Article

Critical Assessment of Waste-Derived Reducing Agent and Support in Ag Nanoparticle Catalysts for p-Nitrophenol Reduction


by
Tiziana Avola
1,
Elena Cazzulani
1,
Michele Bigica
1,
Melissa Greta Galloni
1,2,* and
Sebastiano Campisi
1,2,*
1
Dipartimento di Chimica, Università Degli Studi di Milano, via Golgi 19, 20133 Milano, Italy
2
Consorzio Interuniversitario Nazionale per la Scienza e Tecnologia dei Materiali (INSTM), Via Giusti 9, 50121 Firenze, Italy
*
Authors to whom correspondence should be addressed.
Surfaces 2026, 9(2), 53; https://doi.org/10.3390/surfaces9020053
Submission received: 22 May 2026 / Revised: 5 June 2026 / Accepted: 8 June 2026 / Published: 10 June 2026
(This article belongs to the Special Issue Design of Catalytic Surfaces for Waste Valorization)

Abstract

The transition toward more sustainable catalytic processes has driven increasing interest in waste-derived reducing agents and biomass-based carbon supports. In this study, silver nanoparticles (Ag NPs) were synthesized via conventional NaBH4 reduction or through a bio-derived route using orange peel extract (OPE) and subsequently employed either as colloidal catalysts or immobilized on commercial activated carbon (AC) or coconut-derived carbon (CC). Catalytic activity was evaluated through the reduction of p-nitrophenol under pseudo-first-order conditions using UV–Vis spectroscopy. OPE-derived Ag NPs exhibited slightly higher activity than NaBH4-reduced nanoparticles, while immobilization on carbon supports generally enhanced reaction rates, with Ag/ACBH showing the highest kinetic constant. In contrast, CC-based systems displayed lower absolute activity but improved cost-normalized performance due to the lower cost of the support. A preliminary cost–performance analysis, based on direct material costs, suggested that catalytic efficiency trends can be significantly altered when economic factors are considered, highlighting that the most active system does not necessarily correspond to the most cost-effective one. Stability tests showed progressive deactivation over reuse cycles, mainly attributed to surface oxidation and/or poisoning phenomena. These results demonstrate that integrating waste-derived reagents with low-cost supports can provide competitive catalytic systems, although further optimization is required to improve their long-term operational robustness.

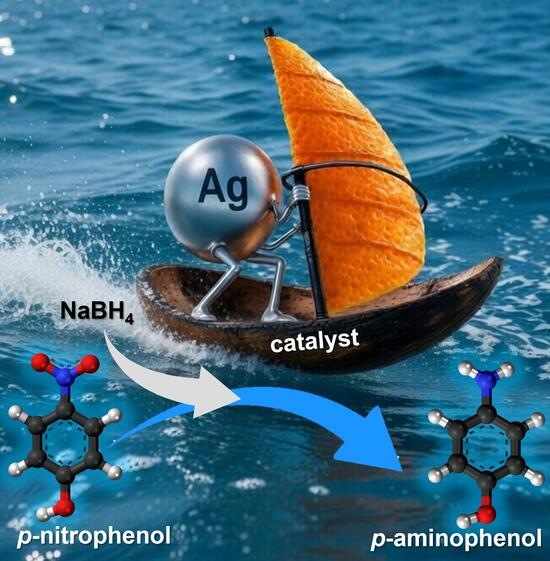
Graphical Abstract

1. Introduction

Designing catalysts with attention to their environmental footprint has become, since the early 2010s, a critical research priority. The ideal catalyst must not only perform well but also minimize the environmental cost of its preparation [1,2,3,4,5]. Within this shift, the valorization of biomass residues and industrial by-products as functional precursors for catalyst synthesis has emerged as one of the most promising strategies, as it couples performance goals with circular economy principles [6]. Waste-derived materials can intervene at multiple stages of catalyst design as reducing agents, capping agents, surface modifiers, and solid supports, thus enabling the replacement of synthetic reagents with renewable resources [7,8,9,10,11,12,13,14,15].
These strategies find a natural application in environmental catalysis, where the primary objective is the development of selective, efficient, and scalable processes for the remediation of contaminated environmental matrices, including water, soil, and air. Integrating circular economy principles into the design of environmental catalysts simultaneously addresses three key pillars: the toxicity of target pollutants, the sustainability of the remediation process, and the material sourcing.
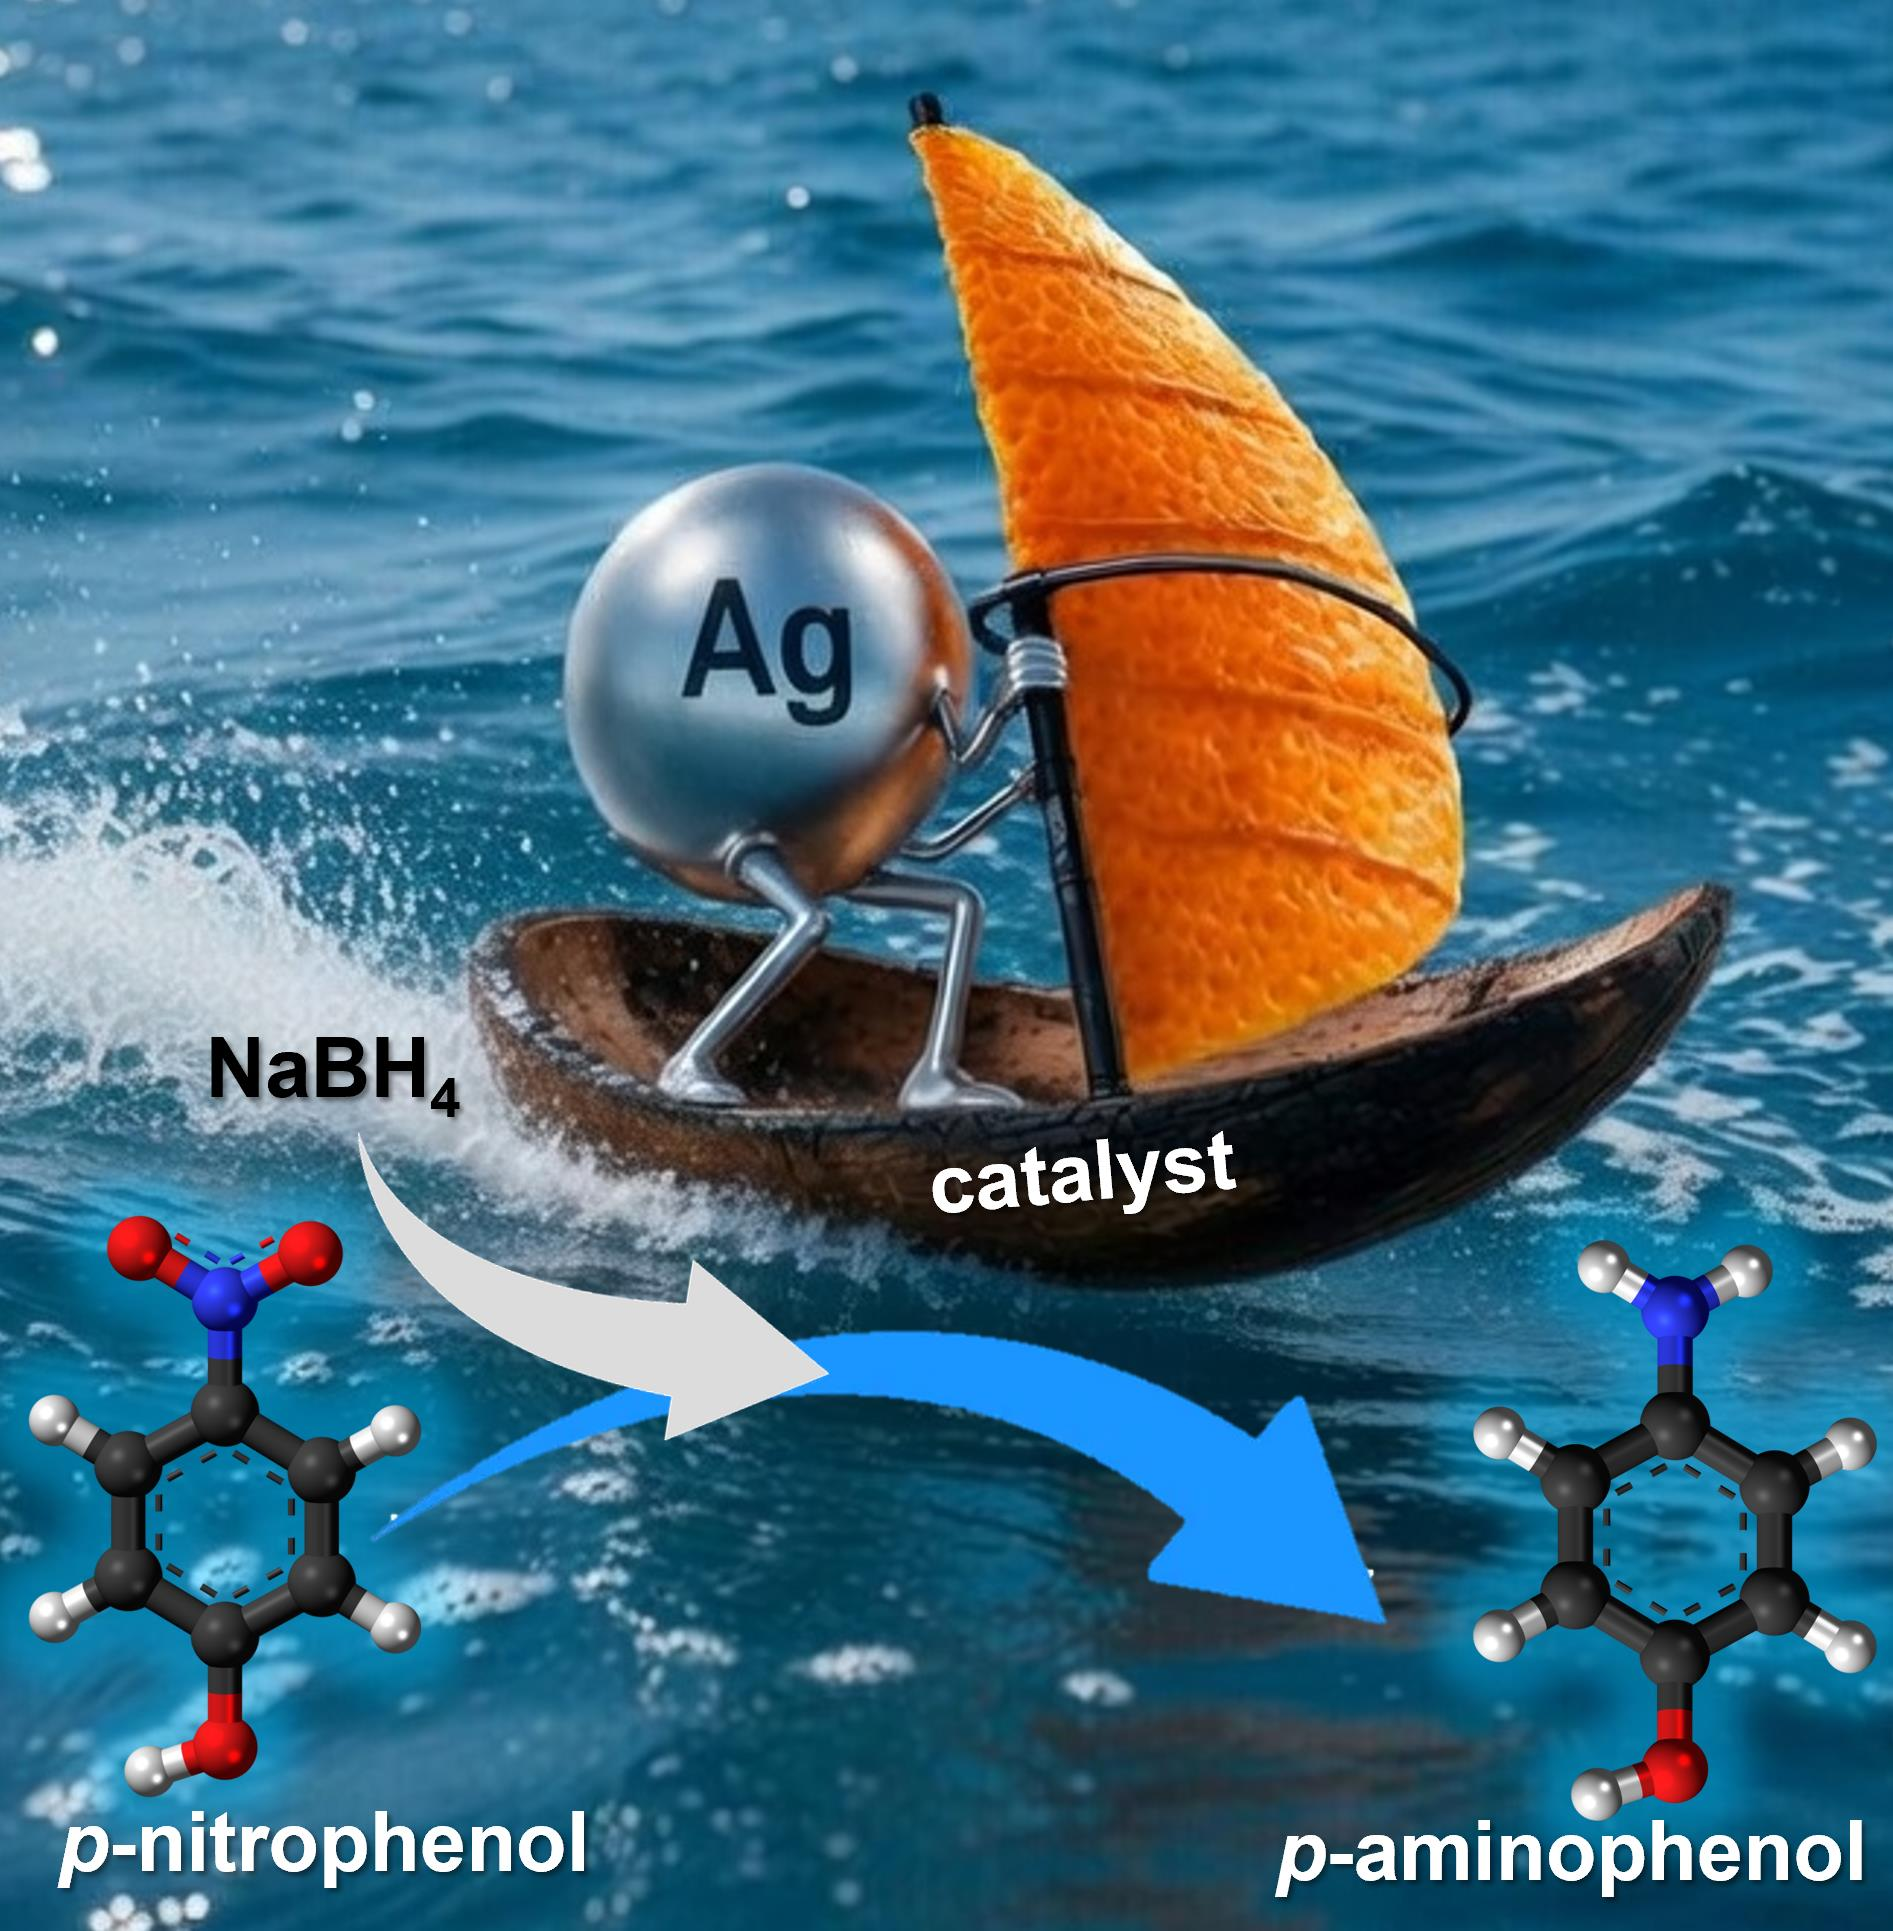
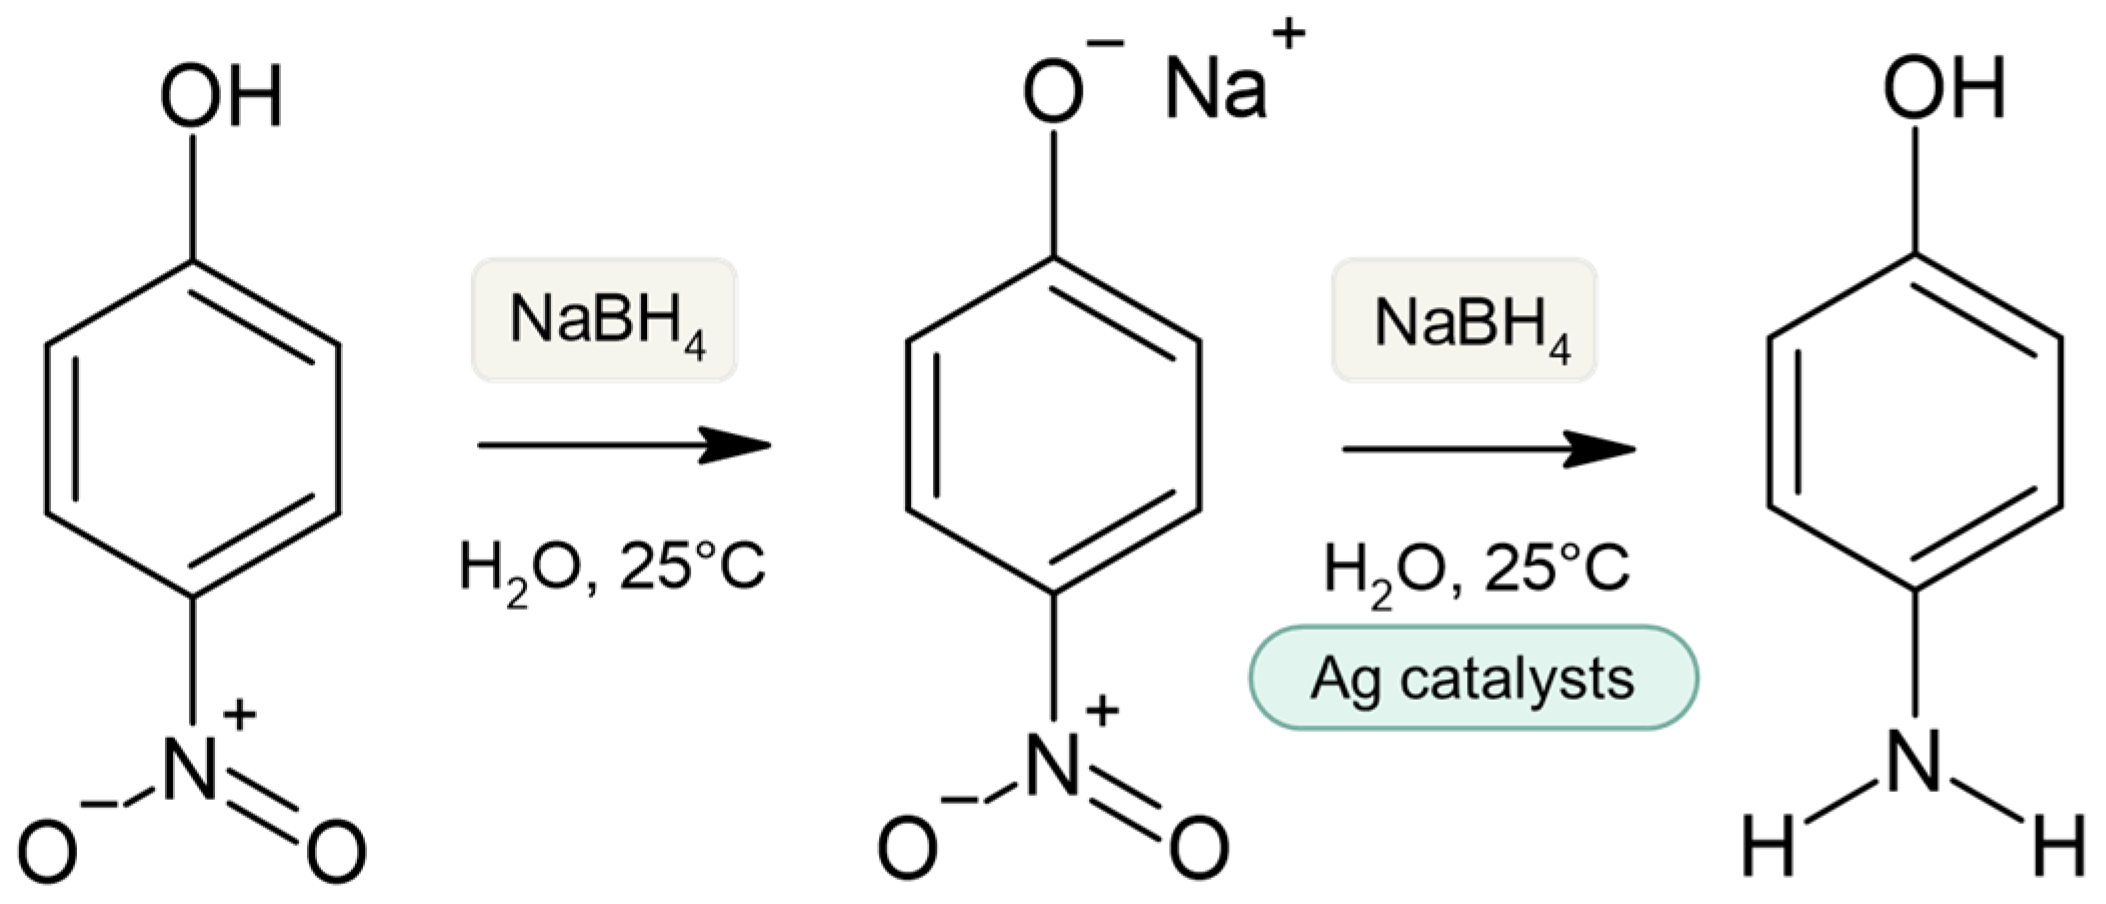
Among the reactions employed as benchmarks in this field, the catalytic reduction of p-nitrophenol (4-NP) to p-aminophenol (4-AP) occupies a central role (Figure 1).
p-Nitrophenol (4-NP) is a persistent toxic pollutant generated in the industrial production of pesticides, synthetic dyes, pharmaceuticals, and petrochemicals and is frequently detected in industrial wastewater streams [16]. The reaction product, p-aminophenol, is a valuable intermediate in the synthesis of analgesic and antipyretic pharmaceuticals, including paracetamol, so the reaction combines environmental remediation with the recovery of an added-value product [17]. Although the reduction of 4-NP by sodium borohydride (NaBH4) is thermodynamically favorable (E°(4-NP/4-AP) = −0.76 V vs. E°H3BO3/BH4−) = −1.33 V), it is kinetically hindered in the absence of a metal catalyst capable of facilitating electron transfer.
Due to its environmental relevance, the strict need for a metal catalyst, and the added value of its reduction product, the 4-NP reduction reaction has become a widely adopted benchmark since the early work of Pradhan et al. [18]. Furthermore, the reaction progress can be easily monitored by UV–Vis spectroscopy through the decay of the nitrophenolate band at 400 nm, enabling a direct comparison between different catalytic systems. Consequently, heterogeneous catalysts have emerged as the preferred choice, owing to their operational simplicity, recyclability, and comparatively low environmental impact. A broad range of catalytic systems has been explored, including Pd, Ag, Pt, Cu, and Au nanoparticles, as well as their composites supported on dendrimers, polymeric matrices, microgels, silica-based, and carbon-based materials [19,20,21,22,23,24,25,26,27]. Among these, silver-based catalysts emerge as particularly promising systems, combining relatively low cost with favorable catalytic properties and offering a viable, more sustainable alternative to more expensive noble metals such as Au, Pd, and Pt while maintaining adequate catalytic efficiency for benchmark reactions such as p-nitrophenol reduction [28,29].
The catalytic behavior of Ag NPs, however, is strongly dependent on their synthetic route, which governs particle size, morphology, surface chemistry, and colloidal stability. Conventional chemical syntheses typically rely on NaBH4, hydrazine, or sodium citrate as reducing agents. While these routes offer reasonable control over particle sizes, they introduce reagents that are hazardous and/or poorly renewable. This limitation has driven the development of green synthesis strategies, in which plant extracts, isolated biomolecules, or microbial systems replace synthetic reductants under milder conditions [7,12,21,30].
Several renewable feedstocks have been successfully explored, from Psidium guajava and Ocimum tenuiflorum leaves to isolated polyphenols, curcumin-based systems, marine biomass such as Fucus gardneri, and fungal systems including Cylindrocladium floridanum [30,31,32,33,34,35,36,37,38,39,40,41,42,43]. These materials contain complex mixtures of phenolic acids, flavonoids, sugars, and organic acids that can simultaneously reduce Ag+ ions and stabilize the resulting nanoparticles. These organic compounds remain adsorbed on the nanoparticle surface, playing a dual and contrasting role in the subsequent catalytic behavior. On the one hand, this residual organic layer functions as a capping agent, preventing aggregation and Ostwald ripening and thus preserving the accessible metallic surface over time [44,45]. On the other hand, the same coating introduces steric hindrance that can obstruct active sites and limit substrate diffusion toward the metal surface [46,47]. The net effect on catalytic activity is therefore not straightforward: it depends on the density, thickness, and chemical nature of the adsorbed layer, as well as on the reaction conditions and the geometry of the substrate.
Despite the presence of capping agents, unsupported nanoparticles tend to aggregate under reaction conditions, thereby reducing their accessible surface area and catalytic activity. Consequently, a wide range of solid supports has been explored for Ag-based catalysts, including silica, TiO2, CeO2, Co3O4, and magnetically recoverable FeOx supports [48,49,50,51,52,53,54]. Most of these, however, rely on conventional and/or energy-intensive preparation routes.
In this context, carbon-based materials derived from biomass waste have emerged as more sustainable alternatives, combining adequate surface area and anchoring capacity with a significantly lower environmental footprint. Among these, biochar, produced by controlled pyrolysis of biomass residues, has attracted particular attention, and Ag NPs supported on biochar have shown improved dispersion and enhanced catalytic activity compared to unsupported systems. Depending on the precursor feedstock and pyrolysis conditions, biochar can exhibit porous architectures, high surface areas, and oxygen-containing surface functionalities capable of anchoring metal nanoparticles and modulating their electronic environment [55,56]. Silver nanoparticles supported on biochar or biomass-derived carbons maintain better dispersion and exhibit enhanced catalytic activity compared to their unsupported counterparts, particularly in 4-NP reduction [57]. Moreover, the use of a biomass-derived support significantly reduces the environmental footprint of the catalyst, enhancing its overall sustainability profile.
Despite the growing literature on both green nanoparticle synthesis and biomass-based supports [5,10,12,19,55,58,59,60,61,62], direct and systematic comparisons between catalysts prepared by conventional chemical reduction and those obtained from plant-assisted routes on renewable carbon carriers remain scarce. It is still unclear whether the sustainability benefits associated with green preparation routes are accompanied by meaningful differences in catalytic performance and, more importantly, how nanoparticle properties and support characteristics govern these differences.
In this work, Ag nanoparticles (Ag NPs), unsupported and supported on two carbon matrices, were investigated as catalysts for the reduction of p-nitrophenol. A commercial activated carbon (AC) was compared with a carbon material derived from coconut biomass (CC), considered a more sustainable alternative, highlighting the potential of waste-derived sources for catalytic applications. Two synthesis approaches were explored: conventional chemical reduction using NaBH4 and a greener route based on orange peel extract (OPE). Accounting for nearly half the mass of processed fruit, OPE is rich in polyphenols, pectin, and soluble sugars [63,64,65,66] and has already been employed as a bio-derived reducing agent for Ag NP synthesis [31,33,34,36,37,38]. Catalytic performance was assessed through p-nitrophenol reduction, enabling a systematic investigation of how both the synthesis route and the support influence catalytic behavior. A preliminary cost-oriented analysis was also included to evaluate whether the sustainability advantage of the green route translates into a favorable cost–performance balance.

2. Materials and Methods

2.1. Chemicals

Silver nitrate (AgNO3, >99%), sodium borohydride (NaBH4, ≥98%), p-nitrophenol (C6H5NO3, ≥99%), and sodium hydroxide aqueous solution (standard solution c(NaOH) = 0.1 mol/L, reag. Ph. Eur., reag. USP, ready-to-use volumetric solution for titration, Titripur®) were purchased from Merck (Darmstadt, Germany) and used as received. Activated charcoal Norit® (granular) was also supplied by Merck. Coconut shell-derived activated carbon (Clean Carbon24, granular, 0.6–2.36 mm/8–30 mesh) was provided by Clean Process. Ethanol absolute anhydrous was furnished by Carlo Erba (Milano, Italy). Liquid nitrogen (N2 > 99.0%) was supplied by Sapio (Monza, Italy). Fresh oranges (Tarocco variety, Naturama) were purchased from a local supermarket in Milan (Italy).
Before use, the granular carbon supports were mechanically ground into fine powders and used in powdered form in all subsequent experiments.
All aqueous solutions were prepared using ultrapure water obtained from a Milli-Q® system (resistivity ≥ 17.5 MΩ·cm; TOC ≤ 2 ppb, Merck Millipore, Burlington, MA, USA).

2.2. Preparation of Orange Peel Extract (OPE)

The orange peels were thoroughly washed with distilled water, manually separated from the pulp, and cut into small pieces. Ca. 60 g of fresh peels was added to 200 mL of Milli-Q water and heated at 80 °C for 15 min under stirring. Fresh peels were intentionally used to maintain a simple, low-processing extraction procedure, closer to a waste-derived approach, and to avoid additional drying treatments that could alter the composition of bioactive compounds in the biomass. After cooling at room temperature, the obtained orange peel extract (OPE) was separated from the solid residue by filtration and stored at 4 °C for subsequent use.
Its UV–Vis spectrum (Figure S1a) was described by two bands at ca. 280 and 320 nm ascribable to benzoyl ring-related systems and the localized transition within the cinnamoyl ring, respectively. An additional contribution in the region 200–230 nm is related to ester, carbonyl, carboxyl, and amine functional groups, as reported in the literature [67].
An ATR-FTIR (Attenuated Total Reflectance Fourier Transform InfraRed) spectrum of the dried OPE extract was collected in the 4000–500 cm−1 range using a Jasco FTIR-4600 spectrometer (Jasco, Tokyo, Japan) equipped with an attenuated total reflectance (ATR) accessory. The ATR-FTIR spectrum (Figure S1b) revealed a broad band in the 3300–3400 cm−1 region associated with O–H/N–H stretching vibrations, together with signals around 2920 cm−1 related to aliphatic C–H stretching. The bands observed in the 1700–1600 cm−1 region can be associated with carbonyl/carboxylate and aromatic contributions, while the intense absorptions in the 1200–1000 cm−1 range are mainly attributable to C–O and C–O–C stretching vibrations typical of carbohydrate- and pectin-derived structures. These features are in agreement with literature on orange peel extract [68] and support the presence of polyphenols, sugars, pectin-related compounds, and other oxygenated biomolecules commonly reported for orange peel extracts.

2.3. Synthesis of Silver Nanoparticles (Ag NPs)

Pristine Ag NPs were synthesized via reduction of AgNO3 using two different reducing agents: sodium borohydride (NaBH4) as a conventional chemical reductant and orange peel extract (OPE) as a waste-derived, bio-based alternative.
For the NaBH4-mediated reduction, 10 mL of an aqueous AgNO3 solution (1 mM) was magnetically stirred (250 rpm) for 5 min. Then, 30 mL of NaBH4 aqueous solution (2 mM) was rapidly added under continuous stirring. The reaction mixture was maintained under stirring for 15 min in the dark (reaction vessel wrapped in aluminum foil). The immediate formation of a brownish colloidal suspension indicated the reduction of Ag+ to metallic Ag NPs. The obtained suspension was labeled as Ag NPsBH.
For the OPE-mediated reduction, 5 mL of NaOH 0.1 M was added to 100 mL of an aqueous AgNO3 solution (1 mM), and the mixture was stirred (250 rpm) for 5 min. Then, 10 mL of OPE was introduced, and the reaction was carried out under magnetic stirring (250 rpm) for 15 min in the dark (reaction vessel wrapped in aluminum foil). A gradual color change to dark brown was observed, indicating the formation of Ag NPs. The resulting suspension was labeled Ag NPsOPE.
The formation of Ag NPs was confirmed by UV–Vis spectroscopy (UV-1800, Shimadzu, Kyoto, Japan) through the appearance of the characteristic surface plasmon resonance (SPR) band of metallic silver nanoparticles.
The Ag NP suspensions were used as prepared or suitably diluted for successive catalytic reduction experiments, without additional purification.

2.4. Preparation of Supported Ag NPs on Carbons

Silver nanoparticles were immobilized onto two activated carbons, namely activated charcoal Norit® (AC) and coconut shell-derived activated carbon (CC), through two different preparation routes to achieve a final silver loading of 0.04 wt.%.
In the first approach, Ag NPs were generated in situ on the carbon by wet impregnation with AgNO3 as a precursor, followed by chemical reduction with NaBH4. In the second approach, Ag NPs were preformed in an aqueous solution using OPE (as described in the previous section) and subsequently deposited onto the carbon supports by incipient-wetness impregnation.
For the NaBH4-assisted route, 3 g of AC or CC were dispersed in 10 mL of an aqueous AgNO3 solution (1 mM) under magnetic stirring (250 rpm). Subsequently, 30 mL of an aqueous NaBH4 solution (2 mM) was added, and the suspension was maintained under stirring for 15 min in the dark. The resulting solid was recovered by filtration, thoroughly washed with Milli-Q water, and dried at room temperature. The obtained materials were labeled Ag/ACBH and Ag/CCBH. The residual silver in the supernatant after separation of the solid phase was determined by Inductively Coupled Plasma Optical Emission Spectroscopy (ICP-OES), using an «Activa», Jobin Yvon ICP-OES instrument (HORIBA, Kyoto, Japan). The absence of detectable Ag in the solution suggested that all the silver precursor introduced was successfully supported on the carbons.
For the OPE-based routes, 3 g of AC or CC was mixed with 10 mL of preformed Ag NPsOPE suspension and stirred for 15 min to promote nanoparticle deposition onto the carbon surface. The resulting solids were recovered by centrifugation (5000 rpm for 5 min, Centrifuge EBA20 Hettich, Tuttlingen, Germany), thoroughly washed with ethanol, and dried at room temperature. The obtained materials were labeled Ag/ACOPE and Ag/CCOPE. The Ag loading of these samples was estimated from the known amount of silver introduced during the synthesis.

2.5. Characterization

Textural properties of the carbon supports were investigated by N2 adsorption–desorption isotherms at −196 °C using an ASAP 2020 instrument (Micromeritics, a part of Malvern Panalytical, a Spectris company, London, UK). These analyses were performed exclusively on the pristine carbon supports, as the thermal pre-treatment required for N2 adsorption/desorption measurements could affect the stability of the supported Ag NPs. Therefore, the reported parameters reflect the intrinsic structural properties of the carbon matrices.
Before analysis, the samples (ca. 0.1 g previously dried at 120 °C overnight) were treated under nitrogen flow at 300 °C for 4 h. The specific surface area was calculated from the adsorption isotherm in the relative pressure range 0.05 < p/p0 < 0.35 using the three-parameter BET equation, selected to account for both microporous and external surface contributions in carbon-based materials. The microporosity was estimated by t-plot analysis, while pore size distributions in the micropore range were additionally evaluated using the Horvath–Kawazoe (HK) method assuming slit-shaped pores.
DLS measurements were performed using a Zetasizer Ultra (Malvern Panalytical, Malvern, UK). Ag NP suspensions, previously diluted 1:10, were loaded into disposable microcuvettes and analyzed at 25 °C in backscattering mode. For the optical properties of Ag NPs, a refractive index of 0.13 and an imaginary refractive index component (absorbance) of 4 were used. Each analysis was performed in triplicate to ensure reproducibility.
Morphological and structural analyses of unsupported and supported Ag NPs were performed through transmission electron microscopy (TEM) using a ZEISS LIBRA 200FE microscope (ZEISS, Oberkochen, Germany) with a 200 kV FEG source and an in-column second-generation omega filter. EDS spectra and element maps were collected along with HAADF-STEM micrographs. To determine the nanoparticles’ size, digitized TEM images were processed with ImageJ 1.54g software, and the data were reported in histograms. Interplanar d-spacing values were estimated from lattice fringe measurements obtained from high-resolution TEM micrographs through FFT-assisted analysis using ImageJ software.

2.6. Catalytic Reduction of p-Nitrophenol and Stability Tests

The catalytic activity of pristine and supported Ag NPs was evaluated through the reduction of p-nitrophenol to p-aminophenol in aqueous solution. The reaction was carried out at room temperature in the presence of an excess of NaBH4 and monitored by UV–Vis spectroscopy.
For pristine Ag NPs, the reaction mixture was prepared directly in a 3 mL quartz cuvette. In a typical experiment, the p-nitrophenol aqueous solution and the freshly prepared NaBH4 aqueous solution were added sequentially to the cuvette, and the reaction was initiated by injecting the Ag NP suspension into the solution. The total reaction volume (3 mL) contained 0.1 mM of p-nitrophenol, 15 mM of NaBH4, and 4.0 × 10⁻³ mM of Ag NPs (molarity reported with respect to Ag atoms). Under these conditions, the molar ratio between catalyst and p-nitrophenol is about 1:25. Immediately after the addition of the nanoparticles, UV–Vis spectra were recorded in the 200–700 nm range every 1 min until completion of the reaction.
The absorbance contribution of Ag NP suspensions at the concentration used during the catalytic tests (0.004 mM with respect to Ag atoms) was preliminarily evaluated and found to be very low (ca. 0.008 a.u.) compared to the p-nitrophenol/p-nitrophenolate signal under the adopted experimental conditions.
For Ag NPs supported on carbons, the catalytic tests were carried out directly in the 3 mL quartz cuvette containing 3.6 mg of catalyst, 0.1 mM of p-nitrophenol, and 15 mM of NaBH4. The amount of catalyst was selected to ensure a comparable amount of Ag in the reaction system, based on the measured metal loading. The reaction was initiated by adding the freshly prepared NaBH4 aqueous solution, after which UV–Vis spectra were immediately recorded in the 200–700 nm range.
The reaction progress was monitored by following the decrease of the characteristic absorption band of p-nitrophenolate at ca. 400 nm and the concomitant increase of the p-aminophenol band at ca. 300 nm. A molar attenuation coefficient of 18,495 M−1·cm−1 was used to convert absorbance to concentration values. The apparent rate constants (kapp expressed in min−1) were determined assuming pseudo-first-order kinetics with respect to p-nitrophenol by linear fitting of ln(At/A0) versus time, where A0 is the initial absorbance at 400 nm, and At is the absorbance at time t.
A blank experiment was carried out under identical conditions in the absence of Ag nanoparticles to evaluate the contribution of NaBH4 alone.
Catalyst reusability was evaluated over consecutive reaction cycles. In each cycle, the catalyst was contacted with fresh reaction solution, and the reaction was allowed to proceed for 5 min. After each run, the catalyst was recovered by centrifugation, separated from the reaction medium, and re-dispersed in a fresh solution under the same conditions. The procedure was repeated for a total of six consecutive cycles.

2.7. Adsorption Experiments on Pristine Carbons

Adsorption equilibrium experiments were carried out at room temperature (T = 20 ± 2 °C) using a batch method. A series of samples was prepared by contacting a fixed volume (V = 30 mL) of p-nitrophenolate aqueous solution (C0 = 0.1 mM, adjusted to pH 10) with varying amounts of adsorbent (m = 5–500 mg).
The suspensions were agitated for 24 h to ensure equilibrium was reached. After equilibration, the solid phase was separated by filtration/centrifugation, and the residual 4-NP concentration (Ce) in the supernatant was determined using UV–vis spectrophotometry.
The amount of adsorbate adsorbed at equilibrium (qe, mg·g−1) and at time t (qt, mg·g−1) was calculated according to
qe,t = (C0 − Ce,t)·V/m
where C0 (mg·L−1) is the initial concentration, Ce and Ct (mg·L−1) are the concentrations at equilibrium and at time t, respectively; V (L) is the solution volume; and m (g) is the mass of adsorbent.
Adsorption isotherms were constructed by plotting qe vs. Ce. The resulting data were analyzed using the Langmuir isotherm model and the Freundlich equation in their nonlinear form (Equations (2) and (3)).
q e = q m a x K L C e 1 + K L C e
q e = K F C e 1 / n
where qmax (mg·g−1) is the maximum adsorption capacity of the carbon supports, Ce (mmol·L−1) is the p-nitrophenolate concentration at equilibrium, KL (L·mmol−1) and KF (L1/n·mmol−1/n·mg·g−1) are the Langmuir and Freundlich constants, respectively, and 1/n is an empirical parameter accounting for heterogeneous surfaces.
Adsorption kinetic experiments were carried out at room temperature (T = 20 ± 2 °C) directly in a 3 mL quartz cuvette containing 3 mg of carbon support and p-nitrophenolate aqueous solution (C0 = 0.1 mM, adjusted to pH 10). The adsorption kinetics were monitored by UV–Vis spectrophotometry following the decrease of the characteristic absorption band of p-nitrophenolate at ca. 400 nm. To minimize mass-transfer limitations, the reaction mixture was manually homogenized between successive spectral acquisitions.
Adsorption kinetic profiles were obtained by plotting qt vs. t. The experimental data were analyzed using the pseudo-first-order (PFO), pseudo-second-order (PSO), and intraparticle diffusion (IPD) kinetic models, as reported in Equations (4)–(6) respectively.
q t = q e 1 e k 1 t
q t = q e 2 k 2 t 1 + q e k 2 t
q t = k i d t 0.5 + C
where qt and qe (mg·g−1) are the adsorption capacity of the carbon supports at time t and at the equilibrium, respectively; k1 (min−1), k2 (g·mg−1·min−1), and kid (mg·g−1·min−0.5) are the PFO, PSO, and IPD kinetic rate constants, respectively; and C is a constant accounting for the thickness of the boundary layer.

2.8. Stability Tests

The stability of the supported Ag NPs and the possible leaching of active species were evaluated by a pre-contact leaching test.
The solid catalyst (3 mg) was first dispersed in 3 mL MilliQ water and kept under stirring for 3 h. The suspension was then centrifuged to separate the solid, and an aliquot of the resulting clear supernatant was collected.
Appropriate volumes of reactant stock solutions were subsequently added to the filtrate to reproduce standard reaction conditions (0.1 mM p-nitrophenol, 15 mM NaBH4) in the absence of the solid catalyst.
The reaction progress was monitored over time by UV–vis spectrophotometry by collecting spectra in the 200–700 nm wavelength range. The absence of any conversion was taken as evidence of negligible leaching of active species from the supported nanoparticles. Conversely, any observed conversion indicated the presence of catalytically active species released into solution.
All experiments were repeated at least three times to ensure reproducibility with relative standard deviations below 5%. The calculated kapp values were averaged and are reported as mean ± standard deviation.

2.9. Cost-Oriented Metrics and Calculation Methodology

A preliminary cost-oriented assessment of the catalyst synthesis procedures was carried out at laboratory scale, focusing on direct material costs associated with the preparation of both pristine and supported Ag NPs. The evaluation was based on the quantities of reagents and materials employed in each synthesis procedure.
Unit costs were derived from publicly available supplier list prices and selected as representative lower-bound values among commercially available laboratory-grade reagents at comparable purity levels. Where multiple suppliers were available, values were chosen as representative of the lower range of market prices to ensure a consistent and unbiased cost framework (Table S1). Sodium hydroxide was considered in pellet form for cost calculations, and the corresponding final cost was derived from the amount of NaOH required to prepare the corresponding solution concentration. For OPE-derived samples, the cost contribution of AgNO3 and NaOH was proportionally based on the fraction of Ag NPsOPE suspension effectively used during the impregnation step. Orange peel extract (OPE) was considered a waste-derived reagent and therefore not associated with any direct purchase cost.
Process water (Milli-Q) was included in the description of each synthesis step for completeness, but it was not monetized in the cost calculation. The adopted system boundaries and assumptions are summarized in Table S2. It should be noted that the present analysis is intentionally limited to direct material costs and does not include operational contributions, such as energy consumption, processing time, labor, or waste treatment. Therefore, the calculated values are intended for comparative purposes rather than as absolute economic indicators.
The cost associated with each catalytic test was estimated by relating the synthesis cost to the amount of catalyst effectively used in the reaction.
For supported catalysts, the cost per test was calculated according to
C o s t t e s t = C b a t c h m b a t c h · m t e s t
where Cbatch is the total synthesis cost, mbatch is the mass of catalyst obtained in the batch, and mtest is the mass of catalyst used in a single catalytic run.
For pristine Ag NPs, the cost per test (Equation (8)) was estimated based on the fraction of the nanoparticle suspension effectively used in the test, according to
C o s t t e s t = C b a t c h   · n A g , t e s t n A g , b a t c h
where nAg,test is the amount of Ag introduced in the catalytic test, and nAg,batch is the nominal amount of Ag used in the synthesis batch.
The amount of Ag introduced in each catalytic test was calculated from the nominal Ag concentration and the total reaction volume, according to the experimental conditions.
For comparative purposes, the synthesis cost of pristine Ag NPs was evaluated by considering the same volume of Ag precursor solution for both reduction routes. This approach assumes a homogeneous distribution of Ag within the nanoparticle suspension at the macroscopic scale.
The figure of merit (FoM) was then defined as a simple comparative indicator to relate catalytic performance to the associated direct material cost:
F o M = k C o s t t e s t
where k is the pseudo-first-order rate constant obtained from kinetic analysis.

3. Results and Discussion

3.1. Physicochemical Properties and Adsorption Features of the Pristine Carbon Supports

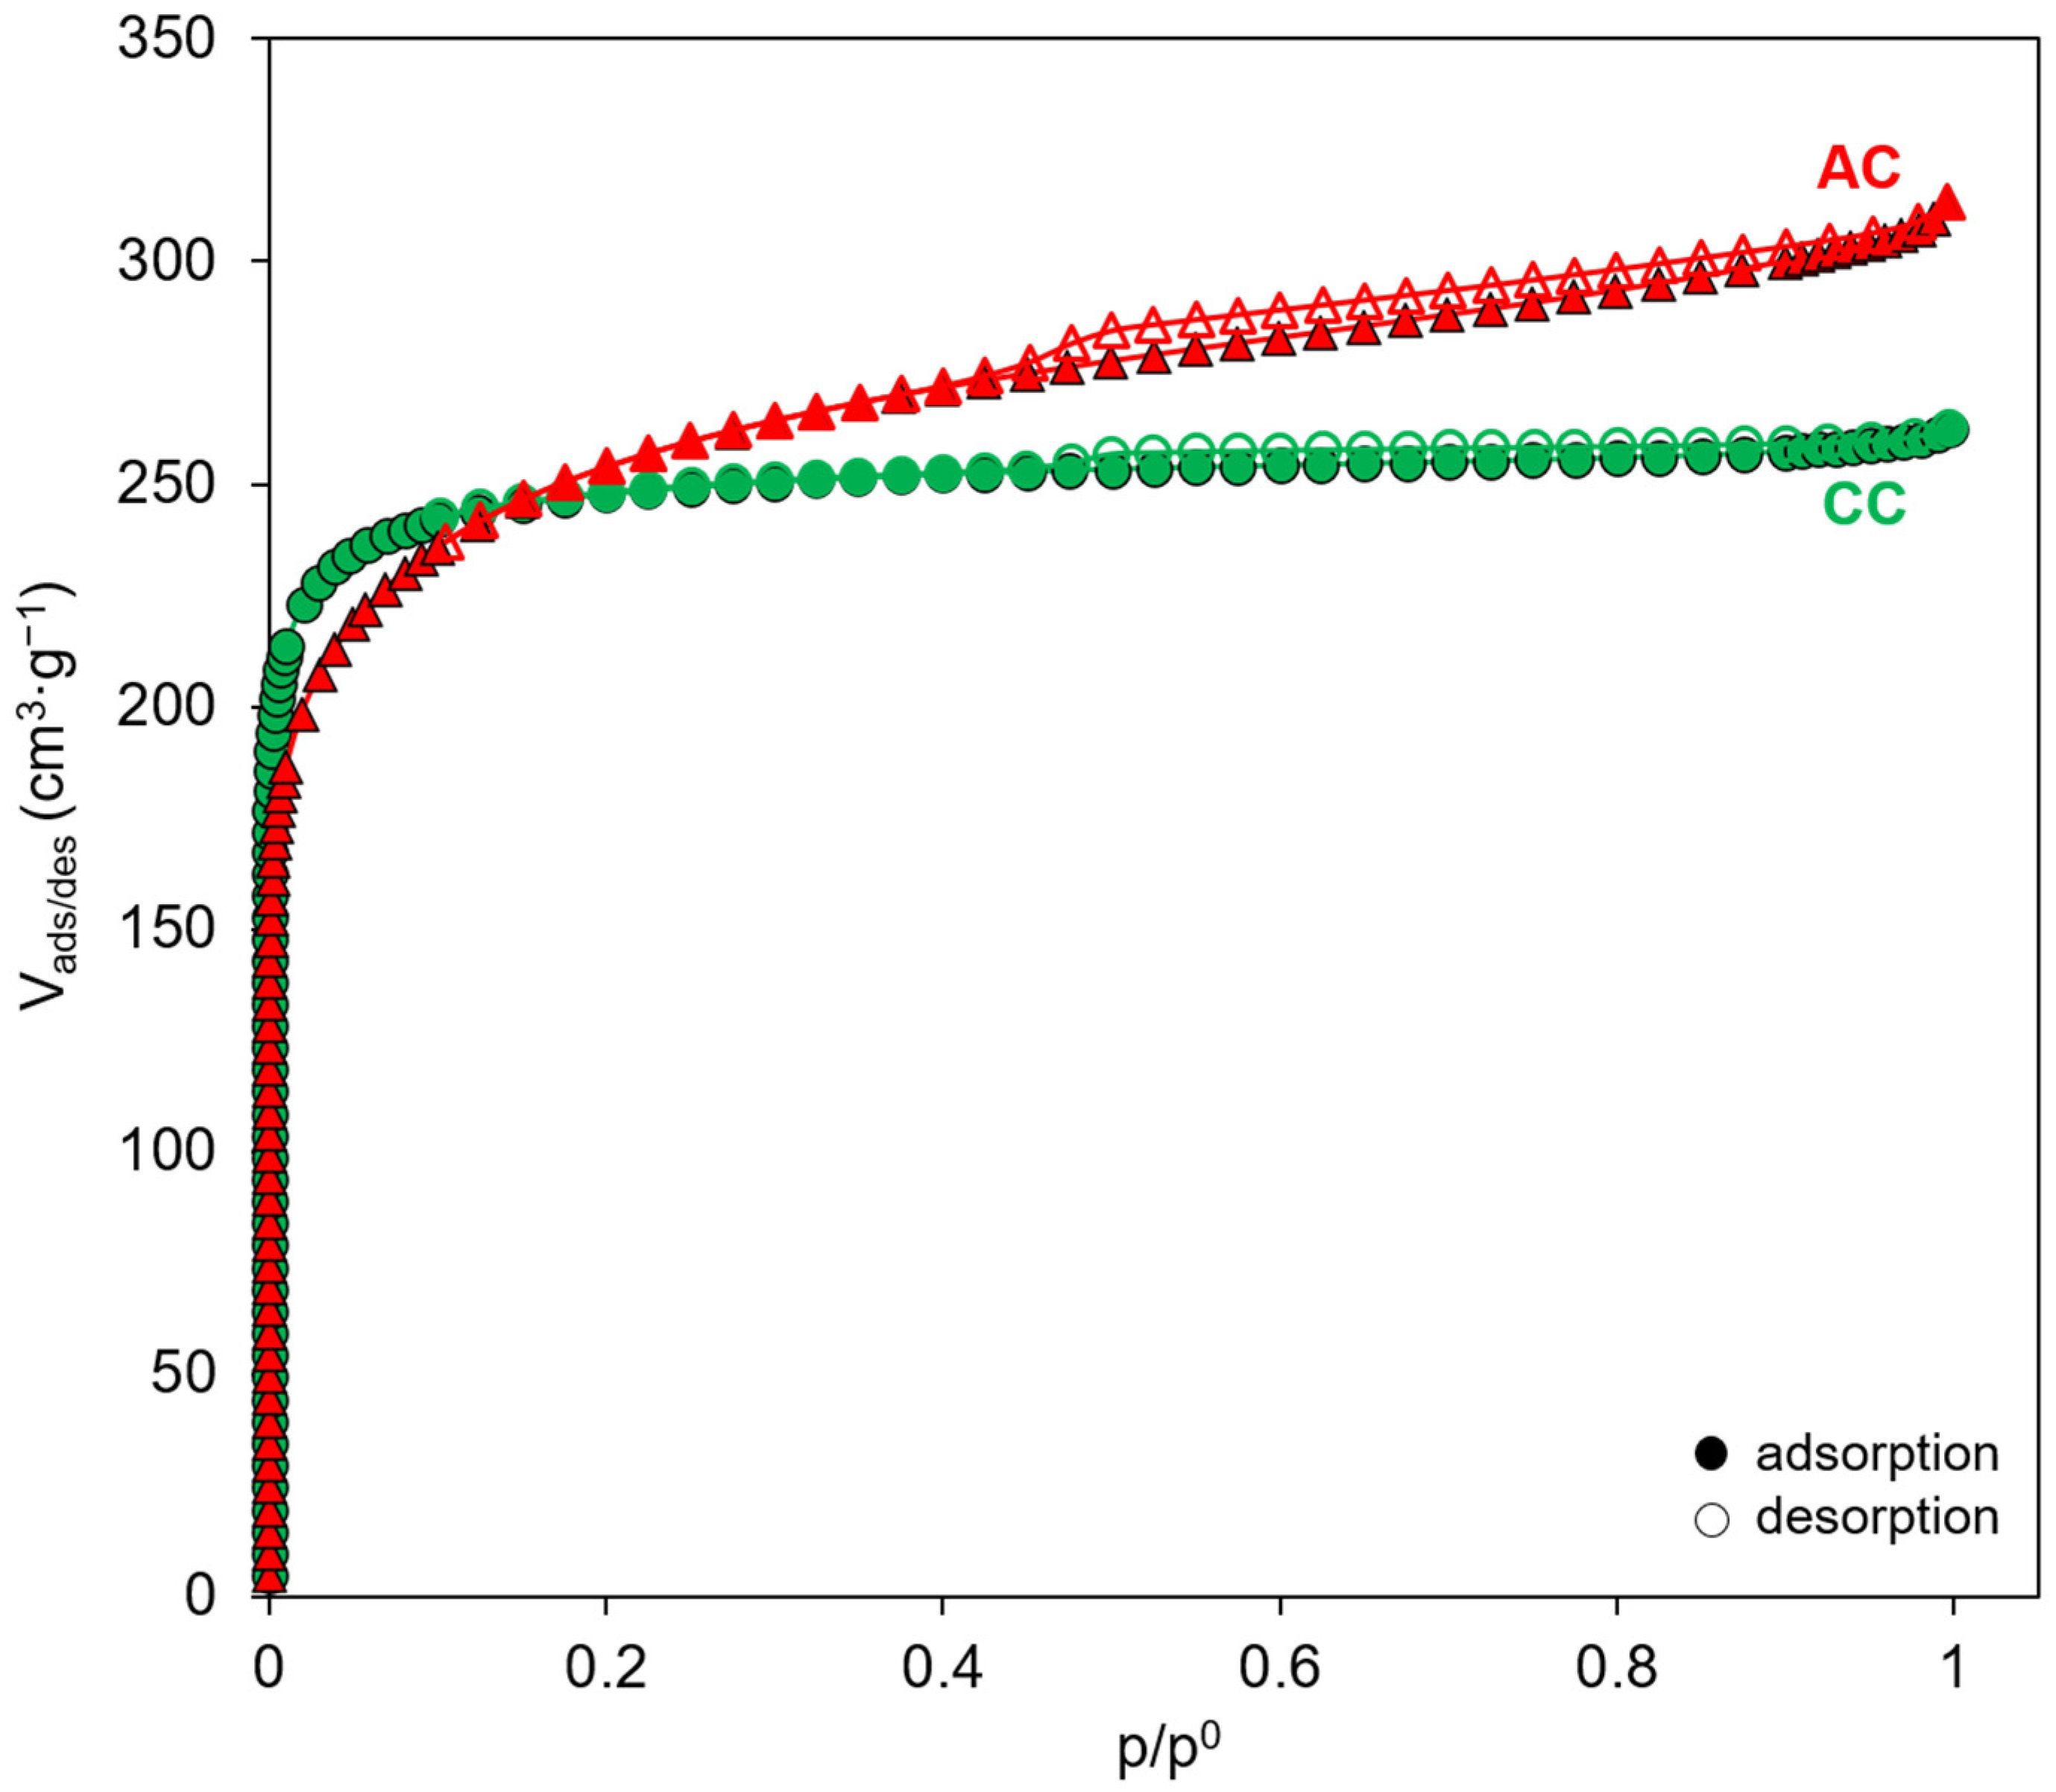
The textural properties of the carbon supports were investigated through N2 adsorption–desorption measurements at −196 °C. The resulting isotherms and corresponding textural properties are presented in Figure 2 and Table 1, respectively.
Both materials exhibit Type I adsorption isotherms according to IUPAC classification [69], which are typical of microporous solids. In particular, a steep increase in adsorption is observed at low relative pressure (p/p0 < 0.1), characteristic of highly microporous carbon structures [69]. At higher relative pressures, a more gradual increase in the adsorbed volume is observed, suggesting an additional contribution from wider pores and the external surface. In this context, the specific surface area was calculated in the relative pressure range 0.05 < p/p0 < 0.35 using the BET equation, which was selected to account for both microporous and external surface contributions in these carbon-based materials.
Despite the similarity of the isotherms, some differences in the textural properties of the two materials can be identified. The commercial activated carbon (AC) shows a slightly higher adsorption capacity over the whole pressure range, corresponding to a surface area of ca. 805 m2·g−1, whereas the coconut-derived carbon (CC) exhibits a surface area of ca. 763 m2·g−1. These values confirm the highly developed porous structure of both materials, making them suitable supports for catalytic species.
A more detailed analysis of the pore structure (Table 1) highlights additional differences between the two carbons. In particular, the coconut-derived carbon displays a larger micropore volume (0.333 cm3·g−1) compared with the commercial activated carbon (0.229 cm3·g−1), indicating a stronger contribution of microporosity in the biomass-derived material. Conversely, AC shows a significantly higher external surface area (371 m2·g−1) than the CC (115 m2·g−1), suggesting a larger fraction of wider pores in the commercial sample.
To better describe the microporous structure, pore size distributions were additionally evaluated using the Horvath–Kawazoe (HK) method, assuming slit-shaped pores (Figure S2), which is generally considered appropriate for carbon-based materials [70]. The analysis confirms the predominantly microporous nature of both supports and provides additional insight into the pore width distribution. In particular, AC exhibits a broader distribution extending to slightly larger pore widths (6.71 Å), whereas CC is mainly characterized by narrower micropores centered at lower pore widths (5.79 Å). These findings are consistent with the literature, as coconut shell-derived activated carbons are generally reported to exhibit a predominantly microporous structure with narrow pore size distributions [71]. In contrast, several commercial activated carbons, including Norit-based materials, often present a more heterogeneous pore system with a significant contribution of mesoporosity [72].
These differences in pore structure are expected to influence the accessibility of the catalytic phase and the diffusion of reactants during the reduction reaction.
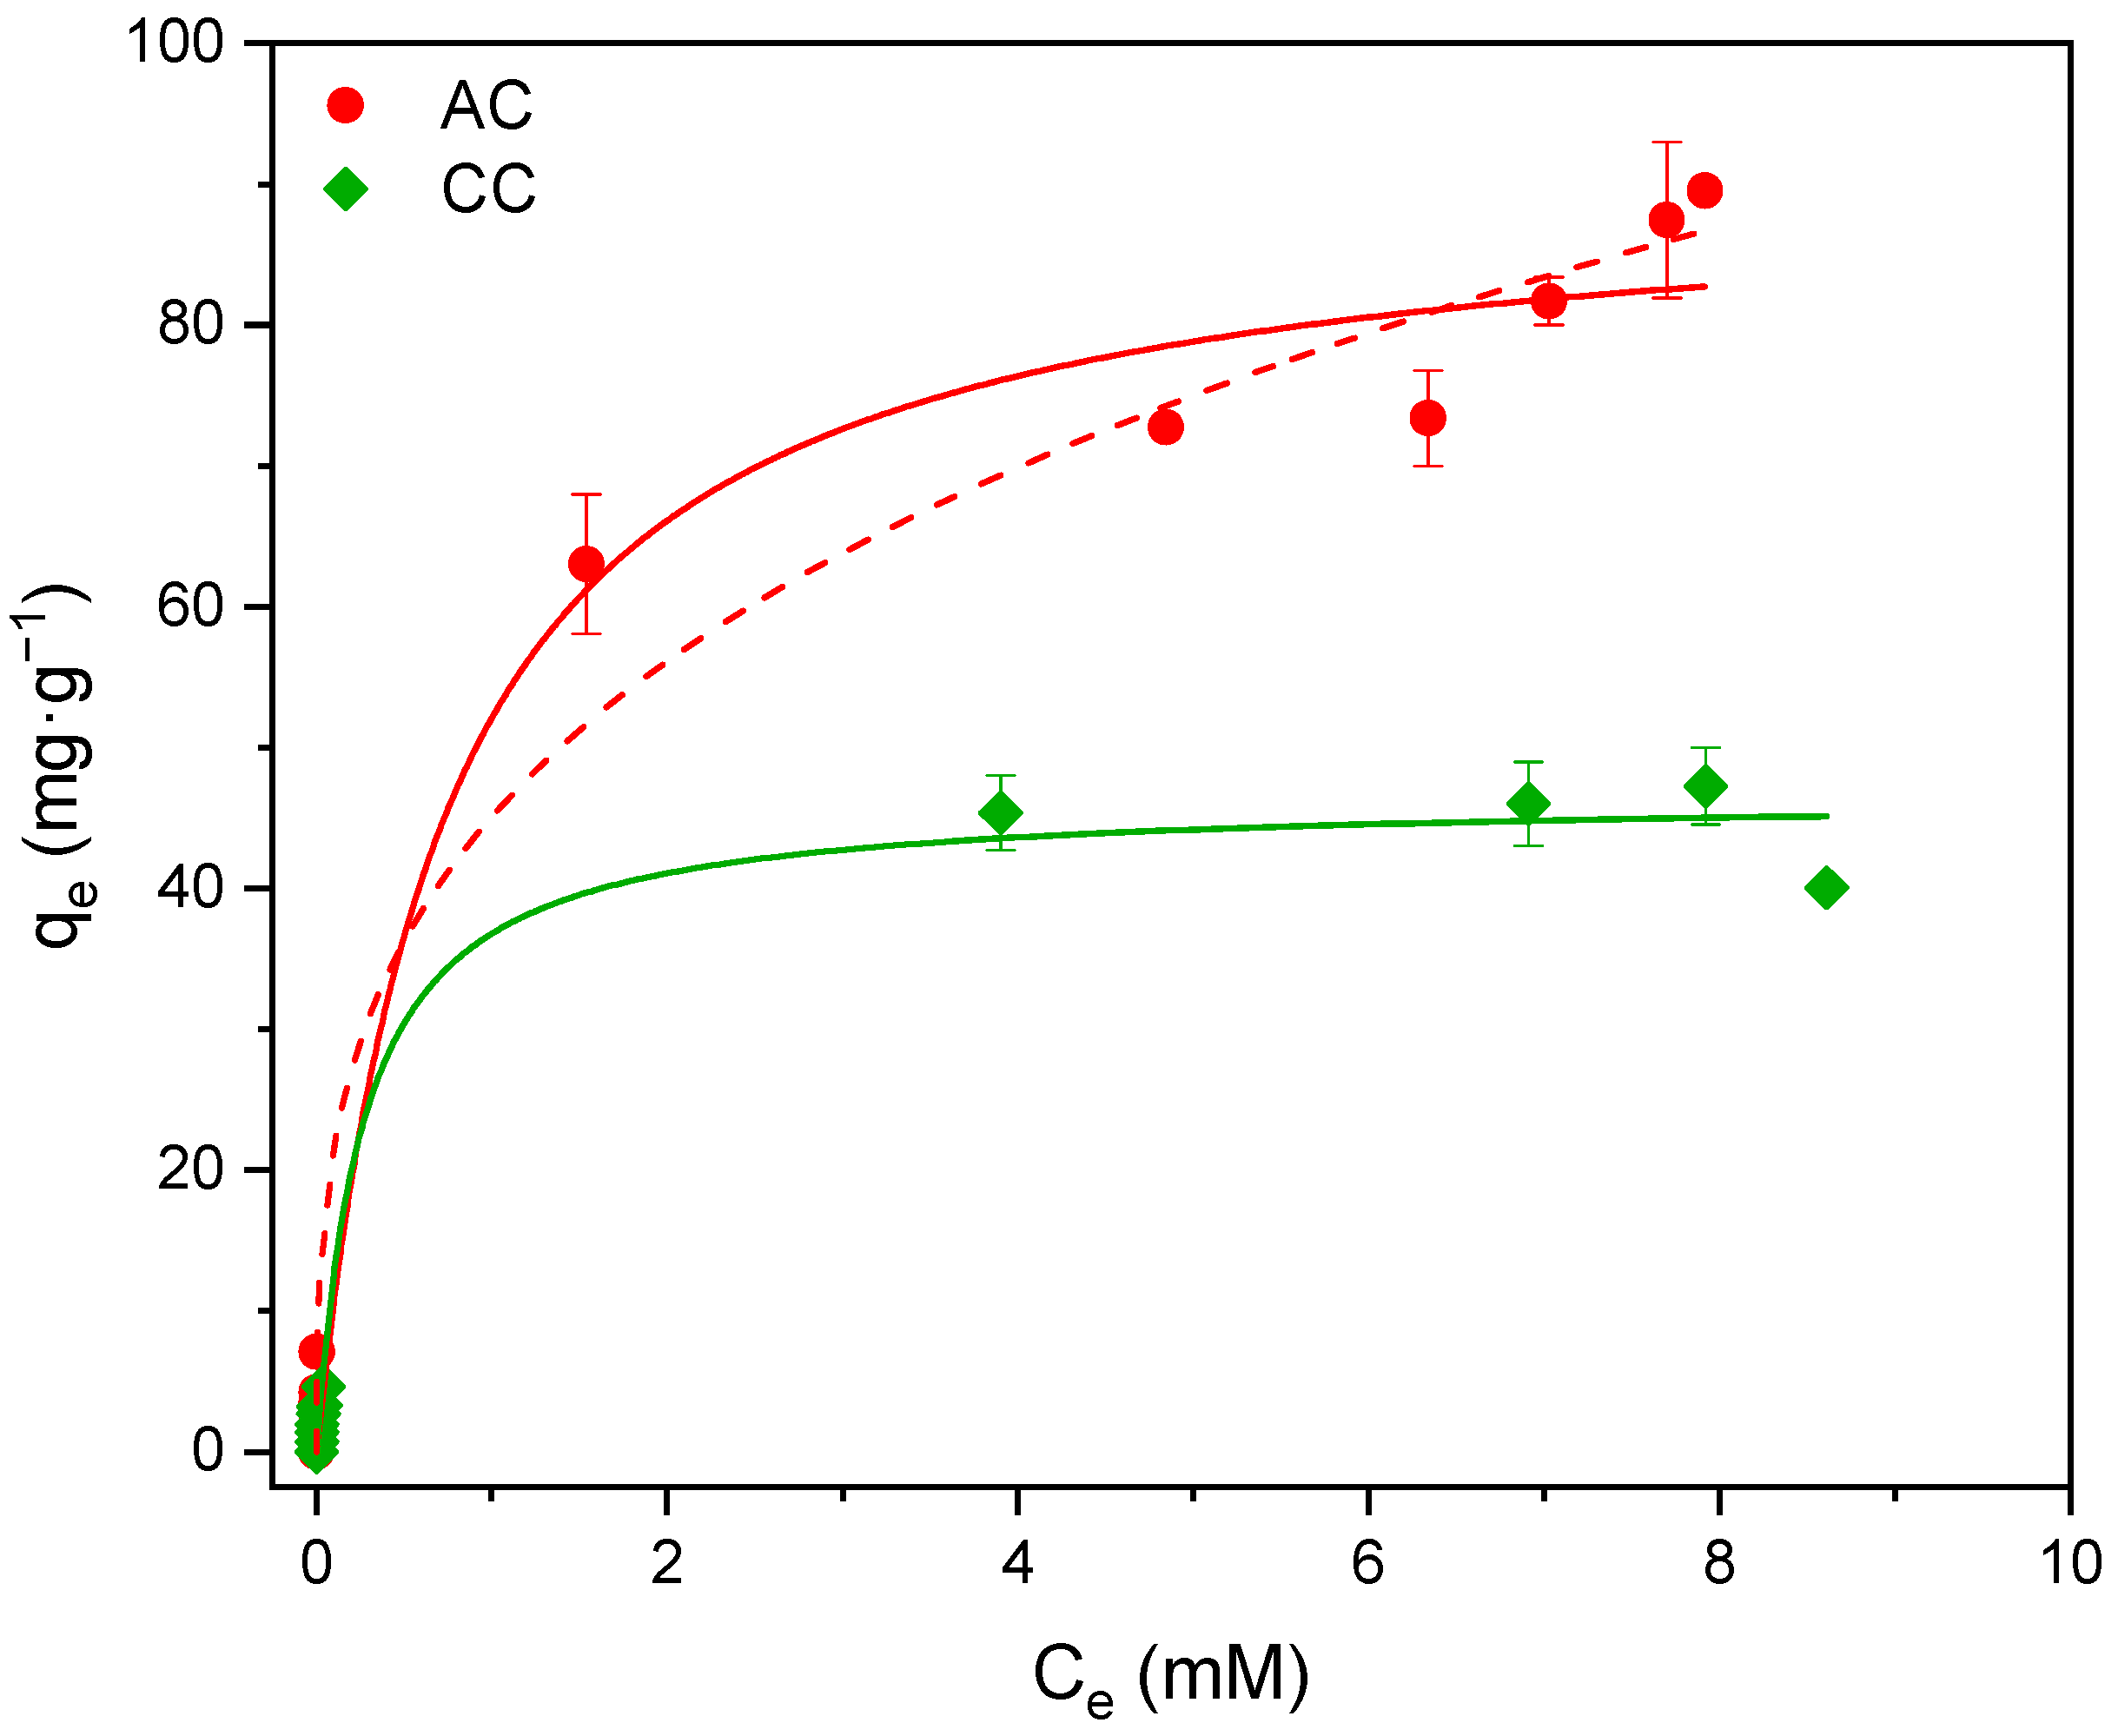
Adsorption equilibrium isotherms of p-nitrophenol on AC and CC were collected at 20 °C and pH 10 to reproduce the reaction conditions employed during the catalytic reduction of p-nitrophenol in the presence of excess NaBH4, providing a more realistic evaluation of the adsorption behavior of AC and CC under operative conditions (Figure 3). AC exhibited a significantly higher adsorption capacity (qmax = 93 mg·g−1) than CC (qmax = 44 mg·g−1), a difference that can be rationalized based on the distinct textural properties of the two materials (Table 1). Both carbons are predominantly microporous. Specifically, 4-NP has a molecular diameter of approximately 6.7 Å, which is commensurate with the characteristic pore widths of both materials (Table 1). Additionally, at pH 10, 4-NP is predominantly present in its anionic form (pKa ≈ 7.1), which promotes the formation of an organized hydration shell and, in many cases, stable ion pairs. As a result, the effective hydrodynamic radius of the species can exceed its nominal molecular dimensions, increasing the steric demand upon pore entry [73,74,75,76]. Accessibility to the internal surface area is therefore limited by a combination of geometric constraints and partial desolvation effects. This effect differs markedly between the two sorbents. According to data in Table 1, in CC, the inaccessible micropore surface accounts for approximately 85% of the total BET surface area, compared to approximately 54% in AC. This difference in effective pore accessibility can contribute to the observed disparity in adsorption capacity, highlighting the role of pore size distribution and surface utilization efficiency as important factors governing adsorption performance in microporous carbons.
The two materials also differ in the isotherm model that best describes their adsorption behavior and in the model parameter values (Table 2). For CC, the data were well described exclusively by the Langmuir model, consistent with a relatively homogeneous set of adsorption sites, reflecting the predominance of adsorption on the external surface and within a limited fraction of accessible micropores. Despite its lower adsorption capacity, CC exhibited a higher Langmuir affinity constant (KL) than AC, indicating stronger local interactions between the adsorbate and the available adsorption sites. Similar behavior has been reported by Terzyk et al. [77,78], who showed that oxygen-containing surface functionalities and local electronic properties can significantly influence the adsorption energy of p-nitrophenol on activated carbons. For AC, both the Langmuir and Freundlich models provided equally satisfactory fits, reflecting a broader distribution of adsorption energies associated with a more heterogeneous pore network that likely includes wider micropores and some contribution from mesoporosity.
Comparison with the literature helps to further interpret these results. Kumar et al. [79] reported Langmuir maximum adsorption capacities for p-nitrophenol in the range of 206–331 mg·g−1 for granular activated carbons with BET surface areas of 580–860 m2·g−1, measured under acidic or near-neutral conditions. The values obtained in the present work are lower, particularly for CC, but this is expected given the alkaline pH adopted here. At pH 10, both p-nitrophenol and the carbon surface, typically negatively charged above its point of zero charge, experience electrostatic repulsion, thereby reducing the overall adsorption capacity compared to acidic conditions, where p-nitrophenol remains undissociated. Nevertheless, the residual capacity of 45–94 mg·g−1 observed here is consistent with previous studies demonstrating that non-electrostatic interactions, including π–π dispersive forces and donor–acceptor mechanisms, can still promote significant 4-NP adsorption even in its anionic form.
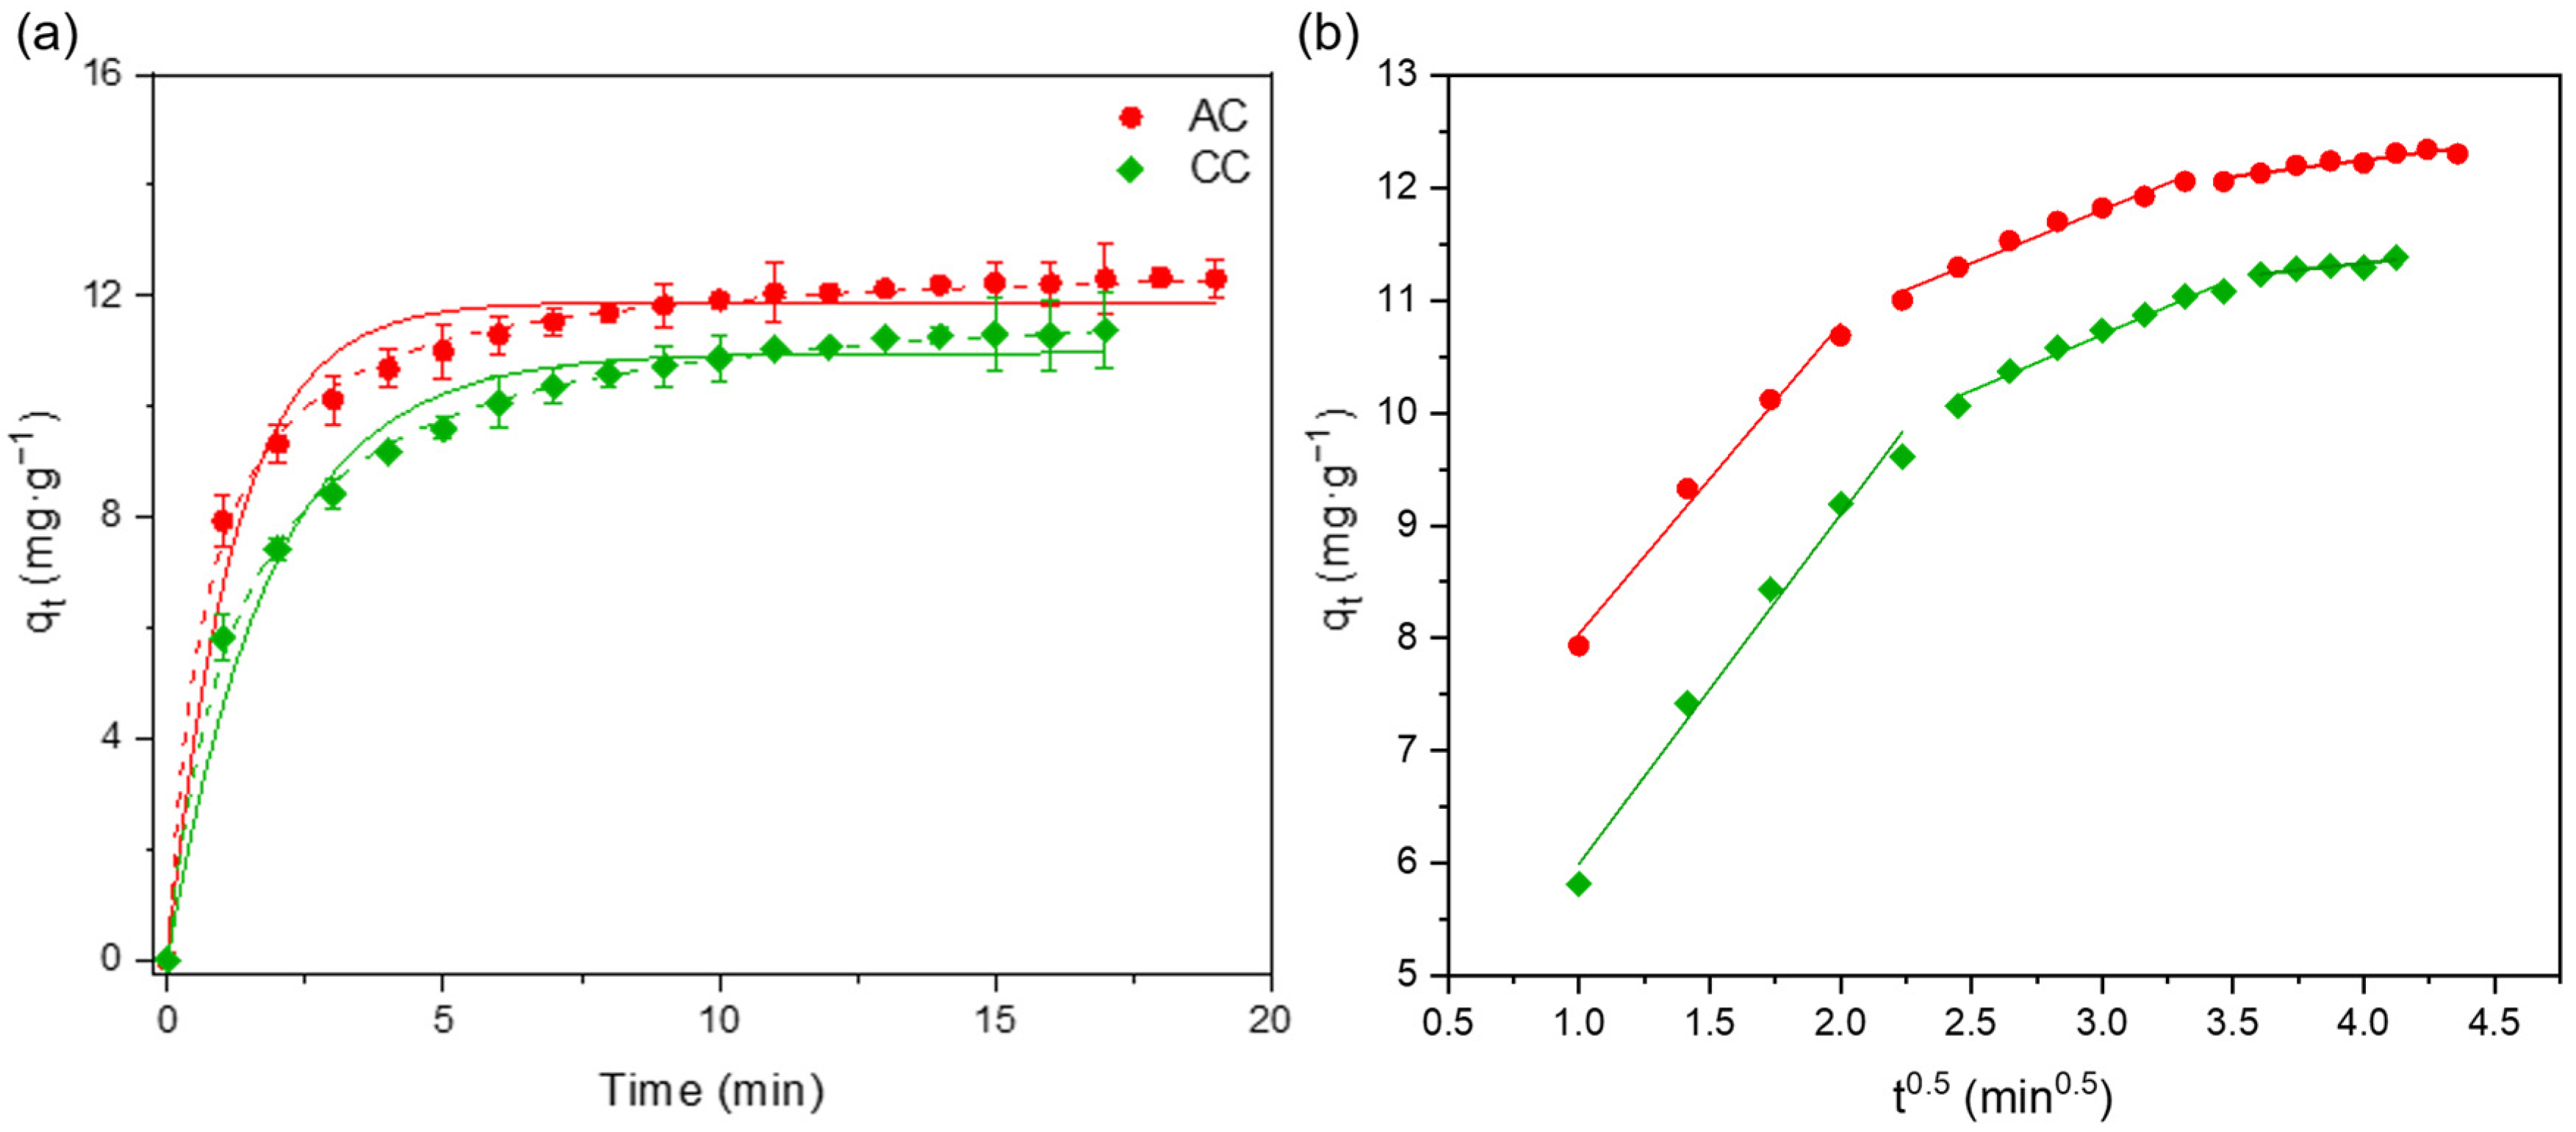
To gain deeper insight into the adsorption behavior, the adsorption kinetics of p-nitrophenol at pH 10 onto AC and CC were investigated. The kinetic profiles are reported in Figure 4 and were analyzed using different adsorption kinetic models. The adsorption capacity as a function of time (qt) for both carbon supports is shown in Figure 4a, while the kinetic parameters obtained from the nonlinear fitting of the pseudo-first-order (PFO) and pseudo-second-order (PSO) models are summarized in Table 3.
Among the investigated models, the PSO equation provided the best fit for both materials; therefore, the following discussion is based on the corresponding PSO kinetic parameters. The obtained kinetic constants reveal significant differences in the adsorption behavior of the two carbons. In particular, the coconut shell-derived carbon (CC) exhibited slower adsorption kinetics (k2 = 0.066 g·mg−1·min−1) compared to the commercial activated carbon (AC). This behavior can be reasonably associated with the distinct textural properties of the two supports. As discussed in the previous section, CC is characterized by a higher degree of microporosity and a significantly lower external surface area, whereas AC possesses a larger mesoporous contribution. The predominance of narrow micropores in CC likely limits the accessibility and diffusion of p-nitrophenolate species within the porous network, leading to slower mass transfer and, consequently, lower adsorption rates. Conversely, the wider pore structure and larger external surface area of AC facilitate the transport of reactant molecules toward the adsorption sites, resulting in faster adsorption kinetics.
Since adsorption in porous carbons generally involves multiple mass transfer steps, including external diffusion, intraparticle diffusion, and adsorption onto active sites, the kinetic data were further analyzed using the intraparticle diffusion (IPD) model (Figure 4b). The IPD plots reveal three distinct linear regions, corresponding to progressively slower uptake rates. This sequential behavior is consistent with diffusion through a hierarchical pore network: rapid transport through macropores, followed by slower diffusion into mesopores, and finally rate-limiting penetration into micropores. The linear dependence of qt on t0.5 throughout all stages suggests that adsorption is significantly influenced by intraparticle diffusion phenomena rather than being exclusively controlled by surface reaction. However, the deviation of the fitted lines from the origin indicates that intraparticle diffusion is not the sole rate-determining step, and the overall adsorption process is governed by the combined contribution of different phenomena. Comparable trends were also reported by Kumar et al. for the adsorption of p-nitrophenol on activated carbons [79].

3.2. Silver Nanoparticles Prepared via Chemical or Bio-Derived Reduction Routes and Their Catalytic Performance

Ag NPs were synthesized via chemical reduction of AgNO3 using two distinct reducing agents: conventional NaBH4 (Ag NPsBH) and waste-derived orange peel extract (Ag NPsOPE). Orange peel extract can be used as both a reducing agent and a stabilizer of the colloidal particles formed, and it has been demonstrated to exert a drastic effect on the size and size distribution of nanoparticles prepared under constant conditions.
Upon reduction of Ag+ ions, both systems exhibited the characteristic color change associated with Ag nanoparticle formation. In the NaBH4-based system, a clear color change from colorless to yellow–brown was observed. Conversely, in the presence of the orange peel extract, the initially colored solution underwent a progressive darkening, consistent with nanoparticle formation despite the inherent color of the extract.
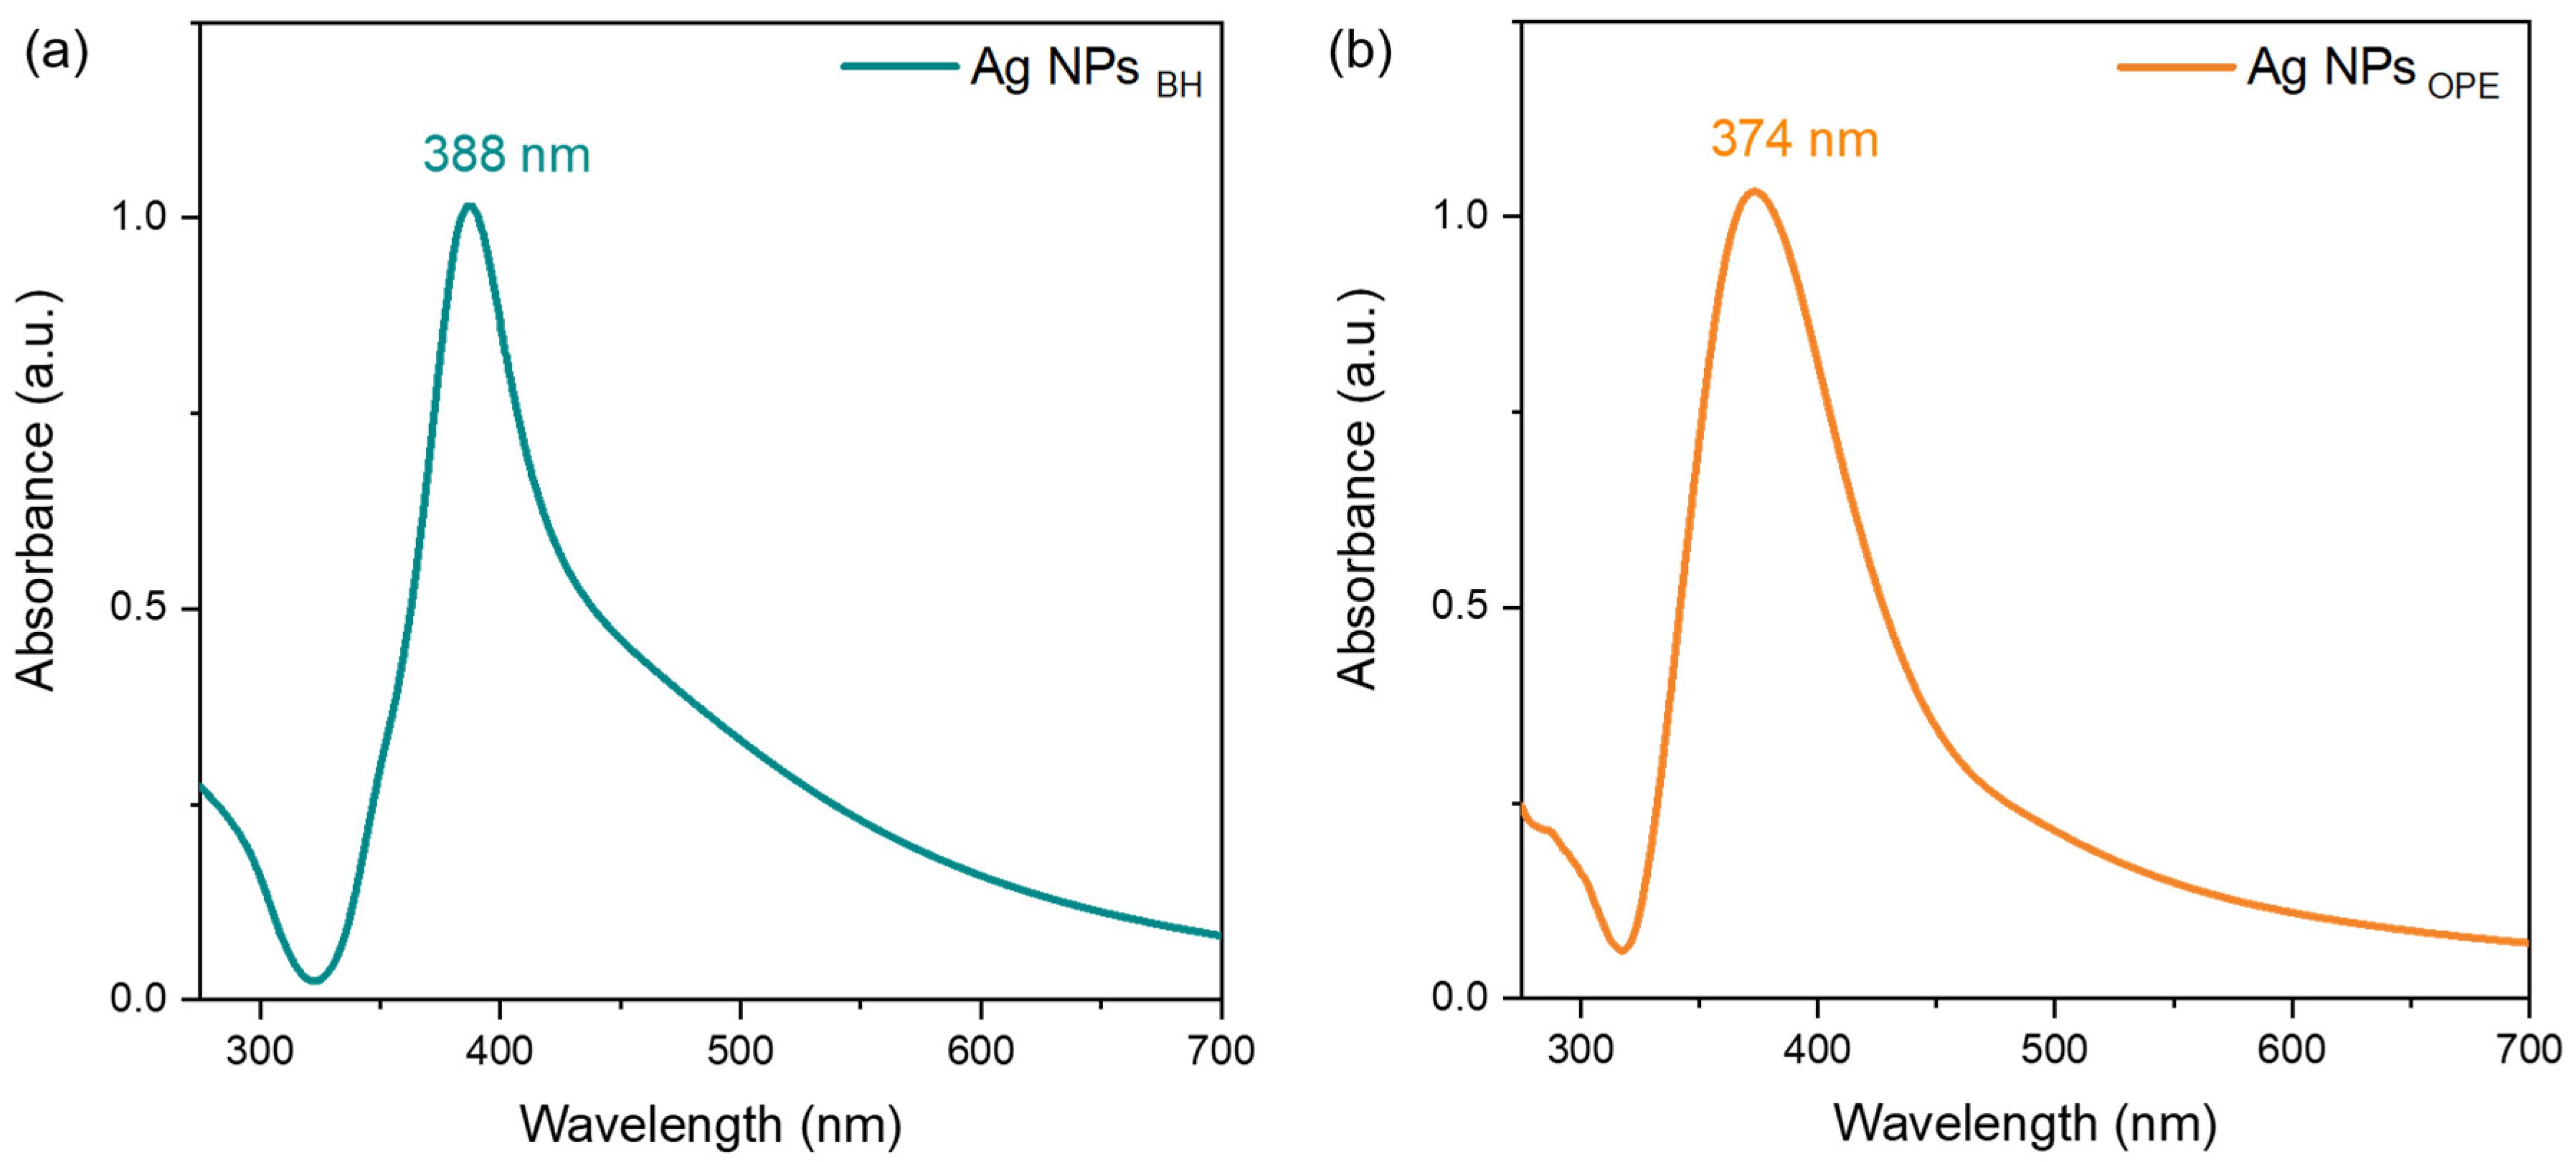
UV–vis spectrophotometric analysis was used to confirm the formation of Ag NPs (Figure 5). As reported in the literature, small spherical silver nanoparticles give a surface plasmon resonance (SPR) band in the 350–500 nm range with a peak position around 410 nm [80,81].
The spectrum of Ag nanoparticles prepared using NaBH4 as a reducing agent displays a narrow SPR peak centered at 388 nm, suggesting a predominant population with uniform particle size distribution. The presence of a tail at longer wavelengths points to a minor population of larger particles or the presence of anisotropic nanostructures. In contrast, the Ag nanoparticles synthesized using orange peel extract exhibit a broadened surface plasmon resonance (SPR) band centered at 374 nm, indicative of smaller particle sizes but increased polydispersity, likely arising from the complex and heterogeneous nature of the biomolecular capping agents [82].
The hydrodynamic sizes and polydispersity index (PDI) of the silver nanoparticles were obtained from the DLS measurements. The diameters of both Ag NPsOPE and Ag NPsBH varied from 10 to 100 nm, with an average value centered at 88 nm for Ag NPsOPE and 59 nm for Ag NPsBH. The relatively low PDI of 0.34 indicates good dispersion of the particles. It should be noted that DLS provides the hydrodynamic diameter of the particles, which includes the contribution of the surrounding solvation layer and possible organic capping agents. Therefore, the larger average size observed for Ag NPsOPE compared to Ag NPsBH can be attributed to the presence of biomolecular species from the extract adsorbed on the nanoparticle surface. This is consistent with the UV–Vis analysis, which reflects the metallic core size and suggests the formation of smaller primary particles in the OPE-based system.
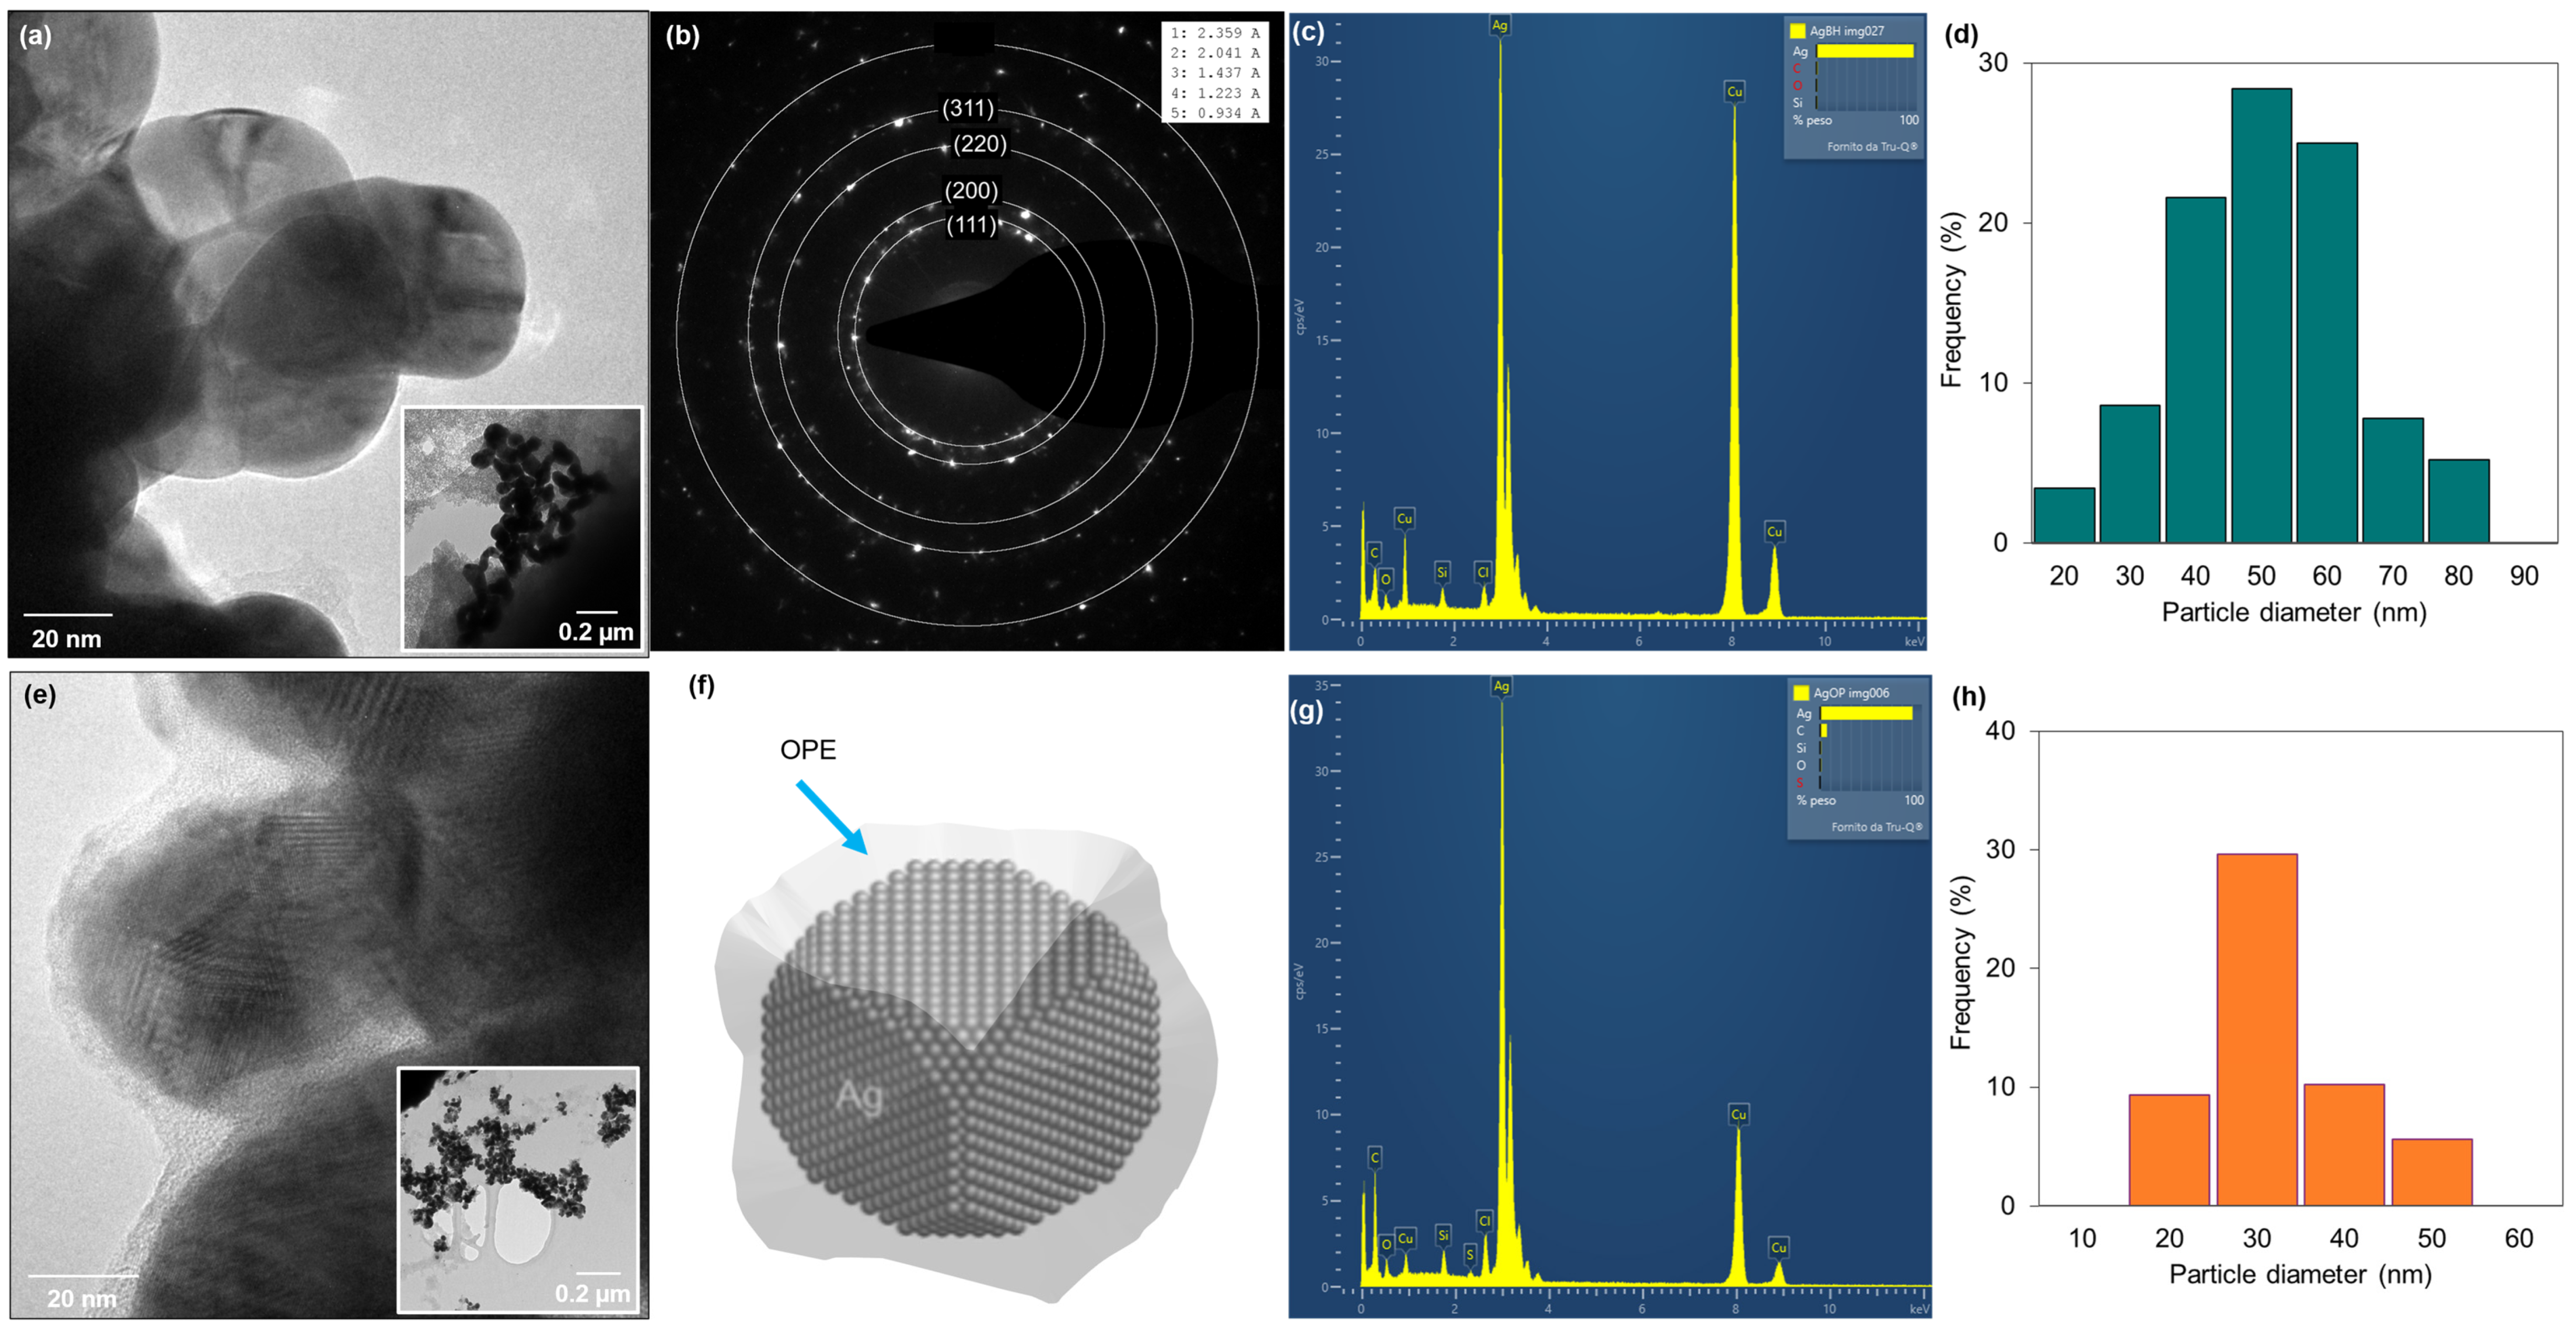
Transmission electron microscopy (TEM) was employed to investigate the size, shape, and morphology of the synthesized Ag NPs in greater detail. TEM images (Figure 6) confirmed that both synthesis routes produced predominantly spherical Ag NPs. As already suggested by the DLS results, a systematic difference between hydrodynamic and projected particle diameters was observed. Image analysis of the TEM micrographs, reported as histograms in Figure 6d,h, gave average diameters of 50.8 ± 13.6 nm for Ag NPsBH and 34.7 ± 9.1 nm for Ag NPsOPE, both significantly smaller than the corresponding hydrodynamic diameters measured by DLS (59 and 88 nm, respectively).
This discrepancy was particularly evident for Ag NPsOPE and supports the interpretation that the larger hydrodynamic diameter does not arise from a larger metallic core but rather from the presence of an organic layer adsorbed on the nanoparticle surface. In agreement with this hypothesis, Ag NPsOPE showed both a smaller average size and a narrower size distribution (σ = 9.1 nm) compared to Ag NPsBH (σ = 13.6 nm), suggesting a more controlled nucleation and growth process promoted by biomolecules present in the extract, which likely acted as stabilizing agents. Accordingly, the broader SPR band observed for Ag NPsOPE is likely influenced not only by particle size distribution effects but also by the presence of the organic capping layer and local dielectric variations surrounding the metallic core.
High-resolution TEM images revealed multiply twinned structures in both samples, a feature commonly observed in face-centered cubic noble metal nanoparticles formed under kinetically controlled growth conditions. In the case of Ag NPsOPE, HRTEM micrographs also showed a thin organic shell surrounding the nanoparticles, directly confirming the presence of a capping layer inferred from DLS analysis (Figure 6e). This organic coating likely contributes to steric stabilization, limiting particle coalescence and growth.
EDS analysis (Figure 6c,g) confirmed that both samples consisted predominantly of silver, while the carbon signal detected in Ag NPsOPE was consistent with residual organic species derived from the extract. Selected-area electron diffraction (SAED) patterns (Figure 6b) displayed diffraction rings attributable to the face-centered cubic (fcc) structure of metallic silver. The calculated d-spacing values for the (111), (200), (220), and (311) planes were 0.236, 0.204, 0.144, and 0.122 nm, respectively, in agreement with reference data for fcc silver (JCPDS card 04-0783). The combined EDS and SAED results confirm that silver was present in the zerovalent metallic state (Ag0) in nanoparticles obtained from both synthetic approaches.
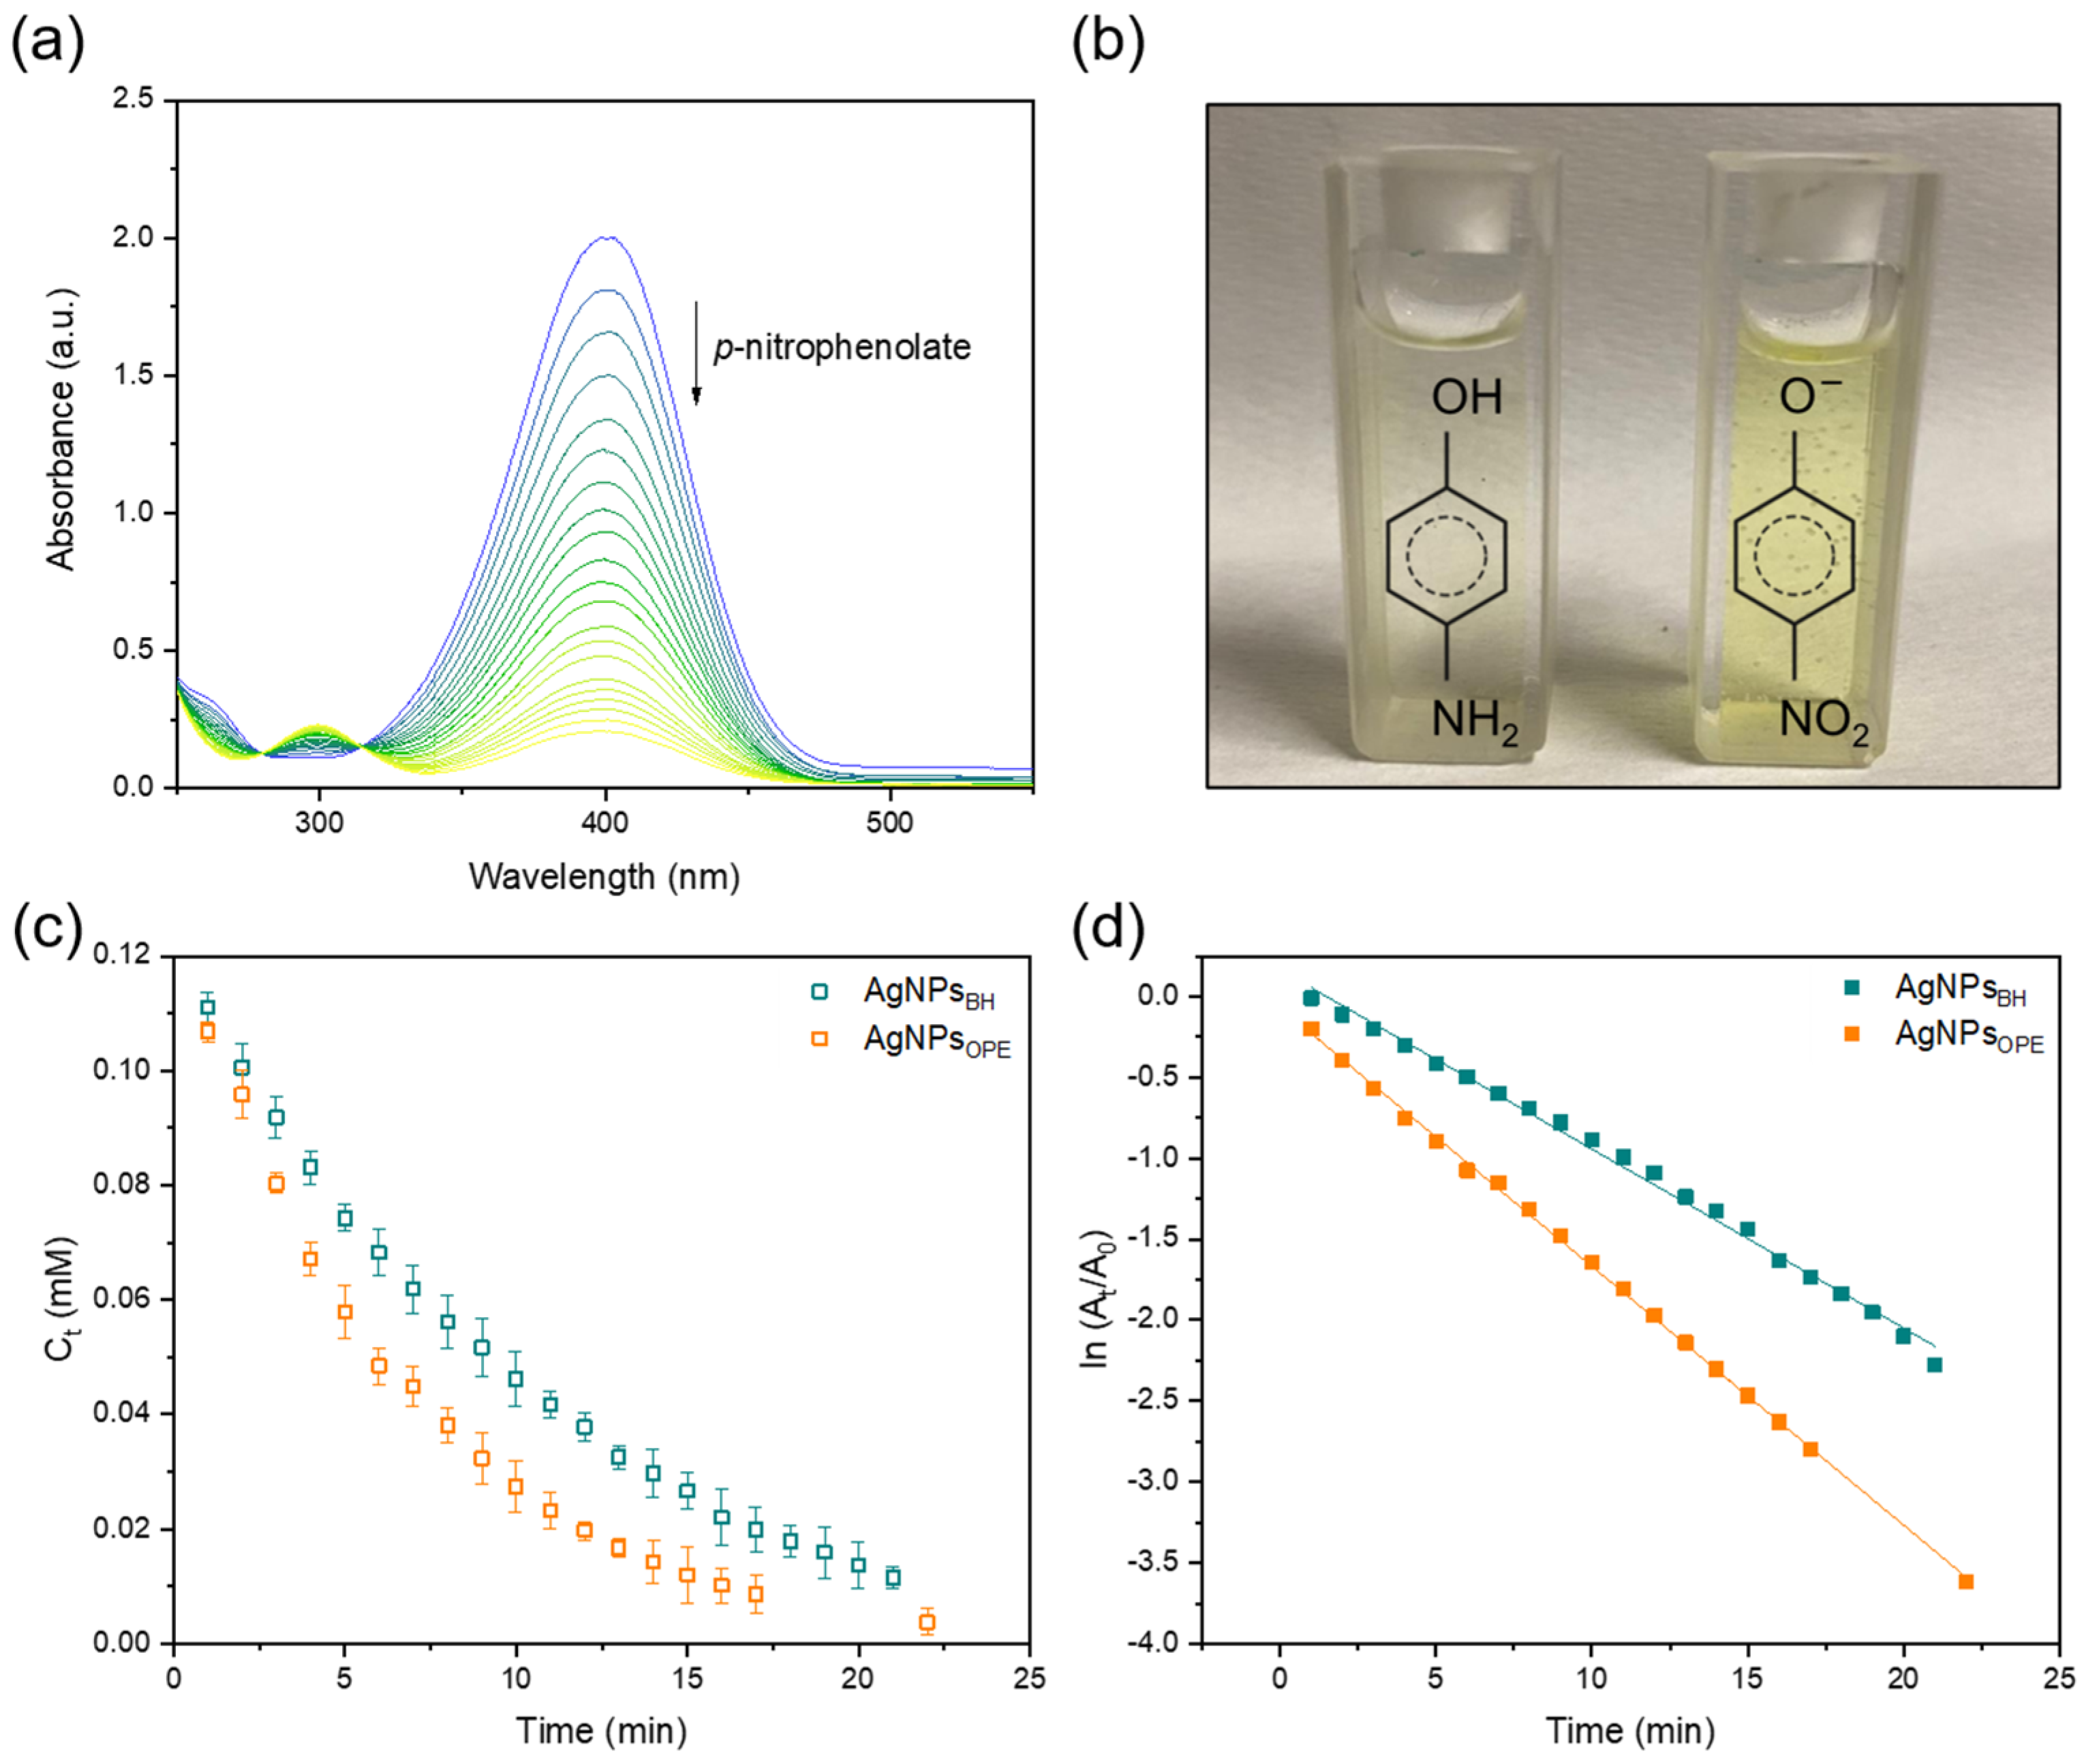
The catalytic activity of Ag nanoparticles was then assessed using the reduction of p-nitrophenol (4-NP) to its corresponding amino derivative, p-aminophenol (4-AP), in the presence of an excess of sodium borohydride (NaBH4) as a model reaction. This reaction is particularly convenient to monitor, as it produces a single product and both the reactant and the product can be detected by UV–vis spectroscopy. In alkaline conditions, p-nitrophenolate shows a characteristic absorption maximum at 400 nm, while p-aminophenol exhibits a band around 300 nm. The progress of the reaction can therefore be followed by tracking the changes in absorbance at these wavelengths.
Initially, the p-nitrophenol aqueous solution exhibited an absorption band at 317 nm and a light-yellow coloration. Upon addition of a freshly prepared NaBH4 aqueous solution, the absorption maximum shifted from 317 nm to 400 nm, consistent with the formation of the p-nitrophenolate ion in alkaline conditions (pH ≈ 10, Figure S3). This transition was accompanied by a visible change in the solution color from pale to bright yellow. In the absence of a catalyst, no changes in the absorption maximum were observed over time (up to 1 h), indicating that NaBH4 does not promote the reduction, even in large excess without an appropriate catalyst (Figure S4). In contrast, when silver-based catalysts were introduced (Figure 7a), a progressive decrease of the 400 nm band was observed. Simultaneously, new absorption peaks appeared at 298 nm and 231 nm, the former attributable to the formation of p-aminophenol. In contrast, the band at 231 nm arises from general aromatic π–π* transitions and is not specific to the product, although in the literature, this peak is often incorrectly attributed exclusively to p-aminophenol. After approximately 15 min, the solution color gradually faded, becoming colorless and transparent (Figure 7b). At the same time, the marked reduction of the 400 nm peak and the increase of the 298 nm band clearly indicated the completion of the reaction.
These results confirm that both Ag NPsOPE and Ag NPsBH are effective catalysts for the reduction process. Notably, the concentration–time profile for Ag NPsOPE exhibits a steeper decline than that of Ag NPsBH, indicating a more rapid consumption of the reactant (Figure 7c). Since NaBH4 is present in large excess, its concentration can be considered constant during the reaction period; thus, the reduction can be treated as a pseudo-first-order reaction with respect to p-nitrophenol. Accordingly, the reaction kinetics can be described by the equation ln(Ct/C0) = −kappt, where kapp is the apparent first-order rate constant (min−1), t is the reaction time, and Ct and C0 are the concentrations of 4-NP at time t and t = 0, respectively. Given that the concentration of 4-NP is directly proportional to its absorbance, the equation can be rewritten as ln(At/A0) = −kappt, where A0 is the initial absorbance at 400 nm, and At is the absorbance at time t. Figure 7d shows a linear relationship between ln(At/A0) and time, confirming pseudo-first-order kinetics for the reduction catalyzed by Ag NPsOPE and Ag NPsBH. As expected, the apparent rate constant, determined directly from the slope of the linear fit, was 0.16 min−1 for Ag NPsOPE, which is slightly higher than that observed for Ag NPsBH (0.12 min−1).
Although the particle sizes of Ag NPsBH and Ag NPsOPE are relatively comparable, the enhanced catalytic activity observed for Ag NPsOPE can likely be associated with the distinct structural and surface features evidenced by TEM, DLS, and HRTEM analyses. In particular, TEM analysis revealed a smaller average metallic core size and a narrower size distribution for Ag NPsOPE, while DLS measurements indicated the presence of a significantly larger hydrodynamic diameter, consistent with the formation of an organic capping layer derived from the orange peel extract. As evidenced by the HRTEM micrographs, this organic shell likely contributes to steric stabilization, limiting nanoparticle aggregation and preserving a higher fraction of accessible active surface during the catalytic process. Moreover, the smaller average particle size observed for Ag NPsOPE is expected to provide a larger exposed metallic surface area, which may additionally contribute to the slightly enhanced catalytic activity. In addition, the presence of oxygenated biomolecules surrounding the nanoparticles may also favor interfacial interactions with p-nitrophenolate species and facilitate electron transfer at the nanoparticle surface.

3.3. Supported Silver Nanoparticles and Their Catalytic Performance

Ag nanoparticles prepared by reduction using sodium borohydride (NaBH4) or orange peel extract (OPE) were subsequently supported on two different carbon supports, specifically, a commercial activated carbon (AC) and a carbon material derived from coconut biomass (CC).
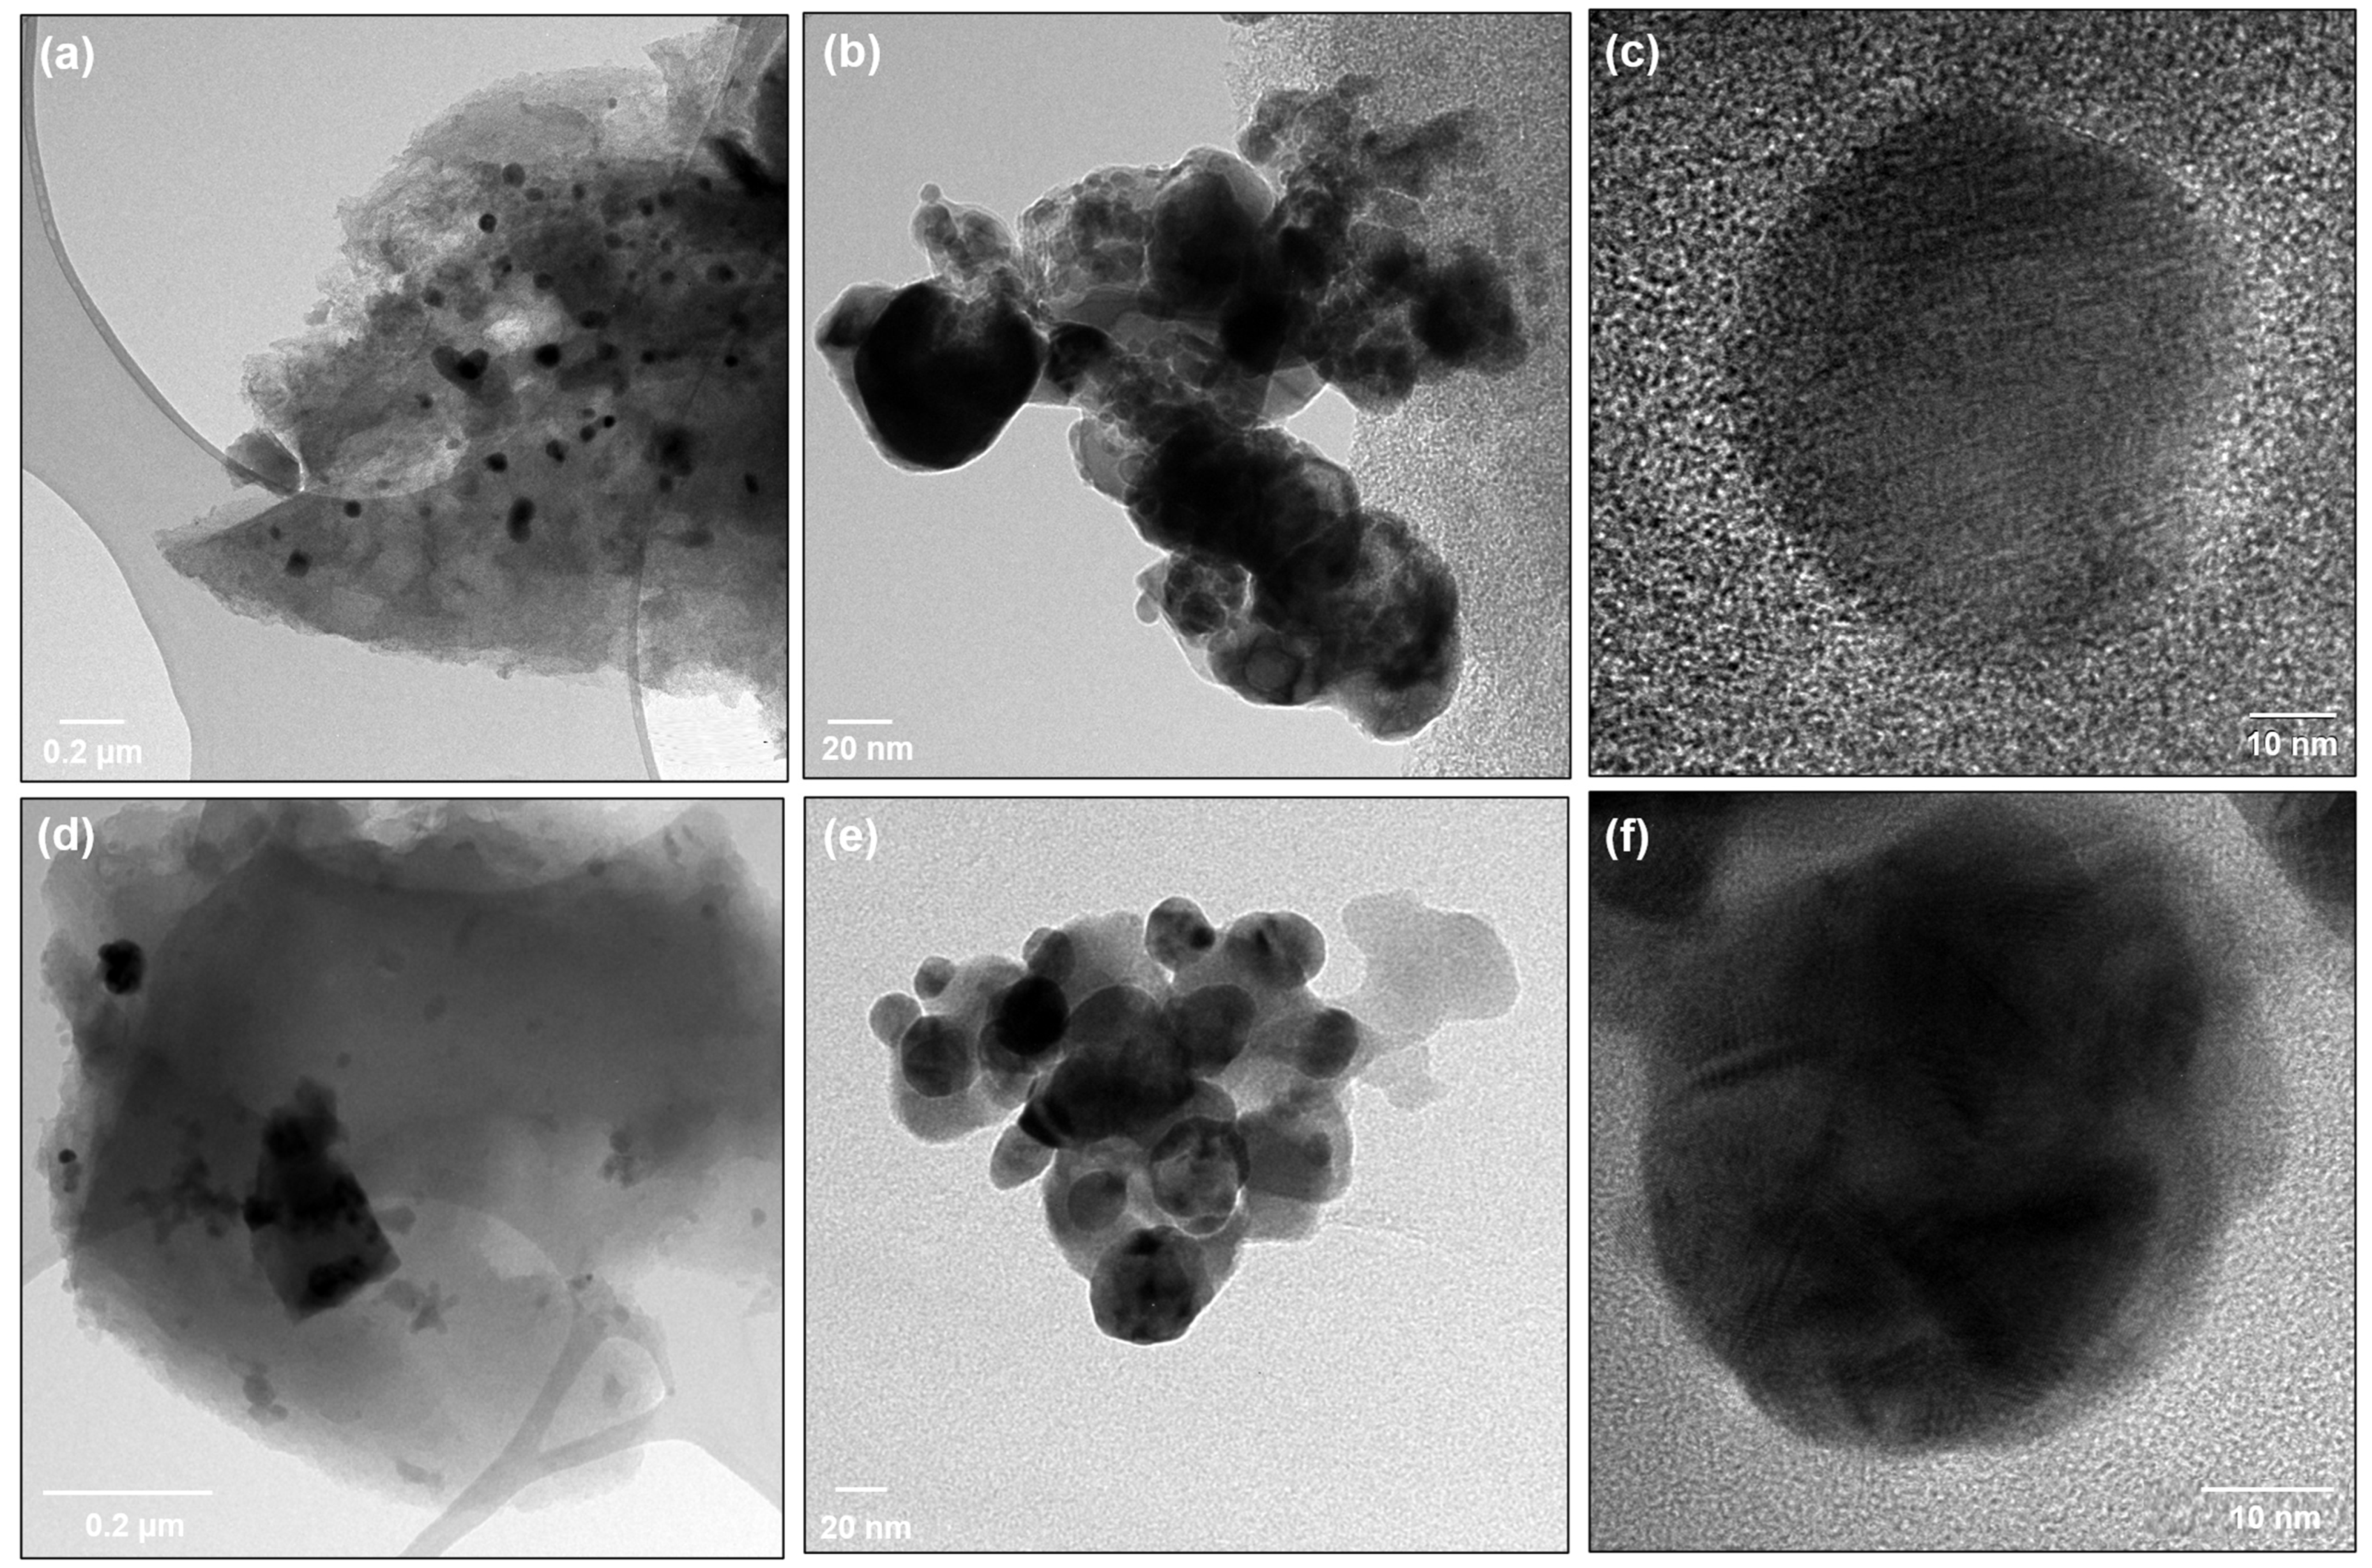
TEM analysis was performed on the Ag nanoparticles supported on the coconut biomass-derived carbon (CC).
Low-magnification TEM micrographs (Figure 8a,d) show extended carbon flakes decorated with darker Ag domains, confirming the successful immobilization of the nanoparticles onto the CC support. Higher-magnification images (Figure 8b,e) indicate that the Ag nanoparticles are moderately dispersed on the CC surface, despite the presence of partially aggregated domains. Image analysis yielded average particle sizes of 49.1 ± 14.3 nm for Ag/CCBH and 31.2 ± 8.2 nm for Ag/CCOPE (Figure S5). These values are remarkably close to those measured for the corresponding unsupported nanoparticles (50.8 ± 13.6 nm for Ag NPsBH and 34.7 ± 9.1 nm for Ag NPsOPE), indicating that the immobilization procedure does not significantly affect nanoparticle dimensions or induce relevant particle growth.
HRTEM images (Figure 8c,f) further confirm the maintenance of nearly spherical morphology of Ag nanoparticles on the CC support. Moreover, the nanoparticles supported through the OPE-assisted route appear generally more homogeneous and less aggregated than those obtained via NaBH4 reduction, in agreement with the narrower particle size distribution previously observed for unsupported Ag NPsOPE. An additional noteworthy aspect concerns the Ag/CCOPE sample. Unlike the unsupported Ag NPsOPE, no evident amorphous organic layer attributable to OPE species can be detected around the supported nanoparticles in Ag/CCOPE. This observation suggests that the immobilization onto the CC support, possibly combined with the washing step, promotes the effective removal or drastic reduction of residual OPE-derived organic species from the nanoparticle surface. This behavior may also contribute to improving the accessibility of the metallic surface sites during catalysis while preserving the smaller particle dimensions generated during the OPE-assisted synthesis.
EDS analysis (Figure S5) confirms the coexistence of Ag and C as the predominant elements in both CC-supported materials.
In general, the TEM characterization indicates that the support immobilization process preserves the main structural features of the unsupported nanoparticles while simultaneously favoring nanoparticle dispersion and limiting excessive particle growth.
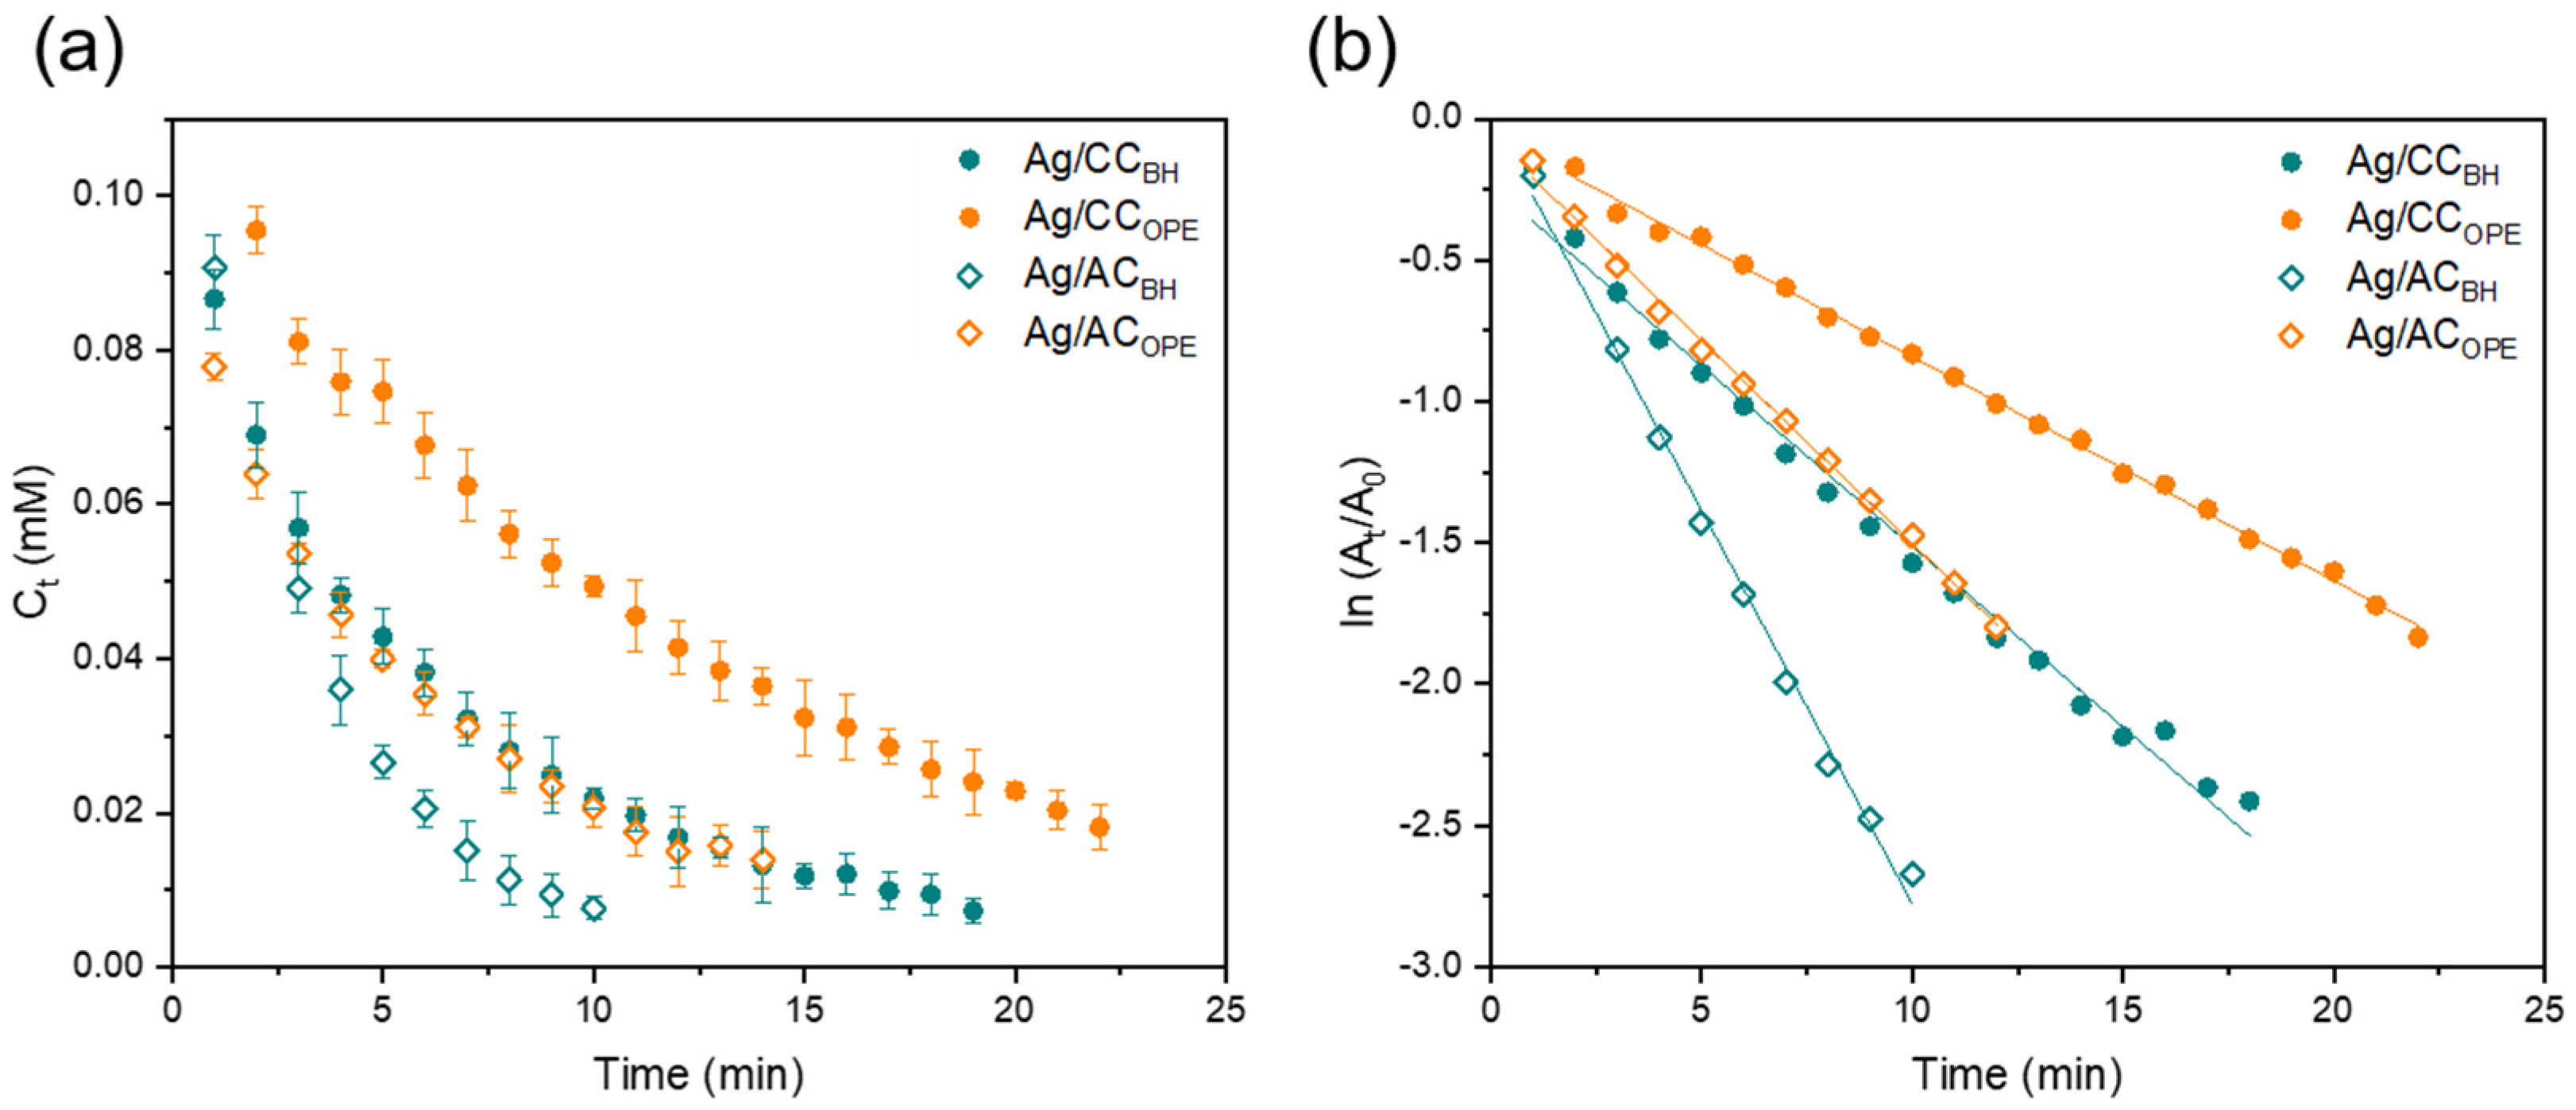
The catalytic activities of supported Ag NPs were evaluated under identical reaction conditions, including pH, temperature, and fixed concentrations of 4-NP and NaBH4. To ensure comparability with unsupported nanoparticles, the catalyst dosage was adjusted based on silver loading to maintain an equivalent total Ag content. In these cases, the concentration of 4-NP also decreases exponentially over time, and the plots of ln(At/A0) versus time show excellent linear correlation, confirming first-order reaction kinetics (Figure 9).
The following trend was observed for the apparent rate constant (kapp): Ag/ACBH (0.21 min−1) > Ag/CCBH (0.14 min−1) ≈ Ag/ACOPE (0.13 min−1) > Ag/CCOPE (0.08 min−1).
Notably, supporting Ag nanoparticles on carbon-based materials significantly enhances catalytic activity, particularly for those prepared by chemical reduction. For instance, the Ag/ACBH catalyst exhibits a kapp value nearly twice that of the corresponding unsupported colloidal nanoparticles (0.21 vs. 0.12 min−1). This improvement can be attributed to the immobilization of Ag NPs on the carbon support, which limits aggregation and increases the availability of active sites. In addition, the higher external surface area and broader pore size distribution of AC compared to CC likely facilitate reactant diffusion and improve the accessibility of Ag active sites during the catalytic process. In contrast, this support effect is less pronounced for OPE-reduced nanoparticles, as the OPE itself acts as a stabilizing agent, effectively preventing aggregation even without a support. Moreover, TEM analysis suggested that the immobilization and washing steps applied to Ag/CCOPE may partially remove the organic shell originally surrounding unsupported Ag NPsOPE. While this could improve accessibility to the metallic surface, it may simultaneously reduce part of the steric stabilization effect associated with the OPE-derived coating [44].
Table 4 summarizes the catalytic performance of the Ag-based materials investigated in this work compared with similar systems from the literature. A direct comparison, however, is challenging due to variability in experimental conditions, such as reagent concentrations, Ag loading, catalyst dosage, and the use of supported versus unsupported systems, which can significantly influence the observed catalytic activity.
Despite these limitations, the catalytic activities determined in this study fall within the ranges commonly reported for Ag-based systems under comparable NaBH4/4-NP ratios, for both unsupported nanoparticles and carbon-supported materials.
The combined catalytic and structural characterization results suggest that the catalytic behavior of the investigated systems is governed not only by nanoparticle size but also by the interplay between particle stabilization, support texture, pore accessibility, and surface chemistry.
Notably, the Ag NPs synthesized using OPE demonstrated catalytic performances comparable to those of other bio-derived systems. This is consistent with findings by Riaz et al. [92], where natural extracts (e.g., Cucumis sativus and Aloe vera) were effectively employed to produce biogenic Ag NPs active in the catalytic reduction of 4-NP.
Consequently, while the use of natural extracts as reducing agents may represent a sustainable alternative to conventional synthesis, further investigation is required to fully assess their operational limits and ensure adequate control over the synthesis process to govern the size distribution and long-term stability of the Ag NPs.
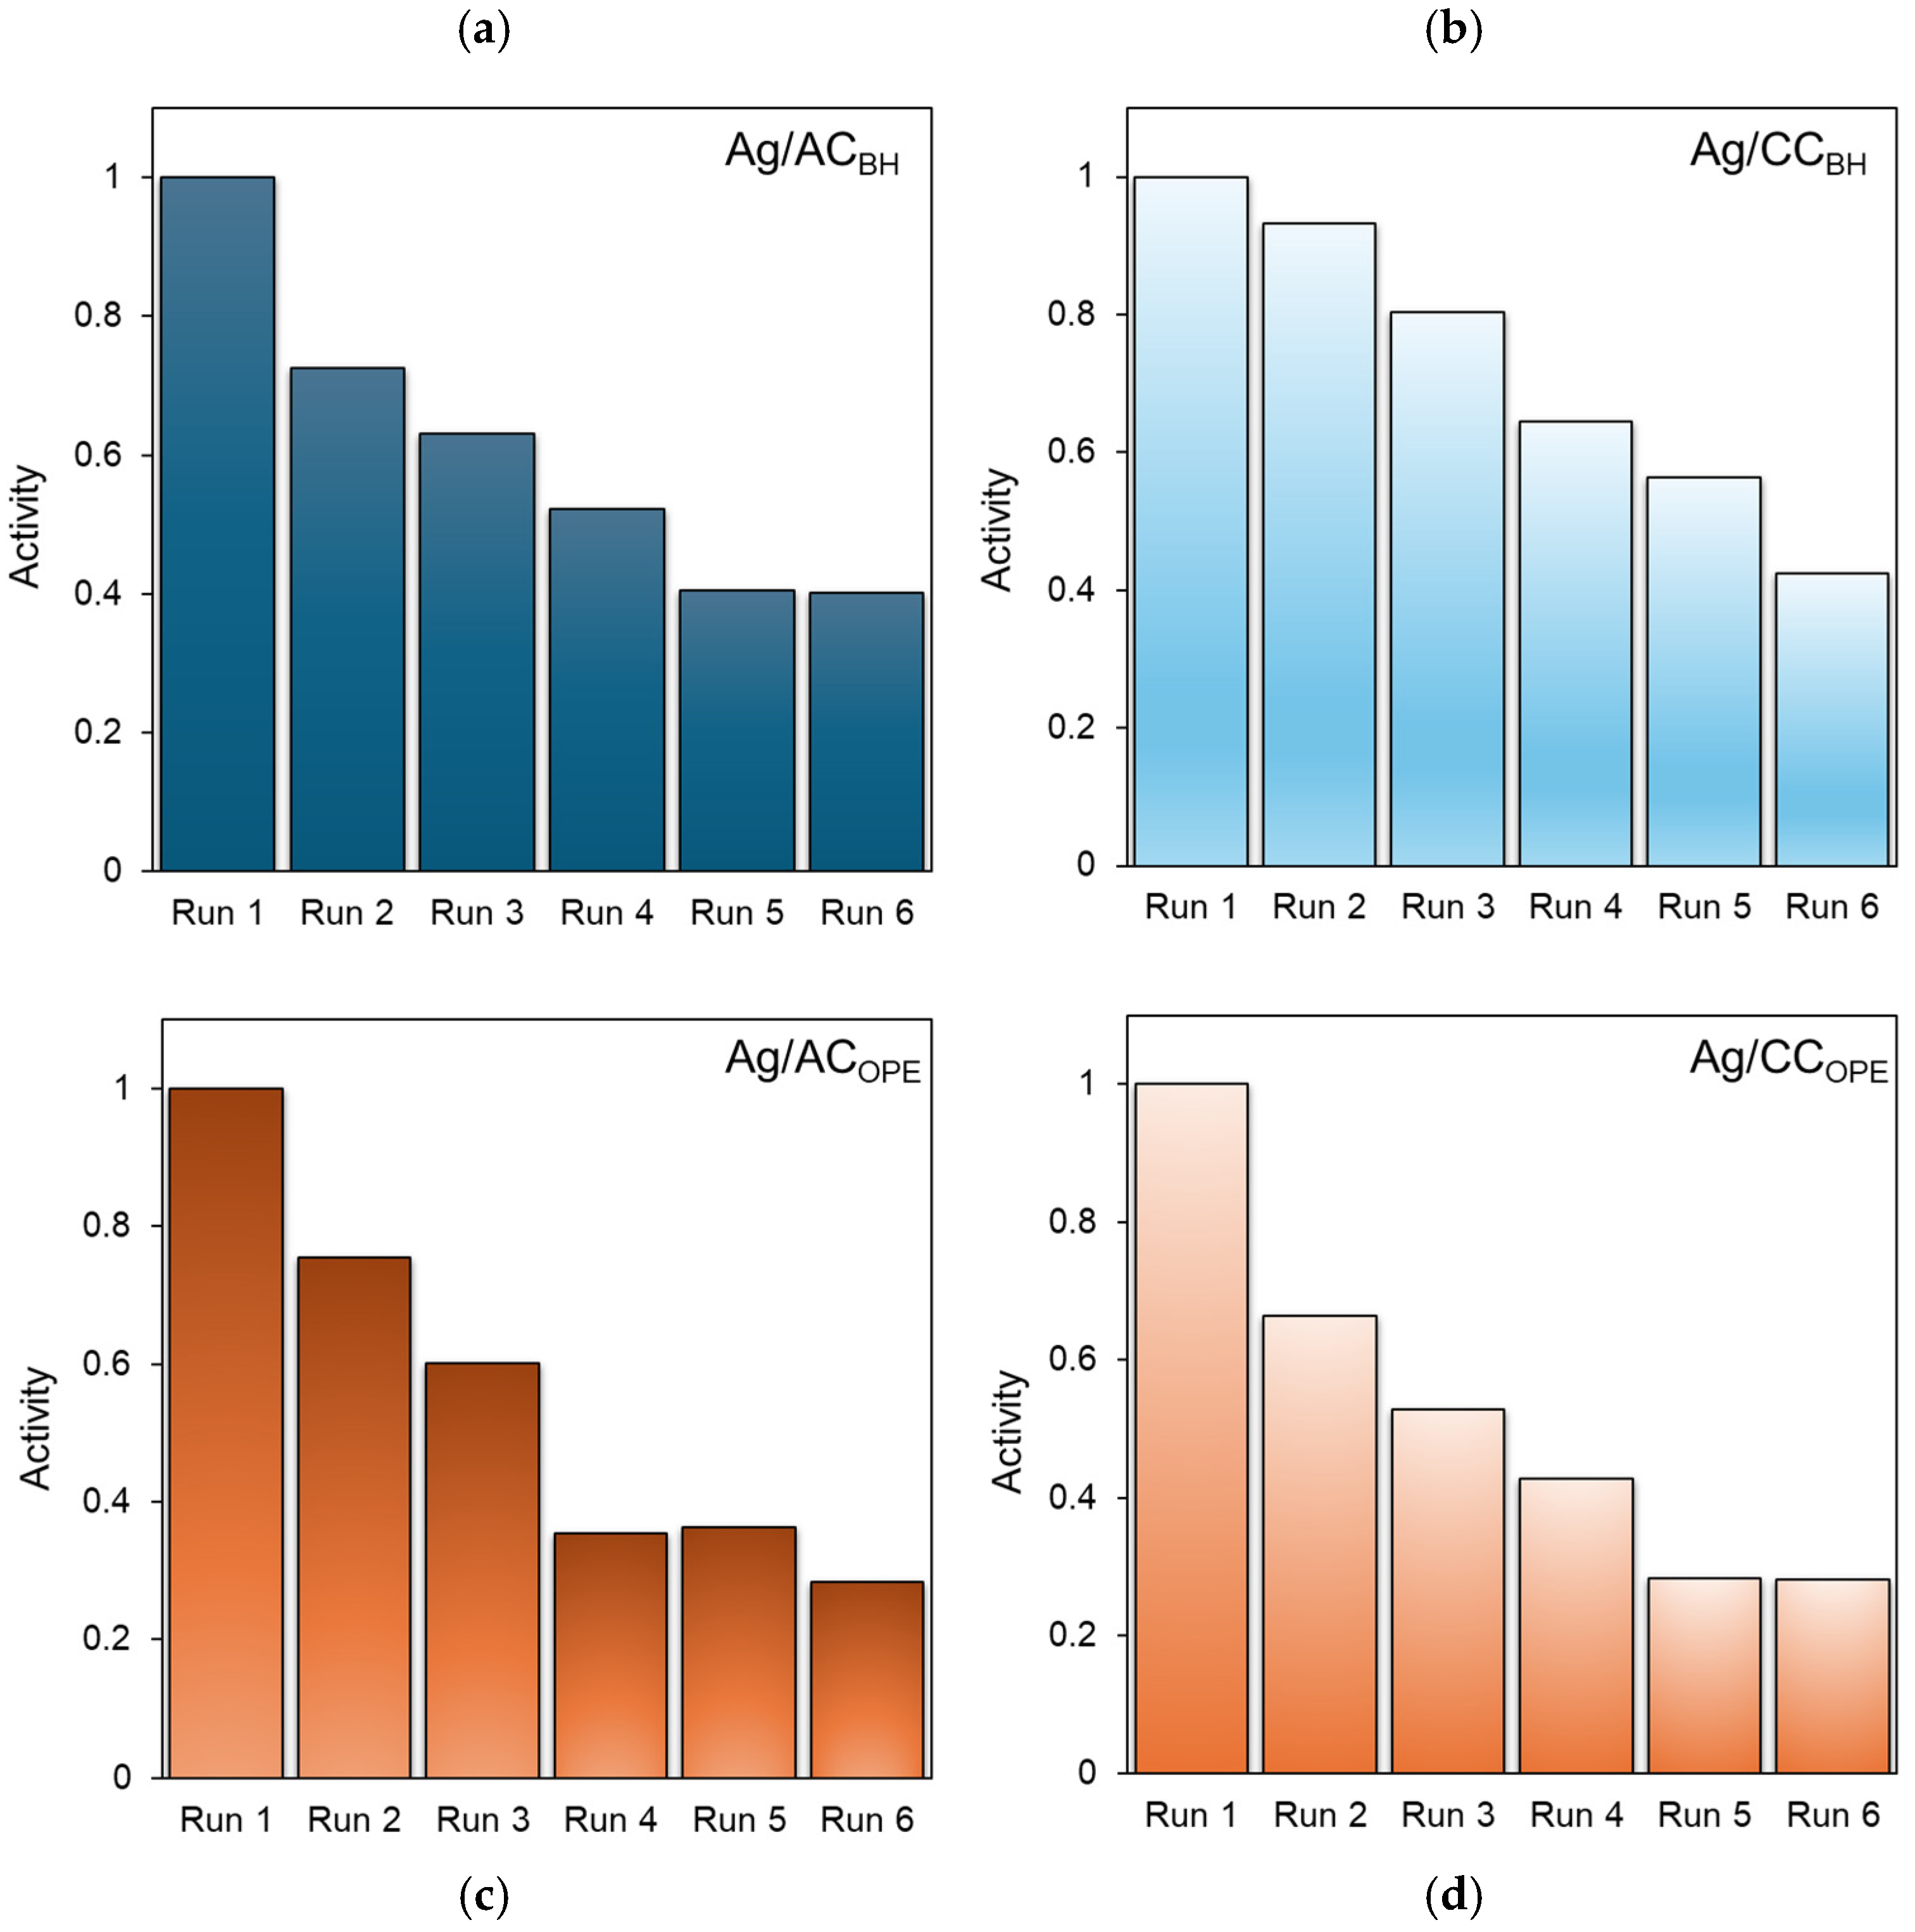
The reusability of a catalyst is a key factor for its practical application. To assess this aspect, six consecutive catalytic reduction cycles were performed, with the Ag-based nanocatalyst recovered by centrifugation after each run and reused in the subsequent cycle. The catalytic activity was expressed as a relative value by comparing the reaction rate of each cycle to the initial rate (Run 1).
As shown in Figure 10, in all cases, the activity gradually decreases across cycles, eventually stabilizing at approximately 30–40% of the initial value after six runs. This decline cannot be attributed to the detachment of Ag nanoparticles. In fact, stability tests conducted on all catalysts confirmed the stable anchoring of Ag and the absence of metal nanoparticle release even after 3 h of contact in water.
Several possible explanations may account for the observed catalytic deactivation. First, partial oxidation of Ag0 to Ag+ species, followed by leaching of these ions, may contribute to the loss of active sites, although this process should be mitigated by the reducing environment maintained by NaBH4. Second, surface poisoning by reaction products may occur: p-aminophenol can strongly adsorb onto the Ag surface through its amine groups, blocking active sites and hindering access to p-nitrophenol, thereby leading to a progressive decrease in catalytic activity [41]. Third, the aggregation of Ag nanoparticles into larger particles during repeated catalytic cycles may significantly reduce the accessible active surface area; however, the presence of the CC support is expected to partially counteract this phenomenon by promoting the dispersion and stabilization. In this respect, the smaller particle size and narrower size distribution observed for the OPE-derived nanoparticles may initially favor higher dispersion, although repeated catalytic cycles could progressively alter these structural features under reaction conditions. Finally, the blocking of the carbon support porosity by reagents, reaction products, or H3BO3 crystals formed during the reaction cannot be excluded, as pore clogging would restrict the diffusion of reactants to the active sites and thus impair the overall catalytic performance. This effect may be particularly relevant for highly microporous systems such as CC, where reactant transport is already partially limited by the narrow pore structure and reduced external surface area evidenced by the N2 adsorption–desorption analyses.

3.4. Cost–Performance Analysis

In heterogeneous catalysis and environmental remediation studies, material performance is still mainly assessed exclusively in terms of catalytic activity, typically expressed as conversion, rate constants, or removal efficiency. While these descriptors are useful for benchmarking intrinsic reactivity, they provide only a partial view of the actual applicability of a catalytic system. From a process-oriented perspective, a more balanced evaluation should account not only for performance but also for the resources required to achieve it.
In this context, the definition of appropriate figures of merit that combine technical performance with process-related costs becomes essential [93]. Such an approach enables a more meaningful comparison between catalytic systems, moving beyond activity alone and incorporating the economic implications associated with their preparation and use. This perspective is particularly relevant for systems derived from waste or “green” routes, where sustainability claims are often not supported by a quantitative cost assessment.
Based on these considerations, a preliminary cost-oriented assessment of the synthesis procedures used in this work was carried out. The analysis was performed at laboratory scale and focused on direct material costs associated with the preparation of both pristine Ag NPs and supported catalysts. It should be emphasized that this analysis is intentionally limited to material costs and does not represent a full techno-economic assessment. In particular, operational factors, such as energy consumption, processing time, labor, and waste treatment, are not included in the present analysis. Rather, it provides a simplified and internally consistent framework for comparative purposes. Therefore, the calculated costs should be interpreted as relative indicators for comparison between systems, rather than absolute economic values. To ensure broader applicability and avoid bias related to specific laboratory procurement conditions, unit costs were estimated based on representative lower-bound market prices for reagents of comparable purity, rather than on the actual purchase costs.
The detailed unit costs and the adopted system boundaries are reported in the Supporting Information (Tables S1 and S2). The analysis includes precursor chemicals, carbon supports, and washing solvents, while process water was considered as part of the synthesis protocol but not monetized. Orange peel extract (OPE) was treated as a waste-derived reagent and therefore not associated with a direct purchase cost. However, it should be noted that this assumption may underestimate the real cost contribution of the OPE-based route when additional processing, storage, or standardization steps are required at a larger scale. In this sense, the OPE-based route should be regarded as an idealized scenario representative of waste valorization conditions, rather than a fully quantified economic case.
The resulting synthesis costs are summarized in Table S3. Batch costs are reported for completeness, while comparative discussion is primarily based on normalized or per-test metrics.
A first comparison between the two reduction routes (NaBH4 vs. OPE) highlights a clear difference in the cost of pristine nanoparticles (Table S3). Under equivalent precursor conditions, the OPE-based route results in a slightly lower synthesis cost compared to the NaBH4-based one. This behavior reflects the absence of an external reducing agent and the simplified reagent systems associated with the waste-derived protocol.
When moving to supported systems, the synthesis cost is largely governed by the carbon support. AC-based materials are more expensive than coconut-derived carbons, reflecting their higher unit price (20 vs. 5 € per kg, Table S1). Consequently, the choice of support becomes a key parameter in determining the total cost of the final catalyst, often overcoming the contribution of nanoparticle synthesis itself.
A comparison between the two synthesis strategies for supported catalysts indicates that NaBH4-derived systems are generally less expensive than OPE-derived ones. This trend is observed for both AC- and CC-based materials, although the difference is more pronounced in the latter case. This result highlights that the adoption of a green reducing agent does not necessarily translate into a lower overall material cost, as additional steps (e.g., washing, solvent use, or base addition) may offset the intrinsic advantages of the bio-derived route under the investigated conditions.
While the analysis of synthesis costs provides useful insight into catalyst preparation, it does not directly reflect the cost associated with catalytic operation. For this reason, the cost per catalytic test was estimated by accounting for the effective amount of catalyst used in each reaction (see Section 2.9). Importantly, unlike batch synthesis costs, the cost per test accounts for the actual amount of material used and is therefore independent of the synthesis scale. However, this approach inherently assumes ideal material utilization and does not consider potential losses during handling, separation, or recovery.
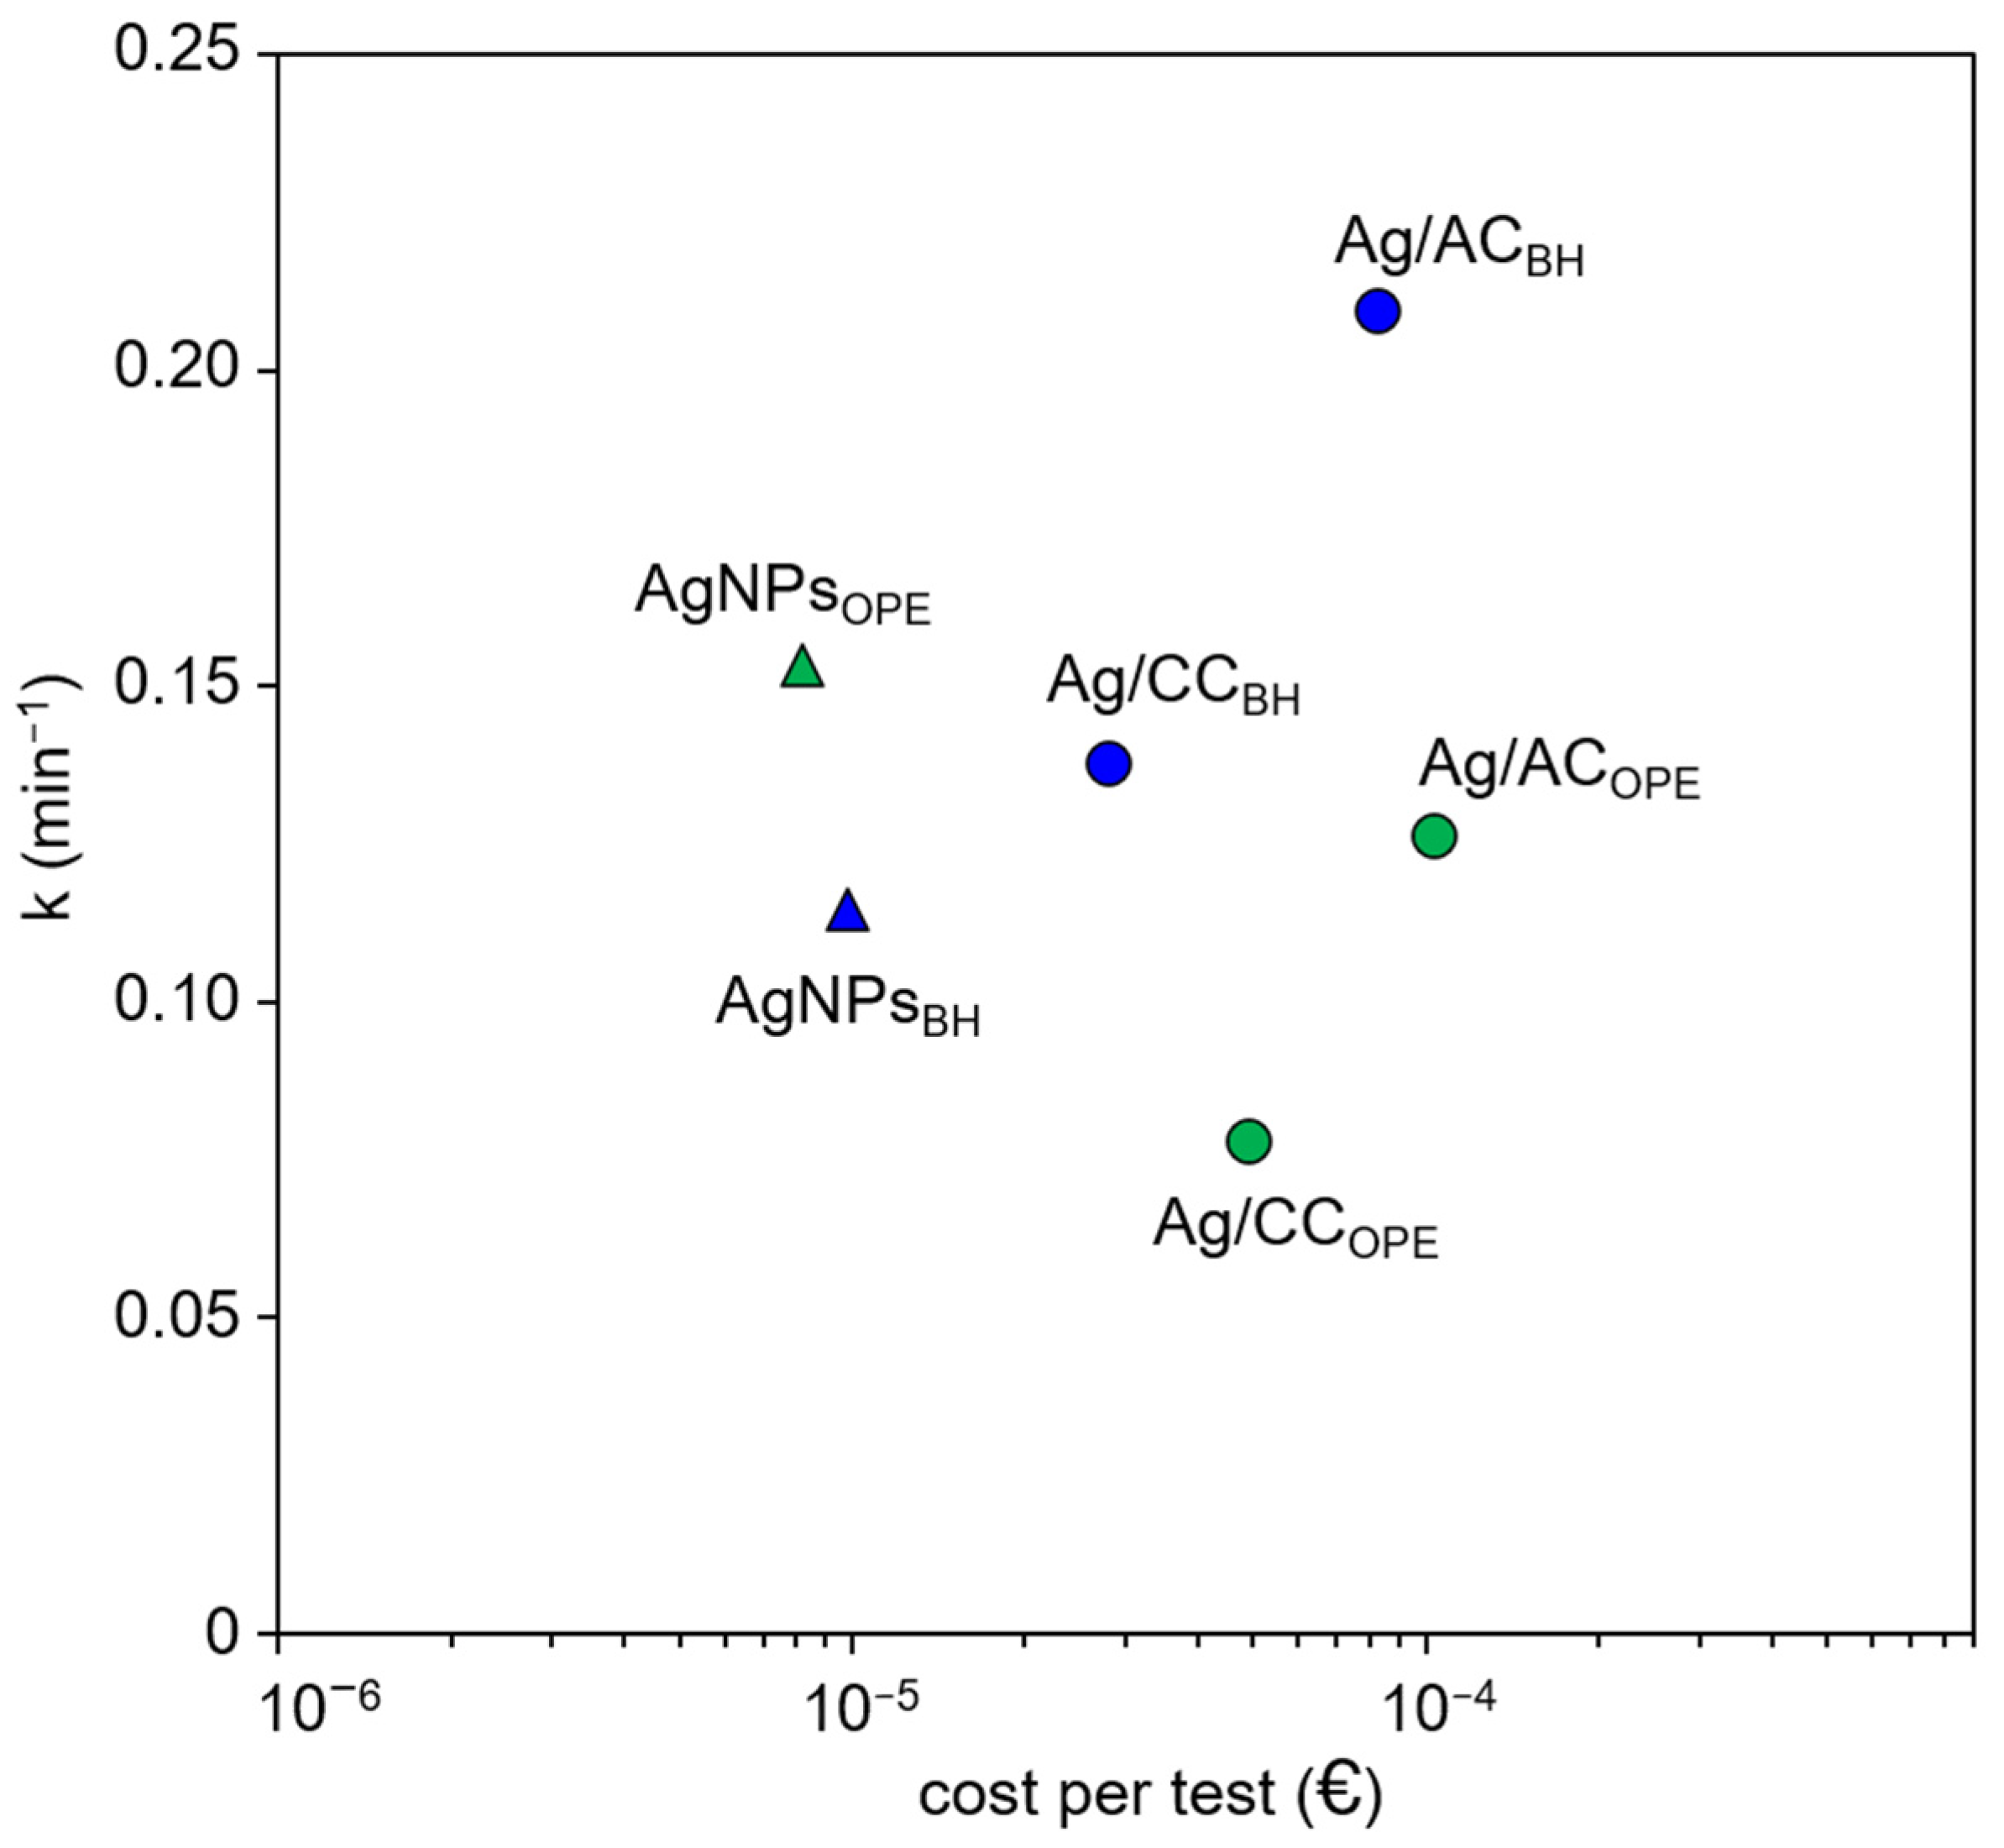
The resulting cost per test values are reported in Table S4 together with the corresponding figure of merit (FoM), while Figure 11 illustrates the relationship between catalytic performance (k) and cost per test. This representation allows a direct visualization of the cost–performance trade-off, while the FoM provides a quantitative descriptor of the catalytic efficiency normalized by cost. It should be emphasized that the FoM is defined under the specific experimental conditions adopted in this study and is therefore intended as a simplified comparative descriptor. As such, it does not account for catalyst stability, long-term productivity, or performance under continuous or scaled-up operation.
It should be taken into account that the comparison between pristine nanoparticle suspensions and supported catalysts reflects two different usage modes, i.e., dispersed versus solid-phase systems, which may influence the interpretation of cost–performance metrics depending on the targeted application. For this reason, the comparison should be interpreted as a framework-level evaluation rather than a direct process equivalence.
The cost per test differs by several orders of magnitude between pristine Ag NPs and supported catalysts (Figure 11). Nanoparticle suspensions result in extremely low costs per test, due to the very small amount of Ag required to reach the target concentration, whereas supported systems require a fixed mass of solid catalyst, leading to significantly higher material costs per run.
When performance is normalized by cost through the FoM (Table S4), a different ranking emerges. In particular, pristine Ag NPs synthesized via the OPE route exhibit the highest FoM value (1.84·104 min−1·€−1), followed by NaBH4-derived nanoparticles (1.17·104 min−1·€−1), reflecting their low cost per test combined with comparable catalytic activity.
Within supported systems, CC-based materials exhibit higher FoM values than AC-based ones, primarily reflecting their lower material cost, even though differences in catalytic activity are observed between the two supports.
Taken together, these results suggest that the integration of cost considerations can influence the interpretation of catalytic performance, even within a simplified material-cost framework. Although certain supported systems exhibit higher kinetic constants, their higher material cost per test results in lower overall cost-efficiency compared to dispersed nanoparticle systems. These findings suggest that sustainability assessments based solely on catalytic activity or green synthesis routes may lead to incomplete interpretations if not complemented by cost considerations. In this context, it is also important to consider that pristine nanoparticle suspensions and supported catalysts differ not only in cost structure but also in operational aspects, such as stability and reusability. In the present study, stability tests were performed only on supported systems, which showed a progressive decrease in activity over consecutive cycles while maintaining no detectable Ag release (Figure 10).
Therefore, although dispersed nanoparticle systems exhibit superior cost-efficiency under batch conditions, supported catalysts offer advantages in terms of recovery, reuse, and operational handling, which are essential for practical water treatment applications.
While the proposed cost–performance framework provides useful insights for preliminary comparison and screening, a more comprehensive evaluation, including operational parameters and long-term catalytic performance, would be required to fully assess the practical viability of these systems. Accordingly, the results presented here should not be interpreted as predictive of real process costs but rather as a simplified comparative framework applicable under laboratory-scale conditions.
Although preliminary and limited to laboratory-scale conditions, this analysis highlights the need for a more critical and multidimensional evaluation of catalytic systems, where performance and cost are jointly considered rather than treated as independent descriptors.

4. Conclusions

Silver nanoparticles synthesized via both NaBH4 and orange peel extract (OPE) routes showed effective catalytic activity in the reduction of p-nitrophenol under pseudo-first-order conditions. OPE-derived nanoparticles exhibited slightly higher activity (kapp = 0.16 min−1) compared to NaBH4-reduced ones (kapp = 0.12 min−1), which can be associated with their smaller average particle size, narrower size distribution, and the presence of an organic capping layer that contributes to colloidal stabilization and preservation of accessible active surface area.
Immobilization on carbon supports significantly influenced the catalytic behavior of the Ag nanoparticles. In particular, the highest activity was observed for Ag/ACBH (kapp = 0.21 min−1), nearly doubling the performance of the corresponding unsupported system. The enhanced performance of AC-based catalysts can be reasonably related to the larger external surface area and broader pore structure of the commercial activated carbon, which facilitate reactant diffusion and accessibility to the active sites. Conversely, catalysts based on coconut-derived carbon exhibited lower kinetic constants (e.g., Ag/CCOPE: 0.08 min−1), reflecting the higher microporous character and reduced pore accessibility of the biomass-derived support.
When evaluated from a cost–performance perspective, however, a different trend emerged. Despite their lower absolute catalytic activity, CC-based systems exhibited more favorable cost-normalized metrics due to the lower cost of the support, while unsupported nanoparticles displayed the highest efficiency per catalytic test. These findings highlight that catalytic activity alone is not sufficient to identify the most advantageous system when economic considerations are included.
Reusability tests revealed progressive catalyst deactivation upon repeated cycles, with the activity decreasing to approximately 30–40% of the initial value after six runs. The observed deactivation was mainly associated with surface-related phenomena, including active-site poisoning, nanoparticle aggregation, and pore blocking, rather than with metal leaching.
All these results demonstrate that both the nanoparticle synthesis route and the physicochemical properties of the support critically govern catalytic performance, stability, and cost-efficiency. More broadly, this work highlights the importance of integrating structural characterization, catalytic evaluation, and preliminary economic considerations to achieve a more comprehensive assessment of sustainable catalytic systems.

Supplementary Materials

The following supporting information can be downloaded at https://www.mdpi.com/article/10.3390/surfaces9020053/s1, Table S1: Unit cost of materials used, based on the lowest commercially available laboratory-grade prices at comparable purity. These values are intended for comparative purposes only and do not represent market-averaged costs. Table S2: System boundaries and assumptions adopted in the cost analysis. Table S3: Detailed material costs of catalyst syntheses at laboratory scale. Table S4: Cost-normalized catalytic performance of Ag-based systems. Figure S1: (a) UV–Vis spectrum and (b) ATR-FTIR spectrum of the dried orange peel extract (OPE). Figure S2: Micropore size distribution of activated carbon (AC) and coconut-derived carbon (CC) obtained by the Horvath–Kawazoe (HK) method assuming slit-shaped pores. Figure S3: UV–Vis absorption spectra of 4-NP before and after the addition of NaBH4 solution. Figure S4: 4-NP spectra after 1 min and 60 min with the addition of NaBH4. Figure S5: (a,c) EDS spectra of Ag/CCBH and Ag/CCOPE; (b,d) particle size distribution histograms of Ag/CCBH and Ag/CCOPE.

Author Contributions

Conceptualization, T.A., M.B., E.C., M.G.G. and S.C.; methodology, T.A., M.B., E.C., M.G.G. and S.C.; validation, T.A., M.B., E.C., M.G.G. and S.C.; formal analysis, T.A. and M.G.G.; investigation, T.A. and M.G.G.; resources, M.G.G. and S.C.; data curation, T.A., M.G.G. and S.C.; writing—original draft preparation, T.A.; writing—review and editing, M.G.G. and S.C.; supervision, M.G.G. and S.C.; project administration, S.C.; funding acquisition, S.C. All authors have read and agreed to the published version of the manuscript.

Funding

This research was funded by the Department of Chemistry, Università degli Studi di Milano, Italy (Piano Sostegno alla Ricerca, PSR 2023, linea 2).

Institutional Review Board Statement

Not applicable.

Informed Consent Statement

Not applicable.

Data Availability Statement

Dataset available on request from the authors.

Acknowledgments

The authors gratefully acknowledge Luisa De Cola and Luigi Menduti from Dipartimento di Scienze Farmaceutiche at Università degli Studi di Milano for DLS analyses presented in this work. The Laboratorio Analisi of the Dipartimento di Chimica, Università degli Studi di Milano, is acknowledged for the XRD measurements, with special thanks to Stefania Vitali for her valuable support. TEM analyses were performed at the TEM facility of Unitech COSPECT at the University of Milan (Italy). The authors are grateful to Nicola Rotiroti for his assistance.

Conflicts of Interest

The authors declare no conflicts of interest. The funders had no role in the design of the study; in the collection, analyses, or interpretation of data; in the writing of the manuscript; or in the decision to publish the results.

References

  1. García-Serna, J.; Piñero-Hernanz, R.; Durán-Martín, D. Inspirational Perspectives and Principles on the Use of Catalysts to Create Sustainability. Catal. Today 2022, 387, 237–243. [Google Scholar] [CrossRef] [Scilit]
  2. Tabanelli, T.; Cespi, D.; Cucciniello, R. Sustainable and Environmental Catalysis. Catalysts 2021, 11, 225. [Google Scholar] [CrossRef] [Scilit]
  3. Vakros, J.; Hapeshi, E.; Cannilla, C.; Bonura, G. Synthesis, Characterization and Performance of Materials for a Sustainable Future. Nanomaterials 2023, 13, 1929. [Google Scholar] [CrossRef] [Scilit] [PubMed]
  4. Akhtar, M.S.; Zaman, W. Sustainable Catalysis for Green Chemistry and Energy Transition. Catalysts 2025, 15, 773. [Google Scholar] [CrossRef] [Scilit]
  5. Radulescu, D.M.; Surdu, V.A.; Ficai, A.; Ficai, D.; Grumezescu, A.M.; Andronescu, E. Green Synthesis of Metal and Metal Oxide Nanoparticles: A Review of the Principles and Biomedical Applications. Int. J. Mol. Sci. 2023, 24, 15397. [Google Scholar] [CrossRef] [Scilit]
  6. Wink, K.; Hartmann, I. Recent Progress in Turning Waste into Catalysts for Green Syntheses. Sustain. Chem. 2024, 5, 27–39. [Google Scholar] [CrossRef] [Scilit]
  7. Pirsaheb, M.; Gholami, T.; Seifi, H.; Dawi, E.A.; Said, E.A.; Hamoody, A.H.M.; Altimari, U.S.; Salavati-Niasari, M. Green Synthesis of Nanomaterials by Using Plant Extracts as Reducing and Capping Agents. Environ. Sci. Pollut. Res. 2024, 31, 24768–24787. [Google Scholar] [CrossRef] [Scilit]
  8. Naik, S.; Bharti, R.; Sharma, R.; Carabineiro, S.A.C.; Sutradhar, M. Plant-Mediated Synthesis of Electrocatalytically Active Cd–Cs Mixed Oxide Nanocomposites and Their Multifunctional Antioxidant and Anticorrosive Performance. Surfaces 2025, 8, 91. [Google Scholar] [CrossRef] [Scilit]
  9. Szczyglewska, P.; Feliczak-Guzik, A.; Nowak, I. Nanotechnology–General Aspects: A Chemical Reduction Approach to the Synthesis of Nanoparticles. Molecules 2023, 28, 4932. [Google Scholar] [CrossRef] [Scilit]
  10. Vijayaram, S.; Razafindralambo, H.; Sun, Y.Z.; Vasantharaj, S.; Ghafarifarsani, H.; Hoseinifar, S.H.; Raeeszadeh, M. Applications of Green Synthesized Metal Nanoparticles—A Review. Biol. Trace Elem. Res. 2024, 202, 360–386. [Google Scholar] [CrossRef] [Scilit]
  11. Farhana, K.; Islam, R. Natural Reducing Agent from Fruit Peels to Produce a New Look of Apparel—A Systematic Review for Sustainability. Mater. Circ. Econ. 2026, 8, 4. [Google Scholar] [CrossRef] [Scilit]
  12. Singh, H.; Desimone, M.F.; Pandya, S.; Jasani, S.; George, N.; Adnan, M.; Aldarhami, A.; Bazaid, A.S.; Alderhami, S.A. Revisiting the Green Synthesis of Nanoparticles: Uncovering Influences of Plant Extracts as Reducing Agents for Enhanced Synthesis Efficiency and Its Biomedical Applications. Int. J. Nanomed. 2023, 18, 4727–4750. [Google Scholar] [CrossRef] [Scilit]
  13. Messire, G.; Caillet, E.; Berteina-Raboin, S. Green Catalysts and/or Green Solvents for Sustainable Multi-Component Reactions. Catalysts 2024, 14, 593. [Google Scholar] [CrossRef] [Scilit]
  14. Mancuso, A.; Iervolino, G. Synthesis and Application of Innovative and Environmentally Friendly Photocatalysts: A Review. Catalysts 2022, 12, 1074. [Google Scholar] [CrossRef] [Scilit]
  15. Lakhani, P.; Bhanderi, D.; Modi, C.K. Support Materials Impact on Green Synthesis and Sustainable Processing via Heterogeneous Catalysis. Discov. Catal. 2024, 1, 2. [Google Scholar] [CrossRef] [Scilit]
  16. Vignesh, S.; Rajkumar, C.; Singh Gautam, R.K.; Suganthi, S.; Ahmad, K.; Oh, T.H. Recent Progress in Advanced Electrode Materials for the Detection of 4-Nitrophenol and Its Derivatives for Environmental Monitoring. Sensors 2026, 26, 306. [Google Scholar] [CrossRef] [Scilit]
  17. Lu, J.; Wang, H.; Cai, X.; Zhu, Y. Advances in Selective Hydrogenation of Nitrobenzene toward P-Aminophenol. Sustain. Chem. Clim. Action 2025, 6, 100072. [Google Scholar] [CrossRef] [Scilit]
  18. Pradhan, N.; Pal, A.; Pal, T. Silver Nanoparticle Catalyzed Reduction of Aromatic Nitro Compounds. Colloids Surf. A Physicochem. Eng. Asp. 2002, 196, 247–257. [Google Scholar] [CrossRef] [Scilit]
  19. Mejía, Y.R.; Reddy Bogireddy, N.K. Reduction of 4-Nitrophenol Using Green-Fabricated Metal Nanoparticles. RSC Adv. 2022, 12, 18661–18675. [Google Scholar] [CrossRef] [Scilit]
  20. Kästner, C.; Thünemann, A.F. Catalytic Reduction of 4-Nitrophenol Using Silver Nanoparticles with Adjustable Activity. Langmuir 2016, 32, 7383–7391. [Google Scholar] [CrossRef] [Scilit]
  21. Siri-apai, P.; Yaemphutchong, S.; Suetrong, N.; Suesuwan, A.; Choophun, N.; Wannapaiboon, S.; Rodchanarowan, A.; Chansaenpak, K.; Aroonrote, N.; Hanlumyuang, Y.; et al. Reduction of 4-Nitrophenol to 4-Aminophenol by Reusable CuFe5O8-Based Catalysts Synthesized by Co-Precipitation Method. Molecules 2025, 30, 777. [Google Scholar] [CrossRef] [Scilit]
  22. Dragos-Pinzaru, O.G.; Buema, G.; Gherca, D.; Tabakovic, I.; Lupu, N. Effect of the Preparation Conditions on the Catalytic Properties of CoPt for Highly Efficient 4-Nitrophenol Reduction. Materials 2022, 15, 6250. [Google Scholar] [CrossRef] [Scilit]
  23. Xu, C.; Qiu, Y.; Yang, X.; Gao, Z.; Wang, Z.; Liu, C.; Sun, Y.; Ma, J.; Liu, L. High-Performance Catalytic Reduction of 4-Nitrophenol to 4-Aminophenol over Pt Nanoparticles Supported on Co-Al LDH Nanosheets. Crystals 2024, 14, 284. [Google Scholar] [CrossRef] [Scilit]
  24. Cardoso Juarez, A.O.; Ivan Ocampo Lopez, E.; Kesarla, M.K.; Bogireddy, N.K.R. Advances in 4-Nitrophenol Detection and Reduction Methods and Mechanisms: An Updated Review. ACS Omega 2024, 9, 33335–33350. [Google Scholar] [CrossRef] [Scilit]
  25. Liao, G.; Gong, Y.; Zhong, L.; Fang, J.; Zhang, L.; Xu, Z.; Gao, H.; Fang, B. Unlocking the Door to Highly Efficient Ag-Based Nanoparticles Catalysts for NaBH4-Assisted Nitrophenol Reduction. Nano Res. 2019, 12, 2407–2436. [Google Scholar] [CrossRef] [Scilit]
  26. Rogers, S.M.; Catlow, C.R.A.; Gianolio, D.; Wells, P.P.; Dimitratos, N. Supported Metal Nanoparticles with Tailored Catalytic Properties through Sol-Immobilisation: Applications for the Hydrogenation of Nitrophenols. Faraday Discuss. 2018, 208, 443–454. [Google Scholar] [CrossRef] [Scilit] [PubMed]
  27. Ansar, S.M.; Kitchens, C.L. Impact of Gold Nanoparticle Stabilizing Ligands on the Colloidal Catalytic Reduction of 4-Nitrophenol. ACS Catal. 2016, 6, 5553–5560. [Google Scholar] [CrossRef] [Scilit]
  28. Merga, G.; Wilson, R.; Lynn, G.; Milosavljevic, B.H.; Meisel, D. Redox Catalysis on “Naked” Silver Nanoparticles. J. Phys. Chem. C 2007, 111, 12220–12226. [Google Scholar] [CrossRef] [Scilit]
  29. Facibeni, A. Silver Nanoparticles: Synthesis, Properties, and Applications; Jenny Stanford Publishing Pte. Ltd.: Singapore, 2023; pp. 1–264. [Google Scholar] [CrossRef] [Scilit]
  30. Narayanan, K.B.; Park, H.H.; Sakthivel, N. Extracellular Synthesis of Mycogenic Silver Nanoparticles by Cylindrocladium Floridanum and Its Homogeneous Catalytic Degradation of 4-Nitrophenol. Spectrochim. Acta A Mol. Biomol. Spectrosc. 2013, 116, 485–490. [Google Scholar] [CrossRef] [Scilit] [PubMed]
  31. Piras, S.; Zannotti, M.; Appignanesi, D.; Ferraro, S.; Minicucci, M.; Giovannetti, R. Silver Nanoparticles-Anchored Reduced Graphene Oxide Obtained by Orange Peel Extract-Mediated Synthesis for Visible Light Photodegradation of Organic Dye. J. Mol. Liq. 2025, 434, 128059. [Google Scholar] [CrossRef] [Scilit]
  32. Khane, Y.; Benouis, K.; Albukhaty, S.; Sulaiman, G.M.; Abomughaid, M.M.; Al Ali, A.; Aouf, D.; Fenniche, F.; Khane, S.; Chaibi, W.; et al. Green Synthesis of Silver Nanoparticles Using Aqueous Citrus Limon Zest Extract: Characterization and Evaluation of Their Antioxidant and Antimicrobial Properties. Nanomaterials 2022, 12, 2013. [Google Scholar] [CrossRef] [Scilit] [PubMed]
  33. Kahrilas, G.A.; Wally, L.M.; Fredrick, S.J.; Hiskey, M.; Prieto, A.L.; Owens, J.E. Microwave-Assisted Green Synthesis of Silver Nanoparticles Using Orange Peel Extract. ACS Sustain. Chem. Eng. 2014, 2, 367–376. [Google Scholar] [CrossRef] [Scilit]
  34. Mickky, B.; Elsaka, H.; Abbas, M.; Gebreil, A.; Shams Eldeen, R. Orange Peel-Mediated Synthesis of Silver Nanoparticles with Antioxidant and Antitumor Activities. BMC Biotechnol. 2024, 24, 66. [Google Scholar] [CrossRef] [Scilit]
  35. Raj, S.; Trivedi, R.; Soni, V. Biogenic Synthesis of Silver Nanoparticles, Characterization and Their Applications—A Review. Surfaces 2022, 5, 67–90. [Google Scholar] [CrossRef] [Scilit]
  36. Simatupang, C.; Jindal, V.K.; Jindal, R. Biosynthesis of Silver Nanoparticles Using Orange Peel Extract for Application in Catalytic Degradation of Methylene Blue Dye. Environ. Nat. Resour. J. 2021, 19, 468–480. [Google Scholar] [CrossRef] [Scilit]
  37. Castro, L.; Blázquez, M.L.; González, F.; Muñoz, J.Á.; Ballester, A. Biosynthesis of Silver and Platinum Nanoparticles Using Orange Peel Extract: Characterisation and Applications. IET Nanobiotechnol. 2015, 9, 252–258. [Google Scholar] [CrossRef] [Scilit] [PubMed]
  38. Nguyen, T.T.T.; Ho, T.G.T.; Do, B.L.; Nguyen, P.A.; Van Nguyen, T.T.; Phan, H.P.; Nguyen, T. Biosynthesized Silver Nanoparticles from Orange Peel Immobilized on Chitosan Aerogel: A Sustainable and Recyclable Catalyst for p-Nitroaniline Reduction. Int. J. Biol. Macromol. 2025, 322, 146641. [Google Scholar] [CrossRef] [Scilit]
  39. Saha, P.; Mahiuddin, M.; Islam, A.B.M.N.; Ochiai, B. Biogenic Synthesis and Catalytic Efficacy of Silver Nanoparticles Based on Peel Extracts of Citrus Macroptera Fruit. ACS Omega 2021, 6, 18260–18268. [Google Scholar] [CrossRef] [Scilit]
  40. Niluxsshun, M.C.D.; Masilamani, K.; Mathiventhan, U. Green Synthesis of Silver Nanoparticles from the Extracts of Fruit Peel of Citrus Tangerina, Citrus Sinensis, and Citrus Limon for Antibacterial Activities. Bioinorg. Chem. Appl. 2021, 2021, 6695734. [Google Scholar] [CrossRef] [Scilit]
  41. Ai, L.; Yue, H.; Jiang, J. Environmentally Friendly Light-Driven Synthesis of Ag Nanoparticles in Situ Grown on Magnetically Separable Biohydrogels as Highly Active and Recyclable Catalysts for 4-Nitrophenol Reduction. J. Mater. Chem. 2012, 22, 23447–23453. [Google Scholar] [CrossRef] [Scilit]
  42. Gangula, A.; Podila, R.; M, R.; Karanam, L.; Janardhana, C.; Rao, A.M. Catalytic Reduction of 4-Nitrophenol Using Biogenic Gold and Silver Nanoparticles Derived from Breynia Rhamnoides. Langmuir 2011, 27, 15268–15274. [Google Scholar] [CrossRef] [Scilit]
  43. Muniyappan, N.; Nagarajan, N.S. Green Synthesis of Silver Nanoparticles with Dalbergia Spinosa Leaves and Their Applications in Biological and Catalytic Activities. Process Biochem. 2014, 49, 1054–1061. [Google Scholar] [CrossRef] [Scilit]
  44. Campisi, S.; Schiavoni, M.; Chan-Thaw, C.; Villa, A. Untangling the Role of the Capping Agent in Nanocatalysis: Recent Advances and Perspectives. Catalysts 2016, 6, 185. [Google Scholar] [CrossRef] [Scilit]
  45. Sengupta, I.; Pareek, S.; Bhargava, P. Surfactant Mediated Silver Synthesis: Influence of Surfactant Molecular Structure on the Size and Shape of Silver Particles. Inorg. Chem. Commun. 2024, 159, 111675. [Google Scholar] [CrossRef] [Scilit]
  46. Campisi, S.; Ferri, D.; Villa, A.; Wang, W.; Wang, D.; Kröcher, O.; Prati, L. Selectivity Control in Palladium-Catalyzed Alcohol Oxidation through Selective Blocking of Active Sites. J. Phys. Chem. C 2016, 120, 14027–14033. [Google Scholar] [CrossRef] [Scilit]
  47. Campisi, S.; Beevers, C.; Nasrallah, A.; Catlow, C.R.A.; Chan-Thaw, C.E.; Manzoli, M.; Dimitratos, N.; Willock, D.J.; Roldan, A.; Villa, A. DFT-Assisted Spectroscopic Studies on the Coordination of Small Ligands to Palladium: From Isolated Ions to Nanoparticles. J. Phys. Chem. C 2020, 124, 4781–4790. [Google Scholar] [CrossRef] [Scilit]
  48. Feng, J.; Fan, D.; Wang, Q.; Ma, L.; Wei, W.; Xie, J.; Zhu, J. Facile Synthesis Silver Nanoparticles on Different Xerogel Supports as Highly Efficient Catalysts for the Reduction of P-Nitrophenol. Colloids Surf. A Physicochem. Eng. Asp. 2017, 520, 743–756. [Google Scholar] [CrossRef] [Scilit]
  49. Bhaduri, B.; Polubesova, T. Facile Synthesis of Carbon-Supported Silver Nanoparticles as an Efficient Reduction Catalyst for Aqueous 2-Methyl-p-Nitrophenol. Mater. Lett. 2020, 267, 127546. [Google Scholar] [CrossRef] [Scilit]
  50. Laghrib, F.; Houcini, H.; Khalil, F.; Liba, A.; Bakasse, M.; Lahrich, S.; El Mhammedi, M.A. Synthesis of Silver Nanoparticles Using Chitosan as Stabilizer Agent: Application towards Electrocatalytical Reduction of P-Nitrophenol. ChemistrySelect 2020, 5, 1220–1227. [Google Scholar] [CrossRef] [Scilit]
  51. Wang, N.; Zeng, S.; Yuan, H.; Huang, J. Morphology-Dependent Interfacial Interactions of Fe2O3 with Ag Nanoparticles for Determining the Catalytic Reduction of p-Nitrophenol. J. Environ. Sci. 2020, 92, 1–10. [Google Scholar] [CrossRef] [Scilit]
  52. Liu, J.; Li, J.; Meng, R.; Jian, P.; Wang, L. Silver Nanoparticles-Decorated-Co3O4 Porous Sheets as Efficient Catalysts for the Liquid-Phase Hydrogenation Reduction of p-Nitrophenol. J. Colloid Interface Sci. 2019, 551, 261–269. [Google Scholar] [CrossRef] [Scilit] [PubMed]
  53. Taratayko, A.; Kolobova, E.; Mamontov, G. Graphene Oxide Decorated with Ag and CeO2 Nanoparticles as a Catalyst for Room-Temperature 4-Nitrophenol Reduction. Catalysts 2022, 12, 1393. [Google Scholar] [CrossRef] [Scilit]
  54. Taratayko, A.V.; Kuznetsov, T.A.; Kozhina, M.V.; Mamontov, G.V. Influence of a Silver Precursor Introducing Method on the Properties of Magnetically Recoverable Ag/FeOx Catalysts in 4-Nitrophenol Reduction. Russ. J. Inorg. Chem. 2025, 70, 1391–1404. [Google Scholar] [CrossRef] [Scilit]
  55. Shetty, A.; Molahalli, V.; Sharma, A.; Hegde, G. Biomass-Derived Carbon Materials in Heterogeneous Catalysis: A Step towards Sustainable Future. Catalysts 2023, 13, 20. [Google Scholar] [CrossRef] [Scilit]
  56. Mergbi, M.; Galloni, M.G.; Aboagye, D.; Elimian, E.; Su, P.; Ikram, B.M.; Nabgan, W.; Bedia, J.; Amor, H.B.; Contreras, S.; et al. Valorization of Lignocellulosic Biomass into Sustainable Materials for Adsorption and Photocatalytic Applications in Water and Air Remediation. Environ. Sci. Pollut. Res. 2023, 30, 74544–74574. [Google Scholar] [CrossRef] [Scilit]
  57. Jacob, J.A.E.; Antony, R.; Ivan Jebakumar, D.S. Synergistic Effect of Silver Nanoparticle-Embedded Calcite-Rich Biochar Derived from Tamarindus Indica Bark on 4-Nitrophenol Reduction. Chemosphere 2024, 349, 140765. [Google Scholar] [CrossRef] [Scilit]
  58. Dai, Y.; Zhang, N.; Xing, C.; Cui, Q.; Sun, Q. The Adsorption, Regeneration and Engineering Applications of Biochar for Removal Organic Pollutants: A Review. Chemosphere 2019, 223, 12–27. [Google Scholar] [CrossRef] [Scilit]
  59. Mukherjee, A.; Zimmerman, A.R.; Harris, W. Surface Chemistry Variations among a Series of Laboratory-Produced Biochars. Geoderma 2011, 163, 247–255. [Google Scholar] [CrossRef] [Scilit]
  60. Zheng, C.; Yang, Z.; Si, M.; Zhu, F.; Yang, W.; Zhao, F.; Shi, Y. Application of Biochars in the Remediation of Chromium Contamination: Fabrication, Mechanisms, and Interfering Species. J. Hazard. Mater. 2021, 407, 124376. [Google Scholar] [CrossRef] [Scilit]
  61. Ghiara, G.; Campisi, S.; Goglio, A.; Formicola, F.; Balordi, M.; Gervasini, A.; Trasatti, S.P.M.; Adani, F.; Franzetti, A.; Cristiani, P. Biochar Based Cathode Enriched with Hydroxyapatite and Cu Nanoparticles Boosting Electromethanogenesis. Sustain. Energy Technol. Assess. 2023, 57, 103274. [Google Scholar] [CrossRef] [Scilit]
  62. Bigica, M.; Ghiara, G.; Cristiani, P.; Campisi, S.; Gervasini, A. Interface Properties of Hydroxyapatite in Ternary Composites Cathodes for Electromethanogenesis. New J. Chem. 2024, 48, 9909–9919. [Google Scholar] [CrossRef] [Scilit]
  63. Brufani, G.; Paone, E.; Ciriminna, R.; Pagliaro, M.; Al-Naji, M.; Vaccaro, L.; Mauriello, F. 2 Step Hydrolytic Conversion of Orange Processing Waste into C5-C6 Sugars: The “Hemicellulose Ahead” Protocol. Rend. Lincei 2025, 37, 35–46. [Google Scholar] [CrossRef] [Scilit]
  64. Fazzino, F.; Mauriello, F.; Paone, E.; Sidari, R.; Calabrò, P.S. Integral Valorization of Orange Peel Waste through Optimized Ensiling: Lactic Acid and Bioethanol Production. Chemosphere 2021, 271, 129602. [Google Scholar] [CrossRef] [Scilit] [PubMed]
  65. Gervasi, T.; Mandalari, G. Valorization of Agro-Industrial Orange Peel By-Products through Fermentation Strategies. Fermentation 2024, 10, 224. [Google Scholar] [CrossRef] [Scilit]
  66. Revathi, V.; Bora, S.; Afzia, N.; Ghosh, T. Orange Peel Composition, Biopolymer Extraction, and Applications in Paper and Packaging Sector: A Review. Sustain. Chem. Pharm. 2025, 43, 101908. [Google Scholar] [CrossRef] [Scilit]
  67. Jayaprakash, N.; Suresh, R.; Rajalakshmi, S.; Raja, S.P.; Sundaravadivel, E.; Gayathri, M.; Sridharan, M.B. One-Step Synthesis, Characterisation, Photocatalytic and Bio-Medical Applications of ZnO Nanoplates. Mater. Technol. 2020, 35, 112–124. [Google Scholar] [CrossRef] [Scilit]
  68. Puccini, M.; Licursi, D.; Stefanelli, E.; Vitolo, S.; Galletti, A.M.R.; Heeres, H.J. Levulinic Acid from Orange Peel Waste by Hydrothermal Carbonization (HTC). Chem. Eng. Trans. 2016, 50, 223–228. [Google Scholar] [CrossRef] [Scilit]
  69. Thommes, M.; Kaneko, K.; Neimark, A.V.; Olivier, J.P.; Rodriguez-Reinoso, F.; Rouquerol, J.; Sing, K.S.W. Physisorption of Gases, with Special Reference to the Evaluation of Surface Area and Pore Size Distribution (IUPAC Technical Report). Pure Appl. Chem. 2015, 87, 1051–1069. [Google Scholar] [CrossRef] [Scilit]
  70. Korili, S.A.; Gil, A. On the Application of Various Methods to Evaluate the Microporous Properties of Activated Carbons. Adsorption 2001, 7, 249–264. [Google Scholar] [CrossRef] [Scilit]
  71. Kwiatkowski, M.; Hu, X. Porous Structure Analysis of Coconut Shell–Derived Activated Carbons Prepared under Different Conditions. Sci. Rep. 2026, 16, 10220. [Google Scholar] [CrossRef] [Scilit]
  72. Mak, S.M.; Tey, B.T.; Cheah, K.Y.; Siew, W.L.; Tan, K.K. Porosity Characteristics and Pore Developments of Various Particle Sizes Palm Kernel Shells Activated Carbon (PKSAC) and Its Potential Applications. Adsorption 2009, 15, 507–519. [Google Scholar] [CrossRef] [Scilit]
  73. Koubaissy, B.; Joly, G.; Magnoux, P. Adsorption and Competitive Adsorption on Zeolites of Nitrophenol Compounds Present in Wastewater. Ind. Eng. Chem. Res. 2008, 47, 9558–9565. [Google Scholar] [CrossRef] [Scilit]
  74. Carrott, P.J.M.; Mourão, P.A.M.; Ribeiro Carrott, M.M.L.; Gonçalves, E.M. Separating Surface and Solvent Effects and the Notion of Critical Adsorption Energy in the Adsorption of Phenolic Compounds by Activated Carbons. Langmuir 2005, 21, 11863–11869. [Google Scholar] [CrossRef] [Scilit]
  75. Derylo-Marczewska, A.; Swiatkowski, A.; Biniak, S.; Walczyk, M. Effect of Properties of Chemically Modified Activated Carbon and Aromatic Adsorbate Molecule on Adsorption from Liquid Phase. Colloids Surf. A Physicochem. Eng. Asp. 2008, 327, 1–8. [Google Scholar] [CrossRef] [Scilit]
  76. Xiao, G.; Wen, R.; Wei, D.; Wu, D. Effects of the Steric Hindrance of Micropores in the Hyper-Cross-Linked Polymeric Adsorbent on the Adsorption of p-Nitroaniline in Aqueous Solution. J. Hazard. Mater. 2014, 280, 97–103. [Google Scholar] [CrossRef] [Scilit]
  77. Terzyk, A.P.; Wiśniewski, M.; Gauden, P.A.; Rychlicki, G.; Furmaniak, S. Carbon Surface Chemical Composition in Para-Nitrophenol Adsorption Determined under Real Oxic and Anoxic Conditions. J. Colloid Interface Sci. 2008, 320, 40–51. [Google Scholar] [CrossRef] [Scilit]
  78. Terzyk, A.P. Further Insights into the Role of Carbon Surface Functionalities in the Mechanism of Phenol Adsorption. J. Colloid Interface Sci. 2003, 268, 301–329. [Google Scholar] [CrossRef] [Scilit]
  79. Kumar, A.; Kumar, S.; Kumar, S.; Gupta, D.V. Adsorption of Phenol and 4-Nitrophenol on Granular Activated Carbon in Basal Salt Medium: Equilibrium and Kinetics. J. Hazard. Mater. 2007, 147, 155–166. [Google Scholar] [CrossRef] [Scilit] [PubMed]
  80. Ider, M.; Abderrafi, K.; Eddahbi, A.; Ouaskit, S.; Kassiba, A. Silver Metallic Nanoparticles with Surface Plasmon Resonance: Synthesis and Characterizations. J. Clust. Sci. 2017, 28, 1051–1069. [Google Scholar] [CrossRef] [Scilit]
  81. Smitha, S.L.; Nissamudeen, K.M.; Philip, D.; Gopchandran, K.G. Studies on Surface Plasmon Resonance and Photoluminescence of Silver Nanoparticles. Spectrochim. Acta A Mol. Biomol. Spectrosc. 2008, 71, 186–190. [Google Scholar] [CrossRef] [Scilit]
  82. Alzoubi, F.Y.; Ahmad, A.A.; Aljarrah, I.A.; Migdadi, A.B.; Al-Bataineh, Q.M. Localize Surface Plasmon Resonance of Silver Nanoparticles Using Mie Theory. J. Mater. Sci. Mater. Electron. 2023, 34, 2128. [Google Scholar] [CrossRef] [Scilit]
  83. Aggour, Y.A.; Kenawy, E.R.; Magdy, M.; Elbayoumy, E. Establishing a Productive Heterogeneous Catalyst Based on Silver Nanoparticles Supported on a Crosslinked Vinyl Polymer for the Reduction of Nitrophenol. RSC Adv. 2024, 14, 30127–30139. [Google Scholar] [CrossRef] [Scilit] [PubMed]
  84. Palem, R.R.; Ganesh, S.D.; Saha, N.; Kronek, J.; Sáha, P. ‘Green’ Synthesis of Silver Polymer Nanocomposites of Poly (2-Isopropenyl-2- Oxazoline-Co- N-Vinylpyrrolidone) and Its Catalytic Activity. J. Polym. Res. 2018, 25, 152. [Google Scholar] [CrossRef] [Scilit]
  85. Song, Y.; Jiang, H.; Wang, B.; Kong, Y.; Chen, J. Silver-Incorporated Mussel-Inspired Polydopamine Coatings on Mesoporous Silica as an Efficient Nanocatalyst and Antimicrobial Agent. ACS Appl. Mater. Interfaces 2018, 10, 1792–1801. [Google Scholar] [CrossRef] [Scilit] [PubMed]
  86. Das, T.K.; Ganguly, S.; Remanan, S.; Ghosh, S.; Das, N.C. Mussel-Inspired Ag/Poly(Norepinephrine)/MnO2 Heterogeneous Nanocatalyst for Efficient Reduction of 4-Nitrophenol and 4-Nitroaniline: An Alternative Approach. Res. Chem. Intermed. 2020, 46, 3629–3650. [Google Scholar] [CrossRef] [Scilit]
  87. Das, R.; Sypu, V.S.; Paumo, H.K.; Bhaumik, M.; Maharaj, V.; Maity, A. Silver Decorated Magnetic Nanocomposite (Fe3O4@PPy-MAA/Ag) as Highly Active Catalyst towards Reduction of 4-Nitrophenol and Toxic Organic Dyes. Appl. Catal. B 2019, 244, 546–558. [Google Scholar] [CrossRef] [Scilit]
  88. Karki, H.P.; Ojha, D.P.; Joshi, M.K.; Kim, H.J. Effective Reduction of P-Nitrophenol by Silver Nanoparticle Loaded on Magnetic Fe3O4/ATO Nano-Composite. Appl. Surf. Sci. 2018, 435, 599–608. [Google Scholar] [CrossRef] [Scilit]
  89. Cheng, H.; Yang, Z.; Du, F.; Liu, H.; Zhang, Q.; Zhang, Y. Recyclable Ag/Halloysite Nanotubes/Polyvinyl Alcohol Sponges for Enhanced Reduction of 4-Nitrophenol. Appl. Clay Sci. 2022, 223, 106510. [Google Scholar] [CrossRef] [Scilit]
  90. El-Tantawy, A.I.; Elsaeed, S.M.; Neiber, R.R.; Eisa, W.H.; Aleem, A.A.H.A.; El-Hamalawy, A.A.; Maize, M.S. Silver Nanoparticles-Based Thioureidophosphonate Composites: Synthesis Approach and Their Exploitation in 4-Nitrophenol Reduction. Surf. Interfaces 2023, 40, 103006. [Google Scholar] [CrossRef] [Scilit]
  91. Rajendiran, R.; Seelam, P.K.; Patchaiyappan, A.; Balla, P.; Shankar, H.; Ravi, B.; Perupogu, V.; Lassi, U. Morphologically Tailored Facet Dependent Silver Nanoparticles Supported α-Al2O3 Catalysts for Chemoselective Reduction of Aromatic Nitro Compounds. Chem. Eng. J. 2023, 451, 138507. [Google Scholar] [CrossRef] [Scilit]
  92. Riaz, M.; Sharafat, U.; Zahid, N.; Ismail, M.; Park, J.; Ahmad, B.; Rashid, N.; Fahim, M.; Imran, M.; Tabassum, A. Synthesis of Biogenic Silver Nanocatalyst and Their Antibacterial and Organic Pollutants Reduction Ability. ACS Omega 2022, 7, 14723–14734. [Google Scholar] [CrossRef] [Scilit]
  93. Jenkins, R.; Gilfrich, J.V. Figures-of-Merit, Their Philosophy, Design and Use. X-Ray Spectrom. 1992, 21, 263–269. [Google Scholar] [CrossRef] [Scilit]
Figure 1. Reaction scheme for the reduction of p-nitrophenol to p-aminophenol.
Surfaces 09 00053 g001
Figure 2. N2 adsorption–desorption isotherms at −196 °C of the pristine carbon supports (AC red triangles and CC green circles). Filled symbols denote adsorption data, while open symbols denote desorption data.
Surfaces 09 00053 g002
Figure 3. Adsorption isotherms of p-nitrophenolate on carbon supports (T = 20.0 ± 0.1 °C). Experimental data were fitted using the Langmuir isotherm model (solid lines) and the Freundlich equation (dotted lines).
Surfaces 09 00053 g003
Figure 4. Adsorption kinetics of p-nitrophenolate on AC and CC. (a) Time evolution of the adsorption capacity (qt), with experimental data fitted using pseudo-first-order (PFO, solid line) and pseudo-second-order (PSO, dashed line) models. (b) Intraparticle diffusion (IPD) plots.
Surfaces 09 00053 g004
Figure 5. UV–Vis spectra of Ag NPs synthesized using (a) NaBH4 aqueous solution and (b) orange peel extract as reducing agents.
Surfaces 09 00053 g005
Figure 6. TEM characterization of Ag NPs synthesized using NaBH4 (Ag NPsBH) and orange peel extract (Ag NPsOPE): (a) TEM micrograph of Ag NPsBH with inset showing a lower magnification image; (b) SAED pattern of Ag NPsBH indexed to the face-centered cubic (fcc) structure of metallic silver; (c) EDS spectrum of Ag NPsBH; (d) particle size distribution histogram of Ag NPsBH obtained from TEM image analysis; (e) HRTEM micrograph of Ag NPsOPE with inset showing a lower magnification image; (f) schematic representation of Ag NPsOPE highlighting the presence of an organic capping layer derived from orange peel extract; (g) EDS spectrum of Ag NPsOPE; (h) particle size distribution histogram of Ag NPsOPE obtained from TEM image analysis.
Surfaces 09 00053 g006
Figure 7. Successive UV–Vis absorption spectra of the reduction of 4-NP by NaBH4 in the presence of Ag NPsBH; the color gradient from blue to yellow represents the progression of the reaction with increasing time, where blue corresponds to the initial spectrum and yellow to the final spectrum. (a). Pictures of the reduction of 4-NP by NaBH4 before and after being catalyzed by Ag NPsBH (b). Profile of Ct against the reaction time (c). Profile of ln(At/A0) against the reaction time (d).
Surfaces 09 00053 g007
Figure 8. TEM characterization of Ag nanoparticles supported on coconut biomass-derived carbon (CC). Low-magnification micrographs of Ag/CCBH (a) and Ag/CCOPE (d) showing carbon flakes decorated with Ag nanoparticles. Higher-magnification images of Ag/CCBH (b) and Ag/CCOPE (e) highlighting the dispersion and partial aggregation of the nanoparticles on the CC surface. HRTEM images of a representative Ag/CCBH (c) and Ag/CCOPE (f) nanoparticle, showing the surface structural features and the degree of local crystallinity of the Ag phase.
Surfaces 09 00053 g008
Figure 9. Concentration profiles of p-nitrophenol as a function of reaction time (a) and corresponding pseudo-first-order linearization plots of ln(At/A0) versus reaction time (b) for the catalytic reduction of p-nitrophenol in the presence of excess NaBH4. Ct denotes the p-nitrophenol concentration at time t, and At and A0 are the UV–Vis absorbance values recorded at 400 nm at time t and at the onset of the reaction, respectively. Results are shown for Ag nanoparticle catalysts supported on activated carbon AC and coconut-shell-derived carbon CC, synthesized via chemical reduction with sodium borohydride (Ag/ACBH and Ag/CCBH) or green reduction using orange peel extract (Ag/ACOPE and Ag/CCOPE).
Surfaces 09 00053 g009
Figure 10. The reusability of Ag/ACBH (a), Ag/CCBH (b), Ag/ACOPE (c), and Ag/CCOPE (d) for the reduction of 4-NP with NaBH4.
Surfaces 09 00053 g010
Figure 11. Relationship between catalytic performance (k) and cost per test for the investigated systems.
Surfaces 09 00053 g011
Table 1. Textural properties of the pristine carbon supports.
SampleSurface Area a
(m2·g−1)
External
Surface Area b
(m2·g−1)
Total Pore Volume c
(cm3·g−1)
Micropore Volume b
(cm3·g−1)
Pore Width d
(Å)
AC8053710.4830.2296.71
CC7631150.4050.3335.79
a by BET equation (3-parameters); b obtained by t-plot; c determined at p/p0 = 0.995; d computed by the Horvath–Kawazoe (HK) method assuming slit-shaped pores.
Table 2. Langmuir and Freundlich isotherm parameters of the adsorption of 4-NP onto the carbon supports.
SampleLangmuir ModelFreundlich Model
qmax (mg·g−1)KL (L·mmol−1)R2nKF (L1/n·mmol−1/n·mg·g−1)R2
AC90 ± 41.4 ± 0.50.9863.2 ± 0.345 ± 30.987
CC46 ± 13.8 ± 1.00.990n.d.n.d.n.d.
Table 3. Kinetic parameters derived from pseudo-first-order (PFO) and pseudo-second-order (PSO) models for p-nitrophenolate adsorption on the carbon supports.
SamplePFOPSO
qe (mg·g−1)k1 (min−1)R2qe (mg·g−1)k2 (g·mg−1·min−1)R2
AC11.9 ± 0.10.84 ± 0.070.96712.72 ± 0.050.115 ± 0.0050.998
CC11.0 ± 0.10.54 ± 0.040.97412.20 ± 0.070.066 ± 0.0030.998
Table 4. Comparison of Ag-based catalysts for the catalytic reduction of p-nitrophenol to p-aminophenol.
Catalyst4-NP
(mM)
NaBH4
(mM)
NaBH4/4-NP RatioAg Loading
(wt.%)
k
(min−1)
Ref.
Ag/poly(AN-co-AMPS)0.11010060.28[83]
PIPOx_PNVP_SNCs0.1505000.0270.49[84]
SBA-15/PDA/Ag2030001503.240.89[85]
MNP-Ag11818-0.46[86]
Ag@Ca-BC0.1251008000.0360.29[57]
Fe3O4@PPy-MAA/Ag1101028.30.05–0.14[87]
Fe3O4@Ag/ATO0.183830-1.05[88]
Ag/Hal/PVA0.140400-0.297[89]
Ag NPs/MTP0.1212100100.166[90]
Ag NPs/BTP0.1212100110.115[90]
AgNSPs/α-Al2O30.051.63220.039[91]
Biogenic Ag NPs0.117170-0.09[92]
Ag NPsBH0.1151504 × 10−3 a0.121 ± 0.005This work
Ag NPsOPE0.1151504 × 10−3 a0.16 ± 0.03This work
Ag/CCBH0.1151500.0360.14 ± 0.01This work
Ag/CCOPE0.1151500.0360.079 ± 0.001This work
Ag/ACBH0.1151500.0360.21 ± 0.07This work
Ag/ACOPE0.1151500.0360.13 ± 0.02This work
a Ag NPs concentration (mM).
Disclaimer/Publisher’s Note: The statements, opinions and data contained in all publications are solely those of the individual author(s) and contributor(s) and not of MDPI and/or the editor(s). MDPI and/or the editor(s) disclaim responsibility for any injury to people or property resulting from any ideas, methods, instructions or products referred to in the content.