Article

“Click” Chemistry on Gold Electrodes Modified with Reduced Graphene Oxide by Electrophoretic Deposition

1
Univ. Lille, CNRS, Centrale Lille, ISEN, Univ. Valenciennes, UMR 8520—IEMN, F-59000 Lille, France
2
CEST Competence Center for Electrochemical Surface Technology, 3430 Tulln, Austria
3
Univ. Rennes, CNRS, ISCR—UMR 6226, Campus de Beaulieu, F-35000 Rennes, France
4
AIT Austrian Institute of Technology, 3430 Tulln, Austria
*
Author to whom correspondence should be addressed.
Surfaces 2019, 2(1), 193-204; https://doi.org/10.3390/surfaces2010015
Submission received: 22 January 2019 / Revised: 6 March 2019 / Accepted: 8 March 2019 / Published: 18 March 2019
(This article belongs to the Special Issue Electrochemical Surface Science: Basics and Applications)

Abstract

:
The coating of electrical interfaces with reduced graphene oxide (rGO) films and their subsequent chemical modification are essential steps in the fabrication of graphene-based sensing platforms. In this work, electrophoretic deposition (EPD) of graphene oxide at 2.5 V for 300 s followed by vapor treatment were employed to coat gold electrodes uniformly with rGO. These interfaces showed excellent electron transfer characteristics for redox mediators such as ferrocene methanol and potassium ferrocyanide. Functional groups were integrated onto the Au/rGO electrodes by the electro-reduction of an aryldiazonium salt, 4-((triisopropylsilyl)ethylenyl)benzenediazonium tetrafluoroborate (TIPS-Eth-ArN) in our case. Chemical deprotection of the triisopropylsilyl function resulted in propargyl-terminated Au/rGO electrodes to which azidomethylferrocene was chemically linked using the Cu(I) catalyzed “click” chemistry.

Graphical Abstract

1. Introduction

Accurate analysis of the presence of disease-specific biomarkers in biological fluids remains of great importance in clinical settings [1] and electrochemical sensors can reach that goal by converting a chemical or a biological response into a processable and quantifiable electrochemical signal [2]. Graphene and its related derivatives have generated great expectations as a transducing platform in biosensing, due to their good mechanical properties accompanied by biocompatibility, electrical conductivity and fast charge transfer kinetics [3,4,5,6]. A mandatory step in the production of biosensors is the modification of graphene-based materials with recognition elements. Covalent and non-covalent strategies have been employed, including amide bond formation and π–π interactions, among others [7,8,9], to integrate surface functionalities and ligands onto graphene-based transducers. The development of these approaches depends on having robust graphene-coated interfaces at hand. Next to drop-casting and spin-coating of reduced graphene oxide (rGO) suspensions onto electrical interfaces, electrophoretic deposition (EPD) has been shown to be an effective technique for manipulating graphene oxide (GO) suspensions with the aim of producing graphene-related films [9,10,11,12,13]. The ability of EPD to be applied to different materials and to control the thickness of the deposits has been well known for a decade [14,15]. EPD has gained increased interest as an alternative processing technique for the deposition of various nanomaterials ranging from metal oxide particles [16] to carbon nanotubes [17]. EPD is also relevant to the development of graphene-based coatings in a cost-effective manner [13,18]. Its capacity to be used in more complex, integrated electrode systems is an advantage over drop-casting and other less defined deposition techniques [10,11,19,20,21,22,23,24]. The group of Boccaccini added intensively to this field by deepening our understanding of EPD through the investigation of GO-EPD kinetics as a function of deposition time and potential [12].
To design a powerful electrochemical sensor, working with highly reduced graphene oxide nanosheets formed by EPD is required. Cathodic EPD would be the preferential approach, as it allows the simultaneous deposition and reduction of GO to rGO [9]. The presence of carboxyl and hydroxyl functions on GO results in an overall negatively charged material of about −41.3 ± 0.8 mV for aqueous GO suspensions. Migration to the anode rather to the cathode occurs upon applying a DC voltage [13]. The anodic EPD of GO results in GO with a low degree of reduction during the deposition process. Thermal or chemical reductions [25] are necessary to restore the aromatic network in order to obtain a material with good electron transfer properties. This is one of the reasons why GO is often charged with a cationic polymer (e.g., polyethyleneimine) [8] or metallic cations (Ni2+, Cu2+, etc.) [21,22,23] to achieve a positively charged GO nanomaterial, which can be deposited by cathodic EPD. The presence of polyethyleneimine (PEI) has been shown to be advantageous for the integration of surface ligands and the formation of an immunosensor for the selective and sensitive electrochemical detection of uropathogenic Escherichia coli [8], the detection of dopamine in meat [20] and Ni2+ for the construction of non-enzymatic glucose sensors operating in a basic medium. However, the formation of well-reduced rGO by EPD free of metal ions and other surface ligands remains a challenge.
In this study, we evaluate the effect of applied electrical current and applied voltage on the electrochemical behavior of electrophoretically deposited rGO on gold thin film electrodes. It is shown that the use of a voltage bias of 2.5 V for 5 min results in rGO thin films of good electrochemical behavior. These films can also be submitted to further surface modification using diazonium electrochemistry without altering their adhesion characteristics.

2. Materials and Methods

2.1. Materials

Potassium hexacyanoferrate(II) ([K4Fe(CN)6]), hydrazine hydrate, phosphate buffer tablets (PBS, 0.1 M), tetrabutylammonium fluoride (TBAF), ferrocenemethanol, copper(II) sulfate (CuSO4), L-ascorbic acid, EDTA and N-butylhexafluorophosphate (NBu4PF6) were purchased from Sigma-Aldrich and used as received. Graphene oxide (GO) powder was purchased from Graphenea, Spain. 4-((triisopropylsilyl)ethylenyl)benzenediazonium tetrafluoroborate (TIPS-Eth-ArN2+) was synthesized as reported previously [26].
Azidomethylferrocene was synthesized according to Reference [27].
Au thin film electrodes were prepared by thermal evaporation of 5 nm of titanium and 40 nm of gold onto cleaned glass slides.

2.2. Electrophoretic Deposition

Before electrophoretic deposition, the gold electrode was cleaned by UV/ozone for 5 min, rinsed with acetone and water and dried under a nitrogen flow. The deposition took place in a two-electrode system with a platinum foil (1 cm2) as the cathode and the cleaned gold surface as the anode (0.5 cm2). The electrodes were placed in parallel to each other at a fixed distance of 1.5 cm. An aqueous GO solution of 1 mg mL−1 was used for the EPD. Voltage biases of 1.25 V, 2.5 V, 5 V or 10 V were applied using a potentiostat/galvanostat (Metrohm Autolab, Utrecht, The Netherlands) for 5 min. The modified gold electrodes were slowly withdrawn manually from the solution and dried in a horizontal position under ambient conditions for 1 h. After the deposition was complete, the modified electrodes were placed into a Teflon autoclave (45 mL) and sealed with 1 mL of hydrazine hydrochloride. The autoclave was heated to 80 °C and kept under a constant temperature for 4 h. The interfaces were then removed and gently washed with water.

2.3. Surface Modification

2.3.1. Diazonium Chemistry

The electrografting of 4-((triisopropylsilyl)ethylenyl)benzenediazonium tetrafluoroborate (TIPS-Eth-ArN2+) (1 mM) in 0.1 M NBu4PF6 in acetonitrile was performed using cyclic voltammetry with a scan rate of 50 mV s−1 for five cycles between +0.60 V and −0.75 V vs. Ag/AgCl. The electrodes were rinsed with copious amounts of acetonitrile and acetone and dried under a stream of argon.

2.3.2. “Click” Chemistry

Before “click” chemistry, the TIPS protection group was removed by the immersion of the Au/rGO-TIPS surface into tetrabutylammonium fluoride (TBAF, 0.05 M in THF) for 20 min. The Au/rGO interface was then immersed into an aqueous solution of CuSO4 (10 mM) and L-ascorbic acid (20 mM) in the presence of azidomethylferrocene (0.83 mM in THF) and left for 1 h under an argon atmosphere. The interface was then treated with an aqueous solution of EDTA for 10 min to chelate any remaining Cu2+ residues and finally washed copiously with acetone and water and left to dry.

2.4. Surface Characterization Techniques

2.4.1. Scanning Electron Microscopy (SEM)

SEM images were obtained using an electron microscope ULTRA 55 (Zeiss, Paris, France) equipped with a thermal field emission emitter and three different detectors (EsB detector with filter grid, high efficiency in-lens SE detector and Everhart–Thornley Secondary Electron Detector).

2.4.2. X-Ray Photoelectron Spectroscopy (XPS)

X-ray photoelectron spectroscopy (XPS) was performed in a PHl 5000 VersaProbe-Scanning ESCA Microprobe (ULVAC-PHI, Osaka, Japan) instrument at a base pressure below 5 × 10⁻⁹ mbar. Core-level spectra were acquired at a pass energy of 23.5 eV with a 0.1 eV energy step. All spectra were acquired with 90° between the X-ray source the and analyzer. After the subtraction of the linear background, the core-level spectra were decomposed into their components with mixed Gaussian−Lorentzian (30:70) shape lines using CasaXPS software. Quantification calculations were conducted using sensitivity factors supplied by PHI.

2.4.3. Electrochemical Measurements

Electrochemical measurements were performed with a potentiostat/galvanostat (Metrohm Autolab, Utrecht, The Netherlands). A conventional three-electrode configuration was employed using a silver wire and a platinum mesh as the reference and auxiliary electrodes, respectively.

2.4.4. Micro-Raman Analysis

Micro-Raman spectroscopy measurements were performed on a LabRam HR Micro-Raman system (Horiba Jobin Yvon, Palaiseau, France) combined with a 473 nm laser diode as the excitation source. Visible light was focused by a 100× objective. The scattered light was collected by the same objective in backscattering configuration, dispersed by a 1800 mm focal length monochromator and detected by a CCD.

2.4.5. Atomic Force Microcopy (AFM)

Tapping mode AFM images in air and ambient temperature were recorded using a Bruker Dimension 3100 AFM (Bruker, Champs-sur-Marne, France). The surfaces were imaged with a silicon cantilever (AppNano TM300, typical spring constant: 50 N/m) working at a frequency of 369 kHz. Image treatment and root mean square (RMS) roughness Ra were obtained with WSXM software (Bruker, Champs-sur-Marne, France). Surface roughness of the samples was measured by scanning over a 5 × 5 µm area.

2.4.6. Profilometry

The thickness of the deposited films was determined by using an optical profilometer (Zygo NewView 6000 Optical Profilometer with MetroPro software). This equipment uses non-contact, three-dimensional scanning white light and optical phase-shifting interferometry, has vertical z-scan measurements ranging from 0.1 nm to 15,000 µm and has capabilities of 1 nm height resolution with step accuracies better than 0.75%. Images were taken with a 10× lens with a 14 mm field of view.

3. Results

3.1. Electrophoretic Deposition

The process for the formation of stable electrochemically active reduced graphene oxide (rGO) thin films on gold thin film electrodes is schematically depicted in Figure 1A. It is based on a two-step process in which, after EPD at 2.5 V for 5 min, the full reduction of GO to rGO is obtained by immersion into hydrazine vapor for 4 h. The use of a potential of 2.5 V proved to be of high importance in the process. Initial investigation revealed that the electrical current signature changes significantly at voltages greater than 2.5 V (Figure 1B), where the electrical current passing through the interface increases during the first 25 s before stabilizing. In contrast, at potential biases of 2.5 V and lower, a decrease of the electrical current is first observed before its stabilization. Indeed, due to the insulating character of GO, the electrical current should decrease during the deposition process as observed for a low voltage bias. The current drop at 2.5 V is slower than that at 1.25 V. The reason for this is not well understood, but could be due to a partial electrochemical reduction of GO under these conditions. A similar behavior was observed by Diba et al. following the deposition of GO at 3 and 5 V [12].
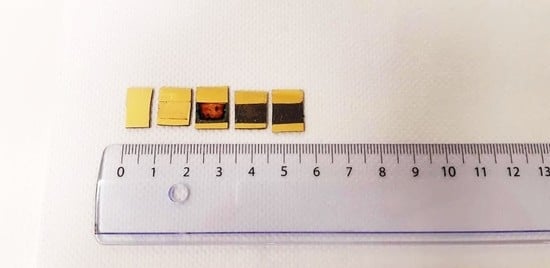
The increase in current at elevated voltages indicates that next to the material deposition an electrochemical reaction occurs, delaying surface passivation [12]. Visual inspection of the interfaces (Figure 1C) shows clearly that the deposition occurred. However, a closer visual inspection of the electrical interfaces (Figure 1D) reveals that the gold thin films were partially destroyed, most likely by the gas evolution during water hydrolysis occurring in parallel at these voltage biases. This results in the swelling of the GO deposit and eventual gold film rupture with poor film attachment.
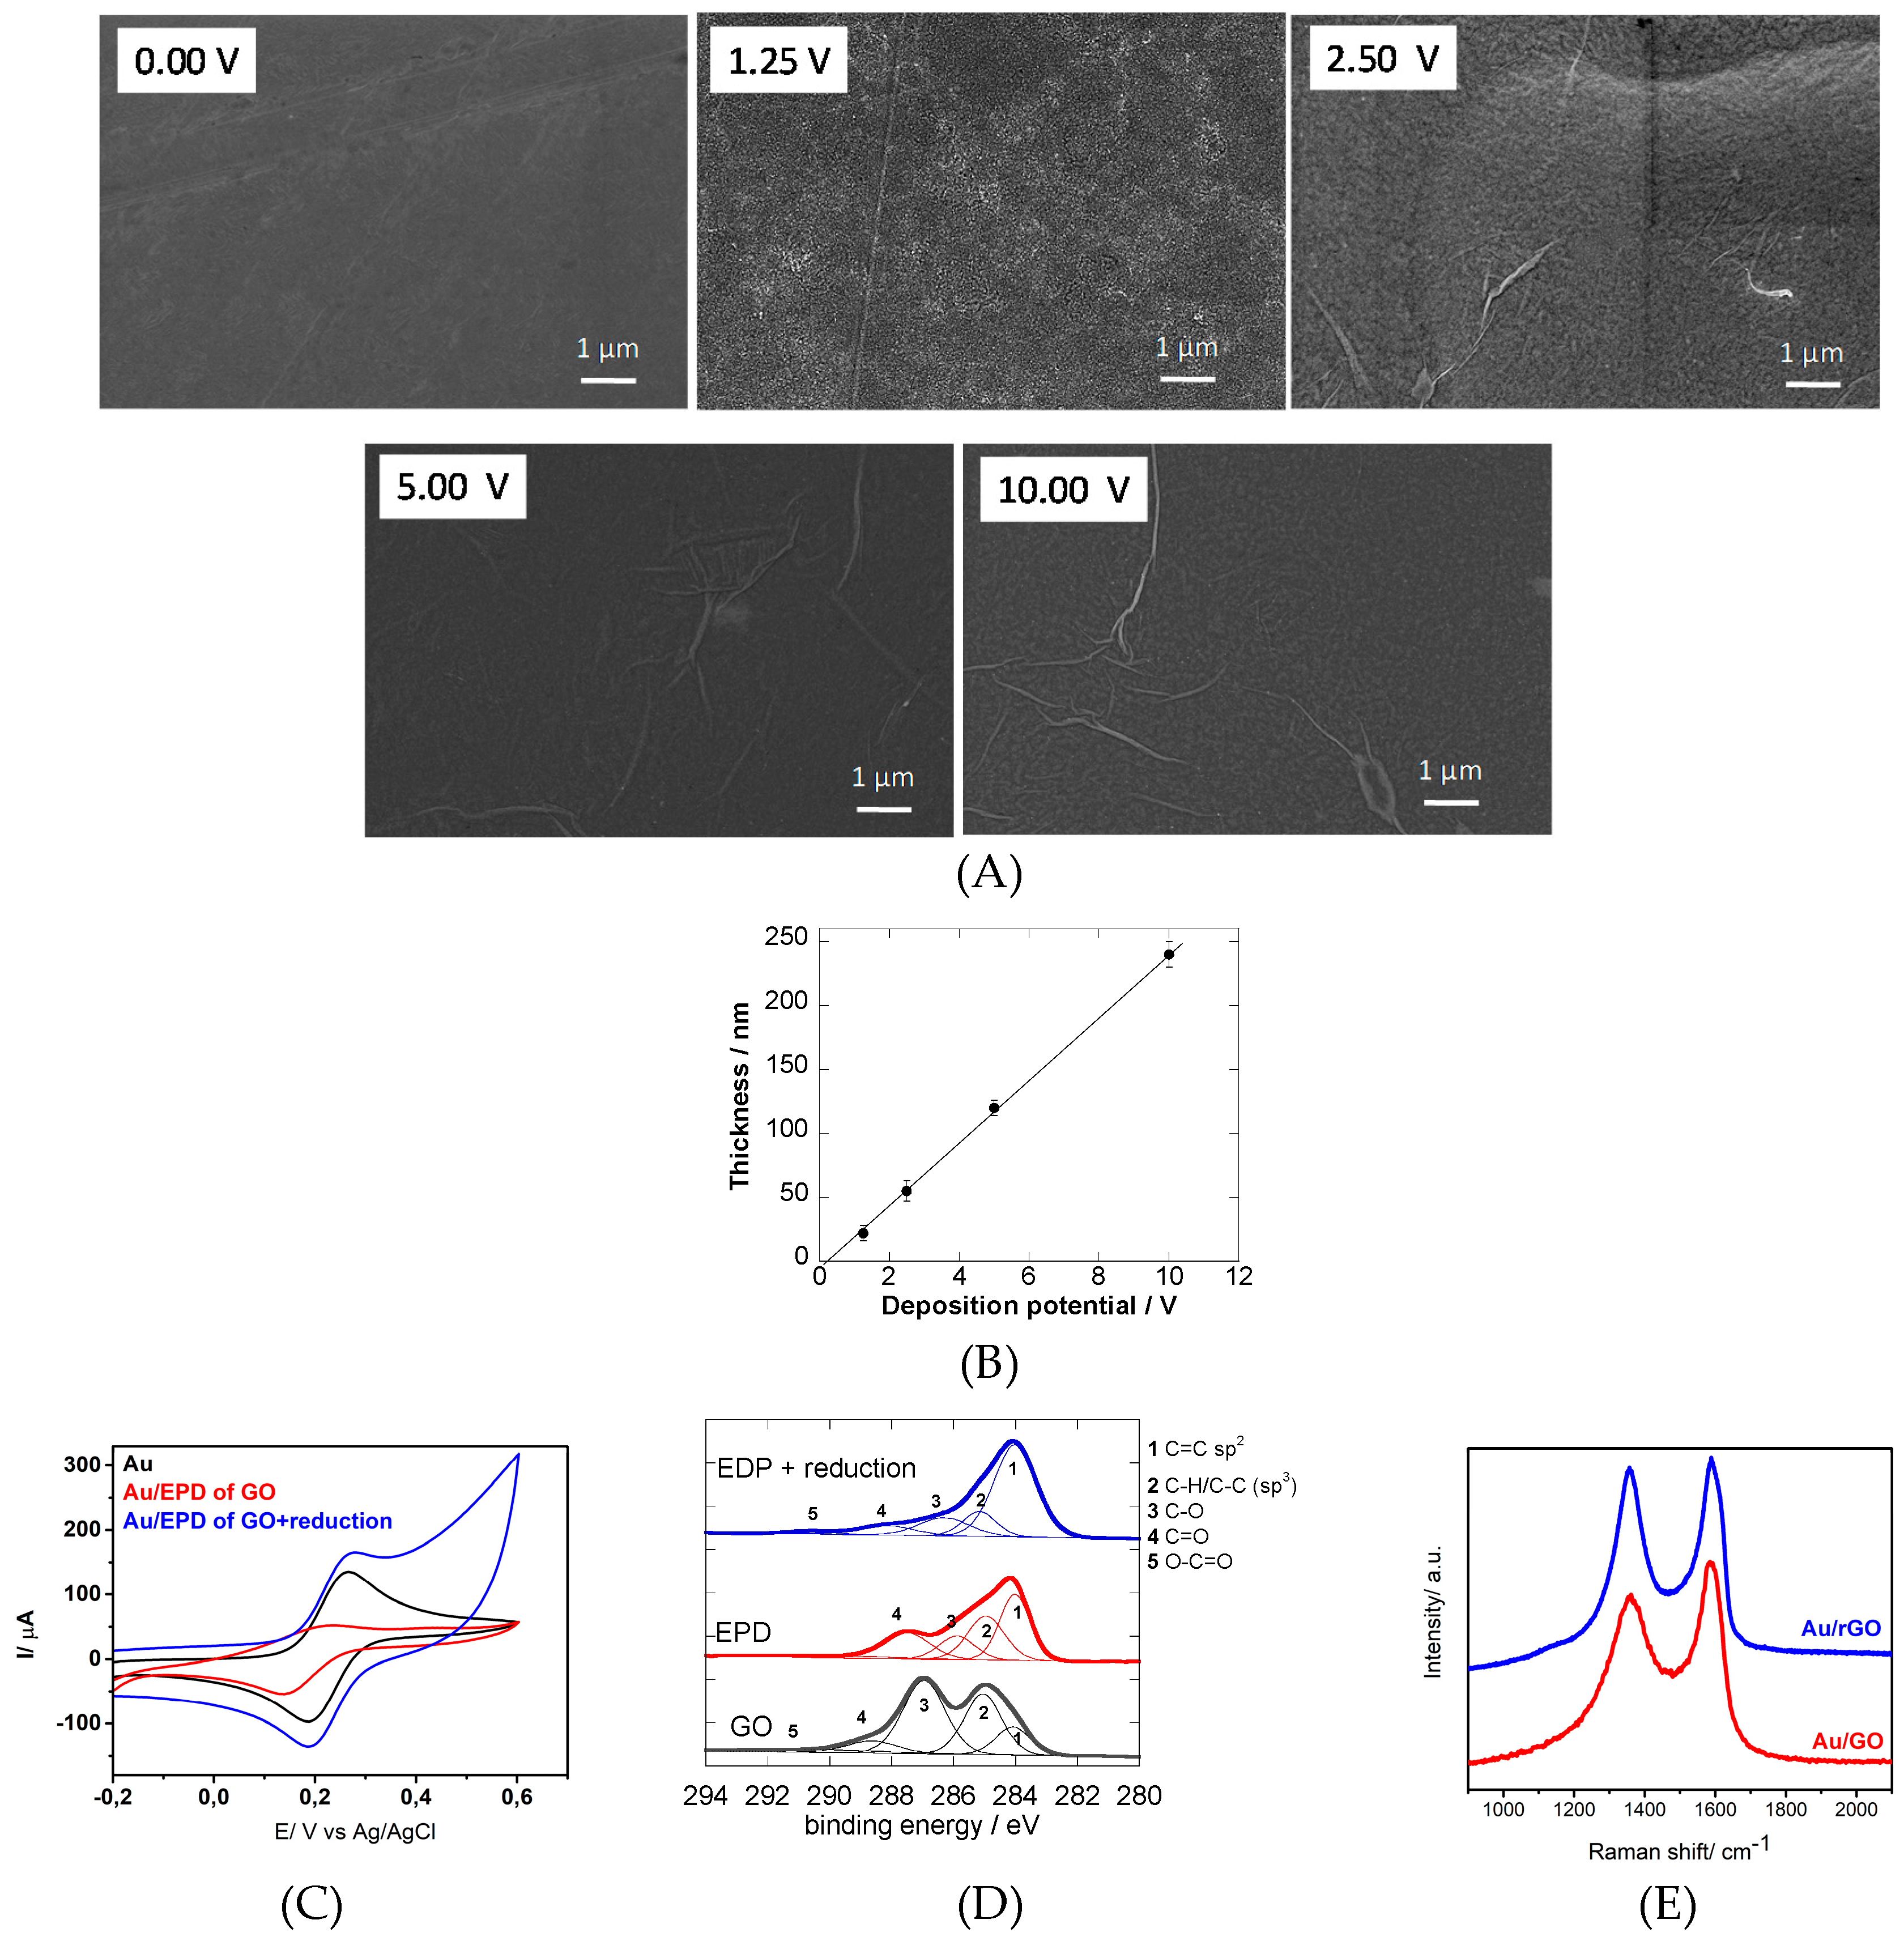
Figure 2A shows SEM images of the different interfaces. While the films formed at 1.25 V display granular like structures, the films deposited at 2.5 V exhibit the typical rGO-like wrinkle structures with no evident local surface inhomogeneities and a complete and even coating of the gold thin film interface. From the cross-section image (Figure 1A), no protrusions and hollow internal structures are visible, indicating that at a lower potential local inhomogeneities associated with rGO formation are avoided. The average surface roughness (Ra), as determined by tapping-mode atomic force microscopy (AFM) measurements, changed from Ra = 4.1 nm (Au) to Ra = 3.5 nm for Au/rGO (2.5 V deposition potential).
To estimate the anodic efficiency of the EPD process, the gold interface was weighed before and after rGO deposition and reduction. To convert the deposited weight (mrGO, 10 µg for 2.5 V for 5 min) into a film thickness (drGO), Equation (1) was used:
d r G O   ( n m ) =   m r G O × A × ρ
where A is the surface area (0.8 cm2 in our case) and ρ is the density of rGO (2.09 g cm−3) [28]. A film thickness of 59 nm was determined. This is in agreement with profilometry measurements where a film thickness of about 55 nm was determined (Figure 2B). Samples prepared at 1.25 V for 5 min had a deposited mass of 3 µg and an estimated rGO film thickness of 20 nm, below the acceptable accuracy limit of profilometry to be validated. Increasing the potential to 5 V resulted in 120 nm thick films. The Hamakar model [29] correlates the time-dependent (t = 300 s) amount of deposited materials (mrGO in g) with the electrical field strength (E, 1.6 V m−1 in our case), the surface area of the electrode (0.8 cm2), the electrophoretic mobility of GO (1.97 × 10⁻⁴ cm2/(Vs)−1), the concentration of the particle suspension (1 mg mL−1, 0.001 g cm−3) and the anodic efficiency factor f (Equation (2)) [29].
m r G O = c r G O × A × μ × E × t × f
In the case of f = 1, the amount of deposited rGO should be equal to mrGO = 47 µg. The determined rGO amount, however, was only 10 µg, which implies an efficiency factor of f = 0.2.
As a voltage bias of 2.5 V seems to be the best condition for the EDP of rGO films onto the gold electrodes, these interfaces were investigated in greater detail. The electrochemical behavior of this interface using ferrocene-methanol redox couple in an aqueous solution is depicted in Figure 2C. Whereas on a bare gold surface a fully reversible voltammogram was observed, an irreversible voltammogram with a very small oxidation peak was observed on GO-coated gold surfaces. To improve the electrochemical behavior of such coated gold surfaces, the interfaces were further treated with hydrazine vapor, known for its strong reducing power. The cyclic voltammograms of hydrazine treated surfaces were largely improved, showing a well-defined redox couple with increased capacitance behavior as expected for rGO materials (Figure 2B, blue curve).
The chemical composition of the deposited graphene matrix was further evaluated using XPS (Figure 2D). The high resolution C1s core level spectrum of the initial GO suspensions showed contributions at 284.2 (C=C sp2), 285.0 (C–H/C–Csp3), 286.7 (C–O) 288.7 (C=O) and a small contribution at 291.0 (O–C=O). The C1s XPS core spectra of GO-coated gold surfaces revealed similar contributions with different intensities. In particular, the band at 284.2 eV due to C=C sp2 increased compared to the GO solution, indicating the partial restoration of the sp2 network of the deposited graphene material. The XPS of GO-coated gold showed additional bands at 285.0 and 286.7 eV with a large band at 288.0 eV due to C=O. The hydrazine reduction of the GO–gold interfaces resulted in a decrease of the epoxy/ether functions at 286.7 eV, in accordance with a partial reduction of GO mostly likely due to the elimination of CO by a Kolb-like mechanism [12,13]. The ketone groups remained preserved.
The Raman spectrum of GO-coated gold surfaces before and after hydrazine reduction (4 h) is presented in Figure 2E. The increase of the D/G ratio from 0.86 to 0.97 after hydrazine chemical reduction was observed.
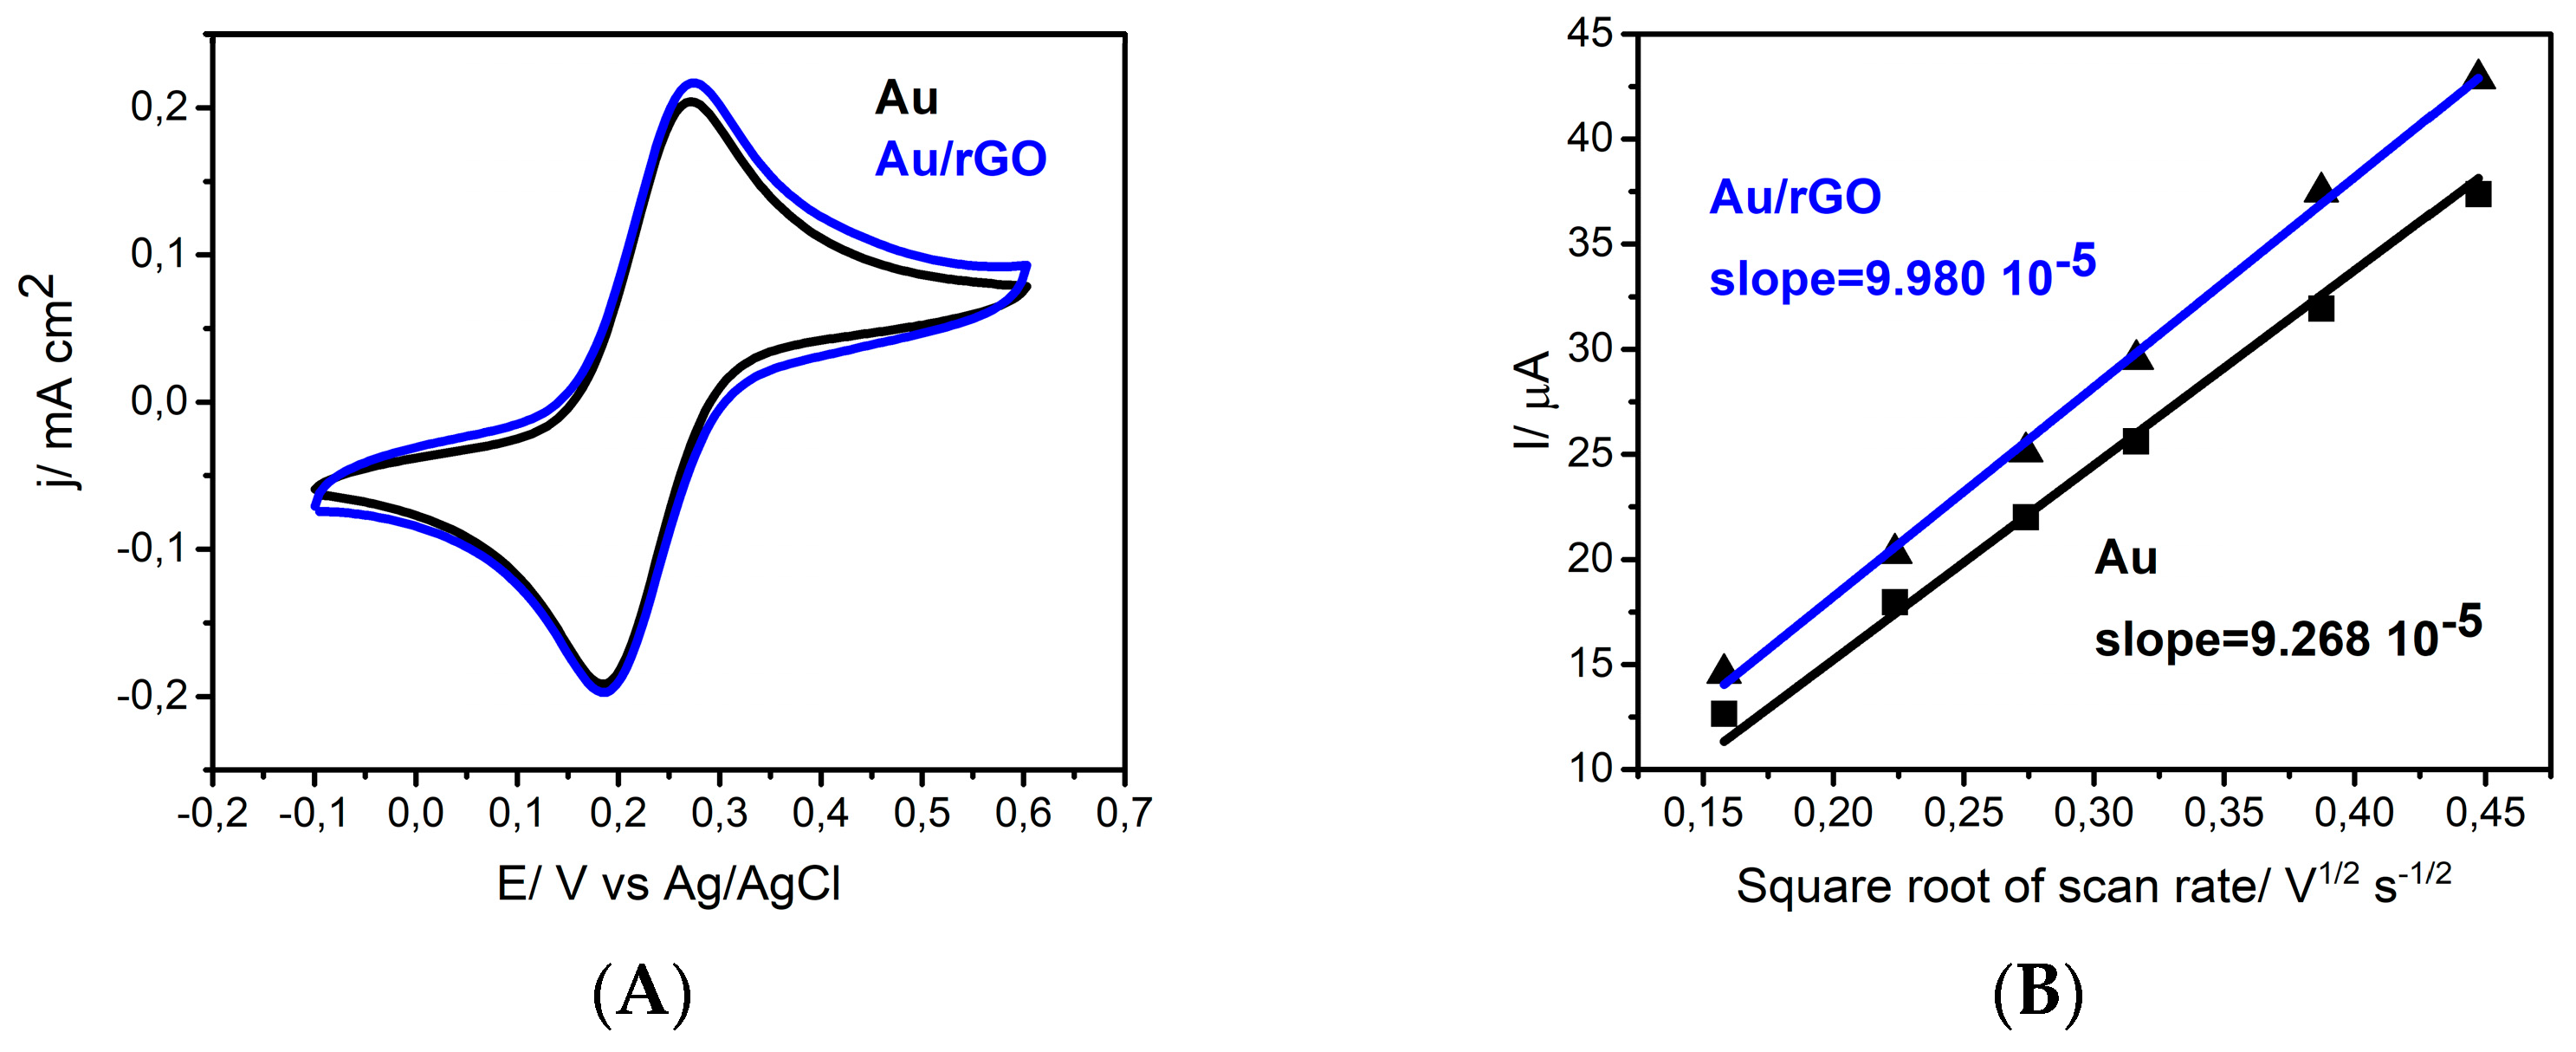
Figure 3A summarizes the electrochemical behavior of a neutral redox species, ferrocene methanol, on bare and GO-coated gold surfaces after the hydrazine chemical reduction. The electrochemically active surface area of the different electrodes was determined by plotting the peak current as a function of the square root of the scan rate (Figure 3B), according to Equation (3) [30]:
A = slope/(268600 × n3/2 × D1/2 × c)
where n is the number of electrons transferred in the redox event (n = 1), D is the diffusion coefficient of ferrocene methanol (7.5 × 10⁻⁶ cm2 s−1) and c is the concentration of ferrocene methanol (1 10−6 mol cm−3). Taking into account the experimentally determined slopes (9.265 × 10⁻⁵ AV1/2 s−1/2 for Au and 9.980 × 10⁻⁵ AV1/2s−1/2 for Au/rGO), the active surfaces of 0.126 cm2 (naked gold) and 0.136 cm2 (Au/rGO) were determined. By plotting the current density vs. potential (Figure 3B), a larger current density was detected on the EPD coated gold interface due to the excellent electrochemical behavior of the interface. This is in agreement with the deposition of an electrochemically active 3D rGO material.

3.2. Surface Modification Using Diazonium Electrografting

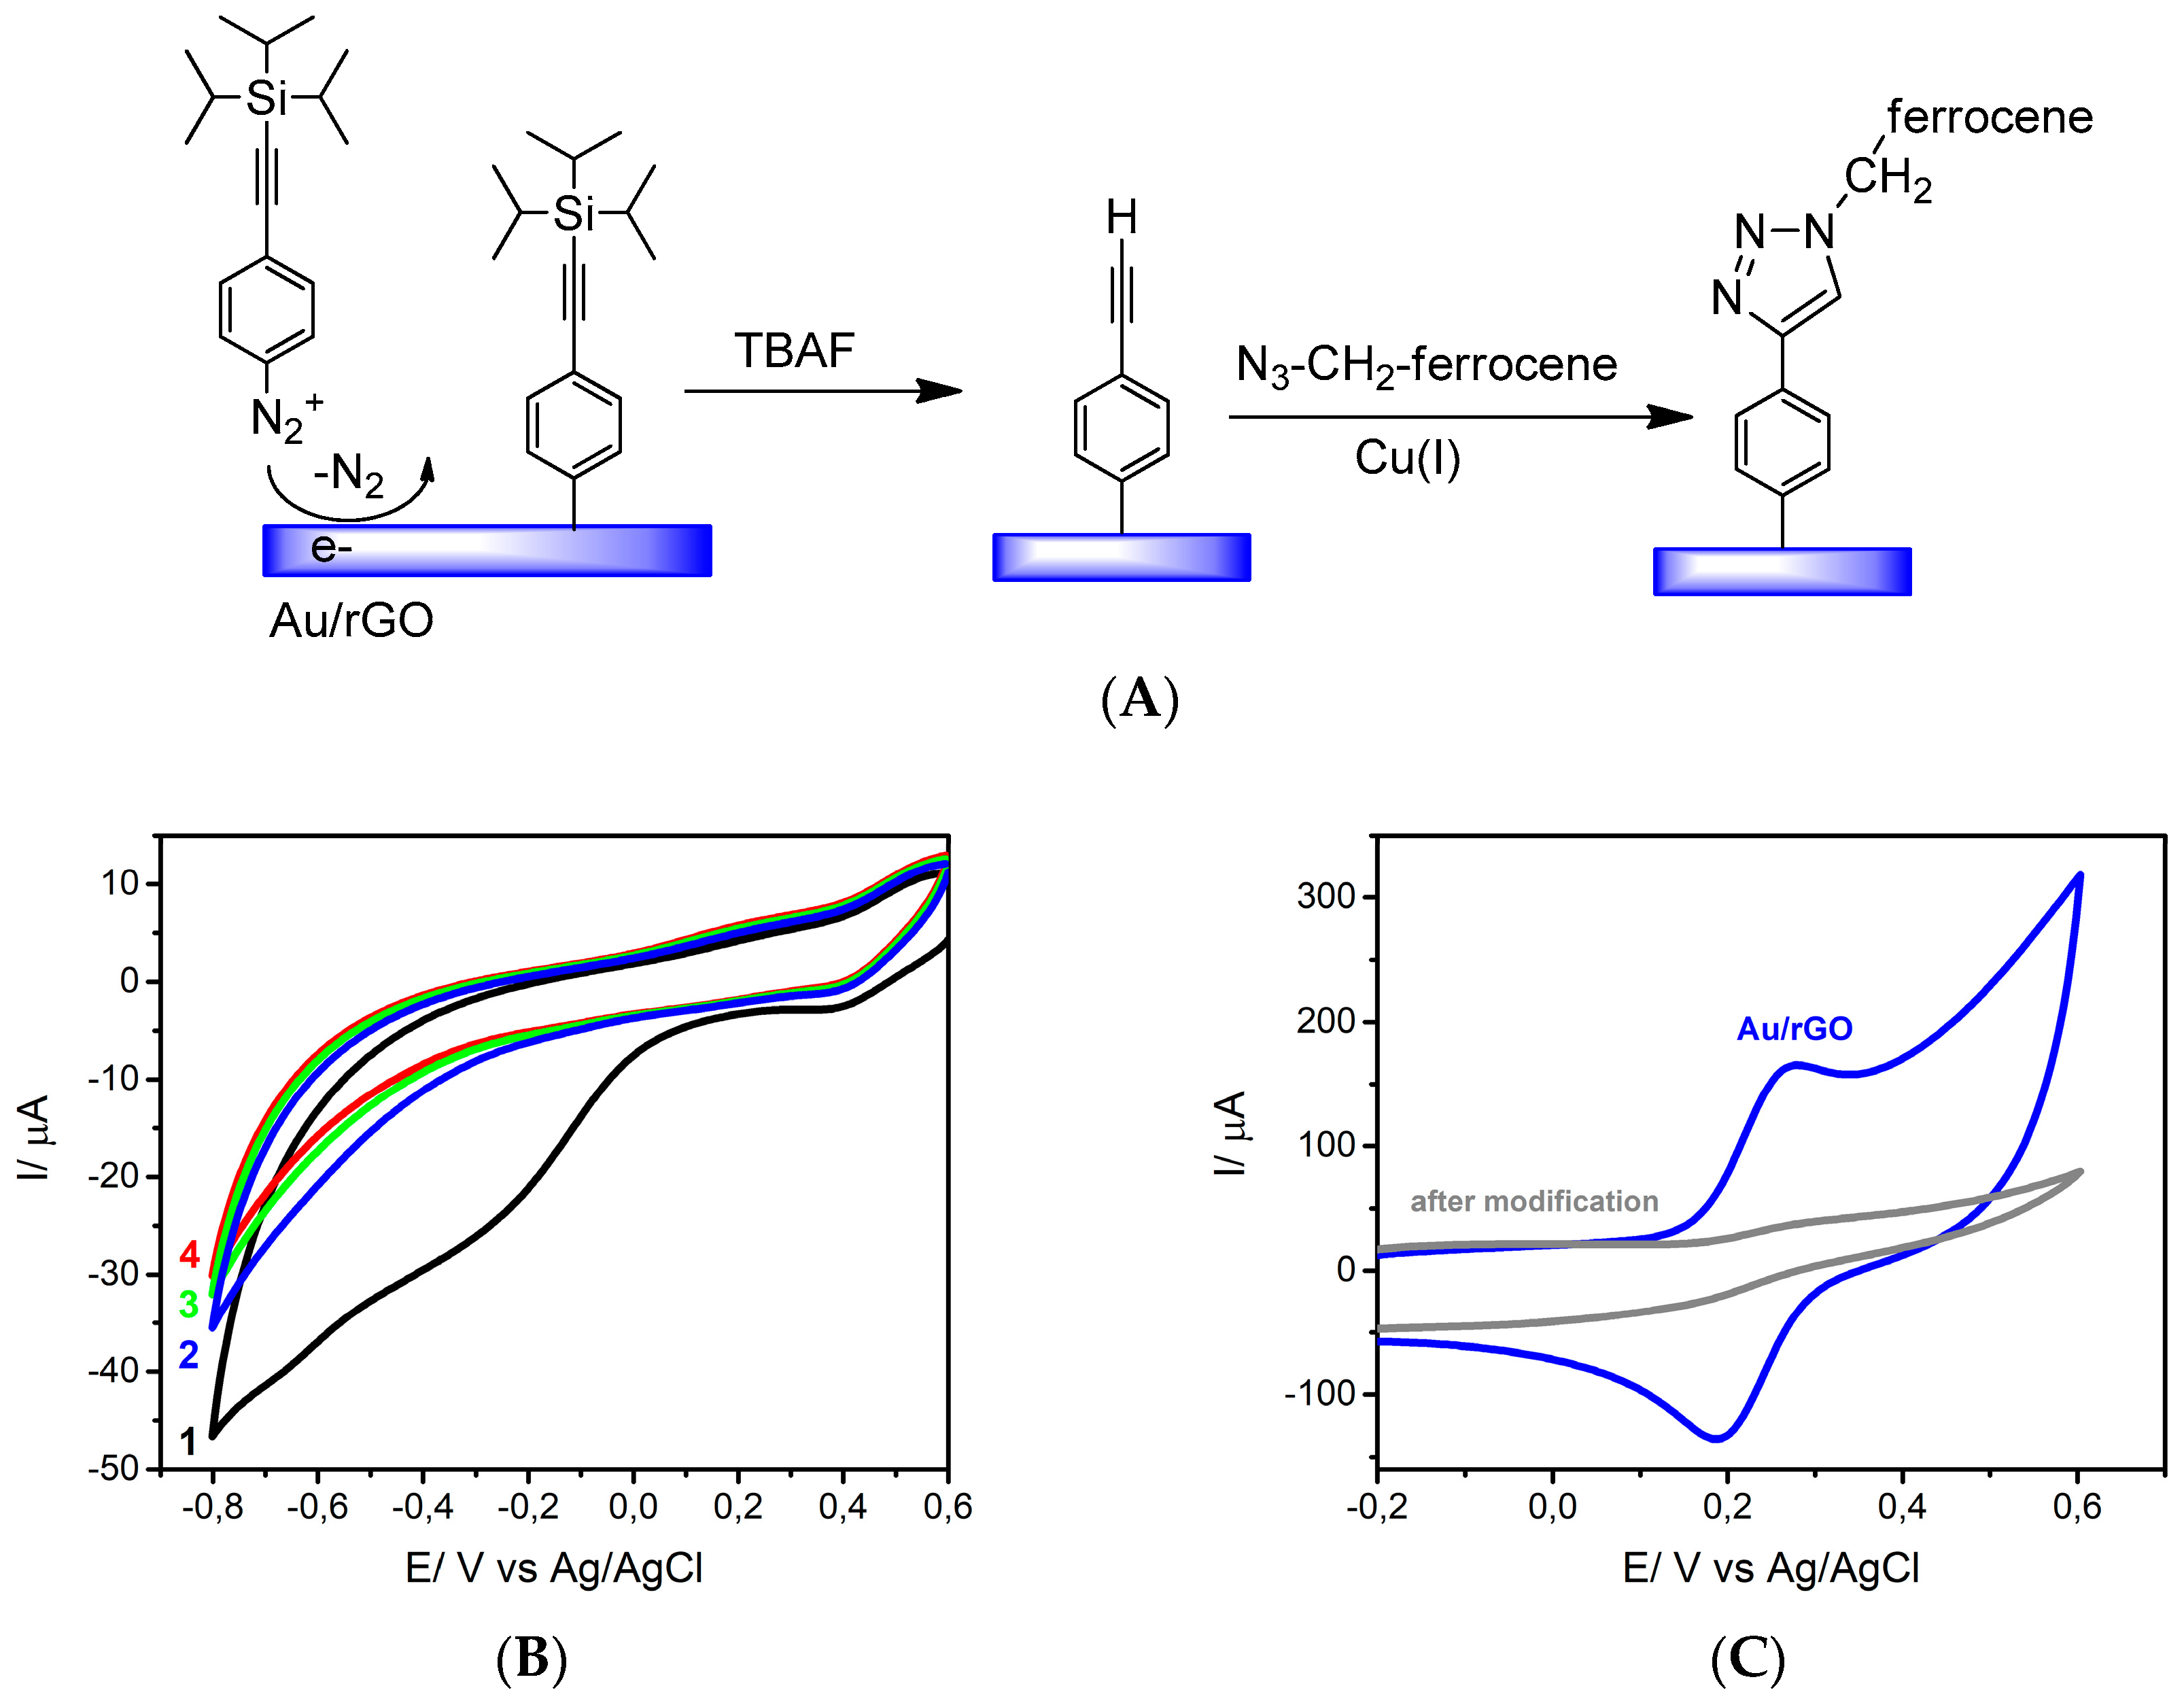
To validate the stability of the formed interface, efficient covalent modification based on the electroreduction of a triisopropylsilyl-protected ethynyl diazonium salt was performed (Figure 4A). Covalent surface modification of graphene-based materials using the electroreduction of aryldiazonium salts is a popular approach as it allows the introduction of different chemical groups. The major drawback of this approach is the difficulty to control the extent of the reaction—notably, to limit the reaction to the formation of a functional monolayer. The highly reactive nature of the formed aryl radical results in the formation of disordered polyaryl multilayers, which in the case of a sensor might limit the dynamic range of sensing. The introduction of bulky substitutions on the ArN2+ moieties limits radical addition reactions and allows the formation of ultrathin functional layers [26,31,32]. On the basis of this concept, the precursor 4-((triisopropylsilyl)ethylenyl)benzenediazonium tetrafluoroborate (TIPS-Eth-ArN2+) was used for the formation of an organic thin film on Au/rGO. The layer was obtained by potential cycling in a solution containing TIPS-Eth-ArN2+ (Figure 4B). As observed by cyclic voltammetry, the reduction peak of TIPS-Eth-ArN2+ at −0.2 V decreased rapidly after five cycles, indicating the blocking of the Au/rGO electrode. Compared to glassy carbon electrodes, the reduction peak shifted to more negative potentials [26]. The blocking properties of the layer was further investigated by recording the cyclic voltammogram of the oxidation of ferrocene methanol in water before and after the electrografting process (Figure 4C) and was found to be typical of a totally blocked electrode.
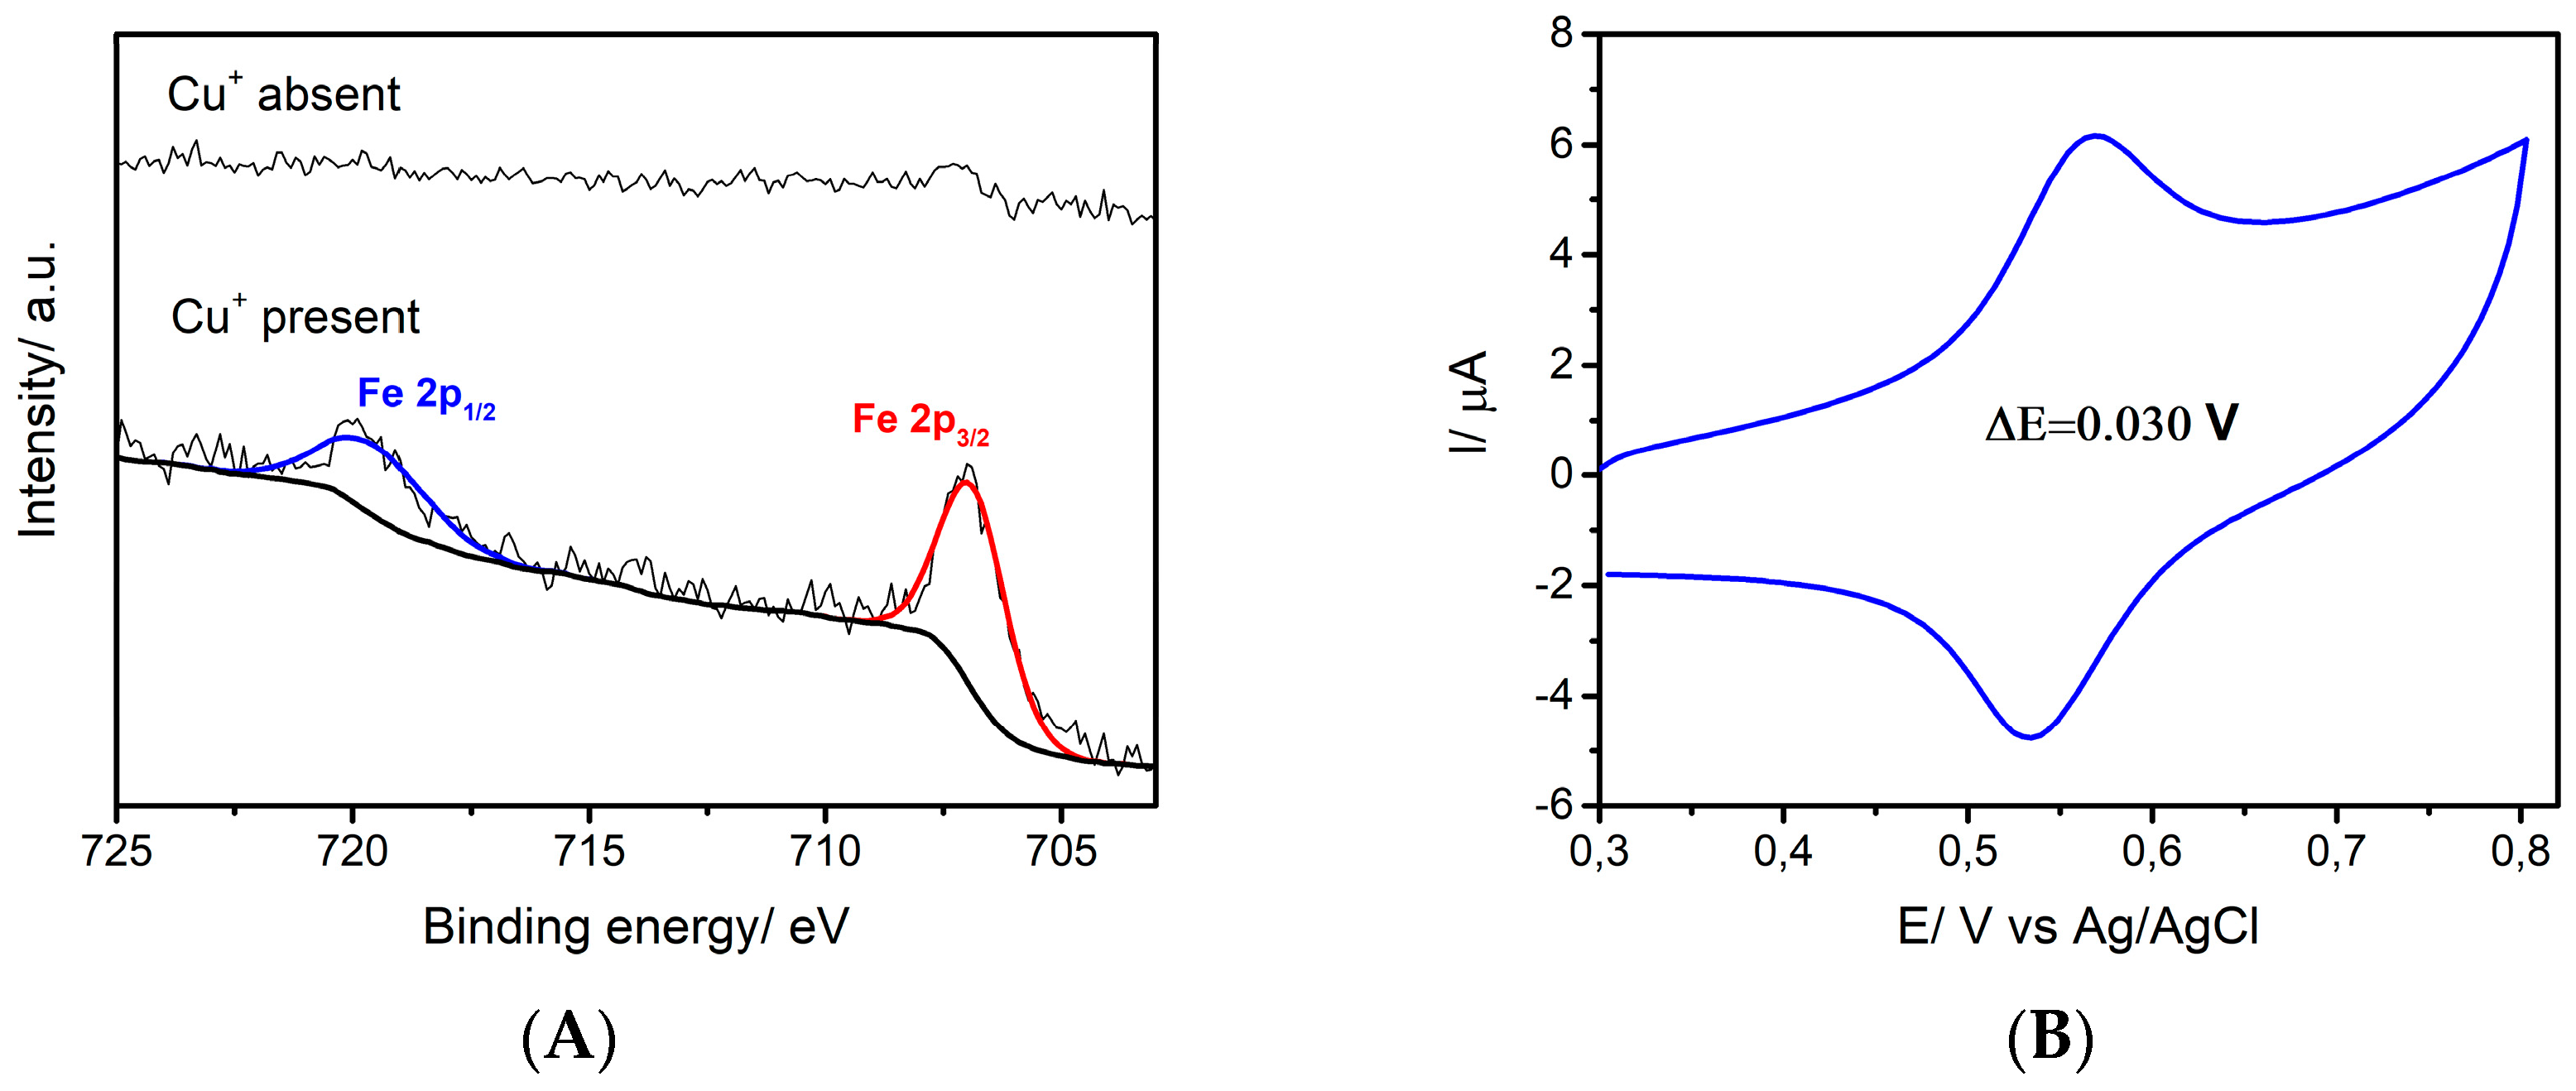
To have access to the acetylene function, the modified Au/rGO-TIP surface was immersed into tetrabutylammonium fluoride (TBAF, 0.05 M in THF) at room temperature. The success of the deprotection step was evidenced by the recovery of the ferrocene oxidation signal, being almost identical to that obtained on Au/rGO (not shown). The deprotected substrate was further treated by “click” chemistry (Huisgen 1,3-dipolar cyclization) using azidomethylferrocene, as first reported by Gooding et al. [33]. The success of the integration of ferrocene units onto the Au/rGO electrodes was seen from the presence of the Fe2p component in the XPS survey spectrum (Figure 5A). In the absence of copper catalyst, no click reaction took place and no Fe2p component could be recorded. Figure 5B shows the cyclic voltammogram of the ferrocene-modified electrode examined in electrolytic ethanol solution. A surface concentration of Γ = 2.5× 10⁻¹⁰ mol cm−2 of bound ferrocene groups was derived from these measurements using Equation (4):
Γ = Q/nFA
where Q is the passed charge, n is the number of exchanged electrons (n = 1), F is the Faraday constant and A is the electroactive surface of the electrode determined as 0.136 cm2. Considering the ferrocene molecules as spheres with a diameter of 6.6 Å, the theoretical maximum coverage for an idealized ferrocene monolayer can be estimated as Γ = 4.8 × 10⁻¹⁰ mol cm−2 [34]. In our case, about half of the full coverage was achieved.

4. Conclusions

In conclusion, by applying a low EPD voltage of 2.5 V, the deposition of partially reduced graphene oxide film can be formed on gold thin film electrodes in a homogenous, and mechanically and chemically stable manner. Further reduction of the films in hydrazine vapor results in reduced graphene oxide-coated substrates showing excellent electron transfer characteristics. The films proved to be of high robustness and could be further modified via the electroreduction of aryldiazonium salts. Using a protection–deprotection approach allows the immobilization of a functional monolayer which can be further functionalized by Cu(I)-catalyzed “click” chemistry. We have demonstrated that a densely packed ferrocenenyl monolayer can be efficiently integrated on these rGO-modified surfaces. Due to the versatility and mild conditions of the “click” chemistry reaction, a wide range of functional groups can be immobilized on such surfaces. These results pave the way for the use of this technology for the modification of more complex electrode configuration such as screen-printed or flexible integrated electrode arrays and the integration of surface ligands for sensing-related applications.

Author Contributions

V.M.: electrophoretic deposition and electrochemistry; P.A.: click chemistry; Y.L.: surface chemistry; H.H.: characterization; W.K.: editing of the draft; R.B.: characterization, editing of the draft; S.S.; original draft preparation, supervision of work.

Acknowledgments

General financial support from the Centre National de la Recherche Scientifique (CNRS), the University of Lille, the Hauts-de-France region and the EU through FLAG-ERA JTC2015 “Graphtivity” is acknowledged.

Conflicts of Interest

The authors declare no conflict of interest.

References

  1. Reina, G.; González-Domínguez, J.M.; Criado, A.; Vázquez, E.; Bianco, A.; Prato, M. Promises, facts and challenges for graphene in biomedical applications. Chem. Soc. Rev. 2017, 46, 4400–4416. [Google Scholar] [CrossRef]
  2. Szunerits, S.; Boukherroub, R. Graphene-based bioelectrochemistry and bioelectronics: A concept for the future? Curr. Opin. Electrochem. 2018, 12, 141–147. [Google Scholar] [CrossRef]
  3. Ambrosi, A.; Chua, C.K.; Latiff, N.M.; Loo, A.H.; Wong, C.H.; Eng, A.Y.; Bonanni, A.; Pumera, M. Graphene and its electrochemistry—An update. Chem. Soc. Rev. 2016, 45, 2458–2493. [Google Scholar] [CrossRef] [PubMed]
  4. Peña-Bahamonde, J.; Nguyen, H.N.; Sofia, K.; Rodrigues, D.F. Recent advances in graphene-based biosensor technology with applications in life sciences. J. Nanobiotechnol. 2018, 16, 75. [Google Scholar] [CrossRef] [PubMed]
  5. Szunerits, S.; Boukherroub, R. Electrochemistry of graphene: The current state of the art. Electrochemistry 2013, 12, 211–242. [Google Scholar]
  6. Szunerits, S.; Boukherroub, R. Graphene-based nanomaterials in innovative electrochemistry. Curr. Opin. Electrochem. 2018, 10, 24–30. [Google Scholar] [CrossRef]
  7. Chekin, F.; Vasilescu, A.; Jijie, R.; Singh, S.K.; Kurungot, S.; Iancu, M.; Badea, G.; Boukherroub, R.; Szunerits, S. Sensitive electrochemical detection of cardiac troponin I in serum and saliva by nitrogen-doped porous reduced graphene oxide electrode. Sens. Actuators B Chem. 2018, 262, 180–187. [Google Scholar] [CrossRef]
  8. Jijie, R.; Kahlouche, K.; Barras, A.; Yamakawa, N.; Bouckaert, J.; Gharbi, T.; Szunerits, S.; Boukherroub, R. Reduced graphene oxide/polyethylenimine based immunosensor for the selective and sensitive electrochemical detection of uropathogenic Escherichia coli. Sens. Actuators B. 2018, 260, 255–263. [Google Scholar] [CrossRef]
  9. Wang, Q.; Vasilescu, A.; Wang, Q.; Coffinier, Y.; Li, M.; Boukherroub, R.; Szunerits, S. Electrophoretic Approach for the Simultaneous Deposition and Functionalization of Reduced Graphene Oxide Nanosheets with Diazonium Compounds: Application for Lysozyme Sensing in Serum. ACS Appl. Mater. Interfaces 2017, 9, 12823–12831. [Google Scholar] [CrossRef] [PubMed]
  10. Subramanian, P.; Lesniewski, A.; Kaminska, I.; Vlandas, A.; Vasilescu, A.; Niedziolka-Jonsson, J.; Pichonat, E.; Happy, H.; Boukherroub, R.; Szunerits, S. Lysozyme detection on aptamers functionalized graphene-coated SPR interfaces. Biosens. Bioelectron. 2013, 50, 239–243. [Google Scholar] [CrossRef]
  11. Subramanian, P.; Barka-Bouaifel, F.; Bouckaert, J.; Yamakawa, N.; Boukherroub, R.; Szunerits, S. Graphene-coated surface plasmon resonance interfaces for studing the interactions between cells and surfaces. ACS Appl. Mater. Interfaces 2014, 6, 5422–5431. [Google Scholar] [CrossRef] [PubMed]
  12. Diba, M.; Garcia-Callastegui, A.; Klupp Taylor, R.N.; Pishbin, F.; Ryan, M.P.; Shaffer, M.S.P.; Boccaccini, A.R. Quantitative evaluation of electrophoretic deposition kinetics of graphene oxide. Carbon 2014, 67, 656–661. [Google Scholar] [CrossRef]
  13. An, S.J.; Zhu, Y.; Lee, S.H.; Stoller, M.D.; Emilsson, T.; Park, S.; Velamakanni, A.; An, J.; Ruoff, R.S. Thin Film Fabrication and Simultaneous Anodic Reduction of Deposited Graphene Oxide Platelets by Electrophoretic Deposition. J. Phys. Chem. Lett. 2010, 1, 1259–1263. [Google Scholar] [CrossRef]
  14. Besra, L.; Liu, M. A review on fundamentals and applications of electophoretic depositon (EDP). Prog. Mater. Sci. 2007, 52, 1–61. [Google Scholar] [CrossRef]
  15. Ammam, M. Electrophoretic deposition under modulated electric fields: A review. RSC Adv. 2012, 2, 7633–7646. [Google Scholar] [CrossRef]
  16. Ata, M.S.; Liu, Y.; Zhitomirsky, I. A review of new methods of surface chemical modification, dispersion and electrophoretic deposition of metal oxide particles. RSC Adv. 2014, 4, 22716–22732. [Google Scholar] [CrossRef]
  17. Boccaccini, A.R.; Cho, H.; Roether, J.A.; Thoimasz, B.J.C.; Minay, E.J.; Shaffer, M.S.P. Electrophoretic deposition of carbon nanotubes. Carbon 2006, 44, 3149–3160. [Google Scholar] [CrossRef]
  18. Chavez-Valdez, A.; Shaffer, M.S.P.; Boccaccini, A.R. Applications of Graphene Electrophoretic Deposition. A Review. J. Phys. Chem. B 2013, 117, 1502–1515. [Google Scholar] [CrossRef]
  19. He, L.; Sarkar, S.; Barras, A.; Boukherroub, R.; Szunerits, S.; Mandler, D. Electrochemically stimulated drug release from flexible electrodes coated electrophoretically with doxorubicin loaded reduced graphene oxide. Chem. Commun. 2017, 53, 4022–4025. [Google Scholar] [CrossRef]
  20. Kahlouche, K.; Jijie, R.; Hosu, I.; Barras, A.; Gharbi, T.; Yahiaoui, R.; Herlem, G.; Ferhat, M.; Szunerits, S.; Boukherroub, R. Controlled modification of electrochemical microsystems with polyethylenimine/reduced graphene oxide using electrophoretic deposition: Sensing of dopamine levels in meat samples. Talanta 2018, 178, 32–440. [Google Scholar] [CrossRef]
  21. Maaoui, H.; Singh, S.K.; Teodorescu, F.; Coffinier, Y.; Barras, A.; Chtourou, R.; Kurungot, S.; Szunerits, S.; Boukherroub, R. Copper oxide supported on three-dimensional ammonia-doped porous reduced graphene oxide prepared through electrophoretic deposition for non-enzymatic glucose sensing. Electrochim. Acta 2017, 224, 346–354. [Google Scholar] [CrossRef]
  22. Wang, Q.; Li, M.; Szunerits, S.; Boukherroub, R. Preparation of reduced graphene oxide-Cu composites through electrophoretic deposition: Application for nonenzyamtic glucose sensing. RSC Adv. 2015, 5, 15861–15869. [Google Scholar] [CrossRef]
  23. Subramanian, P.; Niedziolka-Jonsson, J.; Lesniewski, A.; Wang, Q.; Li, M.; Boukherroub, R.; Szunerits, S. Preparation of reduced graphene oxide-Ni(OH)2 composites by electrophoretic deposition: Application for non-enzymatic glucose sensing. J. Mater. Chem. A 2014, 2, 5525–5533. [Google Scholar] [CrossRef]
  24. Wang, Q.; Vasilescu, A.; Wang, Q.; Li, M.; Boukherroub, R.; Szunerits, S. Electrophoretic approach for the modification of reduced graphene oxide nanosheets with diazonium compounds: Application for electrochemical lysozyme sensing. ACS Appl. Mater. Interfaces 2017, 9, 12823–12831. [Google Scholar] [CrossRef]
  25. Pei, S.; Cheng, H.-M. The reduction of graphene oxide. Carbon 2012, 50, 3210–3228. [Google Scholar] [CrossRef]
  26. Leroux, Y.R.; Fei, H.; Noel, J.-M.; Roux, C.; Hapiot, P. Efficient Covalent Modification of a carbon surface: Use of a silyl protecting group to form an active monolayer. J. Am. Chem. Soc. 2010, 132, 14039–14041. [Google Scholar] [CrossRef] [PubMed]
  27. Casas-Solva, J.M.; Vargas-Berenguel, A.; Captian-Vallvey, L.F.; Santoyo-Gonzalez, F. Convenient Methods for the Synthesis of Ferrocene−Carbohydrate Conjugates. Org. Lett. 2004, 6, 3687–3690. [Google Scholar] [CrossRef]
  28. Park, S.; An, J.; Jung, I.; Piner, R.D.; An, S.J.; Li, X.; Velamakanni, A.; Ruoff, R.S. Colloidal suspensions of highly reduced graphene oxide in a wide variety of organic solvents. Nano Lett. 2009, 9, 1593–1597. [Google Scholar] [CrossRef]
  29. Hamaker, H.C. Formation of a deposite by electrophoresis. Trans. Farady Soc. 1940, 35, 279–287. [Google Scholar] [CrossRef]
  30. Ngamchuea, K.; Eloul, S.; Tschulik, K.; Compton, R.G. Planar diffusion to macro disc electrodes—What electrode size is required for the Cottrell and Randles-Sevcik equations to apply quantitatively? J. Sol. State Electrochem. 2014, 18, 3251–3257. [Google Scholar] [CrossRef]
  31. Nielsen, L.T.; Vase, K.H.; Dong, M.; Besenbacher, F.; Pedersen, S.U.; Daasbjerg, K. Electrochemical Approach for Constructing a Monolayer of Thiophenolates from Grafted Multilayers of Diaryl Disulfides. J. Am. Chem. Soc. 2007, 129, 1888–1889. [Google Scholar] [CrossRef]
  32. Combellas, C.; Jiang, D.-E.; Kanoufi, F.; Pinson, J.; Podvorica, F.I. Steric Effects in the Reaction of Aryl Radicals on Surfaces. Langmuir 2009, 25, 286–293. [Google Scholar] [CrossRef] [PubMed]
  33. Ciampi, S.; Le Saux, G.; Harper, J.B.; Gooding, J.J. Optimization of Click Chemistry of Ferrocene Derivatives on Acetylene-Functionalized Silicon(100) Surfaces. Elecroanalysis 2008. [Google Scholar] [CrossRef]
  34. Chidsey, C.E.D.; Bertozzi, C.R.; Putvinski, T.M.; Mujsce, A.M. Coadsorption of ferrocene-terminated and unsubstituted alkanethiols on gold: Electroactive self-assembled monolayers. J. Am. Chem. Soc. 1990, 112, 4301–4306. [Google Scholar] [CrossRef]
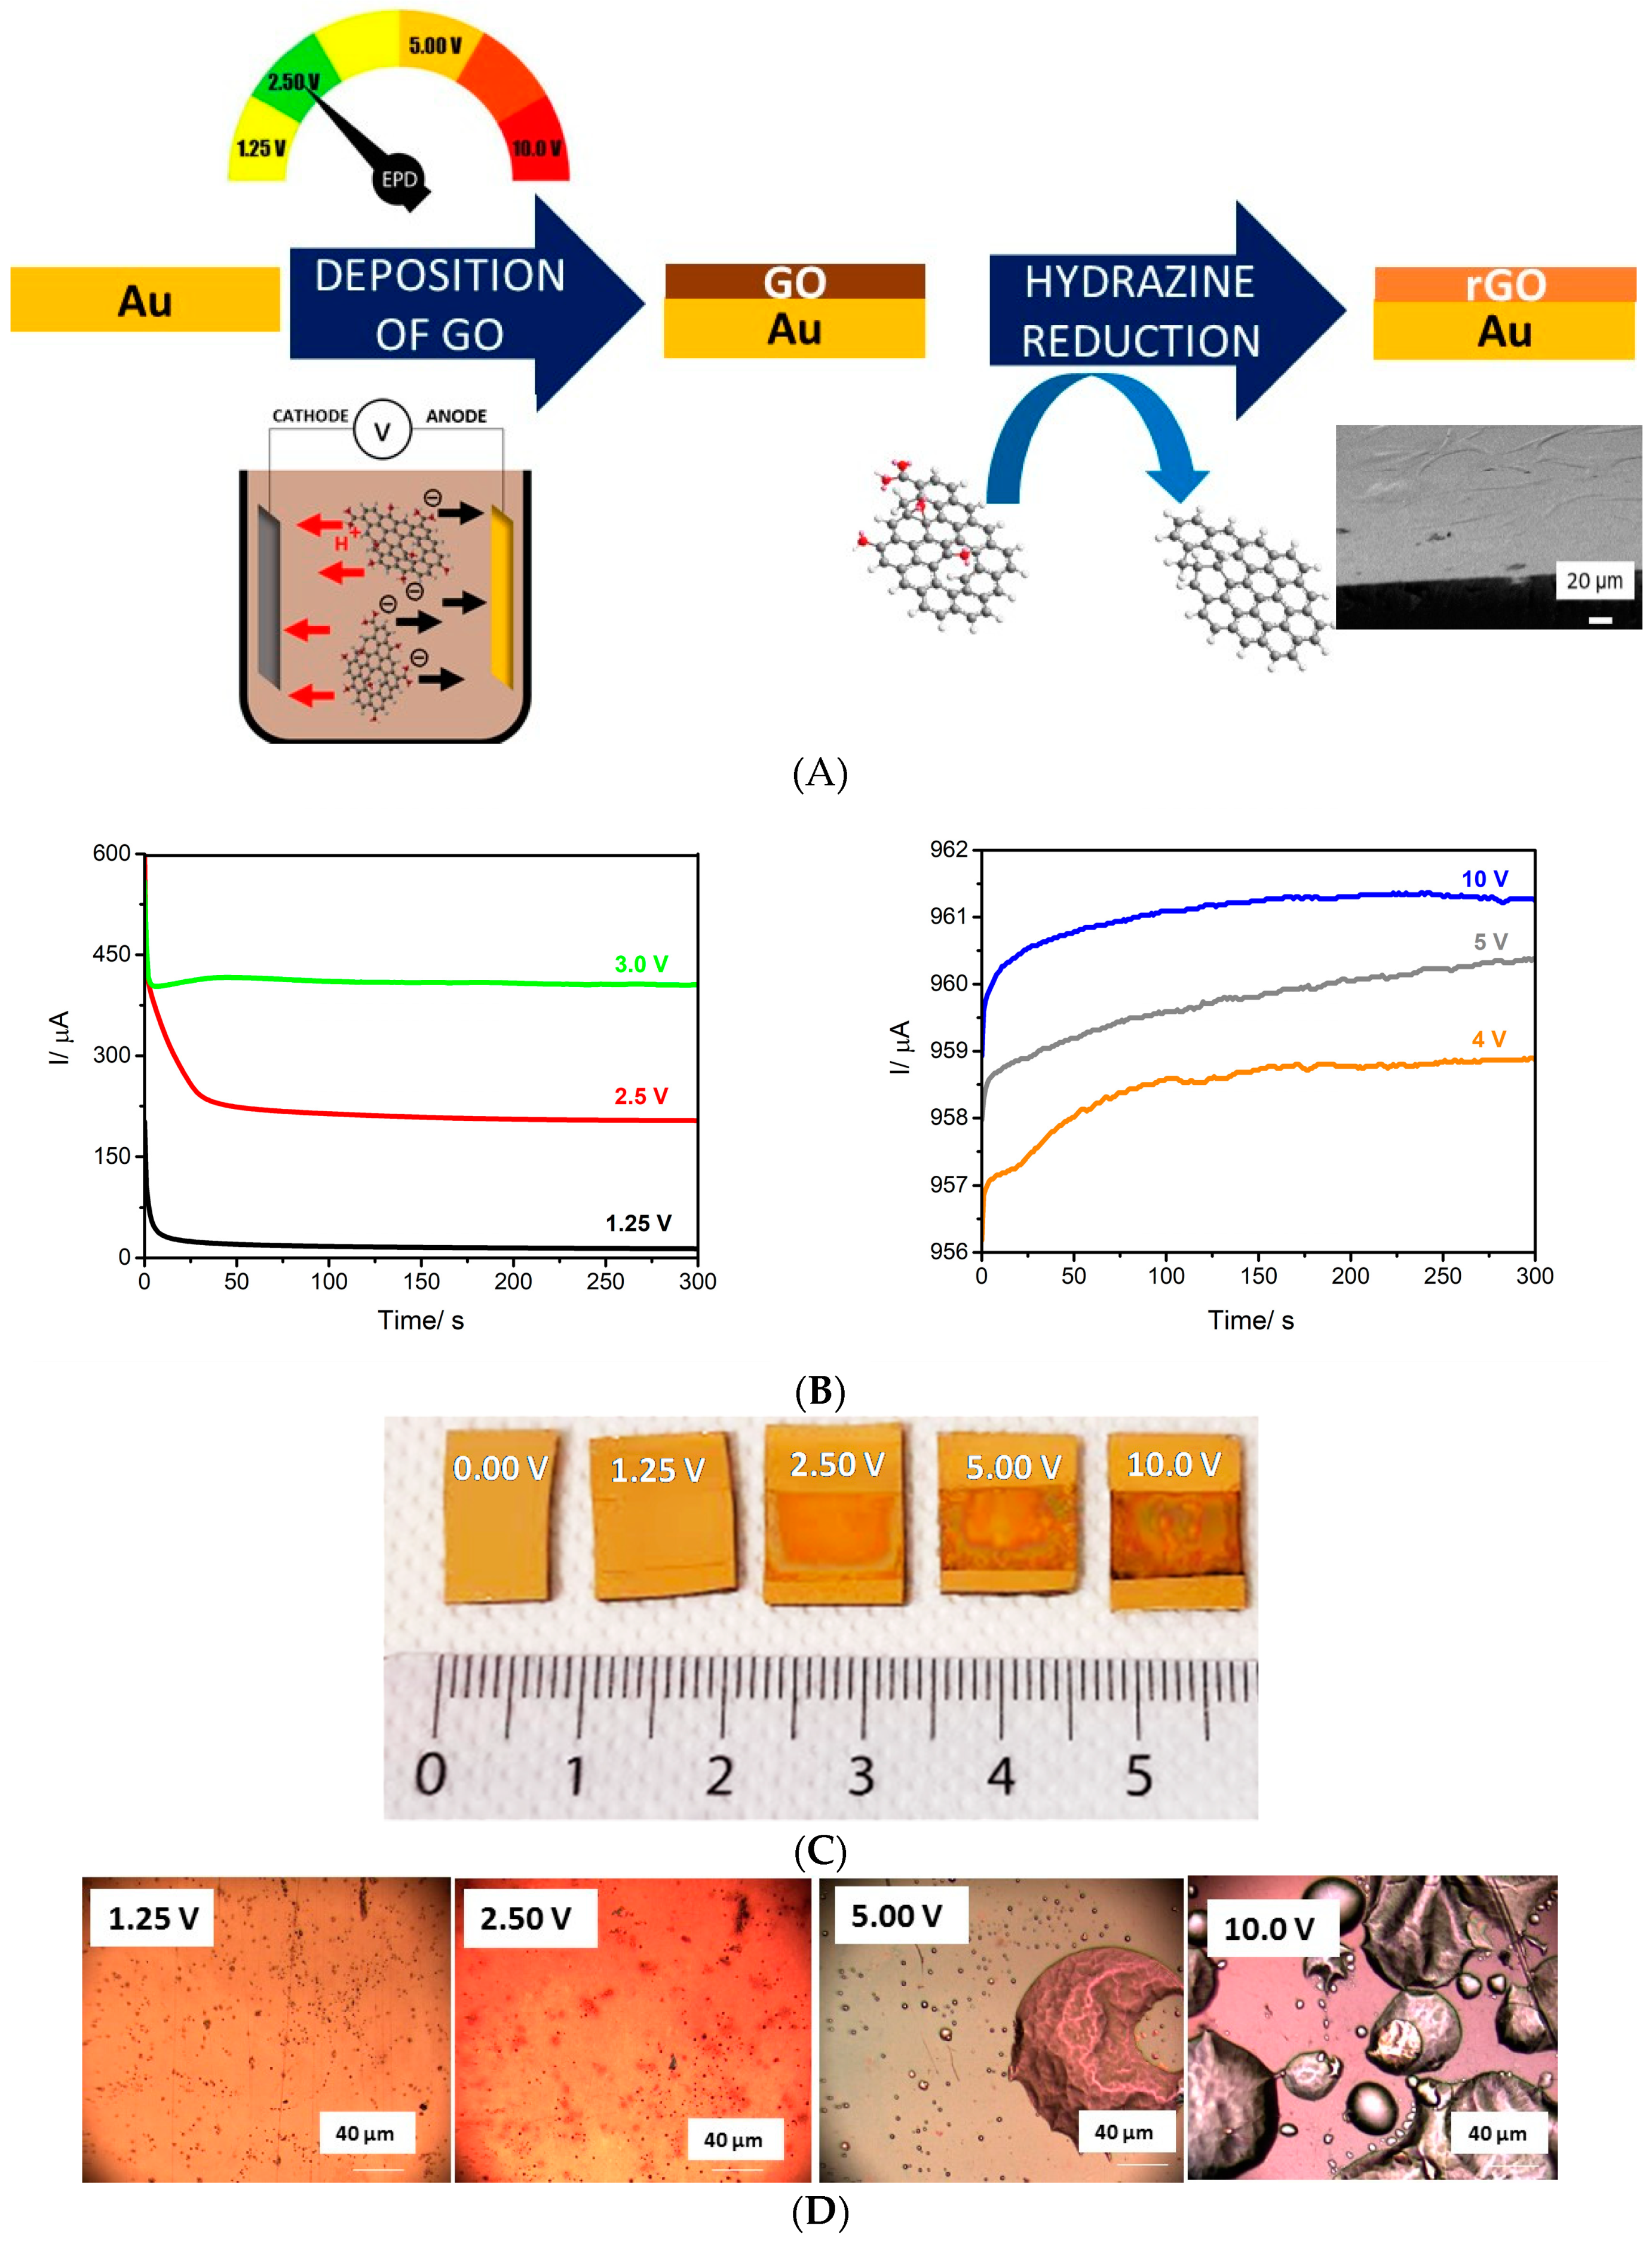
Figure 1. (A) Schematic illustration of the formation of an electrochemically active reduced graphene oxide (rGO) thin film by anodic electrophoretic deposition (EPD) from an aqueous graphene oxide suspensions (GO, 1 mg/mL) at a potential bias of 2.5 V for 5 min, followed by chemical treatment in hydrazine vapor; cross-sectional SEM image of a gold interface coated with rGO using EPD at 2.5 V for 5 min. (B) Change of current as a function of deposition time using different applied potentials: concentration of GO (1 mg/mL) in water (pH 7.5), deposition interface: gold thin film electrode. (C) Photographic images of gold thin film electrodes before (0.00 V) and after anodic EPD of an aqueous solution of GO (1 mg/mL, pH 7.5) for 5 min at 1.25, 2.50, 5.00 and 10.00 V. (D) Photographs of the different interfaces obtained (objective: 10×, numerical aperture: 0.9).
Surfaces 02 00015 g001
Figure 2. (A) SEM image of gold thin films before and after EPD from an aqueous graphene oxide suspension (GO, 1 mg/mL) at different potential biases for 5 min. (B) Thickness of reduced graphene oxide as a function of applied potential (t = 5 min). (C) Cyclic voltammograms recorded on gold thin film electrodes (black), after EPD from an aqueous graphene oxide suspension (GO, 1 mg/mL) at a potential bias of 2.5 V for 5 min (red); after further reduction with hydrazine (blue) using ferrocenemethanol (1 mM)/PBS (0.1 M), scan rate = 100 mV s−1. (D) C1s high-resolution spectra of GO (black), EPD GO (red) and further reduced GO (blue). (E) Raman spectra of the EPD film formed at 2.5 V before (red) and after hydrazine reduction (blue).
Surfaces 02 00015 g002
Figure 3. (A) Cyclic voltammograms recorded on gold thin film electrodes (black) and after EPD and further reduction with hydrazine using ferrocene methanol (1 mM)/PBS (0.1 M), scan rate = 100 mV s−1. (B) Cyclic voltammograms recorded on gold thin film electrodes (black) and after EPD and further reduction with hydrazine using ferrocene methanol (1 mM)/PBS (0.1 M), scan rate = 100 mV s−1.
Surfaces 02 00015 g003
Figure 4. (A) Covalent modification of Au/rGO electrodes using a silyl-protected diazonium salt followed by tetrabutylammonium fluoride (TBAF)-based deprotection and “click” reaction using azidomethylferrocene as a model compound. (B) Electroreduction of 4-((triisopropylsilyl) ethylenyl)benzenediazonium tetrafluoroborate (TIPS-Eth-ArN2+) on Au/rGO, scan rate 50 mV s−1. (C) Cyclic voltammograms of ferrocene methanol (1 mM)/0.1 M PBS of rGO/Au before (blue) and after modification with TIPS-Eth-ArN2+.
Surfaces 02 00015 g004
Figure 5. (A) High-resolution Fe2p X-ray photoelectron spectroscopy (XPS) core-level spectrum of ferrocene modified Au/rGO interfaces. (B) Cyclic voltammograms in acetonitrile/ NBu4PF6 0.1 M), scan rate 100 mV s−1.
Surfaces 02 00015 g005