Effects of the Interfacial Structure on the Methanol Oxidation on Platinum Single Crystal Electrodes


Abstract
1. Introduction
2. Materials and Methods
3. Results
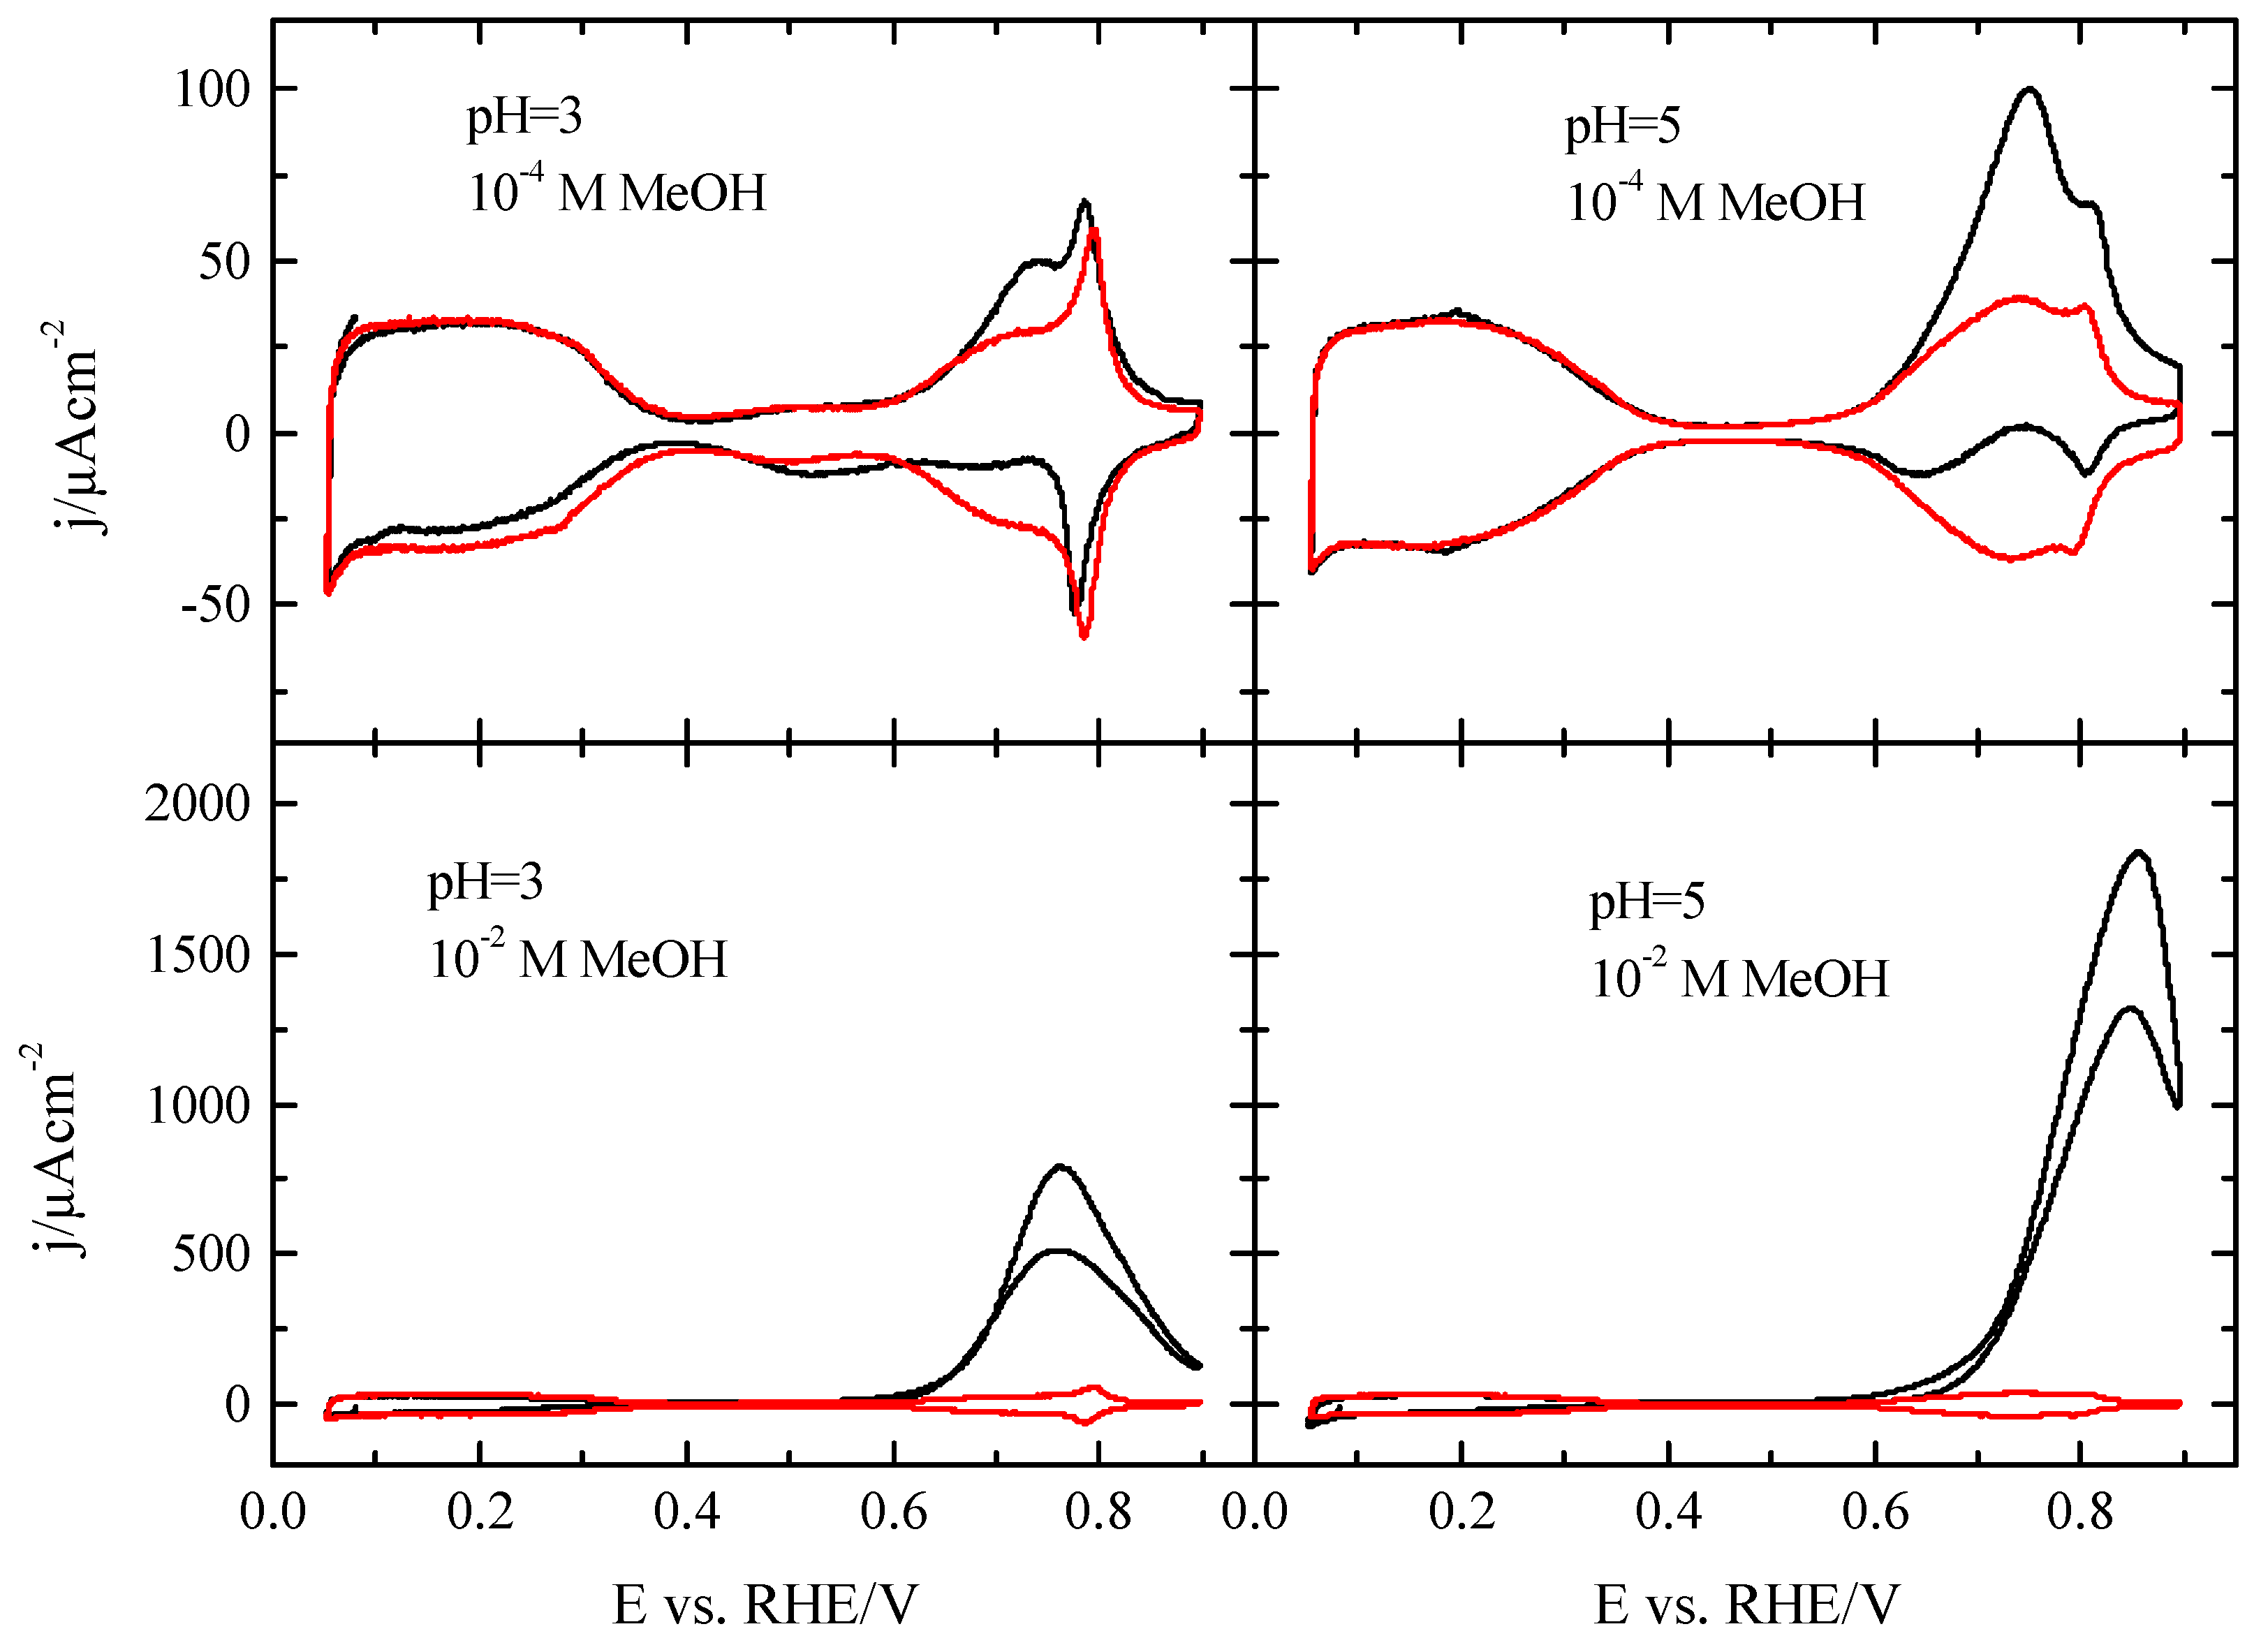
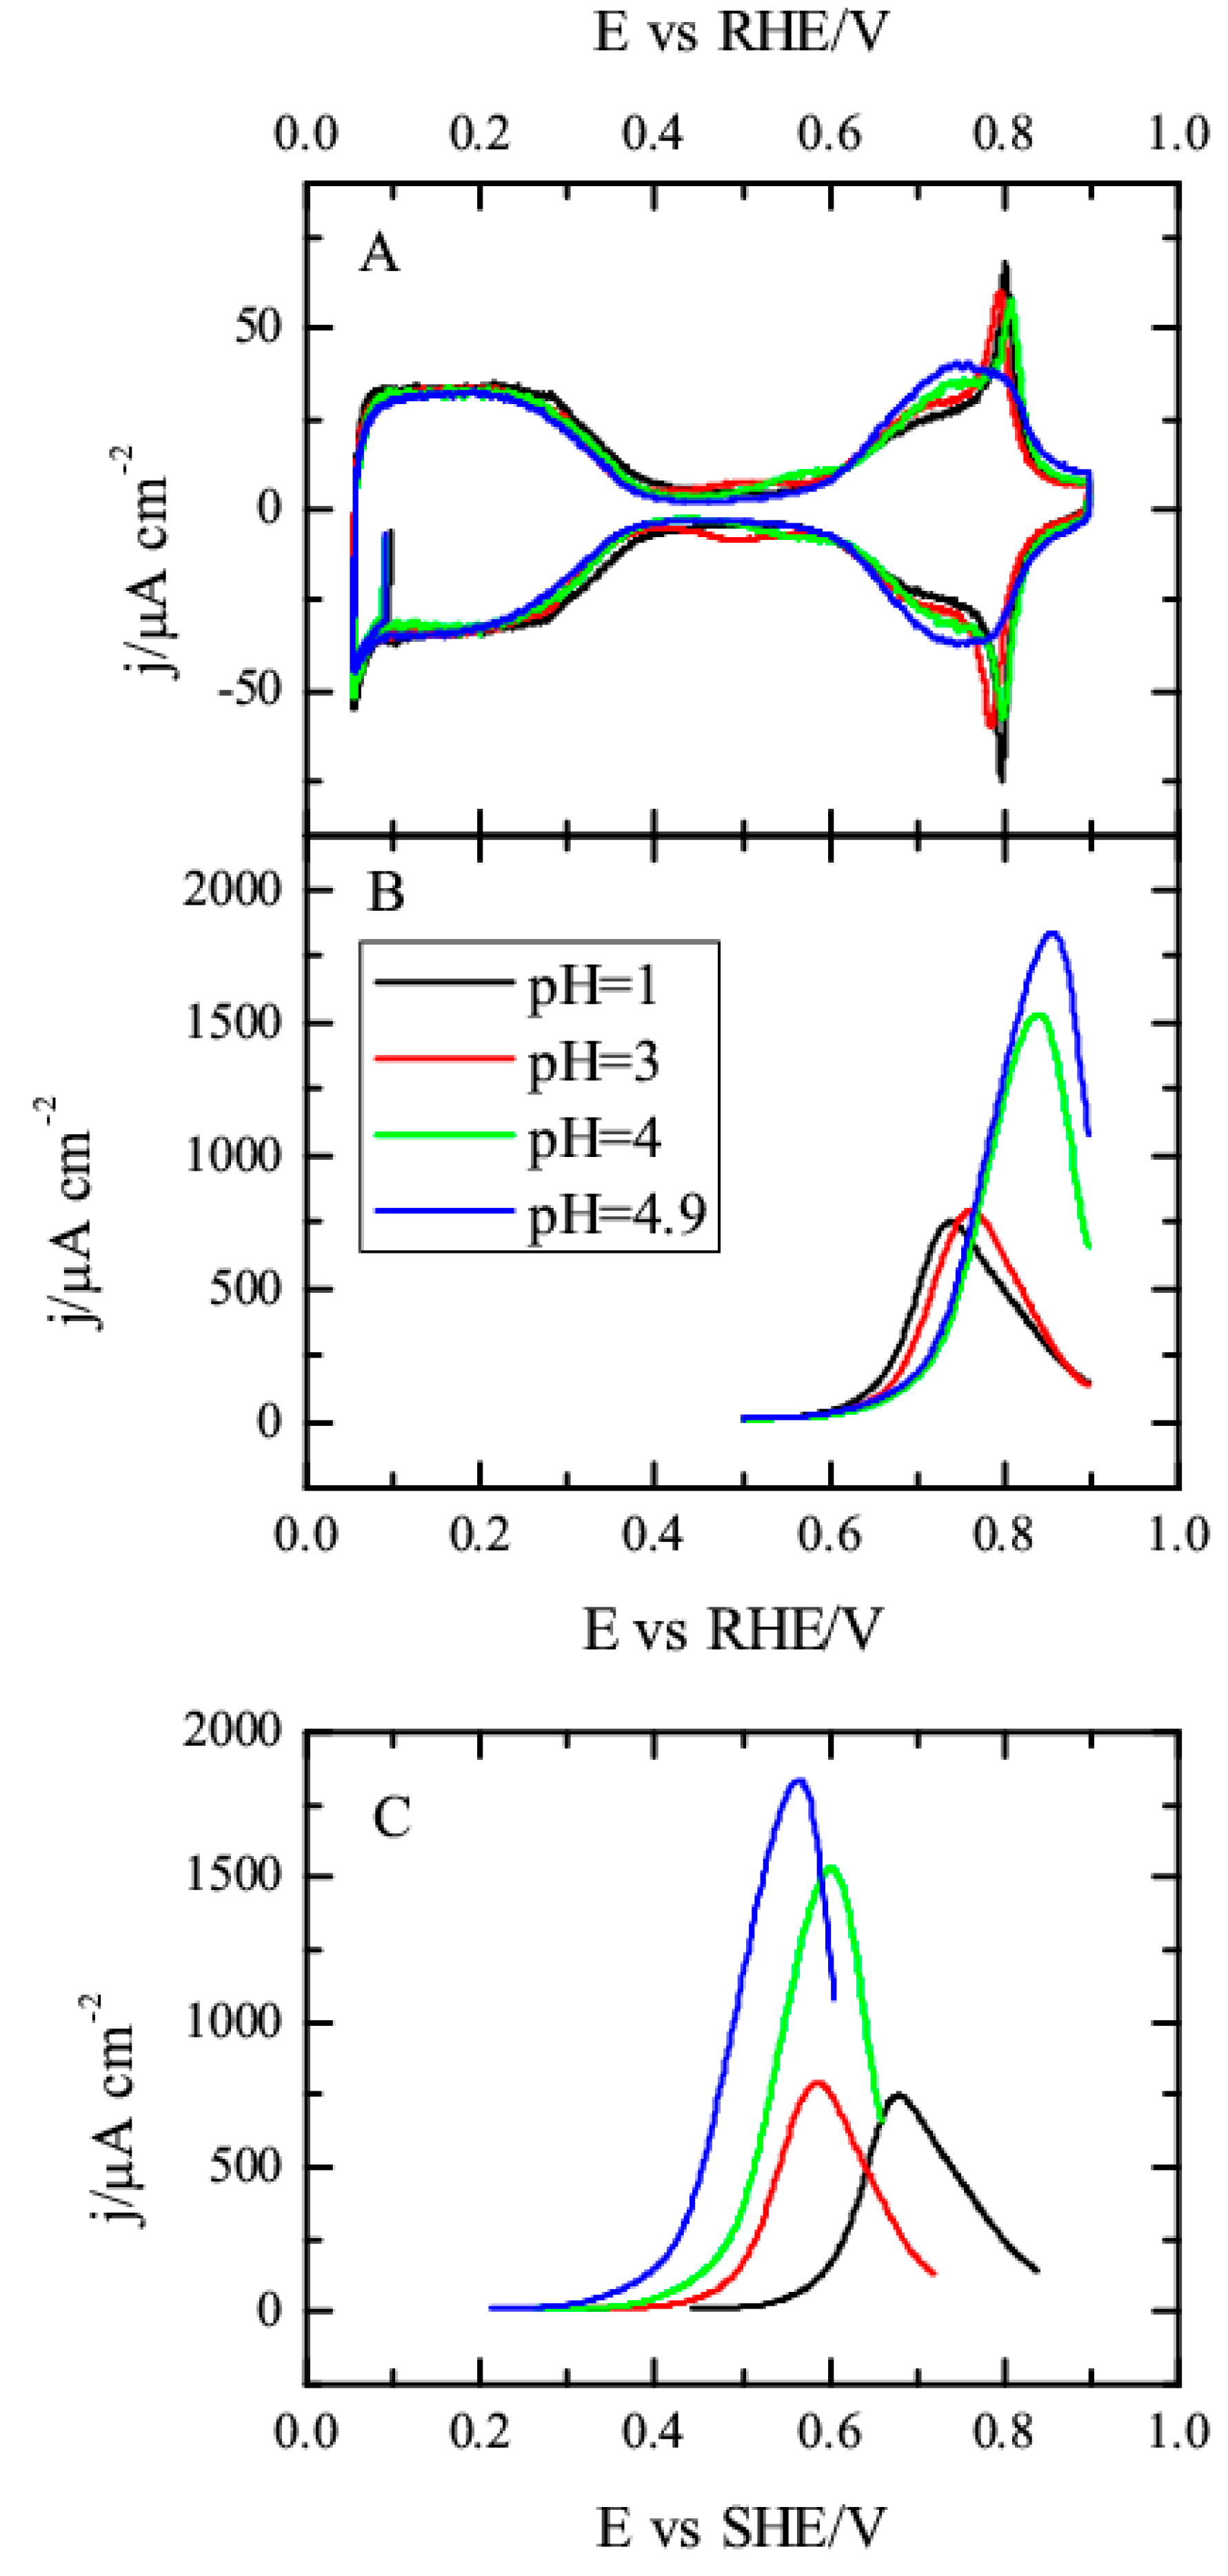
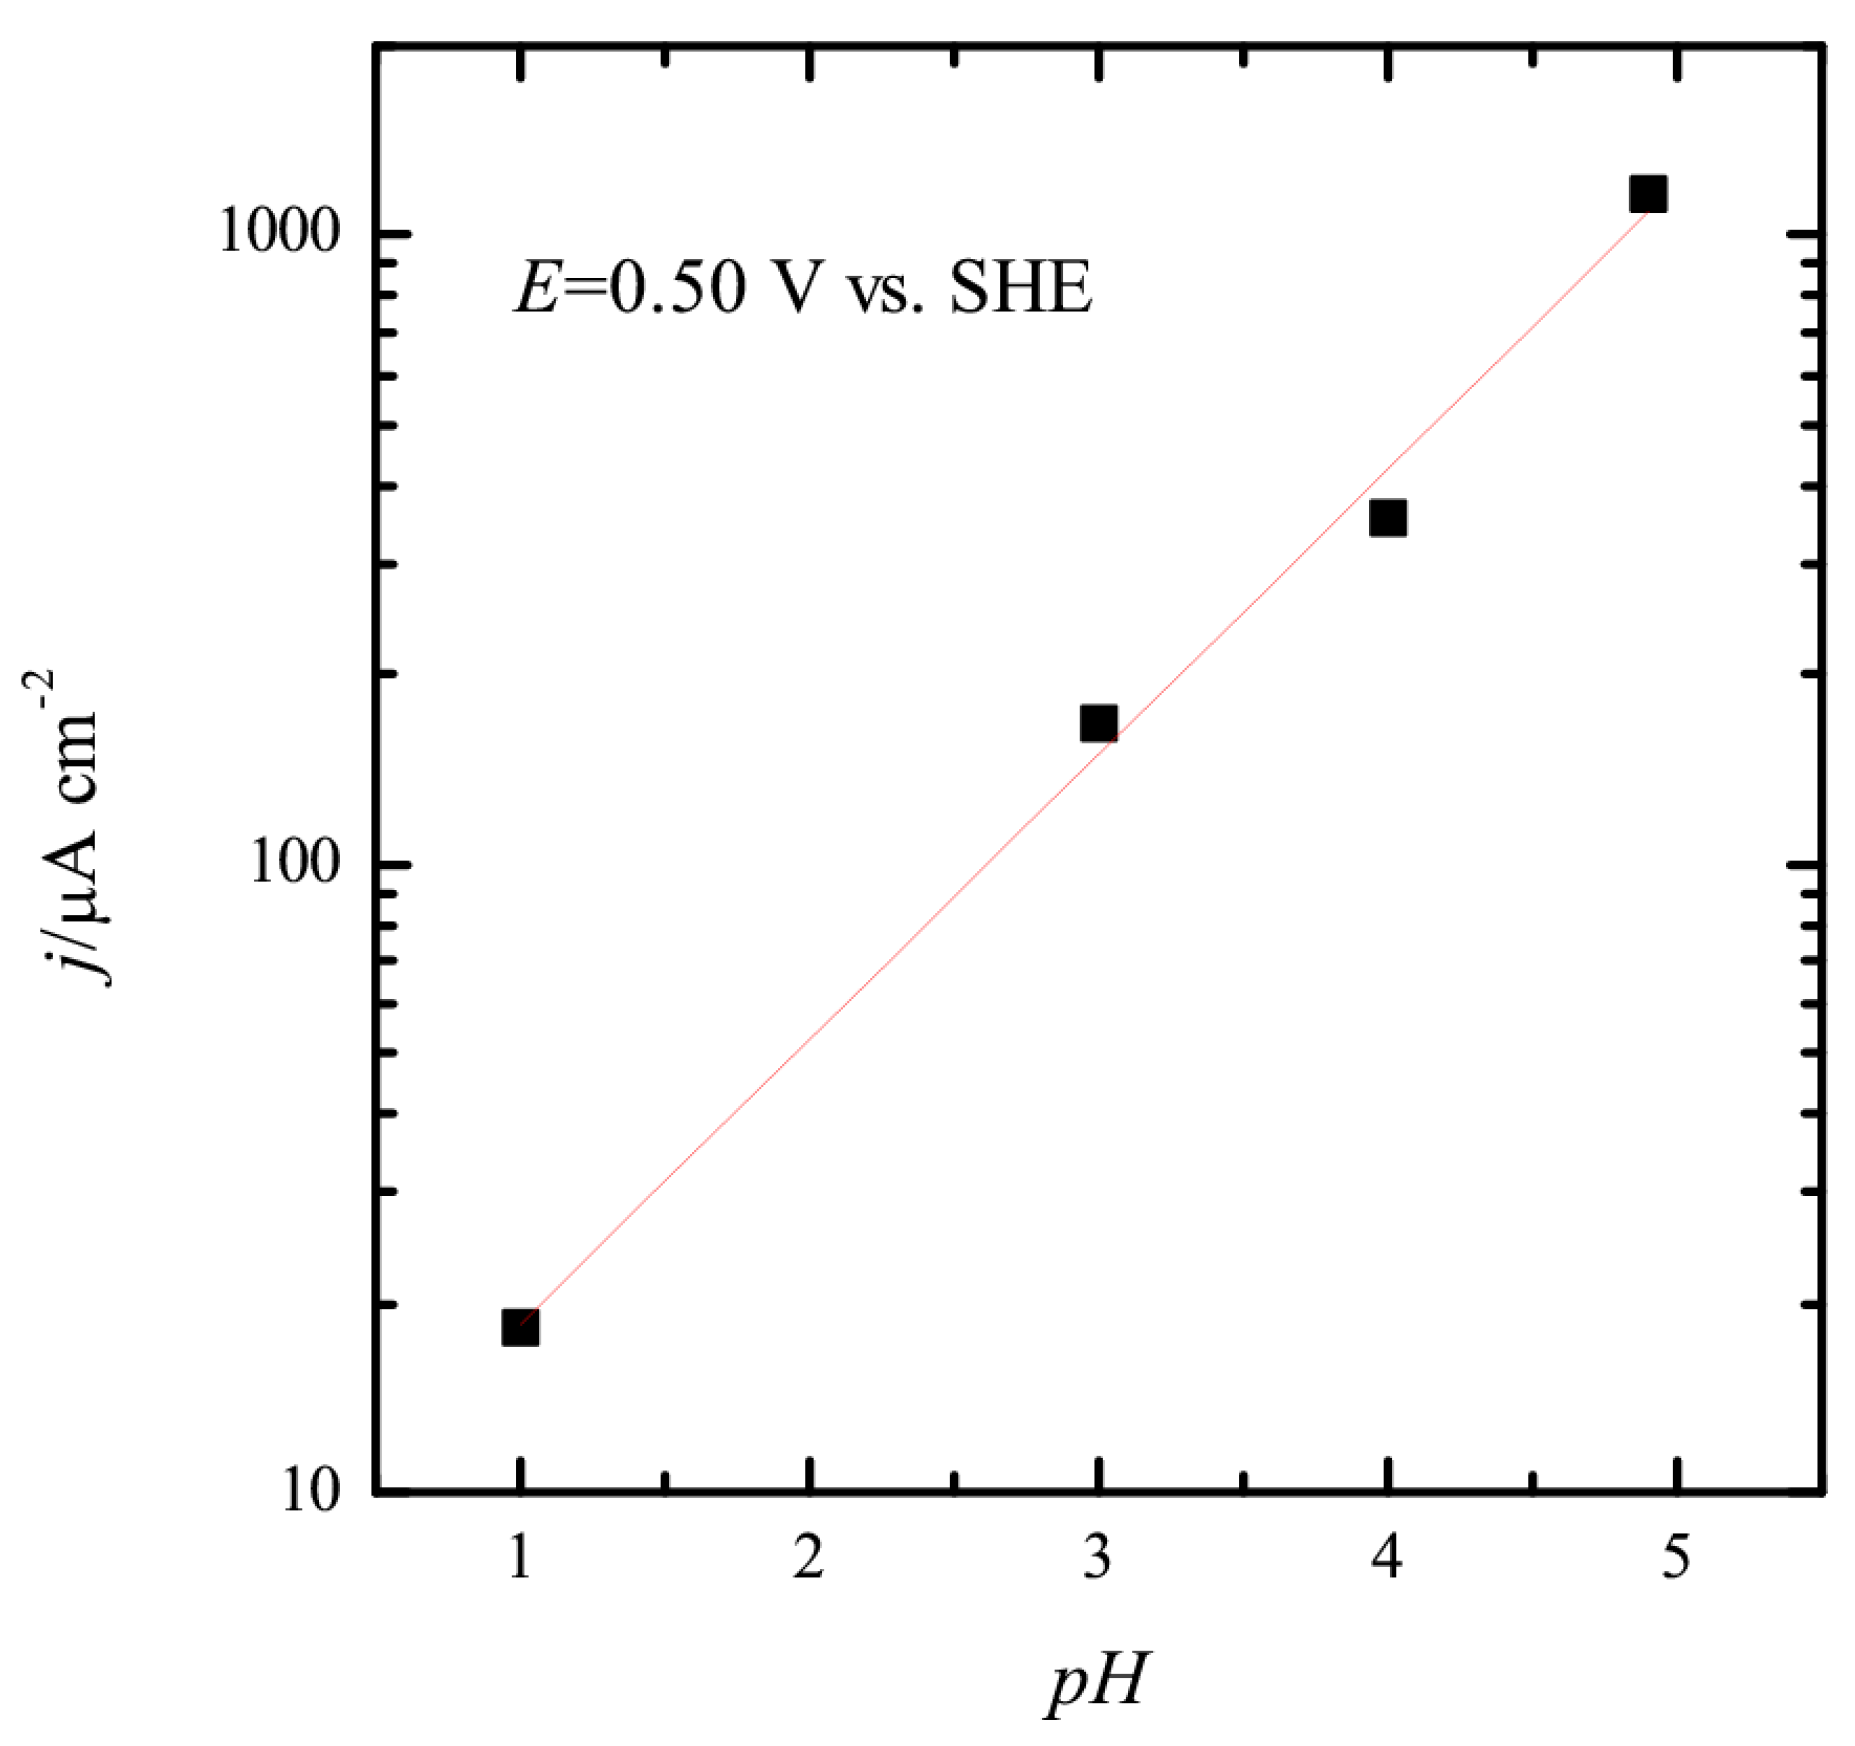
3.1. Pt(111) Electrode
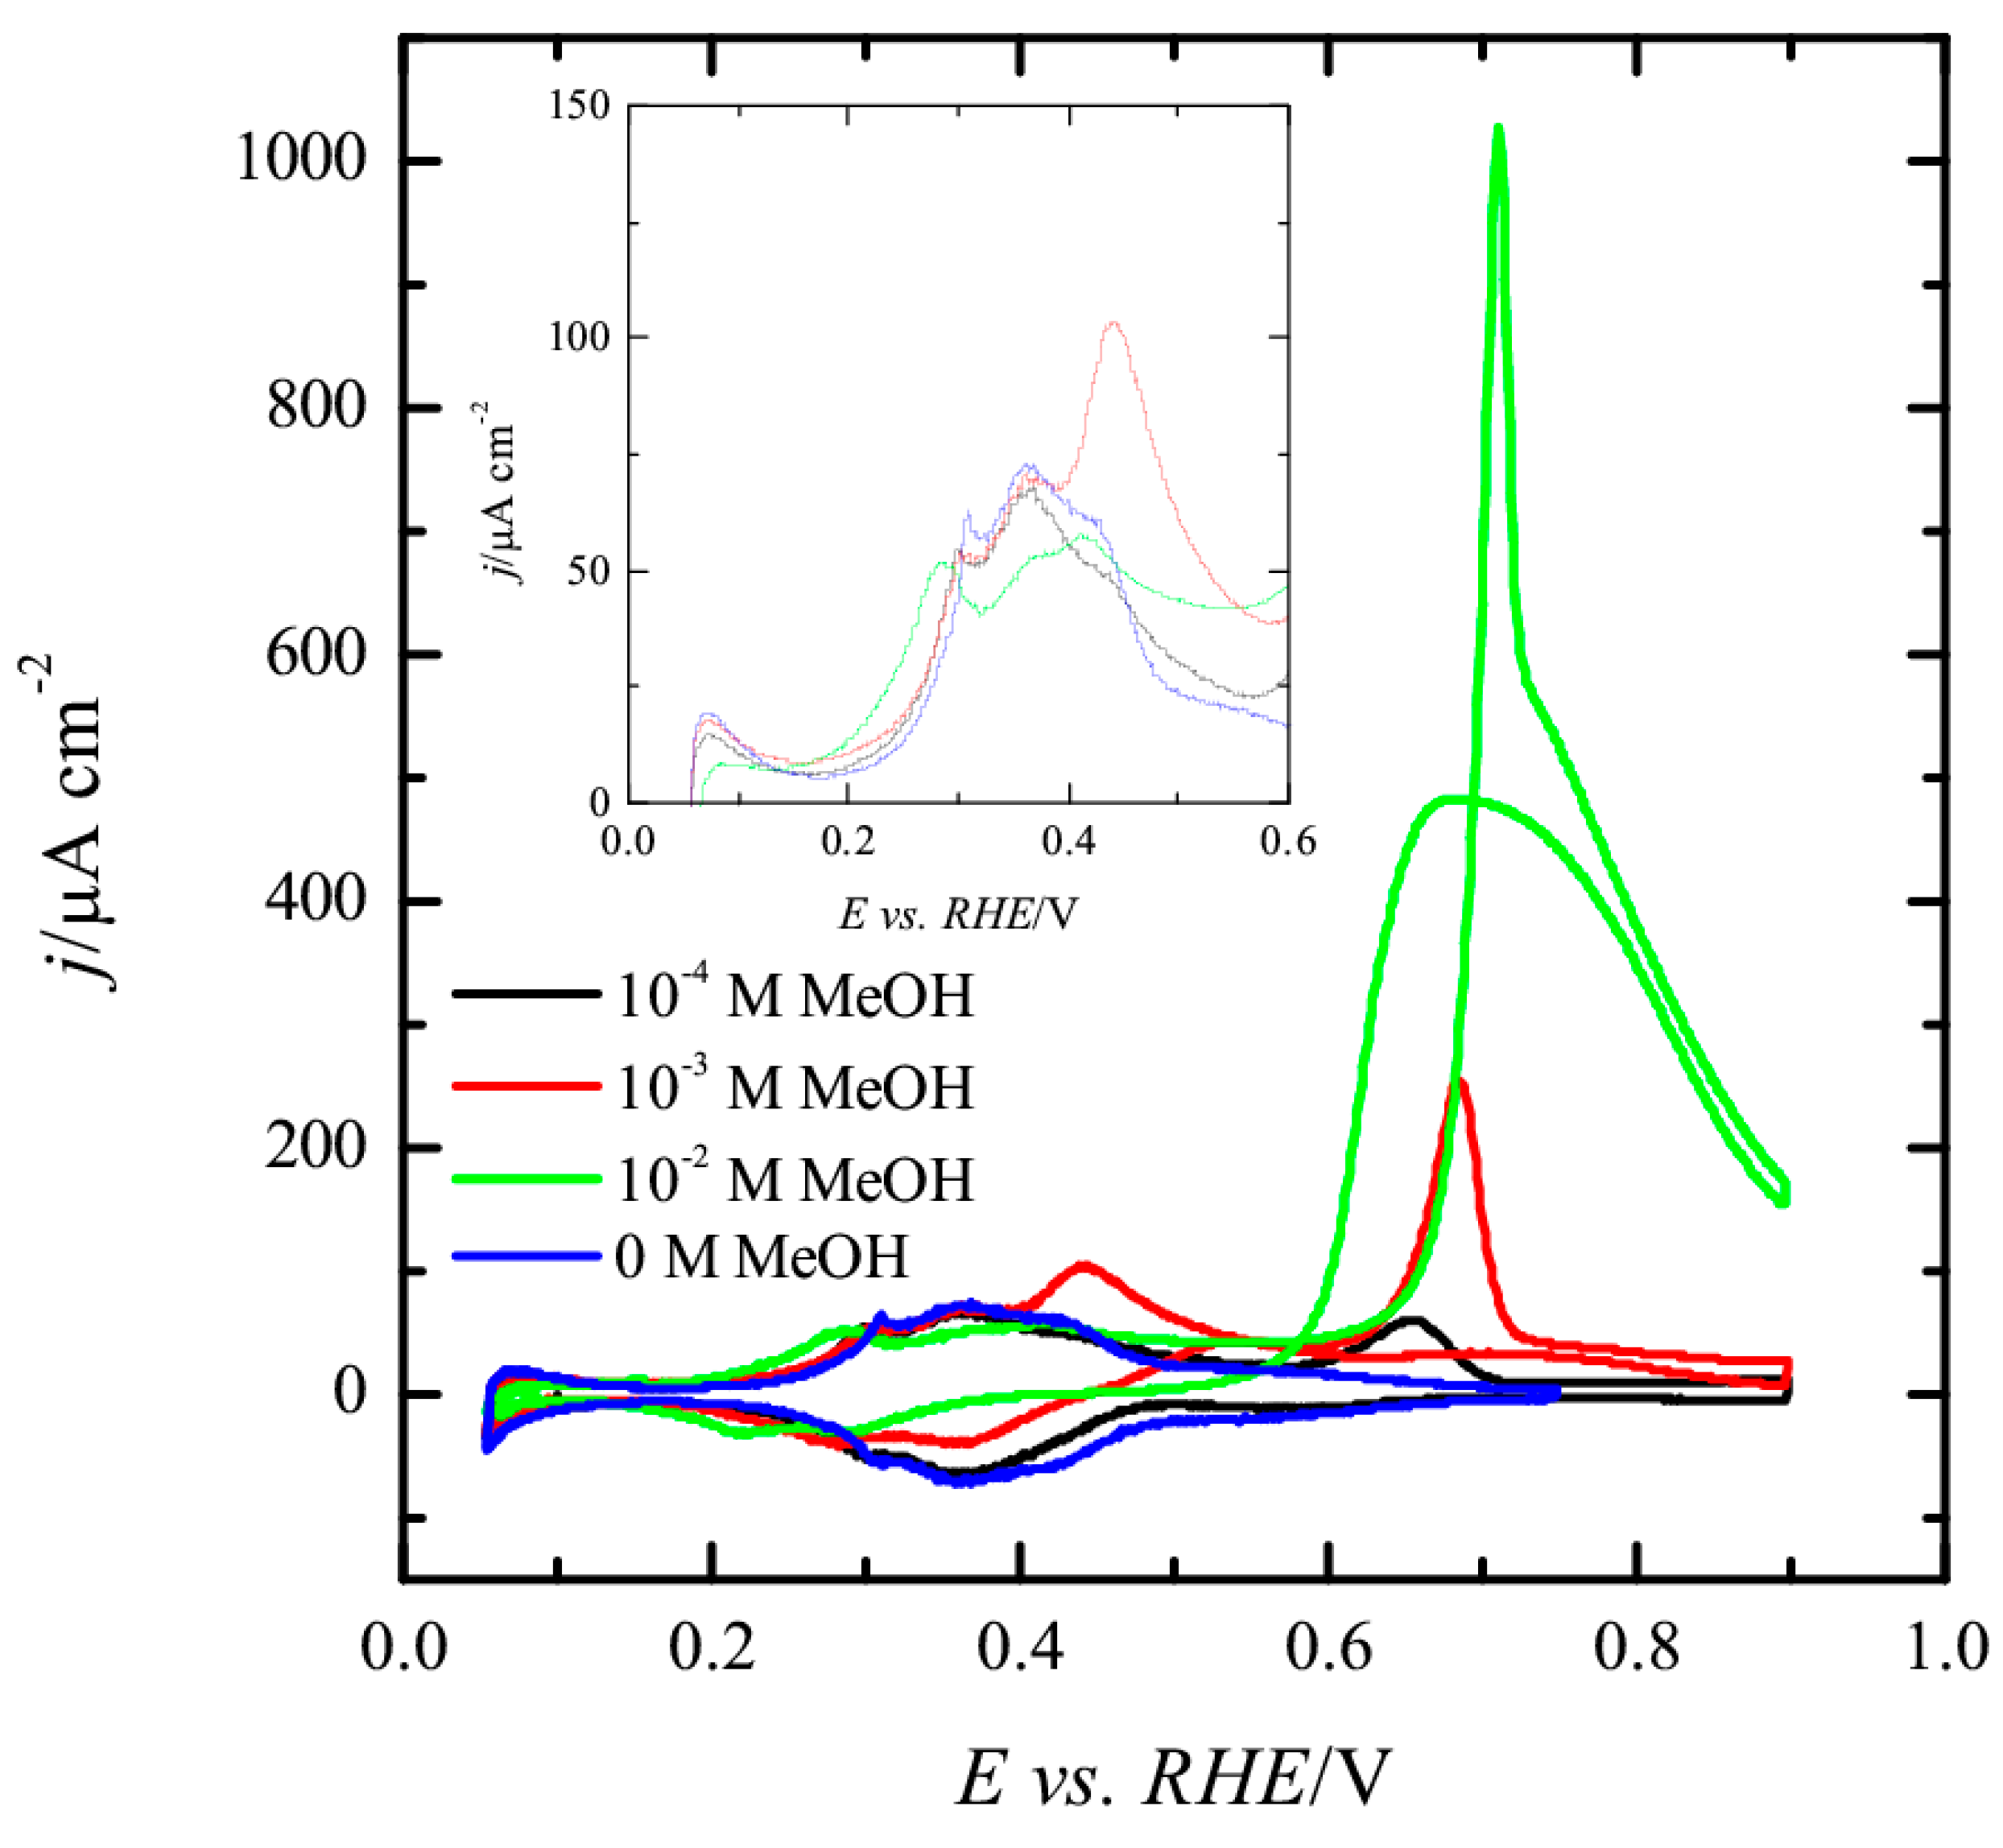
3.2. Pt(100) and Pt(110) Electrodes
4. Conclusions
Author Contributions
Funding
Conflicts of Interest
References
- Parsons, R.; Vandernoot, T. The oxidation of small organic molecules: A survey of recent fuel cell related research. J. Electroanal. Chem. 1988, 257, 9–45. [Google Scholar] [CrossRef]
- Sriramulu, S.; Javi, T.D.; Stuve, E.M. Kinetic Modeling of Electrocatalytic Reactions: Methanol Oxidation on Platinum Electrodes. In Interfacial Electrochemistry, Theory, Experiments and Applications; Wieckowski, A., Ed.; Marcel Dekker: New York, NY, USA, 1998; p. 793. [Google Scholar]
- Iwasita, T. Electrocatalysis of methanol oxidation (vol 47, pg 3663, 2001). Electrochim. Acta 2002, 48, 289. [Google Scholar] [CrossRef]
- Markovic, N.M.; Ross, P.N. Surface science studies of model fuel cell electrocatalysts. Surf. Sci. Rep. 2002, 45, 117–229. [Google Scholar] [CrossRef]
- Koper, M.T.M.T.M.; Lai, S.C.C.S.; Herrero, E. Mechanisms of the Oxidation of Carbon Monoxide and Small Organic Molecules at Metal Electrodes. In Fuel Cell Catalysis: A Surface Science Approach; Koper, M.T.M., Ed.; John Wiley & Sons, Inc.: Hoboken, NJ, USA, 2009; pp. 166–171. ISBN 978-0-470-13116-9. [Google Scholar]
- Cohen, J.L.; Volpe, D.J.; Abruna, H.D. Electrochemical determination of activation energies for methanol oxidation on polycrystalline platinum in acidic and alkaline electrolytes. Phys. Chem. Chem. Phys. 2007, 9, 49–77. [Google Scholar] [CrossRef] [PubMed]
- Neurock, M.; Janik, M.; Wieckowski, A. A first principles comparison of the mechanism and site requirements for the electrocatalytic oxidation of methanol and formic acid over Pt. Faraday Discuss. 2009, 140, 363–378. [Google Scholar] [CrossRef]
- Clavilier, J.; Lamy, C.; Leger, J.M. Electrocatalytic Oxidation of Methanol on Single-Crystal Platinum-Electrodes—Comparison with Polycrystalline Platinum. J. Electroanal. Chem. 1981, 125, 249–254. [Google Scholar] [CrossRef]
- Lamy, C.; Leger, J.M.; Clavilier, J.; Parsons, R. Structural effects in electrocatalysis: A comparative study of the oxidation of CO, HCOOH and CH3OH on single crystal Pt electrodes. J. Electroanal. Chem. 1983, 150, 71–77. [Google Scholar] [CrossRef]
- Franaszczuk, K.; Herrero, E.; Zelenay, P.; Wieckowski, A.; Wang, J.; Masel, R.I.I. A comparison of electrochemical and gas-phase decomposition of methanol on platinum surfaces. J. Phys. Chem. 1992, 96, 8509–8516. [Google Scholar] [CrossRef]
- Herrero, E.; Franaszczuk, K.; Wieckowski, A. Electrochemistry of methanol at low index crystal planes of platinum. An integrated voltammetric and chronoamperometric study. J. Phys. Chem. 1994, 98, 5074–5083. [Google Scholar] [CrossRef]
- Housmans, T.H.M.; Koper, M.T.M. Methanol oxidation on stepped Pt n(111) x (110) electrodes: A chronoamperometric study. J. Phys. Chem. B 2003, 107, 8557–8567. [Google Scholar] [CrossRef]
- Lai, S.C.S.; Lebedeva, N.P.; Housmans, T.H.M.; Koper, M.T.M. Mechanisms of carbon monoxide and methanol oxidation at single-crystal electrodes. Top. Catal. 2007, 46, 320–333. [Google Scholar] [CrossRef]
- Grozovski, V.; Climent, V.; Herrero, E.; Feliu, J.M. The role of the surface structure in the oxidation mechanism of methanol. J. Electroanal. Chem. 2011, 662, 43–51. [Google Scholar] [CrossRef]
- Martínez-Hincapié, R.; Sebastián-Pascual, P.; Climent, V.; Feliu, J.M. Exploring the interfacial neutral pH region of Pt(111) electrodes. Electrochem. Commun. 2015, 58, 62–64. [Google Scholar] [CrossRef]
- Sebastián, P.; Martínez-Hincapié, R.; Climent, V.; Feliu, J.M. Study of the Pt(111) | electrolyte interface in the region close to neutral pH solutions by the laser induced temperature jump technique. Electrochim. Acta 2017, 228, 667–676. [Google Scholar] [CrossRef]
- Clavilier, J.; Faure, R.; Guinet, G.; Durand, R. Preparation of monocrystalline Pt microelectrodes and electrochemical study of the plane surfaces cut in the direction of the {111} and {110} planes. J. Electroanal. Chem. 1980, 107, 205–209. [Google Scholar] [CrossRef]
- Korzeniewski, C.; Climent, V.; Feliu, J. Electrochemistry at Platinum Single Crystal Electrodes. In Electroanalytical Chemistry A Series of Advances: Volume 24; CRC Press: Boca Raton, FL, USA, 2011; pp. 75–170. ISBN 978-1-4398-3750-4. [Google Scholar]
- Clavilier, J.; Elachi, K.; Petit, M.; Rodes, A.; Zamakhchari, M.A. Electrochemical Monitoring of the Thermal Reordering of Platinum Single-Crystal Surfaces after Metallographic Polishing from the Early Stage to the Equilibrium Surfaces. J. Electroanal. Chem. 1990, 295, 333–356. [Google Scholar] [CrossRef]
- Herrero, E.; Orts, J.M.; Aldaz, A.; Feliu, J.M. Scanning tunneling microscopy and electrochemical study of the surface structure of Pt(10,10,9) and Pt(11,10,10) electrodes prepared under different cooling conditions. Surf. Sci. 1999, 440, 259–270. [Google Scholar] [CrossRef]
- García-Aráez, N.; Climent, V.; Herrero, E.; Feliu, J.M. On the electrochemical behavior of the Pt(1 0 0) vicinal surfaces in bromide solutions. Surf. Sci. 2004, 560, 269–284. [Google Scholar] [CrossRef]
- Markovic, N.M.; Grgur, B.N.; Lucas, C.A.; Ross, P.N. Surface electrochemistry of CO on Pt(110)-(1x2) and Pt(110)-(1x1) surfaces. Surf. Sci. 1997, 384, L805–L814. [Google Scholar] [CrossRef]
- Attard, G.A.; Hunter, K.; Wright, E.; Sharman, J.; Martínez-Hincapié, R.; Feliu, J.M. The voltammetry of surfaces vicinal to Pt{110}: Structural complexity simplified by CO cooling. J. Electroanal. Chem. 2017, 793, 137–146. [Google Scholar] [CrossRef]
- Herrero, E.; Wieckowski, A. Electrochemistry of Methanol at Low Index Crystal Planes. J. Phys. Chem. 1994, 98, 5074–5083. [Google Scholar] [CrossRef]
- Berna, A.; Climent, V.; Feliu, J.M. New understanding of the nature of OH adsorption on Pt(111) electrodes. Electrochem. Commun. 2007, 9, 2789–2794. [Google Scholar] [CrossRef]
- Angelucci, C.A.C.A.; Herrero, E.; Feliu, J.M.J.M. Modeling CO oxidation on Pt(111) electrodes. J. Phys. Chem. C 2010, 114, 14154–14163. [Google Scholar] [CrossRef]
- Housmans, T.H.M.; Wonders, A.H.; Koper, M.T.M. Structure Sensitivity of Methanol Electrooxidation Pathways on Platinum: An On-Line Electrochemical Mass Spectrometry Study. J. Phys. Chem. B 2006, 110, 10021–10031. [Google Scholar] [CrossRef] [PubMed]
- Herrero, E.; Fernández-Vega, A.; Feliu, J.M.; Aldaz, A. Poison formation reaction from formic acid and methanol on Pt(111) electrodes modified by irreversibly adsorbed Bi and As. J. Electroanal. Chem. 1993, 350, 73–88. [Google Scholar] [CrossRef]
- Grozovski, V.; Vidal-Iglesias, F.J.; Herrero, E.; Feliu, J.M. Adsorption of formate and its role as intermediate in formic acid oxidation on platinum electrodes. ChemPhysChem 2011, 12, 1641–1644. [Google Scholar] [CrossRef] [PubMed]
- Grozovski, V.; Climent, V.; Herrero, E.; Feliu, J.M. Intrinsic activity and poisoning rate for HCOOH oxidation on platinum stepped surfaces. Phys. Chem. Chem. Phys. 2010, 12, 8822. [Google Scholar] [CrossRef] [PubMed]
- Perales-Rondón, J.V.; Herrero, E.; Feliu, J.M. Effects of the anion adsorption and pH on the formic acid oxidation reaction on Pt(111) electrodes. Electrochim. Acta 2014, 140, 511–517. [Google Scholar] [CrossRef]
- Batista, E.A.; Malpass, G.R.P.; Motheo, A.J.; Iwasita, T. New mechanistic aspects of methanol oxidation. J. Electroanal. Chem. 2004, 571, 273–282. [Google Scholar] [CrossRef]
- Abd-El-Latif, A.A.; Baltruschat, H. Formation of methylformate during methanol oxidation revisited: The mechanism. J. Electroanal. Chem. 2011, 662, 204–212. [Google Scholar] [CrossRef]
- Mostafa, E.; Abd-El-Latif, A.E.A.A.; Baltruschat, H. Electrocatalytic oxidation and adsorption rate of methanol at Pt stepped single-crystal electrodes and effect of Ru step decoration: A DEMS study. ChemPhysChem 2014, 15, 2029–2043. [Google Scholar] [CrossRef] [PubMed]
- Ferre-Vilaplana, A.; Perales-Rondón, J.V.V.; Buso-Rogero, C.; Feliu, J.M.M.; Herrero, E. Formic acid oxidation on platinum electrodes: A detailed mechanism supported by experiments and calculations on well-defined surfaces. J. Mater. Chem. A 2017, 5, 21773–21784. [Google Scholar] [CrossRef]
- Ferre-Vilaplana, A.; Perales-Rondón, J.V.; Feliu, J.M.J.M.; Herrero, E.; Perales-Rondón, J.V.; Feliu, J.M.J.M.; Herrero, E. Understanding the effect of the adatoms in the formic acid oxidation mechanism on Pt(111) electrodes. ACS Catal. 2015, 5, 645–654. [Google Scholar] [CrossRef]
- Bergelin, M.; Herrero, E.; Feliu, J.M.M.; Wasberg, M. Oxidation of CO adlayers on Pt(111) at low potentials: An impinging jet study in H2SO4 electrolyte with mathematical modeling of the current transients. J. Electroanal. Chem. 1999, 467, 74–84. [Google Scholar] [CrossRef]
- Lebedeva, N.P.; Rodes, A.; Feliu, J.M.; Koper, M.T.M.; van Santen, R.A. Role of crystalline defects in electrocatalysis: CO adsorption and oxidation on stepped platinum electrodes as studied by in situ infrared spectroscopy. J. Phys. Chem. B 2002, 106, 9863–9872. [Google Scholar] [CrossRef]
- Rizo, R.; Sitta, E.; Herrero, E.; Climent, V.; Feliu, J.M.J.M. Towards the understanding of the interfacial pH scale at Pt(111) electrodes. Electrochim. Acta 2015, 162, 138–145. [Google Scholar] [CrossRef]
- Vidal-Iglesias, F.J.; Arán-Ais, R.M.; Solla-Gullón, J.; Herrero, E.; Feliu, J.M. Electrochemical characterization of shape-controlled Pt nanoparticles in different supporting electrolytes. ACS Catal. 2012, 2, 901–910. [Google Scholar] [CrossRef]
- Briega-Martos, V.; Herrero, E.; Feliu, J.M.J.M. Effect of pH and Water Structure on the Oxygen Reduction Reaction on platinum electrodes. Electrochim. Acta 2017, 241, 497–509. [Google Scholar] [CrossRef]
- Gamboa-Aldeco, M.E.; Herrero, E.; Zelenay, P.S.; Wieckowski, A. Adsorption of bisulfate anion on a Pt(100) electrode: A comparison with Pt(111) and Pt(poly). J. Electroanal. Chem. 1993, 348, 451–457. [Google Scholar] [CrossRef]
- Climent, V.; Gómez, R.; Orts, J.M.; Feliu, J.M. Thermodynamic analysis of the temperature dependence of OH adsorption on Pt(111) and Pt(100) electrodes in acidic media in the absence of specific anion adsorption. J. Phys. Chem. B 2006, 110, 11344–11351. [Google Scholar] [CrossRef]
- Souza-Garcia, J.; Climent, V.; Feliu, J.M. Voltammetric characterization of stepped platinum single crystal surfaces vicinal to the (110) pole. Electrochem. Commun. 2009, 11, 1515–1518. [Google Scholar] [CrossRef]
- Gómez, R.; Orts, J.M.; Alvarez-Ruiz, B.; Feliu, J.M. Effect of temperature on hydrogen adsorption on Pt(111), Pt(110), and Pt(100) electrodes in 0.1 M HClO4. J. Phys. Chem. B 2004, 108, 228–238. [Google Scholar] [CrossRef]
- Herrero, E.; Feliu, J.M.; Aldaz, A. Poison formation reaction from formic acid on Pt(100) electrodes modified by irreversibly adsorbed bismuth and antimony. J. Electroanal. Chem. 1994, 368, 101–108. [Google Scholar] [CrossRef]
- Arán-Ais, R.M.; Figueiredo, M.C.; Vidal-Iglesias, F.J.; Climent, V.; Herrero, E.; Feliu, J.M. On the behavior of the Pt(1 0 0) and vicinal surfaces in alkaline media. Electrochim. Acta 2011, 58, 184–192. [Google Scholar] [CrossRef]


© 2019 by the authors. Licensee MDPI, Basel, Switzerland. This article is an open access article distributed under the terms and conditions of the Creative Commons Attribution (CC BY) license (http://creativecommons.org/licenses/by/4.0/).
Share and Cite
Kamyabi, M.A.; Martínez-Hincapié, R.; Feliu, J.M.; Herrero, E. Effects of the Interfacial Structure on the Methanol Oxidation on Platinum Single Crystal Electrodes. Surfaces 2019, 2, 177-192. https://doi.org/10.3390/surfaces2010014
Kamyabi MA, Martínez-Hincapié R, Feliu JM, Herrero E. Effects of the Interfacial Structure on the Methanol Oxidation on Platinum Single Crystal Electrodes. Surfaces. 2019; 2(1):177-192. https://doi.org/10.3390/surfaces2010014
Chicago/Turabian StyleKamyabi, Mohammad Ali, Ricardo Martínez-Hincapié, Juan M. Feliu, and Enrique Herrero. 2019. "Effects of the Interfacial Structure on the Methanol Oxidation on Platinum Single Crystal Electrodes" Surfaces 2, no. 1: 177-192. https://doi.org/10.3390/surfaces2010014
APA StyleKamyabi, M. A., Martínez-Hincapié, R., Feliu, J. M., & Herrero, E. (2019). Effects of the Interfacial Structure on the Methanol Oxidation on Platinum Single Crystal Electrodes. Surfaces, 2(1), 177-192. https://doi.org/10.3390/surfaces2010014