Article

Problems of Dating Petroglyphs Using Measurements of Manganese Accumulation in Rock Varnish: New Research Findings and Their Implications


1
School of Geographical Sciences & Urban Planning, Arizona State University, Tempe, AZ 85287, USA
2
Rock Art Research Institute, University of the Witwatersrand, Johannesburg 2017, South Africa
*
Author to whom correspondence should be addressed.
Heritage 2026, 9(8), 329; https://doi.org/10.3390/heritage9080329
Submission received: 10 July 2026 / Revised: 4 August 2026 / Accepted: 18 August 2026 / Published: 19 August 2026

Abstract

Recent attempts at petroglyph dating have focused on measuring the manganese accumulation in the rock varnish coating that develops in a motif groove after it was engraved, under the assumption that this amount is systematically related to age. These efforts reflect the basic need for chronological control for both heritage management and research purposes. Despite the wide availability of portable X-ray fluorescence devices and their ability to take non-destructive field measurements of manganese, these applications have not examined the nature or location of the manganese being analyzed. We employ a mixture of electron microscope methods on samples of petroglyphs obtained from prior investigations of petroglyphs to assess this problem. Results reveal that significant amounts of manganese associated with petroglyphs derive from sources other than the post-engraving rock varnish coating, including the weathering rinds underlying varnish, isolated patches of inherited varnish that were not completely removed during petroglyph engraving, and silica glazes. Significant amounts of manganese also may be removed by microcolonial fungi that, in our samples, dissolve between 22 and 60% of a rock varnish coating. Until the manganese accumulation petroglyph dating approach is able to distinguish manganese subtractions from acid-producing fungi and additions from non-varnish sources from varnish sources, it cannot provide reliable age estimates.

1. Introduction

Few archaeological problems have proven more intractable than dating petroglyphs (rock engravings), despite their widespread occurrence in many dryland regions, their importance to Indigenous peoples, the need for chronometric control for heritage management purposes, and their potential for providing a nuanced perspective on the Precontact past (e.g., [1]). As noted by Chaloupka et al. [2], speaking to this problem globally:
“Studies of prehistoric art are presently marginal to archaeology because, with few exceptions, we can’t date it and so we cannot firmly correlate it with our increasingly detailed archaeological records. If we are to incorporate this most valuable artefactual material into mainstream archaeological reconstruction, we must learn how to date it reliably”
[2]
Substantial research on rock art chronometric techniques has been conducted over the last few decades as a result. Yet, despite this fact, “dating rock art remains a considerable challenge” [3]. The broader problem recognized by archaeologists is that petroglyph surfaces are subject to a variety of chemical, biological, and physical weathering processes that change a rock art surface. Furthermore, these processes change over time as climate and environmental changes occur.
While chronometric techniques using physical samples that provide calendrical (“absolute”) ages have been developed in the last few decades (e.g., [4,5]), these all have drawbacks, including destructive sampling, high cost, and the specialized expertise required for sampling and analysis. A common (and practical) outcome has been to deploy all potential correlative and relative dating approaches for many projects (e.g., [3,6,7,8,9,10,11]), directed towards identifying the most likely chronology.
An evaluation of the darkening of petroglyphs, due to the manganese (Mn) accumulation in rock varnish coatings, has long been one often-utilized relative age estimation strategy for petroglyphs (e.g., [12,13]). Based on the development and availability of portable X-ray fluorescence (pXRF) spectrometry instruments, a number of recent researchers have attempted to use these devices to obtain calendrical ages by measuring the Mn accumulation in rock varnish in petroglyph grooves, given the ubiquitous nature of this accretive rock coating in deserts. Based on their analyses, pXRF proponents have assigned provisional ages to petroglyphs from the Colorado Plateau [14], Great Basin [15,16,17,18,19,20], Saudi Arabia [21,22], Israel [23], and Africa [24]. The pXRF approach has a number of advantages, including the widespread availability of the instruments, the ability to obtain numerous non-destructive measurements in the field, and the relatively low cost and minimal training required for their use. Yet despite its apparent potential, there are technical issues in pXRF petroglyph dating that have not yet been adequately resolved.
Almost a half-century ago, in fact, Bard [25] removed rock varnish via scraping from Nevada petroglyphs and adjacent natural surfaces and then analyzed the removed varnish using neutron activation analysis. One of Bard’s hypotheses was that the buildup of Mn would yield a time signal usable to date varnish. He found no systematic relationship between the age of a rock varnish coating and its Mn content.
We examine here certain implicit assumptions of the pXRF approach. As indicated above, the primary assumption is that Mn systematically accumulates in rock varnish over time, allowing it to be used to assign specific ages to petroglyphs. A related assumption is that the pXRF instrument yields accurate measurements of varnish Mn from the surface of a coating to a depth “of the order of a few tens to hundreds of microns” ([20]: 7).
Our research findings, described below, using samples collected during our prior petroglyph investigations and employing a mixture of electron microscope methods, indicate the following:
  • Substantial amounts of Mn may be dissolved in rock varnish coatings by biological processes, reducing the potential amount of Mn that may be present.
  • Mn measured in petroglyph grooves may partly derive from a variety of non-varnish sources, potentially yielding combined pXRF measurements from multiple sources, adding non-varnish Mn to a reading.
  • The measurement of Mn from “freshly exposed bare rock substrates” [20], used as a correction factor for the petroglyph readings, necessarily yields incorrect results.
These results pose challenges for the use of pXRF measurements of Mn accumulation as a chronometric tool.

2. Methods

2.1. Background

Petroglyphs in arid regions are manufactured by pecking away or incising the surface layer of a rock. This can include existing rock coatings, but often not the underlying decayed zone of rock material called a weathering rind. Rock coatings are added material, whereas weathering rinds are degraded original rock surfaces. There are many different types of rock coatings, such as silica glazes comprised of mostly amorphous silica, and lithobionts such as microcolonial fungi [26]. A common rock coating that accumulates on petroglyphs, however, is rock varnish—a paper-thin, dark accretionary coating of mostly clay, Mn, and iron (Fe) that builds up on the rock surface over time [27]. In contrast, weathering rinds are chemically altered, discolored, and porous zones of weakened rock that progressively develop inward into the rock as minerals dissolve [28]. Although these develop on rock surfaces, remnants of original weathering rinds are ubiquitous under petroglyph grooves coated with rock varnish, as we discuss below. Note that rock varnish is sometimes, incorrectly, referred to as “patina”, which, strictly, is a kind of weathering rind.
The darkening coloring agent in rock varnish is the Mn that accumulates via the action of budding bacteria [29]. The dust that falls on petroglyphs contains clay minerals that are cemented to rock surfaces by nanometer-sized bits of the Mn [26,29]. The Mn in varnish can also be dissolved, most often through the action of acid-producing organisms like microcolonial fungi that commonly grow on petroglyphs [29,30,31,32].
In this study, we examined four natural conditions and processes that may affect the efficacy of pXRF measurements of Mn accumulation in a rock varnish coating as a systematic time signal, as outlined hereafter. We note at the outset that we analyzed existing samples which we had collected for previous research for this current examination. This was warranted given the destructive nature of the mechanical removal of rock varnish necessary for our analyses, and the resulting reluctance of Indigenous tribal stakeholders to approve of such an effort when archived samples were available for study. With one exception, our samples are all from petroglyphs. Given that only certain specimens were appropriate for each respective type of analysis, this limited our sample sizes to only a handful of cases for two out of the four of our cases. Our other two analyses both involved more than 30 samples each. We explain the rationale for our sample selection for each independent concern below. Given the small sample sizes overall, however, our results should be considered preliminary for this reason.

2.2. Varnish Dissolution by Microcolonial Fungi

A variety of epilithic organisms may grow on top of rock varnish and dissolve it, reducing the original amount of Mn present in a coating. These organisms include lichens, cyanobacteria, algae, moss, and different types of fungi [29,30,31,32]. Microcolonial fungi (MCF) are the most prevalent of these on petroglyphs that we have examined [33,34,35,36,37,38]. Where Mn in rock varnish goes after it is dissolved by organic acids has not been determined, but since dissolution involves reducing Mn(IV) to Mn(II), overland flow from rainfall could certainly remove the Mn from the rock surface entirely.
To measure the percent of varnish dissolved by MCF on petroglyphs, we used secondary electron (SE) imagery that shows epilithic organisms in tandem with backscattered electron (BSE) imagery that shows varnish coatings [29,32] in polished cross-sections from five previously analyzed petroglyphs [33,34,35,36]. We quantified the presence of MCF in each sample by measuring (and proportionally calculating) the length of MCF growth in each, in a cross-sectional transect across each polished slide.
Using a cross-sectional transect to obtain quantitative data is commonly employed in a variety of natural science disciplines. For example, biogeographers and wildlife biologists commonly lay out 100 m transects to record every observation of relevance to their research, while archaeologists walk survey transects to identify sites. We employed the same approach here. We used a JEOL SEM at 15 keV to measure cross-sectional lengths where we could observe MCF growing on and dissolving the underlying varnish in each petroglyph.
We stress that this is a limited study based on just the few petroglyphs where we had sufficient SE and BSE imagery to obtain cumulative lengths over 5000 micrometers in our thin-section slides of rock varnish samples. This minimized the chance of bias in sampling, such as “cherry picking” examples in which MCF were more abundant.
The visible cumulative lengths of our examined thin sections were 5000 µm from Coso Range petroglyph CM-15; 7000 µm long from Fort Irwin FI-95-4; 10,000 µm from Fort Irwin FI-95-16; and 10,000 µm from the Cima Volcanic Field 1-1. Our measurements also include 20,000 µm of cross-sectional length from the Sonoran Desert, a landslide scar similar in width and depth to a petroglyph [37].
The cumulative lengths of each area of MCF varnish dissolution were totaled and divided by the total cross-section length observed. This provides a percent of varnish observed that has been dissolved by MCF for each of the samples.
We note that this approach potentially only generates minimum percentages of varnish dissolved by MCF. Some varnish patches may have experienced complete dissolution in the past, after which the MCF died off completely. In such cases, we do not know whether varnish was ever present because areas of completely dissolved varnish would not be visible or included in our measurements.

2.3. Patches of Original Varnish Not Removed by Petroglyph Manufacturing

Petroglyphs we examined were manufactured using a hammerstone to peck away a pre-existing natural surface, often with a dark, well-developed coating of rock varnish. This typically crude engraving process was intended to remove the existing dark rock coating to reveal the lighter-colored weathering rind below, with the resulting contrast helping to reveal a motif. But this process could result in small spots where portions of the original varnish coating were not completely removed, leaving patches of this older, inherited coating. These patches sometimes occur under the varnish layers that developed subsequently, after the petroglyph had been engraved, reflecting an incomplete removal of the original surface during pecking. Alternatively, they may be spots of the original surface that were entirely missed while a motif was being created. While the largest of these inherited, older varnish spots potentially may be visible to the naked eye (and thus can be avoided in sampling), many incompletely engraved patches that underlie subsequent varnish growth are only apparent through a microscopic examination of a thin section.
We used a JEOL SEM at 15 keV to obtain BSE imagery of polished cross-sections of four previously studied petroglyphs [33,35]. The BSE imagery was used to identify and quantify the abundance of older, inherited varnish present. This analysis is again limited to just a few petroglyphs where we had sufficient imagery to obtain thin-section cumulative lengths over 5000 micrometers, the same petroglyph transects used for analysis of MCF dissolution. The cumulative lengths of original varnish still present under petroglyph grooves subsequently coated with varnish were 5000 µm long for Coso petroglyph CM-15; 7000 µm for Fort Irwin FI-95-4; 10,000 µm from Fort Irwin FI-95-16; and 10,000 µm from Cima 1-1. Lengths with pre-existing original varnish were then converted into the percentage of each total length for that sample.
For example, we examined BSE imagery at magnifications ranging from 500× to 10,000× on the 5000 µm long section of the polished sample from Coso petroglyph CM-15 [34] to determine if any “inherited” varnish was present. The length of the cross-section containing the “inherited” varnish in this case was tabulated at 152 µm, or 3.04% (152 divided by 5000), rounded to the nearest percent.

2.4. Mn Within Silica Glaze

Silica glaze is a coating of mostly amorphous silica [26], and its color depends on the presence of its minor elements. Iron-infused silica glaze often has an orange luster. Silica glaze with calcium often appears white. Observations of Mojave Desert petroglyph samples [35] revealed that Mn occurs within non-varnish rock coatings associated with petroglyphs, and it is difficult to distinguish Mn-infused silica glaze from rock varnish in the field because, like rock varnish, it is also dark in color.
In the study of MCF and inherited varnish, we estimated their effect using cross-sectional observations of BSE imagery for sections that were 5000 µm or longer in size to avoid bias. We did not quantify the abundance of Mn found in silica glaze on petroglyphs in this analysis because there was no straightforward way to do so. Instead, we simply determined whether or not Mn-containing silica glaze was present or absent on a petroglyph, and therefore whether the presence of Mn could potentially alter a pXRF field measurement of Mn in a petroglyph coating.
We evaluated 35 Mojave Desert petroglyphs for the presence of Mn-containing silica glaze: 15 thin-section petroglyphs from Fort Irwin, 10 from the Cima Volcanic Field, and 10 from the Coso Range [35]. The method we used involved backscattered electron microscopy and energy-dispersive X-ray spectroscopy (EDS) with an electron microscope where the EDS analysis can determine the elemental chemistry of pockets of material infusing the silica glaze. We used a JEOL SEM at 15 keV. The sample sizes were typically petroglyph flakes less than a millimeter in diameter. Sample selection for this study involved 35 thin-section petroglyphs where EDS analyses had been completed on pockets infused with minor elements such as manganese, iron, and calcium.

2.5. Mn Within Weathering Rinds Under Petroglyphs

Weathering rinds are universally present under every petroglyph we have studied together (e.g., [33,34,35,36]) and separately (e.g., [39,40,41,42]). No petroglyph we have observed has been engraved on a truly “fresh” or “unweathered” rock surface. Substantiating this point, the authors of [43] wrote that there “are an estimated 1 million motifs across the [Murujuga’s Western Australian] archipelago, which are engraved into the weathering rind …” An example of their ubiquitous nature can be seen in the imagery within [44] and [45]. The most likely implication is that original weathering rinds are not completely pecked away when a petroglyph is created, but it is also possible that a subsequent weathering rind developed during the time-lag between motif creation and subsequent development of a significant varnish coating [38].
Weathering rinds, ubiquitous then under the rock varnish covering petroglyph grooves, contain voids that partially fill with Mn. The source of this Mn could pre-date petroglyph manufacturing, may derive from the dissolution of the original varnish (cf. [46]), or from Mn infiltrating into pores after the petroglyph was made.
We analyzed previously collected petroglyph samples with a JEOL JXA-8530F electron microprobe for quantitative analyses with wavelength-dispersive X-ray spectroscopy. These measurements provided data on elemental weight percent of Mg, Al, Si, P, K, Ca, Fe, and Mn. We focus here, however, only the elemental weight percent of Mn in 31 petroglyphs from the Mojave Desert [33,34], Wyoming [40], the Colorado Plateau [42], the Sonoran Desert [41,42], and South Australia [39]. The spot size of the electron microprobe ranged between 25 µm and 50 µm, depending on the size of the Mn-rich deposits in the weathering rind pore spaces themselves, providing us with a single Mn abundance measurement for each examined pore “deposit.” We analyzed either 20 or 30 such Mn-rich deposits in the weathering rinds within the upper 100 µm underneath each of the petroglyph surfaces; that is, within the depth range of a pXRF beam (cf. [20]). Each measurement provides data on the elemental weight percent of Mn present.

3. Results

3.1. Varnish Dissolution by Microcolonial Fungi

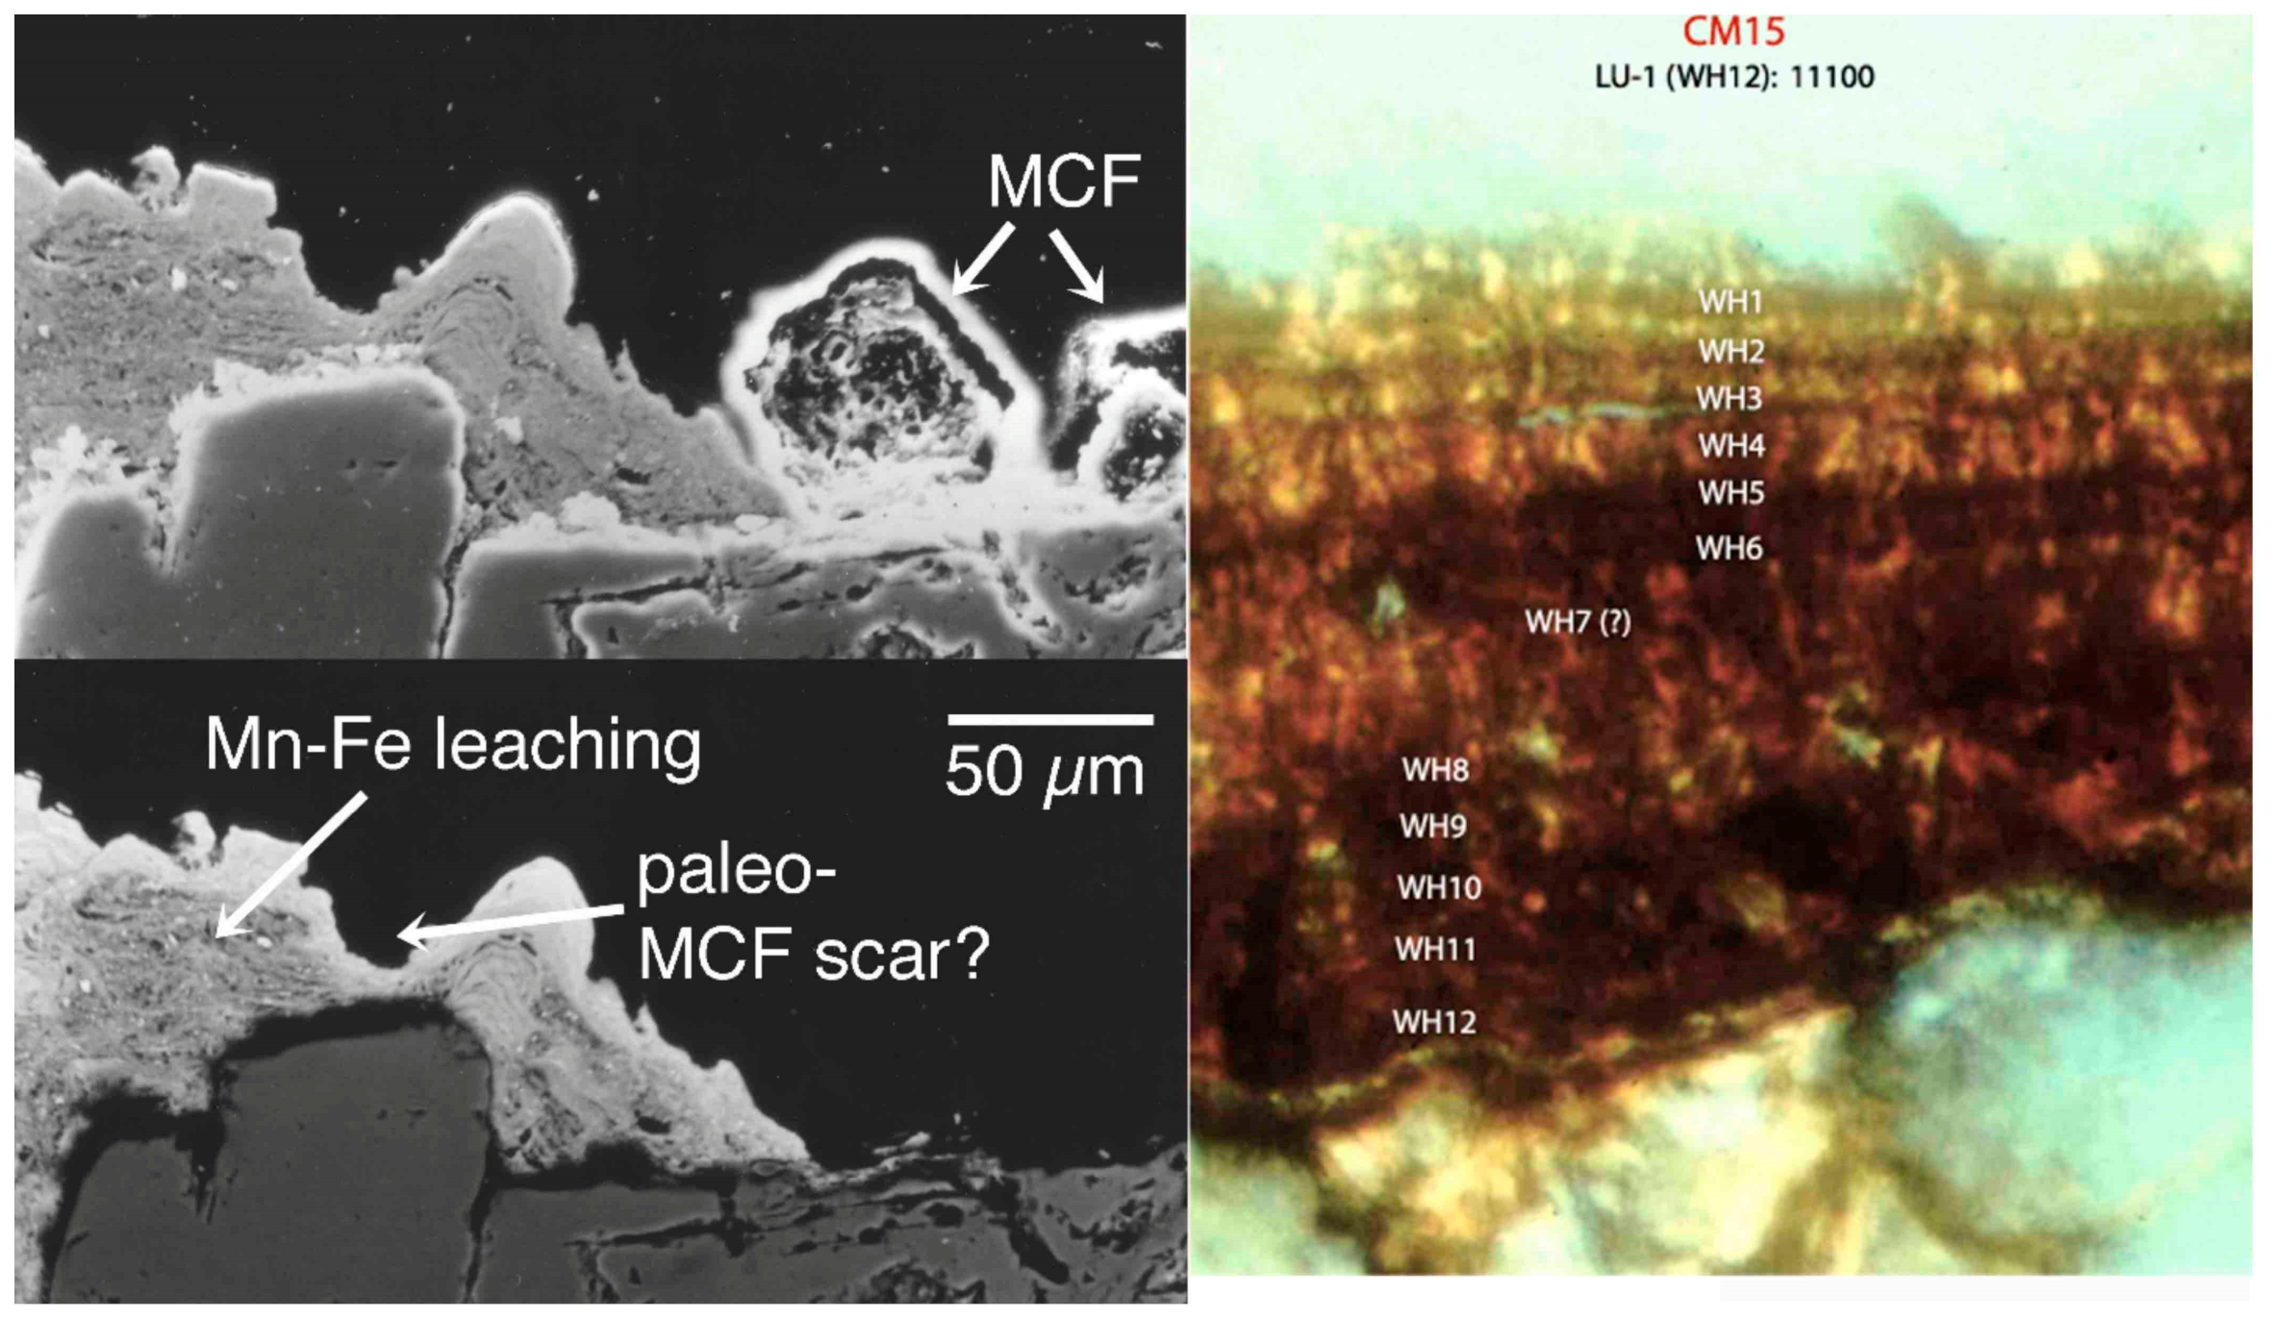
Figure 1 shows a small portion of the 5000 µm-long transect from Coso Range petroglyph CM-15. The SEM imagery in Figure 1 includes secondary electrons, showing the MCF’s presence, and backscattered electrons, showing just the varnish. The only portion of the varnish tabulated as dissolved in our calculations was that in which the MCF remained visibly present, comprising 110 µm of this cross-section. Based on our examination of the 5000 µm transect from Coso Range petroglyph sample CM-15, MCF dissolved 30% of the observed cross-section.
MCF dissolved 22%, 37%, 15%, and 60% of the rock varnish cross-sections that had formed in the other four petroglyphs analyzed from the Mojave and Sonoran deserts (Figure 1). We interpret these dissolution amounts as minimum values given that there are depressions within the varnish that could be scars from MCF that have completely died and are no longer visible. While it is likely that these voids in the rock varnish layers are the result of dissolution by MCF and then its subsequent death (paleo-MCF), we cannot be certain that this is the case in each example, and we have not included them in our tabulations.
The resulting key issue in this case is that the pXRF method cannot discriminate eroded varnish (left images in Figure 1) from continuously forming varnish (right image in Figure 1), because pXRF only measures elements and not whether the area under analysis is losing or accumulating Mn.

3.2. Patches of Original Varnish Not Removed by Petroglyph Manufacturing

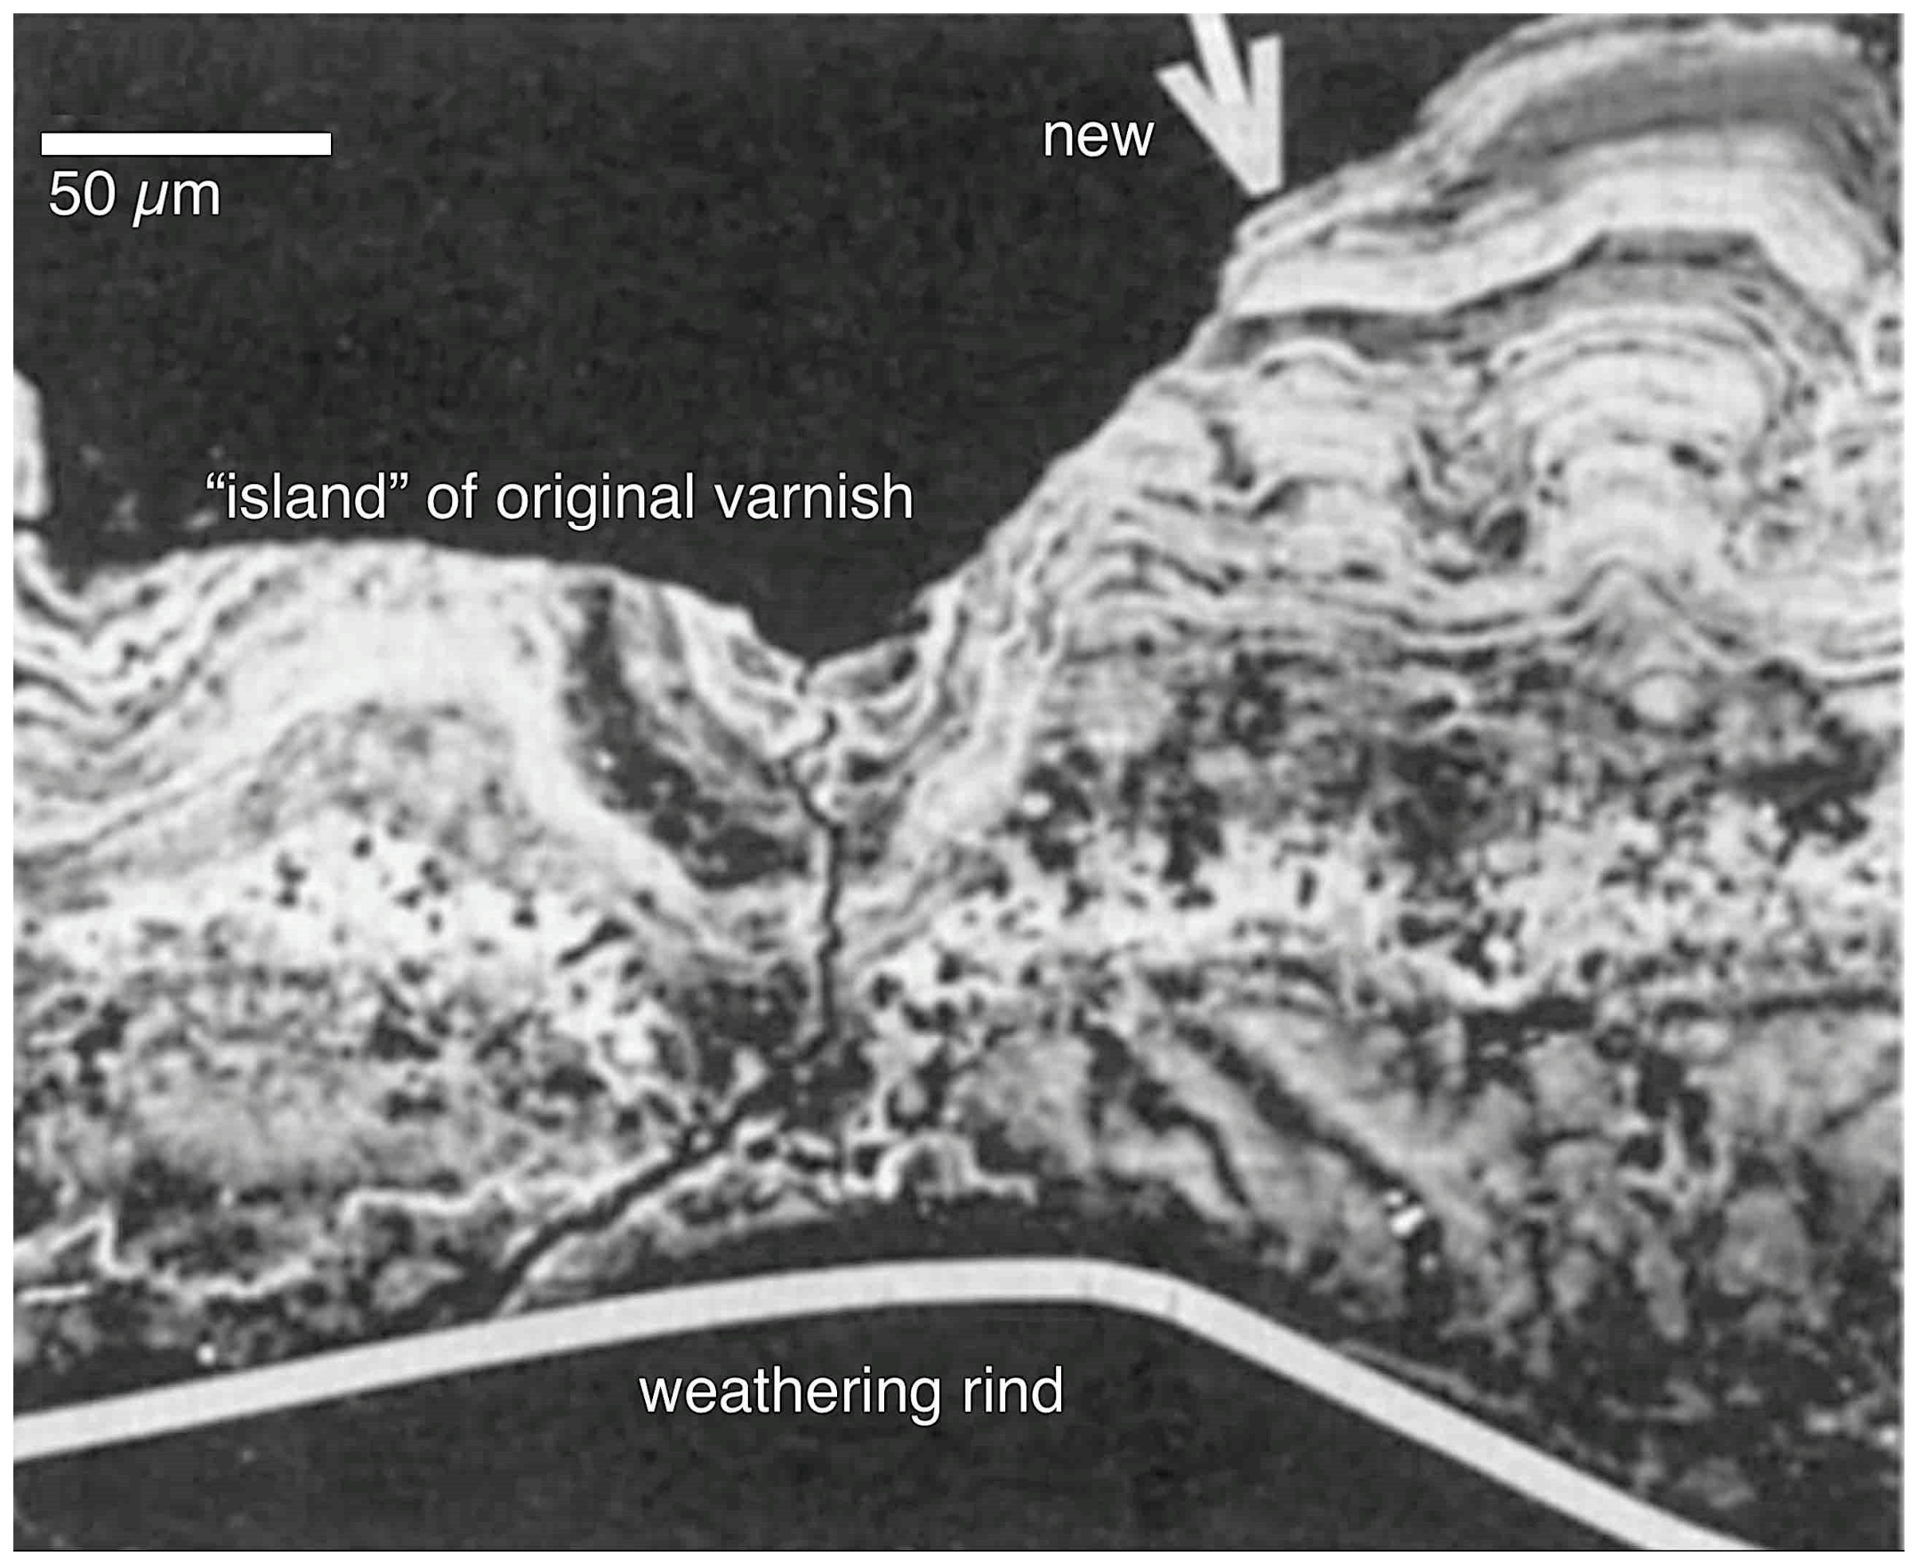
Petroglyph manufacture may leave behind areas of an original varnish surface that were not completely removed. This fact is best observed via backscattered electron microscope imagery (Figure 2). We tabulated the lengths where this “inherited” varnish was present in the BSE imagery for four studied petroglyphs. The lengths of pre-existing original varnish were then converted into the percentage of the total length of varnish examined by BSE to quantify our results.
Inherited varnish patches comprised 3% (CM-15), 2% (Fort Irwin 96-4), 5% (Fort Irwin 96-16), and 3% (Cima 1-1) of their cumulative cross-sectional profile lengths in four analyzed petroglyphs. Although we did not measure the amount of Mn in these original varnish areas, Figure 2 shows the visual difference between old and new varnish at one location.
While larger patches (or ‘islands’) of original varnish may be visible in the field and avoided in pXRF sampling, it is not necessarily possible to determine with a pXRF whether the varnish is newly formed on a petroglyph groove or is an inherited remnant missed during the engraving process. Note that the patches of inherited varnish that we observed were all smaller than 500 µm wide and would only look like small black spots in the field, making their identification in the field effectively impossible.

3.3. Mn Within Silica Glaze

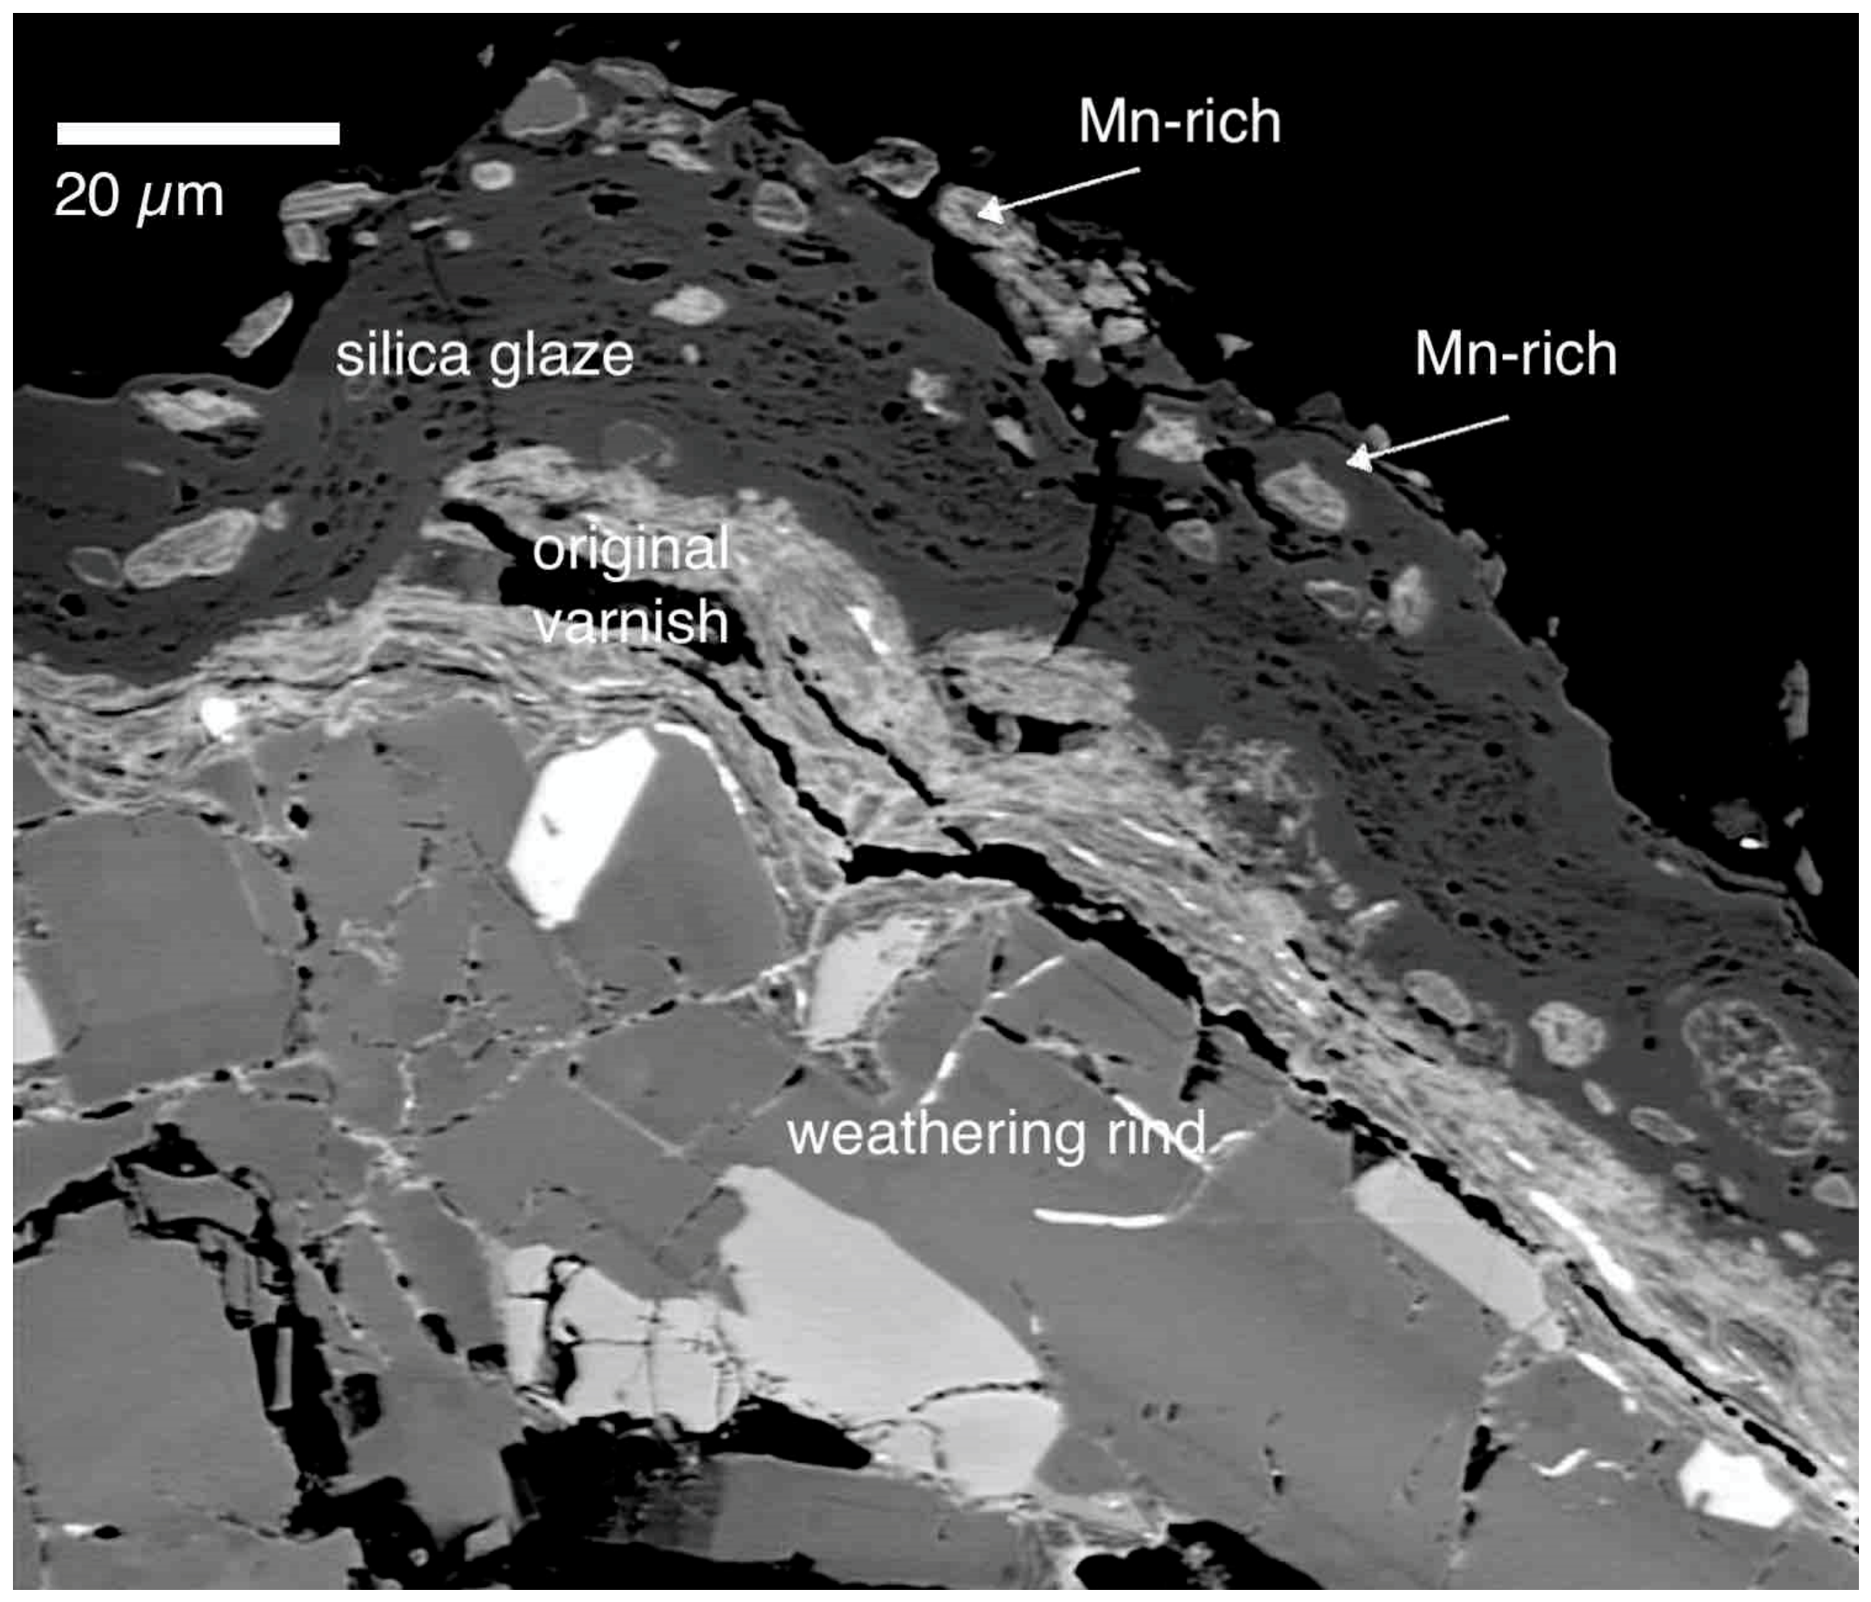
Our third analysis involved determining the prevalence of Mn-infused silica glazes coating petroglyphs along with rock varnish. Two-thirds of the 15 analyzed petroglyph grooves from Fort Irwin includes areas of silica glaze containing Mn nodules. Half of the 10 studied petroglyphs from the Coso Range included such areas, and 4 of 10 included Mn-rich nodules in the Cima Volcanic Field petroglyph samples [35]. Figure 3 shows the typical appearance of these nodules in thin sections.
We stress that these data cannot be used to estimate how much Mn might be present within this silica glaze. We only report that this different type of rock coating often co-exists with rock varnish. If the petroglyphs we studied are representative (and we have no reason to think otherwise), researchers could expect to measure Mn in 40% or more of their studied petroglyphs from these silica glazes rather than from rock varnish, per se.
When seen in the field by eye or via a hand lens, Mn-containing areas of silica glaze are themselves dark in color due to their Mn contents, making them difficult to distinguish from varnish in the field. The exact quantitative contribution of the micronodules of Mn in silica glaze has not been determined; we did not quantify their abundance, and it may vary from case to case. But the relevant issue is that the pXRF method cannot distinguish between the Mn measured in rock varnish and Mn that may also be present in silica glaze (or in any other potential rock coatings). The result is even greater uncertainty in the origin of the pXRF-measured Mn, given that silica glaze is relatively frequently mixed with rock varnish in petroglyph grooves.

3.4. Mn Within Weathering Rinds Under Petroglyphs

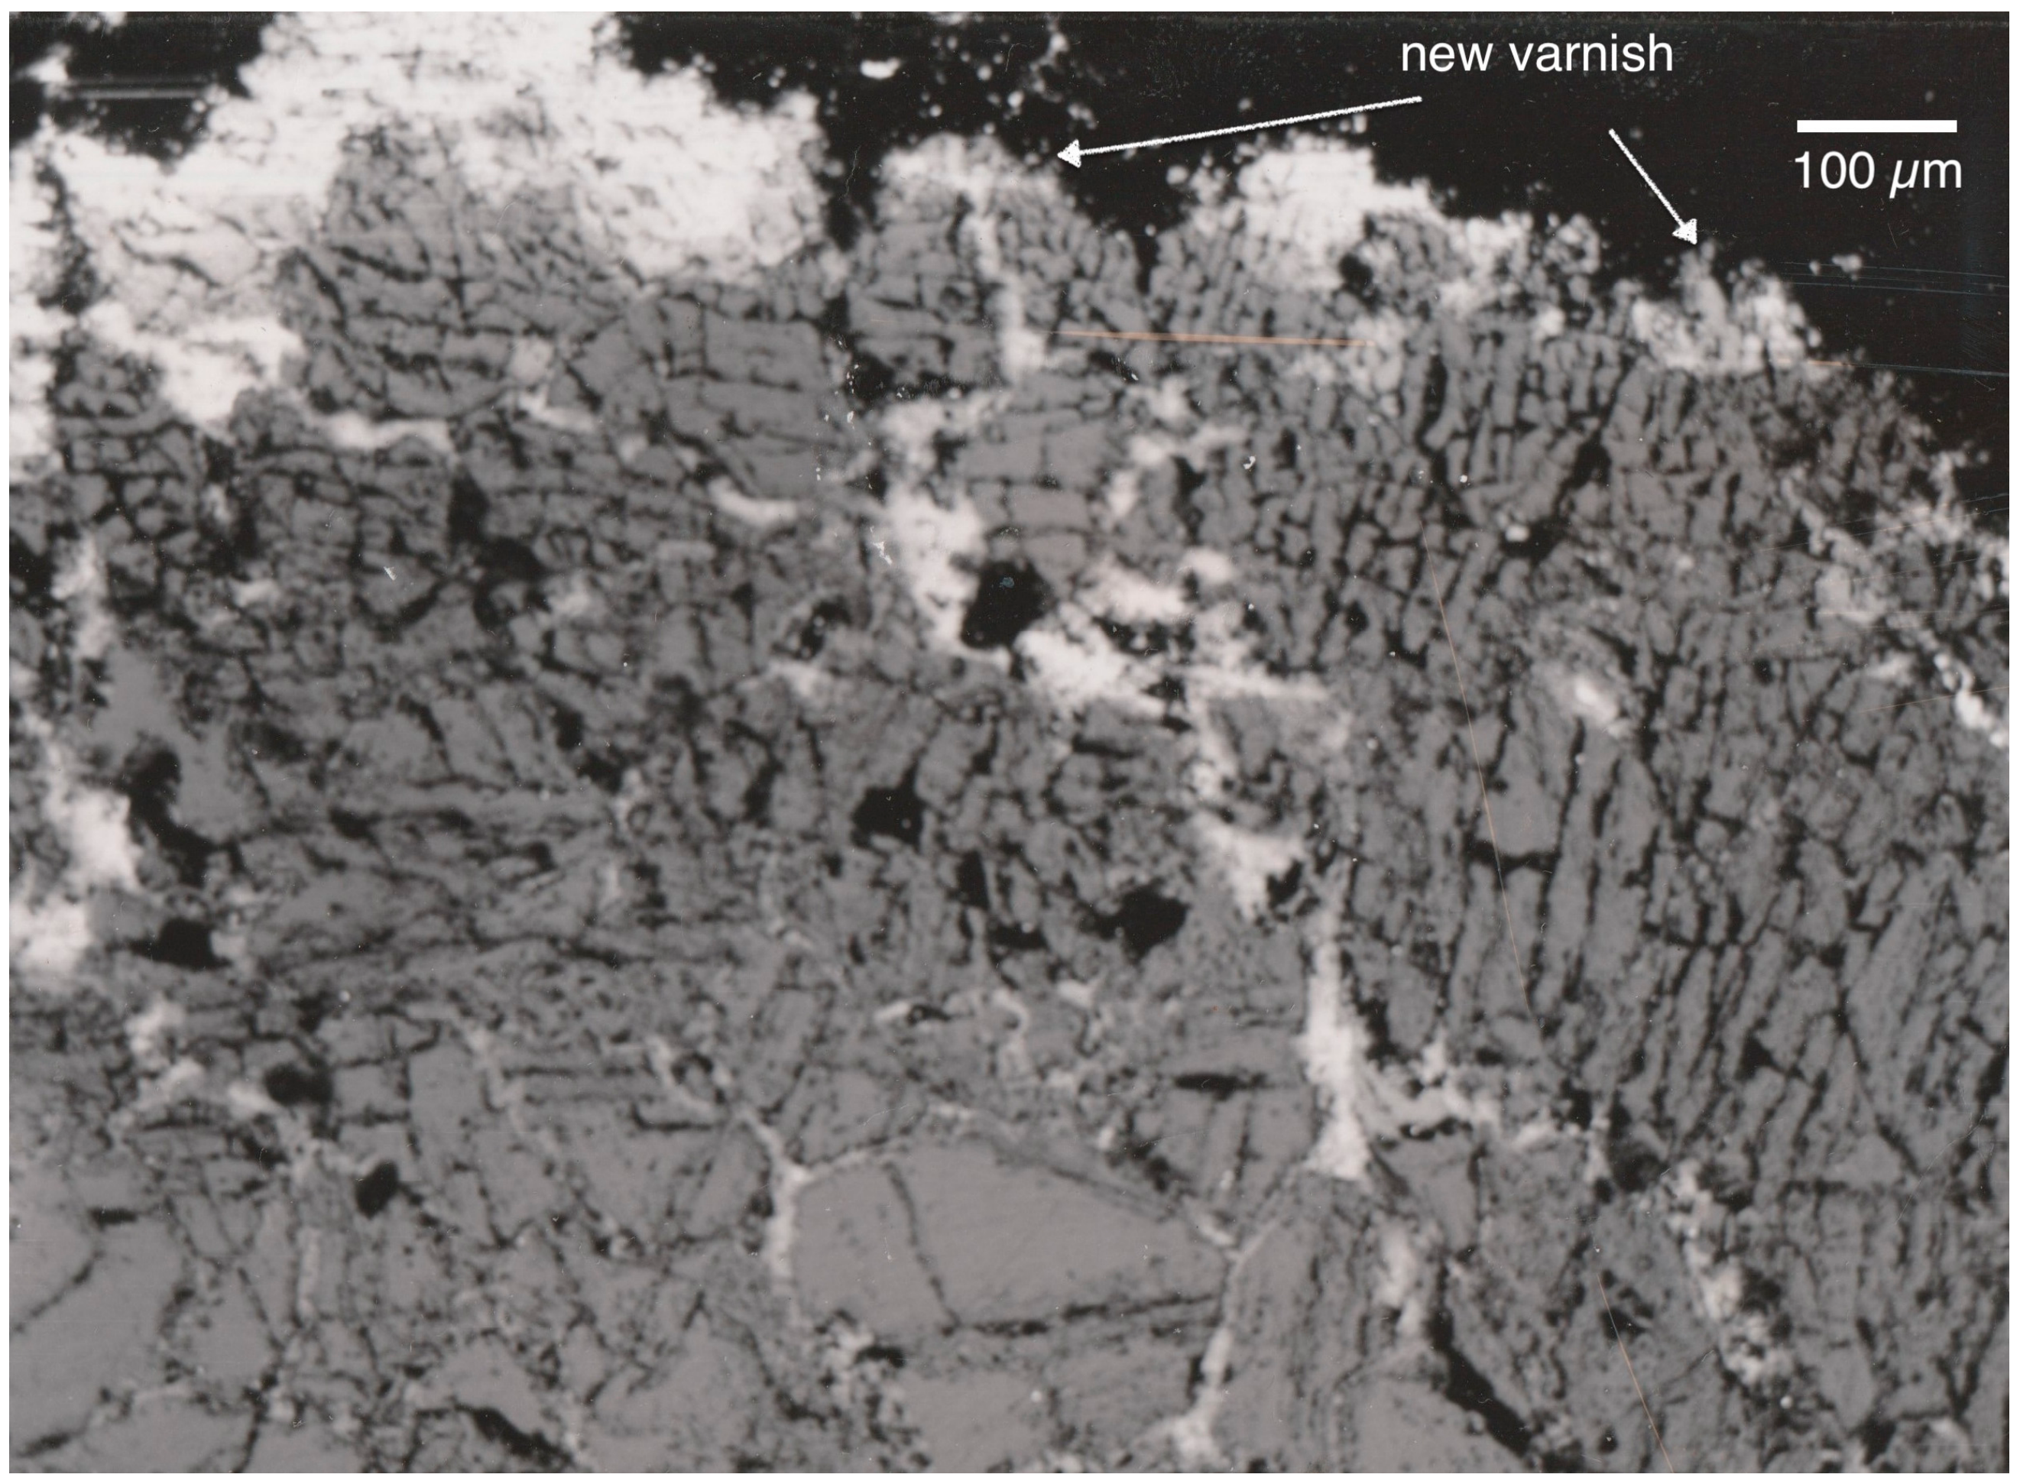
Wavelength-dispersive electron microprobe analyses of areas of Mn within the upper 100 µm of weathering rinds (e.g., Figure 4) varied from <1 to >23% by elemental weight. This extreme variability occurred in all 31 analyzed petroglyphs (Table 1). Given the porous nature of weathering rinds, the Mn elemental weight percentages in these deposits would be included in pXRF measurements, as long as they were within the upper ~100 µm of the surface.
Note that the values in Table 1 also demonstrate that the amount of Mn present in weathering rinds varies, in some cases significantly, even across a single rock surface. For example, petroglyphs CM-2, CM-3, CM-6, CM-7, and CM-8 are all from the same rock panel and thus the same boulder face. The average Mn in the weathering rinds of these five petroglyphs ranges from 4.4% to 8.0% by elemental weight, but within each petroglyph weathering rind, the manganese concentrations are not normally distributed.
The impact on pXRF measurements of a petroglyph could be as variable as the values in Table 1. The Mn abundance in the underlying weathering rind is in some cases much greater than that in the newly formed varnish coating on a petroglyph groove, as is the case for the example of Figure 4. Even greater uncertainty then results from pXRF measurements since the method cannot distinguish between Mn in a rock coating and Mn in the upper ~100 µm of an underlying weathering rind.

4. Discussion

These results provide new insight into the abundance and potential sources of Mn measured within petroglyph grooves coated with rock varnish. We stress again that these are limited results based on analyses of only a few samples. We acknowledge, for example, that measuring the Mn abundance in weathering rinds from only 31 petroglyphs (Table 1) provides limited data. Our data on Mn dissolution by microcolonial fungi (Figure 1) and the presence of underlying patches of inherited, pre-petroglyph varnish under post-pecking varnish coatings (Figure 2) are based on only four to five petroglyphs. Given our small sample size and the limitations of the process we used to select samples for analysis, we do not claim that our results are necessarily statistically representative, although we suspect that they might be. Yet that we do not know how representative our data may be suggests even greater ambiguity in the pXRF measurements of Mn abundance, given that this second uncertainty compounds the first.
Given these uncertainties, the consistency of our results poses difficulties for assigning chronometric ages to petroglyphs based on pXRF Mn abundance measurements, for significant reasons. The central concern is the origin of the measured Mn. Is this solely from rock varnish that developed after a petroglyph was engraved, as is assumed by the approach, or might it also include patches of Mn in older rock varnish that underlies the subsequent varnish coating from a weathering rind only partially removed by petroglyph pecking, and/or Mn that is located in a silica glaze? This cannot be determined using pXRF alone, since pXRF inherently mixes signals from rock coating, weathering rind, and rock material.
The additional, related problem is the fact that localized patches of varnish may also be dissolved by epilithic organisms such as microcolonial fungi (e.g., Figure 1), which are common organisms found on rock varnishes [29]. Although our sample size (again) is small, our results show that up to 60% of a varnish coating may be removed by MCF dissolution. Unlike the other methodological issues—the alternative sources that add Mn to a pXRF petroglyph Mn varnish reading—dissolution reduces this amount, and both of these processes may have affected a specific sample. The result is that the magnitude of the pXRF Mn measurement error, and its direction in adding to or subtracting from the true amount of Mn in the rock varnish coating alone, cannot be determined using a pXRF instrument.
In addition to the potential (if not likelihood) that multiple Mn sources would skew the petroglyph measurements obtained in the field, another aspect of the pXRF methodology may exacerbate this problem. This is the described approach for deriving more accurate petroglyph ages by using Mn and Fe readings on both “freshly exposed bare rock substrates” and “adjacent intact varnish,” for use in the normalization “of their calculated data prior to their conversion to calendrical ages” ([20]: 7). The two difficulties here are straightforward. First, using ‘fresh rock’ for a correction factor ignores the existence of the unknown amount of remnant weathering rind present in petroglyph grooves. Second, using adjacent varnish in the calculations would also increase errors related to uncertainties over the source of the measured Mn, outlined above. That is, the greater the number of incorrect measurements included in the calculations increases the magnitude of the resulting error. Because these factors are themselves not continuous across a rock varnish microstratigraphic profile or even across an intact varnish surface, there is no accurate way to derive a meaningful average value of Mn across these various contexts and conditions using pXRF.

5. Conclusions

Almost a half-century ago, Bard [25] failed to find evidence of a systematic relationship between the Mn abundance in rock varnish and the age of a varnish specimen in his detailed examination of physical samples. Our results yield the same conclusion. The Mn accumulation in rock varnish does not appear to be a useful method for determining petroglyph ages.
Our emphasis, however, has been on certain methodological hurdles resulting from the assumptions of pXRF petroglyph dating. Our data demonstrate that multiple sources of Mn may be present in a typical petroglyph micro-profile, potentially leading to inflated pXRF values for the Mn within a petroglyph groove. But inaccurate measurements may also result from biological processes that erode rock varnish, reducing the Mn accumulation in a varnish profile and likewise yielding an erroneous pXRF measurement. These multiple factors and conditions, in fact, may simultaneously add to and subtract from the amount of Mn present in rock varnish, making it entirely unclear what the pXRF measurements of Mn accumulation actually represent.
Proponents of pXRF petroglyph dating have primarily supported the utility of this technique in two fashions. They have, first, claimed that their results conform to archaeological expectations (e.g., [14,20]). The problem in this case is the fact that the rock art (including pictographs and geoglyphs) that has been systematically dated using verified chronometric techniques has commonly yielded results that are older and/or younger than pre-existing archaeological expectations (e.g., [1,5,35,38,48,49,50,51,52,53]), sometimes dramatically so. It is currently unclear whether the comparative similarities between pXRF results and pre-existing archaeological expectations reflect anything more than confirmation bias.
The second approach has involved measurements on the rock varnish coatings from a small handful of previously dated geomorphic surfaces as checks (e.g., [20]). However, these involve very few examples that are neither systematically nor ‘blindly’ collected, and they are thus effectively anecdotal in nature. Despite use of the technique for over two decades, the proponents of pXRF petroglyph dating have not yet conducted a true, systematic blind test of their technique’s results against independently dated rock varnish surfaces, as was completed to validate the varnish microlamination dating (VML) approach for rock varnish [54]. Until systematic blind tests are conducted that compare pXRF results to the established ages of independently dated rock varnish control surfaces, and the issues raised here are satisfactorily resolved, we recommend a hiatus in attempting to use pXRF to assign dates to petroglyphs.

Author Contributions

Conceptualization, D.S.W. and R.I.D.; methodology, D.S.W. and R.I.D.; software, D.S.W. and R.I.D.; validation, D.S.W. and R.I.D.; formal analysis, D.S.W. and R.I.D.; investigation, D.S.W. and R.I.D.; resources, D.S.W. and R.I.D.; data curation, D.S.W. and R.I.D.; writing—original draft preparation, D.S.W. and R.I.D.; writing—review and editing, D.S.W. and R.I.D.; visualization, D.S.W. and R.I.D.; supervision, D.S.W. and R.I.D.; project administration, D.S.W. and R.I.D.; funding acquisition, D.S.W. and R.I.D. All authors have read and agreed to the published version of the manuscript.

Funding

All analyses presented in this paper are based on samples collected for previously published projects. This work was also supported by institutional support from Arizona State University’s Investigator Incentive Award.

Data Availability Statement

All data required to replicate this analysis are available within this paper.

Acknowledgments

All analyses presented in this paper are based on samples collected for previously published projects, and we thank all of those who assisted in those prior research studies.

Conflicts of Interest

The authors declare that they have no known competing financial interests or personal relationships that could have appeared to influence the work reported in this paper.

References

  1. Steelman, K.L.; Boyd, C.E.; Dering, J.P. Mapping the chronology of an ancient cosmovision: 4000 years of continuity in Pecos River style mural painting and symbolism. Sci. Adv. 2025, 11, 48. [Google Scholar] [CrossRef] [Scilit] [PubMed]
  2. Chaloupka, G.; Chippindale, C.; Nelson, D.E.; Taçon, P.S.C. Introduction. In The Beeswax Art of Northern Australia; Nelson, D.E., Ed.; Simon Fraser University: Burnaby, BC, Canada, 2000; pp. 10–15. [Google Scholar]
  3. Wright, A.M. Religion on the Rocks: Hohokam Rock Art, Ritual Practice, and Social Transformation; University of Utah Press: Salt Lake City, UT, USA, 2014. [Google Scholar]
  4. Dorn, R.I. Chronometric techniques. In Handbook of Rock Art Research; Whitley, D.S., Ed.; AltaMira Press: Walnut Creek, CA, USA, 2001; pp. 167–189. [Google Scholar]
  5. Benson, L.V.; Hattori, E.M.; Southon, J.; Aleck, B. Dating North America’s oldest petroglyphs, Winnemucca Lake subbasin, Nevada. J. Archaeol. Sci. 2013, 40, 4466–4476. [Google Scholar] [CrossRef] [Scilit]
  6. Chippindale, C.; Taçon, P.S.C. The many ways of dating Arnhem Land rock art, north Australia. In The Archaeology of Rock-Art; Chippindale, C., Taçon, P.S.C., Eds.; Cambridge University Press: Cambridge, UK, 1998; pp. 90–111. [Google Scholar]
  7. Keyser, J.D. Relative dating methods. In Handbook of Rock Art Research; Whitley, D.S., Ed.; AltaMira Press: Walnut Creek, CA, USA, 2001; pp. 116–138. [Google Scholar]
  8. Sundstrom, L. Rock Art of the Southern Black Hills: A Contextual Approach. Ph.D. Thesis, University of Kansas, Lawrence, KS, USA, 1990. [Google Scholar]
  9. Whitley, D.S. The Study of North American Rock Art: A Case Study from South-Central California. Ph.D. Thesis, Anthropology Department, University of California, Los Angeles, CA, USA, 1982. [Google Scholar]
  10. Whitley, D.S. Introduction to Rock Art Research, 2nd ed.; Left Coast Press: Walnut Creek, CA, USA, 2011. [Google Scholar]
  11. Whitley, D.S.; Simon, J.M.; Loubser, J.N.H. The Carrizo collapse: Art and politics in the past. In Collected Papers in Honor of the Achievements of Archaeologist Jay von Werlhof; Kaldenberg, R.L., Ed.; Maturango Museum Press No. 20; Maturango Museum: Ridgecrest, CA, USA, 2007; pp. 199–208. [Google Scholar]
  12. Grant, C.; Baird, J.W.; Pringle, J.K. Rock Drawings of the Coso Range, Inyo County, California; Maturango Museum Publication No. 4; Maturango Museum: China Lake, CA, USA, 1968. [Google Scholar]
  13. Whitley, D.S.; Baird, J.; Bennett, J.; Tuck, R.G. The use of relative repatination in the chronological ordering of petroglyph assemblages. J. New World Archaeol. 1984, 6, 19–25. [Google Scholar]
  14. Andreae, M.O.; Andreae, T.W.; Francis, J.E.; Loendorf, L.L. Age estimates for the rock art at the Rocky Ridge site (Utah) based on archaeological and archaeometric evidence. J. Archaeol. Sci. Rep. 2023, 48, 103875. [Google Scholar] [CrossRef] [Scilit]
  15. Pingitore, N.E.; Lytle, F.W. Desert Varnish: Relative and Absolute Dating Using Portable X-Ray Fluorescence. In AGU Fall Meeting Abstracts 2003; B21C-0719; American Geophysical Union (AGU): Washington, DC, USA, 2003. [Google Scholar]
  16. Lytle, F.; Lytle, M.; Rogers, A.K.; Garfinkel, A.P.; Maddock, C.; Wight, W.; Cole, C. An experimental technique for measuring age of petroglyph production: Results on Coso petroglyphs. In Proceedings of the 31st Great Basin Anthropological Conference, Portland, OR, USA, 15–18 October 2008. [Google Scholar]
  17. Rogers, A.K. A Chronology of Six Rock Art Motifs in the Coso Range, Eastern California. Am. Indian Rock Art 2010, 36, 23–36. [Google Scholar]
  18. Lytle, F.M.; Lytle, K.; Stever, K. Dating Black Canyon petroglyphs by XRF chemical analysis, Appendix A. In Ethnographic and Archaeological Inventory and Evaluation of Black Canyon, Lincoln County, Nevada; Volume 1: Report and Appendices; Gilreath, A., Bengston, G., Patterson, B., Eds.; U.S. Fish and Wildlife Service: Washington, DC, USA, 2011. [Google Scholar]
  19. Andreae, M.O.; Al-Amri, A.; Andreae, T.W.; Garfinkel, A.; Haug, G.; Jochum, K.P.; Stoll, B.; Weis, U. Geochemical studies on rock varnish and petroglyphs in the Owens and Rose Valleys, California. PLoS ONE 2020, 15, e0235421. [Google Scholar] [CrossRef] [Scilit] [PubMed]
  20. Andreae, M.O.; Andreae, T.W. Archaeometric studies on rock art at four sites in the northeastern Great Basin of North America. PLoS ONE 2022, 17, e0263189. [Google Scholar] [CrossRef] [Scilit] [PubMed]
  21. Macholdt, D.S.; Jochum, K.P.; Al-Amri, A.; Andreae, M.O. Rock varnish on petroglyphs from the Hima region, southwestern Saudi Arabia: Chemical composition, growth rates, and tentative ages. Holocene 2019, 29, 1377–1396. [Google Scholar] [CrossRef] [Scilit]
  22. Andreae, M.O.; Al-Amri, A.; Andreae, C.M.; Guagnin, M.; Jochum, K.P.; Stoll, B.; Weis, U. Archaeometric studies on the petroglyphs and rock varnish at Kilwa and Sakaka, northern Saudi Arabia. Arab. Archaeol. Epigr. 2020, 31, 219–244. [Google Scholar] [CrossRef] [Scilit]
  23. Shezaf, I.; Eisenberg-Degena, D.; Schwimer, L.; Wieler, N.; Gorenc, Y. New Insights into Dating Rock Art in the Arid Carbonate Terrain of the Negev Highlands, Israel. Carmel Studies in Archaeological Sciences and Conservation 2025, 2025/2. Available online: https://carmel.haifa.ac.il/wp-content/uploads/2026/01/Carmel_25_2-1.pdf (accessed on 27 March 2025).
  24. Guagnin, M.; Charloux, G.; AlSharekh, A.M. The Rock Art of Saudi Arabia: Life-Sized Reliefs of Camels and Equids: The Camel Site in Saudi Arabia. Available online: https://www.bradshawfoundation.com/middle_east/saudi_arabia_camel_site/life_sized_reliefs_camels_equids_camel_site_saudi_arabia/index.php (accessed on 27 March 2025).
  25. Bard, J.C. The Development of a Patination Dating Technique for Great Basin Petroglyphs Utilizing Neutron Activation and X-Ray Fluorescence Analyses. Ph.D. Thesis, University of California, Berkeley, CA, USA, 1979. [Google Scholar]
  26. Dorn, R.I. Rock Coatings; Elsevier: Amsterdam, The Netherlands, 1998. [Google Scholar]
  27. Dorn, R.I. Rock coatings. In Weathering and Soils Geomorphology: Treatise on Geomorphology, 2nd ed.; Pope, G.A., Ed.; Elsevier: Amsterdam, The Netherlands, 2022; pp. 151–188. [Google Scholar]
  28. Oguchi, C.T. Weathering rinds: Formation processes and weathering rates. In Weathering and Soils Geomorphology: Treatise on Geomorphology, 2nd ed.; Pope, G.A., Ed.; Elsevier: Amsterdam, The Netherlands, 2022; pp. 189–203. [Google Scholar]
  29. Dorn, R.I. Rock varnish revisited. Prog. Phys. Geogr. Earth Environ. 2024, 48, 389–419. [Google Scholar] [CrossRef] [Scilit]
  30. Dragovich, D. Weathering of desert varnish by lichens. In Proceedings of the 21st IAG Conference, Perth, Australia, 10–18 May 1986; pp. 407–412. [Google Scholar]
  31. Dragovich, D. Distribution and chemical composition of microcolonial fungi and rock coatings from arid Australia. Phys. Geogr. 1993, 14, 323–341. [Google Scholar] [CrossRef] [Scilit]
  32. Dorn, R.I. Anthropogenic interactions with rock varnish. In Ecological Drivers of Biogeochemical Cycles under Changing Environments; Dontsova, K., Balogh-Brunstad, Z., Le Roux, G., Pierret, M.-C., Eds.; American Geophysical Union: Washington, DC, USA, 2020; pp. 267–283. [Google Scholar]
  33. Whitley, D.S.; Dorn, R.I. Rock art chronology in eastern California. World Archaeol. 1987, 19, 150–164. [Google Scholar] [CrossRef] [Scilit]
  34. Whitley, D.S.; Dorn, R.I. Cation-ratio dating of petroglyphs using PIXE. Nucl. Instrum. Methods Phys. Res. Sect. B Beam Interact. Mater. At. 1988, 35, 410–414. [Google Scholar] [CrossRef] [Scilit]
  35. Whitley, D.S.; Dorn, R.I.; Simon, J.M.; Rechtman, R.; Whitley, T.K. Sally’s Rockshelter and the archaeology of the vision quest. Camb. Archaeol. J. 1999, 9, 221–246. [Google Scholar] [CrossRef] [Scilit]
  36. Whitley, D.S. Rock art dating and the peopling of the Americas. J. Archaeol. 2013, 2013, 713159. [Google Scholar] [CrossRef] [Scilit]
  37. Dorn, R.I. Chronology of rock falls and slides in a desert mountain range: Case study from the Sonoran Desert in south-central Arizona. Geomorphology 2014, 223, 81–89. [Google Scholar] [CrossRef] [Scilit]
  38. Whitley, D.S.; Dorn, R.I. Rock varnish dating, surface features and archaeological controversies in the North American desert west. Arts 2026, 15, 6. [Google Scholar] [CrossRef] [Scilit]
  39. Dorn, R.I.; Nobbs, M.; Cahill, T.A. Cation-ratio dating of rock-engravings from the Olary Province of arid South Australia. Antiquity 1988, 62, 681–689. [Google Scholar] [CrossRef] [Scilit]
  40. Francis, J.E.; Loendorf, L.L.; Dorn, R.I. AMS radiocarbon and cation-ratio dating of rock art in the Bighorn Basin of Wyoming and Montana. Am. Antiq. 1993, 58, 711–737. [Google Scholar] [CrossRef] [Scilit] [PubMed]
  41. Welsh, P.H.; Dorn, R.I. Critical analysis of petroglyph radiocarbon ages from Côa, Portugal and Deer Valley, Arizona. Am. Indian Rock Art 1997, 23, 11–24. [Google Scholar]
  42. Dorn, R.I.; Moore, G.; Pagán, E.O.; Bostwick, T.W.; King, M.; Ostapuk, P. Assessing early Spanish explorer routes through authentication of rock inscriptions. Prof. Geogr. 2012, 64, 415–429. [Google Scholar] [CrossRef] [Scilit]
  43. Gliganic, L.A.; McDonald, J.; Meyer, M.C. Luminescence rock surface exposure and burial dating: A review of an innovative new method and its applications in archaeology. Archaeol. Anthropol. Sci. 2024, 16, 17. [Google Scholar] [CrossRef] [Scilit]
  44. Fairweather, J.H.; Wu, Y.-L.; Mather, C.; Hergt, J.; Pathirage, I.; Roberts, M.P.; Yusiharni, E.; Smirk, M.; McDonald, J. Characterisation of rock varnish at Murujuga (Western Australia): Implications for climate records and petroglyph dating. Quat. Int. 2026, 761, 110154. [Google Scholar] [CrossRef] [Scilit]
  45. Freire-Lista, D.M.; Jiménez-Martínez, R.; Luengo, J.; de los Ríos, A.; Pérez-Ortega, S.; García-Oteyza, J.; Sulaimanova, A. Saimaluu-Tash I Rock Art (Kyrgyzstan): An integrated petrographic, petrophysical, and iconographic study. Heritage 2026, 9, 241. [Google Scholar] [CrossRef] [Scilit]
  46. Dorn, R.I.; Mahaney, W.C.; Krinsley, D.H. Case hardening: Turning weathering rinds into protective shells. Elem. Int. Mag. Mineral. Geochem. Petrol. 2017, 13, 165–169. [Google Scholar] [CrossRef] [Scilit]
  47. Dorn, R.I. Petroglyphs in Petrified Forest National Park: Role of rock coatings as agents of sustainability and as indicators of antiquity. Bull. Mus. North. Ariz. 2006, 63, 53–64. [Google Scholar]
  48. Wendt, W.E. ‘Art mobilier’ from Apollo 11 Cave, southwest Africa: Africa’s oldest dated works of art. South Afr. Archaeol. Bull. 1976, 31, 5–11. [Google Scholar] [CrossRef] [Scilit]
  49. Roosevelt, A.C. Dating the rock art at Monte Alegre, Brazil. In Dating and the Earliest Known Rock Art; Strecker, M., Ed.; Oxbow Books: Oxford, UK, 1999; pp. 35–40. [Google Scholar]
  50. Valladas, H.; Tisnérat-Laborde, N.; Cachier, H.; Arnold, M.; de Quirós, F.B.; Cabrera-Valdés, V.; Clottes, J.; Courtin, J.; Fortea-Pérez, J.J.; Gonzáles-Sainz, C. Radiocarbon AMS dates for Paleolithic cave paintings. Radiocarbon 2001, 43, 977–986. [Google Scholar] [CrossRef] [Scilit]
  51. Valladas, H. Direct radiocarbon dating of prehistoric cave paintings by accelerator mass spectrometry. Meas. Sci. Technol. 2003, 14, 1487. [Google Scholar] [CrossRef] [Scilit]
  52. Aubert, M.; O’Connor, S.; McCulloch, M.; Mortimer, G.; Watchman, A.; Richer-LaFlèche, M. Uranium-series dating of rock art in East Timor. J. Archaeol. Sci. 2007, 34, 991–996. [Google Scholar] [CrossRef] [Scilit]
  53. Huyge, D.; Vandenberghe, D.A.G.; De Dapper, M.; Mees, F.; Claes, W.; Darnell, J.C. First evidence of Pleistocene rock art in North Africa: Securing the age of the Qurta petroglyphs (Egypt) through OSL dating. Antiquity 2011, 85, 1184–1193. [Google Scholar] [CrossRef] [Scilit]
  54. Marston, R.A. Editorial note. Geomorphology 2003, 53, 197. [Google Scholar]
Figure 1. Mn dissolution caused by microcolonial fungi (MCF) growing within petroglyph CM-15 [34], as revealed by a comparison of SE (upper left) and BSE (lower left) microscopy. Note that the SE imagery shows the topography and the structure of the MCF. In areas where no MCF have dissolved varnish, rock varnish accretes as a sequence of microlaminations of black and orange layers as seen in the right image (from [36]). These microlaminations correspond with broad climatic periods that can be used to assign approximate minimum ages to the varnish sequence [38].
Heritage 09 00329 g001
Figure 2. Patch of original varnish only partially removed during the manufacturing of petroglyph WP90-5, Legend Rock site, Wyoming [40], as viewed by BSE microscopy. The arrow identifies newly formed varnish that developed on top of a surface truncated by petroglyph manufacturing. Note how the reformation of the new varnish has not yet spread over the entire original varnish patch.
Heritage 09 00329 g002
Figure 3. Silica glaze containing Mn-rich nodules formed on petroglyph CM-5 from the Cima Volcanic Field, Mojave Desert, CA (cf. [33]), as viewed by BSE microscopy. While silica glaze so enriched with Mn appears dark in the field, the pockets of Mn-rich material seen in this BSE image are bright white since they contain abundant Mn. Moreover, note that a portion of the original varnish coating was left behind during petroglyph pecking and was then covered by silica glaze that formed after the petroglyph was made.
Heritage 09 00329 g003
Figure 4. Pockets of Mn in weathering rind pores are shown as bright areas in a BSE image from petroglyph 169A-Spiral-1, Hedgpeth Hills, Sonoran Desert, AZ [41]. Petroglyph pecking removed all of the original varnish but not all of the original weathering rind. Small amounts of rock varnish formed on top of the weathering rind in micron-scale patches; their slightly darker appearance reflects the fact that the weathering-rind deposits are richer in Mn than those present in the varnish.
Heritage 09 00329 g004
Table 1. Abundance of Mn in weathering rind pores underneath the rock varnish covering petroglyph grooves. Mn measured in elemental weight percent. All measurements were collected in the top 100 µm of the petroglyph groove surface.
MotifLocationAve%/
(n) *
High Mn%Low Mn%Beam WidthOriginal RockPublication
CM-14Coso Range, CA5.3 (30)17.10.330 µmbasalt[34]
CM-13Coso Range, CA4.4 (30)15.20.930 µmbasalt[34]
CM-3Coso Range, CA7.2 (30)22.80.730 µmbasalt[34]
CM-2Coso Range, CA6.0 (30)19.50.730 µmbasalt[34]
CM-6Coso Range, CA4.5 (30)13.01.130 µmbasalt[34]
CM-7Coso Range, CA8.0 (30)13.61.030 µmbasalt[34]
CM-8Coso Range, CA7.3 (30)20.20.330 µmbasalt[34]
Cima 1-8Cima Volcanic Field, CA9.2 (20)14.90.425 µmbasalt[33]
Cima 1-7Cima Volcanic Field, CA7.4 (20)17.00.925 µmbasalt[33]
Cima 1-1Cima Volcanic Field, CA5.2 (20)13.31.125 µmbasalt[33]
Cima 1-2Cima Volcanic Field, CA4.9 (20)14.81.725 µmbasalt[33]
Cima 1-3Cima Volcanic Field, CA11.3 (20)20.31.025 µmbasalt[33]
Cima 2-1Cima Volcanic Field, CA12.5 (20)29.01.125 µmbasalt[33]
Cima 2-5Cima Volcanic Field, CA7.8 (20)22.90.825 µmbasalt[33]
de NizaPhoenix, AZ9.2 (30)20.90.530 µmgranite[42]
1776Glen Canyon NRA, UT10.3 (10)18.01.350 µmsandstone[42]
PEFO-91E2Petrified Forest NP, AZ5.5 (30)12.72.250 µmsandstone[47]
PEFO-92G4Petrified Forest NP, AZ5.0 (30)13.70.750 µmsandstone[47]
PEFO-92G3Petrified Forest NP, AZ7.1 (30)15.71.450 µmsandstone[47]
PEFO-92G3Petrified Forest NP, AZ8.9 (30)15.41.450 µmsandstone[47]
PEFO-91E7Petrified Forest NP, AZ8.2 (30)14.21.950 µmsandstone[47]
WP90-5Legend Rock 48HO4, WY7.0 (20)20.01.150 µmsandstone[40]
WP90-9Legend Rock 48HO4, WY7.1 (20)22.10.250 µmsandstone[40]
WP90-26Pet Cyn 24CB602, WY5.5 (20)18.30.650 µmsandstone[40]
WP90-27Pet Cyn 24CB602, WY8.8 (20)17.30.650 µmsandstone[40]
1.69A-BH1Hedgpeth Hills, AZ7.7 (30)20.02.240 µmbasalt[41]
1.69A-Cur1Hedgpeth Hills, AZ6.8 (30)23.82.940 µmbasalt[41]
169ASpiral1Hedgpeth Hills, AZ7.7 (30)20.31.340 µmbasalt[41]
Dot, K-1 Olary, South Australia17.8 (20)27.23.450 µmdolomite[39]
Spiral, K-11Olary, South Australia12.3 (20)23.94.450 µmdolomite[39]
Oval, K-19Olary, South Australia9.9 (20)19.93.850 µmdolomite[39]
* Ave%—average percentage of Mn present by elemental weight; (n)—number of pores measured for calculation.
Disclaimer/Publisher’s Note: The statements, opinions and data contained in all publications are solely those of the individual author(s) and contributor(s) and not of MDPI and/or the editor(s). MDPI and/or the editor(s) disclaim responsibility for any injury to people or property resulting from any ideas, methods, instructions or products referred to in the content.