1. Introduction
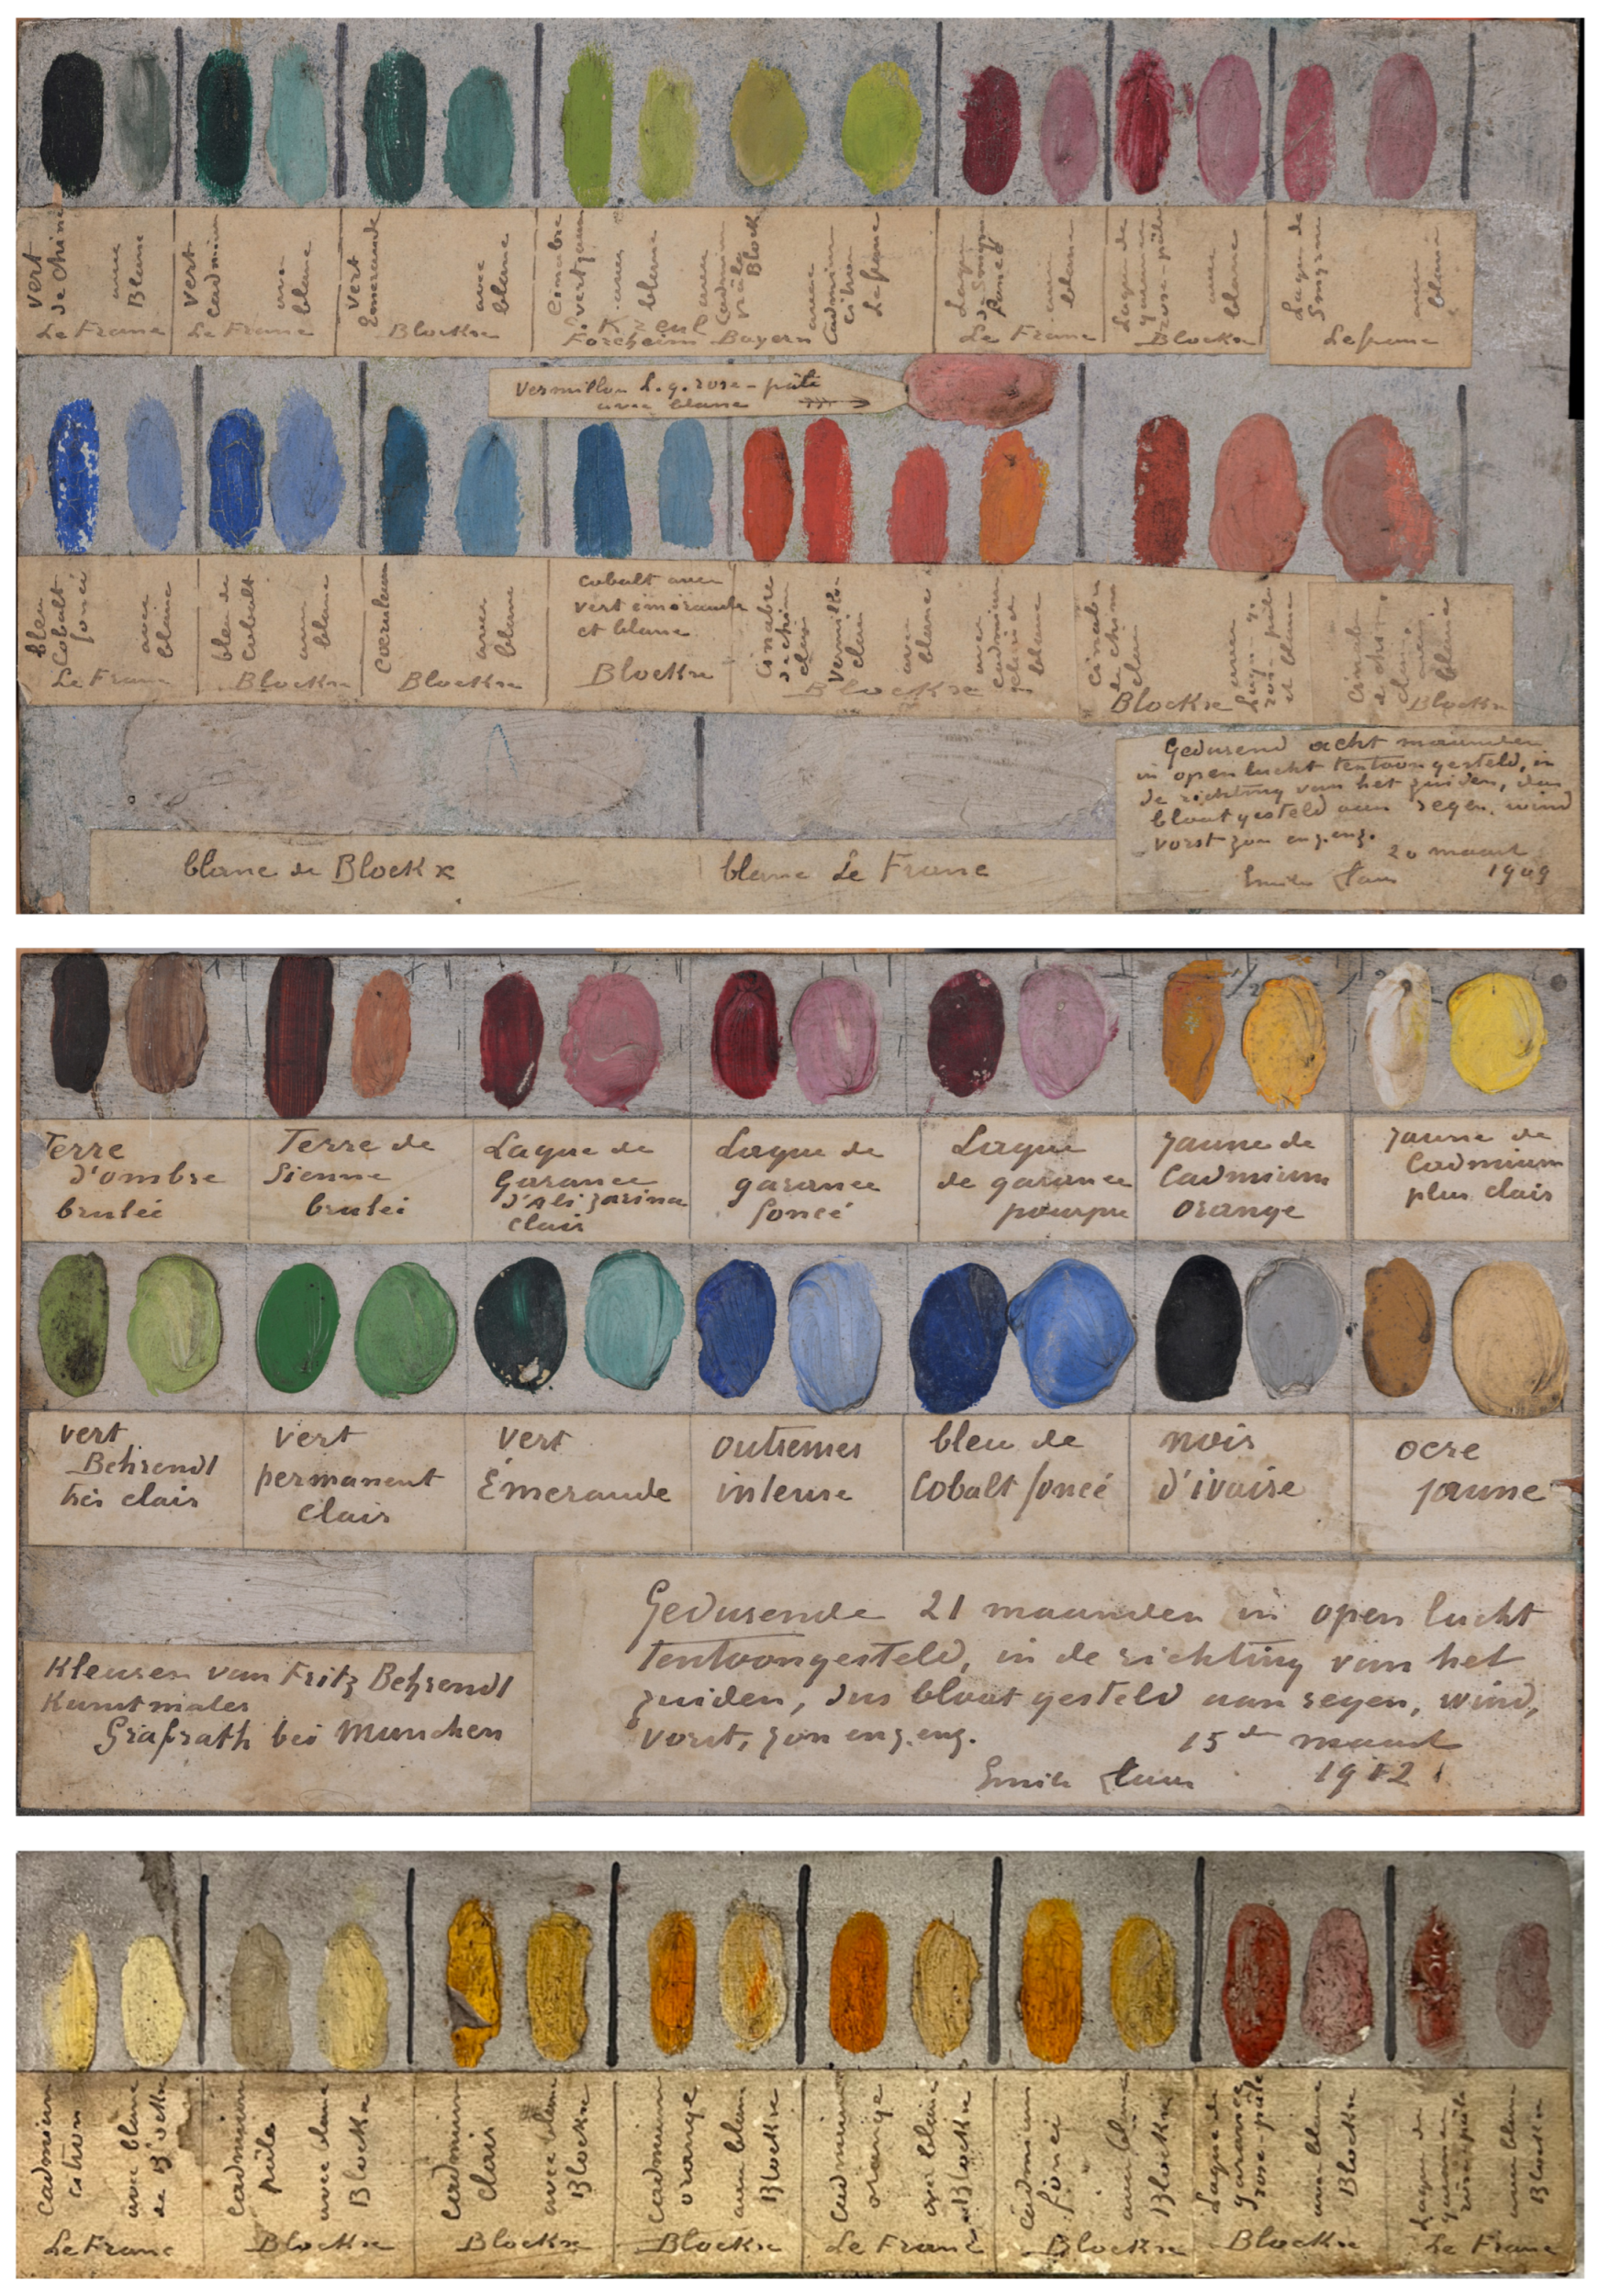
With the advent of industrial production processes, artists encountered some difficulties in knowing the exact composition of the colors they affected. Concerned about the quality of the colors he used, Emile Claus (1849–1924), leading figure of Belgian Luminism, conducted aging tests on three panels, presented in
Figure 1, preserved at the Archives of Contemporary Art in Belgium (ACAB) from the Royal Museum of Fine Arts of Belgium (RMFAB). These panels, along with three brushes, a palette, and a container, are stored in a compartmentalized walnut suitcase-shaped painter’s box. This box can be used as an easel thanks to its three telescopic legs for painting outdoors [
1].
The colors tested by the artist came from three manufacturers. The first manufacturer, the Belgian company Blockx (BLX), is at the heart of a research project conducted by the European Centre for Archaeometry (CEA), which consists of studying the manufacturer’s material and documentary archives collected since its foundation in 1865. The second is Lefranc Bourgeois (LF), the French paint manufacturer founded in 1720. And finally, the artists’ paints produced by the German manufacturer Fritz Behrendt, founded in 1903. Unlike the two previous manufacturers, the production of Fritz Behrendt colors ceased in November 1939. LF and BLX colors are located on the first and third panels while FB colors are only applied to the second panel. On the first panel, there is also a color swatch from a fourth manufacturer, namely C. Kreul Forcheim Bayern founded by Carl Kreul in 1838.
To conduct these aging tests, the artist systematically applied a swatch of pure color accompanied on its right by a swatch of the same color mixed with lead white from the corresponding manufacturer. These two swatches are separated from the swatches of another color by a vertical line. A handwritten legend on paper glued to the panels indicates under each color the name of the color, its manufacturer and whether it is mixed with white. For the swatches of colors mixed with white, the proportions are not specified but given the rigorous execution of the aging tests, we can assume that the proportion of white was globally similar for all colors. Although the artist conducted his tests methodically, the thickness of the paint films was not controlled. This parameter can influence the aging behavior of the paint swatches.
The first and second panels are dated, the third is not, but in the literature, it is assumed to be dated in the same way as the first panel [
1]. Indeed, in the bottom right of the first panel, we read this handwritten: “
Gedurend acht maanden in openlucht tentoogesteld, in de richting van het zuiden, dus blootegested aan regen, wind, vorst zon enz. enz. 20 maart 1909 Emile Claus”. Its translation is “
Exhibited outdoors for eight months, facing south, thus exposed to rain, wind, frost, sun, etc., etc. 20 March 1909 Emile Claus”. And for the second panel, it is written “
Gedurend 21 maanden in open lucht tentoogesteld, in de richting van het zuiden, dus blootegested aan regen, wind, vorst zon enz. enz. 15 maart 1912 Emile Claus” traducted by “
Exhibited outdoors for 21 months, facing south, thus exposed to rain, wind, frost, sun, etc., etc. 15 March 1912 Emile Claus” [
1].
Using these panels, Emile Claus studied the quality of colors from different manufacturers in the 1910s, subjecting them to the same aging conditions. Today, this study is fully part of a dynamic of research devoted to commercial paintings of the late 19th and early 20th centuries [
2,
3,
4,
5] and these panels allow the comparison of materials used to produce nominally identical colors by different manufacturers. Thus, only colors with an equivalent from another manufacturer are selected. The comparison is supported by complementary, non-invasive scientific analyses carried out in situ thanks to the mobile laboratory of the CEA.
2. Materials and Methods
2.1. Analytical Protocol
Emile Claus’ panels were analyzed using imaging methods (high resolution photography, infrared reflectography (IRR), X-ray radiography (XRR) and digital microscopy) and physico-chemical analyses (Raman spectroscopy (RS), X-ray fluorescence spectrometry in imaging mode (MA-XRF) and hyperspectral imaging (HSI)).
High-resolution photographic documentation of the panels was acquired using a digitization system designed by the CEA [
6]. For images in visible light and under ultraviolet light (induced fluorescence), a Nikon
® (Tokyo, Japan) Z7-II camera with a Z-MC 105 mm f/2.8 Nikkor
® (Tokyo, Japan) lens was used to capture images, with each close-up recording a small area of the painting (
cm). The images were then assembled using PTGui
® software (New House Internet Services B.B., Rotterdam, The Netherlands, v.11.32). IRR was performed with the use of an Osiris
® camera (Opus Instruments, Lisbon, Portugal) sensitive in the 0.9–1.7 μm range and halogen lamps. XRR was performed with the use of an Oxford-Instrument
® 5000 series X-ray source (Scotts Valley, CA, USA) operating between 40 and 50 kV at 1 mA, with two flat panels from X-Ris
® (Herstal, Belgium) and Balteau NDT
® (Hermalle-sous-Argenteau, Belgium).
The surface of the panels was examined with Dino-Lite® digital microscopes (Almere, The Netherlands) at , , and magnification.
MA-XRF was performed across the entire surface of the panels [
7,
8]. The devised used is composed of a Moktek
® (Orem, UT, USA) Magnum X-ray source (with a Ag anode, 40 kV voltage and a current of 120 μA) and a Silicon-Drift 123SDD Amptek
® (Bedford, MA, USA) X-ray detector. The scanning step was set to 1 mm with a dwell time of 300 ms with a spot size of 1 mm. The obtained spectra were processed in batch mode using PyMCA. (v.5.9.6).
RS was performed with Enwave Optronics
® (Irvine, CA, USA) device (I-dual-G portable Raman analyzer), with a 785 nm laser with power varying between 30 and 300 mW and a spectral resolution of 6 cm
−1 in the spectral domain of 100–3000 cm
−1. For each point of analysis, three acquisitions generally lasting 30 s with a laser power of ≈100 mW and a 500 μm spot size were carried out. The spectra were then processed using Spectragryph
® (v1.2.16) [
9,
10].
HSI were acquired using the Specim (Oulu, Finland) IQ hyperspectral camera exposed to light generated by halogen lamps. The acquired image has a size of pixels and each pixel records a reflectance spectrum in the visible range (400–1000 nm) with an integration time ranging from 1–500 ms. The spectra were extracted from the datacube thanks to Spectronon® (Resonon Inc., Bozeman, MT, USA, v.3.6) and studied with Spectragryph®.
2.2. Preprocessing and Comparison of Reflectance Spectra
Reflectance spectra were extracted from the hyperspectral datacube using Spectronon® software (v.3.6). Each spectrum corresponds to the average of multiple spectra, located in a region comprising multiple pixels, within a carefully selected region containing a single color and no underlying paint layers other than the preparation layer. Spectra are then preprocessed using Savitzky–Golay smoothing with a third-order polynomial to reduce noise.
As reported in the literature, binder type and aging can influence reflectance spectra [
11]. In this study, all colors differ in age by less than three years, which should not result in significant spectral variations. To reveal more spectral characteristics, the first derivatives of the reflectance spectra are compared, highlighting inflection points (IP). The spectra exhibit a main IP, due to the transition from low to high reflectances. Its position provides an additional point of comparison between colors from different manufacturers.
To objectively quantify the similarity between first derivative of two reflectance spectra, three different metrics were employed: Pearson Correlation Coefficient (P), Cosine Similarity (C) and Euclidean Distance (E). The first two metrics are insensitive to differences in spectral amplitude, unlike the latter. Their definitions are provided in
Appendix A.
3. Results and Discussion
The following sections present a comparative assessment of the durability of six nominally identical colors manufactured by the three paint producers (BLX, LF, and FB): lead white, cobalt blue, viridian, pale pink madder lake, cadmium yellow and cadmium orange. Only colors available from at least two manufacturers were considered, allowing direct comparison under identical aging and exposure conditions.
3.1. Condition Report
3.1.1. Lead White
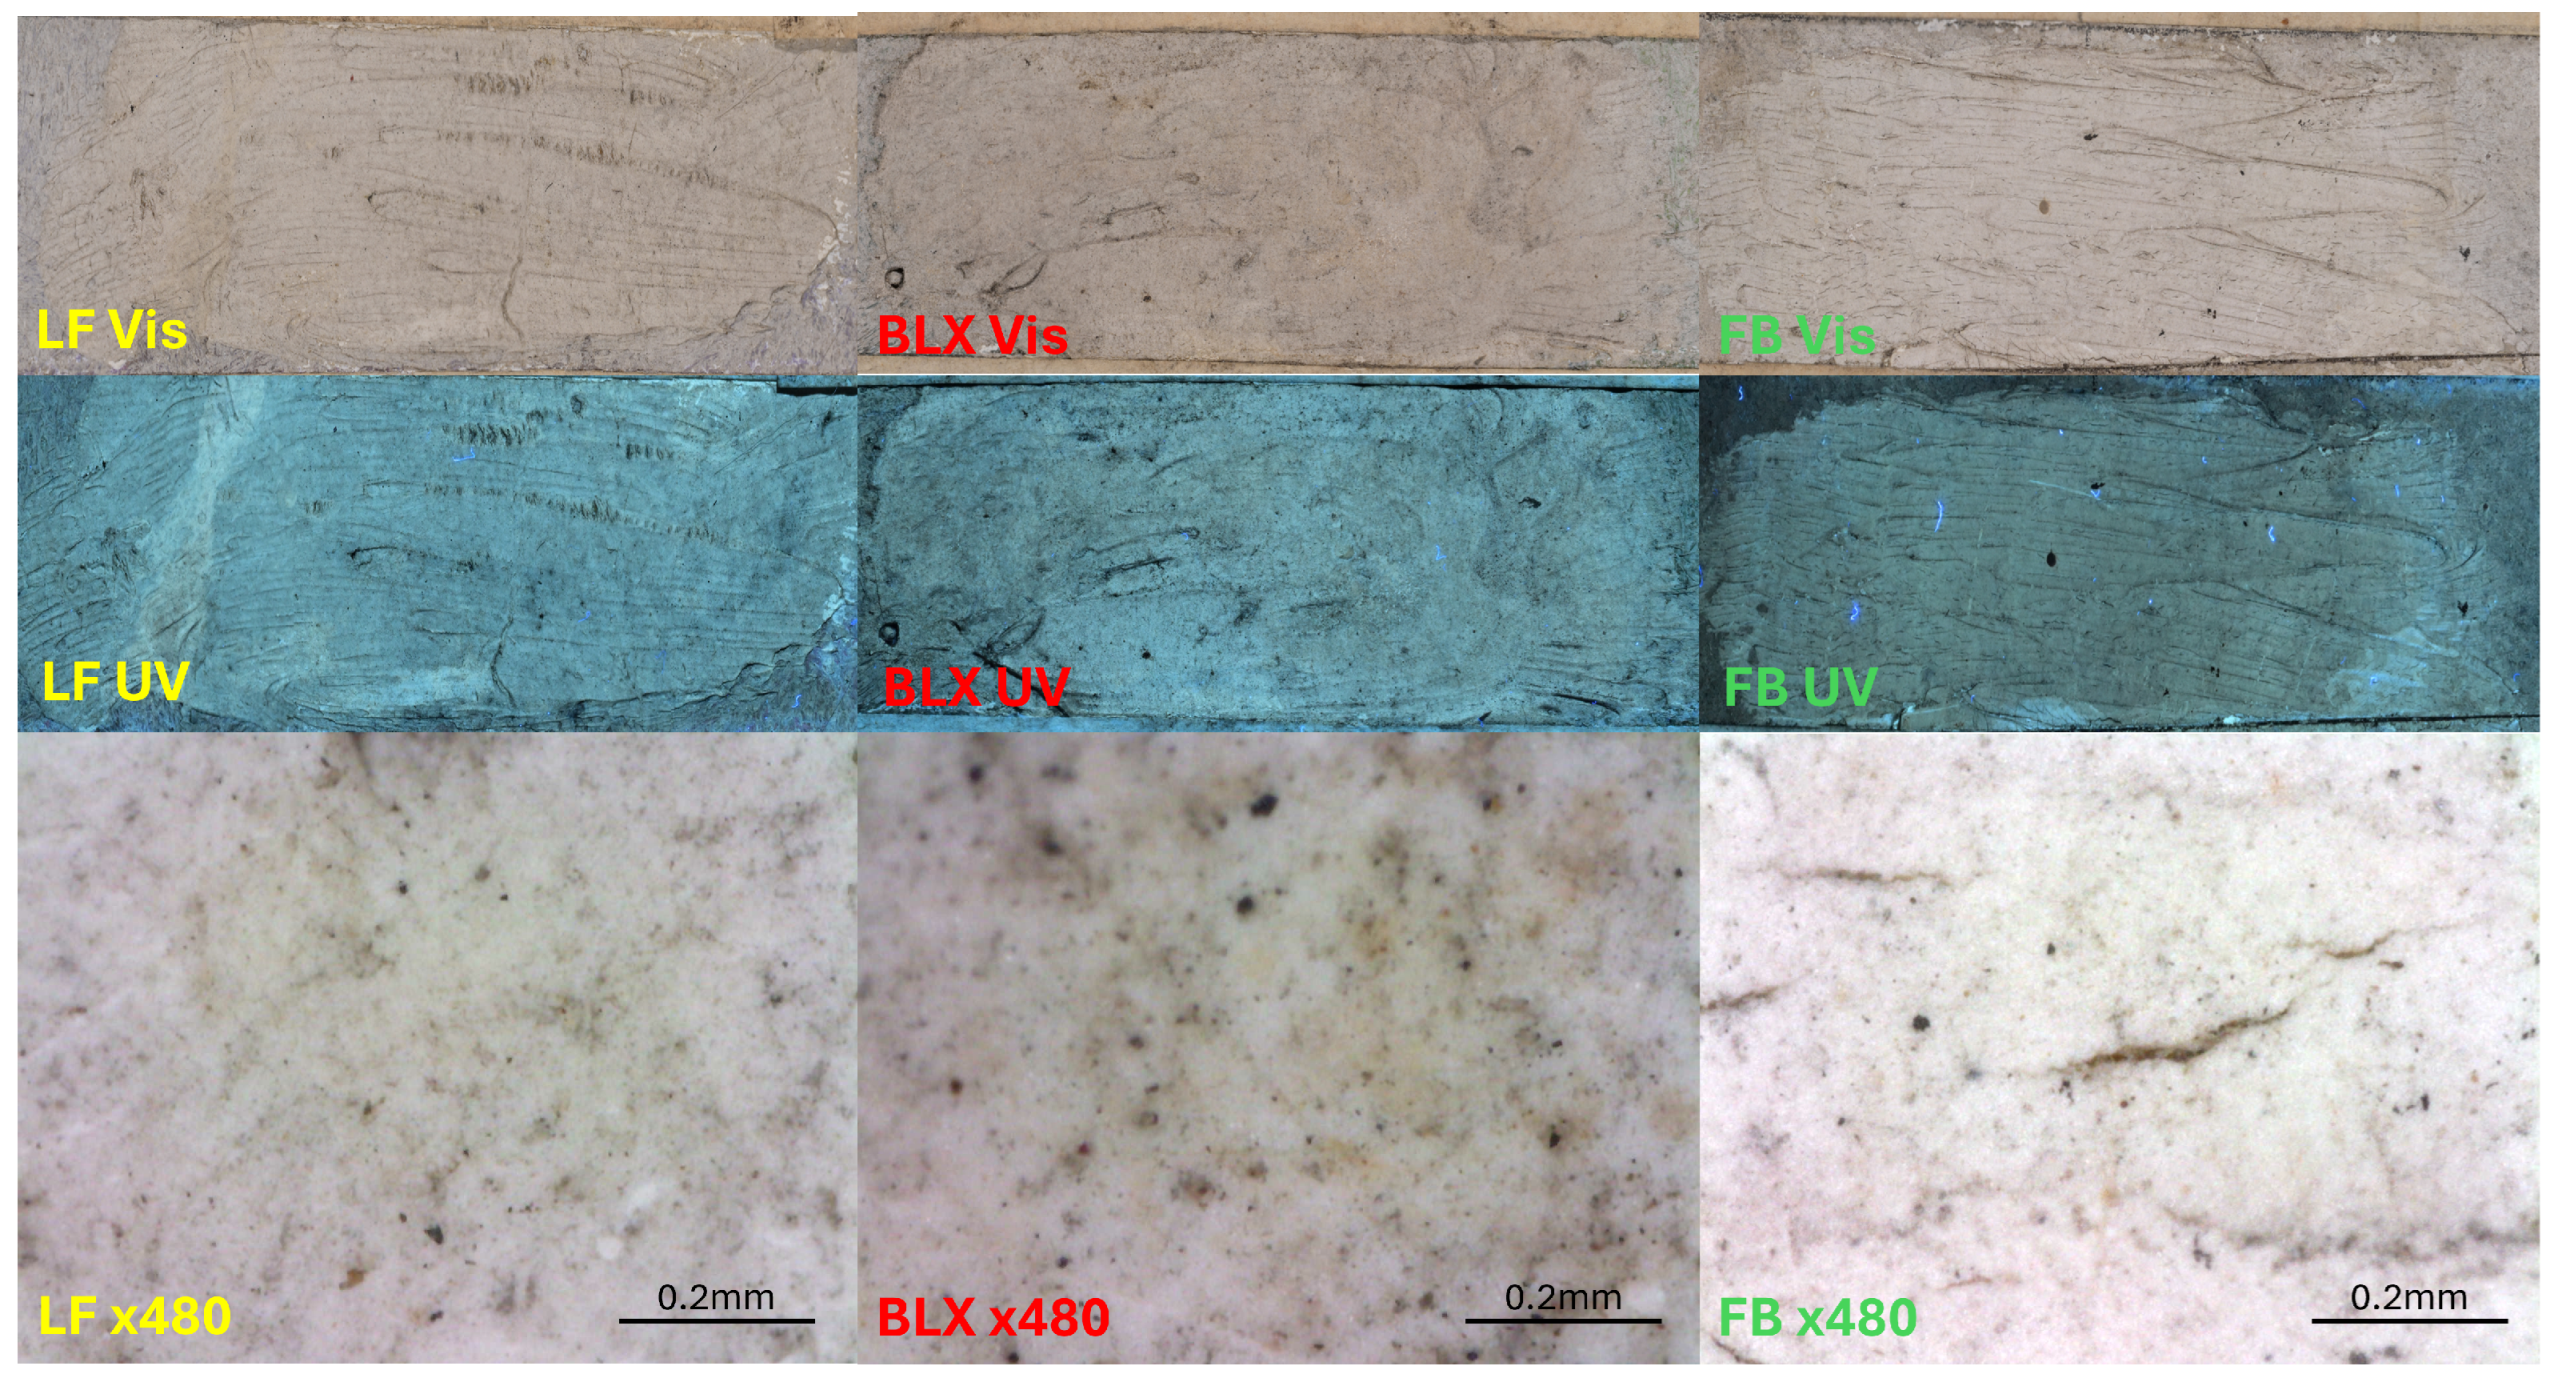
The panels display swatches of lead white from the three manufacturers. BLX and LF white colors are present on the first panel, and FB white on the second (
Figure 1). Only FB white exhibits minor cohesion failures across its entire surface (
Figure 2).
3.1.2. Cobalt Blue
The cobalt blue colors of the three manufacturers are positioned on the first two panels, LF and BLX blue colors on the first and FB on the second (
Figure 1). As shown in
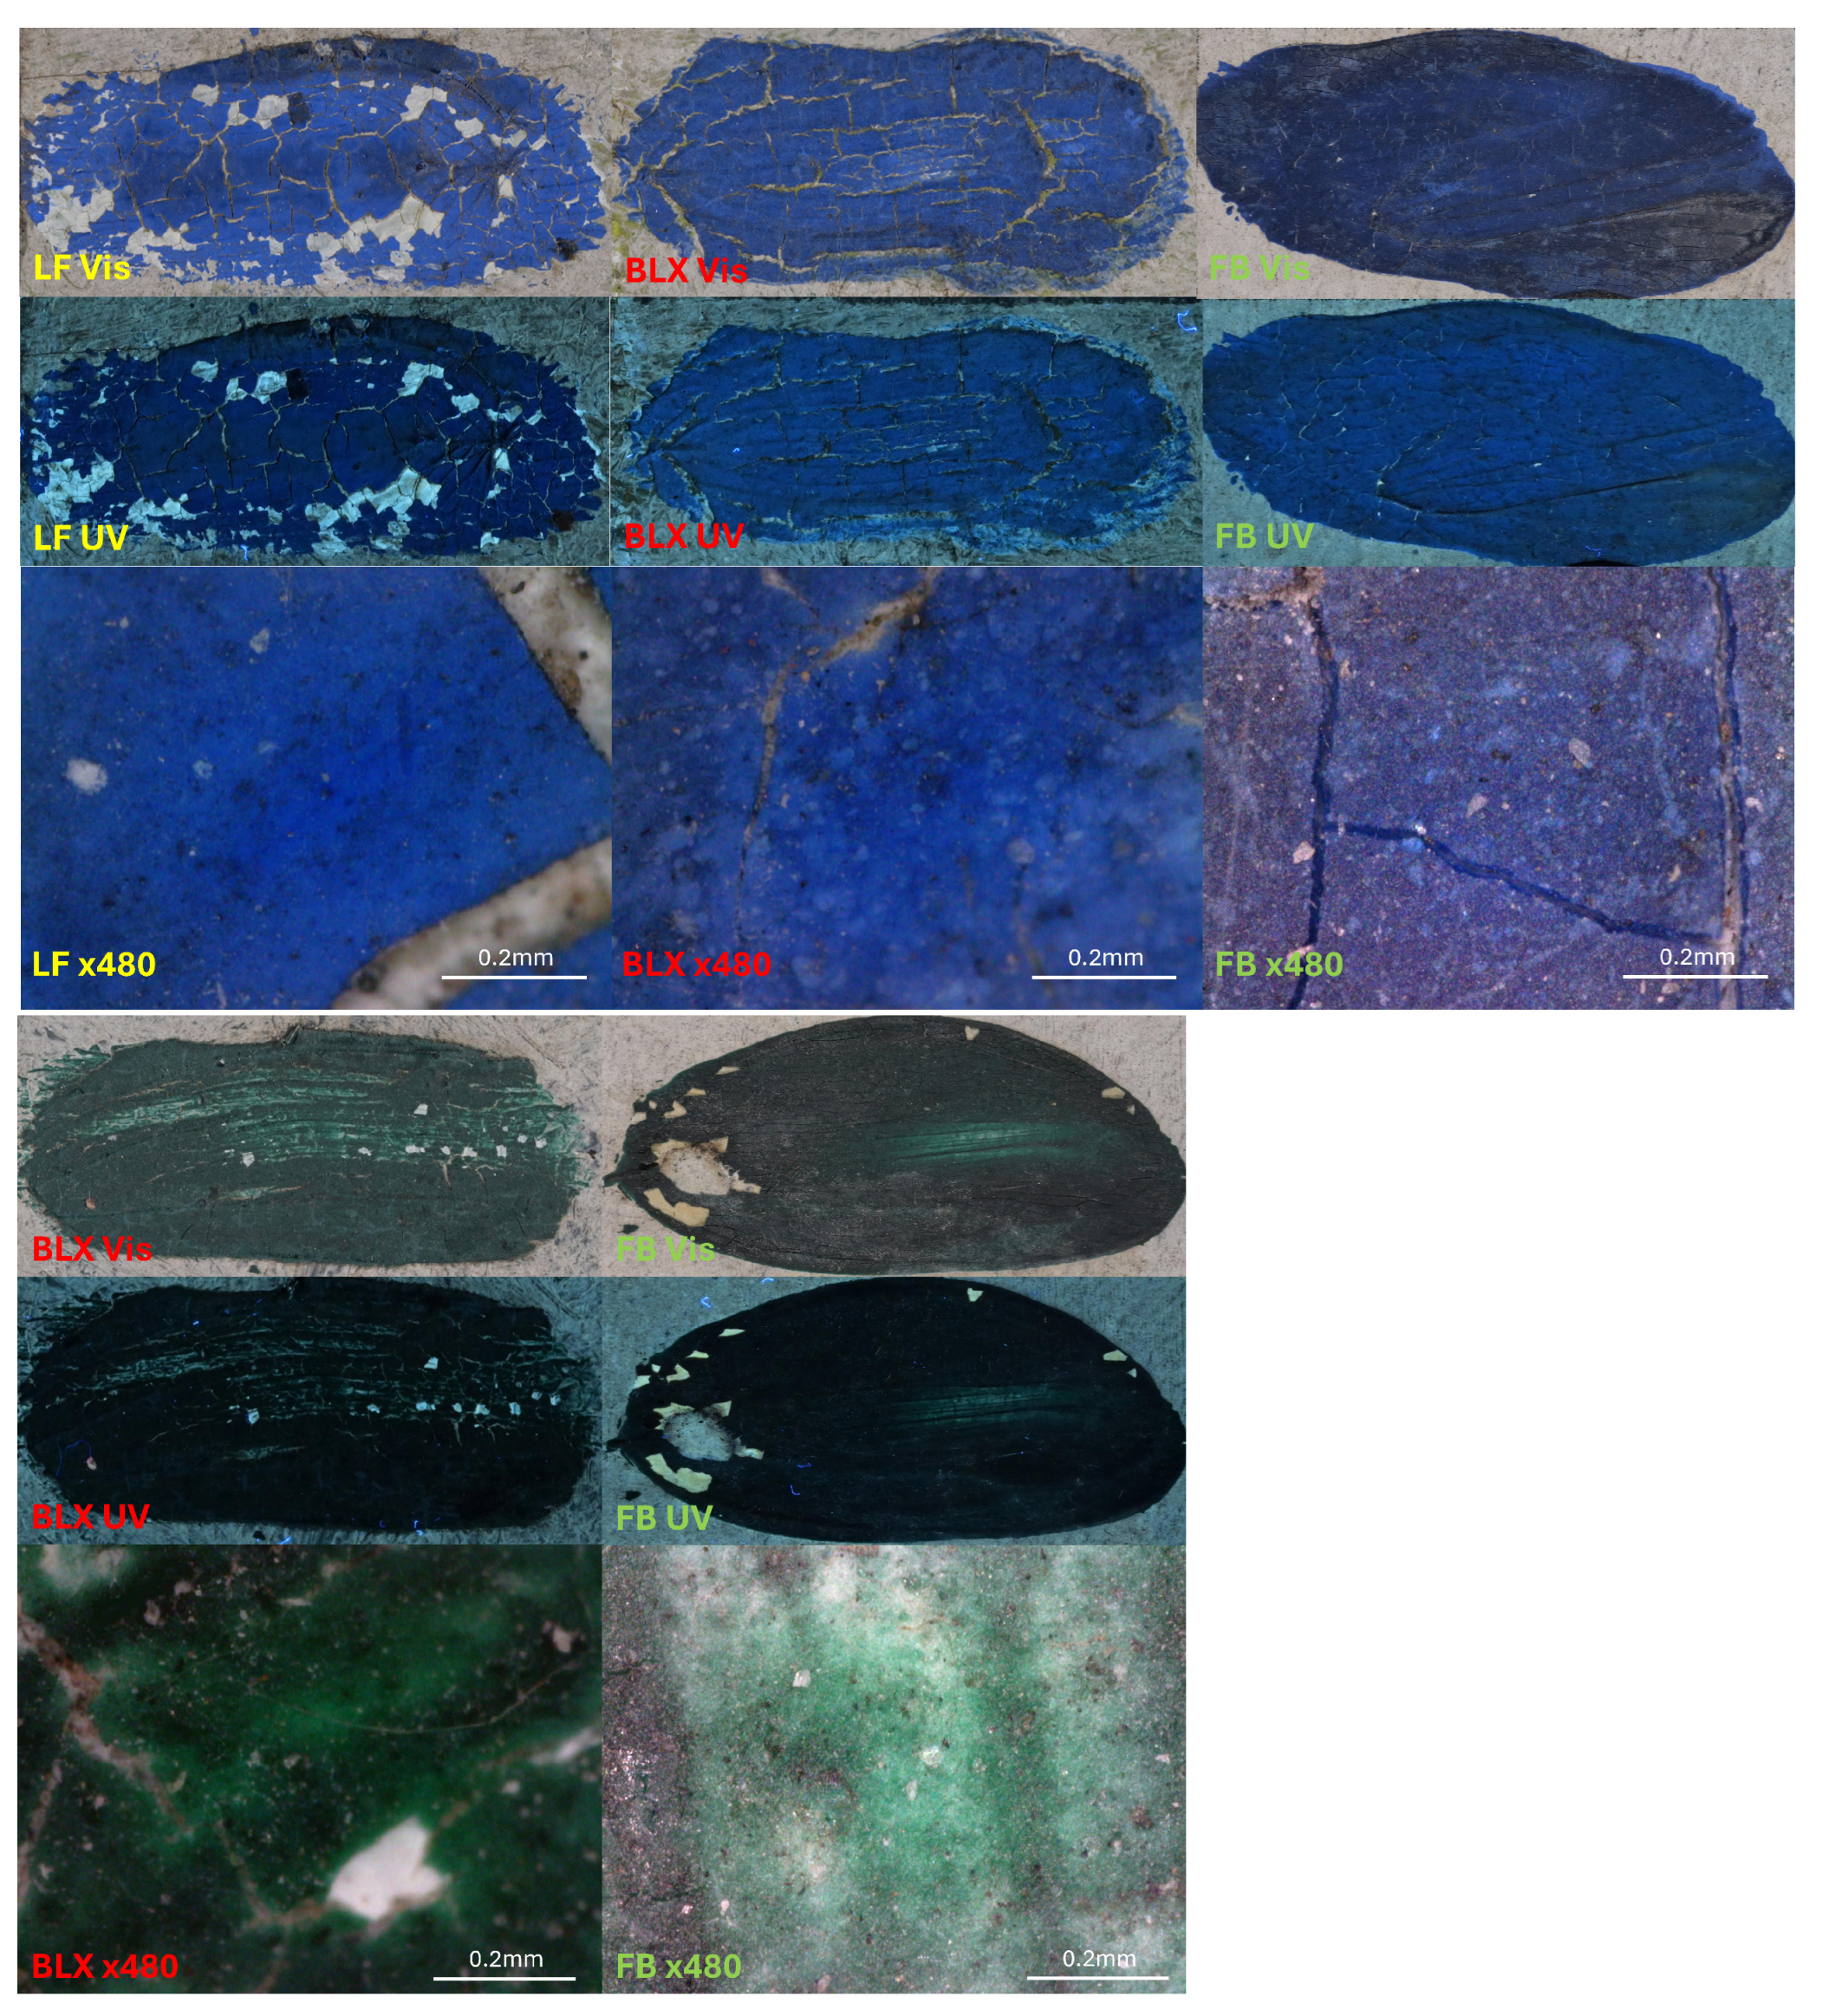
Figure 3, the paint layer of the three blue swatches exhibits cohesive failures, but at different states. Indeed, unlike the others, the white ground layer is not visible through the cracks in FB cobalt blue. For LF blue, in addition to exhibiting cohesive failure in its paint layer, it also shows adhesive failure, making it the most degraded of the three cobalt blue colors. Microscopy at 480× magnification reveals that LF blue appears to be more intense with finer pigment grains; it is also darker than the other two when exposed to UV light.
3.1.3. Viridian
On the panels, the French inscription “Vert Emeraude” refers to viridian green. Since there is no viridian green in the LF range, the comparison will focus on BLX green on the first panel and FB green on the second (
Figure 1). As shown in
Figure 3, both green colors exhibit very slight cohesive failures due to aging. They also show adhesive failures, more pronounced for FB green.
3.1.4. Lakes
Madder lakes produce a wide range of colors from yellow to violet. This results from numerous variables, such as the production of the organic dye, a mixture of anthraquinone compounds, mainly alizarin (1,2-dihydroxyanthraquinone), followed by purpurin (1,2,4-trihydroxyanthraquinone) and pseudopurpurin (1,3,4-trihydroxyanthraquinone-2-carboxylic acid), and the type of inorganic substrate on which this dye is precipitated [
12,
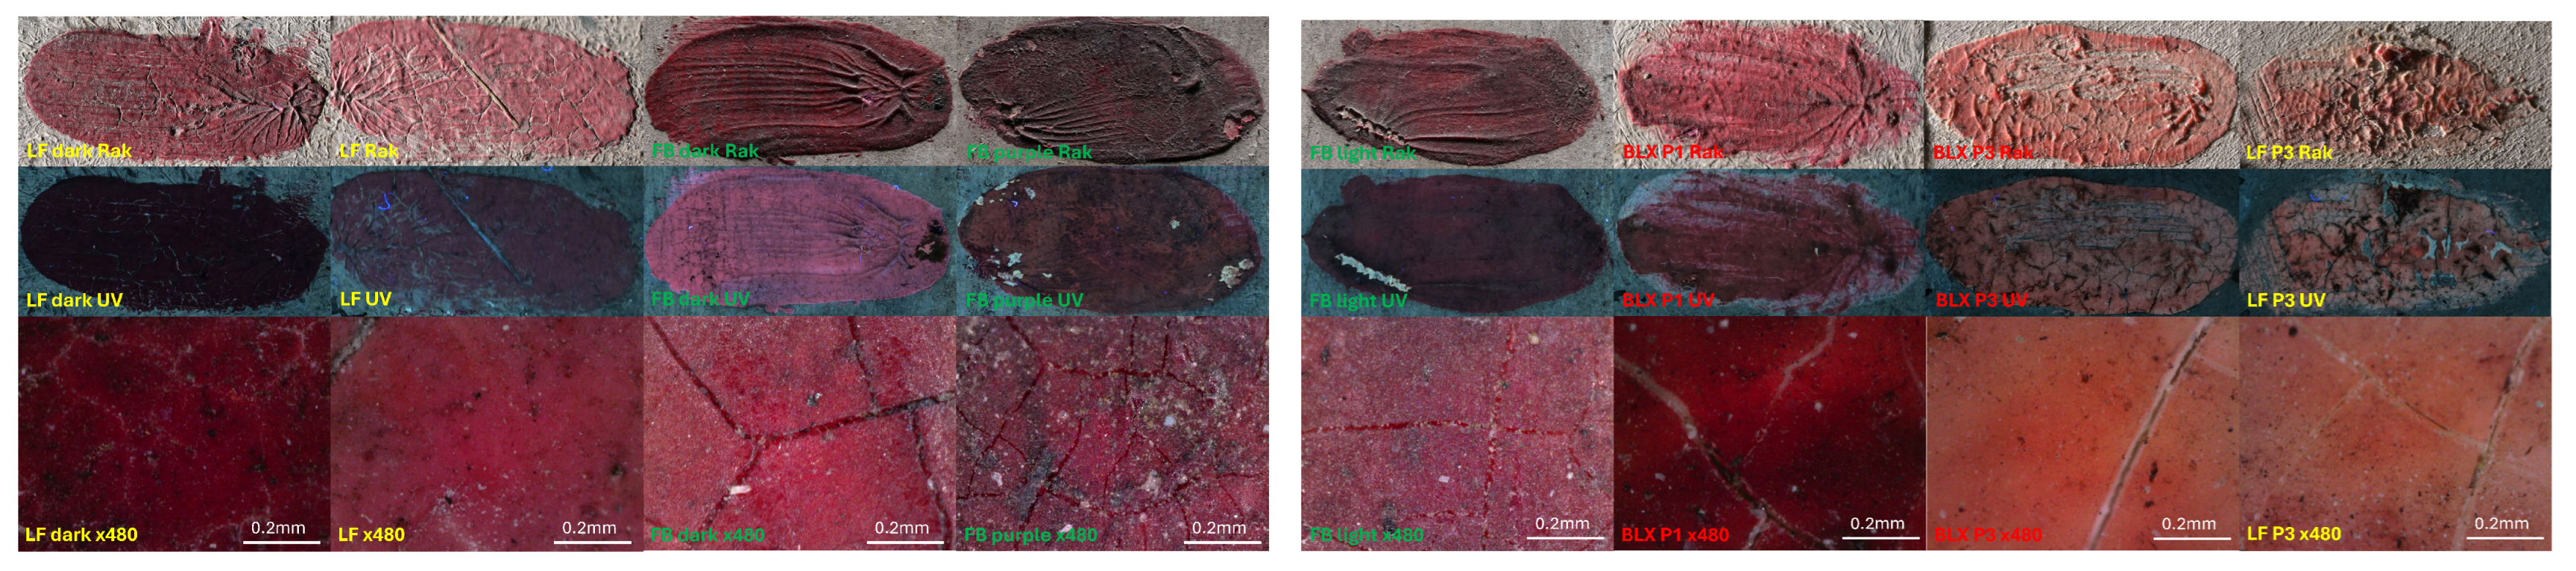
13]. Emile Claus’ panels contain eight lake swatches with colors ranging from orange to deep purplish-red, as illustrated in
Figure 4.
On the second panel, there are three FB lakes, designated respectively as dark, purple and light madder. The light and purple swatches exhibit adhesion failures within the paint layer and the three FB swatches show slight cohesive failures due to aging (
Figure 4).
The first panel features two Smyrna lakes from LF, one of which is described as dark (
Figure 4). Both swatches exhibit cohesive failures due to aging. The French colorist’s Smyrna lakes were already listed in a wholesale catalog in 1858. This catalog listed more than thirty madder-based lakes, including madder carmine, one of the most expensive pigments in the catalog, although it was not always composed of pure madder and sometimes contained cochineal [
13].
The three other swatches are nominally identical and designated as pale pink madder lakes. One from LF, is located on the third panel, while the other two from BLX are positioned on the first and third panels. These two BLX colors are assumed to be identical since they are both dated 1909 [
1]. BLX lake on the first panel has a deep red hue and slight cohesive failures in its paint layer due to aging. The difference with the two swatches on the third panel is flagrant. Although the colors are all dated 1909, the lakes on the third panel are discolored and exhibit significant premature defects in adhesion and cohesion of the paint layer. LF lake also shows localized detachment of the paint layer (
Figure 4). The difference between the two swatches of BLX pale pink madder lakes lies in the support. Indeed, the first panel is prepared with a lead white ground layer, while the ground layer of the third panel is composed of a mixture of lead white and zinc white (
Table 1).
Under 365 nm ultraviolet light, most swatches show no detectable fluorescence. However, the FB dark madder lake and the two swatches from the third panel exhibit a pink fluorescence characteristic of natural madder lake pigments (NR9) (
Figure 4) [
14].
3.1.5. Cadmium-Based Colors
The cadmium-based colors from BLX and LF are all on the third panel, while those from FB are on the second (
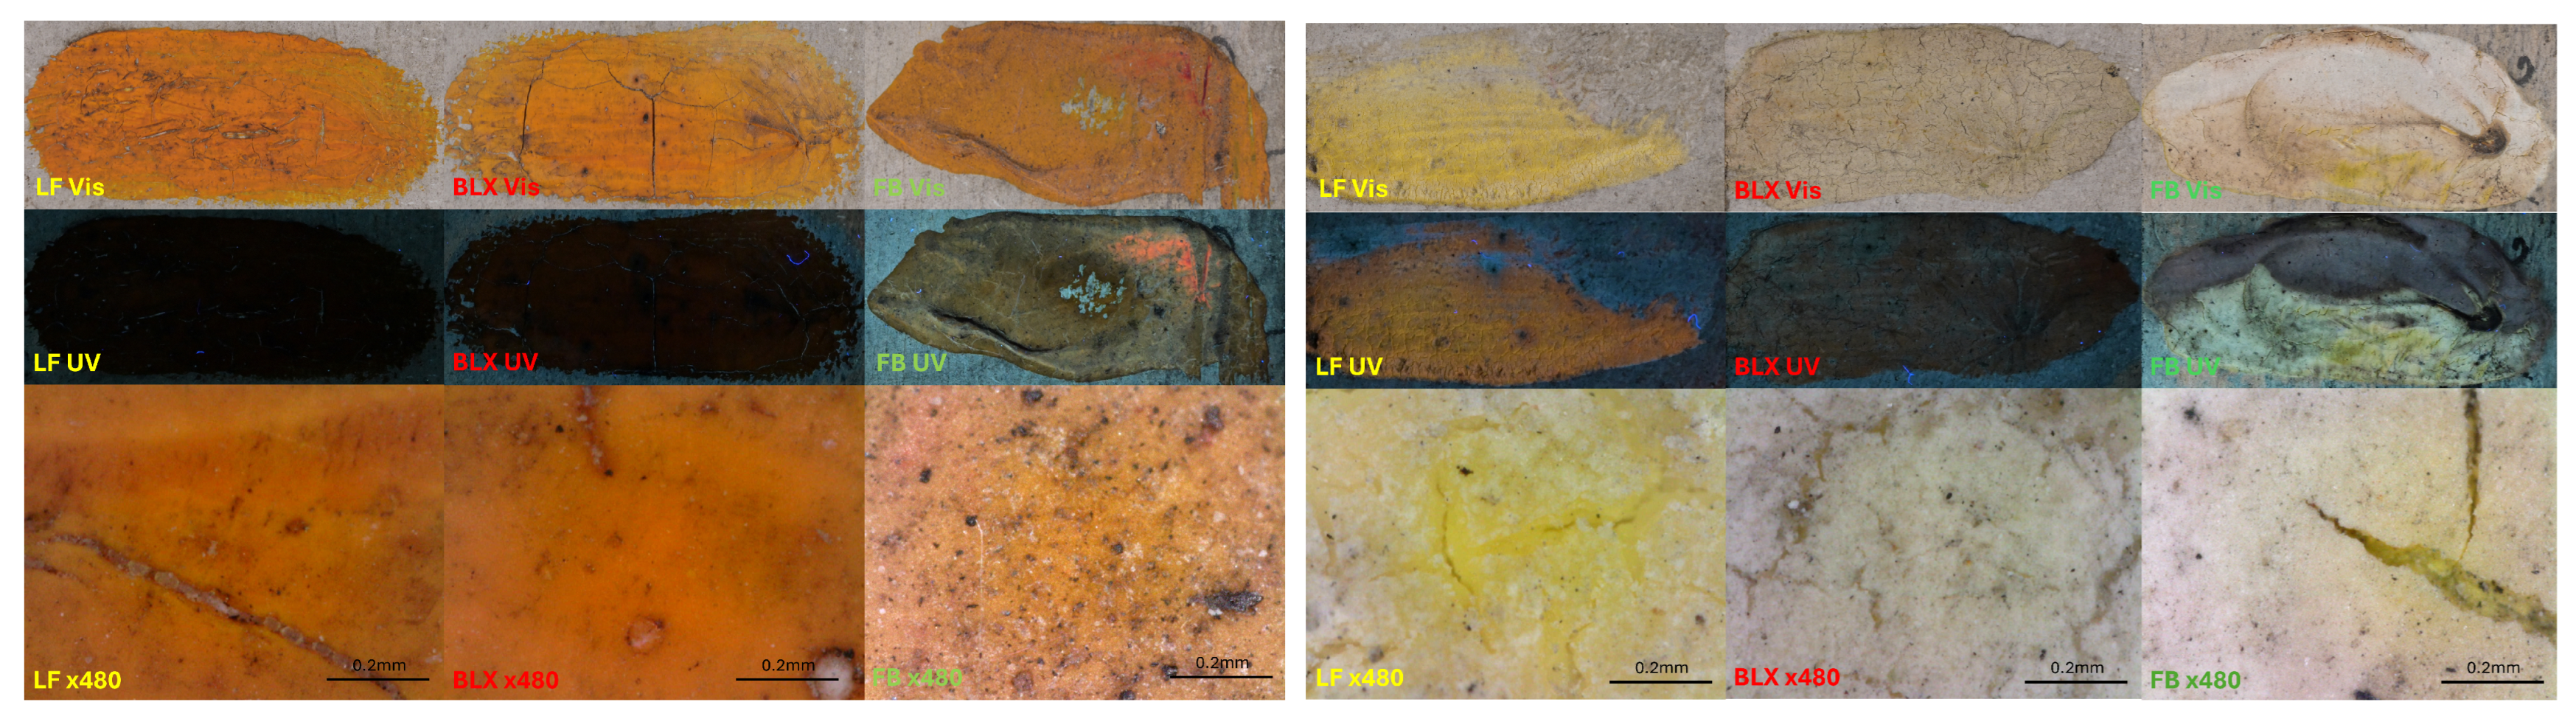
Figure 1). BLX orange color exhibits marked cohesive failures unlike the other two colors, as illustrated in
Figure 5.
BLX and FB cadmium yellow show significant discoloration, appearing more brownish and whitish than LF, as illustrated in
Figure 5. Microscopic examination of BLX and FB yellows at 480× magnification reveals that the deeper layers of the paint appear yellow. This would indicate surface alteration. For LF yellow, examination reveals early signs of surface bleaching. Examination under UV light (
Figure 5) confirms the color degradation. Indeed, the color of BLX becomes red and dark when illuminated under UV light [
15]. The appearance of FB yellow under UV light is unusual and cannot be explained at this stage.
Interestingly, cadmium yellow colors from FB and BLX appear degraded when used alone, whereas mixtures with lead white retain a pale yellow hue, consistent with pigment dilution (
Figure 1). This observation suggests that the lead white pigment modifies the degradation behavior.
3.2. XRF/RS Analysis
The results of MA-XRF and RS analysis initially allow us to verify whether, under the same nominal color identification, manufacturers used the same pigments. But also to determine any differences between these colors that could help us understand their visual state described in the
Section 3.1.
These analytical methods also made it possible to define the composition of the white ground layer of the three panels; the results are presented in the
Table 1.
3.2.1. Lead White
The results presented in
Table 2 confirm that all three colors are indeed composed of lead white pigment, as evidenced by the narrow absorption band located at approximately 1050 cm
−1 for all white and the presence of lead in BLX and LF swatches [
16,
17]. X-ray diffraction analysis would be necessary to determine whether it is cerussite (
) or hydrocerussite (
) [
18,
19]. A difference is observed between BLX and LF (
Table 2), namely the presence of sulfur in BLX, which may suggest the use of a sulfate-based filler such as calcium sulfate [
20], but its characteristic absorption bands were not detected by RS [
21]. Alternatively, sulfur could originate from the presence of lead sulfate (
) [
22].
3.2.2. Cobalt Blue
Cobalt blue is a synthetic spinel pigment composed of cobalt and aluminium (
, PB28). As presented in
Table 2, the cobalt blue colors studied are indeed composed of cobalt blue pigment, as suggest by the elements detected. The observed Raman absorption band comes from the lead white of the preparatory layer.
As discussed by Geldof and Steyn in
Van Gogh’s Cobalt Blue [
23], cobalt was extracted from natural ores that frequently contained nickel, a chemically similar element but one that is difficult to completely remove during refining. The nickel content in cobalt blue would depend on the ore or on the purification process used. MA-XRF data (
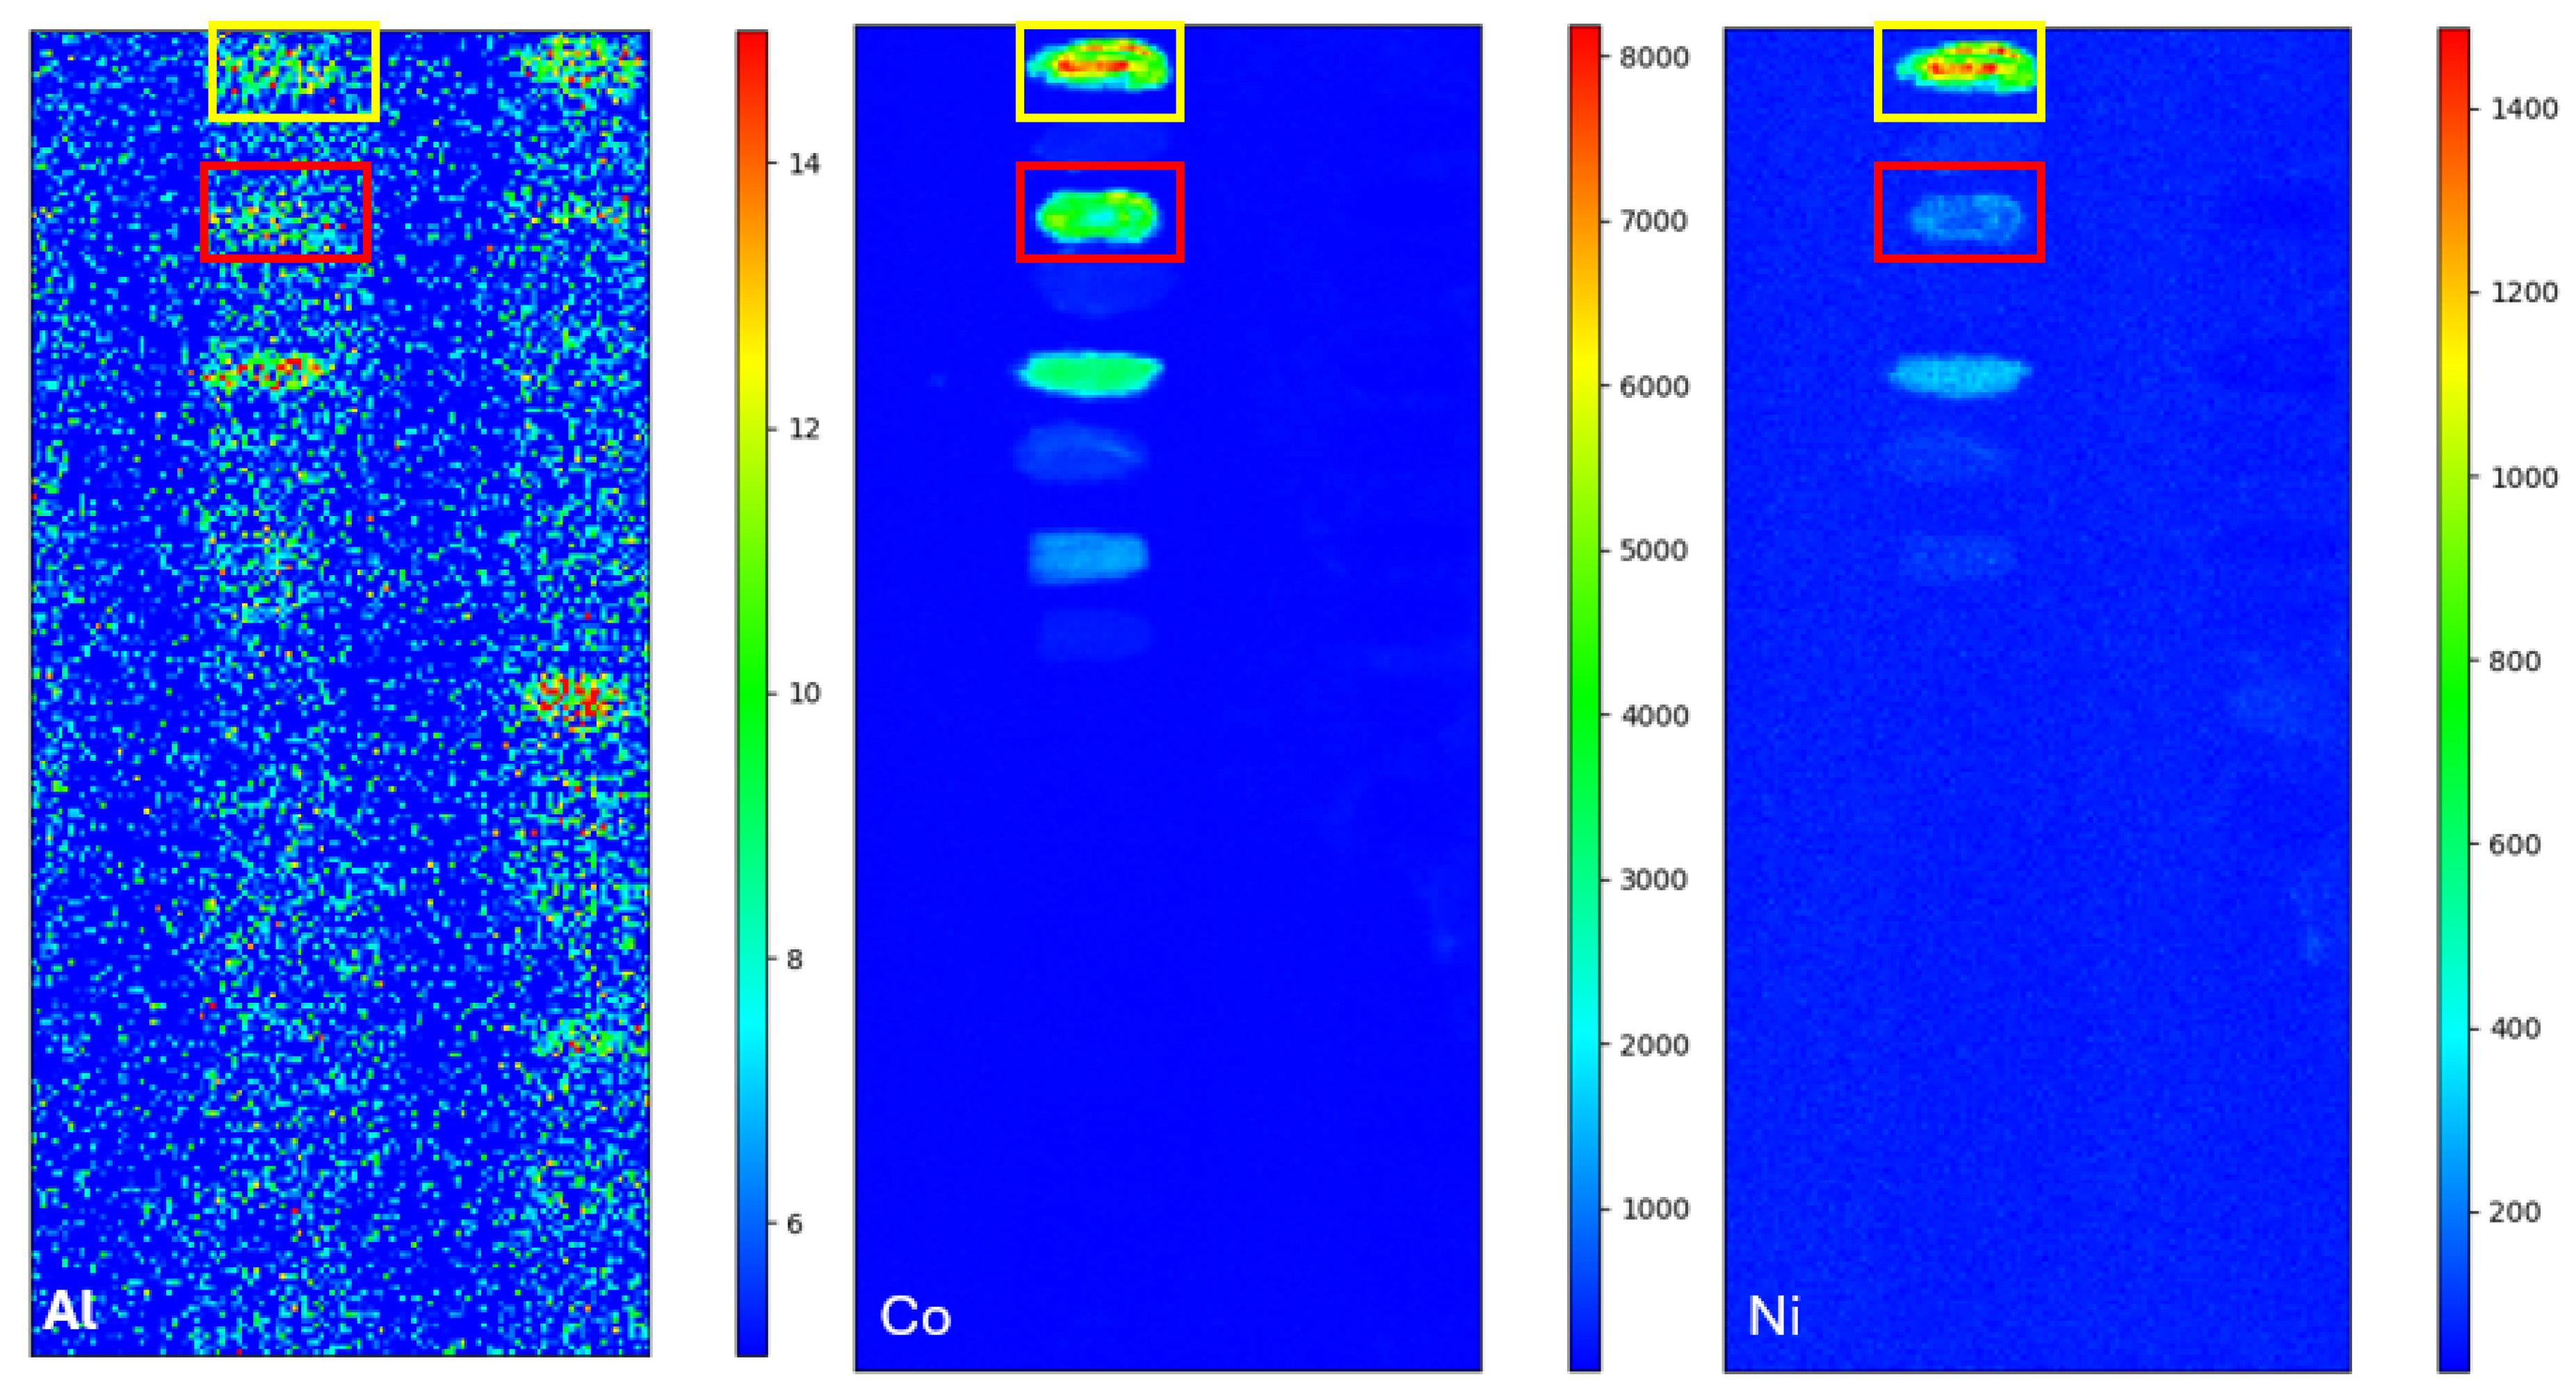
Figure 6) reveal marked differences in nickel concentration between the manufacturers studied. After extracting the average spectra for a pixel from the three cobalt blue colors, we could determine the number of counts associated with Co (K
) and Ni(K
) for 0.3 s. Ni(K
)/Co(K
) ratio reaches
for LF cobalt blue, compared to
for BLX and
for FB. The closer ratios between BLX and FB suggest comparable ore sources or refining process, while the significantly higher ratio observed for LF indicates the use of a cobalt ore richer in nickel or a less rigorous purification process.
LF cobalt blue exhibits the most pronounced cracking and appears visually more intense (
Figure 3). Comparing the intensity of cobalt in LF and BLX blue colors, swatches of relatively similar thickness, LF blue has indeed a higher cobalt content (
Figure 6). This intensity could explain its state of preservation, significant cohesive failures, which could indicate the use of a cobalt salt as a drier [
24,
25,
26].
3.2.3. Viridian
MA-XRF results show that the green colors are composed of chromium with trace amounts of calcium (
Table 2). This result is expected for chromium-based pigments [
27]. To distinguish whether the studied colors are indeed composed of hydrated chromium oxide pigment (
, PG18) and not chromium oxide pigment (
, PG17), data obtained by HSI will be useful.
The two green colors are distinguished in particular by the presence of trace amounts of potassium in the BLX swatch (
Table 2). This result could be related to the pigment manufacturing process. Indeed, the industrial production of chromium pigments from chromite ore generally involves a prior conversion to alkali dichromate, most often sodium or potassium dichromate. This precursor is then transformed by reduction, washing and/or calcination to obtain the desired chromium oxides [
12]. The detection of potassium could, for example, result from incomplete washing of the pigment.
3.2.4. Lakes
Identifying the pigment in madder lake is a well-known challenge, due to their complex composition and the low concentrations of dye in the pigment formulation [
28]. To identify the inorganic substrate of madder lake, which is a key element in their manufacturing process, X-ray fluorescence spectroscopy is useful. Although low levels of phosphorus may be associated with the dye source, the proportion of phosphorus in these lakes suggests the use of phosphate as a precipitating agent [
13]. And the metals present in these lakes: calcium, iron and lead (
Table 2), are known to be used in the production of madder lakes [
12]. The presence of aluminum is also well known and may be due to the precipitation of the lake with aluminum salts [
12,
13,
28].
Unlike lakes from other manufacturers, LF lakes do not contain aluminum in their composition, or if they do, they contain less, making it difficult to detect.
For FB lakes, the previous section demonstrated a different response under UV light for the dark madder lake compared to the two other FB lakes (
Figure 4). MA-XRF results show that the FB dark madder lake contains sulfur but not phosphorus or lead, unlike the other two FB lakes (
Table 2). Since no characteristic Raman bands of lead white were observed, the detected lead cannot be attributed to this pigment. According to the literature, lead could originate from the lake preparation, and both phosphate and sulfate have been reported depending on the manufacturing process [
12].
As explained in the
Section 3.1, the difference between these two BLX pale pink madder lake is the ground layer on which they were applied. MA-XRF analysis shows the presence of iron and zinc in the composition of the swatch of the third panel, which is not found in that of the first and these two elements are also present in the panel’s preparation layer (
Table 1).
3.2.5. Cadmium-Based Color
The results presented in
Table 2 show that FB cadmium yellow color would be produced with the cadmium yellow pigment (
, PY37) while the additional presence of zinc in the composition of BLX cadmium yellow suggests the use of cadmium zinc yellow pigment (
, PY35). Nevertheless, we cannot rule out the possibility that this yellow color was produced by a mixture of cadmium yellow (
, PY37) and zinc white (
, PW4). The traces of zinc observed in LF cadmium yellow (
Table 2) likely originate from the zinc white that makes up the preparation layer (
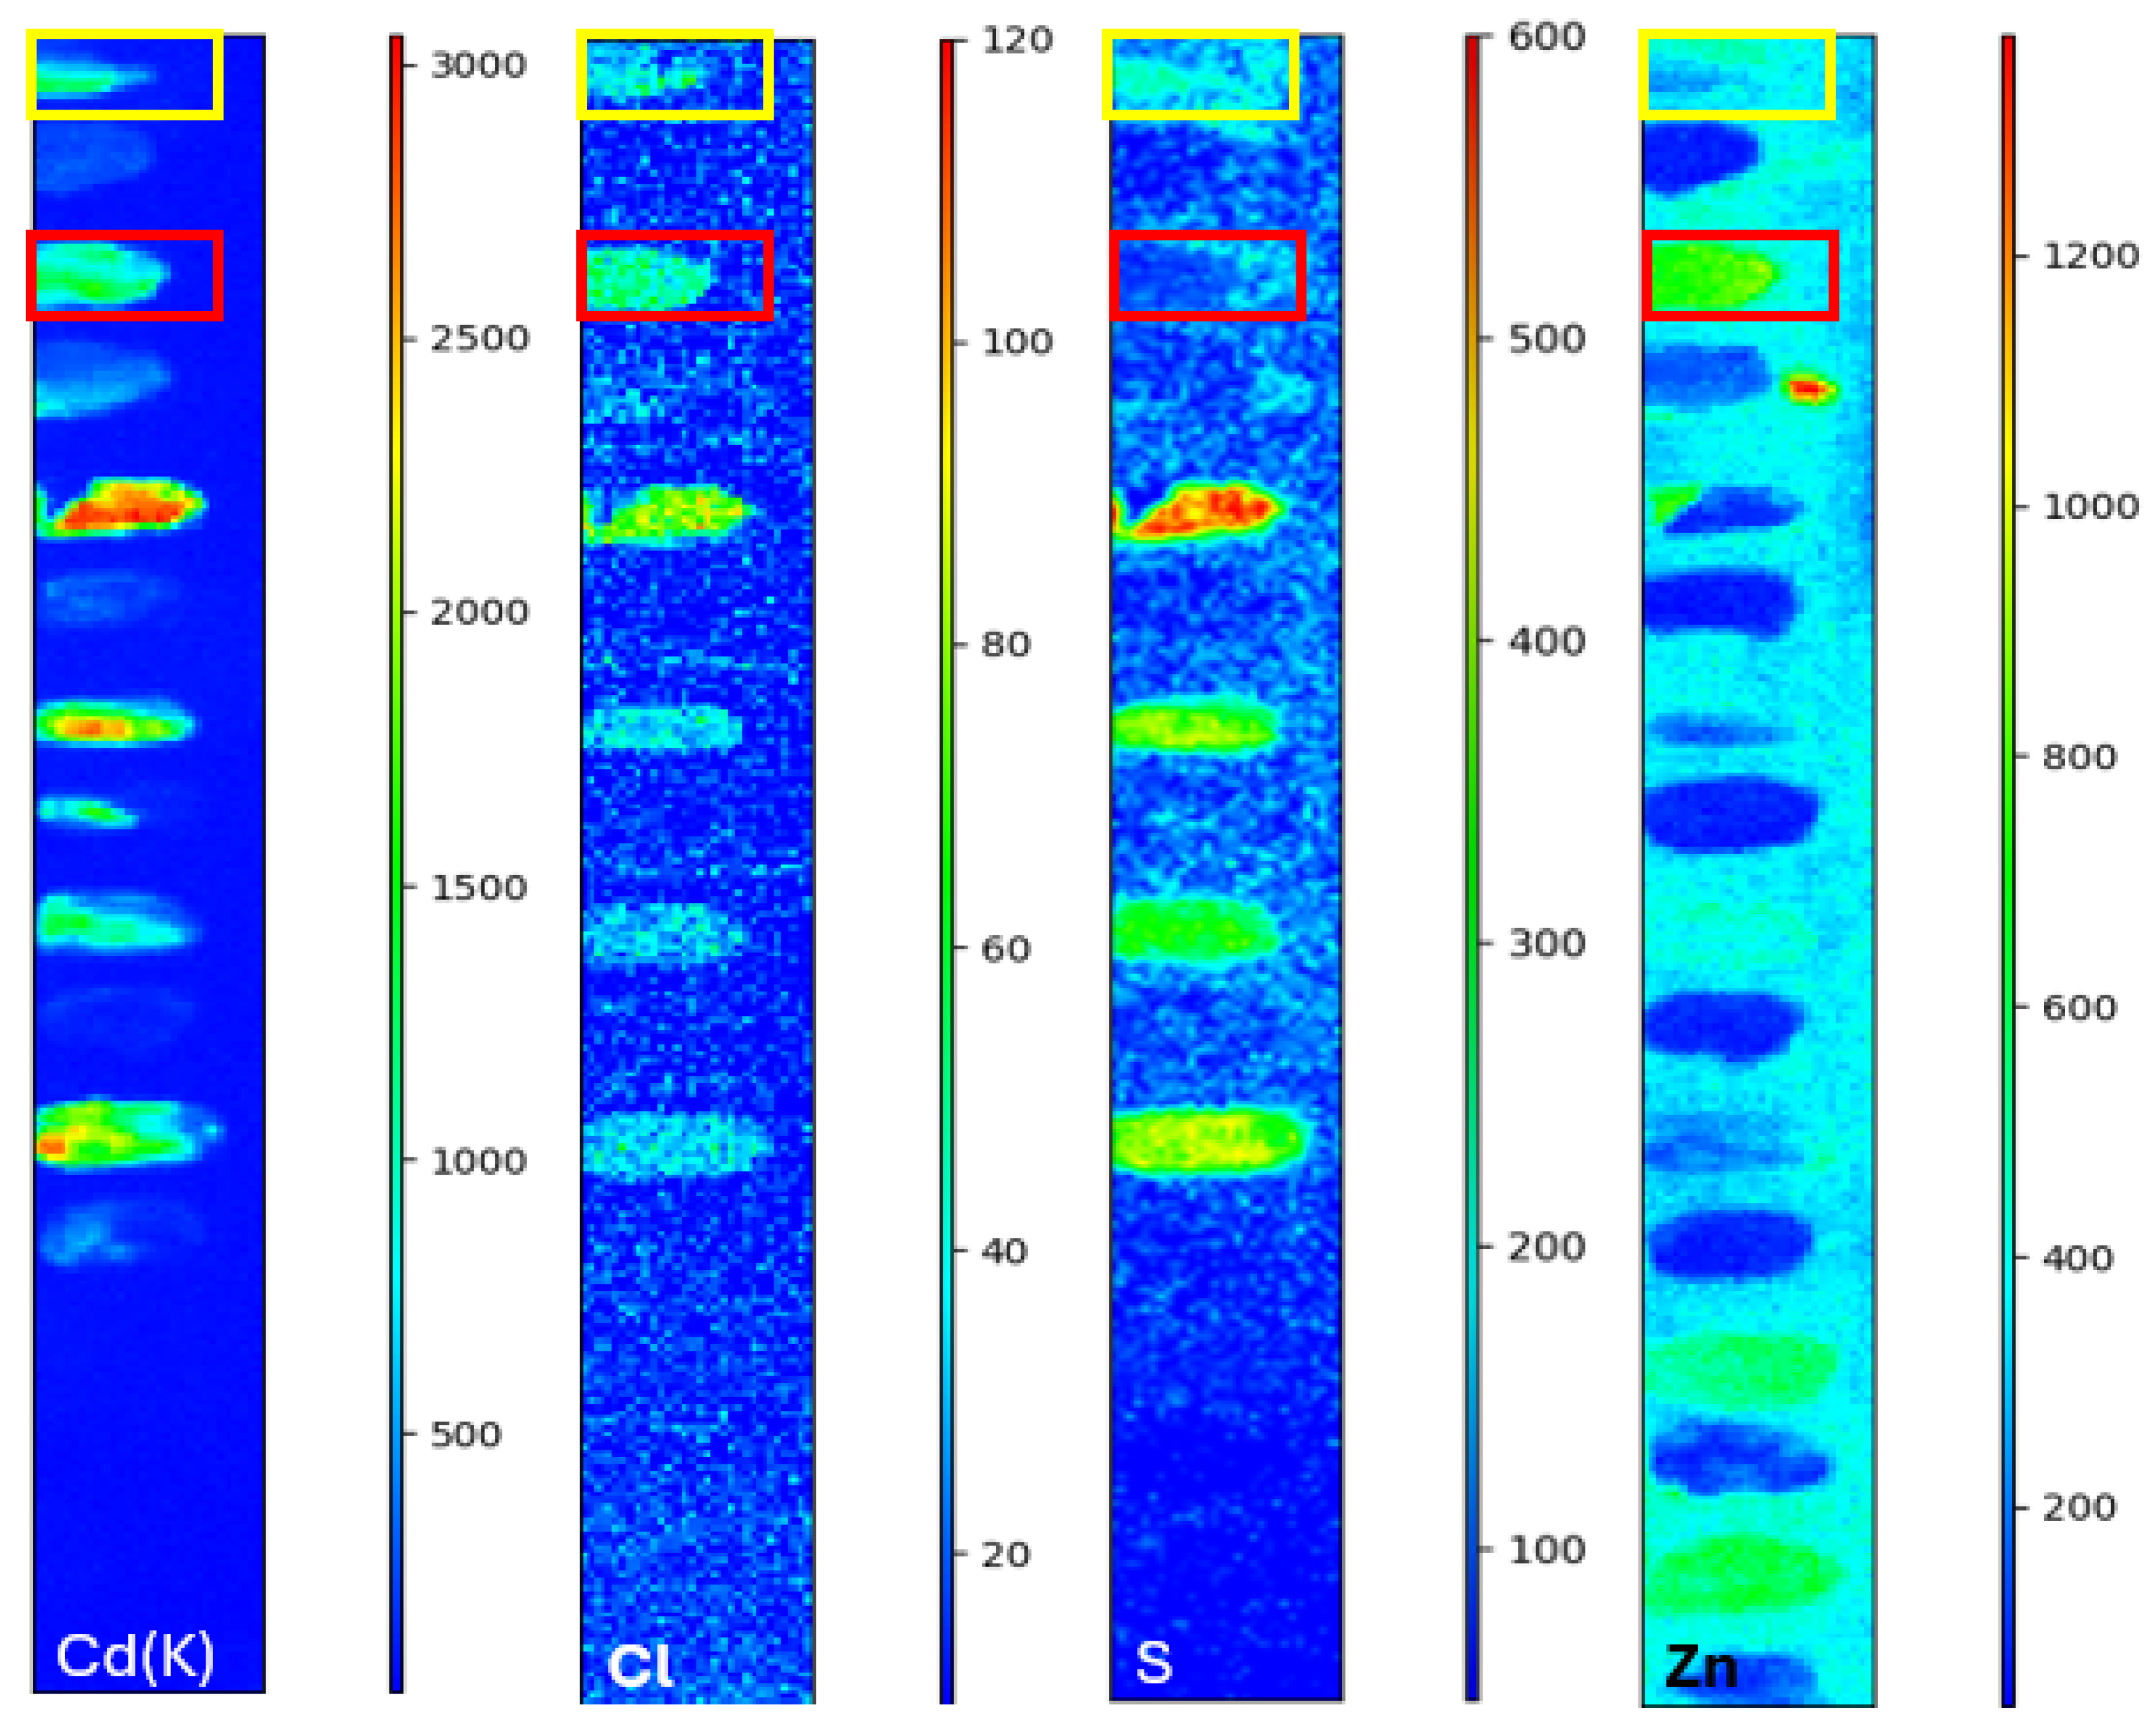
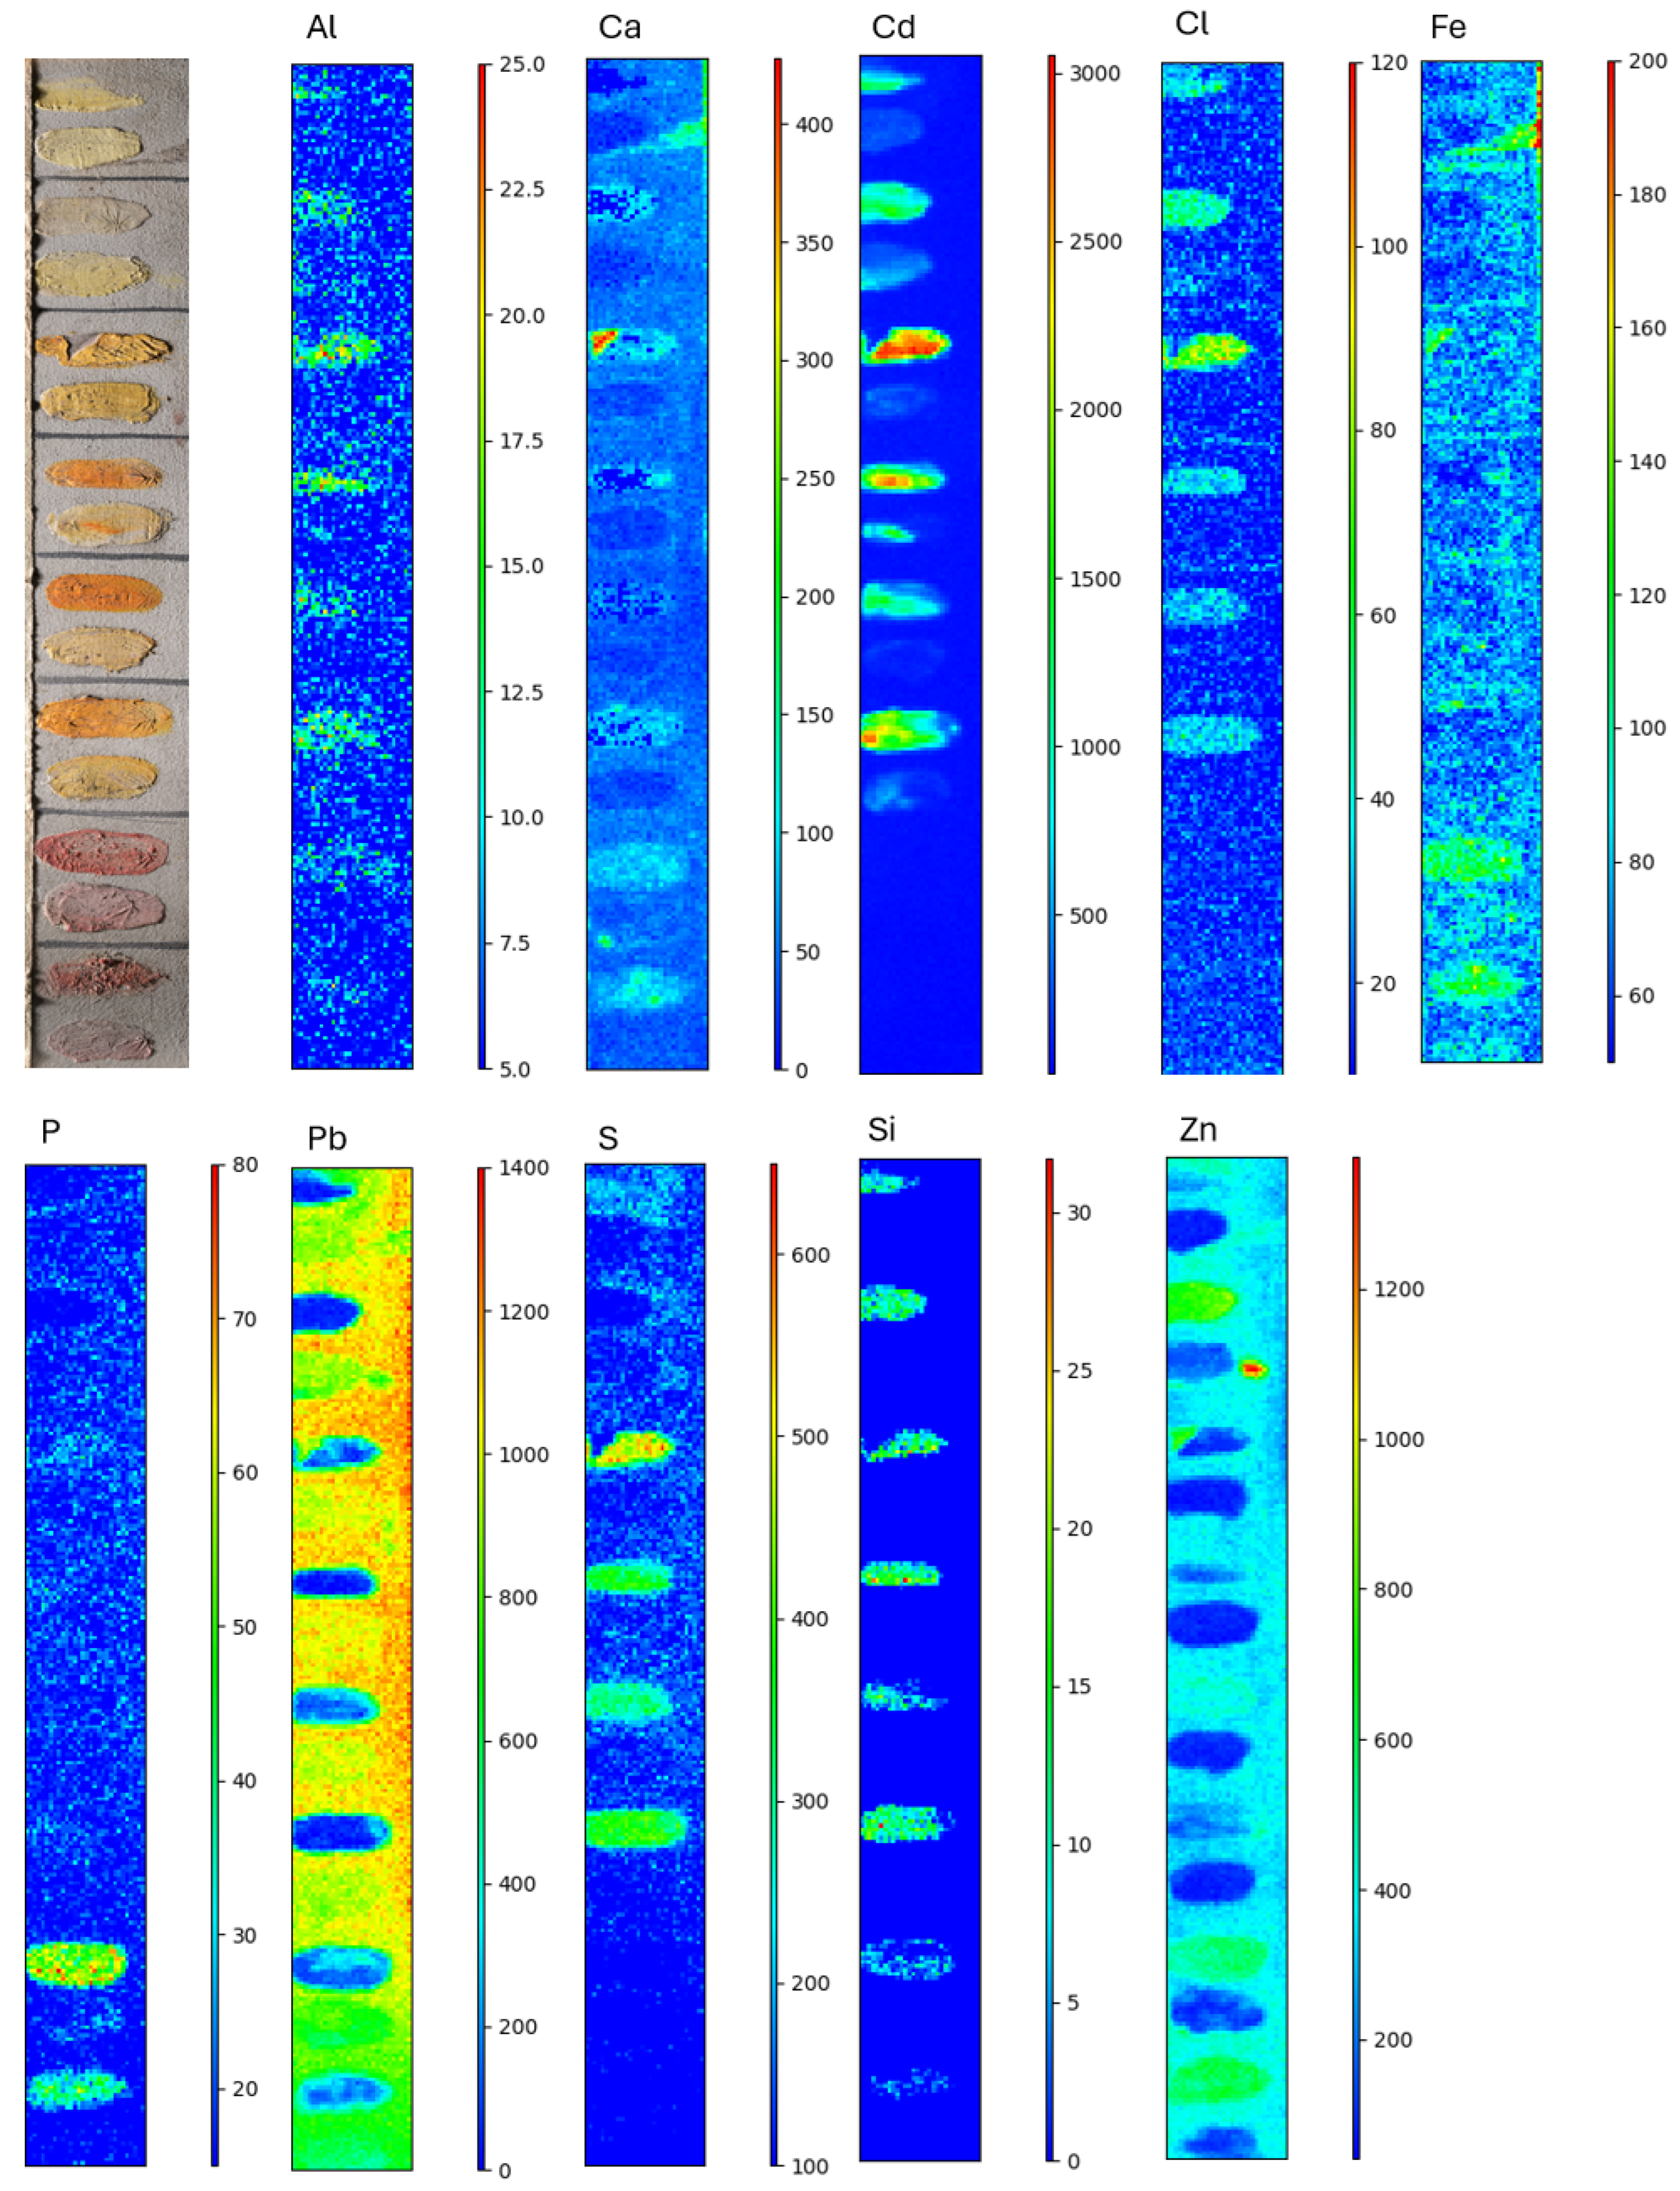
Table 1). Indeed, as shown in
Figure 7, the zinc distribution in this color is not pronounced enough to definitively classify it as cadmium zinc yellow pigment (
, PY35). Therefore, LF cadmium yellow would likely be cadmium sulfide (
, PY37) [
29].
The cadmium-based pigments studied all contain cadmium, as expected, and systematically exhibit the presence of chlorine. The occurrence of chlorine is consistent with the wet synthesis process of cadmium sulfide pigments, which consist of precipitating a soluble cadmium salt, such as
, with a soluble sulfur source,
[
30].
The Raman spectrum of the cadmium yellow pigment from BLX displays three main bands at 1080, 1150 and 1240 cm
−1 (
Table 2) that do not correspond to the characteristic vibrational signatures of cadmium sulfide [
17,
31]. Given that this is a degraded color, as stated in the
Section 3.1, are these bands related to pigment degradation products?
Indeed, recent atomistic studies have highlighted the key role of structural defects in the degradation of yellow cadmium pigments. The presence of cadmium vacancies promotes the interaction of
with the environment, and therefore in particular
,
, and
[
32,
33]. Moreover, studies conducted on major paintings such as Vincent Van Gogh’s
Flowers in a blue Vase (1887) [
34], Henri Matisse’s
The Joy of living (1905–1906) [
35] and James Ensor’s
Still Life with Cabbage (1921) [
36] have shown that the photo-oxidation of
can lead to the formation of secondary compounds such as cadmium sulfate (
), cadmium carbonate (
), and cadmium oxalate (
). In this context, the band observed at approximately 1082 cm
−1 can be attributed to the symmetric
stretching mode of the carbonate ion (
) consistent with cadmium carbonate, a known alteration product of cadmium yellow pigment [
37,
38]. The band near 1150 cm
−1 may be assigned to the antisymmetric
stretching mode of sulfate ions
, supporting the occurrence of CdS oxidation processes [
39,
40]. The origin of the band detected around 1240 cm
−1 remains unclear and could not be confidently assigned based on the available reference spectra.
Moreover, the study of cadmium yellow in Edvard Munch’s
The Scream (1910) [
41] shows that these degradations are particularly pronounced for cadmium yellow produced by wet process. The presence of chlorine in the pigment promotes photo-oxidation by reacting with cadmium sulfide. This reduces the band gap of
, increasing its photosensitivity. Chloride ions can form
, which is highly hygroscopic, creating an aqueous environment that promotes sulfate migration [
42]. And indeed, the distribution of chlorine (
Figure 7) shows a more intense signal for the degraded yellow of BLX than for the yellow of LF.
LF cadmium orange contains traces of selenium (
Table 2), indicating that it is composed of cadmium orange pigment (
(
), PO20). However, the exact composition of cadmium oranges BLX and FB cannot be determined. Nevertheless, they can be identified as cadmium-based pigments due to the presence of cadmium and sulfur in their composition. Although the orange colors studied were also produced using a wet process, as evidenced by the presence of chlorine in their composition, only the yellow ones were altered. This observation is consistent with findings in the literature, where cadmium orange pigments appear to be more stable [
43].
3.3. Reflectance Spectra
The comparison of reflectance spectra begins with the behavior of spectra, and more particularly the evolution of the main IP when white is added to the color.
As a reminder, Emile Claus did not specify the proportion of white used in the paint mixtures. Given the rigorous execution of the aging tests, we can assume that the proportion of white was globally similar for all colors.
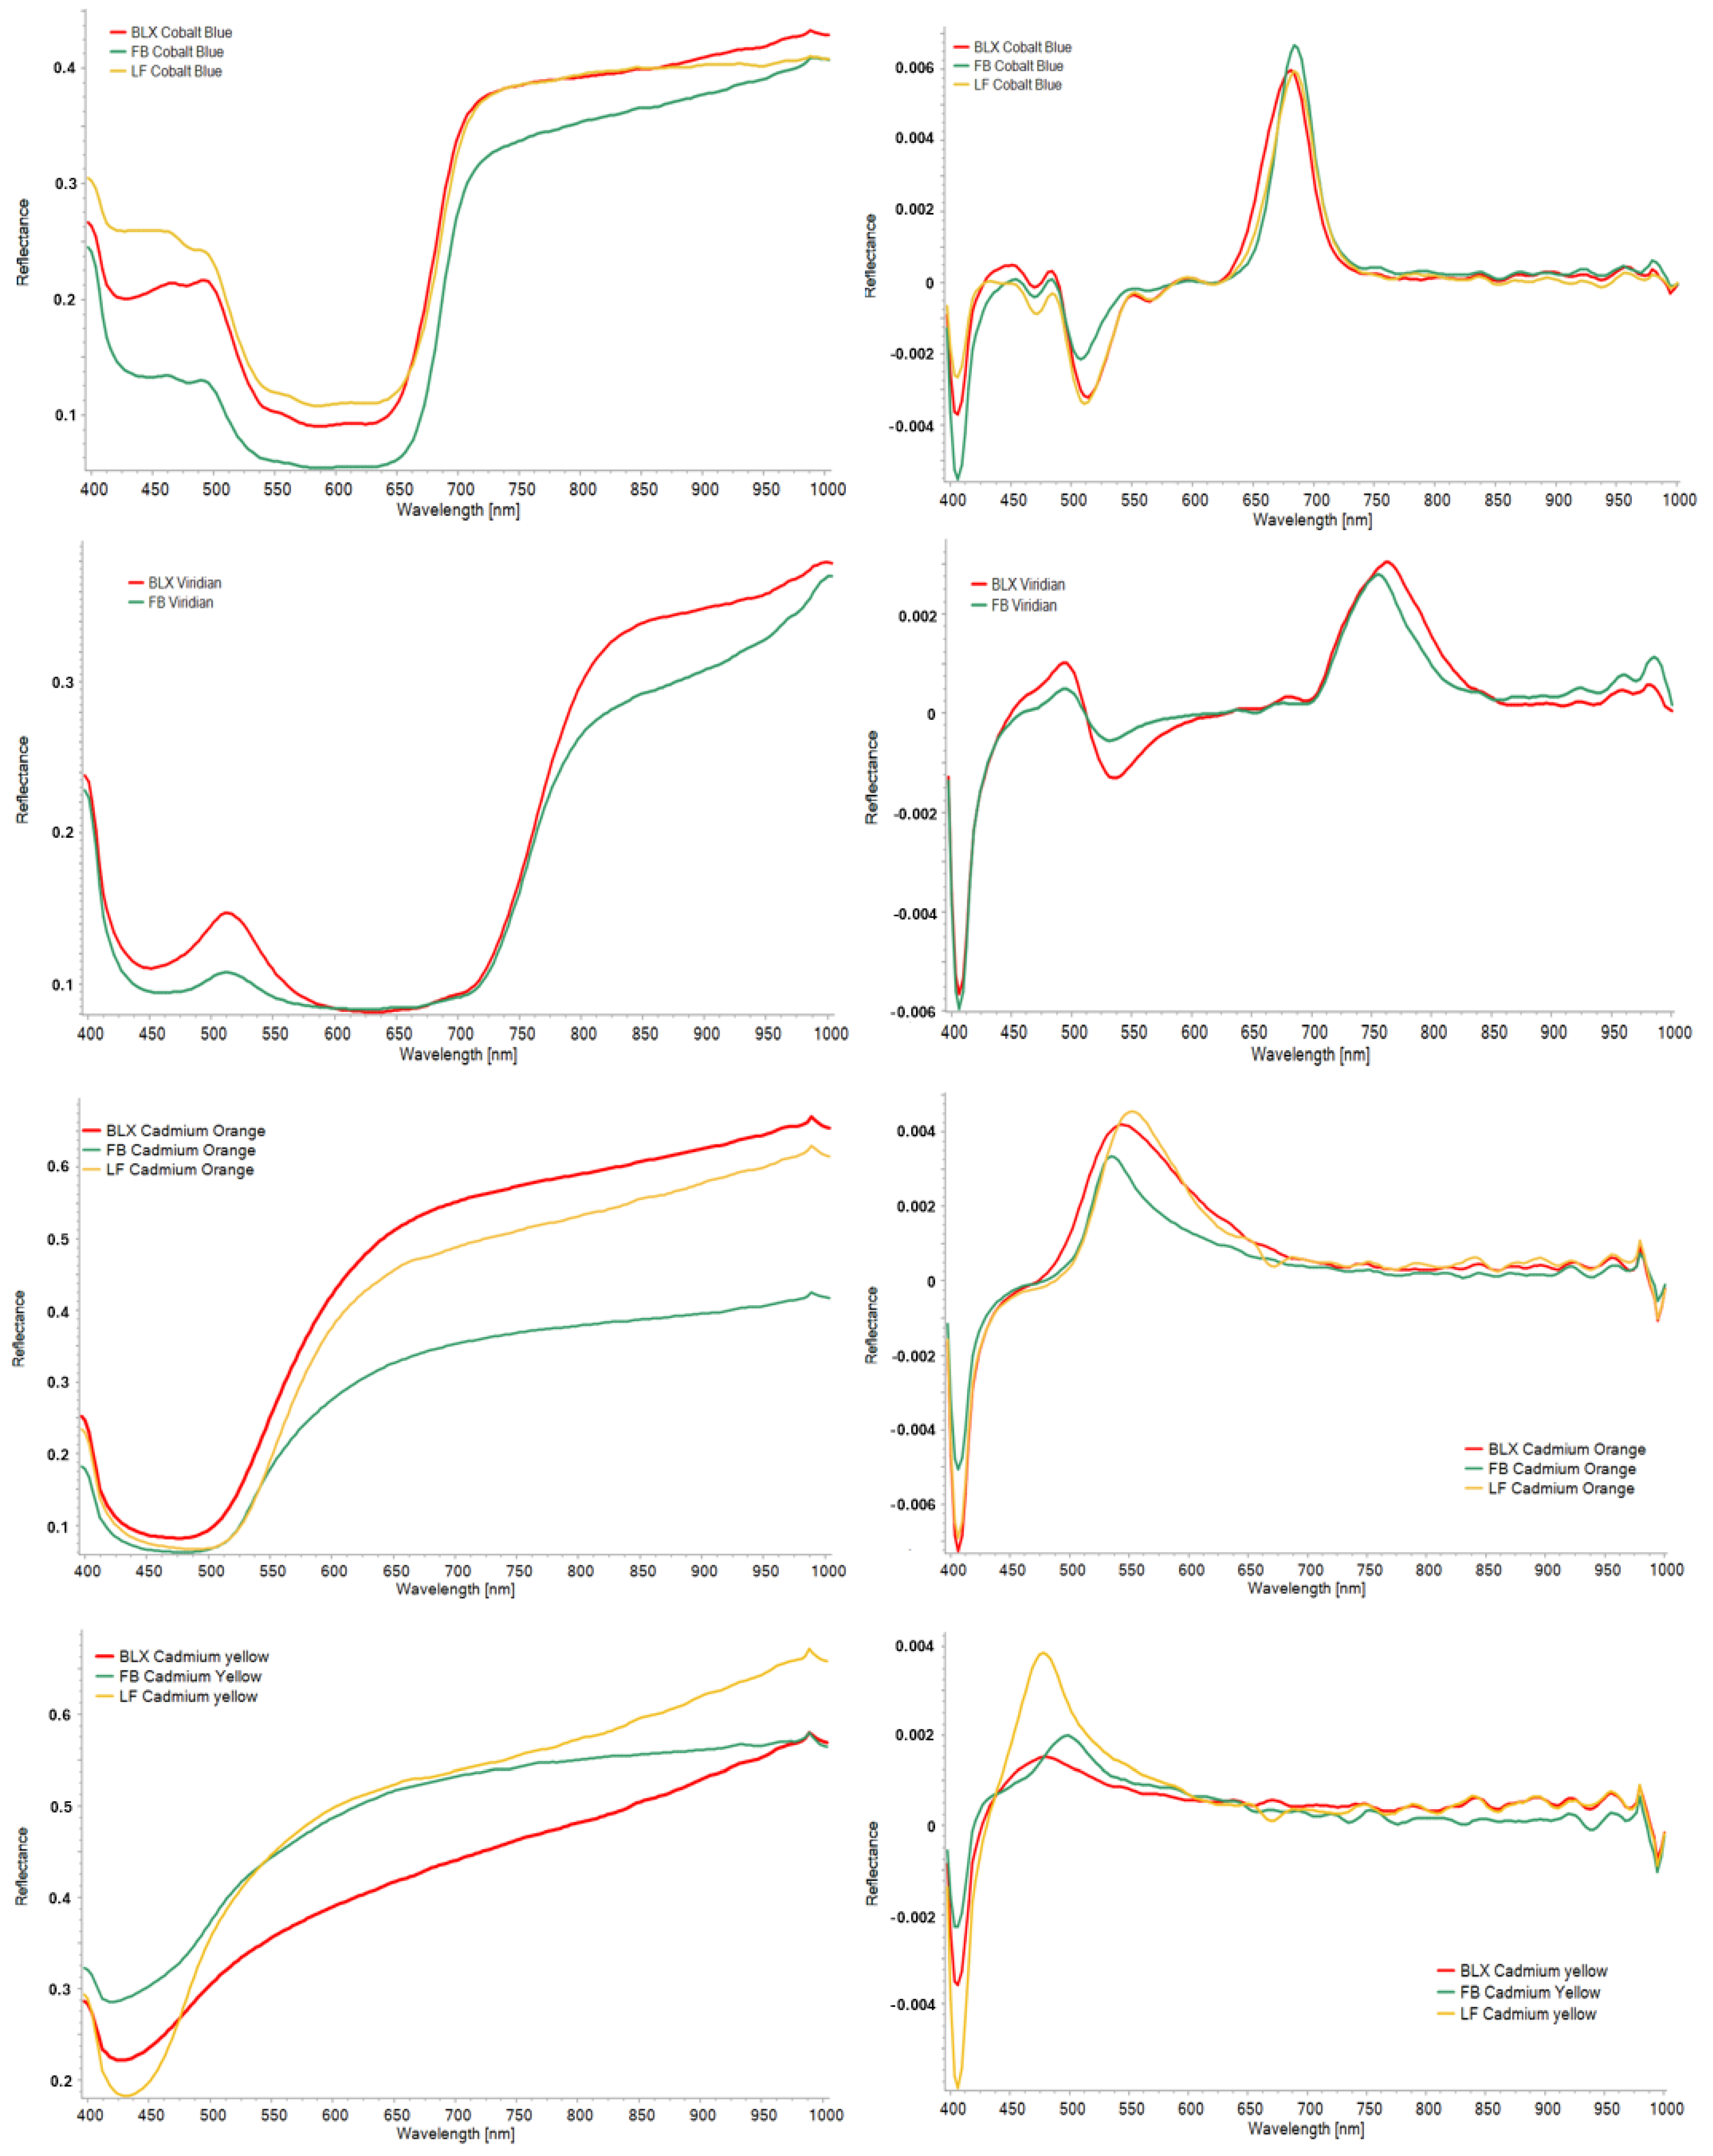
Mixing pigments with similar relative amounts of white should modify the reflectance spectra in a systematic manner. The effective concentration of the colored pigment decreases, resulting in a less abrupt transition from low to high reflectance values. Consequently, in the first-derivative spectra, the main IP becomes wider and less intense. This behavior is characterized by an increase in the full width at half maximum (FWHM) and a decrease in peak height (h), leading to a lower h/FWHM ratio. As highlighted in red in
Table 3, this ratio is indeed lower for all colors mixed with white, with the exception of cadmium yellows and FB viridian, which are highlighted in blue.
For most pigments, a shift of the principal IP toward shorter wavelengths may occur as a result of hue lightening. As shown in
Table 3, for colors mixed with white, when the main inflection point shifts towards lower wavelengths, it is highlighted in red; otherwise, it is highlighted in blue. The expected behavior, a shift towards lower wavelengths, is observed for colors where the color of the main pigments has changed, due to aging, as for madder lake and cadmium yellow, whereas for pigments where failure of adhesion or cohesion (for instance cobalt blue) is observed no shift is observed.
Spectra from the same color group are now compared to improve pigment identification initiated by MA-XRF and Raman analyses when necessary, but also to identify any differences between the pigments of the three manufacturers.
3.3.1. Cobalt Blue
In the visible range, cobalt blue is characterized by weak absorption bands arising from Co(II) d–d electronic transitions and centered at approximately 546, 582, and 623 nm [
44,
45]. These three absorption features are clearly observed in the cobalt blue spectra and remain unaffected by the addition of lead white (
Table 3).
As presented in
Table 4, similarity rates are higher between BLX and LF. This result is consistent with the observed shape of the main IP: their heights are practically identical, and their FWHM are closer than between LF and FB. This observation could be compared to to the condition of the paints described in the
Section 3.1. The state of preservation of the LF color appears to be closer to that of BLX than to that of LF. Given the MA-XRF results, which show a closer
/
ratio betwee BLX and FB, one might have expected better ratios between these two colors. The greater spectral similarity between LF and BLX can be explained by the fact that these two colors are applied to the same board and that their reflectance spectra come from the same datacube, thus introducing a positive correlation between them.
As shown in
Table 3, BLX color has a slightly lower main IP than the other two colors. One might therefore expect LF and BLX to score higher for P and C, as these metrics take the shape of the spectrum more into account than differences in intensity. However, this variation remains minor across the entire spectrum (
Figure A4).
3.3.2. Viridian
As shown in
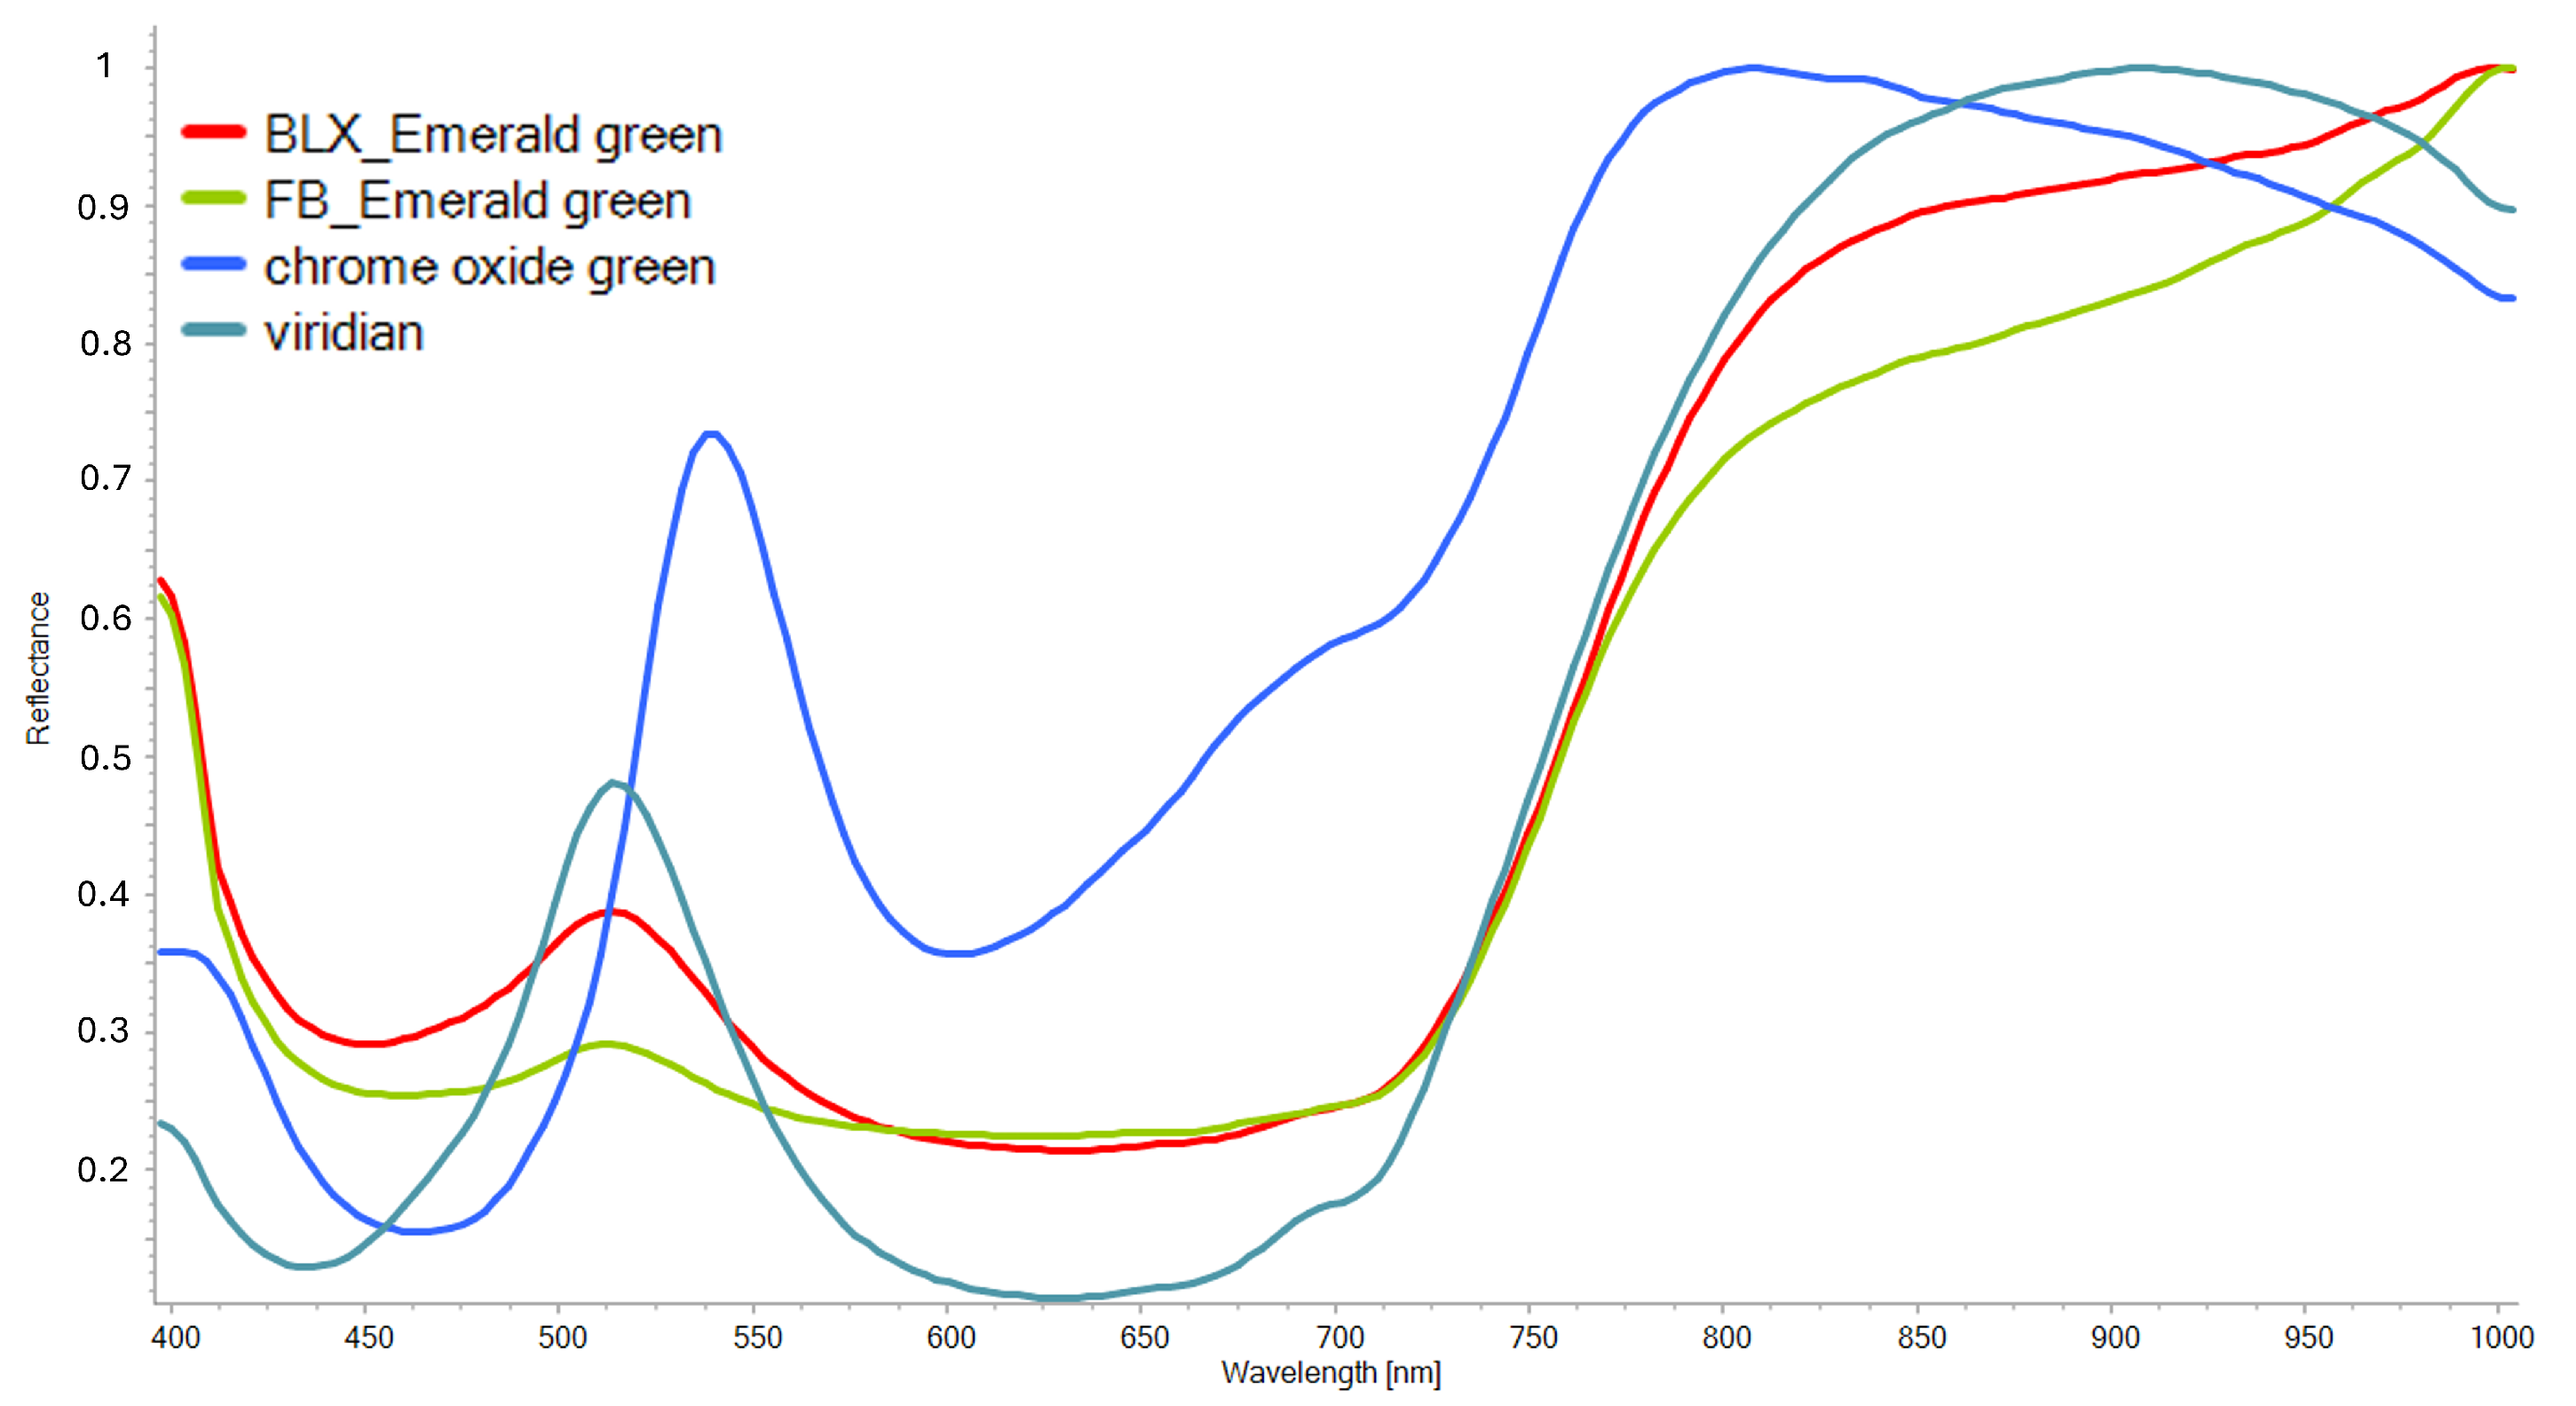
Figure 8, comparison of the reflectance spectra of the greens studied with reference spectra shows that they are both composed of the green pigment hydrated chromium oxide or viridian (
, PG18).
The similarity rates obtained between these two colors reflect a significant similarity in the shape of the spectra (P and C) and a less advantageous similarity when their intensity is taken into consideration (E) (
Table 4). Indeed, the absorption bands are more pronounced (
Figure 8) and the transition from low to high reflectance is greater for the BLX color, resulting in a more intense main IP (
Table 3,
Figure A4). The characteristics of the PG18 pigment are more clearly observed in the reflectance spectrum of the BLX color.
3.3.3. Lakes
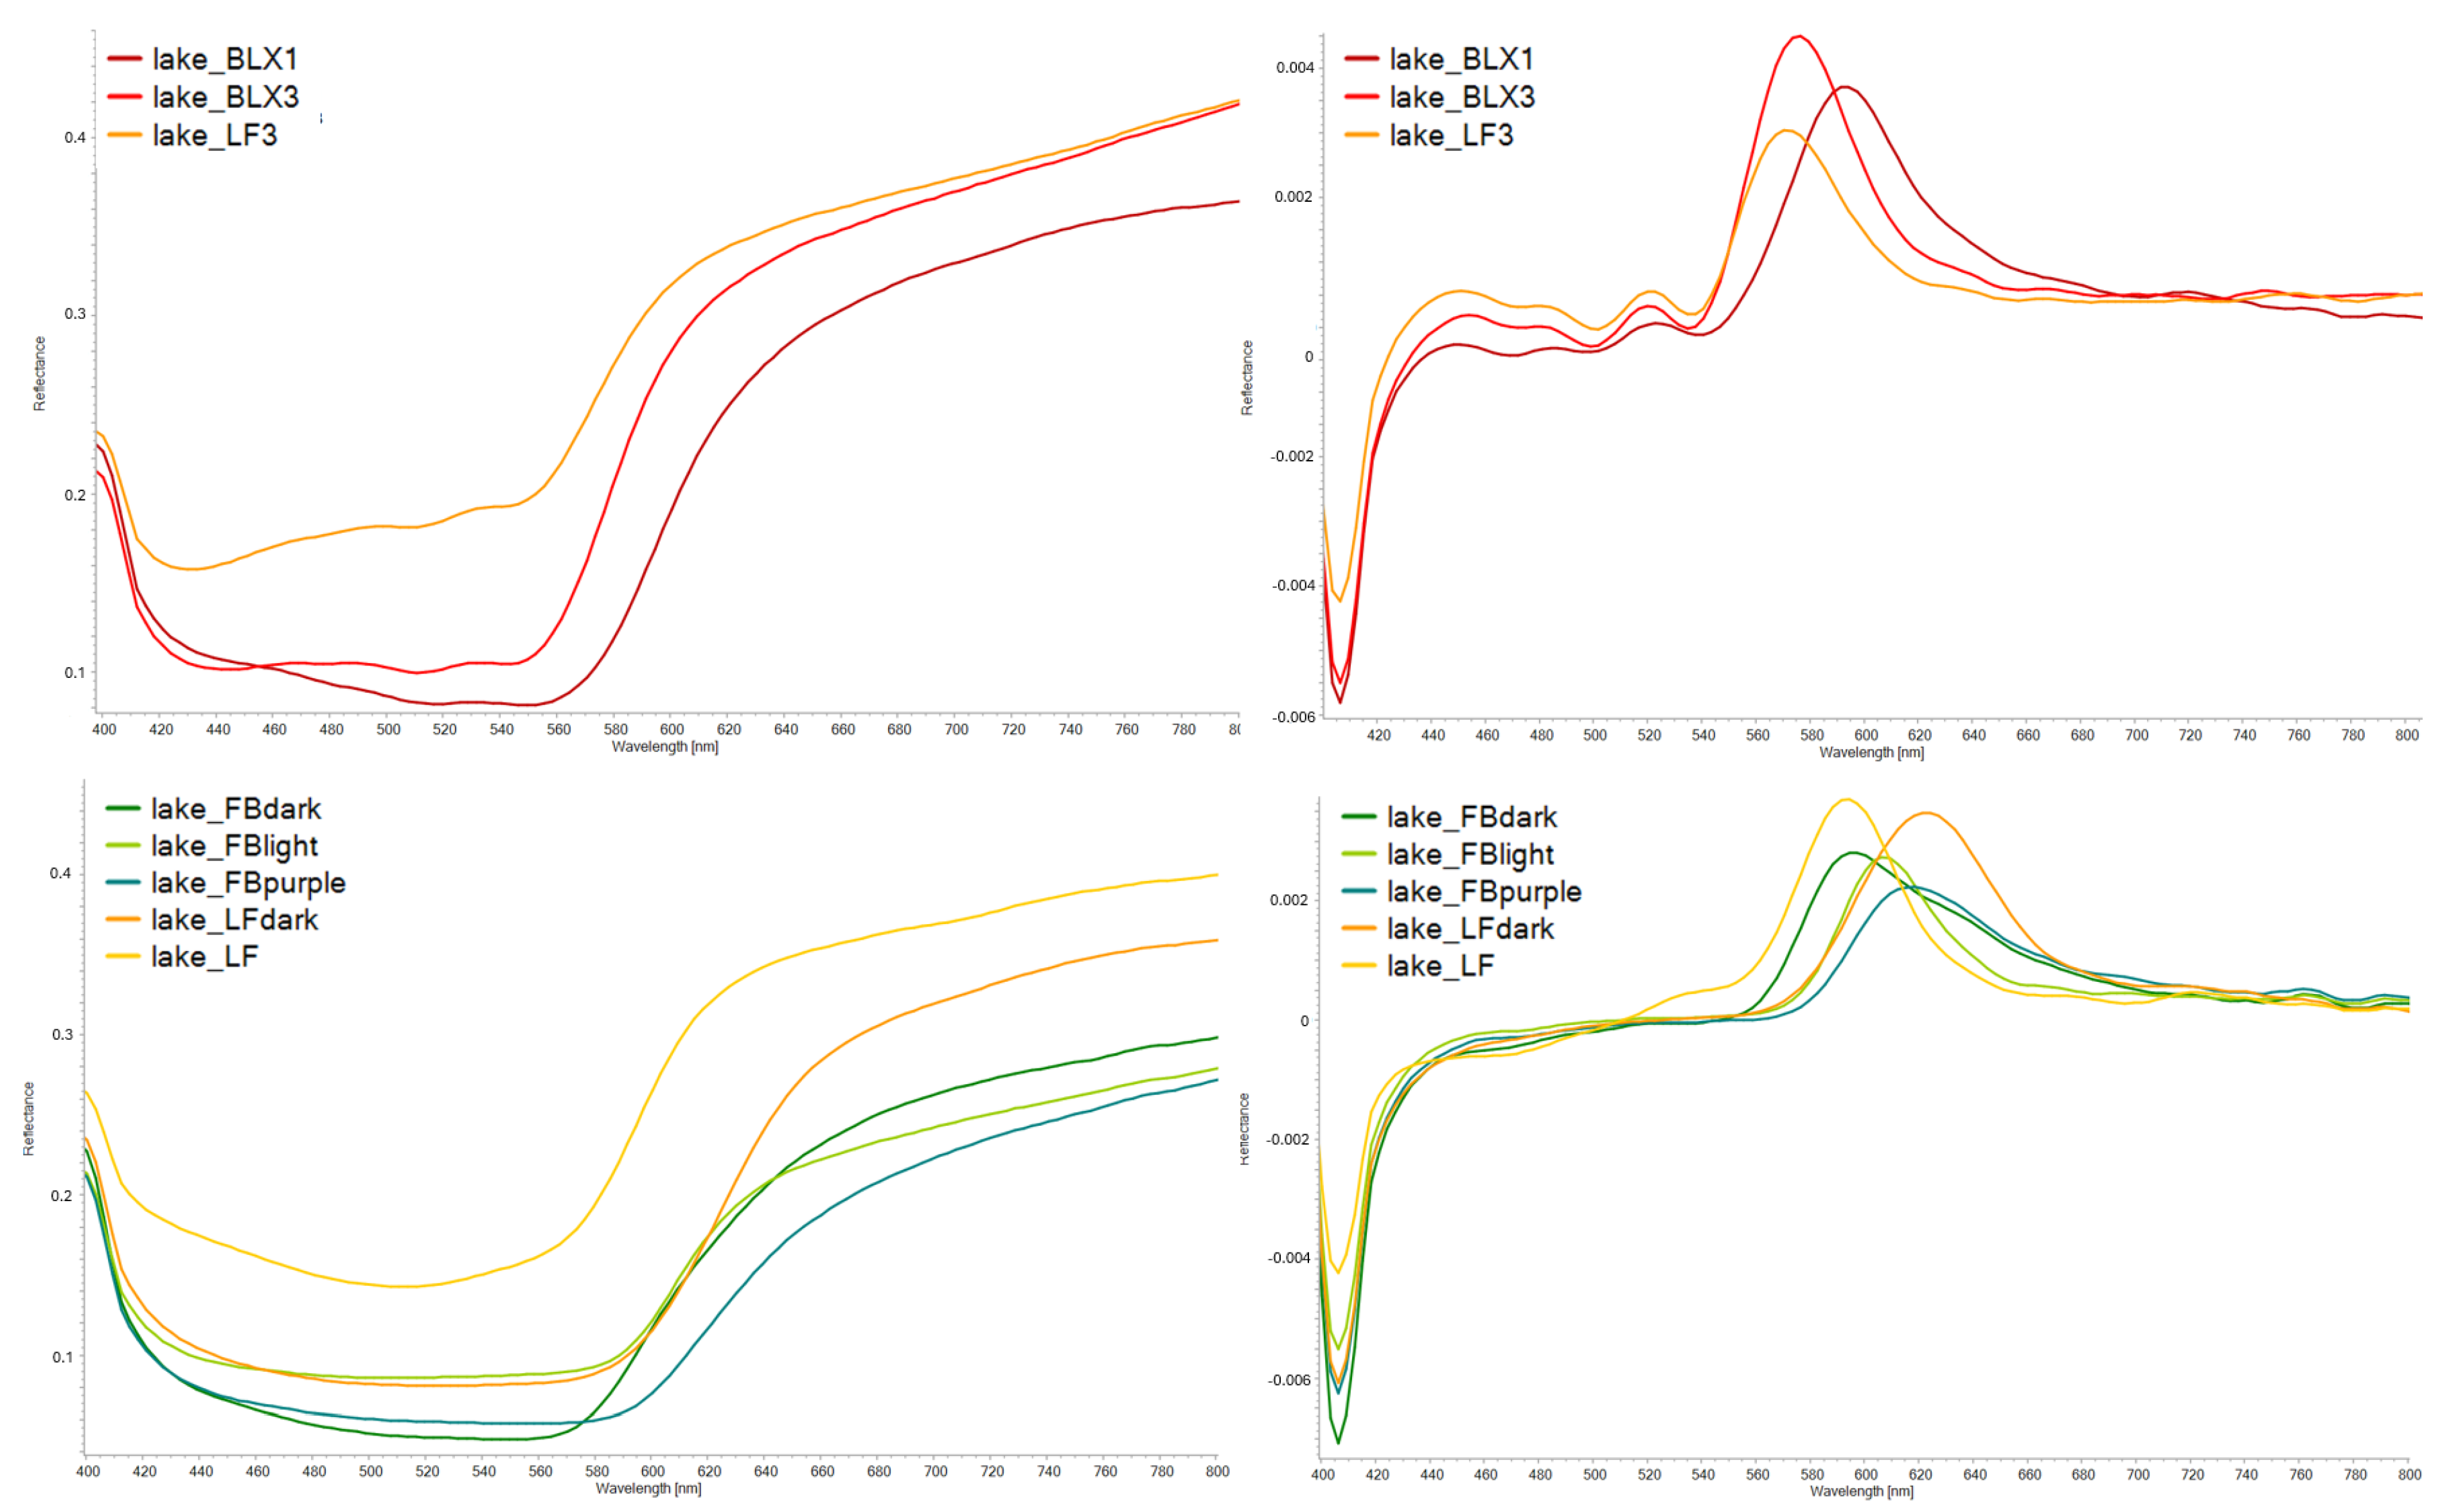
The reflectance spectra of the lakes allow us to distinguish a group of lakes. Pale pink madder lakes and the others studied lakes, namely the light, dark and purple madder lakes of FB, as well as the Smyrna lakes of LF, because the pale pink madder lakes, unlike the others, all exhibit three absorption bands located approximately at 440, 510 and 540 nm (
Figure 9). This result would indicate that the dye used for the pale pink madder lakes is purpurine-based, although it does not rule out the possibility of a mixture with another dye [
12,
46]. The similarity rates clearly show that the spectra of the two degraded colors are more similar (
Table 4). It is also not surprising to observe that the main IP of the better-preserved lake is located at higher wavelengths, given that its red hue is more intense and the difference in intensity between the lakes of the third panel is easily explained by the fact that LF3 is in a more advanced state of degradation than BLX3 (
Figure 9). And although the two BLX lakes are not in the same state of preservation, the metrics confirm that the BLX1 has a higher rate of similarity with the BLX3 than with LF3 (
Table 4).
3.3.4. Cadmium-Based Colors
For orange colors, a link can be established between spectral characteristics and the color state described in the
Section 3.1. As presented in
Table 3, the most intense IP with the smallest FWHM is also the color least affected by cohesive breakage, namely FB orange. Conversely, BLX orange, which has deeper cracks, has the broadest and least intense IP. Regarding similarity rates, there are no significant differences between the orange colors from different manufacturers for the P and C metrics (
Table 4).
The cadmium yellow swatches from BLX and LF show comparable absorption band positions in the visible range, ∼430 nm, (
Table 3), resulting in high similarity scores (
Table 4). However, analysis of the first-derivative spectra highlights marked differences in the main IP. Indeed, due to the degradation of BLX and FB yellow colors, their intensity are lower and much wider than that of LF (
Table 3). This result is consistent with the whitening of the color, which tends to flatten the spectrum as explained previously (
Figure A4).
4. Conclusions
This study aimed to characterize and compare the composition and state of preservation of nominally identical colors from different manufacturers by analyzing the colors that composed the aging tests carried out by Emile Claus on three panels.
Analyses performed on these panels revealed differences in the manufacturing processes of nominally identical colors between the manufacturers. For the cobalt blues, MA-XRF revealed a significantly higher Ni/Co ratio for LF blue, suggesting either the use of a different cobalt ore or a less refined purification process than for the other two manufacturers. Furthermore, the apparent concentration of cobalt pigment seems higher in this color, which could explain its state of preservation if LF used cobalt salts whose drying properties are known. This same analysis also showed a lower aluminum concentration for the LF range of lakes, again highlighting specific choices in the manufacturing process of these lakes.
This study demonstrated that certain alterations can occur not due to the intrinsic composition of the pigment, but rather in connection with external factors, such as the ground layer. This is particularly evident in the case of pale pink madder BLX lakes. That applied on zinc white ground layer degrade, unlike that applied over a lead white ground layer, which is better preserved. This suggests an influence of zinc white on the degradation of the lakes.
Raman analysis identified the well-documented degradation products of cadmium yellows. Furthermore, the higher chlorine content in the BLX yellow, compared to the similar swatch from LF, could have played a significant role in its degradation by promoting its hygroscopic nature.
HSI shows that, for most pigments, the addition of lead white results in a systematic shift of the main IP towards shorter wavelengths, a phenomenon consistent with the optical dilution effect expected in mixtures of colors and white. However, deviations from this general trend are observed for altered colors. Overall, by combining derivative spectral analysis with quantitative similarity metrics, this approach enables a refined comparison of paint formulations from different manufacturers while remaining fully non-invasive.
Finally, the FB colors, all located on the second panel, were exposed to the outdoor weathering conditions for 21 months outdoors, unlike the other panels which were only outside for 8 months. Yet, whether through visual examination of the colors or study of the data collected through physico-chemical analyses, we observed no further degradation related to this difference in exposure time, which should nevertheless be taken into account.
Despite the results obtained, further analyses incorporating other analytical techniques, such as X-ray diffraction for example, could refine the interpretation of the production or composition of colors. In addition, the analysis of micro-samples would be useful to improve the identification of pigments, particularly cadmium yellow and lakes, and would also allow a better understanding of degradation processes, including the distinction between surface and bulk alterations.
Author Contributions
C.D., D.S. and M.L. realized the in situ measurements. N.d.V. performed the extraction of average spectra from XRF data. E.D. carried out the processing of the HSI data and interpreted the results of the analysis. E.D., D.S., F.V. and C.D. have discussed the results. C.D. and F.V. supervised the project. All authors have read and agreed to the published version of the manuscript.
Funding
This research was funded by the Belgian Science Policy Office (BELSPO, Brussels) through the FED-tWIN project Face to Face (FED-tWIN2019-prf060).
Informed Consent Statement
Not applicable.
Data Availability Statement
The datasest used and/or analyzed during the current study are available from the corresponding author on reasonable requests.
Acknowledgments
The authors sincerely thank Kim Oosterlink (RMFAB) for his commitment that greatly assisted this research. The authors would also like to express their gratitude to Véronique Cardon, Archives of Contemporary Art of Belgium (RMFAB) and Ludovic Godfrin, Modern painting collection department (RMFAB).
Conflicts of Interest
The authors declare no conflict of interest.
Abbreviations
The following abbreviations are used in this manuscript:
| ACAB | Archives of Contemporary Art in Belgium |
| RMFAB | Royal Museum of Fine Arts of Belgium |
| BLX | Blockx |
| LF | Lefranc Bourgeois |
| FB | Fritz Behrendt |
| CEA | Centre Européen d’Archéométrie |
| IRR | InfraRed Reflectography |
| XRR | X-Ray Radiography |
| RS | Raman Spectroscopy |
| MA-XRF | Macro X-Ray Fluorescence |
| HSI | HyperSpectral Imaging |
| IP | Inflection Point |
| P | Pearson correlation coefficient |
| C | Cosine similarity |
| E | Euclidean distance |
| FWHM | Full Width at Half Maximum |
Appendix A
Pearson Correlation Coefficient (P): measures the linear relationship between two data sets
X and
Y and is defined as
Here,
n is the set size,
and
are individual values, and
and
their means. The coefficient ranges from
, for a perfect negative correlation, to 1, for a perfect one, with 0 indicating no linear correlation. In this paper,
is expressed as a percentage. It is insensitive to amplitude differences, therefore identical spectra with different absolute reflectances yield a maximum similarity score [
47,
48].
Cosine Similarity (C): measures the similarity between two
n-dimensional vectors by computing the cosine of the angle between them. For vectors
X and
Y, it is defined as
The resulting value lies in the interval
, as for (P). This metric is insensitive to differences in spectral amplitude [
49].
Euclidean Distance (E): computes the distance between two vectors
X and
Y in an
n-dimensional space:
This distance is normalized to obtain a percentage similarity score:
If
, then
, the score decreases as the distance increases. Unlike the previous metrics, this method is sensitive to spectral intensity differences [
50,
51].
Appendix B
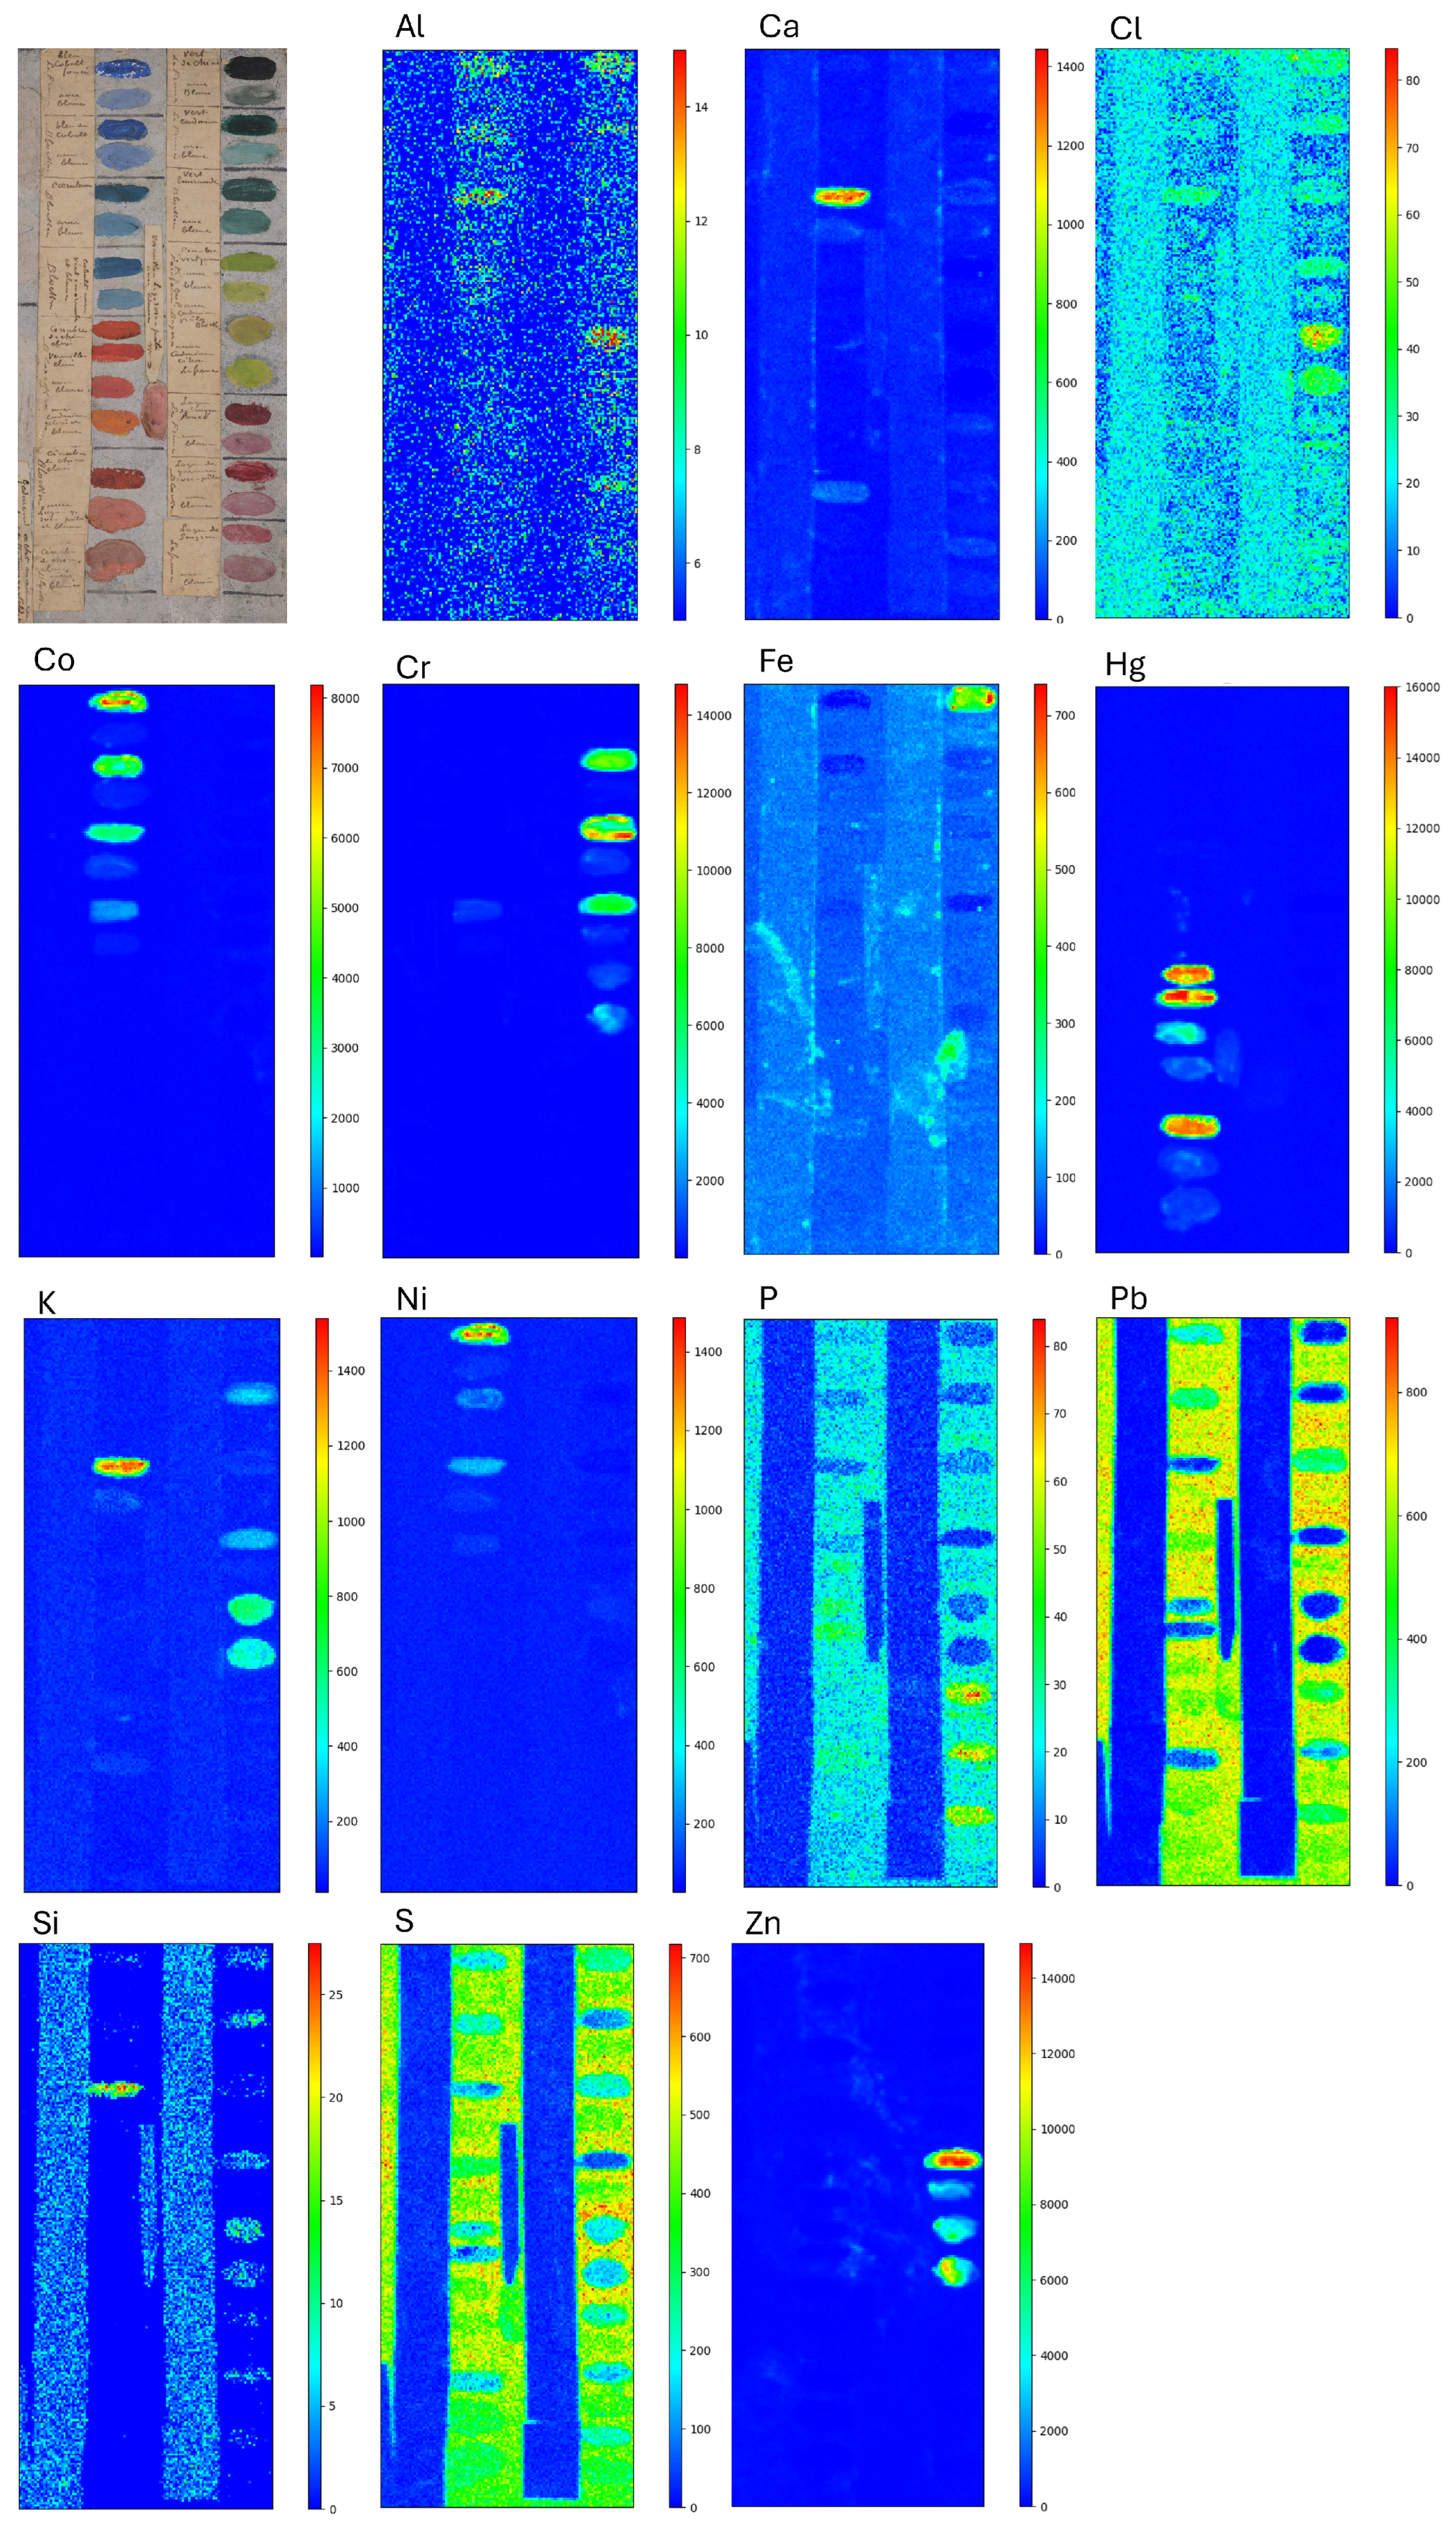
Figure A1.
Area Studied by MA-XRF in the first panel and resulting elemental maps (Al, Ca, Cl, Co, Cr, Fe, Hg, K, Ni, P, Pb, S, Si, Zn). The color scale in the elemental distribution is the count number in the XRF spectrum.
Figure A1.
Area Studied by MA-XRF in the first panel and resulting elemental maps (Al, Ca, Cl, Co, Cr, Fe, Hg, K, Ni, P, Pb, S, Si, Zn). The color scale in the elemental distribution is the count number in the XRF spectrum.
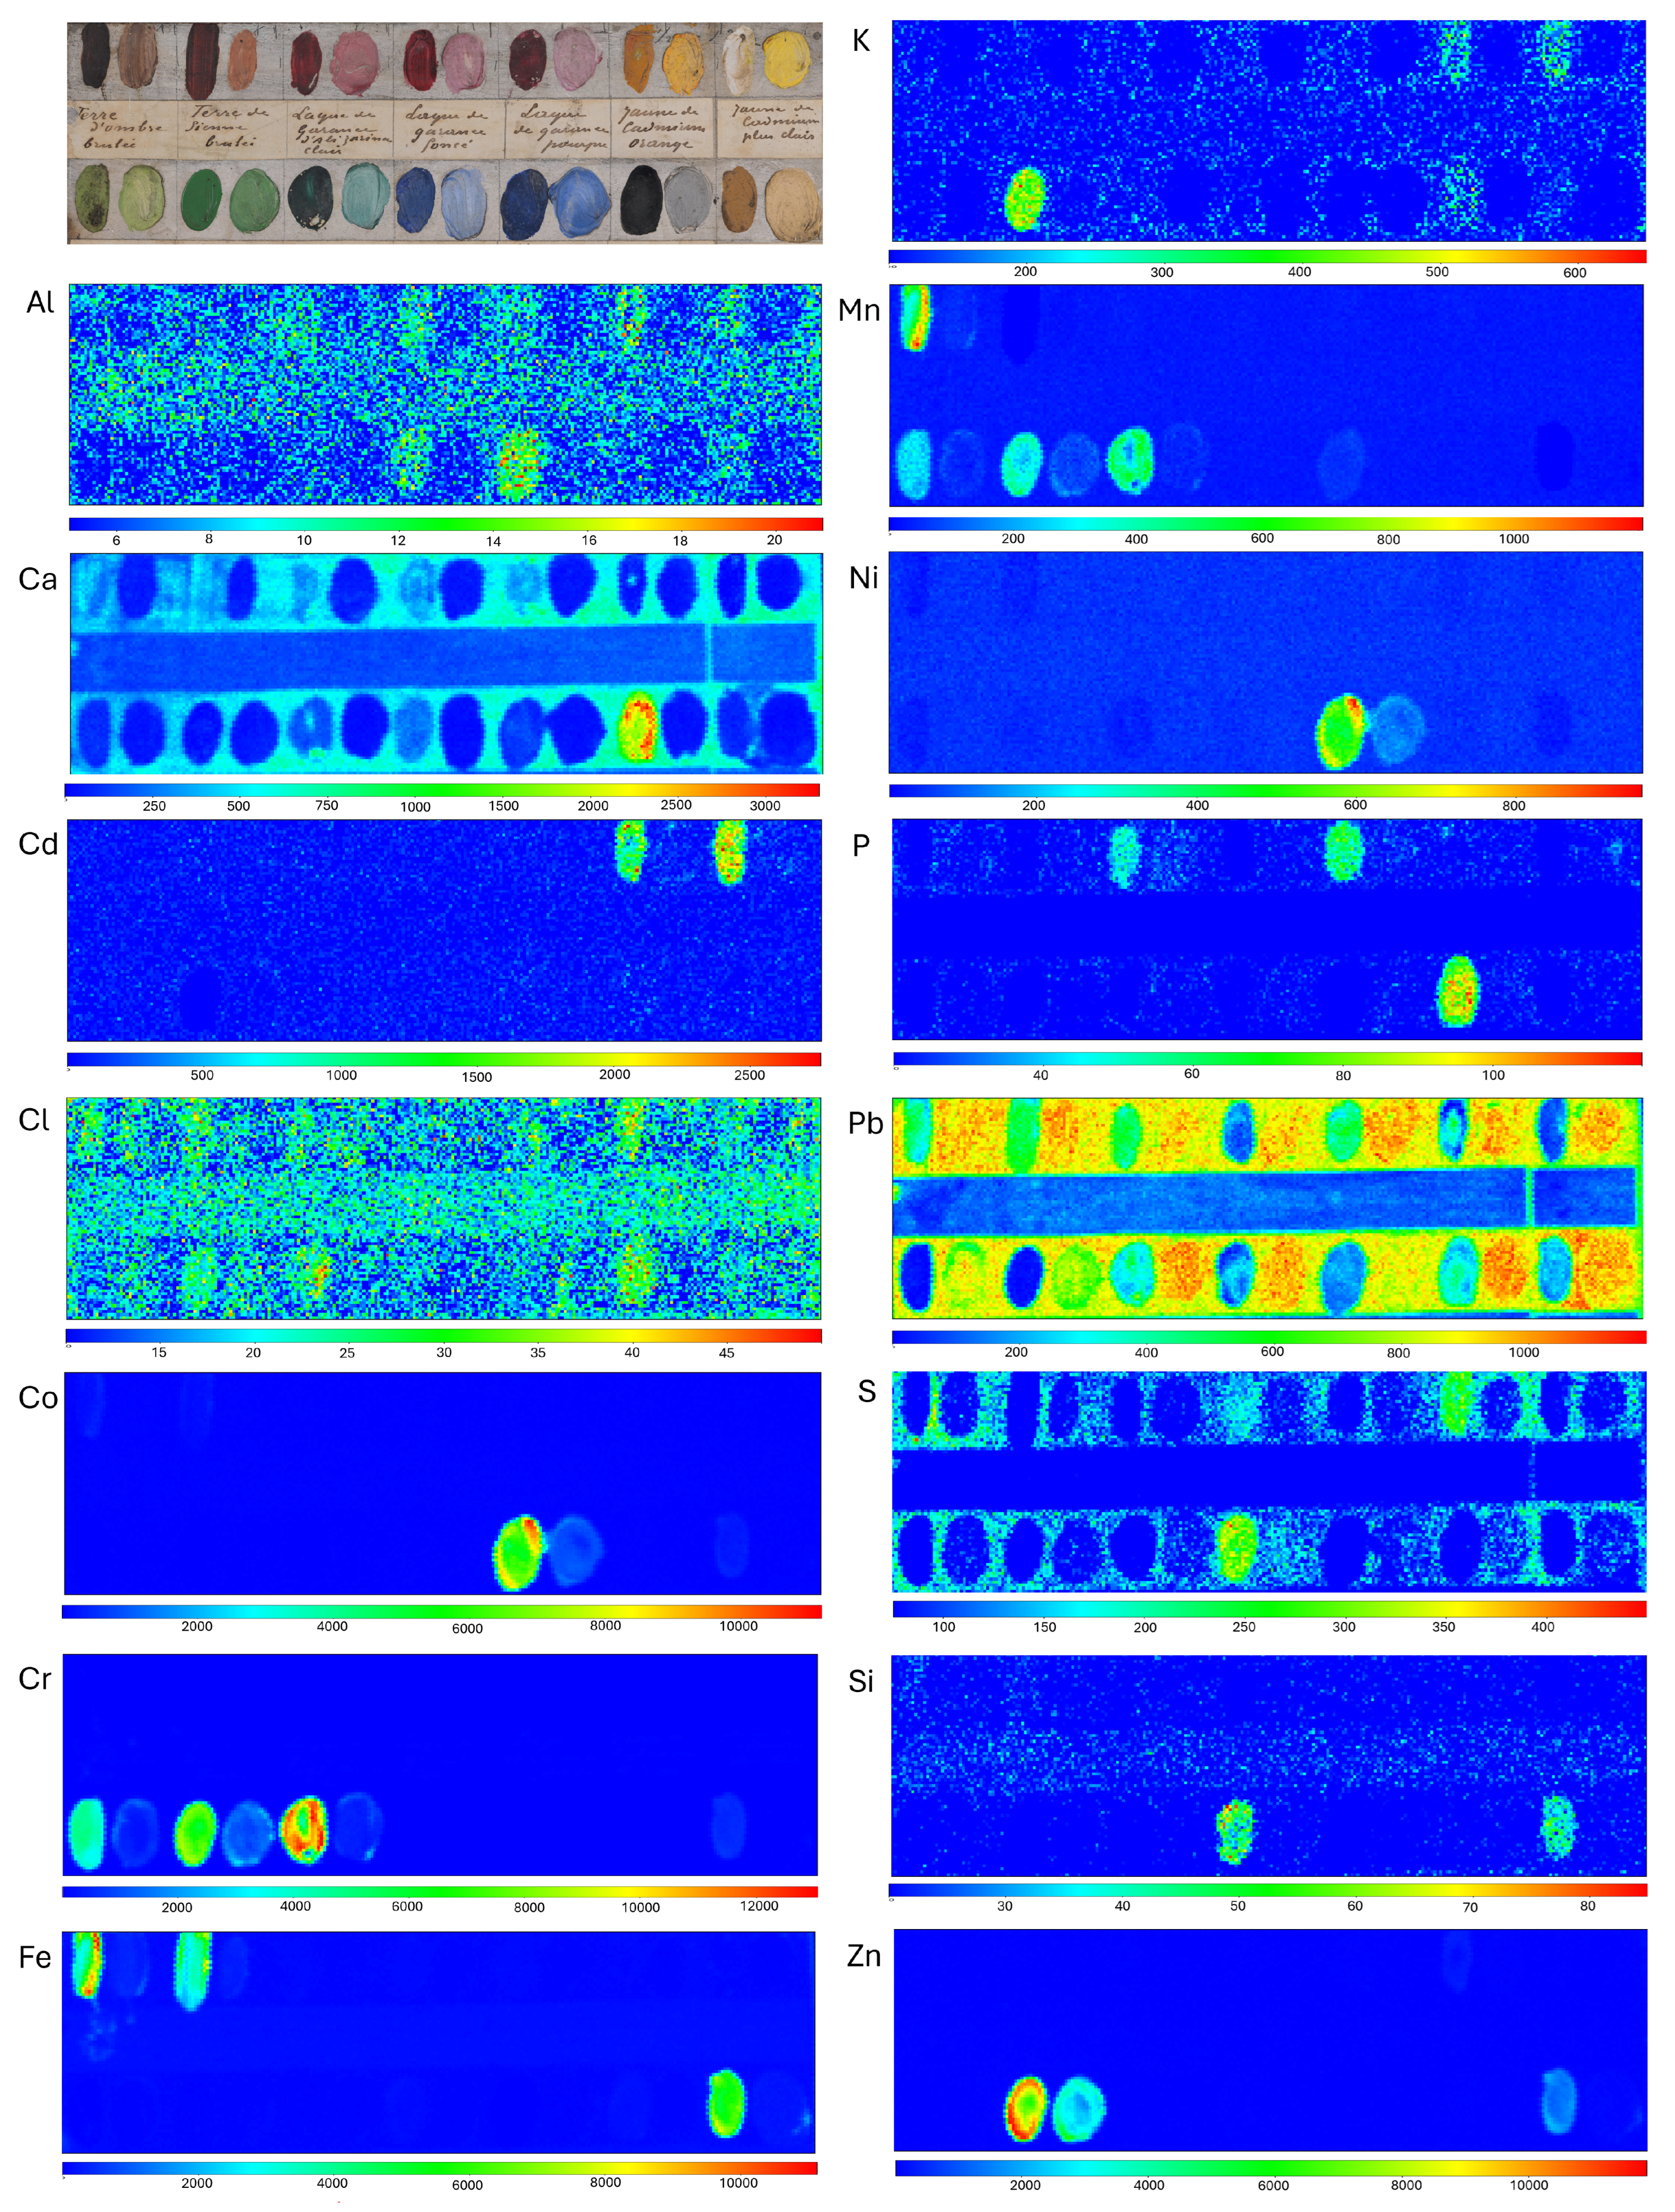
Figure A2.
Area Studied by MA-XRF in the second panel and resulting elemental maps (Al, Ca, Cd, Cl, Co, Cr, Fe, K, Mn, Ni, P, Pb, Si, S, Zn). The color scale in the elemental distribution is the count number in the XRF spectrum.
Figure A2.
Area Studied by MA-XRF in the second panel and resulting elemental maps (Al, Ca, Cd, Cl, Co, Cr, Fe, K, Mn, Ni, P, Pb, Si, S, Zn). The color scale in the elemental distribution is the count number in the XRF spectrum.
Figure A3.
Area Studied by MA-XRF in the third panel and resulting elemental maps (Al, Ca, Cd, Cl, Fe, P, Pb, S, Si, Zn). The color scale in the elemental distribution is the count number in the XRF spectrum.
Figure A3.
Area Studied by MA-XRF in the third panel and resulting elemental maps (Al, Ca, Cd, Cl, Fe, P, Pb, S, Si, Zn). The color scale in the elemental distribution is the count number in the XRF spectrum.
Appendix C
Figure A4.
Reflectance spectra in the visible range (left) and their first derivative (right) of the studied colors. Spectra of the colors from BLX are red, LF are yellow, and FB are green.
Figure A4.
Reflectance spectra in the visible range (left) and their first derivative (right) of the studied colors. Spectra of the colors from BLX are red, LF are yellow, and FB are green.
References
- Serck-Dewaide, M. (Ed.) Bulletin de L’institut Royal du Patrimoine Artistique 29; Institut Royal du Patrimoine Artistique: Brussels, Belgium, 2003. [Google Scholar]
- Sessa, C.; Steuer, C.; Quintero Balbás, D.; Sciutto, G.; Prati, S.; Stege, H. Analytical studies on commercial artists’ colour charts from Das Deutsche Farbenbuch (1925)—identification of synthetic and natural organic colourants by Raman microscopy, surface-enhanced Raman spectroscopy and metal underlayer ATR-FTIR spectroscopy. Herit. Sci. 2022, 10, 109. [Google Scholar] [CrossRef]
- Pause, R.; van der Werf, I.D.; van den Berg, K.J. Identification of Pre-1950 Synthetic Organic Pigments in Artists’ Paints. A Non-Invasive Approach Using Handheld Raman Spectroscopy. Heritage 2021, 4, 1348–1365. [Google Scholar] [CrossRef]
- Ali, A.; Singh, M. From blue to green: A review of the use and alteration of azurite pigment in cultural heritage. Arts Commun. 2025, 10, 025220048. [Google Scholar] [CrossRef]
- Sundberg, B.; Pause, R.; van der Werf, I.; Astefanei, A.; van den Berg, K.; van Bommel, M. Analytical approaches for the characterization of early synthetic organic pigments for artists’ paints. Microchem. J. 2021, 170, 106708. [Google Scholar] [CrossRef]
- Strivay, D.; Clar, M.; Rakkaa, S.; Hocquet, F.P.; Defeyt, C. Development of a translation stage for in situ noninvasive analysis and high-resolution imaging. Appl. Phys. A 2016, 122, 950. [Google Scholar] [CrossRef]
- Hocquet, F.P.; Garnir, H.P.; Marchal, A.; Clar, M.; Oger, C.; Strivay, D. A remote controlled XRF system for field analysis of cultural heritage objects. X-Ray Spectrom. 2008, 37, 304–308. [Google Scholar] [CrossRef]
- Hocquet, F.P.; Calvo del Castillo, H.; Cervera Xicotencatl, A.; Bourgeois, C.; Oger, C.; Marchal, A.; Clar, M.; Rakkaa, S.; Micha, E.; Strivay, D. Elemental 2D imaging of paintings with a mobile EDXRF system. Anal. Bioanal. Chem. 2011, 399, 3109–3116. [Google Scholar] [CrossRef]
- Lauwers, D.; Hutado, A.G.; Tanevska, V.; Moens, L.; Bersani, D.; Vandenabeele, P. Characterisation of a portable Raman spectrometer for in situ analysis of art objects. Spectrochim. Acta Part A Mol. Biomol. Spectrosc. 2014, 118, 294–301. [Google Scholar] [CrossRef] [PubMed]
- Vandenabeele, P.; Hardy, A.; Edwards, H.G.M.; Moens, L. Evaluation of a Principal Components-Based Searching Algorithm for Raman Spectroscopic Identification of Organic Pigments in 20th Century Artwork. Appl. Spectrosc. 2001, 55, 525–533. [Google Scholar] [CrossRef]
- Pozo-Antonio, J.S.; Cardell, C.; Sánchez, S.; Jesús, M.R. Reflectance of Oil Paintings: Influence of Paint Layer Thickness and Binder Amount. Coatings 2022, 12, 601. [Google Scholar] [CrossRef]
- Fitzhugh, E.W. (Ed.) Artists’ Pigments, A Handbook of Their History and Characteristics; Archetype Publications Ltd.: London, UK, 1997; Volume 3. [Google Scholar]
- Kirby, J.; Spring, M.; Higgitt, C. The Technology of Eighteenth- and Nineteenth-Century Red Lake Pigments. Natl. Gallery Tech. Bull. 2007, 28, 69–96. [Google Scholar]
- Cosentino, A. Effects of different binders on technical photography and infrared reflectography of 54 historical pigments. Int. J. Conserv. Sci. 2015, 6, 287–298. [Google Scholar]
- Comelli, D.; MacLennan, D.; Ghirardello, M.; Phenix, A.; Schmidt Patterson, C.; Khanjian, H.; Gross, M.; Valentini, G.; Trentelman, K.; Nevin, A. Degradation of Cadmium Yellow Paint: New Evidence from Photoluminescence Studies of Trap States in Picasso’s Femme (Époque des “Demoiselles d’Avignon”). Anal. Chem. 2019, 91, 3421–3428. [Google Scholar] [CrossRef] [PubMed]
- Ashok, R. (Ed.) Artists’ Pigments, A Handbook of Their History and Characteristics; Archetype Publications Ltd.: London, UK, 1993; Volume 2. [Google Scholar]
- Caggiani, M.; Cosentino, A.; Mangone, A. Pigments Checker version 3.0, a handy set for conservation scientists: A free online Raman spectra database. Microchem. J. 2016, 129, 123–132. [Google Scholar] [CrossRef]
- Gonzalez, V.; Hageraats, S.; Wallez, G.; Eveno, M.; Ravaud, E.; Réfrégiers, M.; Thoury, M.; Menu, M.; Gourier, D. Microchemical analysis of Leonardo da Vinci’s lead white paints reveals knowledge and control over pigment scattering properties. Sci. Rep. 2020, 10, 21715. [Google Scholar] [CrossRef]
- Gonzalez, V.; Gourier, D.; Calligaro, T.; Toussaint, K.; Wallez, G.; Menu, M. Revealing the the origin and history of lead white pigments by their photoluminescence properties. Anal. Chem. 2017, 89, 2909–2918. [Google Scholar] [CrossRef] [PubMed]
- Dupuis, G. Couleur de la Matière Picturale: Caractérisation des Pigments et des Mélanges de Pigments, Effets Induits Par L’adjonction de Liant et de Charges. Ph.D. Thesis, Université Paris Sud–Paris XI, Orsay, France, 2004. [Google Scholar]
- Infrared, & Raman Users Group, Raman Spectral Database. Available online: http://www.irug.org/search-spectral-database?reset=Reset (accessed on 14 December 2025).
- Kotulanová, E.; Bezdička, P.; Hradil, D.; Hradilová, J.; Švarcová, S.; Grygar, T. Degradation of lead-based pigments by salt solutions. J. Cult. Herit. 2009, 10, 367–378. [Google Scholar] [CrossRef]
- Geldof, M.; Steyn, L. Van Gogh’s Cobalt Blue. In Van Gogh’s Studio Practice; Vellekoop, M., Geldof, M., Hendriks, E., eJansen, L., Eds.; Yale University Press: New Haven, CT, USA; London, UK, 2013; pp. 256–267. [Google Scholar]
- Fuster-López, L.; Izzo, F.C.; Damato, V.; Yusà-Marco, D.J.; Zendri, E. An insight into the mechanical properties of selected commercial oil and alkyd paint films containing cobalt blue. J. Cult. Herit. 2019, 35, 225–234. [Google Scholar] [CrossRef]
- Šimůnková, E.; Brothánková-Bucifalová, J.; Zelinger, J. The influence of cobalt blue pigments on the drying of linseed oil. Stud. Conserv. 1985, 30, 161–166. [Google Scholar] [CrossRef]
- Church, A.H.A.H. The Chemistry of Paints and Painting; Seeley, Service: London, UK, 1915. [Google Scholar]
- Larsen, R.; Coluzzi, N.; Cosentino, A. Free XRF Spectroscopy Database of Pigments Checker. Int. J. Conserv. Sci. 2016, 7, 659–668. [Google Scholar]
- Veiga, T.; Moro, A.J.; Nabais, P.; Vilarigues, M.; Otero, V. A First Approach to the Study of Winsor & Newton’s 19th-Century Manufacture of Madder Red Lake Pigments. Heritage 2023, 6, 3606–3621. [Google Scholar] [CrossRef]
- Rosi, F.; Grazia, C.; Gabrieli, F.; Romani, A.; Paolantoni, M.; Vivani, R.; Brunetti, B.G.; Colomban, P.; Miliani, C. UV–Vis-NIR and micro Raman spectroscopies for the non destructive identification of Cd1-xZnxS solid solutions in cadmium yellow pigments. Microchem. J. 2016, 124, 856–867. [Google Scholar] [CrossRef]
- Feller, R.L. (Ed.) Artists’ Pigments, A Handbook of Their History and Characteristics; Archetype Publications Ltd.: London, UK, 1987; Volume 1. [Google Scholar]
- Lobon, M.G.; Ghirardello, M.; Darder, E.J.; Cabello, C.P.; Bauza, M.; Cotte, M.; Burnstock, A.; Nevin, A.; Amato, S.R.; Izzo, F.C.; et al. A study of Cadmium Yellow paints from Joan Miró’s paintings and studio materials preserved at the Fundació Miró Mallorca. Herit. Sci. 2023, 11, 145. [Google Scholar] [CrossRef]
- Giacopetti, L.; Satta, A. Reactivity of Cd-yellow pigments: Role of surface defects. Microchem. J. 2018, 137, 502–508. [Google Scholar] [CrossRef]
- Giacopetti, L.; Nevin, A.; Comelli, D.; Valentini, G.; Buongiorno Nardelli, M.; Satta, A. First principles study of the optical emission of cadmium yellow: Role of cadmium vacancies. AIP Adv. 2018, 8, 065202. [Google Scholar] [CrossRef]
- Van der Snickt, G.; Janssens, K.; Dik, J.; De Nolf, W.; Vanmeert, F.; Jaroszewicz, J.; Cotte, M.; Falkenberg, G.; Loeff, L. Combined use of Synchrotron Radiation Based Micro-X-ray Fluorescence, Micro-X-ray Diffraction, Micro-X-ray Absorption Near-Edge, and Micro-Fourier Transform Infrared Spectroscopies for Revealing an Alternative Degradation Pathway of the Pigment Cadmium Yellow in a Painting by Van Gogh. Anal. Chem. 2012, 84, 10221–10228. [Google Scholar] [CrossRef] [PubMed]
- Mass, J.; Opila, R.; Buckley, B.; Cotte, M.; Church, J.; Mehta, A. The photodegradation of cadmium yellow paints in Henri Matisse’s Le Bonheur de vivre (1905–1906). Appl. Phys. A 2012, 111, 59–68. [Google Scholar] [CrossRef]
- Van der Snickt, G.; Dik, J.; Cotte, M.; Janssens, K.; Jaroszewicz, J.; De Nolf, W.; Groenewegen, J.; Loeff, L. Characterization of a Degraded Cadmium Yellow (CdS) Pigment in an Oil Painting by Means of Synchrotron Radiation Based X-ray Techniques. Anal. Chem. 2009, 81, 2600–2610. [Google Scholar] [CrossRef] [PubMed]
- Falgayrac, G.; Sobanska, S.; Brémard, C. Heterogeneous microchemistry between CdSO4 and CaCO3 particles under humidity and liquid water. J. Hazard. Mater. 2013, 248–249, 415–423. [Google Scholar] [CrossRef]
- Prabha, K.; Krishnan, S.; Sagadevan, S. Growth and characterization of cadmium sulphate single crystal by gel growth. Arch. Appl. Sci. Res. 2010, 2, 214–223. [Google Scholar]
- Frost, R.L.; Scholz, R.; López, A.; Xi, Y. Vibrational spectroscopic characterization of the sulphate mineral khademite Al(SO4)F⋅5(H2O). Spectrochim. Acta. Part A Mol. Biomol. Spectrosc. 2013, 116, 165–169. [Google Scholar] [CrossRef]
- Buzgar, N.; Buzatu, A.; Sanislav, I. The Raman study of certain sulfates. Analele Stiintifice Ale Univ. Al. I. Cuza Din Iasi. Ser. Geol. 2009, LV, 5–23. [Google Scholar]
- Monico, L.; Cartechini, L.; Rosi, F.; Chieli, A.; Grazia, C.; De Meyer, S.; Nuyts, G.; Vanmeert, F.; Janssens, K.; Cotte, M.; et al. Probing the chemistry of CdS paints in The Scream by in situ noninvasive spectroscopies and synchrotron radiation x-ray techniques. Sci. Adv. 2020, 6, eaay3514. [Google Scholar] [CrossRef]
- Monico, L.; Chieli, A.; De Meyer, S.; Cotte, M.; De Nolf, W.; Falkenberg, G.; Janssens, K.; Romani, A.; Miliani, C. Role of relative humidity and Cd/Zn stoichiometry in the photo-oxidation process of cadmium yellows (CdS/Cd1-xZnxS) in oil paintings. Chem. A Eur. J. 2018, 24, 11584–11593. [Google Scholar] [CrossRef]
- Pisu, F.; Ricci, P.; Porcu, S.; Carbonaro, C.; Chiriu, D. Degradation of CdS Yellow and Orange Pigments: A Preventive Characterization of the Process through Pump–Probe, Reflectance, X-ray Diffraction, and Raman Spectroscopy. Materials 2022, 15, 5533. [Google Scholar] [CrossRef]
- Boselli, L. Non-Invasive Spectroscopic Study of 19th Century Artists’ Materials. Ph.D. Thesis, Universita degli Studi de Ferrara, Ferrara, Italy, 2010. [Google Scholar]
- Delaney, J.K.; Conover, D.M.; Dooley, K.A.; Glinsman, L.; Janssens, K.; Loew, M. Integrated X-ray fluorescence and diffuse visible-to-near-infrared reflectance scanner for standoff elemental and molecular spectroscopic imaging of paints and works on paper. Herit. Sci. 2018, 6, 31. [Google Scholar] [CrossRef]
- Innocenti, S.; Ricci, M.; Quintero Balbás, D.; Fontana, R.; Striova, J.; Becucci, M. Surface-enhanced Raman spectroscopy for madder lake detection in painting layers. Eur. Phys. J. Plus 2023, 138, 381. [Google Scholar] [CrossRef]
- Friday Zinzendoff, O.; Chiyeaka, O.; Ahad, N.; Sharipov, O. Robust Pearson correlation coefficient for imbalanced sample size and high dimensional data set. Sci. World J. 2025, 20, 131–136. [Google Scholar] [CrossRef]
- Dhara, D.; Chakravortty, S. Performance Evaluation of Hybrid Spectral Matching Algorithms for Automated Identification of Spectral Signatures. In Computational Intelligence Based Hyperspectral Image Analysis and Applications: Volume 2; Bajaj, A., Abraham, A., Eds.; Springer: Cham, Switzerland, 2025; pp. 229–250. [Google Scholar] [CrossRef]
- Sahoo, S.; Maiti, J. Variance-Adjusted Cosine Distance as Similarity Metric. arXiv 2025. [Google Scholar] [CrossRef]
- Belenki, L.; Sterzik, V.; Bohnert, M. Similarity Analysis of Spectra Obtained via Reflectance Spectrometry in Legal Medicine. SLAS Technol. 2014, 19, 110–118. [Google Scholar] [CrossRef]
- Mussabayev, R. Optimizing Euclidean Distance Computation. Mathematics 2024, 12, 3787. [Google Scholar] [CrossRef]
Figure 1.
(From top to bottom) First panel: oil on wood, cm, 20 March 1909, ACAB 29784, RMFAB, inv.33052; second panel: oil on wood, cm, 12 March 1912, ACAB 29785, RMFAB, inv.33052; and third panel: oil on wood, cm, ACAB 29786, RMFAB, inv.33052.
Figure 1.
(From top to bottom) First panel: oil on wood, cm, 20 March 1909, ACAB 29784, RMFAB, inv.33052; second panel: oil on wood, cm, 12 March 1912, ACAB 29785, RMFAB, inv.33052; and third panel: oil on wood, cm, ACAB 29786, RMFAB, inv.33052.
Figure 2.
Photography (Vis), photography under UV light (UV) and photomicrographs at ×480 magnification of lead white from LF, BLX and FB.
Figure 2.
Photography (Vis), photography under UV light (UV) and photomicrographs at ×480 magnification of lead white from LF, BLX and FB.
Figure 3.
Photography (Vis), photography under UV light (UV) and photomicrographs at ×480 magnification of: cobalt blue from LF, BLX and FB and viridian from BLX and FB.
Figure 3.
Photography (Vis), photography under UV light (UV) and photomicrographs at ×480 magnification of: cobalt blue from LF, BLX and FB and viridian from BLX and FB.
Figure 4.
Photography (Vis), photography under UV light (UV) and photomicrographs at ×480 magnification: LF Smyrna lake (LF), LF dark Smyrna lake (LF dark); FB dark madder lake (FB dark), purple (FB purple) and light (FB light); pale pink madder lakes on the first (BLX P1) and the third (BLX P3 and LF P3) panels.
Figure 4.
Photography (Vis), photography under UV light (UV) and photomicrographs at ×480 magnification: LF Smyrna lake (LF), LF dark Smyrna lake (LF dark); FB dark madder lake (FB dark), purple (FB purple) and light (FB light); pale pink madder lakes on the first (BLX P1) and the third (BLX P3 and LF P3) panels.
Figure 5.
Photography (Vis), photography under UV light (UV) and photomicrographs at ×480 magnification of cadmium orange and yellow from LF, BLX and FB.
Figure 5.
Photography (Vis), photography under UV light (UV) and photomicrographs at ×480 magnification of cadmium orange and yellow from LF, BLX and FB.
Figure 6.
Aluminium, cobalt and nickel distributions of the first panel. Red rectangle highlights the position of BLX cobalt blue and yellow rectangle highlights the position of LF cobalt blue. The color scale in the elemental distribution is the count number in the XRF spectrum.
Figure 6.
Aluminium, cobalt and nickel distributions of the first panel. Red rectangle highlights the position of BLX cobalt blue and yellow rectangle highlights the position of LF cobalt blue. The color scale in the elemental distribution is the count number in the XRF spectrum.
Figure 7.
Cadmium, chlorine, sulfur and zinc distributions of the third panel. Red rectangle highlights the position of BLX cadmium yellow and yellow rectangle highlights the position of LF cadmium yellow. The color scale in the elemental distribution is the count number in the XRF spectrum.
Figure 7.
Cadmium, chlorine, sulfur and zinc distributions of the third panel. Red rectangle highlights the position of BLX cadmium yellow and yellow rectangle highlights the position of LF cadmium yellow. The color scale in the elemental distribution is the count number in the XRF spectrum.
Figure 8.
Reflectance spectra in the visible range of viridian colors from BLX and FB compared to reference color reflectance spectra of viridian (Kremer Pigmente GmbH &Co., KG, Aichstetten, Germany; product no. 44250) and chromium oxide green (Kremer Pigmente GmbH & Co., KG, Aichstetten, Germany; product no. 44200).
Figure 8.
Reflectance spectra in the visible range of viridian colors from BLX and FB compared to reference color reflectance spectra of viridian (Kremer Pigmente GmbH &Co., KG, Aichstetten, Germany; product no. 44250) and chromium oxide green (Kremer Pigmente GmbH & Co., KG, Aichstetten, Germany; product no. 44200).
Figure 9.
Reflectance spectra in the visible range (left) and their first derivative (right) of the three pale pink madder lakes (over) and the other lakes (bottom).
Figure 9.
Reflectance spectra in the visible range (left) and their first derivative (right) of the three pale pink madder lakes (over) and the other lakes (bottom).
Table 1.
MA-XRF and RS results for the ground layers of the three panels. Elements detected: major elements are in bold and trace elements are indicated in parentheses. Raman bands intensity: m medium.
Table 1.
MA-XRF and RS results for the ground layers of the three panels. Elements detected: major elements are in bold and trace elements are indicated in parentheses. Raman bands intensity: m medium.
| Panel | Color | Element(s) Detected | Raman Band(s) (cm−1) | Attribution |
|---|
| First | white | (Fe), P, Pb, S | 1049 m | Lead white |
| Second | white | Ca, Pb, S | 1047 m, 1080 m | Lead white, chalk |
| Third | white | (Ca), (Fe), Pb, Zn | 1049 m | Lead white, zinc white |
Table 2.
Summary of RS and MA-XRF analysis results. Elements detected: major elements are in bold and trace elements are indicated in parentheses. Raman bands intensity: vs very strong, s strong, m medium and w weak.
Table 2.
Summary of RS and MA-XRF analysis results. Elements detected: major elements are in bold and trace elements are indicated in parentheses. Raman bands intensity: vs very strong, s strong, m medium and w weak.
| Color | Element(s) Detected | Raman Band(s) |
|---|
| Lead white | LF | Pb | 1046 s |
| BLX | Pb, S | 1048 s |
| FB | not recorded | 1045 vs |
| Cobalt blue | LF | (Al), Co, Ni | 1047 s |
| BLX | (Al), Co, (Ni) | 1050 w |
| FB | Al, Co, Ni | no signal detected |
| Viridian | BLX | (Ca), (Cl), Cr, (K) | no signal detected |
| FB | (Ca), (Cl), Cr | no signal detected |
| Madder lake | FB light | (Al), (Ca), Pb P | no signal detected |
| FB dark | (Al), (Ca), S | no signal detected |
| FB purple | (Al), (Ca), Pb P | no signal detected |
| LF 3 | (Ca), Fe, P, (Si), Zn | 1049 w |
| BLX 1 | (Al), (Ca), P, (Si) | 1042 w |
| BLX 3 | (Al), (Ca), Fe, P, (Si), Zn | 1049 w |
| Smyrna lake | LF | (Ca), Pb, P, (Si), S | 1042 m |
| LF dark | (Ca), Pb, P, (Si), S | no signal detected |
| Cadmium yellow | LF | Cd, Cl, S, Si, (Zn) | 1048 w |
| BLX | (Al), Cd, Cl, Si, Zn | 1082 w, 1150 m, 1240 m |
| FB | Cd, (Cl), (K) | no signal detected |
| Cadmium orange | LF | (Al), Cd, Cl, S, Si, (Se), (Zn) | no signal detected |
| BLX | Al, Cd, Cl, S, Si | no signal detected |
| FB | (Al), Cd, Cl, (K), S | no signal detected |
Table 3.
Characteristics of reflectance spectrum in the visible range: position of absorption bands (nm) in the reflectance spectra, position and full width at half maximum (FWHM) (nm), and intensity of the main IP in the first derivative spectra. Color nomenclature, “+w” used for colors mixed with lead white paint.
Table 3.
Characteristics of reflectance spectrum in the visible range: position of absorption bands (nm) in the reflectance spectra, position and full width at half maximum (FWHM) (nm), and intensity of the main IP in the first derivative spectra. Color nomenclature, “+w” used for colors mixed with lead white paint.
| Color | Absorption Bands (nm) | Main IP (nm) | FWHM (nm) | Height (h) | h/FWHM |
|---|
| Cobalt blue | LF | 479, 545, 586, 626 | 684 | 40.9 | | |
| LF +w | 426, 479, 546, 585, 625 | 668 | 48.2 | | |
| BLX | 428, 477, 542, 585, 624 | 681 | 44.8 | | |
| BLX +w | 425, 477, 548, 584, 624 | 665 | 51.2 | | |
| FB | 480, 588, 622 | 685 | 37.2 | | |
| FB +w | 478, 540, 585, 623 | 672 | 53.1 | | |
| Viridian | BLX | 451, 631 | 763 | 78.9 | | |
| BLX +w | 443, 623 | 733 | 77.3 | | |
| FB | 458.5 | 756 | 66.4 | | |
| FB +w | 435, 623 | 724 | 52.8 | | |
| Pale pink madder lake | LF3 | 431, 509, 541 | 572 | 46.7 | | |
| LF3 +w | 428, 513, 548 | 574 | 48.9 | | |
| BLX3 | 443, 511, 541 | 576 | 46.4 | | |
| BLX3 +w | 423, 512, 547 | 583 | 50.9 | | |
| BLX1 | 433, 515, 550 | 593 | 54.1 | | |
| BLX1 +w | 423, 516, 552 | 588 | 62.5 | | |
| Cadmium yellow | LF | 431 | 478 | 65.7 | | |
| LF +w | 431 | 465 | 54.9 | | |
| BLX | 427 | 480 | 114.6 | | |
| BLX +w | 438 | 484 | 50.9 | | |
| FB | 421 | 498 | 89.9 | | |
| FB +w | 450 | 498 | 48.1 | | |
| Cadmium orange | LF | 489 | 552 | 79.3 | | |
| LF +w | 449 | 515 | 77.8 | | |
| BLX | 475 | 544 | 101.9 | | |
| BLX +w | 453 | 518 | 117.3 | | |
| FB | 476 | 535 | 66.3 | | |
| FB +w | 449 | 527 | 59.2 | | |
Table 4.
Similarity rates between two first derivative of reflectance spectra of the studied colors.
Table 4.
Similarity rates between two first derivative of reflectance spectra of the studied colors.
| Color | 1st | 2nd | P (%) | C (%) | E (%) |
|---|
| Lead white | LF | BLX | 91.98 | 92.32 | 80.23 |
| LF | FB | 82.99 | 83.66 | 69.73 |
| BLX | FB | 95.88 | 96.04 | 80.91 |
| Cobalt blue | LF | BLX | 97.25 | 97.23 | 86.97 |
| LF | FB | 93.25 | 93.27 | 78.95 |
| BLX | FB | 95.07 | 95.08 | 83.59 |
| Viridian | BLX | FB | 97.9 | 97.91 | 89.76 |
| Pale Pink Madder Lake | LF3 | BLX3 | 98.76 | 98.78 | 86.58 |
| BLX1 | BLX3 | 91.46 | 91.4 | 78.76 |
| BLX1 | LF3 | 87.96 | 87.85 | 74.61 |
| Cadmium yellow | LF | BLX | 97.43 | 97.49 | 78.73 |
| LF | FB | 92.94 | 93.14 | 69.95 |
| BLX | FB | 95.31 | 95.47 | 83.76 |
| Cadmium orange | LF | BLX | 99.14 | 99.16 | 92.6 |
| LF | FB | 98.56 | 98.52 | 81.55 |
| BLX | FB | 99.43 | 99.39 | 79.44 |
| Disclaimer/Publisher’s Note: The statements, opinions and data contained in all publications are solely those of the individual author(s) and contributor(s) and not of MDPI and/or the editor(s). MDPI and/or the editor(s) disclaim responsibility for any injury to people or property resulting from any ideas, methods, instructions or products referred to in the content. |




 ,
,