
Article

A Multi-Analytical Approach for the Investigation of Black Crusts on Two Monuments in Athens, Greece


by
Dimitrios Mitsos
1,*,
Eleni Palamara
1,
Andreas Germanos Karydas
2,
Evangelos Gerasopoulos
3 and
Vasilis Poulopoulos
4
1
Laboratory of Archaeometry, University of the Peloponnese, Palaio Stratopedo, 24133 Kalamata, Greece
2
X-Ray Fluorescence Laboratory, Institute of Nuclear and Particle Physics, NCSR “Demokritos”, 15341 Agia Paraskevi, Greece
3
Institute for Environmental Research and Sustainable Development (IERSD), National Observatory of Athens, I. Metaxas and Vassilis Pavlou, 15236 Old Penteli, Greece
4
ΓAΒ LAB—Knowledge and Uncertainty Research Laboratory, University of the Peloponnese, 22131 Tripoli, Greece
*
Author to whom correspondence should be addressed.
Heritage 2026, 9(5), 196; https://doi.org/10.3390/heritage9050196
Submission received: 9 March 2026 / Revised: 7 May 2026 / Accepted: 14 May 2026 / Published: 19 May 2026

Abstract

Analytical studies of archeological materials often face challenges, such as the merging of heterogeneous, multidimensional datasets from complementary analytical techniques, and incorporating site- and user-defined parameters. In this study, a data fusion methodology is applied that combines micro-X-ray fluorescence (micro-XRF) spectrometry and handheld Raman spectroscopy to investigate degradation layers and identify pollution sources on two monuments in an urban background: the Temple of Hephaestus and the Byzantine Church of Ag. Theodoroi, in Athens, Greece. A total of 12 samples were collected for laboratory measurements and 32 in situ measurements were conducted. Statistical and unsupervised machine learning tools, namely correlation analysis, Principal Component Analysis and k-means clustering, were applied to the merged datasets. Additionally, selected elements’ ratios were calculated to infer their sources. The black crusts were identified as heterogeneous mixtures of calcium sulfate dihydrate, calcite, and particulate pollutants, with their composition reflecting their preservation state. Vehicular emission indicators were dominant in both sites, while secondary domestic heating pollutant indicators were more prevalent at Ag. Theodoroi. Orientation had a minor role compared to pollutant sources in differentiating degradation patterns. The integrated comparison of the different outputs highlighted the interpretive potential of the approach, particularly in improving the readability of the multivariate structure and supporting the development of targeted conservation strategies for monuments in polluted urban contexts.

1. Introduction

1.1. Historical Building Materials and Air Pollution

Air pollution is one of the primary concerns regarding the future of the Earth’s climate and public health. In recent decades, however, there is a rising interest in the way that air pollutants affect the building materials of historical structures [1,2,3,4], while also considering the implications of intense urbanization for both its negative physical impact and its leveraging for raising public awareness and promoting Cultural Heritage (CH) [5]. Considering the constant changes in global air chemistry and, subsequently, the concentrations of pollutants affecting materials, recent studies have focused on the impact these changes have on the degradation processes, both indoors and outdoors [6,7,8,9]. This is especially critical when facing preservation problems regarding built heritage, as monuments are more exposed to degrading factors, when compared to the more easily controllable indoor environments.
Historical stone monuments, in particular, serve as critical cultural touchstones, yet they are increasingly threatened by air pollution. In heavily populated or industrial areas, atmospheric pollutants deposit on monument surfaces and form heterogeneous degradation layers—most commonly referred to as black crusts—with well-researched formation mechanisms that affect both the aesthetic value and the structural integrity of the building materials [10,11]. More specifically, carbonate building materials undergo chemical alteration, most usually through the dissolution of the carbonate substrate and the formation of gypsum aggregates that fixate atmospheric particulate pollutants. These particles further facilitate the cycle of chemical alteration and eventually give the appearance of a dark coating [12,13]. Regarding the nature of such deposits, they can range from sulfate aerosols, soot, polycyclic aromatic hydrocarbons (PAHs) and nitrogen oxides (NOx) to heavy and transition metal-carrying particulates [14,15,16], each with a specific role in the formation of the black crusts [17,18].
Consequently, traditional use of single-technique characterizations can fail to fully grasp the complex interactions among elemental agents, molecular phases, and environmental parameters such as air quality and local microclimate. Thus, the need for utilizing a combination of analytical techniques is deemed necessary in order to obtain the maximum amount of information regarding the nature of these materials, the processes involved in their formation, and the parameters that can affect them [19,20].

1.2. Multi-Analytical Data Fusion

Multi-analytical approaches have relied on a combination of analytical techniques, such as scanning electron microscopy coupled with energy-dispersive X-ray spectroscopy (SEM-EDS), X-ray fluorescence (XRF) spectrometry, X-ray diffraction (XRD), Raman spectroscopy, Fourier transform infrared (FTIR) spectroscopy, and laser ablation inductively coupled plasma mass spectrometry (LA-ICP-MS), to investigate different aspects of the pollution-induced degradation processes in archeological building materials [21,22,23,24].
While the combination of techniques provides a wider range of complementary information, the datasets deriving from each technique traditionally remain isolated from each other in subsequent analytical steps and, thus, require manual cross-comparison by researchers that can introduce varying levels of bias. Additionally, specific challenges have already been highlighted, regarding the combination of portable and benchtop instrumentations and the effectiveness of the complementary application of elemental and molecular analyses [25], as well as the time- and resource-consuming cross-processing steps to reach conclusions, especially in the case of highly heterogeneous materials [24].
The emerging concept of data fusion emphasizes the combination of these diverse datasets into a unified framework. Such efforts have been made in the recent years for the identification of clay minerals [26] and soil characterization [27,28], as well as 3D modeling and remote sensing, although the need for similar efforts regarding purely analytical results and the protection of built heritage has been noted [29,30,31]. Furthermore, despite the promising prospects of multi-analytical data fusion, several challenges persist, such as high data heterogeneity and multidimensionality, the need for standardization of the results, reproducibility and automation of the processes [32]. For example, merging quantitative data from XRF measurements and qualitative data from Raman measurements into one data framework can be extremely challenging and certain parameters have to be taken into consideration, such as the separate steps in data processing for each analytical technique. There is the possibility of semi-manual approaches, for example, using separate software for peak detection and baseline correction of spectra, in the case of Raman spectroscopy. This not only addresses the aforementioned issues partially but also slows the repetition of analyses when new samples or new types of parameters are added, thus affecting the reproducibility and automation of the process.

1.3. Research Aim

This study applies an integrated data fusion workflow within a heritage science context that combines multidimensional micro-XRF and Raman data with user-defined parameters, including sample surface orientation and sampling height, and macroscopic observation ratings for the state of preservation of the building materials, to characterize black crusts on two significant monuments in Athens, Greece. The synergy of advanced statistical analysis and unsupervised machine learning techniques in the applied workflow aims to reveal the components of the black crusts and possible deeper patterns that highlight their correlation to specific pollution sources.
Ultimately, the potential of the systematic comparison of the black crusts’ composition to reveal pollution-source fingerprints, which is crucial in adopting tailored preservation strategies [33] and to quantify the impact of multiple parameters on the degradation patterns, is being investigated.

2. Materials and Methods

2.1. Site Selection

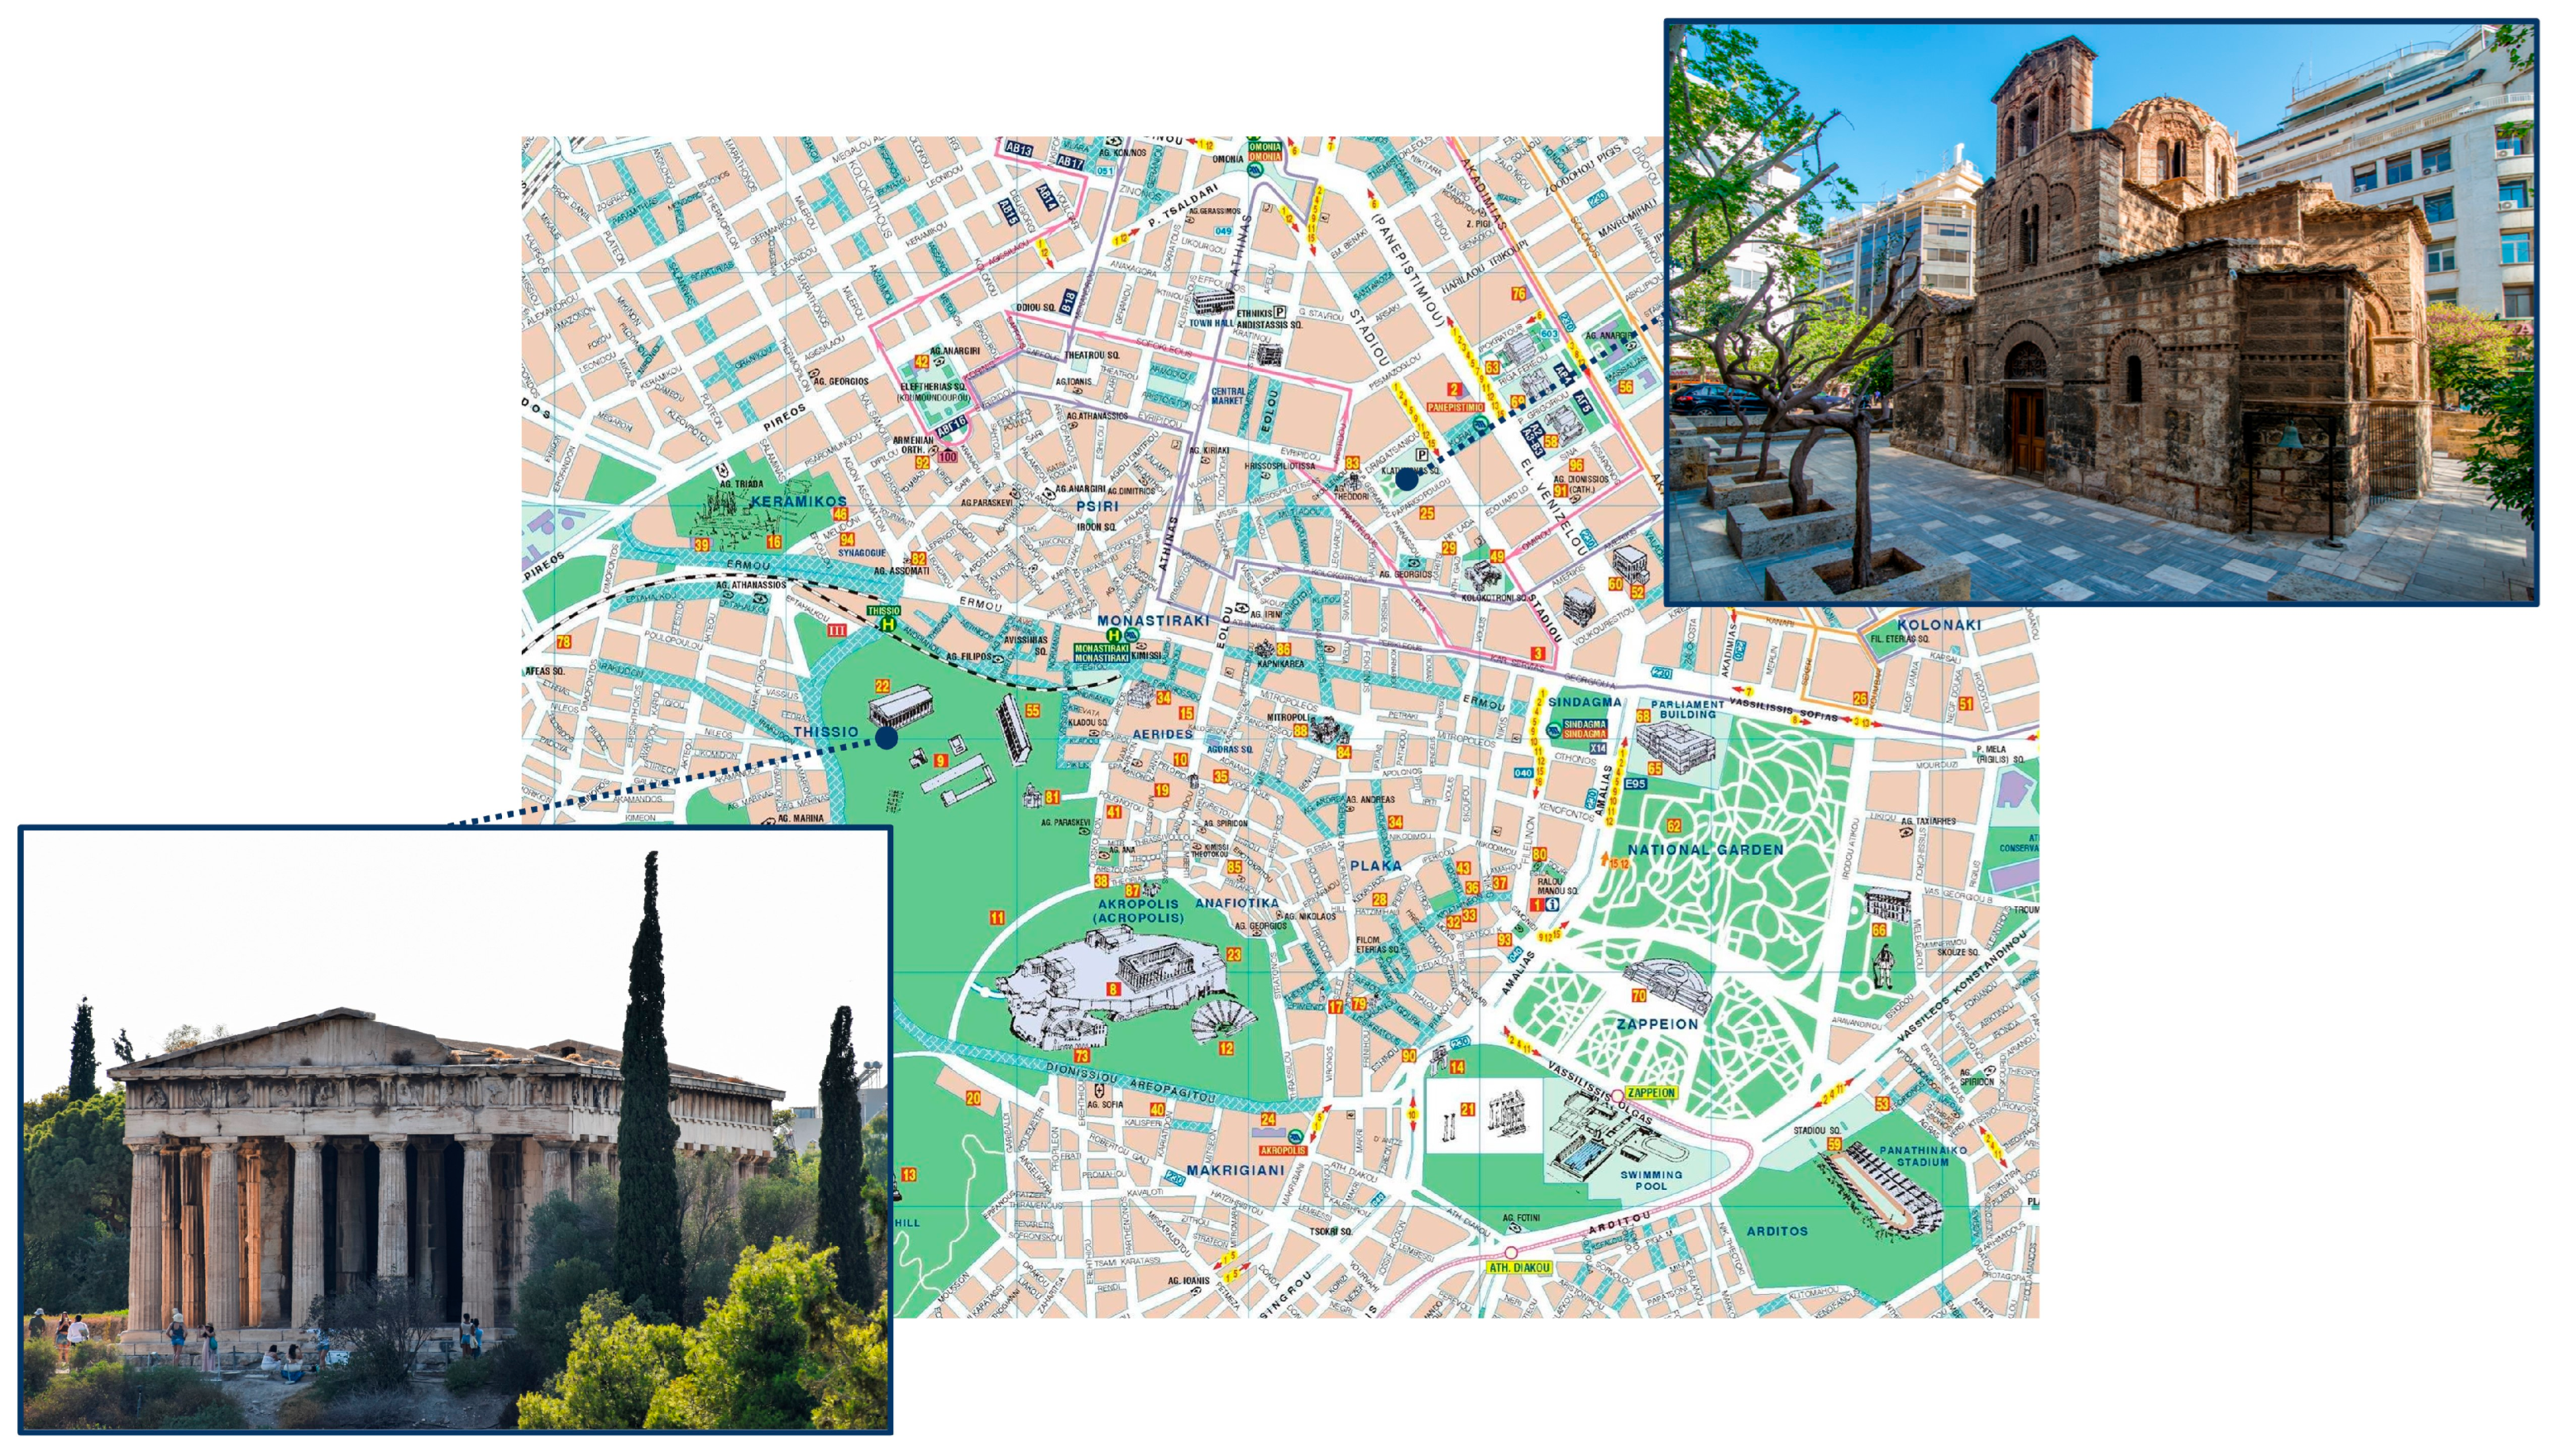
The monuments under study are the Temple of Hephaestus and the Church of Ag. Theodoroi, in Athens, Greece (Figure 1). They were selected based on their spatial proximity, historical significance, partial similarity of building materials in order to purposefully investigate possible differentiations in the degradation patterns related to the 1500-year interval between their construction.
The Temple of Hephaestus, constructed in the mid-5th century BCE, stands as one of the best-preserved Greek temples of the Classical era. It is built mainly of Pentelic marble and is located within the wider archeological area of the Roman Agora, in the center of Athens, near heavy city traffic. As such, possible pollution sources include high vehicular density in adjacent roads, and distant industrial emissions or deposits from older factories’ emissions in Athens, though many have been decommissioned. Thick black crusts were identified on all the façades after an initial visual inspection of the monument.
Located at a distance of approximately 1 km from the Temple of Hephaestus, the 11th-century Byzantine Church of Ag. Theodoroi combines limestone, sandstone, and marble blocks with brick masonry. Its more enclosed courtyard in proximity with apartment buildings is exposed to both vehicular and domestic heating emissions. The building is oriented along traditional east–west lines, providing distinct sun exposure patterns. Preliminary macroscopic surveys revealed thick black crust layers, predominantly on the north and west façades.

2.2. Sampling and In Situ Measurements Strategy

Following Greece’s Ministry of Culture’s guidelines and restrictions, a total of 12 black crust samples of 2–3 cm2 each were extracted, 6 from each monument. All samples originate from a stone substrate, although in the case of the Temple of Hephaestus it is Pentelic marble, which in general has a higher calcite (CaCO3) content and fewer impurities compared to the limestone and marble substrates from Ag. Theodoroi. The selection aimed at ensuring orientation coverage and height variation to capture microclimatic diversity. All samples were examined under a LED I-Scope by Moritex (Tokyo, Japan) in 50× magnification in order to have an initial approach on the fabric, color and morphology of the crust. The samples were then embedded in Struers CaldoFix-2 resin, then dried at 75 °C for 1.5 h and polished using a Labopol-2 Polishing Device (Struers, Ballerup, Denmark) and multiple Struers grinding papers in order to prepare cross-sections for the micro-XRF line-scan measurements.
In situ Raman measurements were conducted in the exact same locations where the physical samples were extracted from, as well as additional locations in the same façades, with the aim to ensure orientation coverage and height variation, and to compare the results from the two analytical techniques. A total of 16 measurements were conducted in total per monument, with 4 measurements conducted for each main orientation. Additionally, each orientation was recorded as follows; N for north, NE for northeast, E for east, SE for southeast, S for south, SW for southwest, W for west and NW for northwest.
A complete table referencing the Sample IDs, sampling locations and height and surface orientation as well as optical microscope images of the samples, can be found in Table S1 of the Supplementary Materials.

2.3. Analytical Techniques

The two analytical techniques utilized in this study were selected based on their complementarity in the chemical information they yield for the materials, both on an elemental and a molecular level. Handheld Raman spectroscopy was selected for its capability to conduct in situ, non-destructive measurements for the identification of both organic and inorganic molecular phases (which in the case of benchtop techniques would require much larger samples). Additionally, implementing micro-XRF spectrometry offered the chance to investigate the materials on a microscopic level, especially regarding the elements’ concentrations along the samples’ cross section profiles.

2.3.1. Raman Spectroscopy

The molecular composition of the samples was determined using the BRAVO handheld Raman spectrometer by Bruker (Billerica, MA, USA). The spectrometer is equipped with two near-infrared excitation lasers (DUO LASER™ technology, with laser wavelengths at 785 nm and 853 nm) and a CCD detector, allowing for a total spectral range of 300–3200 cm−1 and a spectral resolution of 2 cm−1. The duration of each measurement was typically 1–2 min, according to the morphology of the sample surface. The stability and full contact of the instrument to the material surface during the measurements was ensured with a customized support setup. Data acquisition and processing were carried out by using the free Spectragryph software (version 1.2.16.1). A total of 174 manually identified bands were cross-referenced with known spectral libraries from the literature and the free online RUFF mineral database [34,35]. Baseline correction was avoided, as the algorithm used in the BRAVO instrumentation software (version 2.2.4) already performs a similar step when merging the raw spectral data from both lasers, to exclude fluorescence signals (SSE™ patented technology by BRUKER). The raw spectral data were manually checked for validity of the merged resulting spectra.

2.3.2. Micro-XRF Spectrometry

A customized portable micro-X-ray fluorescence instrumentation from the X-Ray fluorescence Laboratory of the Institute of Nuclear and Particle Physics at NCSR “Demokritos” was used to obtain the elemental composition of the cross-section samples prepared and embedded in resin. This customized setup carries an electro-thermally cooled 10 mm2 silicon drift detector, with full width at half maximum 170 eV at 5.89 keV, coupled with a digital signal processor. Each sample’s cross section underwent 3 line-scan measurements along their profile of approximately 1–3 mm in length, depending on the sample’s thickness, with a step size of 0.02 mm and acquisition time of 30 s per spot measurement. The measurements focused on the degradation layers, as an original substrate material was either not present or of extremely low thickness. The spectrometer’s spatial resolution for the detection of the Cu-Kα line with unfiltered excitation was measured to be approximately 74 μm. The X-ray tube measurement conditions were set at 50 kV, 600 μA, using an unfiltered exciting beam. The elemental concentrations were determined through the PyMCA software (version 5.8.0) and configured in accordance with the experimental setup features and excitation conditions [24,36].

2.4. Data Fusion Workflow

Following data collection, the three data sources (i.e., spectra from Raman spectroscopy, spectra and measured elemental concentrations from micro-XRF spectrometry, and user-defined parameters as described in Section 2.4.3) were pre-treated, with the aim to extract features and be integrated into a single data framework for subsequent analyses. All the steps in the workflow are written in custom-built code scripts in the Python programming language (version 3.9). It should be noted that an in-depth description focusing on the coding and algorithmic methodology that was followed and is briefly described here is the subject of a separate research article [37].

2.4.1. Raman Data

A custom script was built to detect Raman bands above a Raman intensity threshold value, designed to eliminate background noise. A unique threshold value was set for each spectrum, according to the minimum and maximum intensity values of all the identified Raman bands in that single spectrum. For subsequent data fusion, each sample’s Raman signal was re-encoded as presence (=1) or absence (=0) of the 174 bands that were manually assigned in Section 2.3.1. This approach created a binary matrix that simplified complex spectral data and allowed for dimensionality reduction. A tolerance window of ±3 cm−1 was considered for the band assignment to compensate for expected shifts related to the in situ measurement conditions. Occasional negative Raman intensity values, generally identified as instrumental artifacts due to the baseline correction algorithms used in the instrument’s software [38], were set to zero [39].
A material assignment step was then performed, according to the simultaneous presence of a material’s main Raman bands in a single spectrum. For example, an assignment of “gypsum” (CaSO4·2H2O) required the simultaneous presence of Raman bands at 1008 cm−1 (ν1 symmetric stretching mode of the S O 4 2 group) and 1136 cm−1 (ν3 antisymmetric stretching mode) [40]. A silhouette score was then calculated for the entirety of the Raman dataset for each monument in order to find the optimal number of k values (i.e., number of clusters) for subsequent clustering. K-means and Principal Component Analysis (PCA) were then performed for clustering, dimensionality reduction and plotting of the results. The 5 main Raman bands that contributed the most to the cluster centroids were then calculated and presented in a table alongside the PCA scatter plot, in the final visualization. These bands were used to assign two primary pollution sources, named “Raman source 1” and “Raman source 2” (categorized in the data framework as 1 = ‘vehicular emissions’, 2 = ‘industrial emissions’, 3 = ‘domestic heating’, 4 = ‘biological activity’ or 5 = ‘soil dust’), according to the prevalence of specific molecular phases, such as calcium sulfate dihydrate, identified in the analysis.

2.4.2. Micro-XRF Data

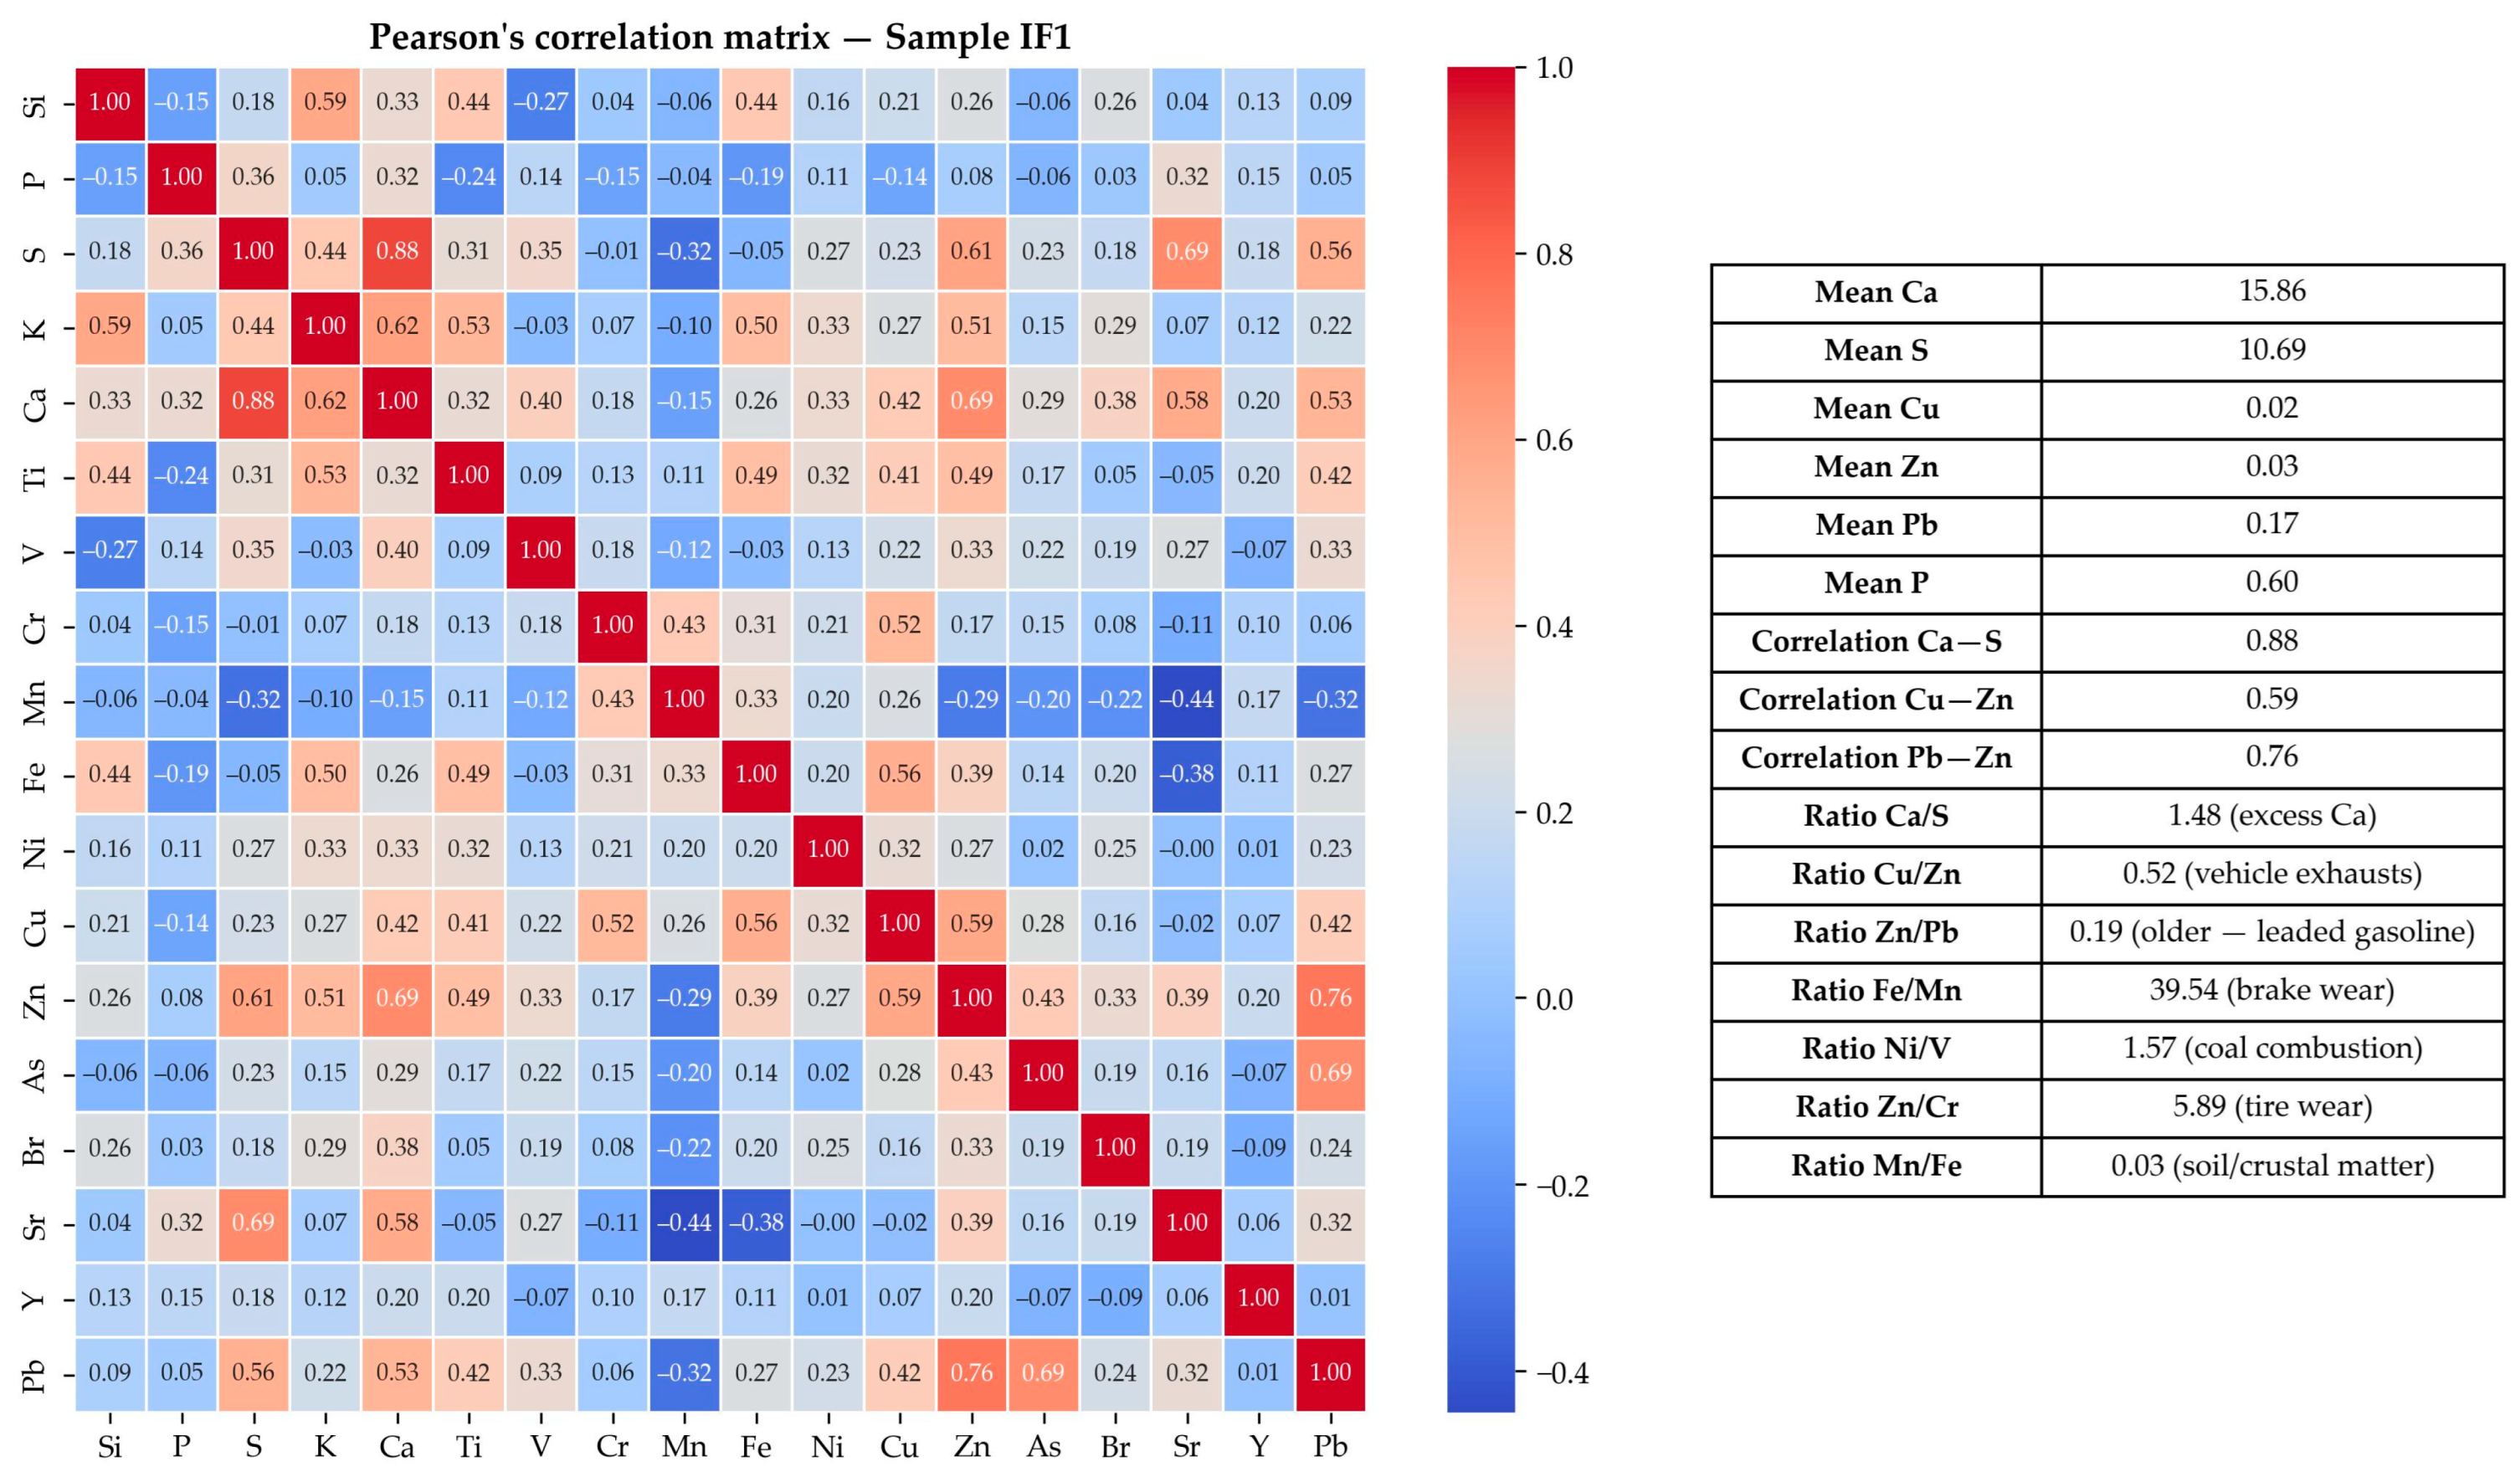
Similarly, custom scripts were built for statistical analyses of the micro-XRF data. A Pearson’s correlation matrix was computed—according to the concentrations of elements calculated in Section 2.3.2—and subsequently visualized in the form of a heatmap. The mean values of the elements’ concentrations were then calculated to create a representative elemental profile for each sample. Correlation scores were calculated for Ca and S, along with the Ca:S ratio, to infer the samples’ gypsum content, as calcium sulfate dihydrate is the main constituent of black crusts and is known to have a Ca:S ratio of 1.25. As in Section 2.4.1, the two primary pollution sources were identified and categorized according to the prevalence of specific element ratios within each sample that are used as pollution fingerprints in the literature. More specifically, the ratios utilized for the purposes of this study are the following: Cu:Zn [15], Zn:Pb [41], Ni:V [42], Zn:Cr [43], and Mn:Fe [44,45]. It is acknowledged that these element ratios are typically used for the study of air pollutants and not degradation layers. Nevertheless, the approach of using such ratios has been previously proven to be in good agreement with and substantial in inferring pollution sources that contribute to the formation and growth of such layers on a monument in Athens [24]; thus, it was decided to be incorporated in the current methodology to explore their validity in a more complex context. In a final step, the results of these calculations were then visualized in a table alongside the Pearson’s correlation matrix heatmap, separately for each sample. Similarly to Section 2.4.1, these ratios were used to assign two primary pollution sources, named “XRF source 1” and “XRF source 2” (categorized in the data framework as 1 = ‘vehicular emissions’, 2 = ‘industrial emissions’, 3 = ‘domestic heating’, 4 = ‘biological activity’ or 5 = ‘soil dust’), according to the prevalence of groups of pollutants identified in the analysis.

2.4.3. Unified Data Framework

User-defined parameters, such as surface orientation, sampling height, construction chronology and condition rating, were re-encoded to numeric form to ensure consistency across datasets and better integration into the subsequent statistical analyses. Orientation was re-encoded through a simplified normalized scalar variable expressing relative directional exposure. This encoding was used as an exploratory contextual descriptor and should not be considered equivalent to a complete circular representation of orientation. After macroscopic observation, each sample was assigned an estimated condition rating based on visible crust thickness and color, and the building material’s morphological degradation. Condition rating values were re-encoded and normalized to a 0–2 scale (0 = ‘good’, 1 = ‘moderate’, 2 = ‘poor’).
Each row in the unified framework corresponds to a unique Sample ID, which is used as an identifier. Columns include the user-defined parameters and their normalized values (i.e., normalized sampling height values, orientations and their normalized values, normalized chronology of the monuments, and macroscopic observation condition rating), the cluster numbers for each analytical technique and, as determined in the subsequent statistical analyses, the two primary pollution sources as they are identified for each sample in Section 2.4.1 and Section 2.4.2, and the state of preservation as inferred by the analytical results (Table 1). More specifically, the “Raman state” variable was decided by comparing the intensity of the gypsum bands, and the “XRF state” variable was decided according to the concentrations of Ca and S and the Ca:S ratio in the measured physical samples.
In a final step, a separate PCA scatter plot was created, after performing k-means clustering. The plot was based on the entirety of data and extracted features, where both in situ Raman measurements and micro-XRF measurements were conducted. The aim of this approach was to compare the interpretability of clustering between single-technique and fused datasets to explore possible correlations and to assess the degree of agreement between the two analytical techniques. The variables included in the integrated dataset were selected on the basis of analytical relevance and interpretive value in order to avoid unnecessary dimensional expansion and maintain a transparent relationship between the analytical measurements and the multivariate outputs.
This study is conducted using a mid-level data fusion (MLF) (or feature-level) approach as it integrates a feature extraction step which can hold adequate original information from the analytical techniques, with the extracted features then combined to build further quantitative or qualitative outcomes [46,47]. The MLF approach is also easily adaptable with established feature extraction steps used in this study, such as PCA.
Limitations include the small number of physical samples and the capture of each monument’s condition at a single time point, instead of temporal variation over the course of months or years, as both the materials’ degradation rates and the pollutants’ concentrations vary seasonally with temperature and humidity levels [24,48,49]. Given the relatively limited overall sample size for both analytical techniques, care was taken to avoid excessive dimensional complexity in the integrated analysis. For this reason, the fusion step was based on extracted and chemically interpretable variables rather than on the complete raw datasets. This strategy allows for the reduction in feature redundancy while retaining the most diagnostically relevant information. The encoded pollution source and preservation state variables were therefore treated as condensed interpretive descriptors derived from the preceding analytical stages, rather than as direct physical measurements. Consequently, the PCA/k-means output is interpreted as a consistency assessment and visualization tool for comparing Raman-, micro-XRF-derived and contextual information, rather than as a standalone predictive or source-apportionment model.

3. Results and Discussion

3.1. Molecular Composition

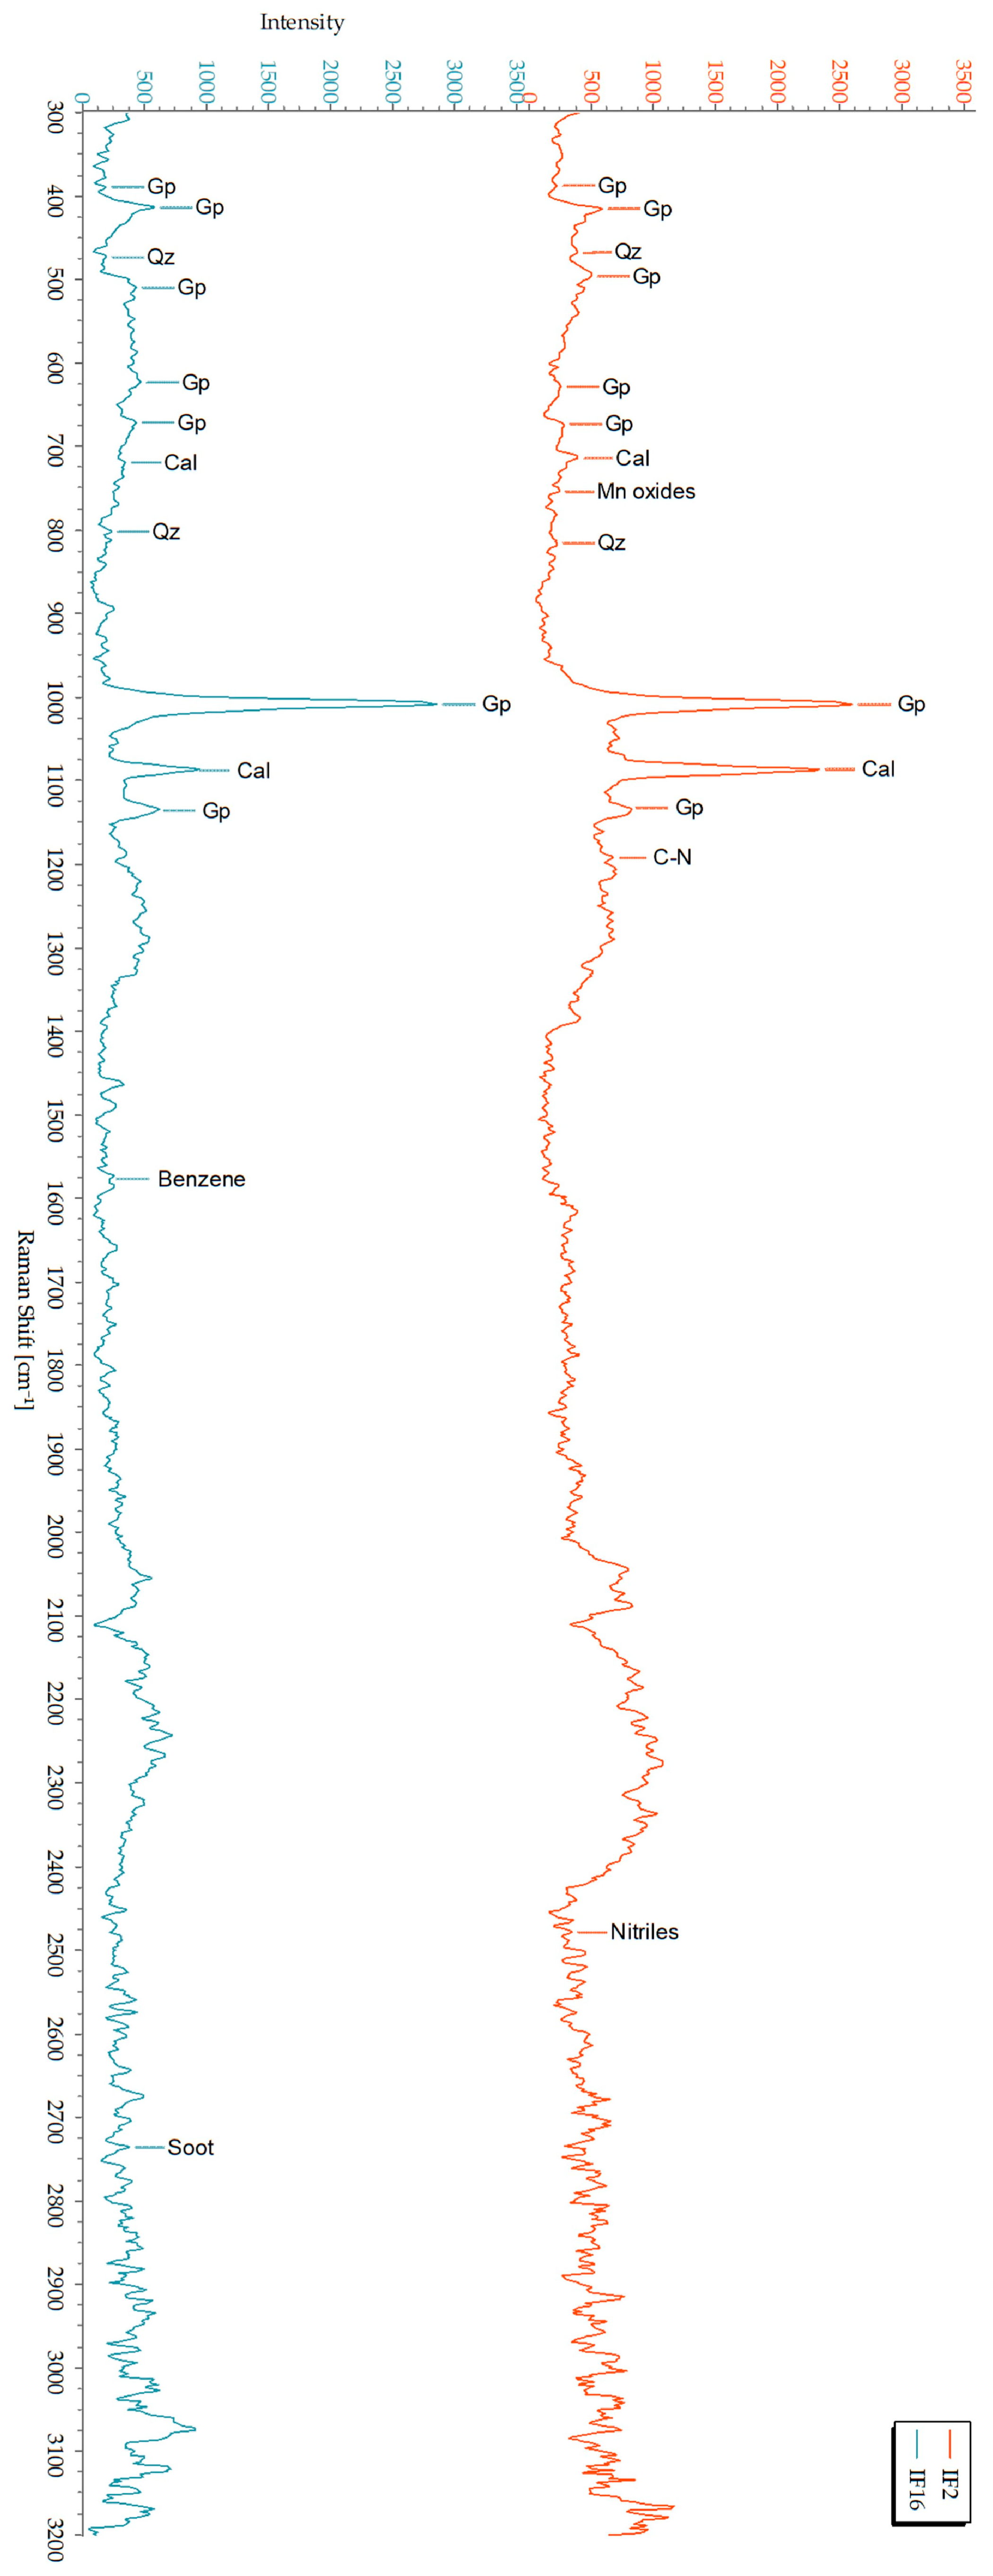
As described in Section 2.3.1 and Section 2.4.1, all Raman spectra were manually examined to determine the accurate assignment of Raman bands before subsequent analysis. Representative Raman spectra from measurements with sample IDs IF2 and IF16 are shown in Figure 2.
In this example, it is notable that the bulk of the crusts’ mineral matrix is very similar, with the only differentiations being in the signal intensity of calcium sulfate dihydrate, calcite and quartz Raman bands. More specifically, IF2 shows higher signal intensity in calcite Raman bands, and IF16 shows higher signal intensity in calcium sulfate dihydrate Raman bands, indicating a different progression in the gypsification of the original building material in the two measured areas of the monument (west and east). There are noticeable differentiations, except in the identified Raman bands regarding the contaminants’ molecular phases, namely C-N bond and nitriles group in IF2, and benzene and soot in IF16. Given the measurement conditions not being in an ideal laboratory environment, the high complexity of the analyzed material, and the resulting spectra noise, it is evident that absolute identification between minute variations in Raman intensity signals and/or wavenumber values is challenging when performed manually. However, the differentiations are worth mentioning, since the peaks among noise patterns do present variations when comparing individual spectra and may be further explored in the subsequent statistical analyses.
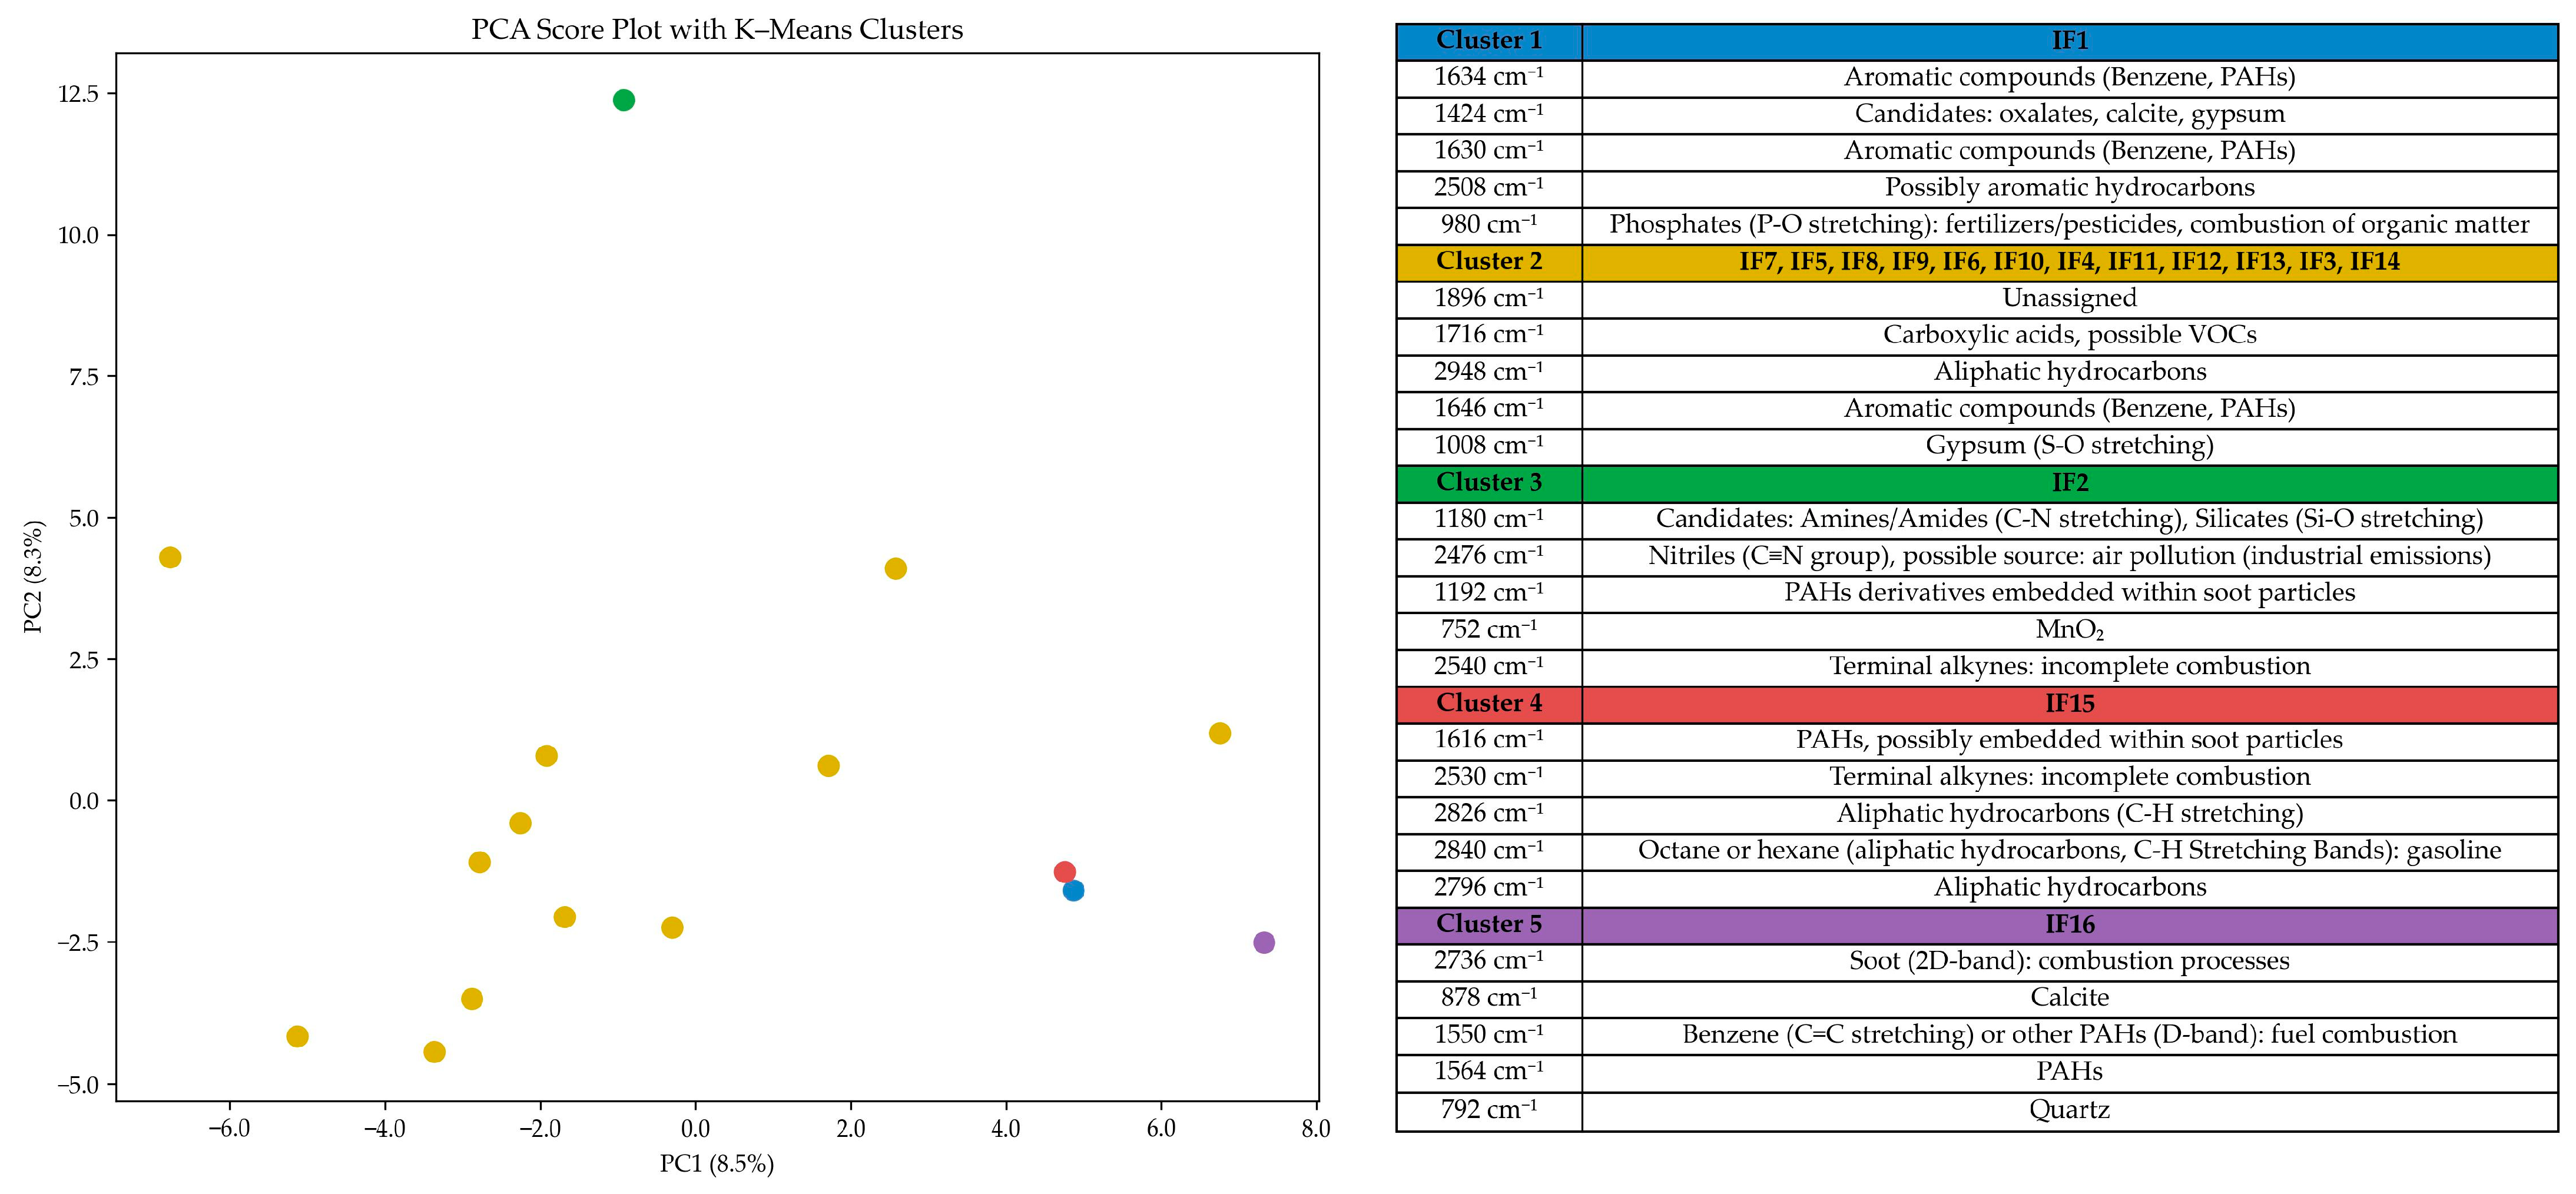
Subsequently, a visualization of the results from the statistical analysis for the Raman data was created for each monument, according to the steps described in Section 2.4.1. Regarding the Temple of Hephaestus (Figure 3), a total of five clusters were determined to give the optimal silhouette score.
The first two principal components explained a limited proportion of the total variance (8.5% for PC1 and 8.3% for PC2), suggesting that the dataset retained substantial multidimensional complexity. This is not unexpected for binary Raman peak data derived from highly heterogeneous degradation layers. Accordingly, PCA is used here as an exploratory visualization method, while interpretation was based on the combined consideration of cluster structure, peak assignments, and subsequent complementary analytical evidence.
The bulk of the samples (IF3, IF4, IF5, IF6, IF7, IF8, IF9, IF10, IF11, IF12, IF13, and IF14) were assigned to Cluster 2. IF1, IF2, IF15, and IF16 were each assigned to a separate cluster. The main contributing Raman bands for Cluster 2, as shown in the adjacent table in the visualization, are a mixture of calcium sulfate dihydrate, carboxylic acids, aliphatic hydrocarbons and aromatic compounds (such as benzene or PAHs). IF1 is differentiated by the presence of phosphates and calcium oxalates, which are in good agreement with the effect of microorganisms on calcitic stones [50,51]. IF2 shows a more distinct presence of amines, nitriles, terminal alkynes (an indicator for incomplete combustion), and MnO2, all related to vehicular emissions, corroborating the insights gained earlier in the manual examination of its Raman spectrum. Mn is known to act as the nucleus for the formation of calcium sulfate dihydrate in black crusts, as do most transition metal-carrying particulates [18,52]. Mn oxides’ presence could be partly attributed to biological activity in black crusts, although their source is more strongly associated with vehicular emissions [53]. IF15 differentiates by showing the presence of octane and hexane Raman bands, which are fingerprints for gasoline combustion. IF16 shows a distinct presence of calcite and quartz, indicating a better state of preservation for the stone building material, as well as PAHs and fuel combustion derivatives, also in agreement with earlier manual examination of its Raman spectrum. Overall, the Raman-derived features are consistent with the atmospheric context of the site, given its close proximity to high-traffic roads. There is no clear indication within this dataset that surface orientation exerts a major influence on the samples’ composition, as the bulk of the samples that are assigned to Cluster 1 come from various orientations.
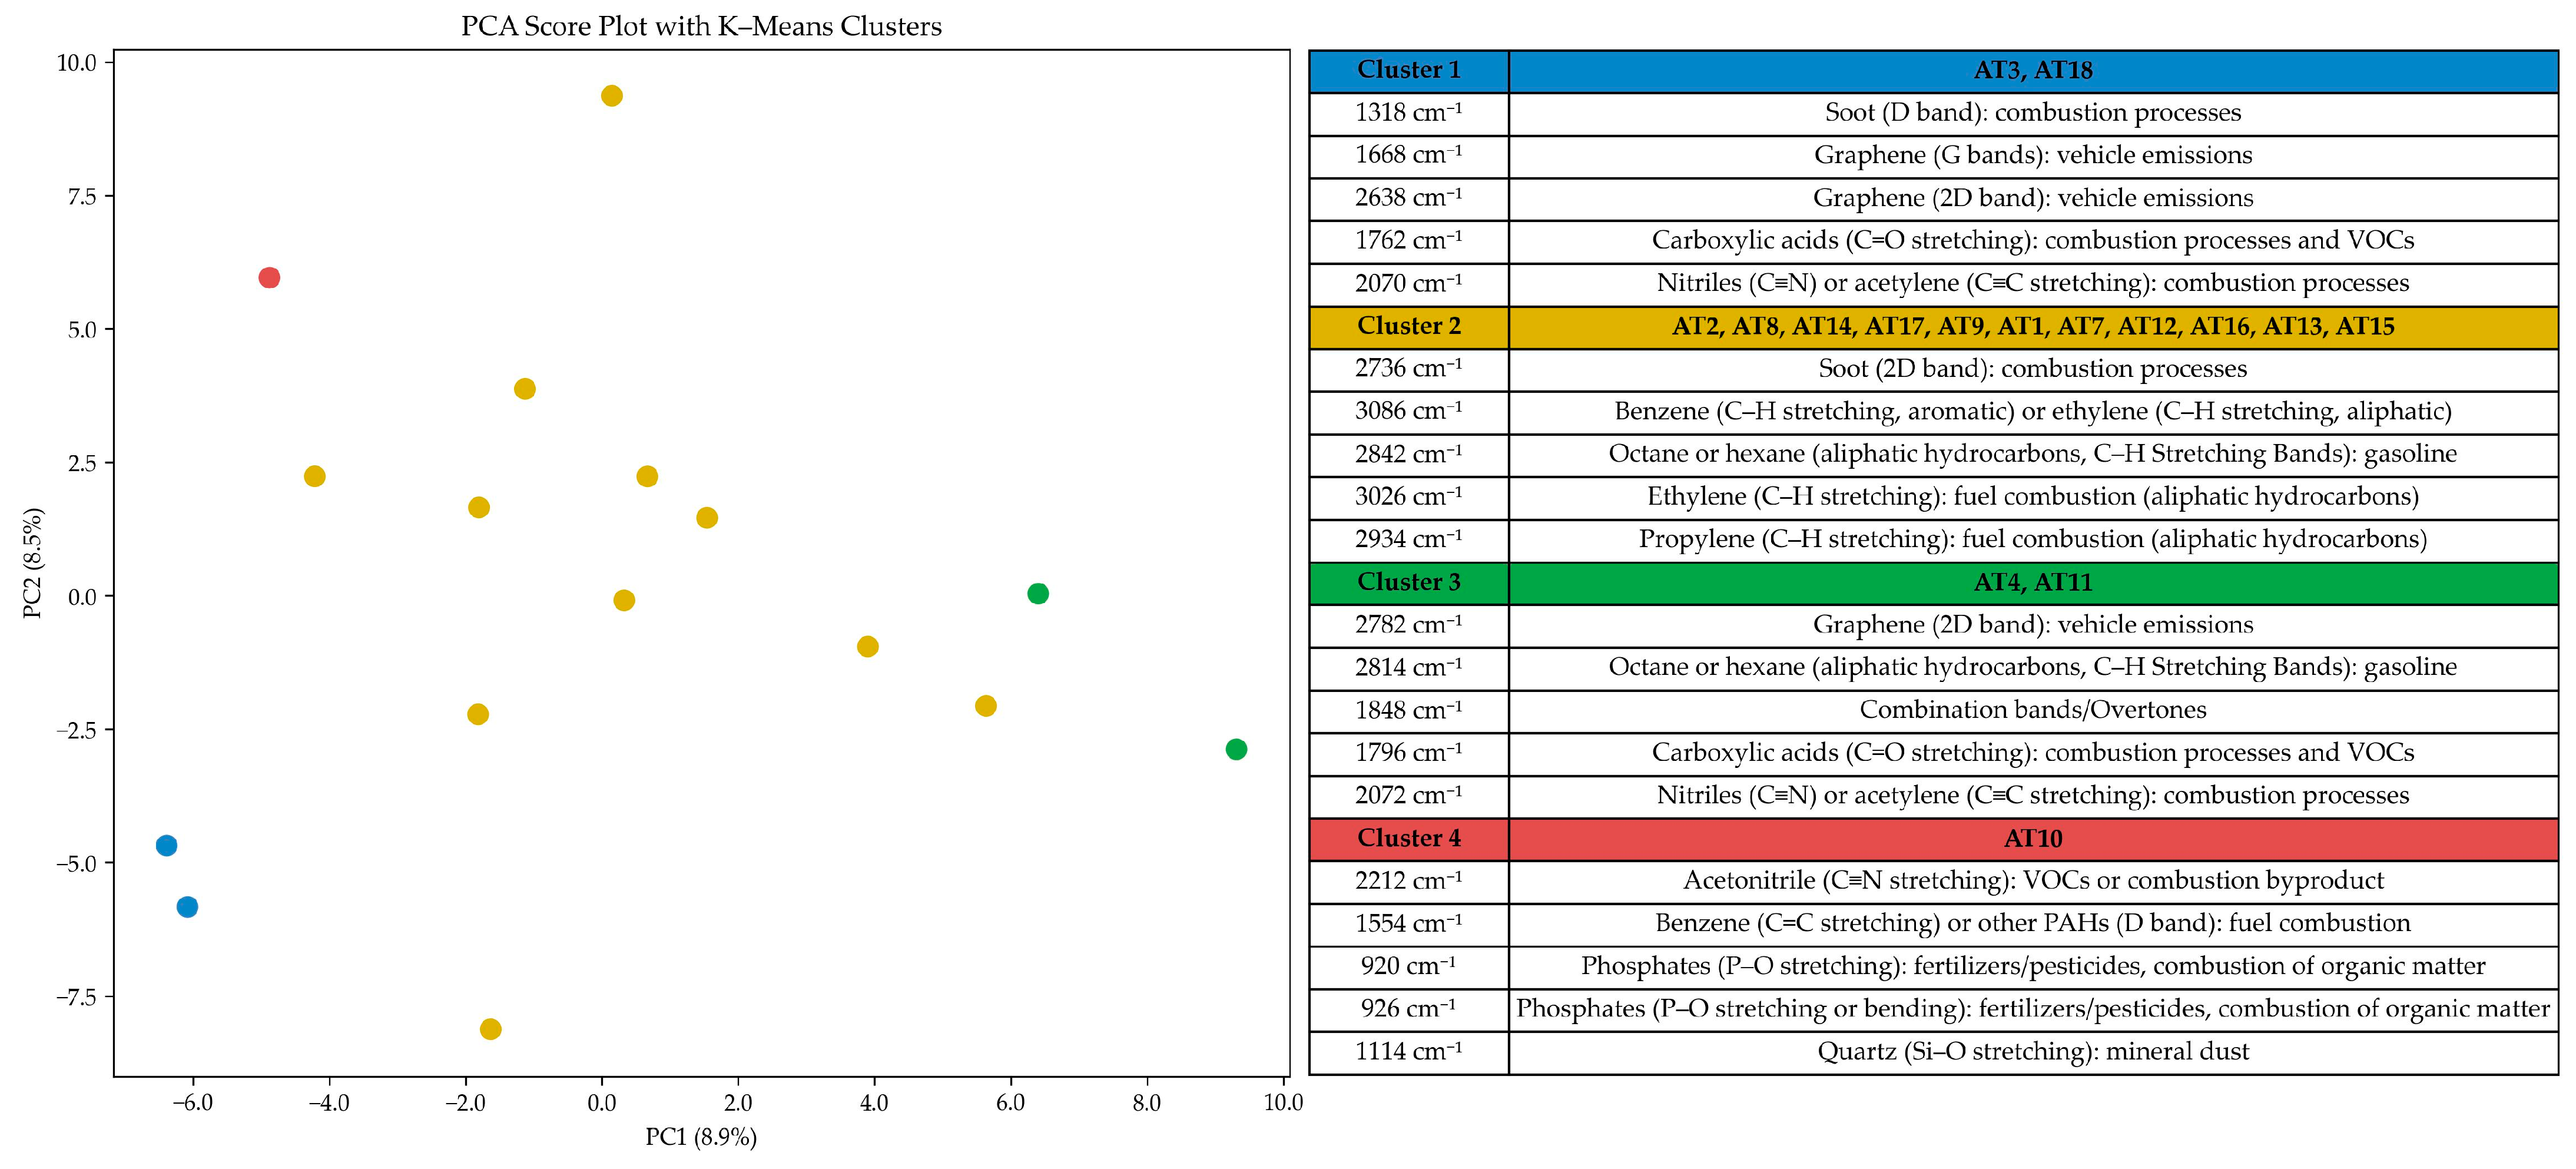
Regarding the Church of Ag. Theodoroi (Figure 4), the optimal number of clusters was determined to be 4, according to the optimal silhouette score.
The explained variance here is slightly improved over the IF samples (8.9% for PC1 and 8.5% for PC2), but the dataset still retains substantial multidimensional complexity. Again, the bulk of the samples (AT1, AT2, AT7, AT8, AT9, AT12, AT13, AT14, AT15, AT16, and AT17) were assigned to the same cluster (Cluster 2), while AT3 and AT18 were assigned to Cluster 1, AT4 and AT11 to Cluster 3, and AT10 to Cluster 4. Cluster 2 is defined by the presence of soot (combustion processes) and vehicular fuel combustion derivatives, such as benzene, aliphatic hydrocarbons, ethylene and propylene. Cluster 1 shows similar traits, with the addition of a defining presence of Raman bands for graphene, nitriles, and carboxylic acids from combustion processes and VOCs. Similarly, Cluster 3 is defined by vehicular emissions’ signature Raman bands, such as graphene, gasoline combustion derivatives, carboxylic acids and nitriles. Cluster 4 differentiates by showing a strong presence of acetonitrile, phosphates and quartz. The results are in good agreement with the atmospheric background of the site, although there is a more dominating presence of Raman bands related to vehicular emissions’ derivatives in comparison to the Temple of Hephaestus, where some of the Raman bands can be associated with combustion processes related to both traffic and industries.
Overall, the results help us move towards a comprehensible initial visualization and categorization of large datasets, while at the same time showing limitations in the explained variance between the samples’ features when considering a single analytical technique. This can be partly attributed to the nature of the measurements being conducted outside a stable laboratory environment and further establishes the necessity for additional methodological steps including complementary analytical techniques and statistical exploration.

3.2. Elemental Distributions and Ratios

As described in Section 2.4.2, an individual visualization of the results for each physical sample that underwent micro-XRF measurements was created. In the example of sample IF1 (Figure 5), a heatmap visualization of the Pearson’s correlation matrix for the distribution of elements—based on the individual spot measurements during the line scans—shows good correlation between S and Ca (correlation score of 0.88, with absolute correlation being 1), indicating that the bulk of the sample consists of calcium sulfate dihydrate. Pb showed a good correlation score with S (0.56) and Ca (0.53), indicating a correlation to the calcium sulfate dihydrate formation processes. Zn distribution showed a similar pattern, an element that is known to derive from tire wear [17]. This is in good agreement with the Cu:Zn ratio (0.59) being close to the fingerprint range for traffic emissions (0.1–0.5), as opposed to industrial emissions (0.7–1.5) [16]. Fe shows good correlation with other metals related to non-exhaust particulates [54], such as Cu (0.56), Zn (0.39), and Mn (0.33). Good correlation with Ti (0.49), K (0.50), and Si (0.44) could be attributed to a portion of Fe deriving from the substrate material or soil dust particulates.
All the element ratios used for the identification of pollution sources showed that vehicular emissions (either fuel combustion or non-exhaust emissions, such as tire- and brake-wear) seem to be the main source of the elements present within the black crust in sample IF1. The ratio of Ca:S (1.48) implies the presence of superfluous Ca that does not derive from calcium sulfate dihydrate. This could be explained by the presence of pristine calcite crystals within the black crust or from Ca-bearing particulates from soil dust, or a combination of both.
The same process was followed for all the remaining physical samples (IF2, IF3, IF4, IF5, IF6, AT1, AT4, AT8, AT9, AT11, and AT14), and the visualizations can be found in Figures S1–S11 of the Supplementary Material. Regarding the Temple of Hephaestus, all samples showed superfluous Ca content, other than that present in calcium sulfate dihydrate, indicating a good state of preservation for the building material. A prevalence of implications for vehicular emissions as pollution sources was identified for all samples, as indicated by the element ratios used to identify them. However, the provenance of Cu and Zn (as indicated by the Cu:Zn ratio) was different in samples IF3, IF5, and IF6, where industrial emissions are suggested as sources for these elements. Interestingly, these are the same samples that showed lower Ca:S ratios—which translate to a more prominent presence of calcium sulfate dihydrate—as well as industrial emissions as the secondary pollution source. This could be attributed either to the presence of factories in the area in the past, or the deposition of industrial emissions from greater distances.
Regarding the Church of Ag. Theodoroi, all samples indicate vehicular emissions as the main pollution source, with a noted decrease in industrial emissions as a suggested secondary source from the element ratios used, except for sample AT9, where industry is identified as the main source. The obtained Cu:Zn ratios further support the hypothesis for the main pollution source for the Ag. Theodoroi samples. In particular, samples AT4 and AT14 suggest domestic heating as a secondary pollution source, whereas sample AT8 suggests soil dust. It is safe to say that a combination of pollution sources can explain these differences, with each element having a provenance from multiple pollution sources, or even the substrate.

3.3. Integrated Data Fusion

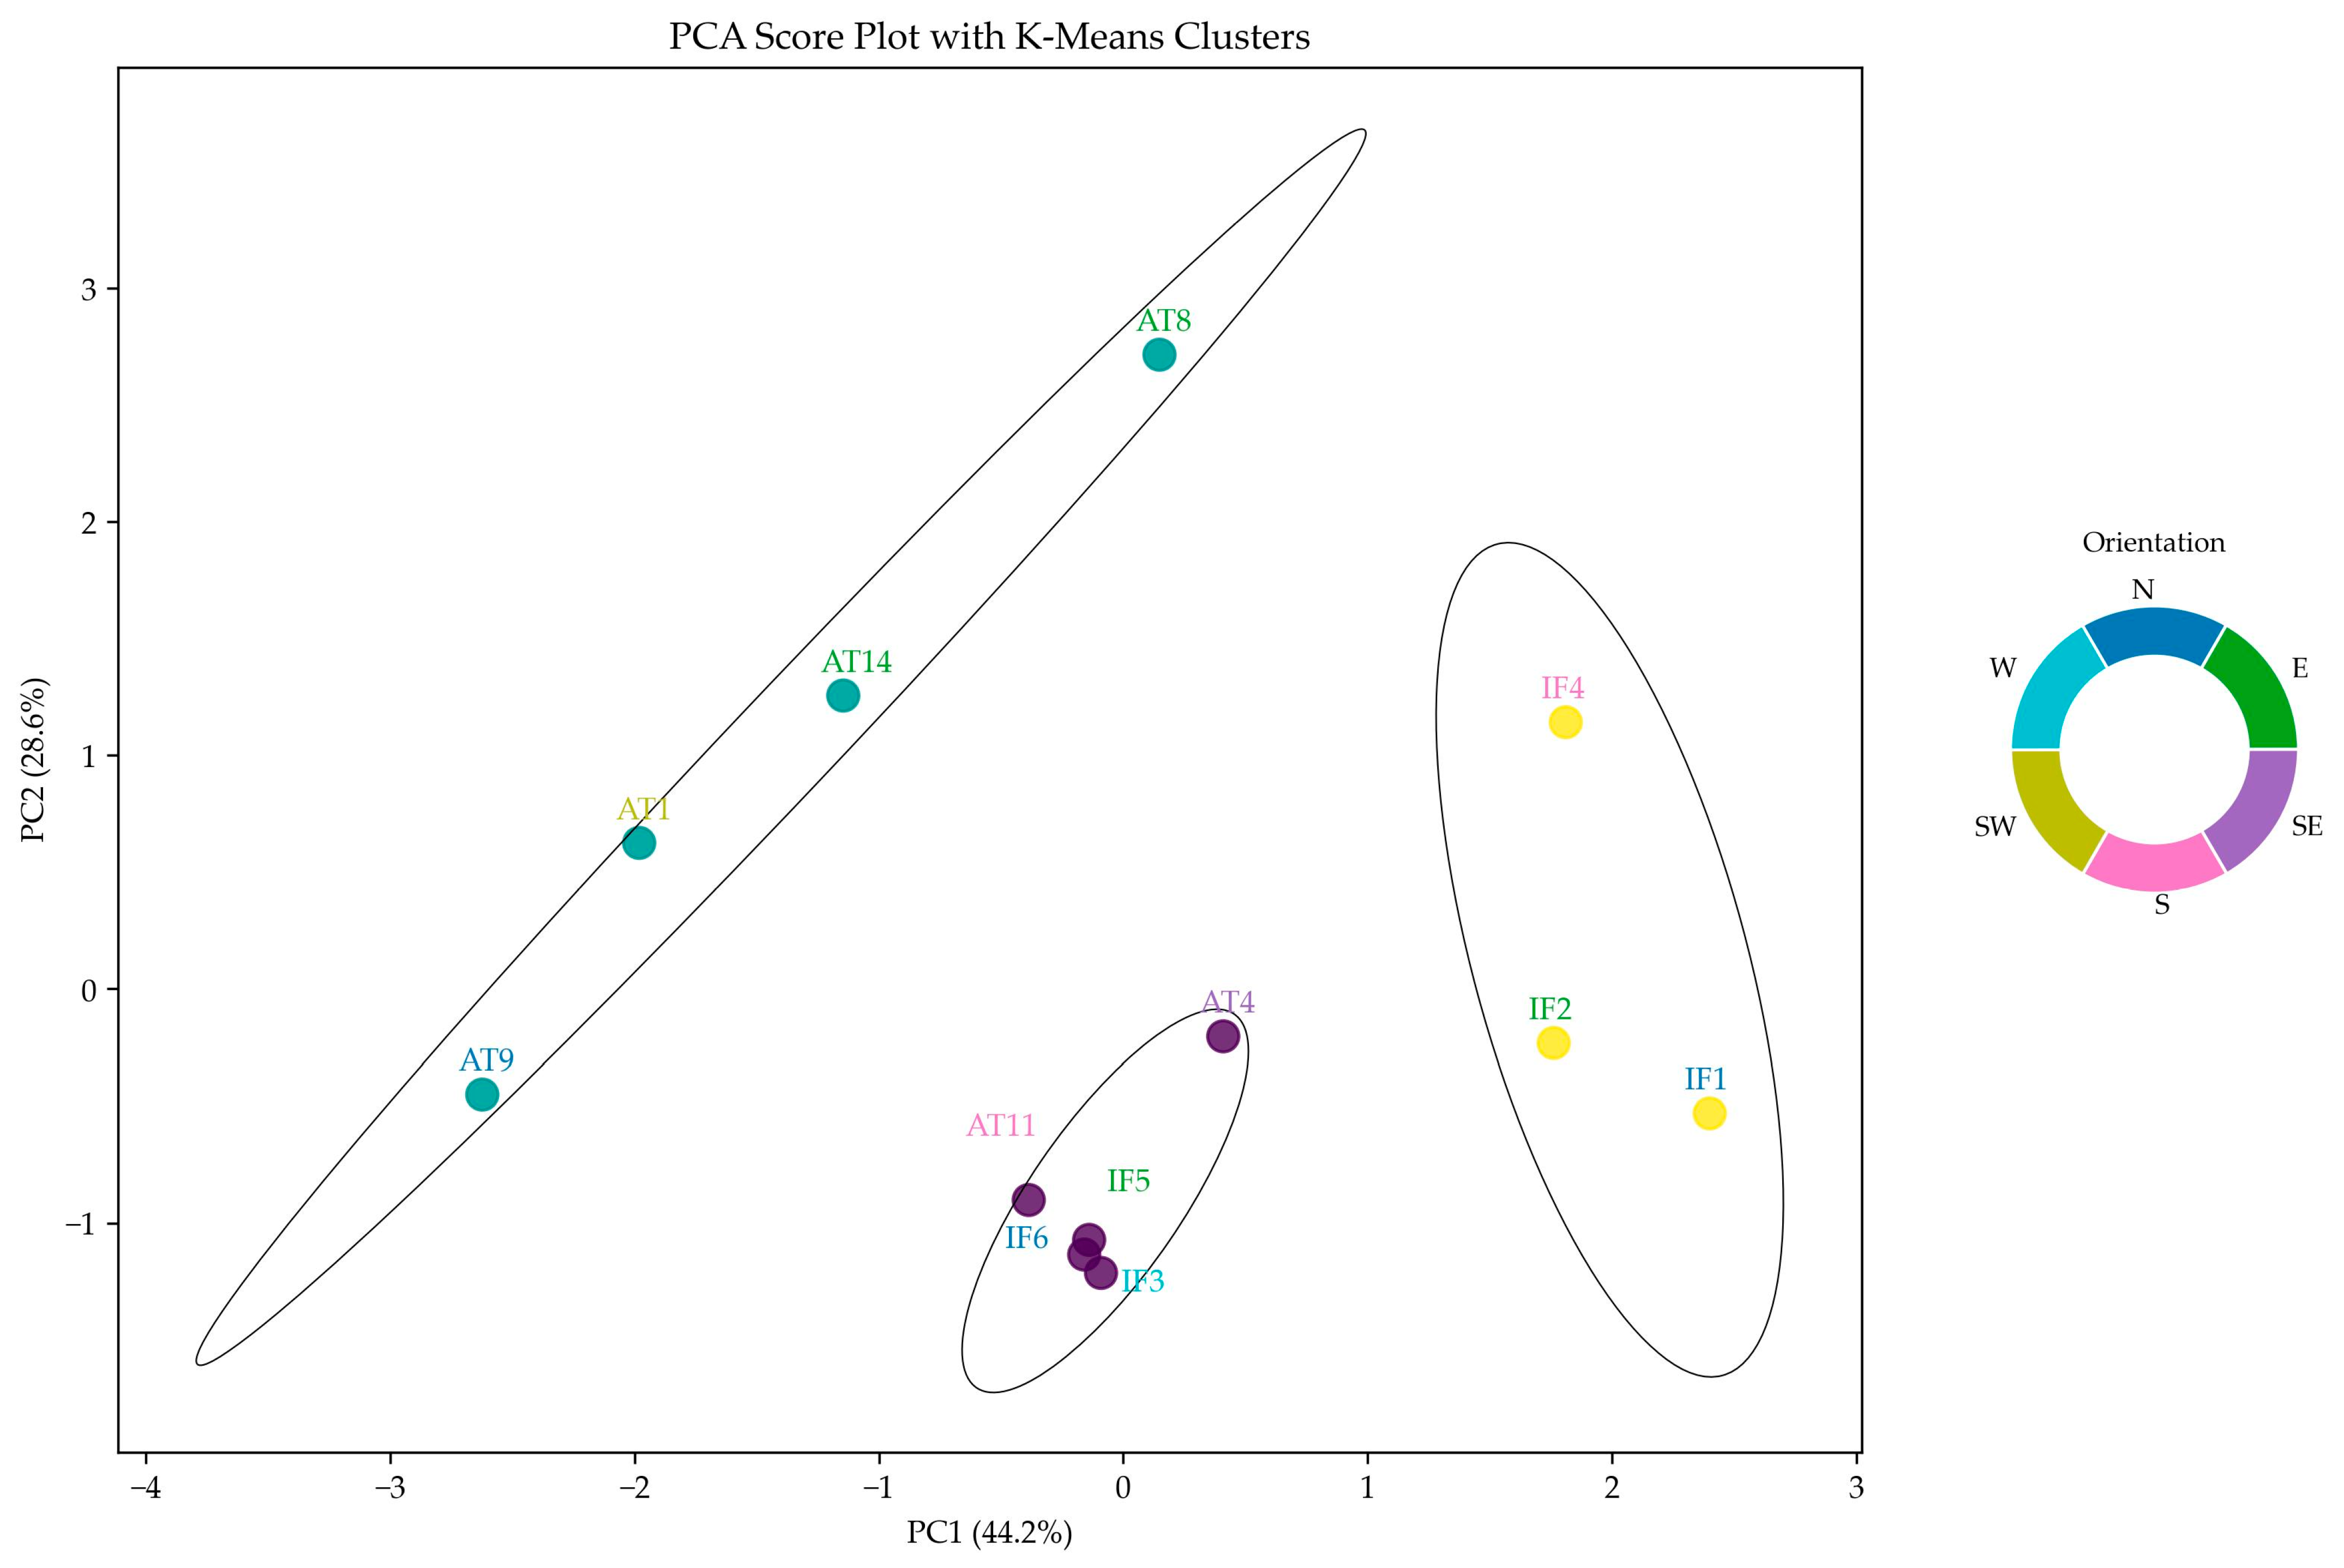
As described in Section 2.4.3, a final visualization with clustering, after merging the in situ Raman measurements and micro-XRF physical samples’ measurements data, was created. To improve visual interpretability, ellipses were added to the PCA score plots to illustrate the dispersion of samples assigned to each cluster in the reduced two-dimensional space (Figure 6).
The optimal k value was determined to be 3. Compared with the Raman-only results in Section 3.1, the clusters in the integrated analysis are fewer and more readily interpretable. This is also reflected in the explained variance of the first two principal components, which is markedly higher in the integrated analysis (44.2% for PC1 and 28.6% for PC2), when compared to the clustering results regarding the Raman datasets alone. The cumulative variance of 72.8% suggests that the first two components captured most of the structured variability in the integrated feature space. This supports the use of the fused PCA score plot as a meaningful visualization of sample relationships, while interpretation remained grounded in the combined assessment of Raman, micro-XRF, and user-defined variables.
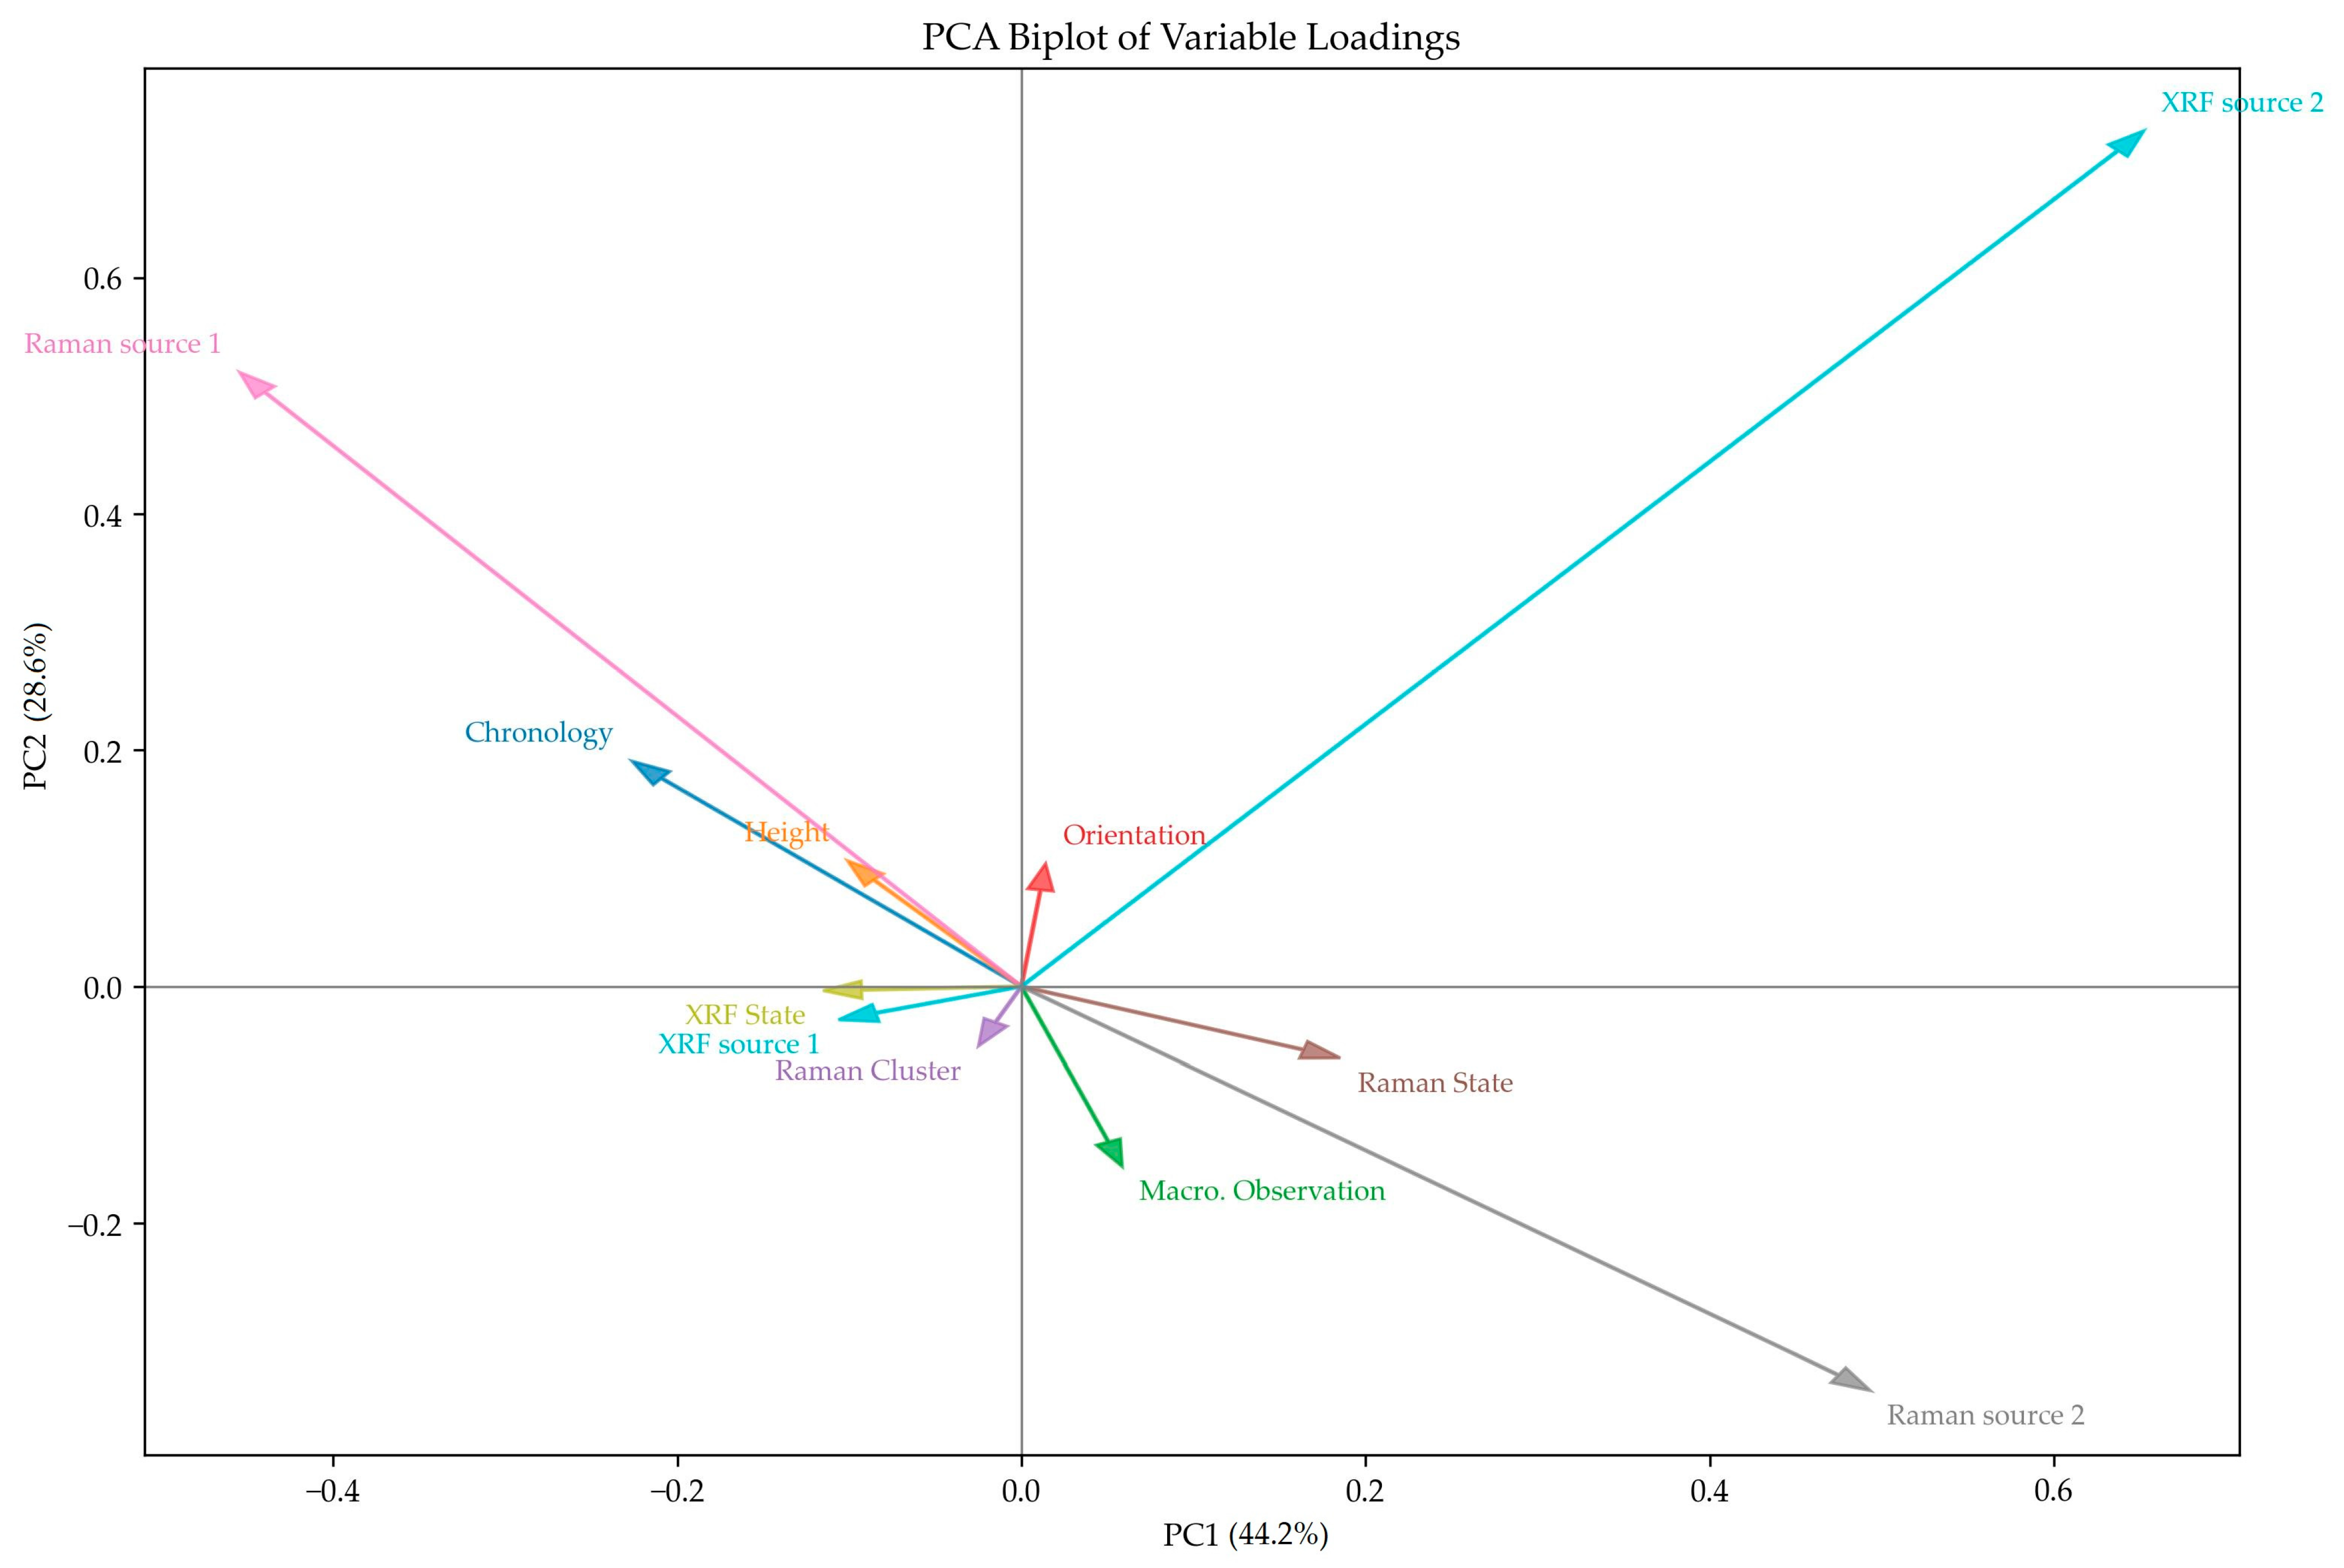
Calculation of the five most contributing features within the unified data framework showed that the pollution-source variables were the variables most strongly associated with cluster separation. The highest contribution score was associated with the secondary source indicated by the micro-XRF analyses, followed by the secondary source indicated by the Raman analyses. This helps explain the relative homogeneity observed for most samples, as well as the main features contributing to their differentiation. A separate biplot of variable loadings on PC1 and PC2 was created to facilitate interpretation of the integrated PCA results and to visualize the variables contributing to the variance (Figure 7).
Overall, orientation and height appear to have a comparatively limited contribution to cluster separation in this dataset, as samples from various orientations and heights were assigned to the same clusters. However, this result should be interpreted cautiously, particularly for orientation, since the simplified scalar encoding used here does not preserve all directional contrasts. Samples from the same sites tend to cluster together, with the exception of Cluster 0, where samples from both sites are present, indicating other contributing factors. The results are in good agreement with the extracted features from the previous steps. More specifically, the Sample IDs assigned to Cluster 0 (IF3, IF5, IF6, AT4, and AT11) were identified to have industrial emissions as a secondary source in both Raman and micro-XRF analyses; they belonged to the same cluster in Raman analyses, and they had higher Cu:Zn ratios compared to other samples in micro-XRF analyses. Sample IDs assigned to Cluster 1 (all from the Church of Ag. Theodoroi) showed industrial emissions as a primary (AT9) or secondary (AT1) pollution source or domestic heating (AT4, AT14) as a secondary source in micro-XRF analyses and were assigned to the same cluster in Raman analyses. Sample IDs assigned to Cluster 2 (all from the Temple of Hephaestus) were each assigned to a separate cluster in Raman analyses and were the only samples from the same site that did not indicate industrial emissions as a secondary pollution source and showed lower Cu:Zn ratios in micro-XRF analyses.

4. Conclusions

The main components of the black crusts on the monuments were shown to consist of a heterogeneous mixture of calcium sulfate dihydrate aggregates, pristine calcite crystals, and various metal- and soot-bearing particulate pollutants. The ratios between these components were shown to vary according to the preservation state of the sample material, with samples from the Temple of Hephaestus being in a generally better state than those from the Church of Ag. Theodoroi. Regarding the connection to pollution sources affecting the materials’ degradation and the growth of black crusts, vehicular emissions from exhausts and tire- and brake-wear are suggested as the main sources for the Temple of Hephaestus. Secondary sources were—in order of prevalence—industrial emissions, soil dust and biological activity. The Church of Ag. Theodoroi is in closer proximity to high-traffic streets and residential spaces, resulting in a more distinct presence of domestic heating-related molecular phases and elements in the black crusts, compared to the Temple of Hephaestus. Additionally, the main and secondary pollution-source variables were the features most strongly associated with cluster separation. Notably, surface orientation showed a comparatively limited contribution to the differentiation of degradation patterns within the present dataset and encoding scheme. These results should be understood as an indication of consistency between separately extracted Raman- and micro-XRF-derived interpretations and the observed sample groupings, rather than as an independent source-apportionment model.
In evaluation of the methodological steps followed in this study, the results suggest that feature-level multi-analytical data fusion reduces fragmentation of information across modalities and improves the readability of the multivariate structure, while also streamlining the interpretive workflow. The cumulative variance explained by PC1 and PC2 (72.8%) in the integrated PCA further suggests that the selected variables captured the dominant structure of the dataset without compromising interpretability. Overall, the results from micro-XRF analyses were in good agreement with the findings from the Raman analyses, highlighting the complementarity of the two analytical techniques and the interpretive value of the applied data fusion methodology within a heritage science context.
For heritage practitioners, these findings suggest more targeted conservation and pollution mitigation strategies, particularly in urban centers where multiple pollutant sources overlap. Future implementations of the workflow may incorporate a larger sample size and real-time environmental monitoring to build a dynamic dataset for monitoring degradation processes, as well as test methods specifically designed for mixed data structures, such as Gower-distance-based clustering. Ultimately, this application study suggests a shift in focus toward more holistic and policy-relevant outcomes, securing the longevity of valuable cultural sites in ever-growing urban environments.

Supplementary Materials

The following supporting information can be downloaded at https://www.mdpi.com/article/10.3390/heritage9050196/s1. Table S1: Sampling positions and optical microscope images of the samples, Figure S1: Micro-XRF analysis visualization for sample IF2, Figure S2: Micro-XRF analysis visualization for sample IF3, Figure S3: Micro-XRF analysis visualization for sample IF4, Figure S4: Micro-XRF analysis visualization for sample IF5, Figure S5: Micro-XRF analysis visualization for sample IF6, Figure S6: Micro-XRF analysis visualization for sample AT1, Figure S7: Micro-XRF analysis visualization for sample AT4, Figure S8: Micro-XRF analysis visualization for sample AT6, Figure S9: Micro-XRF analysis visualization for sample AT9, Figure S10: Micro-XRF analysis visualization for sample AT11, Figure S11: Micro-XRF analysis visualization for sample AT14.

Author Contributions

Conceptualization, Methodology, Software, Formal analysis, Investigation, Data curation, Writing—original draft, Visualization, D.M. Data curation, Validation, Writing—review and editing, E.P. Methodology, Data curation, Validation, Writing—review and editing, Resources, A.G.K. Validation, Writing—review and editing, Resources, E.G. Supervision, Methodology, Validation, Writing—review and editing, Resources, V.P. All authors have read and agreed to the published version of the manuscript.

Funding

This study was implemented within the scope of the “Exceptional Laboratory Practices in Cultural Heritage: Up-grading Infrastructure and Extending Research Perspectives of the Laboratory of Archaeometry”, co-financed by Greece and the European Union projects under the auspices of the program “Competitiveness, Entrepreneurship and Innovation” (NSRF 2014–2020).

Data Availability Statement

Sample data (Raman spectra, micro-XRF elemental concentration values) are stored and can be accessed at https://github.com/vacilos/dmitsos_data (accessed on 12 May 2026).

Acknowledgments

The authors thank the Ephorate of Antiquities of Athens for permitting sampling and in situ measurements at the monuments and Kalliopi Tsampa, member of the XRF Laboratory at NCSR “Demokritos” for helping in the pre-processing of micro-XRF data. The instrumentation of the Laboratory of Archaeometry of the University of the Peloponnese was utilized under the Direction of the late Nikolaos Zacharias, and this study is dedicated to his memory.

Conflicts of Interest

The authors declare no conflicts of interest.

References

  1. Camuffo, D.; Del Monte, M.; Sabbioni, C.; Vittori, O. Wetting, deterioration and visual features of stone surfaces in an urban area. Atmos. Environ. 1982, 16, 2253–2259. [Google Scholar] [CrossRef]
  2. Brimblecombe, P. The Effects of Air Pollution on the Built Environment; Imperial College Press: London, UK, 2003. [Google Scholar] [CrossRef]
  3. Vidal, F.; Vicente, R.; Silva, J.M. Review of environmental and air pollution impacts on built heritage: 10 questions on corrosion and soiling effects for urban intervention. J. Cult. Herit. 2019, 37, 273–295. [Google Scholar] [CrossRef]
  4. Weththimuni, M.L.; Licchelli, M. Heritage Conservation and Restoration: Surface Characterization, Cleaning and Treatments. Coatings 2023, 13, 457. [Google Scholar] [CrossRef]
  5. Feng, H. Impact of Urbanization on Cultural Heritage: A Quantitative Analysis. Adv. Educ. Humanit. Soc. Sci. Res. 2024, 11, 153–163. [Google Scholar] [CrossRef]
  6. Charola, E.; Pühringer, J.; Steiger, M. Gypsum: A review of its role in the deterioration of building materials. Environ. Geol. 2007, 52, 339–352. [Google Scholar] [CrossRef]
  7. Vidović, K.; Hočevar, S.; Menart, E.; Drventić, I.; Grgić, I.; Kroflić, A. Impact of air pollution on outdoor cultural heritage objects and decoding the role of particulate matter: A critical review. Environ. Sci. Pollut. Res. 2022, 29, 46405–46437. [Google Scholar] [CrossRef]
  8. Macchia, A.; Cerafogli, E.; Rivaroli, L.; Colasanti, I.A.; Aureli, H.; Biribicchi, C.; Brunori, V. Marble Chromatic Alteration Study Using Non-Invasive Analytical Techniques and Evaluation of the Most Suitable Cleaning Treatment: The Case of a Bust Representing Queen Margherita di Savoia at the U.S. Embassy in Rome. Analytica 2022, 3, 406–429. [Google Scholar] [CrossRef]
  9. Ryhl-Svendsen, M.; Smedemark, S.H. Mass-Transfer Air Pollution Modeling in Heritage Buildings. Heritage 2023, 6, 4768–4786. [Google Scholar] [CrossRef]
  10. Moropoulou, A.; Bisbikou, K.; Torfs, K.; Van Grieken, R.; Zezza, F.; Macri, F. Origin and growth of weathering crusts on ancient marbles in industrial atmosphere. Atmos. Environ. 1998, 32, 967–982. [Google Scholar] [CrossRef]
  11. Silva, F.M.; Arreiol, M.; Fragata, A. The Impact of Pollution on Cultural Heritage in the Historic Centre of Porto, Portugal. Urban Sci. 2024, 8, 31. [Google Scholar] [CrossRef]
  12. Amoroso, G.G.; Fassina, V. Stone Decay and Conservation: Atmospheric Pollution, Cleaning, Consolidation and Protection. Stud. Conserv. 1984, 29, 158–159. [Google Scholar] [CrossRef]
  13. Rodriguez-Navarro, C.; Sebastian, E. Role of particulate matter from vehicle exhaust on porous building stones (limestone) sulfation. Sci. Total Environ. 1996, 187, 79–91. [Google Scholar] [CrossRef]
  14. Cadle, S.H.; Mulawa, P.A.; Hunsanger, E.C.; Nelson, K.; Ragazzi, R.A.; Barrett, R.; Gallagher, G.L.; Lawson, D.R.; Knapp, K.T.; Snow, R. Composition of light-duty motor vehicle exhaust particulate matter in the Denver, Colorado area. Environ. Sci. Technol. 1999, 33, 2328–2339. [Google Scholar] [CrossRef]
  15. Valavanidis, A.; Fiotakis, K.; Vlahogianni, T.; Bakeas, E.B.; Triantafillaki, S.; Paraskevopoulou, V.; Dassenakis, M. Characterization of atmospheric particulates, particle-bound transition metals and polycyclic aromatic hydrocarbons of urban air in the centre of Athens (Greece). Chemosphere 2006, 65, 760–768. [Google Scholar] [CrossRef] [PubMed]
  16. Thorpe, A.; Harrison, R.M. Sources and properties of non-exhaust particulate matter from road traffic: A review. Sci. Total Environ. 2008, 400, 270–282. [Google Scholar] [CrossRef] [PubMed]
  17. Pozo-Antonio, J.S.; Cardell, C.; Comite, V.; Fermo, P. Characterization of black crusts developed on historic stones with diverse mineralogy under different air quality environments. Environ. Sci. Pollut. Res. 2022, 29, 29438–29454. [Google Scholar] [CrossRef]
  18. Ruffolo, S.A.; La Russa, M.F.; Rovella, N.; Ricca, M. The Impact of Air Pollution on Stone Materials. Environments 2023, 10, 119. [Google Scholar] [CrossRef]
  19. Clemente, P.; Giovinazzi, S.; Fantoni, R. Special issue on knowledge, evaluation and preservation of cultural heritage. J. Civ. Struct. Health Monit. 2024, 14, 83–84. [Google Scholar] [CrossRef]
  20. De Rosa, A.; Cennamo, P.; Saltarelli, C.; Trojsi, G.; Rimauro, J.; Vigorito, M.R.; Chianese, E. The Effects of Urban Pollution on the “Gesù Nuovo” Façade (Naples, Italy): A Diagnostic Overview. Atmosphere 2025, 16, 68. [Google Scholar] [CrossRef]
  21. Fronteau, G.; Schneider-Thomachot, C.; Chopin, E.; Barbin, V.; Mouze, D.; Pascal, A. Black-crust growth and interaction with underlying limestone microfacies. In Natural Stone Resources for Historical Monuments; Přikryl, R., Török, Á., Eds.; The Geological Society of London: London, UK, 2010. [Google Scholar] [CrossRef]
  22. Török, Á.; Licha, T.; Simon, K.; Siegesmund, S. Urban and rural limestone weathering; the contribution of dust to black crust formation. Environ. Earth Sci. 2011, 63, 675–693. [Google Scholar] [CrossRef]
  23. Casadio, F.; Daher, C.; Bellot-Gurlet, L. Raman Spectroscopy of cultural heritage Materials: Overview of Applications and New Frontiers in Instrumentation, Sampling Modalities, and Data Processing. Top. Curr. Chem. 2016, 374, 62. [Google Scholar] [CrossRef]
  24. Mitsos, D.; Kantarelou, V.; Palamara, E.; Karydas, A.G.; Zacharias, N.; Gerasopoulos, E. Characterization of black crust on archaeological marble from the Library of Hadrian in Athens and inferences about contributing pollution sources. J. Cult. Herit. 2022, 53, 236–243. [Google Scholar] [CrossRef]
  25. Odelli, E.; Rousaki, A.; Raneri, S.; Vandenabeele, P. Advantages and pitfalls of the use of mobile Raman and XRF systems applied on cultural heritage objects in Tuscany (Italy). Eur. Phys. J. Plus 2021, 136, 449. [Google Scholar] [CrossRef]
  26. Gibbons, E.; Léveillé, R.; Berlo, K. Data fusion of laser-induced breakdown and Raman spectroscopies: Enhancing clay mineral identification. Spectrochim. Acta Part B At. Spectrosc. 2020, 170, 105905. [Google Scholar] [CrossRef]
  27. Qingya, W.; Li, F.; Jiang, X.; Hao, J.; Zhao, Y.; Wu, S.; Cai, Y.; Huang, W. Quantitative analysis of soil cadmium content based on the fusion of XRF and Vis-NIR data. Chem. Intell. Lab. Syst. 2022, 226, 104578. [Google Scholar] [CrossRef]
  28. Zhang, Z.; Wang, Z.; Luo, Y.; Zhang, J.; Feng, X.; Zeng, Q.; Tian, D.; Li, C.; Zhang, Y.; Wang, Y.; et al. Quantitative Analysis of Soil Cd Content Based on the Fusion of Vis-NIR and XRF Spectral Data in the Impacted Area of a Metallurgical Slag Site in Gejiu, Yunnan. Processes 2023, 11, 2714. [Google Scholar] [CrossRef]
  29. Ramos, M.M.; Remondino, F. Data fusion in Cultural Heritage—A Review. Int. Arch. Photogramm. Remote Sens. Spat. Inf. Sci. 2015, XL-5/W7, 359–363. [Google Scholar] [CrossRef]
  30. Lombardo, L.; Parvis, M.; Corbellini, S.; Arroyave Posada, C.E.; Angelini, E.; Grassini, S. Environmental monitoring in the cultural heritage field. Eur. Phys. J. Plus 2019, 134, 411. [Google Scholar] [CrossRef]
  31. Laohaviraphap, N.; Waroonkun, T. Integrating Artificial Intelligence and the Internet of Things in Cultural Heritage Preservation: A Systematic Review of Risk Management and Environmental Monitoring Strategies. Buildings 2024, 14, 3979. [Google Scholar] [CrossRef]
  32. Zhao, C.; Zhang, Y.; Wang, C.C.; Hou, M.; Li, A. Recent progress in instrumental techniques for architectural heritage materials. Herit. Sci. 2019, 7, 36. [Google Scholar] [CrossRef]
  33. Yan, Y.; Wang, Y. A Review of Atmospheric Deterioration and Sustainable Conservation of Calcareous Stone in Historical Buildings and Monuments. Sustainability 2024, 16, 10751. [Google Scholar] [CrossRef]
  34. RRUFF. Project Database. Available online: https://rruff.info/ (accessed on 13 May 2025).
  35. Cedeño, E.; Zhenli, S.; Zijin, H.; Jingjing, D. Raman spectroscopy for profiling physical and chemical properties of atmospheric aerosol particles: A review. Ecotoxicol. Environ. Saf. 2023, 249, 114405. [Google Scholar] [CrossRef]
  36. Kantarelou, V.; Karydas, A.G. A simple calibration procedure of polycapillary based portable micro-XRF spectrometers for reliable quantitative analysis of cultural heritage materials. X-Ray Spectrom. 2016, 45, 85–91. [Google Scholar] [CrossRef]
  37. Mitsos, D.; Poulopoulos, V. Addressing Air Pollution Challenges: An Integrated Algorithmic Approach Towards Safeguarding Built Heritage. Algorithms 2025, 18, 619. [Google Scholar] [CrossRef]
  38. Xu, Y.; Du, P.; Senger, R.; Robertson, J.; Pirkle, J.L. ISREA: An Efficient Peak-Preserving Baseline Correction Algorithm for Raman Spectra. Appl. Spectrosc. 2020, 75, 34–45. [Google Scholar] [CrossRef]
  39. Chi, M.; Han, X.; Xu, Y.; Wang, Y.; Shu, F.; Zhou, W.; Wu, Y. An Improved Background-Correction Algorithm for Raman Spectroscopy Based on the Wavelet Transform. Appl. Spectrosc. 2019, 73, 78–87. [Google Scholar] [CrossRef]
  40. Prieto-Taboada, N.; Gómez-Laserna, O.; Martínez-Arkarazo, I.; Olazabal, M.Á.; Madariaga, J.M. Raman spectra of the different phases in the CaSO4-H2O system. Anal. Chem. 2014, 86, 10131–10137. [Google Scholar] [CrossRef] [PubMed]
  41. Joint Research Centre: Institute for Health and Consumer Protection; Kephalopoulos, S.; Bruinen de Bruin, Y.; Koistinen, K.; Jantunen, M.; Yli-Tuomi, T. A Review of Source Apportionment Techniques and Marker Substances Available for Identification of Personal Exposure, Indoor and Outdoor Sources of Chemicals; Publications Office of the European Union: Luxembourg, 2006.
  42. Figueroa, D.A.; Rodríguez-Sierra, C.J.; Jiménez-Velez, B.D. Concentrations of Ni and V, other heavy metals, arsenic, elemental and organic carbon in atmospheric fine particles (PM2.5) from Puerto Rico. Toxicol. Ind. Health 2006, 22, 87–99. [Google Scholar] [CrossRef] [PubMed]
  43. Fussell, J.C.; Franklin, M.; Green, D.C.; Gustafsson, M.; Harrison, R.M.; Hicks, W.; Kelly, F.J.; Kishta, F.; Miller, M.R.; Mudway, I.S.; et al. A Review of Road Traffic-Derived Non-Exhaust Particles: Emissions, Physicochemical Characteristics, Health Risks, and Mitigation Measures. Environ. Sci. Technol. 2022, 56, 6813–6835. [Google Scholar] [CrossRef] [PubMed]
  44. Moreno, T.; Martins, V.; Querol, X.; Jones, T.; Bérubé, K.; Minguillón, M.C.; Amato, F.; Capdevila, M.; de Miguel, E.; Centelles, S.; et al. A new look at inhalable metalliferous airborne particles on rail subway platforms. Sci. Total Environ. 2015, 505, 367–375. [Google Scholar] [CrossRef]
  45. Crilley, L.R.; Lucarelli, F.; Bloss, W.J.; Harrison, R.M.; Beddows, D.C.; Calzolai, G.; Nava, S.; Valli, G.; Bernardoni, V.; Vecchi, R. Source apportionment of fine and coarse particles at a roadside and urban background site in London during the 2012 summer ClearfLo campaign. Environ. Pollut. 2017, 220, 766–778. [Google Scholar] [CrossRef]
  46. Smolinska, A.; Engel, J.; Szymanska, E.; Buydens, L.; Blanchet, L. Chapter 3—General Framing of Low-, Mid-, and High-Level Data Fusion With Examples in the Life Sciences. In Data Handling in Science and Technology; Cocchi, M., Ed.; Elsevier: Amsterdam, The Netherlands, 2019; Volume 31. [Google Scholar] [CrossRef]
  47. Robert, C.; Jessep, W.; Sutton, J.J.; Hicks, T.M.; Loeffen, M.; Farouk, M.; Ward, J.F.; Bain, W.E.; Craigie, C.R.; Fraser-Miller, S.J.; et al. Evaluating low- mid- and high-level fusion strategies for combining Raman and infrared spectroscopy for quality assessment of red meat. Food Chem. 2021, 361, 130154. [Google Scholar] [CrossRef]
  48. Maurenbrecher, P. Water-Shedding Details Improve Masonry Performance; Construction Technology Update 23; Institute for Research in Construction, National Research Council of Canada: Ottawa, ON, Canada, 1998. [Google Scholar] [CrossRef]
  49. Koukoulakis, K.G.; Chrysohou, E.; Kanellopoulos, P.G.; Karavoltsos, S.; Katsouras, G.; Dassenakis, M.; Nikolelis, D.; Bakeas, E. Trace elements bound to airborne PM10 in a heavily industrialized site nearby Athens: Seasonal patterns, emission sources, health implications. Atmos. Pollut. Res. 2019, 10, 1347–1356. [Google Scholar] [CrossRef]
  50. Gulotta, D.; Bertoldi, M.; Bortolotto, S.; Fermo, P.; Piazzalunga, A.; Toniolo, L. The Angera stone: A challenging conservation issue in the polluted environment of Milan (Italy). Environ. Earth Sci. 2013, 69, 1085–1094. [Google Scholar] [CrossRef]
  51. Rampazzi, L. Calcium oxalate films on works of art: A review. J. Cult. Herit. 2019, 40, 195–214. [Google Scholar] [CrossRef]
  52. McAlister, J.J.; Smith, B.J.; Török, A. Transition metals and water-soluble ions in deposits on a building and their potential catalysis of stone decay. Atmos. Environ. 2008, 42, 7657–7668. [Google Scholar] [CrossRef]
  53. Macholdt, D.S.; Herrmann, S.; Jochum, K.P.; Kilcoyne, A.L.D.; Laubscher, T.; Pfisterer, J.H.K.; Pöhlker, C.; Schwager, B.; Weber, B.; Weigand, M.; et al. Black manganese-rich crusts on a Gothic cathedral. Atmos. Environ. 2017, 171, 205–220. [Google Scholar] [CrossRef]
  54. Hagino, H.; Iwata, A.; Okuda, T. Iron Oxide and Hydroxide Speciation in Emissions of Brake Wear Particles from Different Friction Materials Using an X-ray Absorption Fine Structure. Atmosphere 2024, 15, 49. [Google Scholar] [CrossRef]
Figure 1. Pictures and locations of the Temple of Hephaestus and the Byzantine Church of Ag. Theodoroi in the center of Athens, Greece.
Heritage 09 00196 g001
Figure 2. Representative Raman spectra of measurements with Sample IDs IF2 and IF16, showcasing the similarities in bands associated with the crusts’ mineral matrix (gypsum = Gp, calcite = Cal, quartz = Qz), and differentiations in terms of contaminants, such as manganese oxides (=Mn oxides), C-N and nitriles bonds for IF2, and benzene and soot for IF16.
Heritage 09 00196 g002
Figure 3. PCA scatter plot after k-means clustering with adjacent table of the clusters, the Sample IDs assigned to each cluster, and the five most contributing Raman bands for the cluster centroids, regarding Raman measurements conducted at the Temple of Hephaestus.
Heritage 09 00196 g003
Figure 4. PCA scatter plot after k-means clustering with adjacent table of the clusters, the Sample IDs assigned to each cluster, and the five most contributing Raman bands for the cluster centroids, regarding Raman measurements conducted at the Church of Ag. Theodoroi.
Heritage 09 00196 g004
Figure 5. Heatmap of a Pearson’s correlation matrix for the distribution of elements as measured by micro-XRF in line-scans, with the adjacent table presenting key features for sample IF1 (i.e., selected mean elements’ concentrations, correlation values between elements and element ratios).
Heritage 09 00196 g005
Figure 6. PCA scatter plot with dispersion ellipses for the Sample IDs where both in situ Raman measurements and micro-XRF measurements on physical samples were conducted. The variables entering the integrated analysis included Raman-derived cluster/source/state descriptors, micro-XRF-derived cluster/source/state descriptors, selected elemental ratio descriptors, and contextual variables including normalized sampling height, chronology, macroscopic observation rating, and orientation encoding. Ellipses were computed in the two-dimensional PCA score space from the dispersion of samples assigned to each cluster and are included as visual aids to show cluster spread. The different cluster assignments are annotated by different colored circles in the biplot. The orientation ring legend corresponds to different colors for the Sample ID text labels in the biplot.
Heritage 09 00196 g006
Figure 7. PCA biplot of the integrated feature-level dataset, showing the loading vectors of the variables. Arrows represent the direction and magnitude of the variable loadings on PC1 and PC2. Variables oriented toward the same direction are positively associated, whereas variables with opposing orientations indicate contrasting contributions to sample separation.
Heritage 09 00196 g007
Table 1. Unified data framework incorporating the various parameters (i.e., normalized sampling height, sampling surface orientation, macroscopic observation condition rating, XRF and Raman cluster numbers, main pollution sources and inferred states).
Sample IDHeight Norm.OrientationOrient.
Norm.
Chron. Norm.Macro. Observ.Raman
Cluster
Raman Source 1Raman
Source 2
Raman StateXRF ClusterXRF Source 1XRF Source 2XRF State
IF10.1N00211422141
IF20E0.70710231323152
IF30.1W0.70710221212121
IF40.1S10121212151
IF50E0.70710121212121
IF60.1N00121212121
IF70.1E0.7071012121
IF80.1E0.7071012121
IF90N0022121
IF100.1N0012121
IF110S1022121
IF120.1S1012121
IF130S1012121
IF140.1W0.7071012121
IF150W0.7071024132
IF160.1W0.7071025312
AT11SW0.92391123112122
AT20.6NE0.3827122311
AT30.5NE0.3827111131
AT40.4SE0.92391131222131
AT70.8S1112311
AT80.4E0.70711123112151
AT90.3N01223112212
AT100S1124142
AT110S11131213121
AT120.1S1112312
AT131SE0.9239122311
AT140.3E0.70711123113131
AT151W0.7071112311
AT160.1S1122311
AT170.6NE0.3827122312
AT180.3E0.7071111131
Disclaimer/Publisher’s Note: The statements, opinions and data contained in all publications are solely those of the individual author(s) and contributor(s) and not of MDPI and/or the editor(s). MDPI and/or the editor(s) disclaim responsibility for any injury to people or property resulting from any ideas, methods, instructions or products referred to in the content.