2.1. Study Object
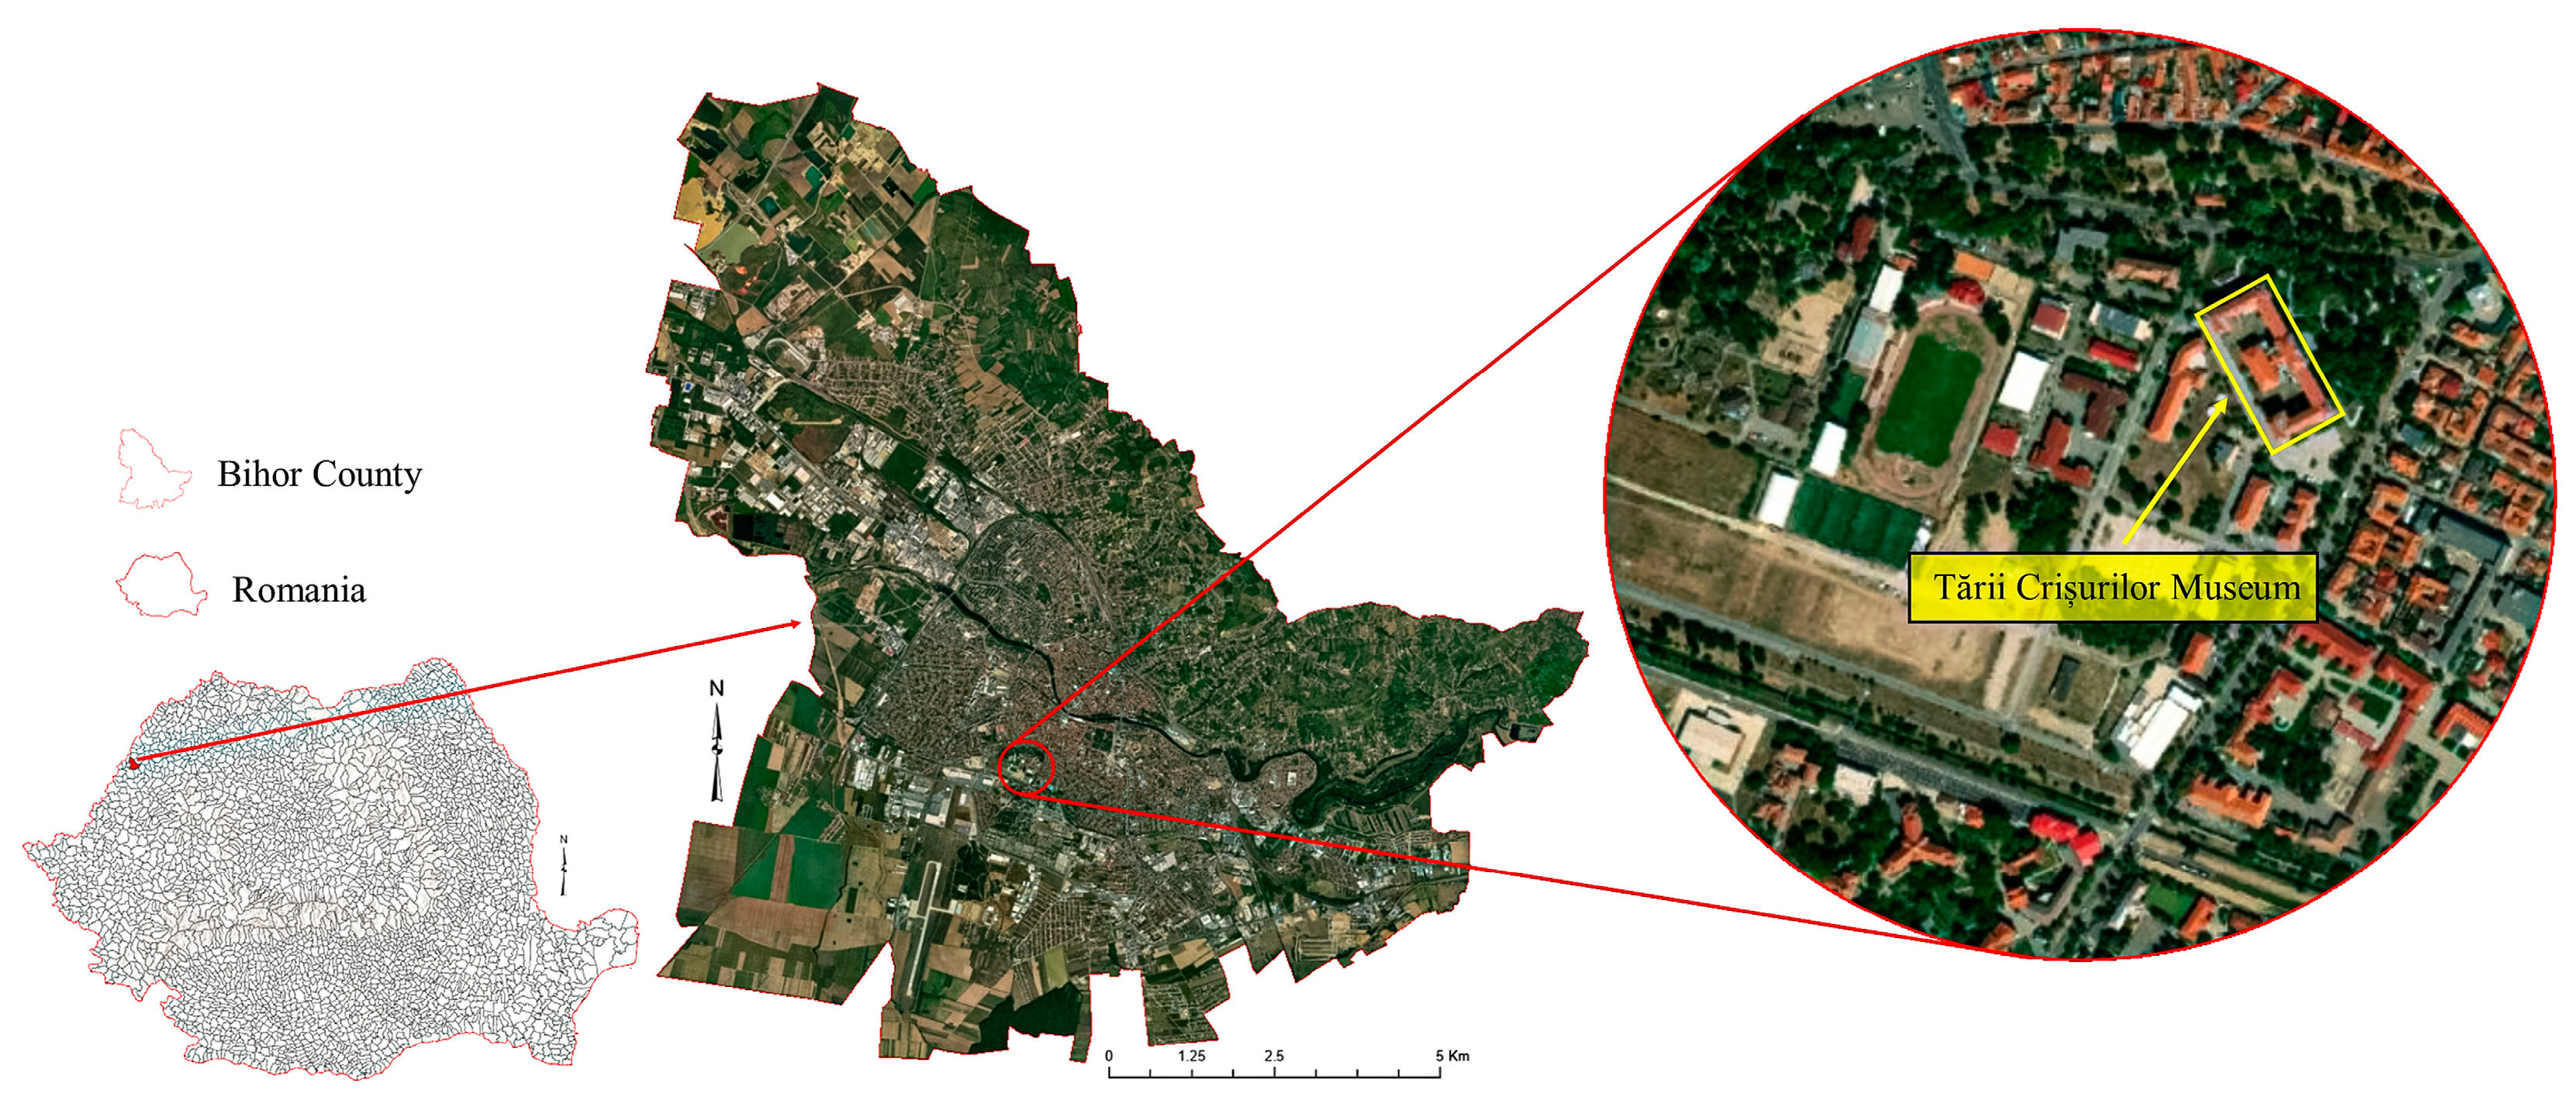
Crişurilor County Museum is located in Oradea Municipality on Armatei Române Street no. 1A and is one of Romania’s largest museums (
Figure 1). Founded in 1971, the museum today holds a heritage of approximately 450,000 archaeological, historical, ethnographic and art pieces, illustrating the cultural diversity specific to the western region of Romania, marked by an ethnic and cultural mosaic. Since 2006, the museum has been operating in the building of the former Cadet School, a historical monument built in 1897 to serve military education.
The ethnographic collection of the Crişurilor County Museum was selected for the present study. The choice is justified by the high sensitivity of the exhibited objects (textiles, furniture and artefacts made of organic materials) to variations in T, RH, other pollutants and microbiological contamination, factors that can accelerate degradation processes. At the same time, this collection is among the most visited by the public in this museum, making understanding visitors’ perceptions of microclimate conditions an essential objective of the research.
Within this museum collection, three exhibition halls were monitored. All three spaces share common characteristics: they are dedicated to the exhibition of traditional clothing and ethnographic furniture and are integrated into the same visitor route, ensuring a comparable frequency of visitors. At the same time, the interconnection of the halls favours an active exchange of air between the spaces, which results in uneven air circulation and, implicitly, a redistribution of PM, pollutants, and microbiological load. Exhibition hall 1 has an area of 40.95 m
2 and a total air volume of 192.47 m
3, housing exhibits such as traditional clothing, household textiles and traditional furniture. Exhibition hall 2 has an area of 37.76 m
2 and an air volume of 177.47 m
3, mainly dedicated to presenting traditional clothing. Exhibition Hall 3, with an area of 37.17 m
2 and a total volume of 174.7 m
3, houses a collection of household textiles, traditional furniture, and household objects, made mainly of wood (
Table 1). The analysed rooms lack windows with direct exposure to the outdoor environment, and the indoor microclimate is fully controlled through mechanical ventilation systems. The exhibition spaces are equipped with HVAC units: three systems in Exhibition Halls 2 and 3, and two in Exhibition Hall 1. These systems provide both heating and cooling, ensuring precise control over indoor environmental conditions and contributing to the overall stability of the monitored microclimate.
Ilies et al. [
40] also studied the ethnography section of the Crişurilor County Museum, but the aim focused mainly on evaluating the interaction between microclimate parameters and the conservation processes of museum heritage. They focused particularly on the statistical dimension, using IAQ data integrated into impact indices for visitors’ and employees’ health and the conservation status of exhibits. Unlike that research, the present approach extends the analysis by including the microbiological dimension and visitors’ perceptions of IAQ.
2.2. Determination of IAQ and Fungal Contamination Indicator Values
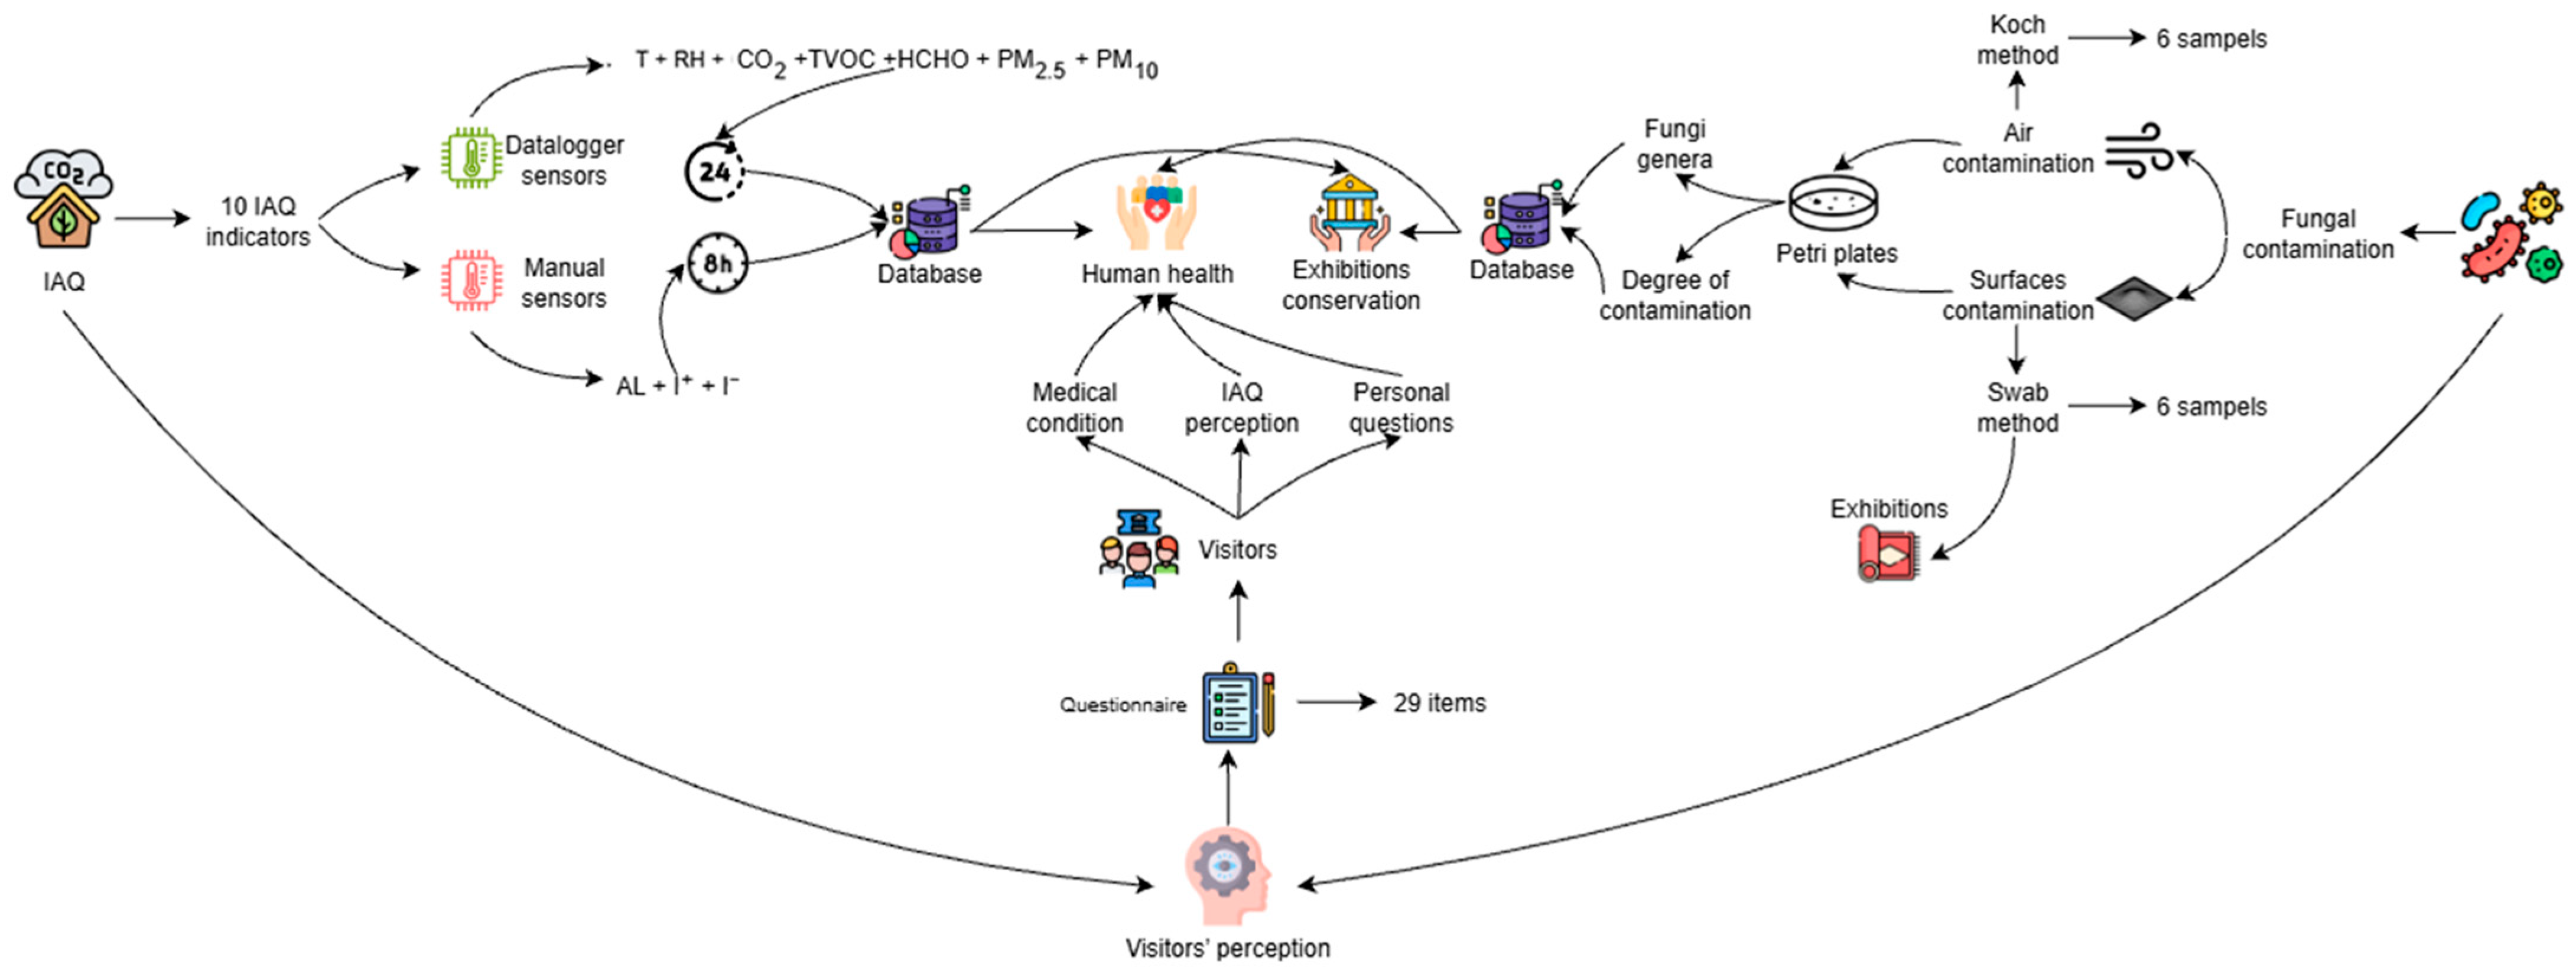
In this paper, an integrated approach was pursued, aiming to analyse the leading indicators of IAQ, fungal microflora, and visitors’ perceptions of microclimate conditions in museum spaces (
Figure 2). These three components are deeply interconnected, each exerting a direct influence on the others. IAQ parameters condition both the conservation processes of the exhibited heritage and the development and diversity of fungal microflora. At the same time, IAQ and the presence of biological agents significantly affect visitors’ health, comfort and perceptions.
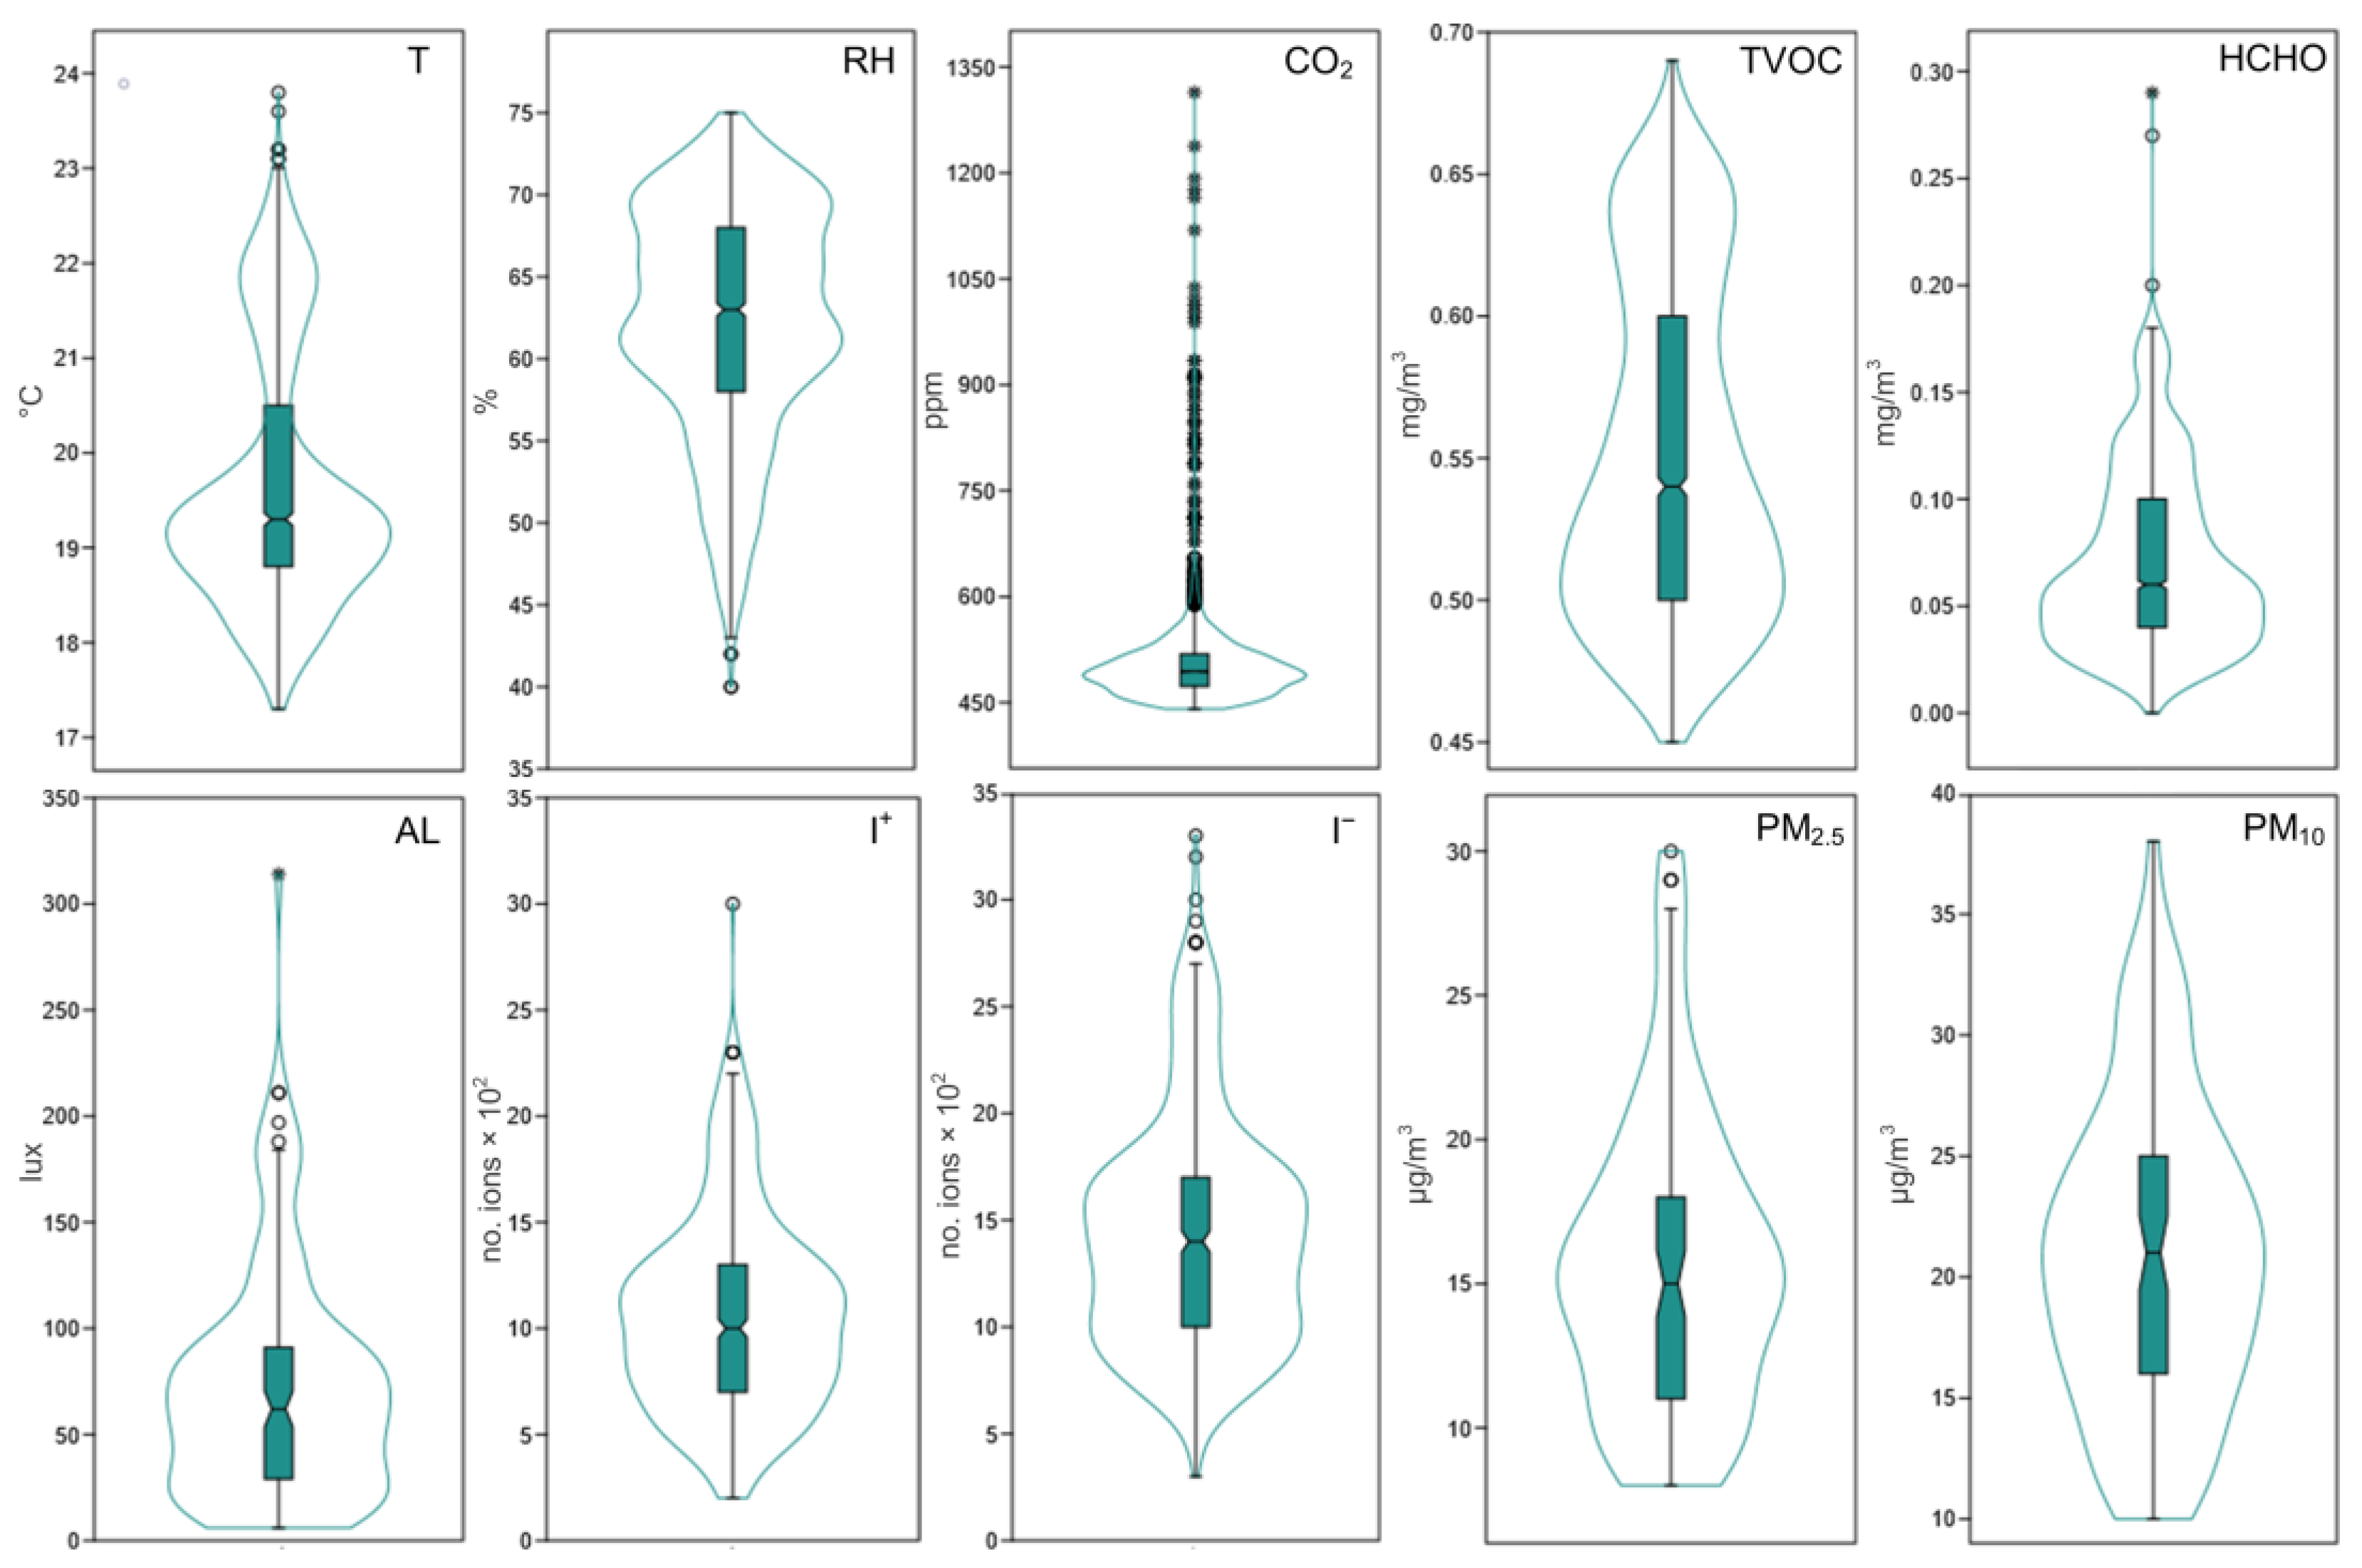
For indoor air monitoring, data was obtained between January and August 2024, for a set of ten indicators: T, RH, CO2, positive ions (I+), negative ions (I−), formaldehyde (HCHO), TVOC, suspended particles with a diameter of ≤2.5 µm (PM2.5), particles with a diameter of ≤10 µm (PM10) and artificial illumination level (AL).
Data collection was carried out using datalogger devices for the indicators T, RH, CO2, HCHO, TVOC, PM2.5, and PM10, set to record and store data at hourly intervals, and placed at strategic points in the three monitored rooms. Regarding the indicators I+, I− and AL, in the absence of datalogger devices, the data were collected manually three times a day (in the morning, at midday, and in the evening) from different points of the exhibition spaces with the help of dedicated detectors.
To monitor T and RH, recognised as essential indicators for heritage conservation and for the development of bacterial and fungal microflora, twenty-two KlimaloggPro thermo-hygrometers (TFA, Ottersberg, Germany) were used in conjunction with HOBO U23 Pro v2 datalogger sensors (Onset Computer Corporation, Bourne, MA, USA). CO
2, HCHO and TVOC concentrations (including the additional parameters T and RH) were determined using three Evikontroll Gas detection and control system devices (Evikontroll Gas, Tartu, Estonia). PM
2.5 and PM
10 were recorded with three DeltaOHM HD50PM devices (Senseca Italy Srl, Padova, Italy). For the indicators I
+ and I
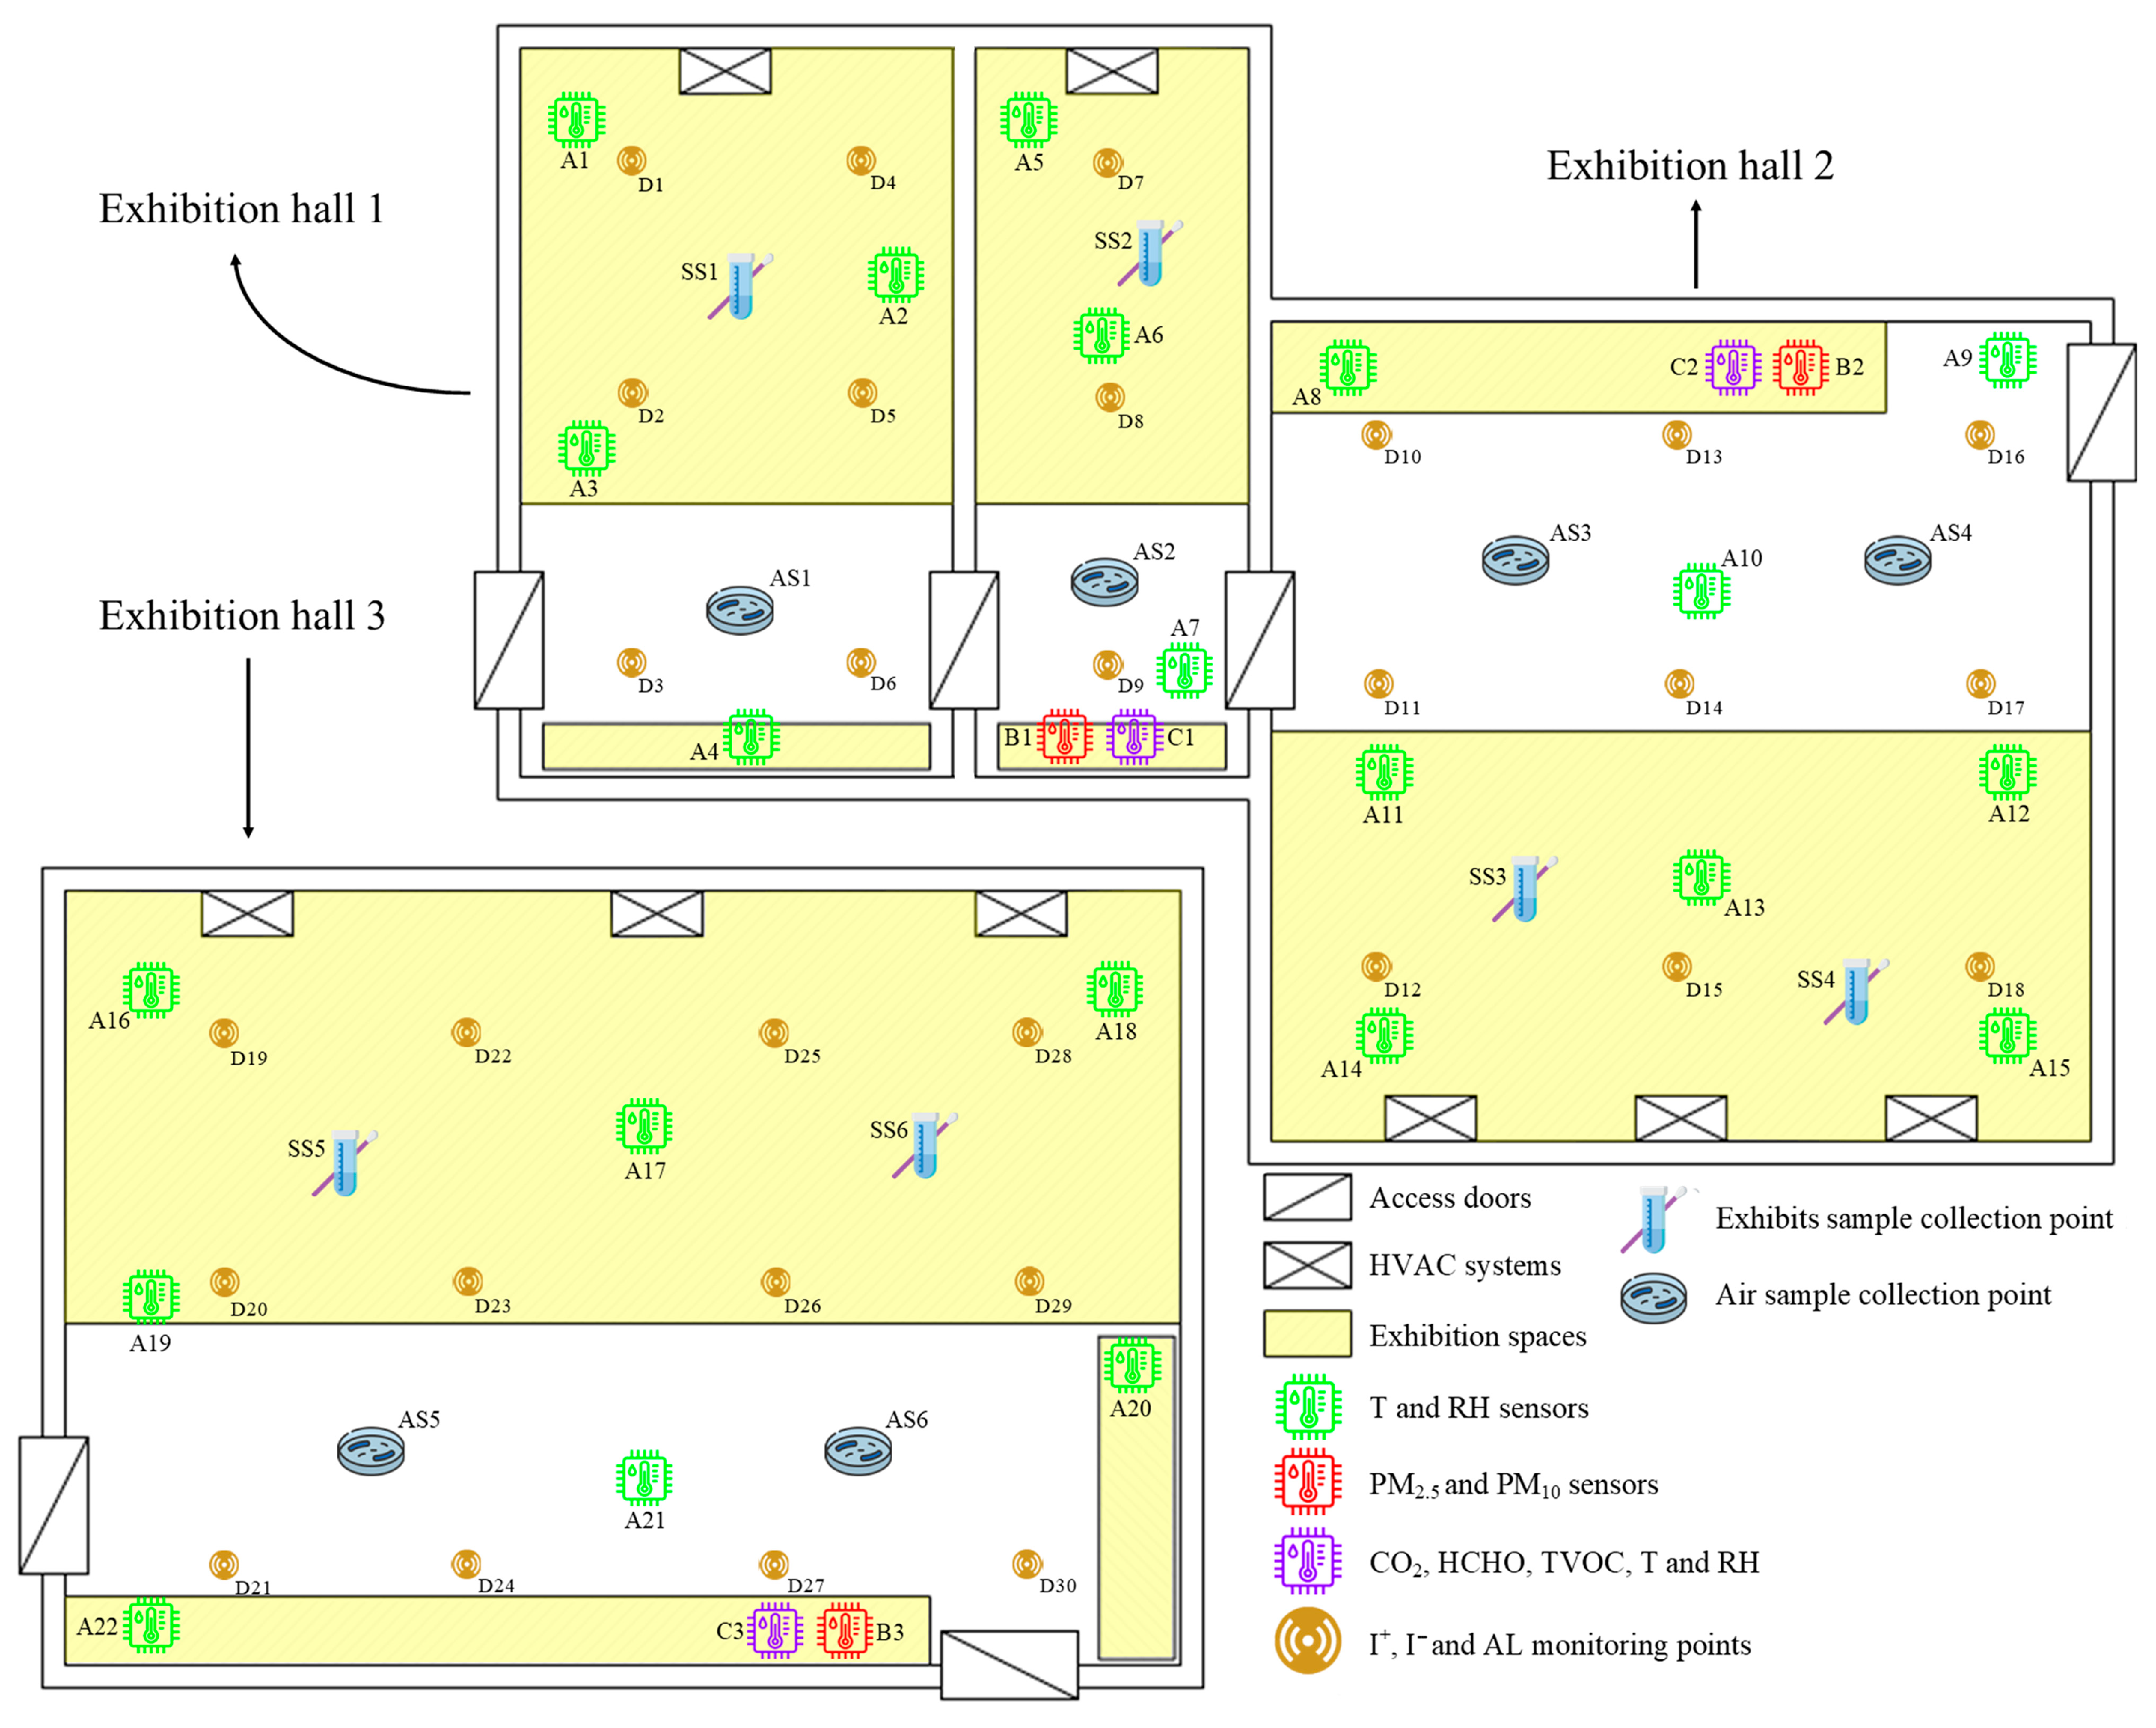
−, measurements were made using the NKMH-103 device (Ion Trading, Tokyo, Japan), and for AL, the Extech SDL400 (Extech Instruments, Nashua, NH, USA) was used (
Figure 3). The values of these parameters were obtained from a dense spatial distribution of collection points, and the resulting data were averaged to yield values as representative as possible for each indicator [
40].
All this equipment was arranged in a dense network of monitoring points, configured to ensure the most uniform coverage of the exhibition spaces. This approach allows the average characterisation of the microclimate and the identification of minor fluctuations in the parameters, generated by the presence of visitors, local pollutant emissions or the peculiarities of air circulation between interconnected rooms. Thus, the implemented monitoring system offers high spatial and temporal resolution, essential for the precise assessment of risks to heritage and human health.
After the monitoring period ended, all data were analysed against the international standards in force for assessing IAQ, with consideration of both human health protection and the conservation of the exhibited heritage. In addition, the monitored indicators were interpreted in relation to their influence on the growth and development of fungal microflora, the well-being of visitors, and their perception in the exhibition spaces.
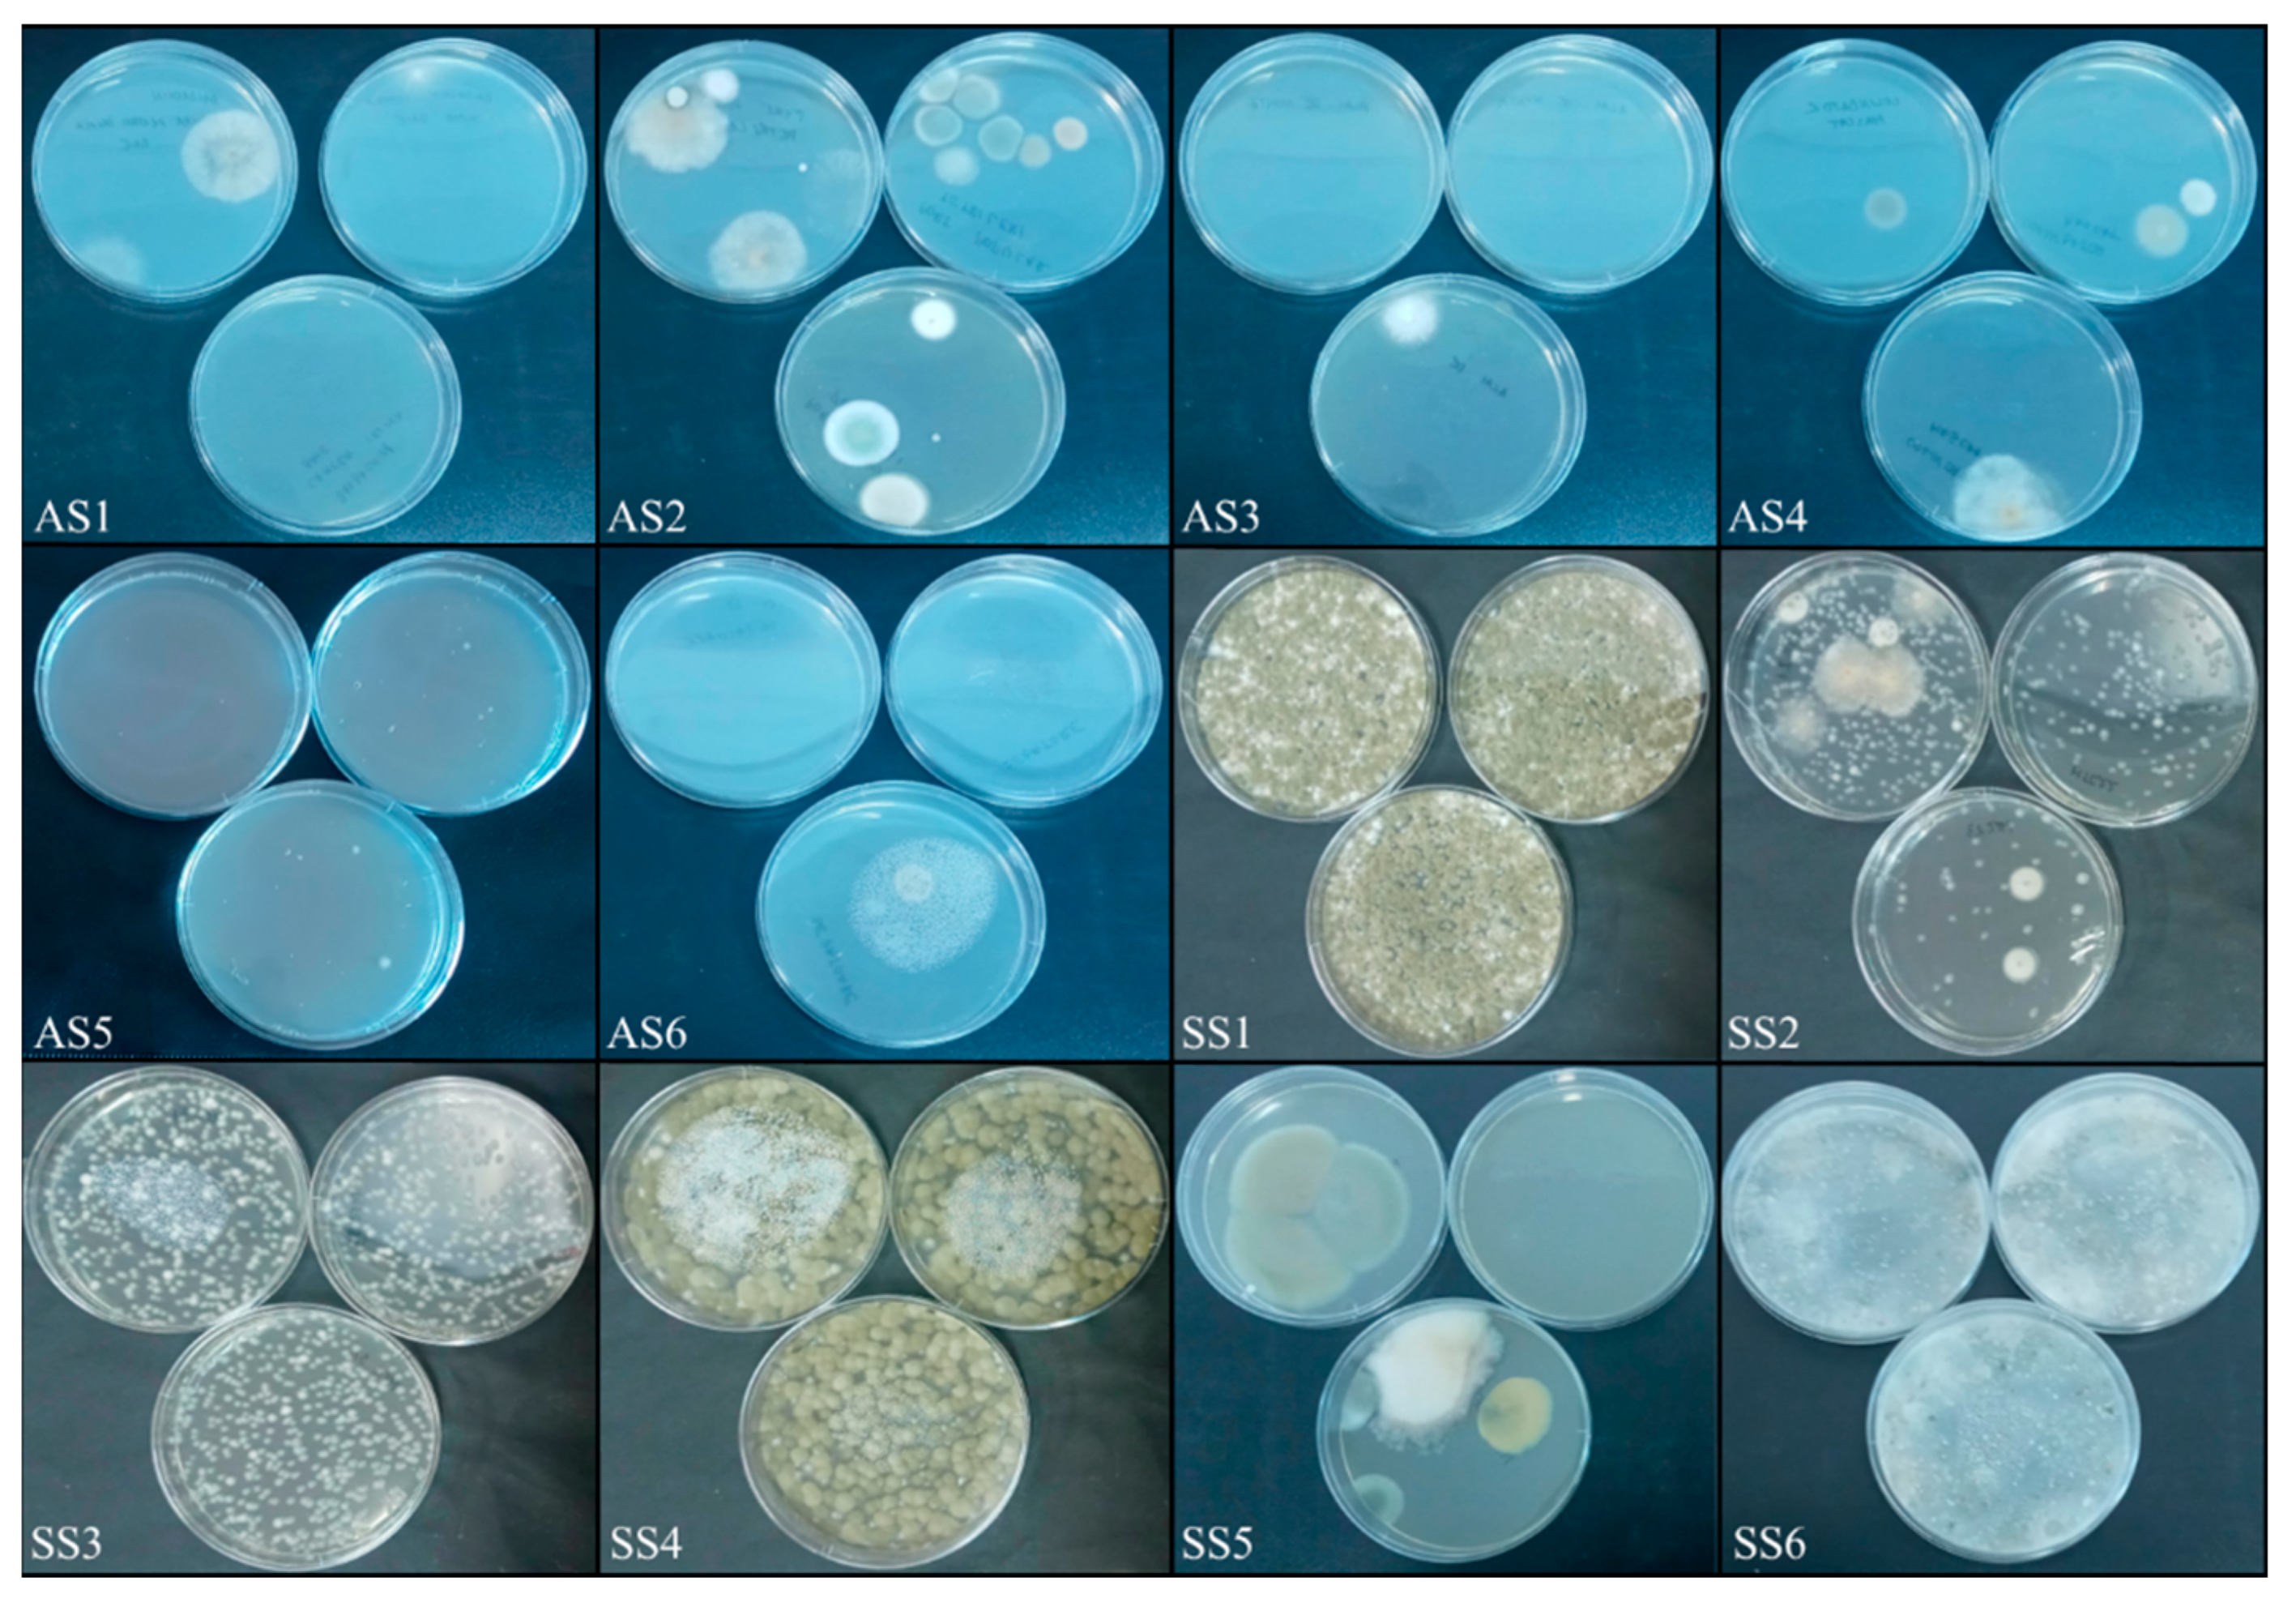
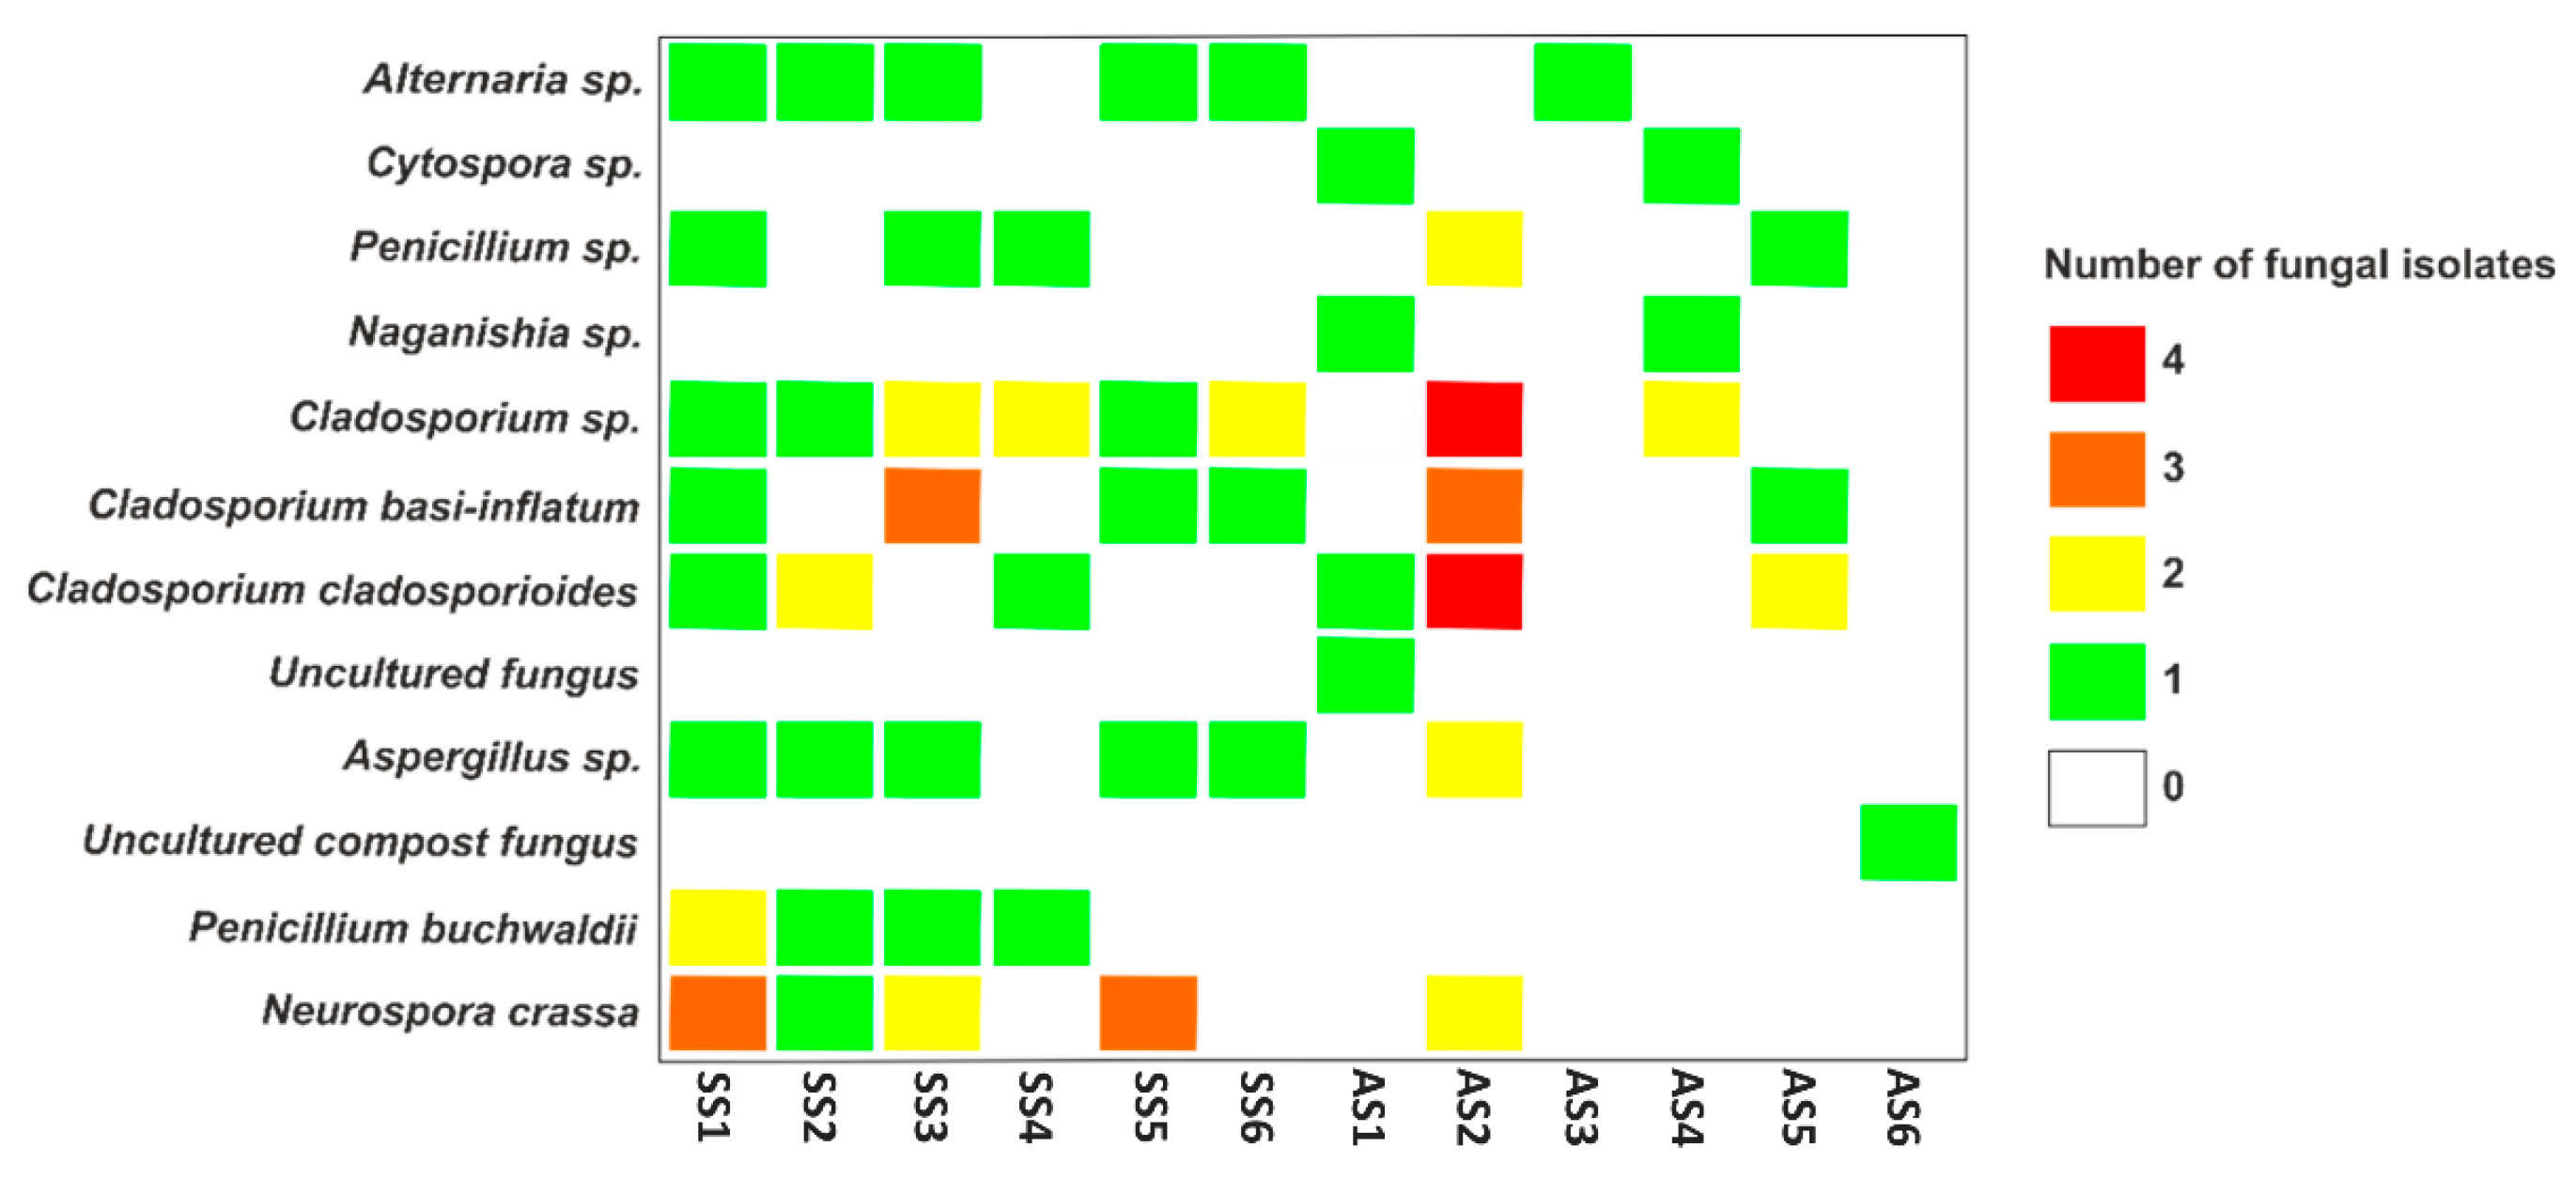
Regarding microbiological contamination, six air samples and six surface samples (two per room) were collected in July 2024, under consistent indoor conditions (
Figure 3). The sampling date was selected during the warm season, when fungal growth potential is generally higher, and all measurements were conducted on the same day to ensure comparability and minimise temporal variability.
The Koch sedimentation method was used to quantify fungal contamination in the air [
41]. The selected sampling points correspond to exhibit locations where only personnel can change the exhibits, or to locations near walking passages where visitors have access. Three Petri plates were set up and left open for half an hour at each sampling point. The Petri plates contained Sabouraud agar medium with 40 g/L glucose, 10 g/L peptone, 15 g/L agar, and 50 µg/mL chloramphenicol, adjusted to pH 5.6 [
42]. The plates used in the Koch method were incubated at 20 °C for 10 days. With Omelianski’s formula, the fungal colony-forming units (CFUs) in the air were estimated:
where
n represents the number of colonies on the plate,
S is the surface area of the Petri dish (∅90 mm), and
k is the air exposure time coefficient:
k = 1 for 5 min,
k = 2 for 10 min,
k = 3 for 15 min, and so on [
43].
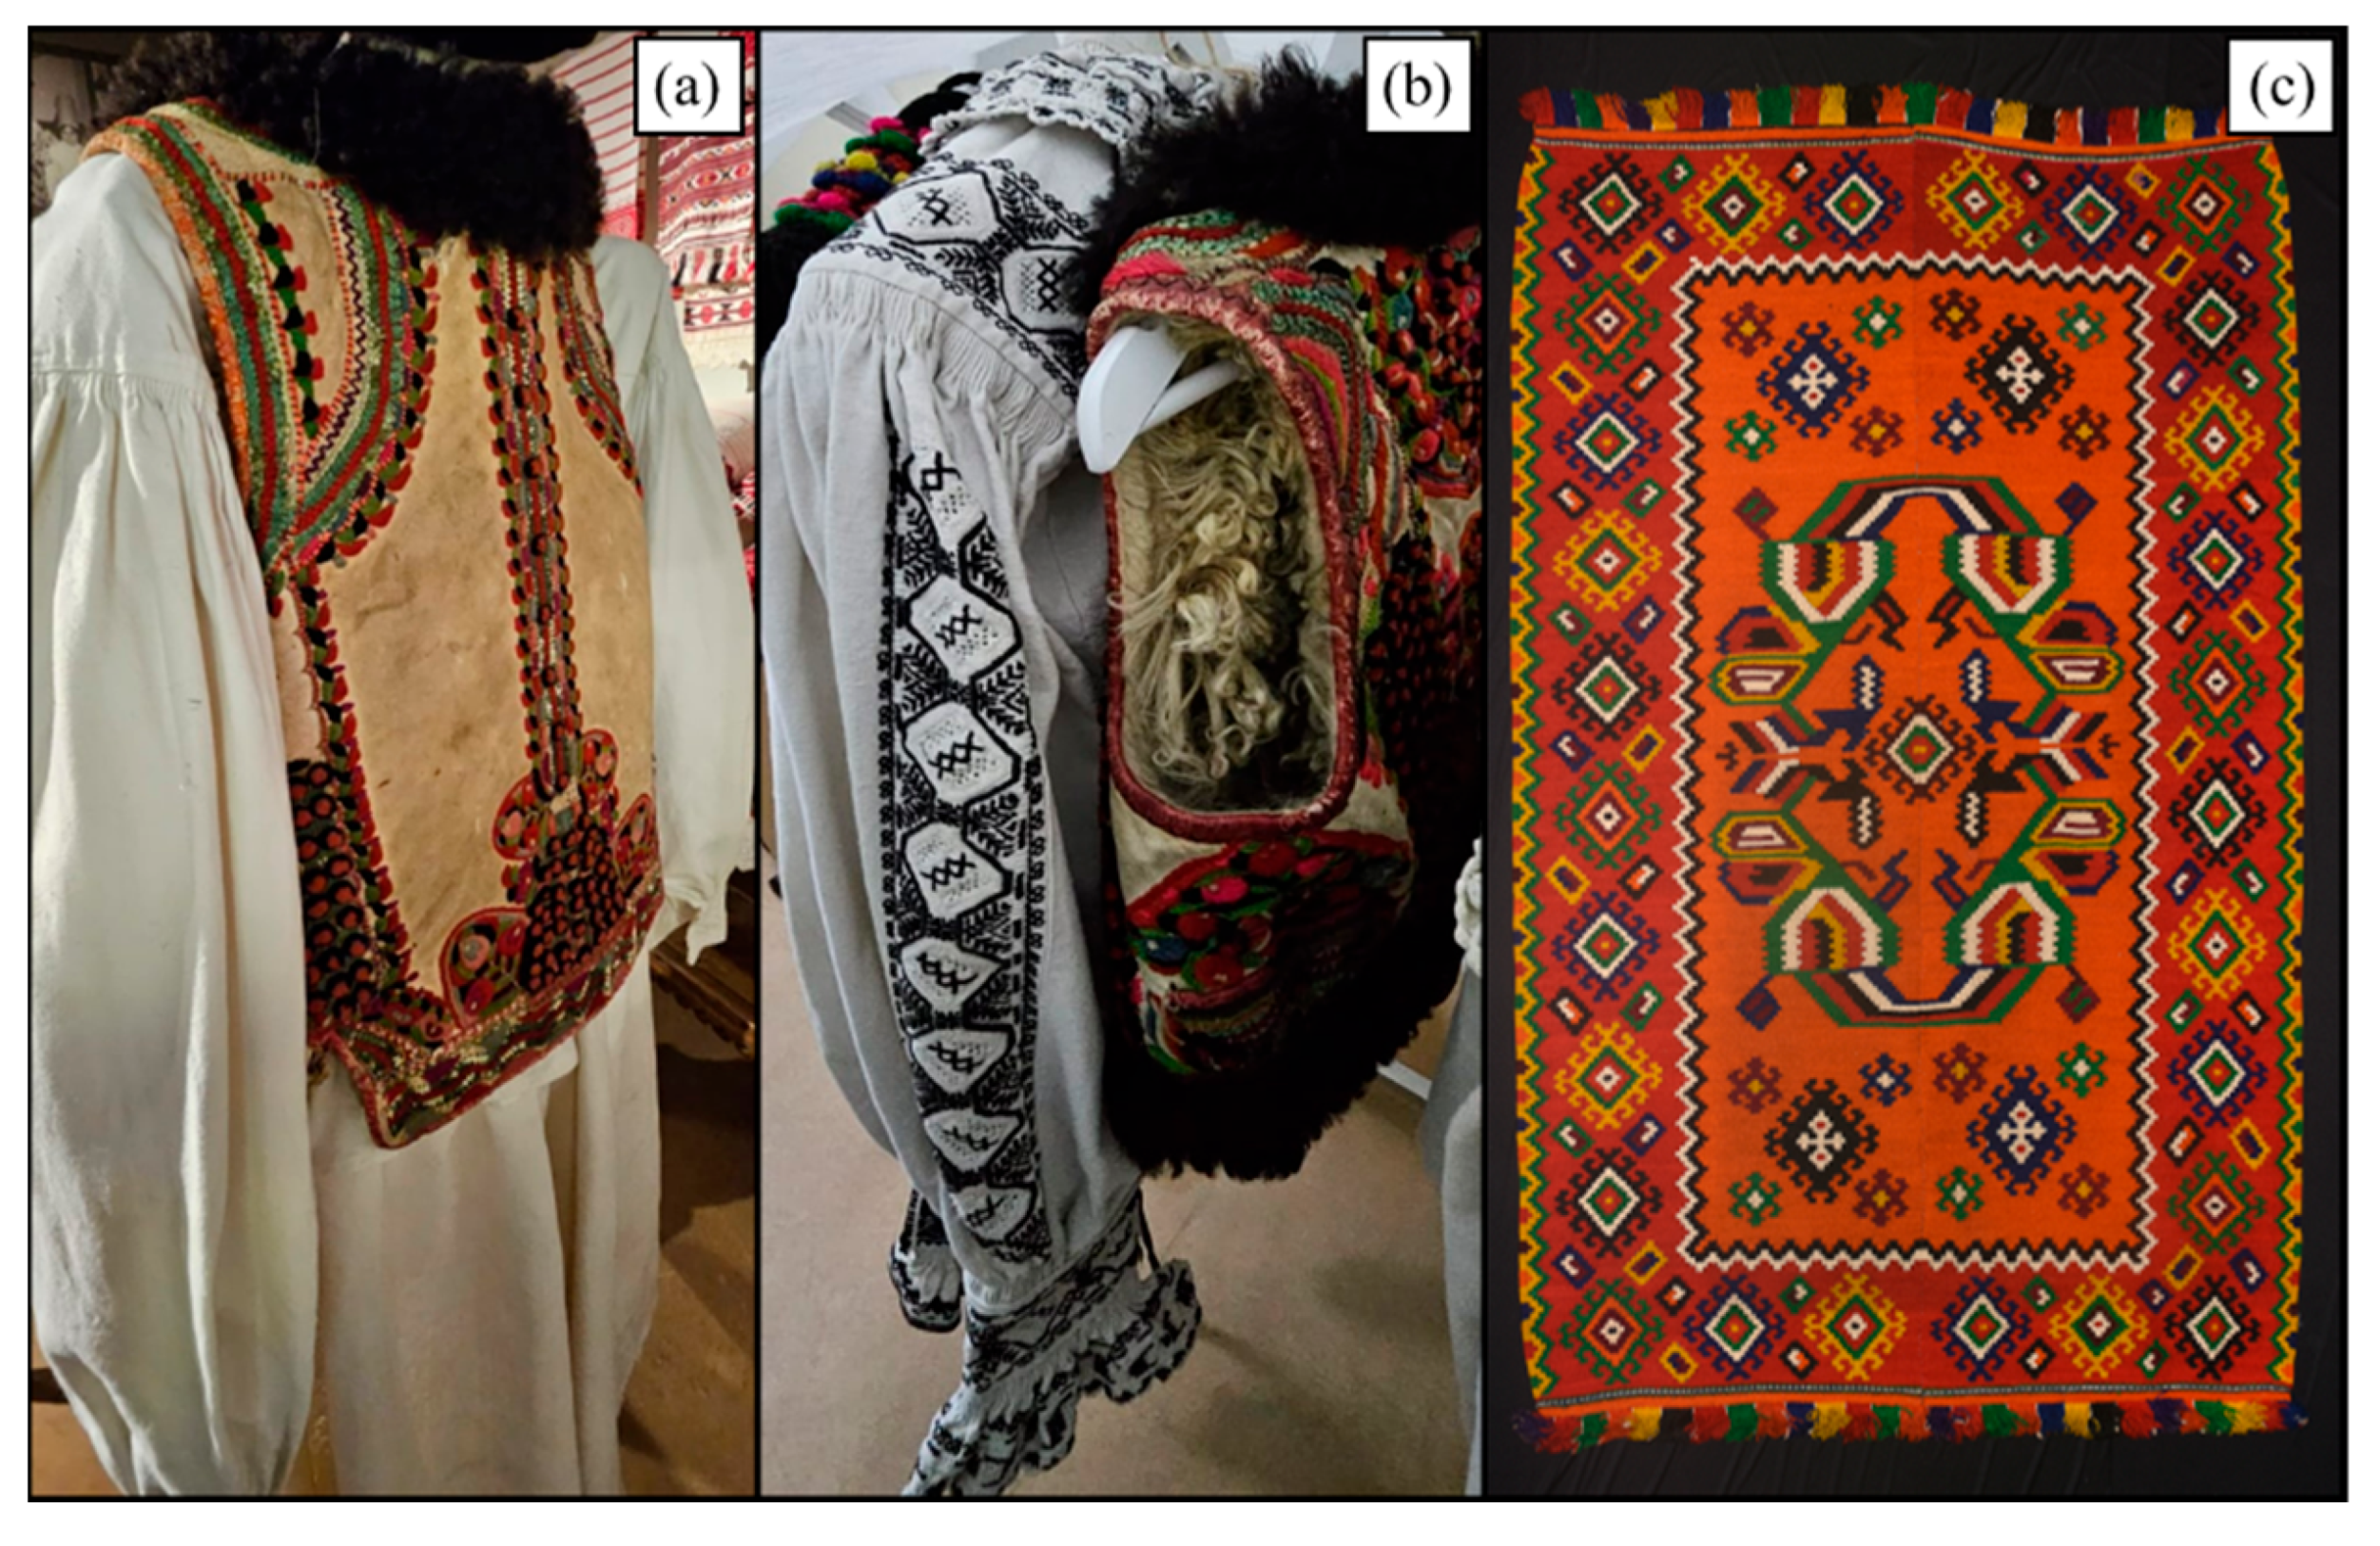
The degree of contamination on the surfaces was assessed using sterile swabs. The swabbed surfaces included the textile materials of the adjacent clothing present on the exposed mannequins (
Figure 4). Swabs were rinsed with 1 mL of saline solution and vigorously vortexed before 150 µL of the resuspended cells was plated on Sabouraud agar. For each of the six swabs, the resuspended cells were plated onto three plates, which were then incubated for 10 days at 20 °C.
Figure 3 and
Table 2 indicate the sampling locations for air and surface samples, their placement within the museum exhibit, the elevation above the ground, and the sampling technique.
After being parafilm-sealed, all samples were transferred and further examined using standardised practices for handling microbiological samples [
44] at the Molecular Biology Centre of the Institute of Interdisciplinary Research on Bio-Nano-Sciences of Babeş-Bolyai University in Cluj-Napoca, Romania. Following the manufacturer’s instructions, DNA was extracted from each independent colony cultured on Sabouraud agar plates for ten days using the Animal and Fungi DNA Preparation Kit
® (Jena Bioscience, Jena, Germany). The polymerase chain reaction (PCR) amplification reactions took place in a total volume of 25 µL, with 1× MyTaq Reaction Buffer (Meridian Bioscience
®, London, UK), 0.5 mM of each primer (Macrogen Inc., Seoul, Republic of Korea), 1.25 U of MyTaq Red DNA Polymerase (Meridian Bioscience
®, London, UK) and 50–100 ng of template DNA. The applied PCR program consisted of an initial denaturation at 95 °C for 5 min, followed by 35 cycles of denaturation at 95 °C for 30 s, hybridisation at 56 °C for 30 s, and elongation at 72 °C for 30 s, with a final elongation step at 72 °C for 5 min. The internal transcribed spacer (ITS) region was used for fungal identification with the primers ITS1 (5′-TCCGTAGGTGAACCTGCGG-3′) and ITS4 (5′-TCCTCCGCTTATTGATATGC-3′). The DNA fragments generated by PCR were purified from agarose gels using the NucleoSpin™ Gel and PCR Clean-up kit (Macherey-Nagel, Ping-Tung, Taiwan), and sequencing was performed by the commercial Sanger sequencing service at Macrogen (MacrogenEurope, Amsterdam, The Netherlands). The DNA sequences were submitted to GenBank under the accession numbers PV916258-PV916276.
2.3. The Determination of the Visitors’ Perceptions
In the study, to complement the information obtained through microclimatic and microbiological monitoring, a standardised questionnaire was administered to museum visitors throughout the monitoring period (
Supplementary Materials). The instrument included 29 items and was designed to capture, in an integrated manner, visitors’ medical conditions, their perception of IAQ, and basic socio-demographic information. The questionnaire comprised a combination of closed-ended questions (including dichotomous yes/no items and multiple-choice formats) and a limited number of open-ended questions, allowing both structured quantitative analysis and the capture of subjective perceptions.
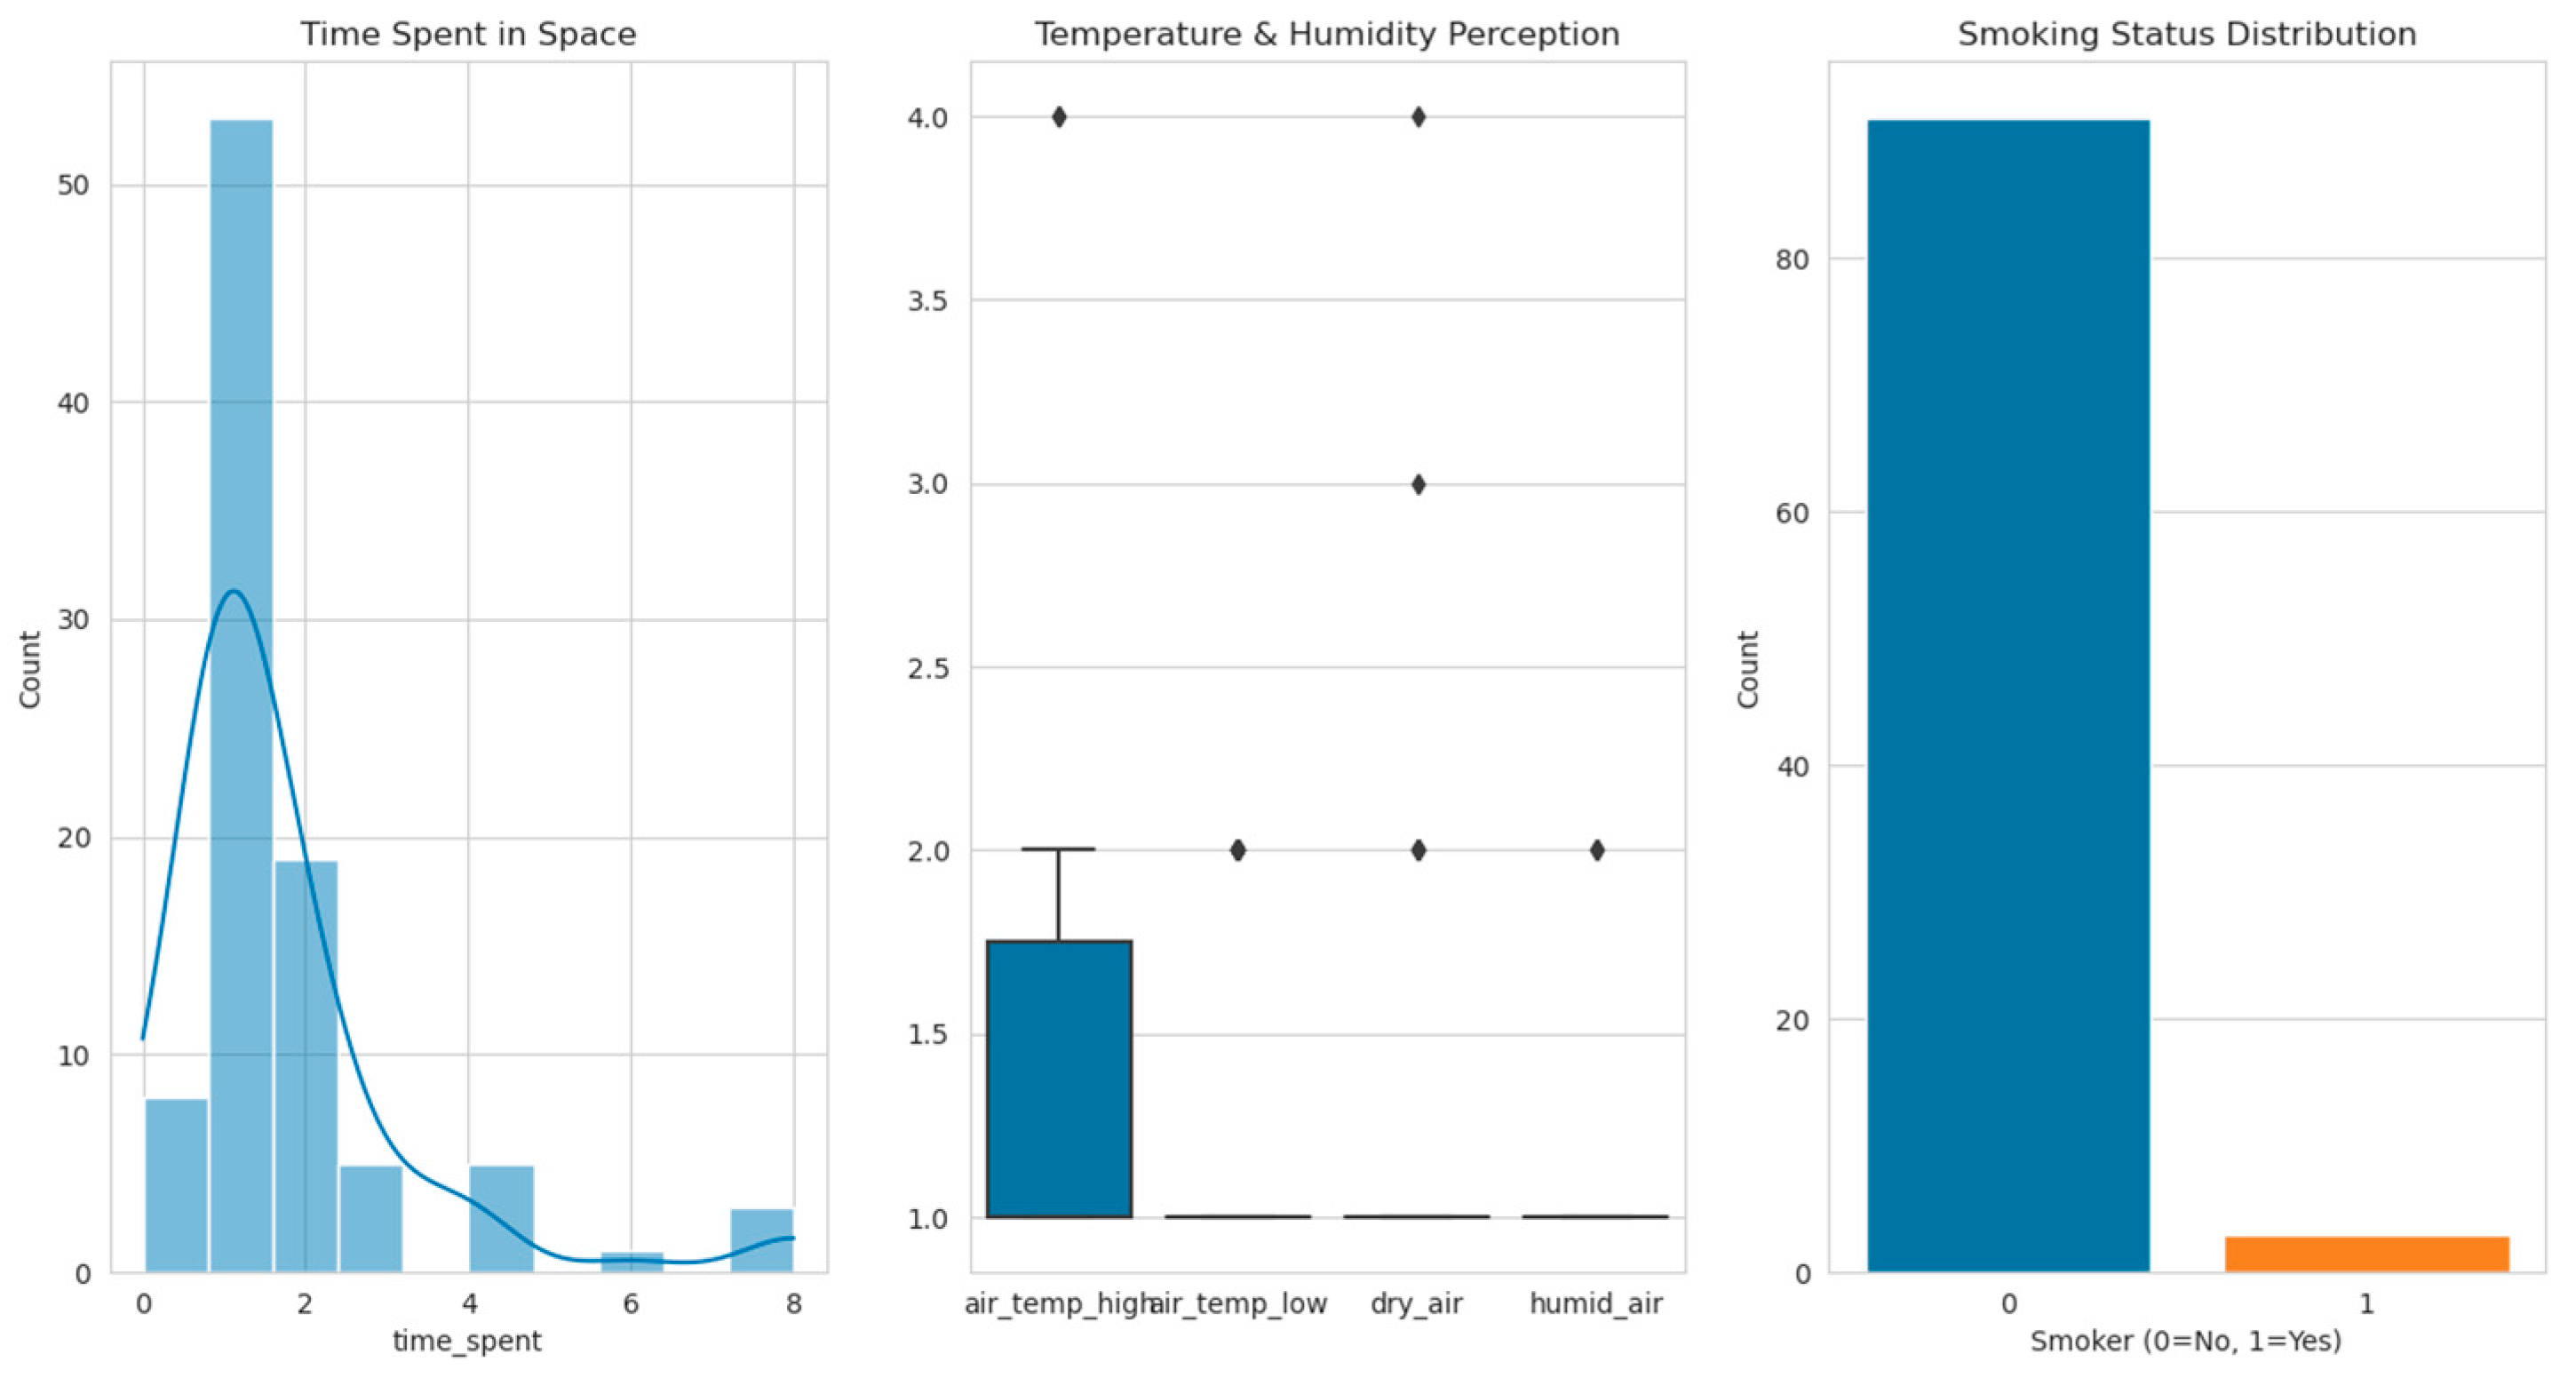
The questionnaire was applied to a sample of 94 visitors throughout the entire monitoring period (January–August 2024). The sample was selected through a convenience sampling methodology, which involved randomly contacting people in the exhibition spaces and asking about their willingness to participate in the research. At the same time, a balanced distribution of respondents by gender and age group was sought to ensure a minimum level of representativeness of the museum’s visiting public. The final sample included 41 male and 53 female respondents, with a mean age of 39.5 years, a median of 38 years, and an age range between 16 and 75 years. No significant seasonal differences were observed in the distribution or completion of the questionnaires across the monitoring period.
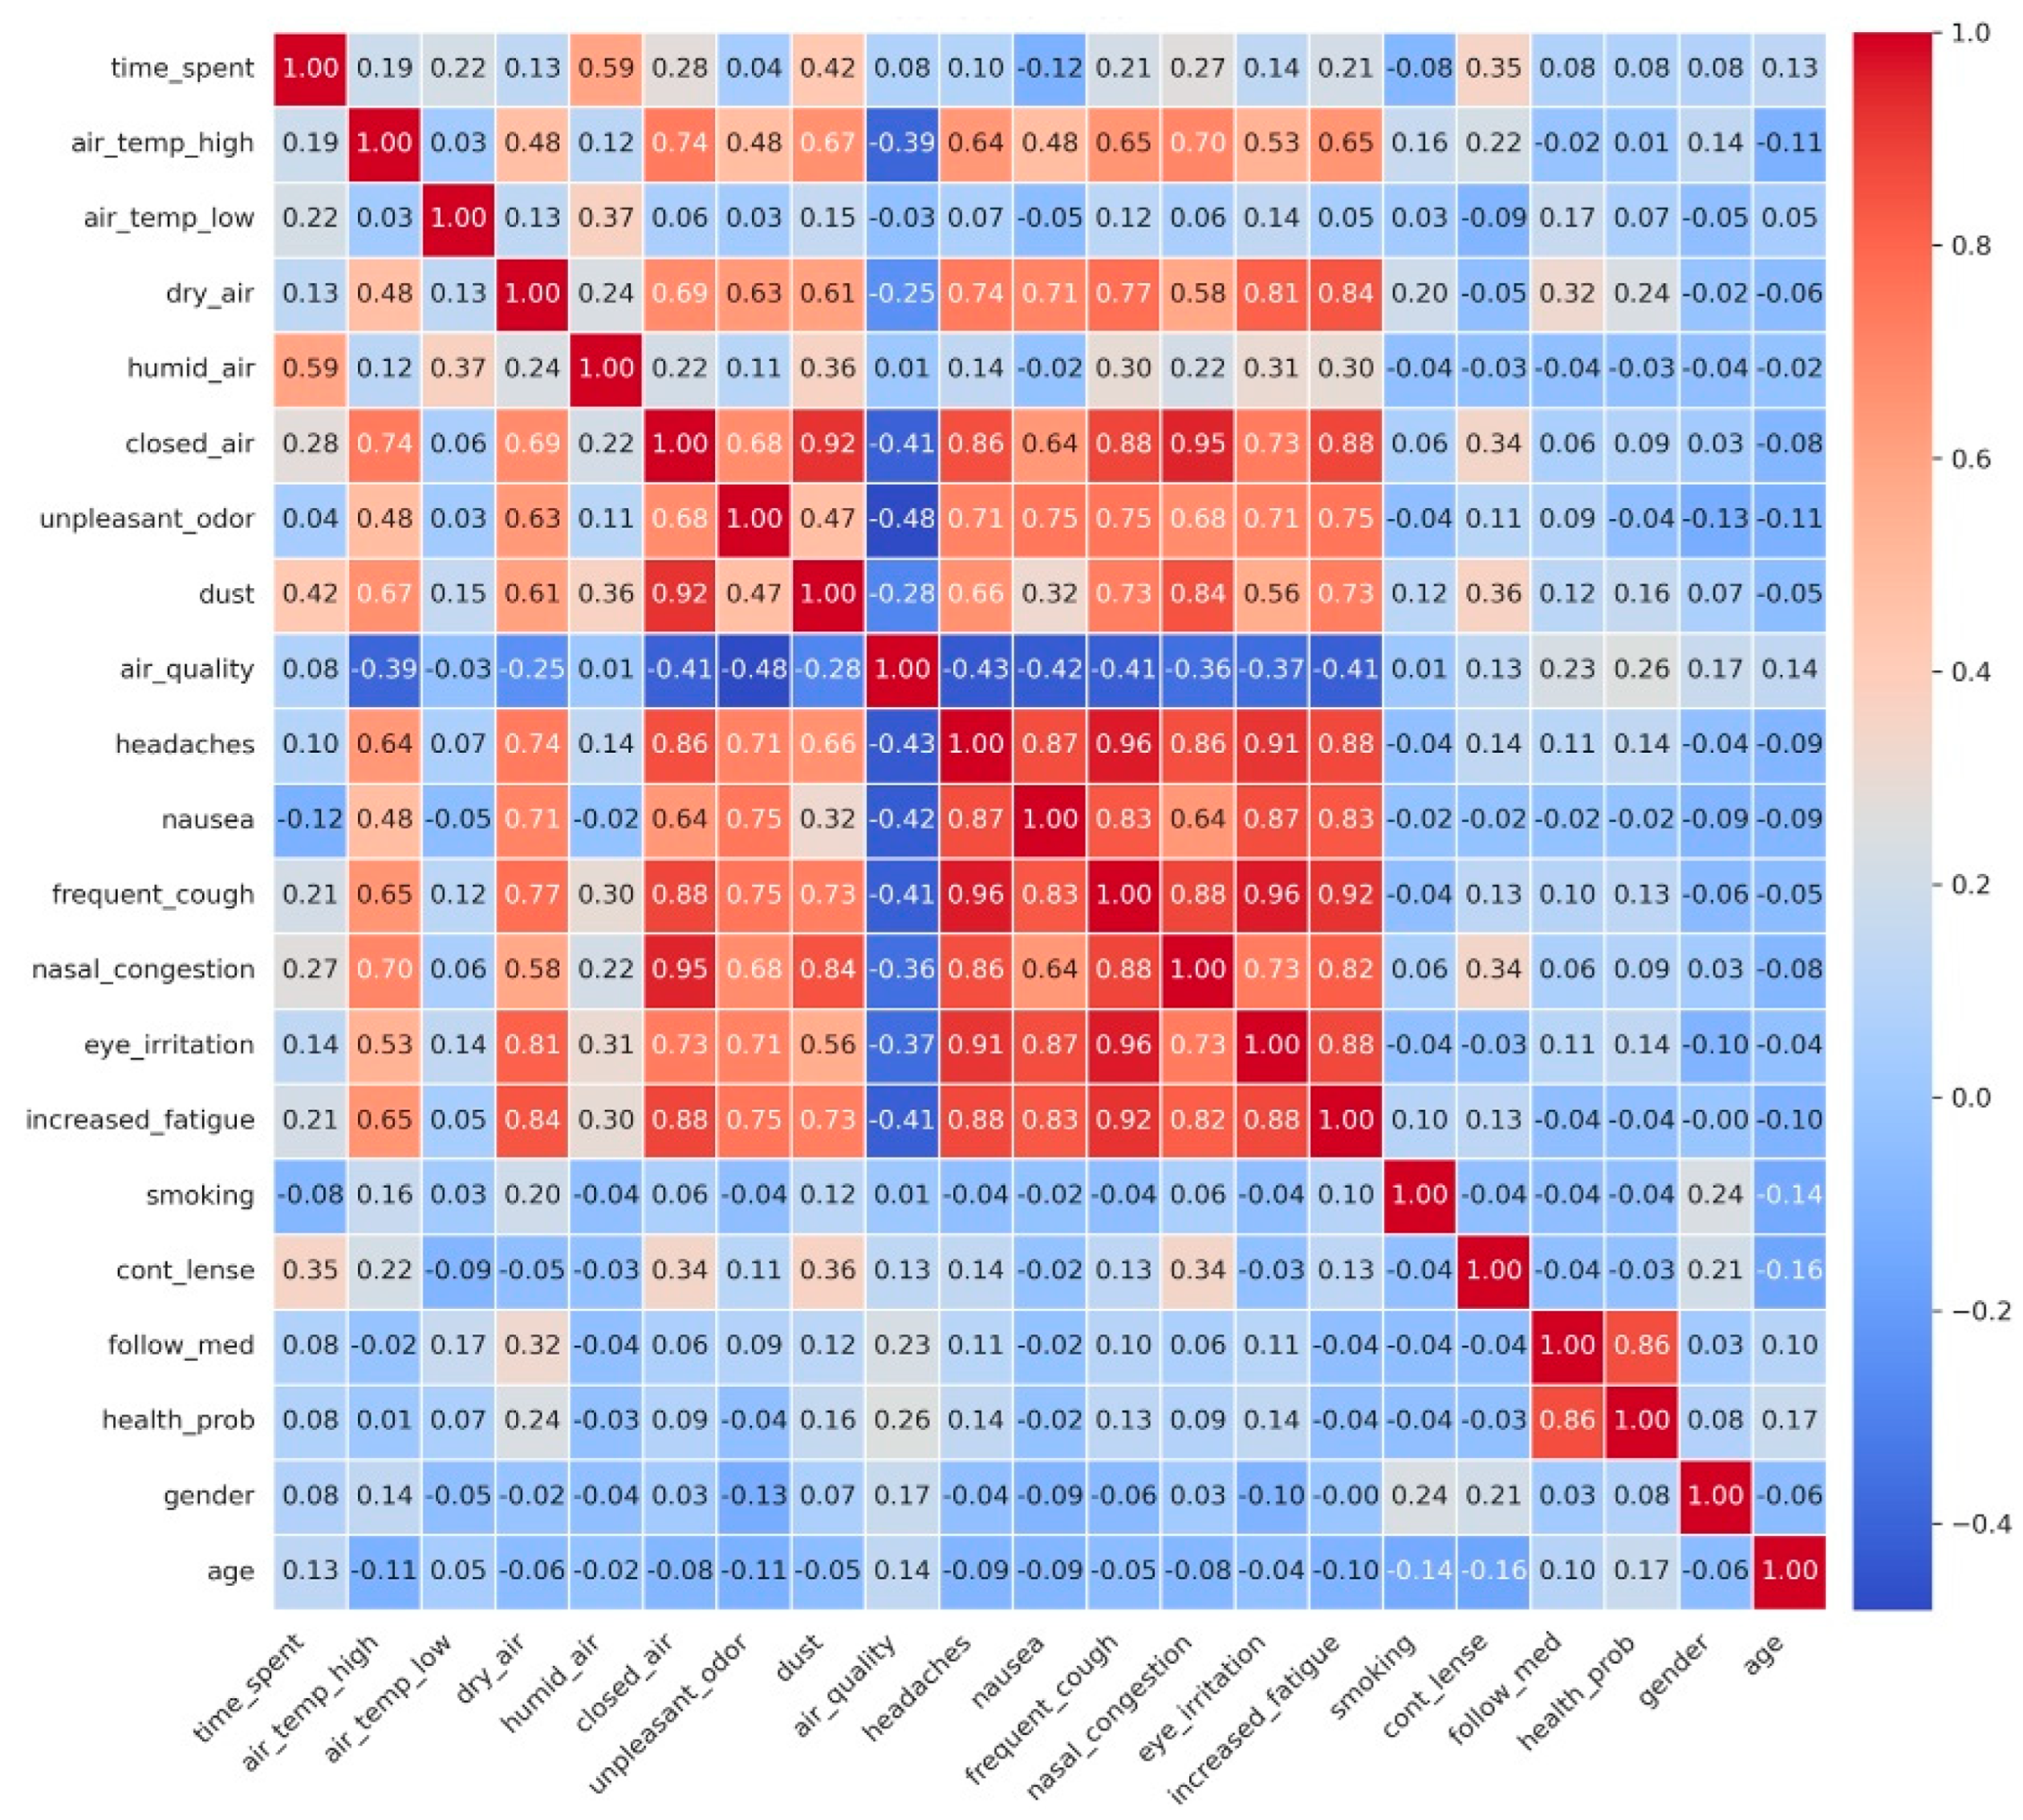
The health-related questions targeted symptoms such as frequent cough, nasal congestion, headaches, nausea, eye irritation, or severe fatigue, as well as aspects of chronic conditions, allergies, medications, smoking, or contact lens use, to identify possible interactions between indoor exposure and individual vulnerability. The component dedicated to the perception of air quality included items regarding the level of comfort felt in relation to microclimatic parameters (high or low T, excessively high or low RH values, unpleasant odours, dust or stagnant air) and the general assessment of IAQ, allowing the correlation of objective monitoring data with the subjective perceptions of visitors. The final section focused on personal and demographic information (gender, age) necessary for comparative analyses and statistical interpretations. The dependent variable was the time spent in the museum, while the independent variables included both medical factors and perceptions of the indoor microclimate.
During the study, a series of statistical methods were applied to test the formulated hypothesis, but the most appropriate was ordinary multiple regression. This statistical approach is based on a theoretical model of multiple linear regression, which allows quantification of the relationships between a dependent variable (
Y) and a set of independent variables (
X1,
X2, …,
X20), each with its own weight, represented by the coefficient
βi. The model used can be formalized as follows:
where
—dependent variable,
—corresponding variables and their coefficients, and
u—Model’s residual.
The applicability of this model in the present work lies in its ability to simultaneously analyse the influence of several IAQ factors on a synthesis indicator. Through this approach, it is possible to evaluate not only the individual impact of each parameter, but also their cumulative effects and potential interactions, thus providing a much more complex and rigorous perspective on the determinants and visitors’ perceptions.
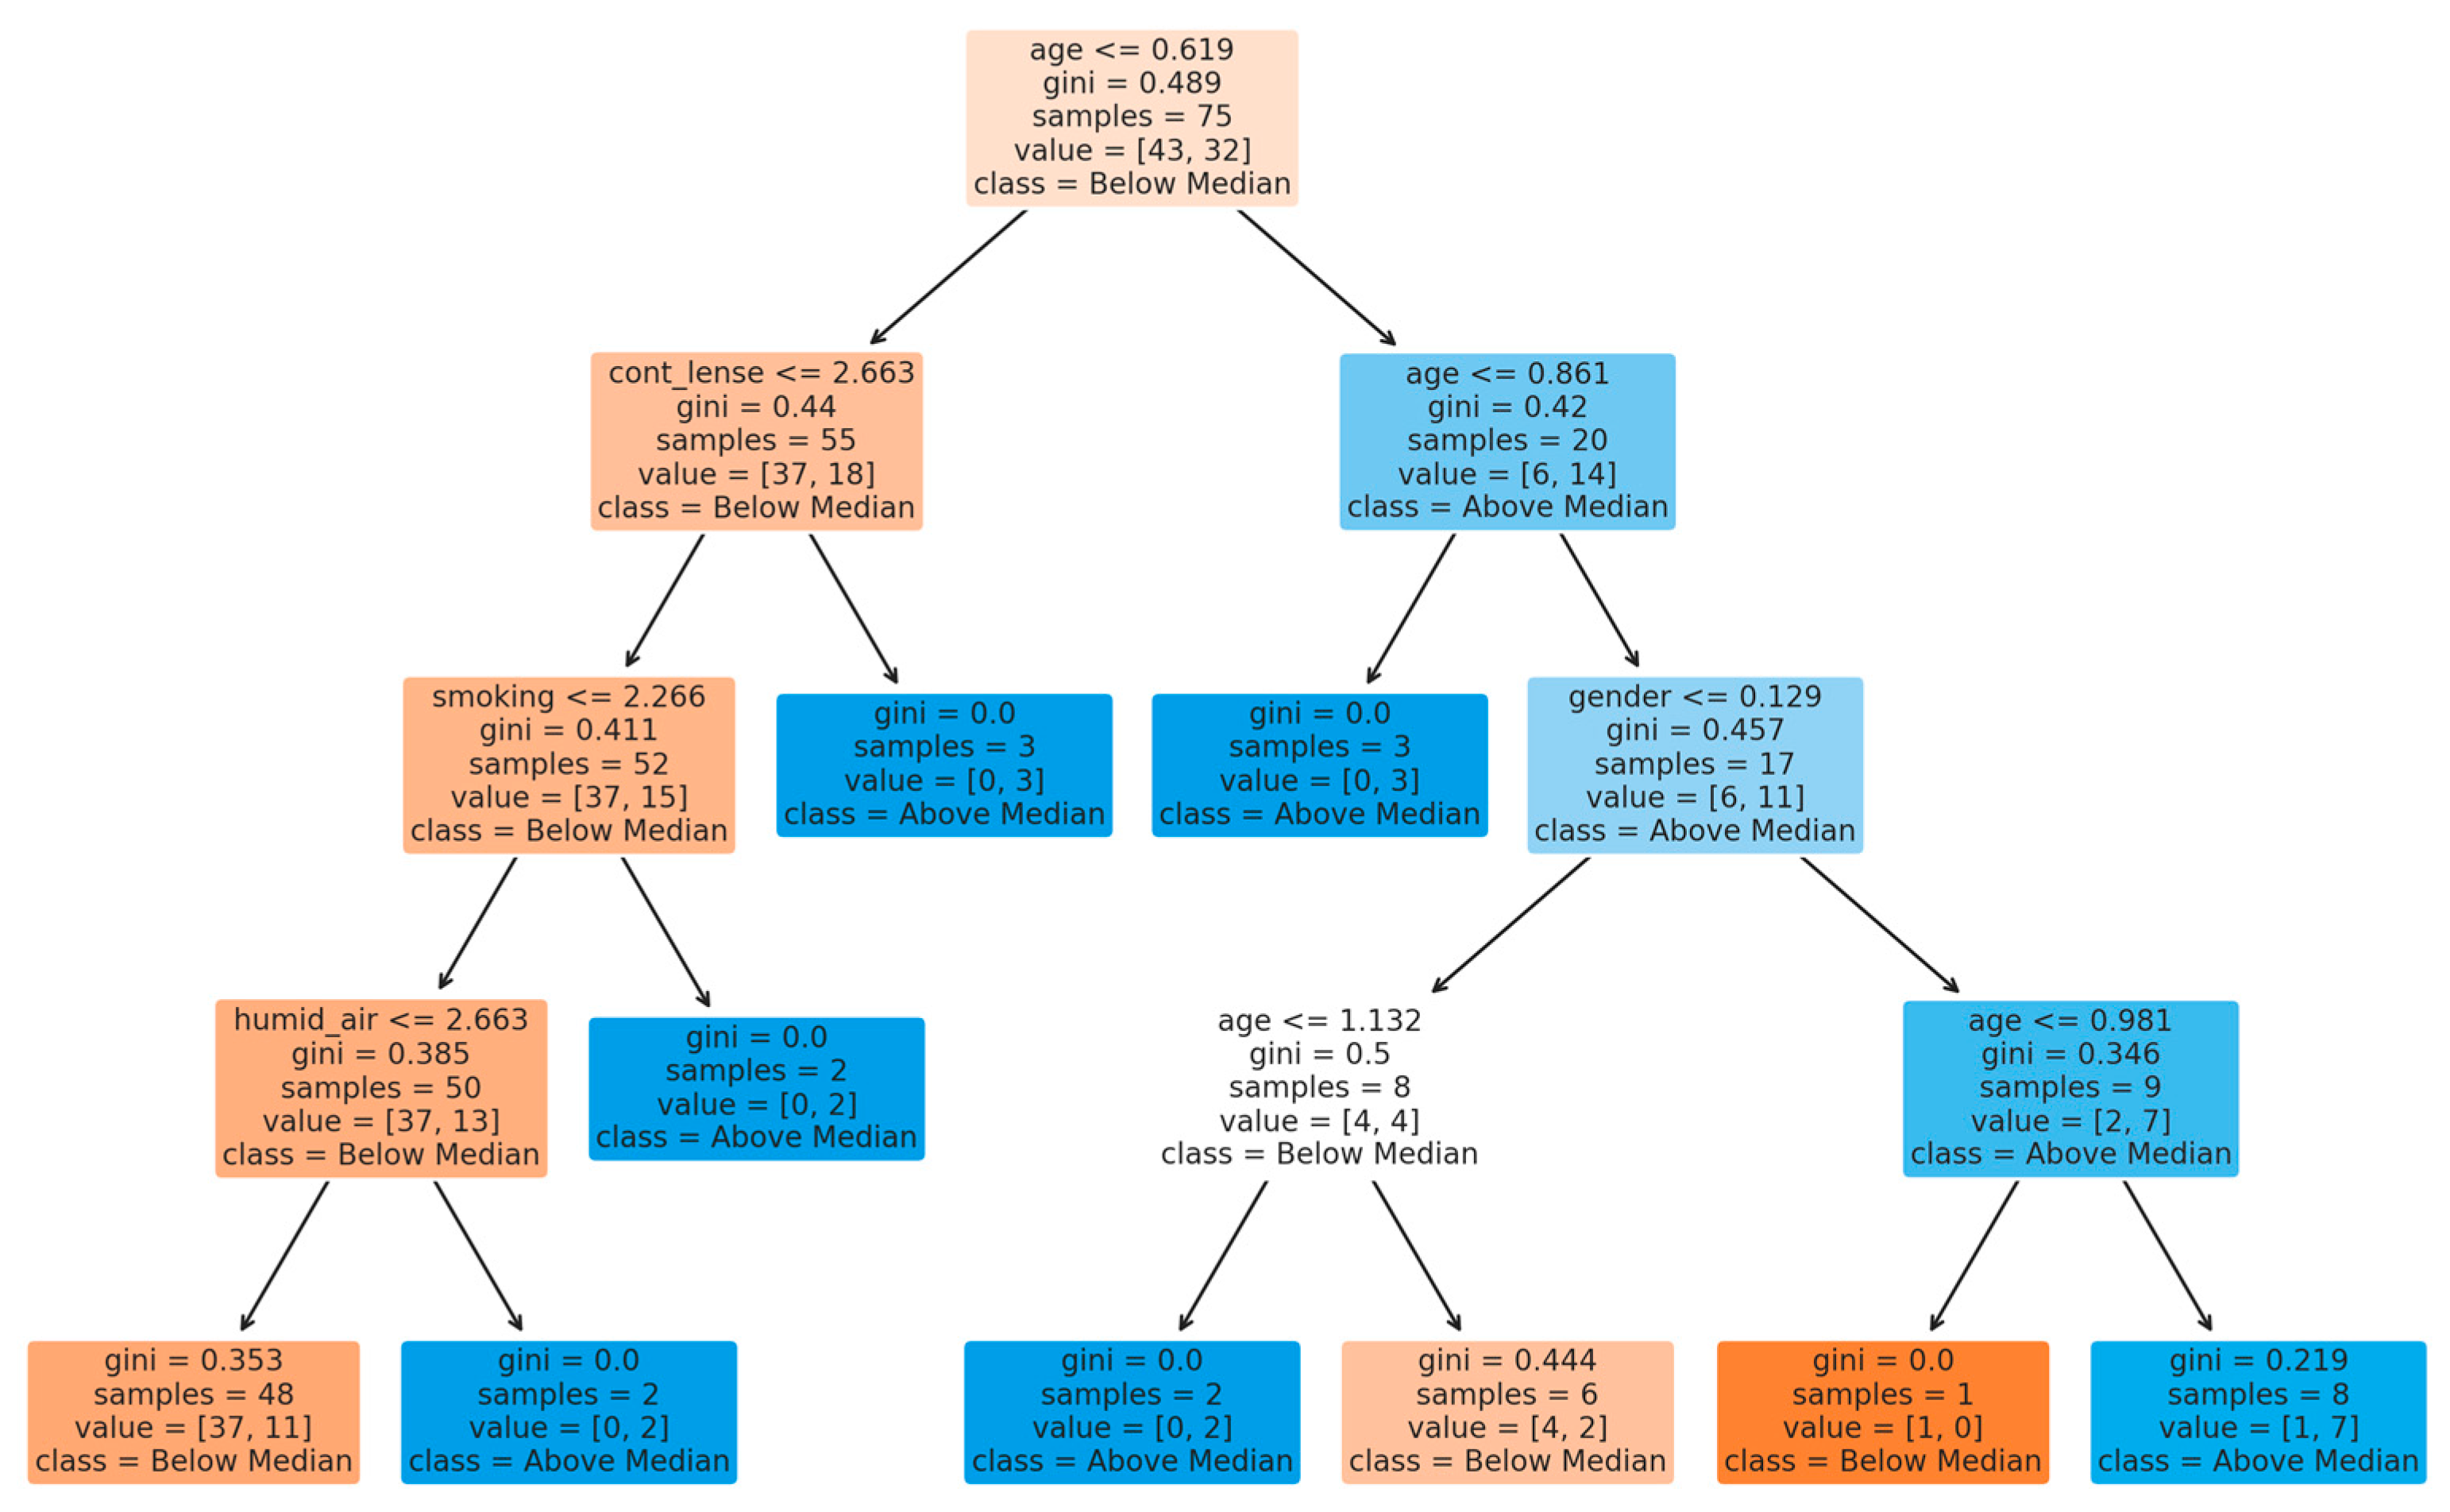
To predict the time spent in the museum, we also used Decision Tree modelling. In particular, we classified the dependent variable (time spent in the museum) into two classes: class 0—less than 4 h; 1—more than 4 h. The Gini index, based on impurity, was employed to classify nodes. Gini impurity quantifies the likelihood that a randomly selected element from a set would be misclassified if assigned a label according to the set’s label distribution. It achieves its lowest value (zero) when all instances within a node belong to the same target category. The Gini index is expressed as follows [
45]:
where
pi is the proportion of class
i in the node and
n is the number of nodes.
To formulate the accuracy, precision, and recall used in the reporting of decision trees, first of all, it is crucial to identify the following:
True Positives (TP) → Correctly predicted positive cases.
True Negatives (TN) → Correctly predicted negative cases.
False Positives (FP) → Incorrectly predicted positive cases (Type I error).
False Negatives (FN) → Incorrectly predicted negative cases (Type II error).
Accuracy measures the overall correctness of the model and can be formulated as follows:
Precision is used to measure how many predicted positives are correct and is formulated as follows:
Recall measures how well the model finds all actual positives. Its formula is as follows:
By using the model’s performance indicators, we aim to assess how accurately and completely the questionnaire responses explain and predict the time visitors spend in the museum. This gives us an objective picture of how perceptions of air quality and individual factors influence their behaviour. In this way, we can identify the questionnaire variables that have the strongest impact on visit duration, as well as the microclimate aspects perceived as limiting the visitor experience.





 ,
,