1. Introduction
The preservation of the outstanding cultural value of archaeological sites is a concern from a multi-risk perspective, encompassing both natural and anthropogenic hazards. For this reason, the collaboration and integration of professional skills from many disciplines and scientific knowledge are recognised as essential requirements [
1,
2], and are also recommended by the International Principles Applicable to Archaeological Excavations [
3] and the Charter for the Protection and Management of the Archaeological Heritage [
4] (ICOMOS 1990). In particular, when archaeological structures are involved, assessing and reducing their vulnerability to seismic risk is one of the most demanding challenges, since they are significantly prone to out-of-plane (OOP) failure modes under horizontal actions due to the frequent lack of horizontal diaphragms and weak transverse connections. On the other hand, the criteria for their protection, outlined by the Venice Charter on the Conservation and Restoration of Monuments and Sites [
5], are based on the respect for the authenticity and original materials of the structures, requiring the development of specific approaches for both assessing their vulnerability and designing strengthening interventions [
6]. To date, the definition of a proper analytical approach for investigating the seismic behaviour of archaeological remains is still a matter of ongoing research [
7,
8,
9,
10].
In this context, the PRIN project 2022 MiRA, funded by the EU PNNR and involving most of the authors of this paper, aims to outline a multi-scale methodological approach to assess the vulnerability of archaeological sites and structures to OOP mechanisms. The research is specifically focused on archaeological remains, mainly masonry walls in the Pompeii Archaeological Park (PAP), which is directly involved in the project.
At the site scale, a statistical approach based on typological mechanical-based fragility curves is under development [
11]. At the scale of the single structure, instead, this study proposes a methodological framework—illustrated through applications to selected masonry walls in the PAP—aimed at identifying the expected OOP failure mechanism and evaluating the related acceleration capacity.
The analytical approach is based on a preliminary investigation aimed at classifying the wall typology according to the proposed morphological criteria and identifying the quality of wall connections (
Section 2). This latter issue is crucial for defining the expected OPP failure mode and adopting the most appropriate model to assess the horizontal capacity of the walls.
The proposed analytical approach is presented in
Section 3 and applied to selected archaeological walls in
Section 4. The methodology can be employed both when the mechanism has already been triggered and when it needs to be identified by comparing different potential configurations of the portions involved and their corresponding capacities.
By comparing the acceleration capacity with the expected seismic demand for the limit states critical to the preservation of archaeological assets, the approach also provides a basis for prioritising intervention strategies. This is particularly useful in the case of very extensive archaeological areas, such as the PAP.
2. Two-Level Classification of Archaeological Walls
This section presents a classification of the most recurring masonry wall connections as a preliminary step of a methodology aimed at assessing their vulnerability to OOP failure mechanisms.
The proposed classification is organised into two levels, reflecting progressive stages of knowledge. The first level focuses on the morphology of the connections and relies on simple geometrical data obtained from on-site surveys or from maps. The second level evaluates the effectiveness of the wall connections, requiring a deeper understanding of construction techniques and mechanical properties that influence connection behaviour, such as interlocking effects, cohesion at the masonry block–mortar interface, and the tensile strength of the masonry.
The primary assumption underlying this analysis is that the walls exhibit sufficiently monolithic behaviour—consistent with the construction observed in the walls of Pompeii—thereby preventing disaggregation and crumbling of the masonry under seismic loading.
2.1. First Level of Classification: Wall Connection Morphology
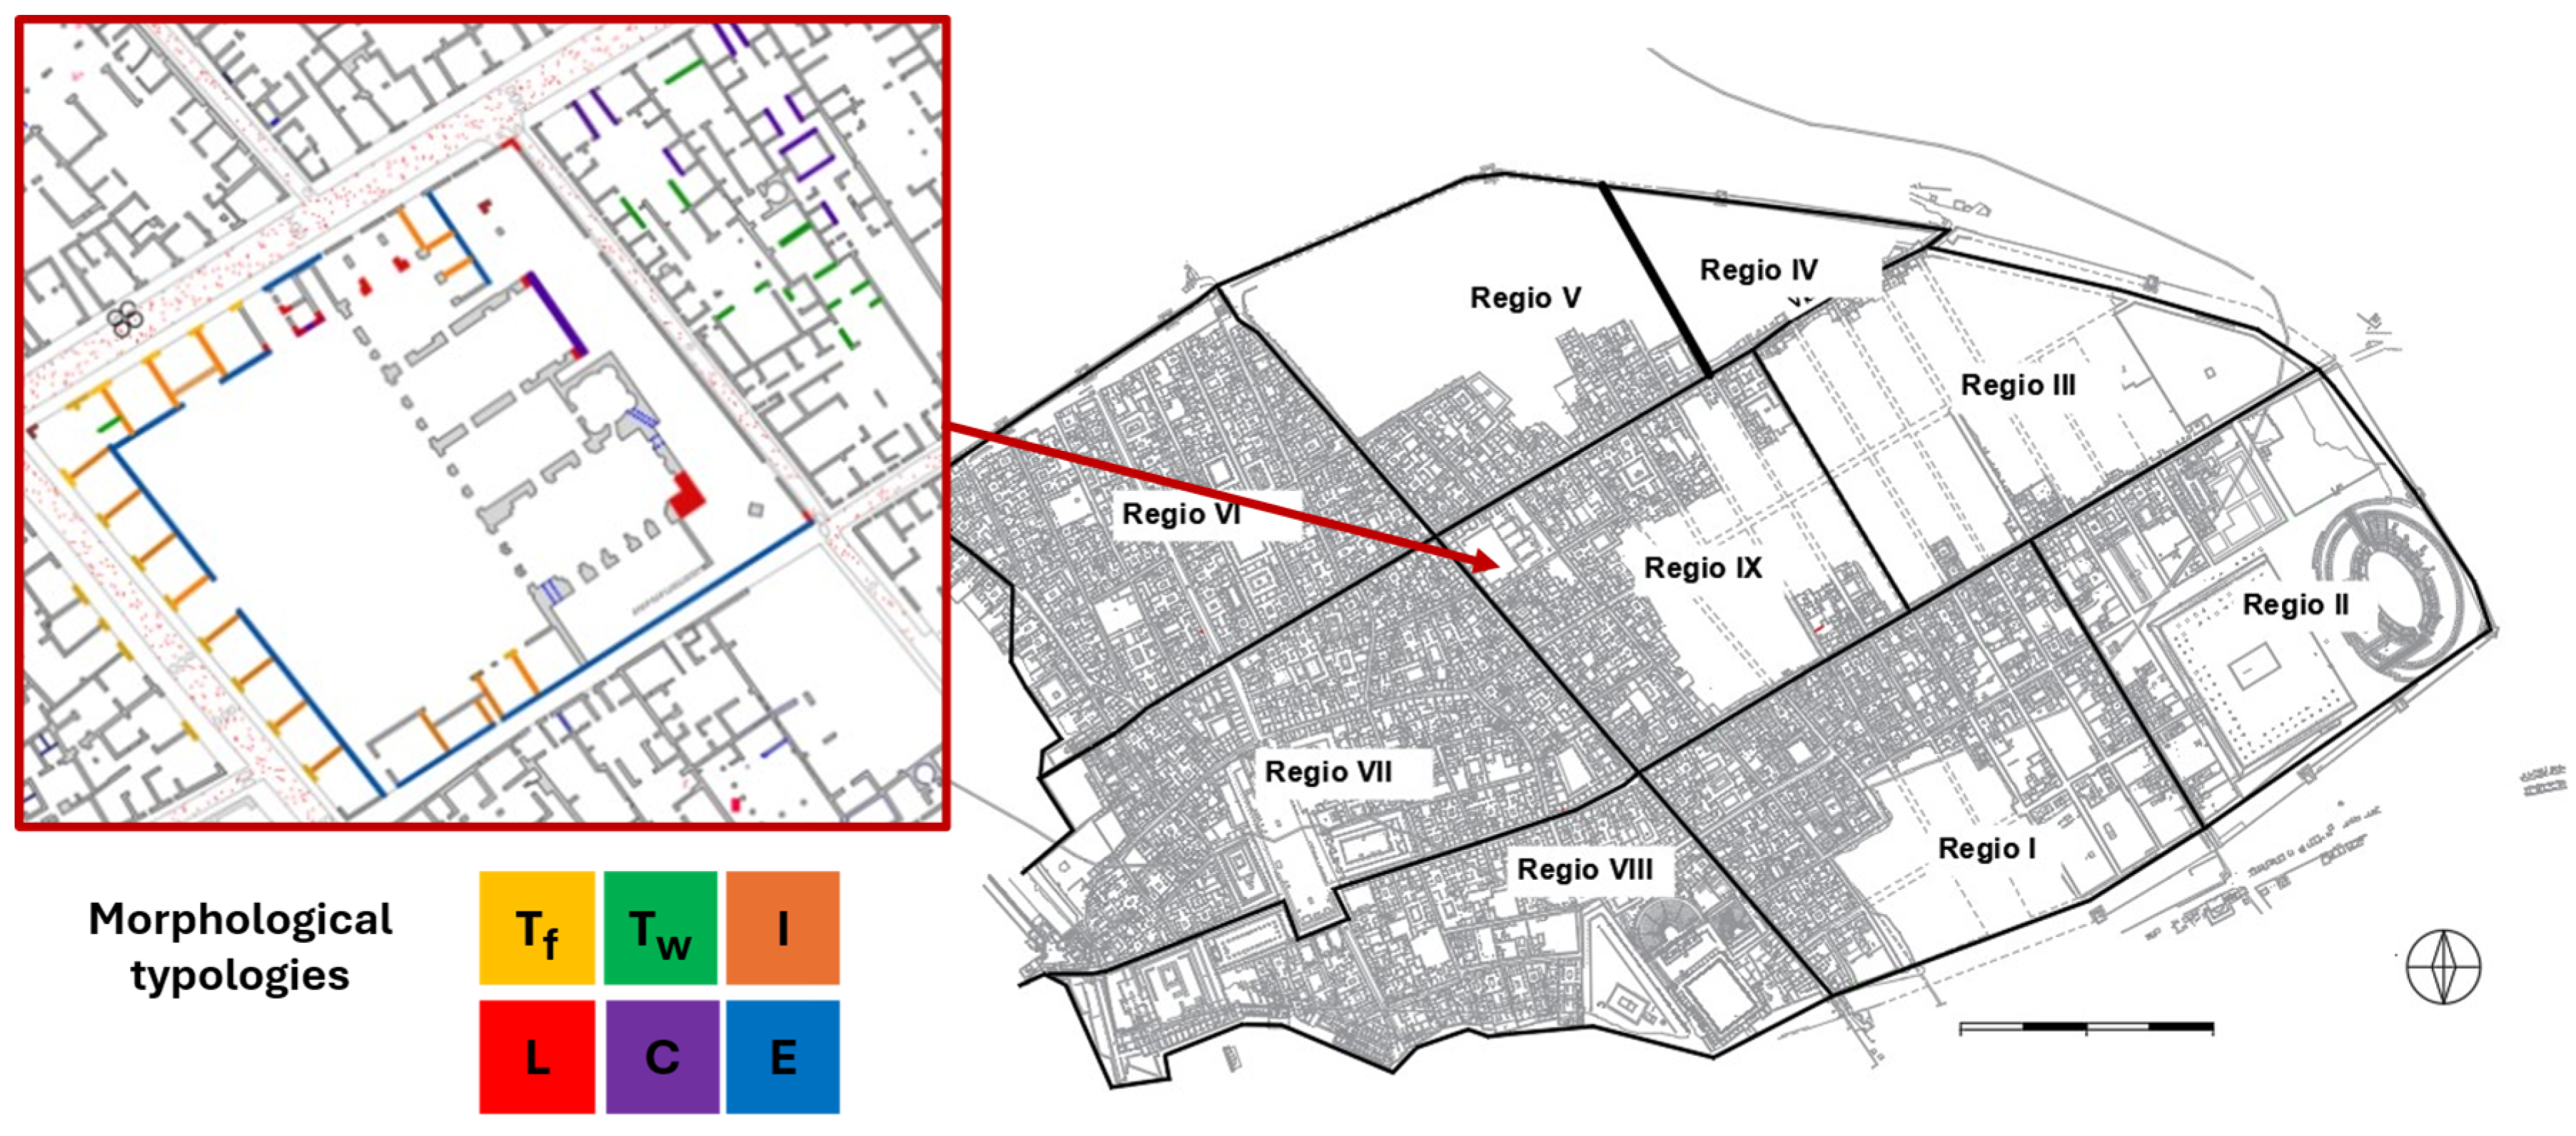
The morphological classification of the most recurring typologies of wall connections in the PAP is presented in
Table 1 and illustrated in
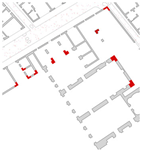
Figure 1 for a representative portion of Regio IX, evidenced in the frame on the left, as an example. In this table, the sketches depict the front wall of each typology with different colours to highlight the elements that can exhibit OOP failure mechanisms under actions applied orthogonally to their mid-plane; in contrast, the grey elements represent the transverse walls, which can provide a more or less effective restraining action for the OOP mechanisms, depending on the quality of the connections. The typologies are labelled by capital letters indicating the morphological features of the connections. Note that ‘Tf-shaped’ and ‘Tw-shaped’ walls fall under the broader typology of ‘T-shaped’ walls, with the front wall represented by the flange and the web, respectively. Both types are connected to a single orthogonal wall, whereas I-, L-, and C-shaped walls are connected to two walls, and E-shaped walls are connected to three or more. Specifically, for C-shaped walls, the two orthogonal walls only extend along one side of the front wall, leaving the corners free; instead, for I-shaped walls, the orthogonal walls extend on both sides of the front wall, providing lateral confinement that also depends on their length. Additionally, for L-shaped walls, the two orthogonal walls are intended to be monolithically connected at the corner, so that the latter (highlighted in red colour in
Table 1) behaves as a single macro-block. For the sake of brevity, the X-shaped wall will hereafter be referred to as the X typology.
Among these typologies, single walls are clearly the most vulnerable to simple rocking mechanisms; in contrast, for the other typologies, identifying the expected OOP failure mechanism is less straightforward and requires detailed information on the quality of the wall connections. It is also crucial to employ proper modelling approaches to analyse different kinds of mechanisms, such as simple or compound rocking, rocking-sliding, or horizontal flexure mechanisms, whose activation depends on the typology and quality of the connections.
2.2. Second Level of Classification: Wall Connections Effectiveness
As above-mentioned, the second level of classification focuses on assessing the effectiveness of wall connections, a crucial issue in identifying the expected OOP failure mechanism for the typology under consideration and adopting the most appropriate analytical model. This requires investigating the construction techniques through on-site surveys and literature studies. In addition to these qualitative observations, an estimate of the mechanical properties of the masonry is necessary.
In a previous study [
11], the authors identified three variants in the quality of the connections for the Tf typology, which can be readily extended to the other typologies, as they pertain to any configuration of orthogonal walls. These variants are classified as ‘poor’ (p), ‘intermediate’ (i), and ‘good’ (g) connections.
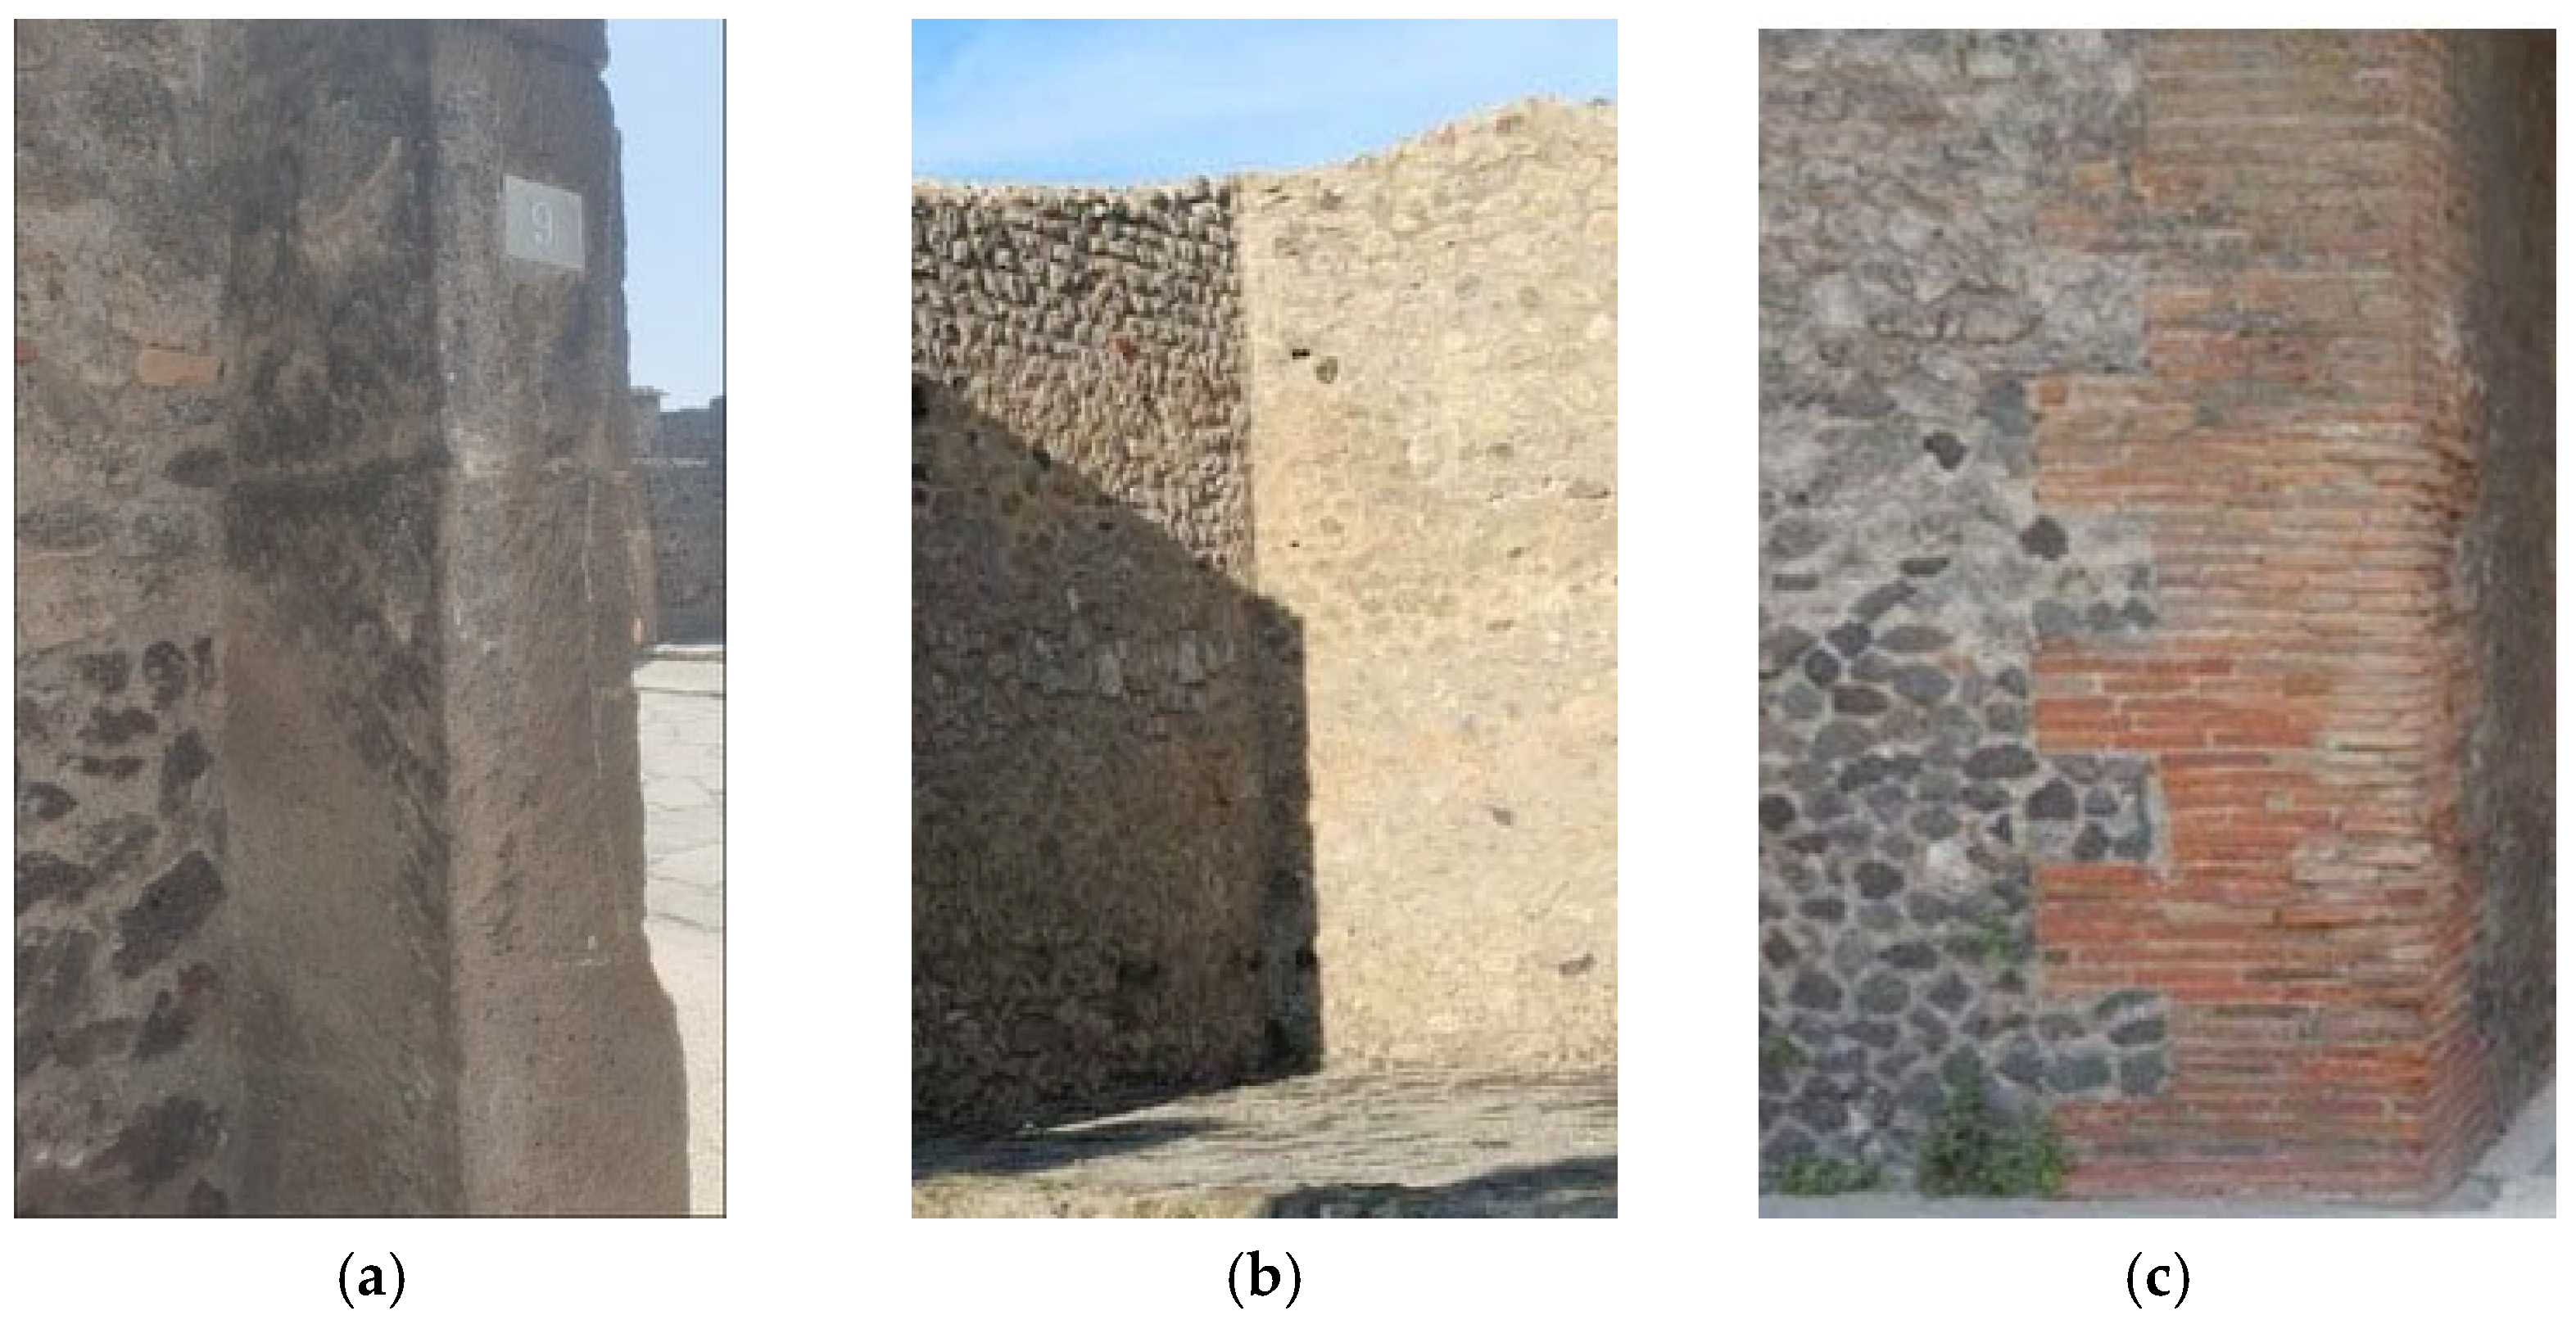
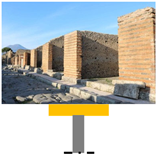
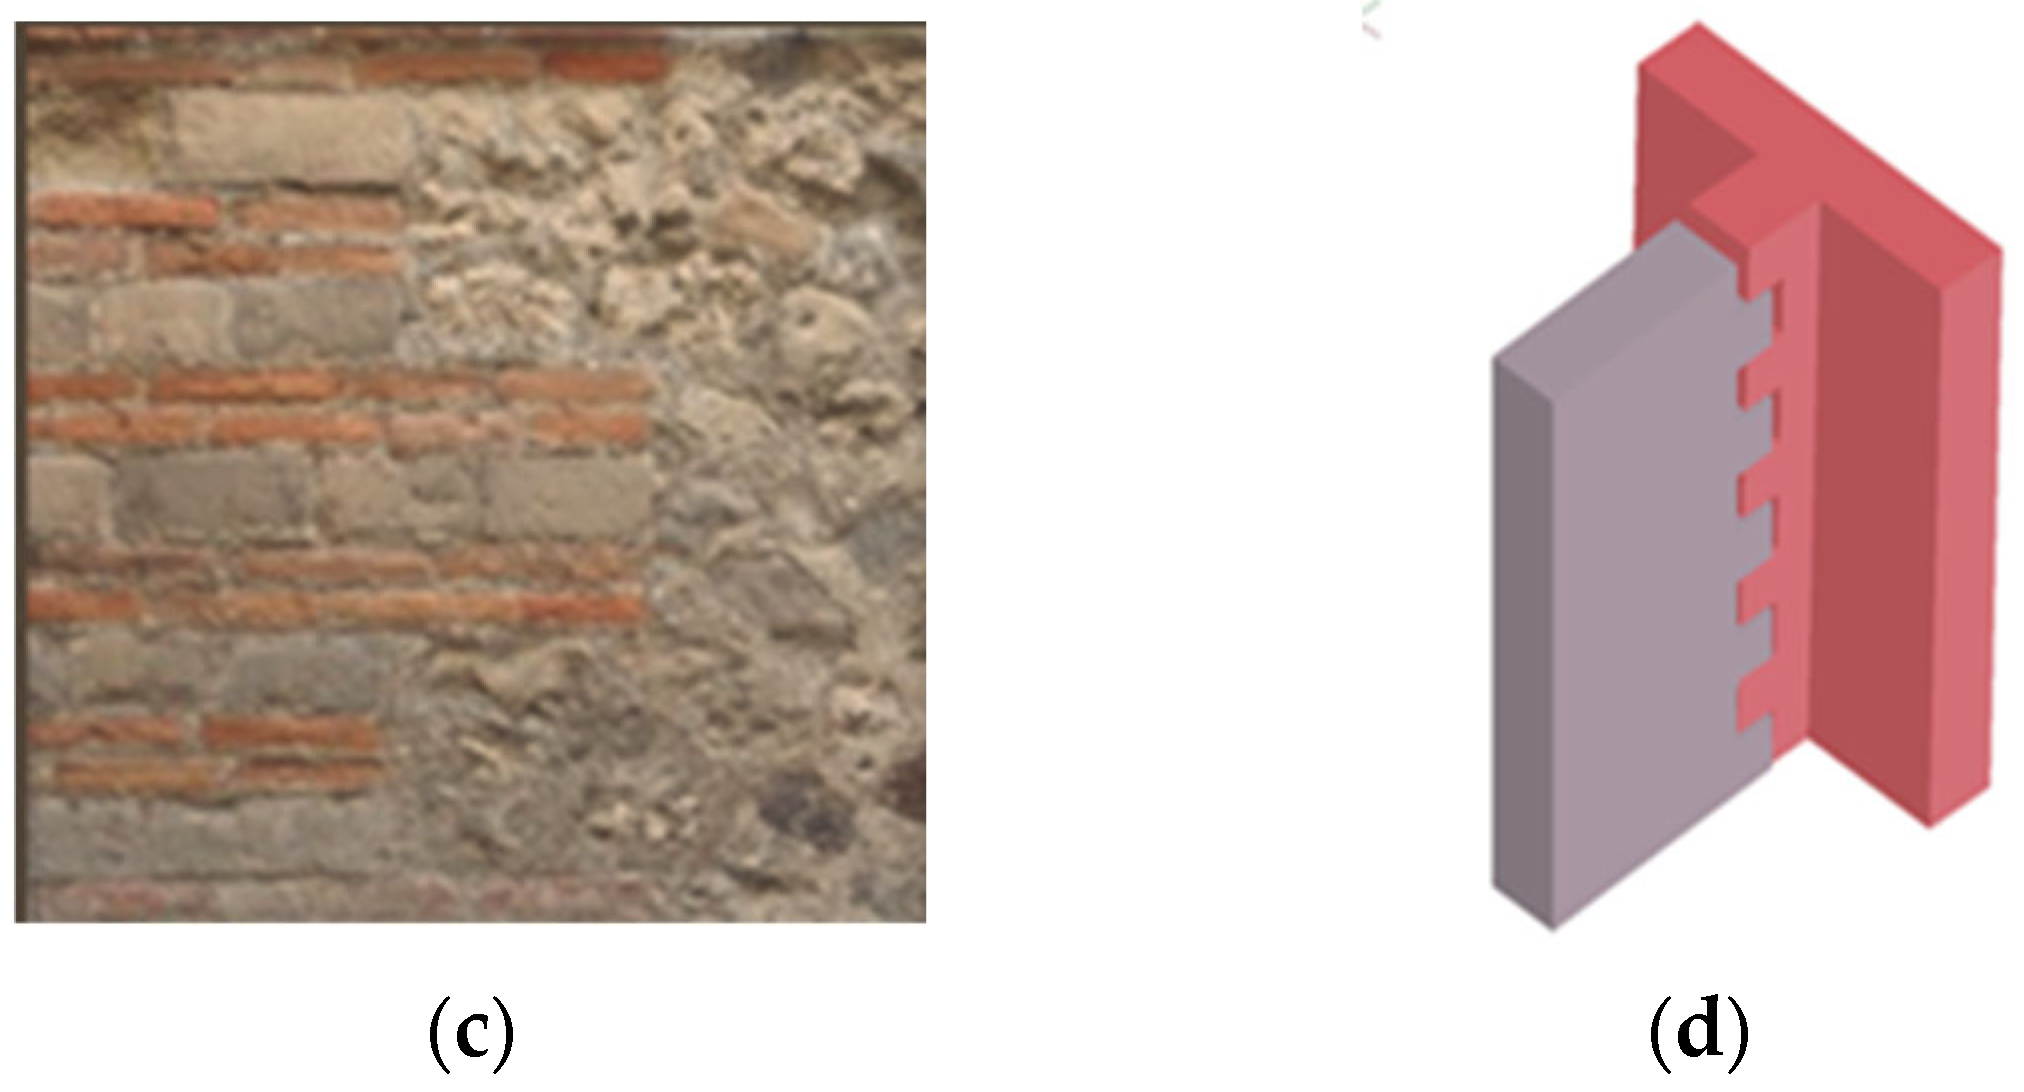
‘Poor’ connections are typically observed between walls built at different times, using different materials and construction techniques. A recurring example in the PAP, shown in
Figure 2a, involves a variant of the Tf typology, named Tf-p, which features front walls made of large Sarno limestone blocks and transverse walls constructed of rubble stone masonry. In cases of ‘poor’ connections, all the typologies listed in
Table 1 behave essentially as single walls, and simple rocking can be assumed as the expected failure mechanism. For the I and Tw typologies, the OOP mechanism of the front wall may be activated regardless of the direction of the horizontal action. For the other typologies, simple rocking may occur only when the front wall is pushed away from the transverse wall; otherwise, when the front wall is pushed toward the transverse wall, the latter acts as a restraint, preventing the simple rocking. Nonetheless, different OOP mechanisms may still trigger.
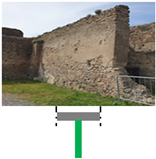
‘Intermediate’ connections can be assumed for orthogonal walls constructed using the
opus incertum technique (see
Figure 2b), characterised by irregular stones bonded with pozzolana-based mortar, which provide a diffuse but relatively weak interlocking along the wall height. In this case, the tensile strength of the masonry plays a key role in governing the connections’ effectiveness, making its reliable assessment essential. Examples of ‘intermediate’ connections are primarily observed in the Tf, I and E typologies. In particular, the Tf-i variant of the Tf typology is characterised by the use of
opus incertum both in the transverse wall and the inner core of the front wall, the latter being folded by two external layers of thin bricks or regular tuff blocks; such a configuration can be classified within the ‘intermediate’ connection category.
Finally, ‘good’ connections are characterised by an improved construction technique, frequently adopted in Pompeii for the reconstructions after the AD 62 earthquake [
12]. Within the PAP, this technique is mainly observed in the Tf, L, and C typologies. Particularly, in the C typology (
Figure 2c), toothed connections made of regular masonry units can be observed at the corners. Various types of masonry units and arrangements can be observed, as highlighted by Dessales et al. [
13].
3. A Methodological Path to Assess the Vulnerability of Archaeological Walls to OOP Failure Modes
This section presents a methodological framework for assessing the vulnerability of archaeological walls to OOP horizontal actions. The approach can be applied both when the expected OOP failure mechanism is clearly identifiable and when it must be predicted due to the absence of a distinct crack pattern. The two scenarios mainly differ in the procedures used to identify the failure mechanism.
Once the mechanism has been identified, the proposed methodology provides the corresponding triggering horizontal action using the linear kinematic approach of limit analysis, which belongs to the force-based methods. It is important to emphasise that the analysis focuses on the onset of OOP mechanisms, which is defined as a limit damage state (SLD) for existing masonry buildings according to the Italian Technical Code, namely NTC 2018 [
14]. Indeed, for such buildings, the ultimate limit states are generally associated with a certain displacement capacity, reflecting an expected ductile behaviour. In archaeological contexts, however, the presence and reliability of ductile behaviour are difficult to establish. Therefore, the onset of the OOP mechanisms assumes a more critical and meaningful role in the assessment of the seismic response. In
Section 4.5, the criteria for selecting hazard parameters are discussed in relation to defining the seismic demand associated with the limit states relevant to the preservation of archaeological assets.
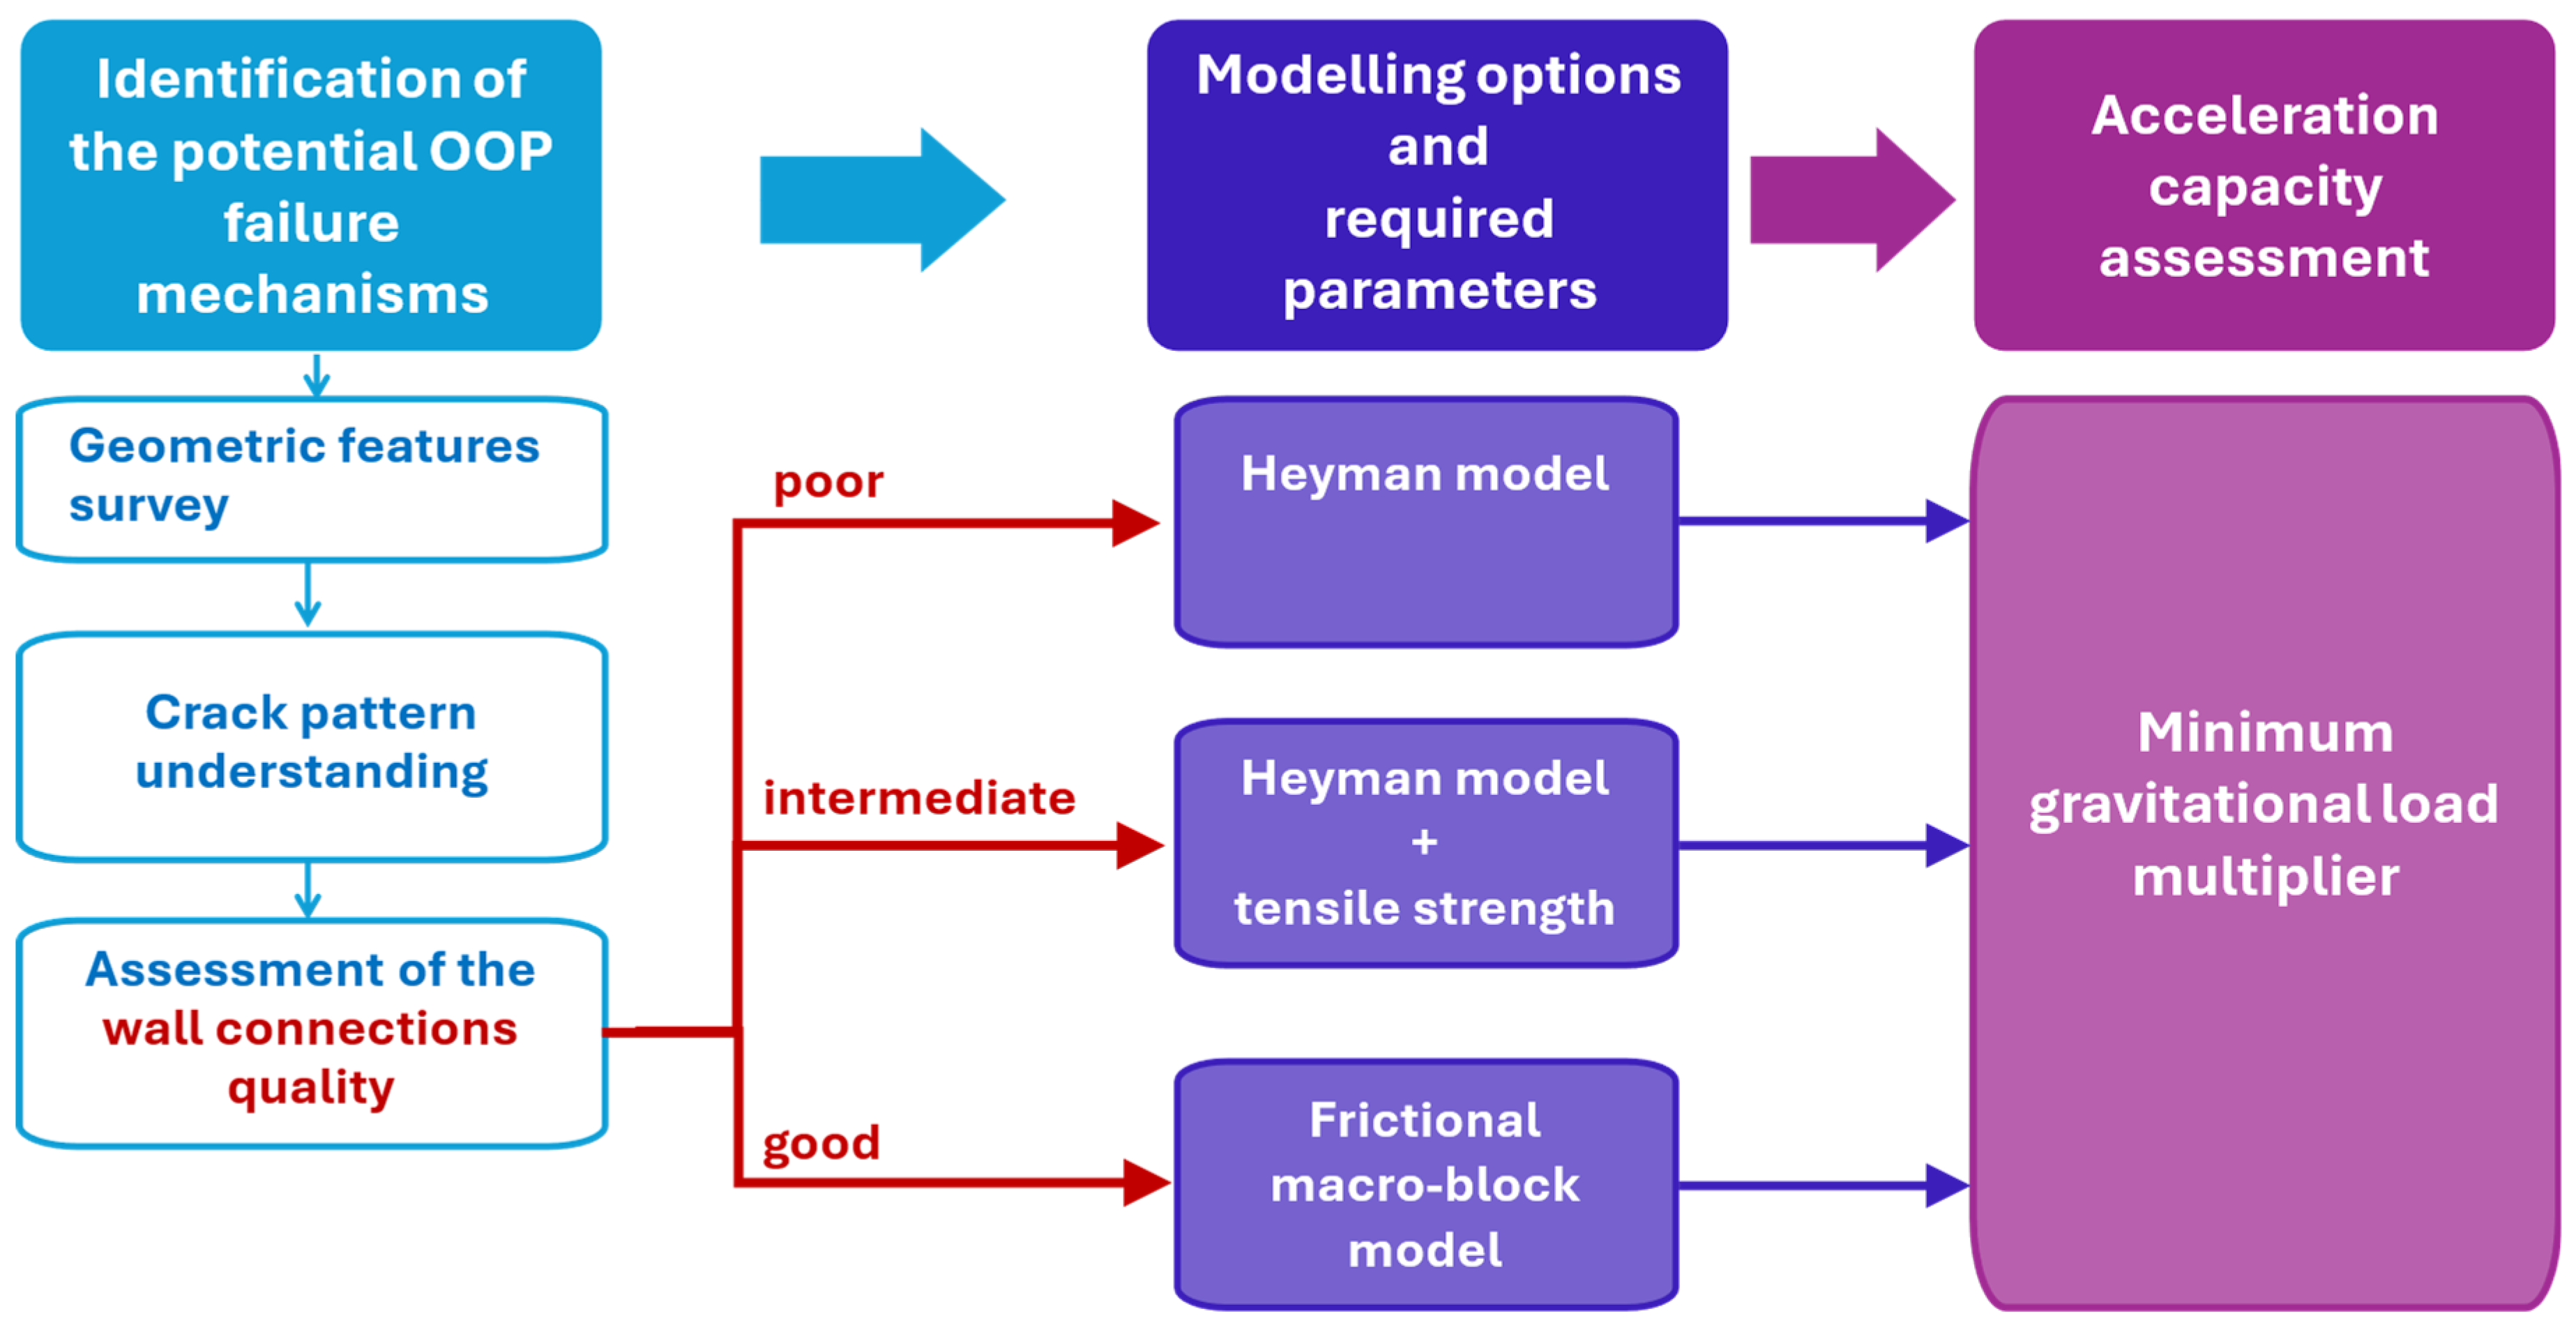
The three main steps of the proposed methodology are presented in the flowchart in
Figure 3 with different colours and discussed in the following paragraphs.
3.1. Identification of the Potential OOP Failure Mechanisms
The first step of the methodology is to identify the most likely OOP failure mechanism affecting the wall under investigation (first column in
Figure 3). When the stone arrangement ensures the monolithic behaviour of the wall, OOP failure mechanisms are typically characterised by a few primary cracks, which transform the wall into a system of rigid macro-blocks. These macro-blocks are articulated by unilateral hinges along the cracks and can fail due to loss of equilibrium. Therefore, understanding the crack pattern represents the first fundamental step in analysing the OOP response of the wall.
While the crack pattern is often clearly identifiable once a failure mechanism has been triggered, it is more common that the mechanism has not yet fully developed, or that the wall is undamaged. In such cases, multiple hypotheses must be formulated about the most likely OOP mechanism based on the wall’s restraining conditions and its vulnerabilities—such as the use of different materials and construction techniques or evidence of repairs and modifications carried out over time.
As discussed in the previous section, in archaeological contexts, the investigation of the morphology and effectiveness of the wall connections plays a crucial role since, in the absence of horizontal diaphragms, these connections are generally the only restraint; moreover, the frequent lack of horizontal diaphragms rules out the possibility of vertical flexure failure modes. Similarly, compound rocking-sliding mechanisms involving transverse walls are unlikely, as these walls are often made of rubble stone masonry, and the in-plane frictional resistance, typically provided by a regular bond pattern, is lacking.
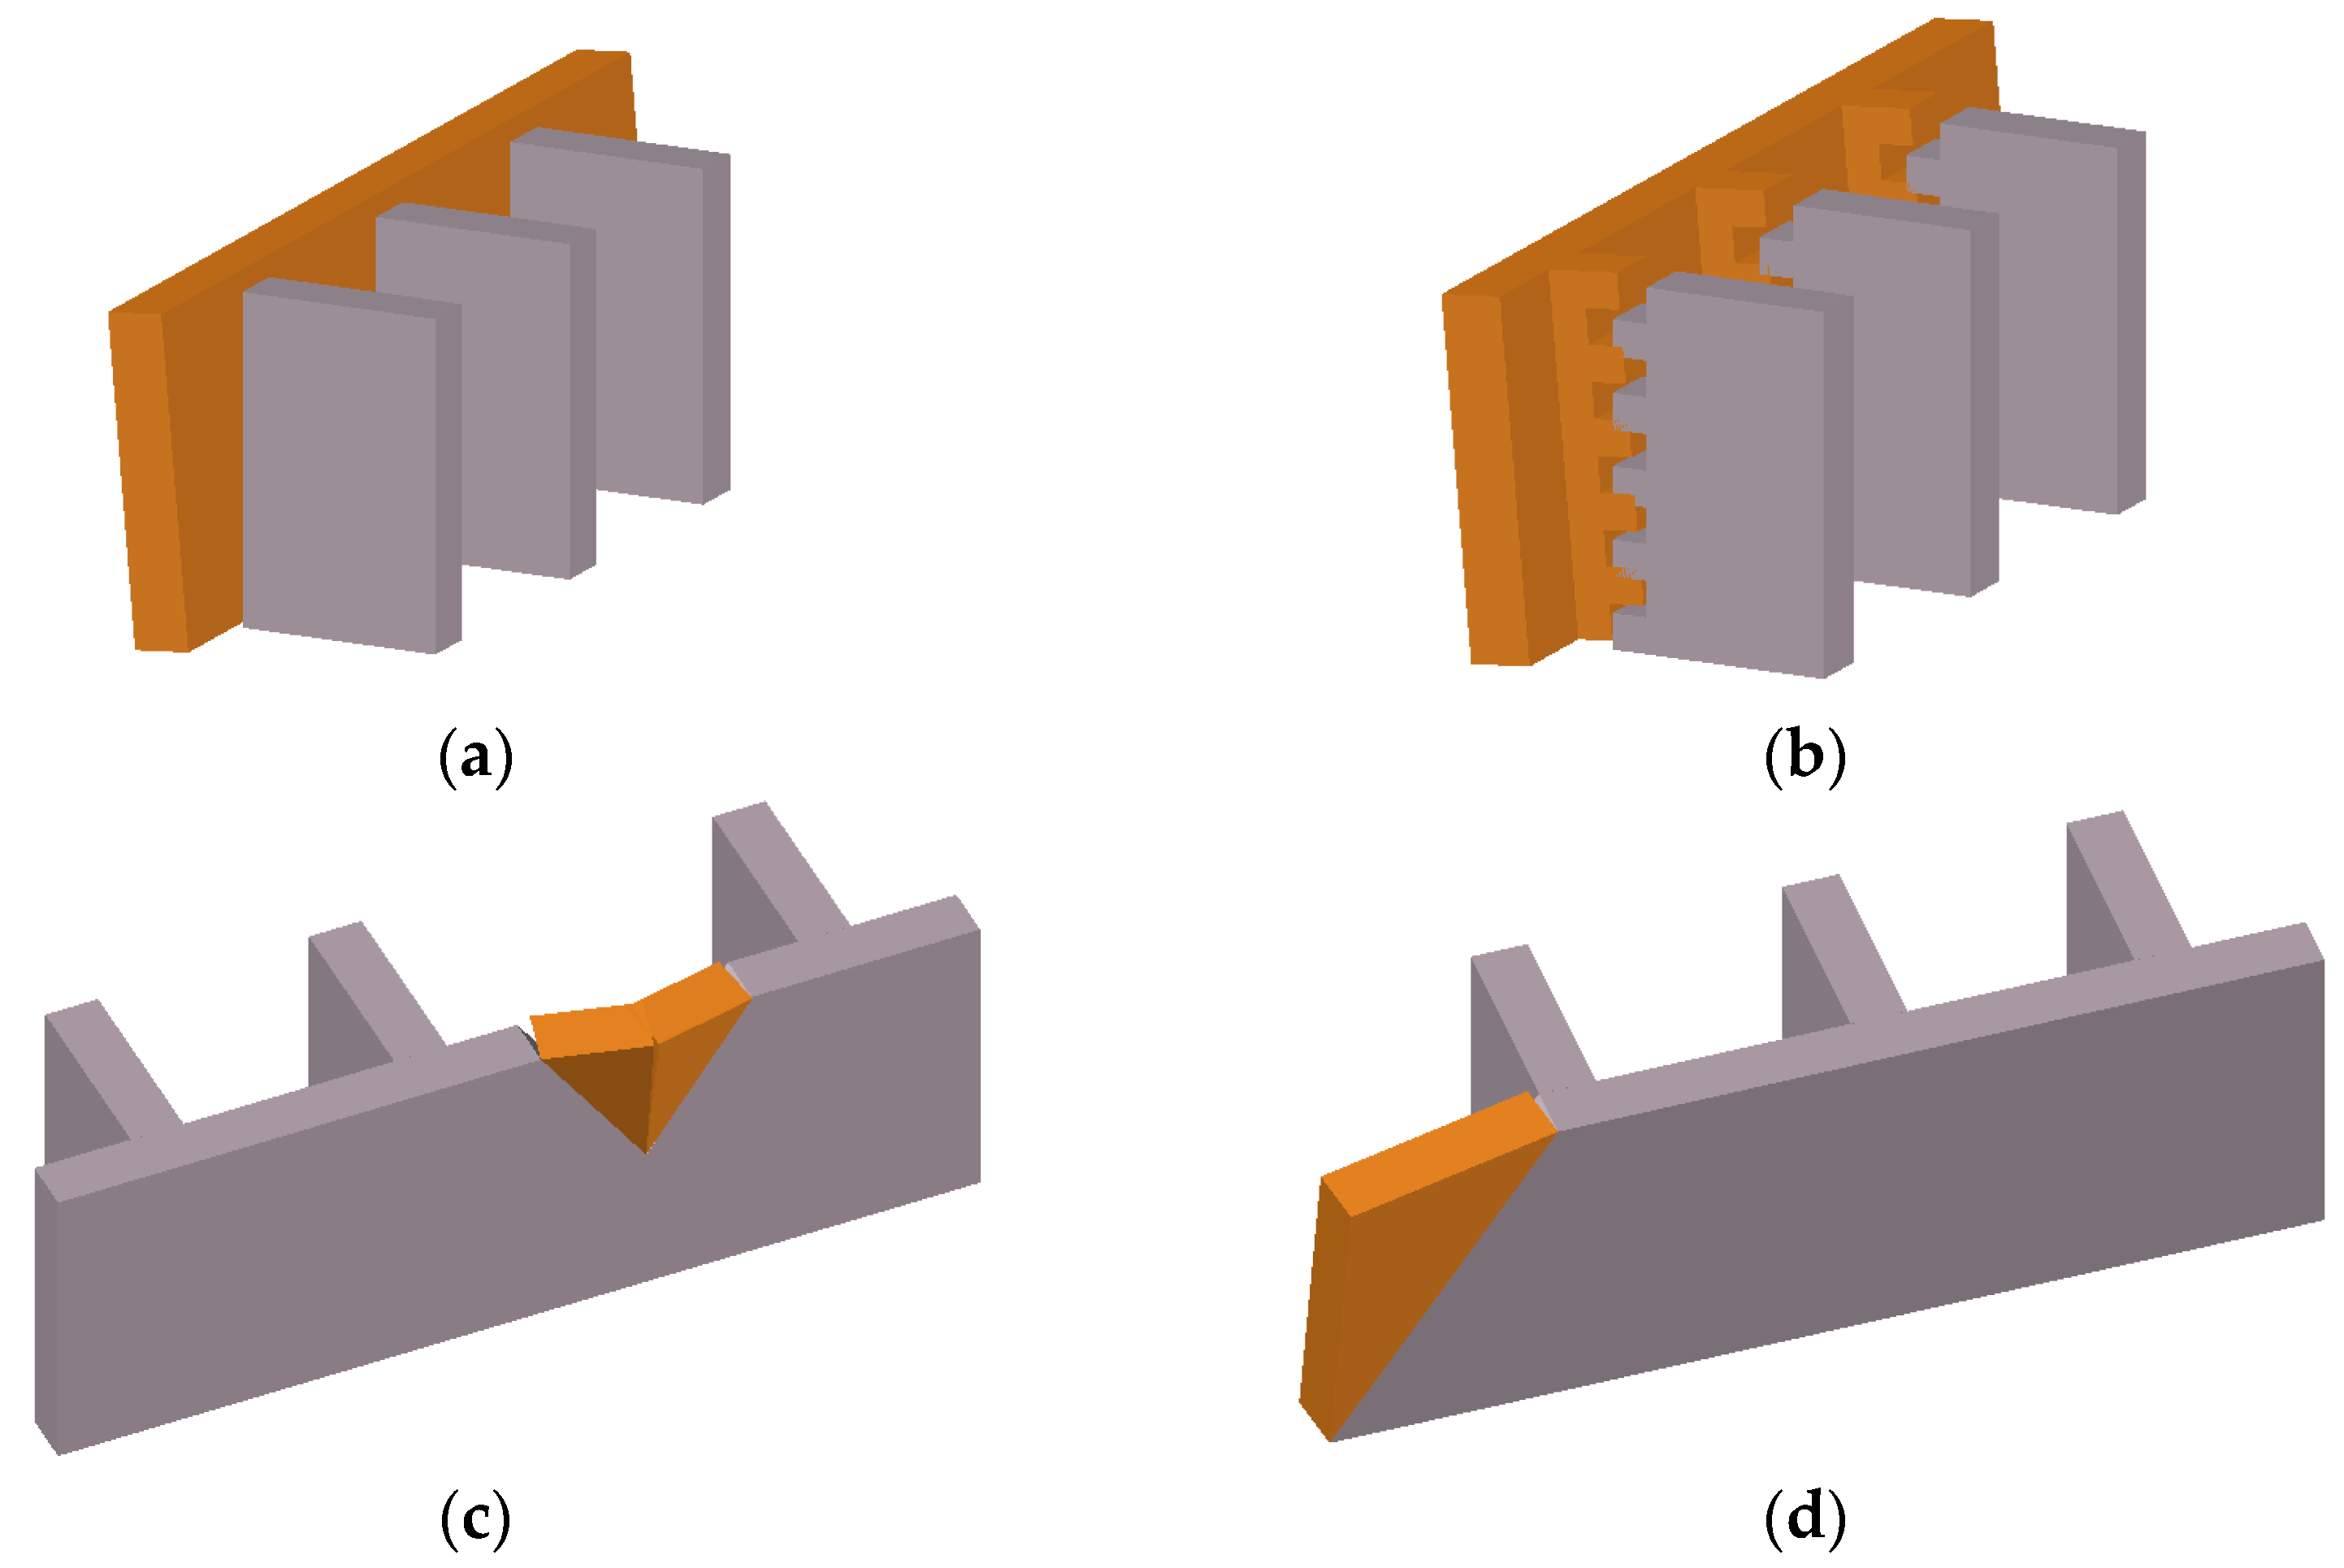
Consequently, the feasible OOP failure mechanisms for archaeological walls can be grouped into two classes, with an example illustrated in
Figure 4 for the E typology: (1) simple rocking (
Figure 4a) or simple rocking-sliding (
Figure 4b), and (2) horizontal flexure, either symmetrical (
Figure 4c) or not symmetrical (
Figure 4d). Note that the macro-blocks involved in the mechanisms depicted in
Figure 4 are shown in orange.
The key factor in selecting the most reliable OOP failure mechanism is the horizontal slenderness of the walls, which is known to increase susceptibility to horizontal flexure failure. For simple rocking (
Figure 4a), the failure may involve only the self-weight of the macro-block when connections are ‘poor’. In cases of ‘intermediate’ or ‘good’ connections, additional restraining forces—such as the tensile strength of the masonry or frictional resistance—may contribute to a rocking-sliding mechanism (
Figure 4b). Corner failures, which are specific to the L typology, can also occur as simple rocking or rocking-sliding (
Figure 4a,b), depending on the connections to the adjacent walls.
3.2. Basics of Modelling Approaches
Identifying the most likely OOP failure mechanism and assessing the associated horizontal capacity requires a modelling approach that explicitly accounts for the factor that most strongly influences the OOP failure mode, i.e., the effectiveness of the wall connections. Accordingly, three modelling approaches were adopted, corresponding to the three levels of connection effectiveness identified in the second level of the classification outlined in
Section 2.1 (see the flowchart in
Figure 3). Specifically, the original Heyman model [
15] was applied for ‘poor’ connections, a modified Heyman model accounting for masonry tensile strength [
11] was used for ‘intermediate’ connections, and a frictional macro-block model [
16] was employed for ‘good’ connections. All approaches assume that masonry behaves as a system of rigid blocks and describe failure mechanisms as kinematic systems of rigid macro-blocks separated by cracks and articulated by unilateral hinges. These are all based on limit analysis, which provides the horizontal capacity as a static force proportional to the gravitational loads via a multiplier, α. In the absence of horizontal diaphragms, as a common condition for archaeological walls, the self-weight of the macro-blocks is the only gravitational load considered in the analysis.
However, it should be highlighted that the analysis used Heyman’s no-tension masonry model, which represents a limit-analysis idealisation supported by observed masonry collapse mechanisms. This approach does not model the full nonlinear material behaviour of masonry; therefore, the results should be interpreted within the scope of this idealisation, avoiding overextension of the conclusions.
The fundamentals of the adopted modelling approaches are summarised below to facilitate the understanding of the case studies presented in
Section 4. A more detailed development and application of these approaches to archaeological contexts is provided in [
11]. Although their validation in such contexts is still a subject of ongoing research, Heyman-based models and limit analysis approaches have been extensively validated for existing masonry buildings [
16,
17,
18,
19], and are recognised in advanced Technical Standards on masonry, such as the Commentary to the Italian Technical Code, namely CNTC 2019 [
20]. A key advantage of the proposed models lies in their reliance on a limited set of relatively robust parameters—primarily geometric properties of the masonry walls—which can be readily and reliably determined.
3.2.1. Original Heyman Model
The original Heyman model [
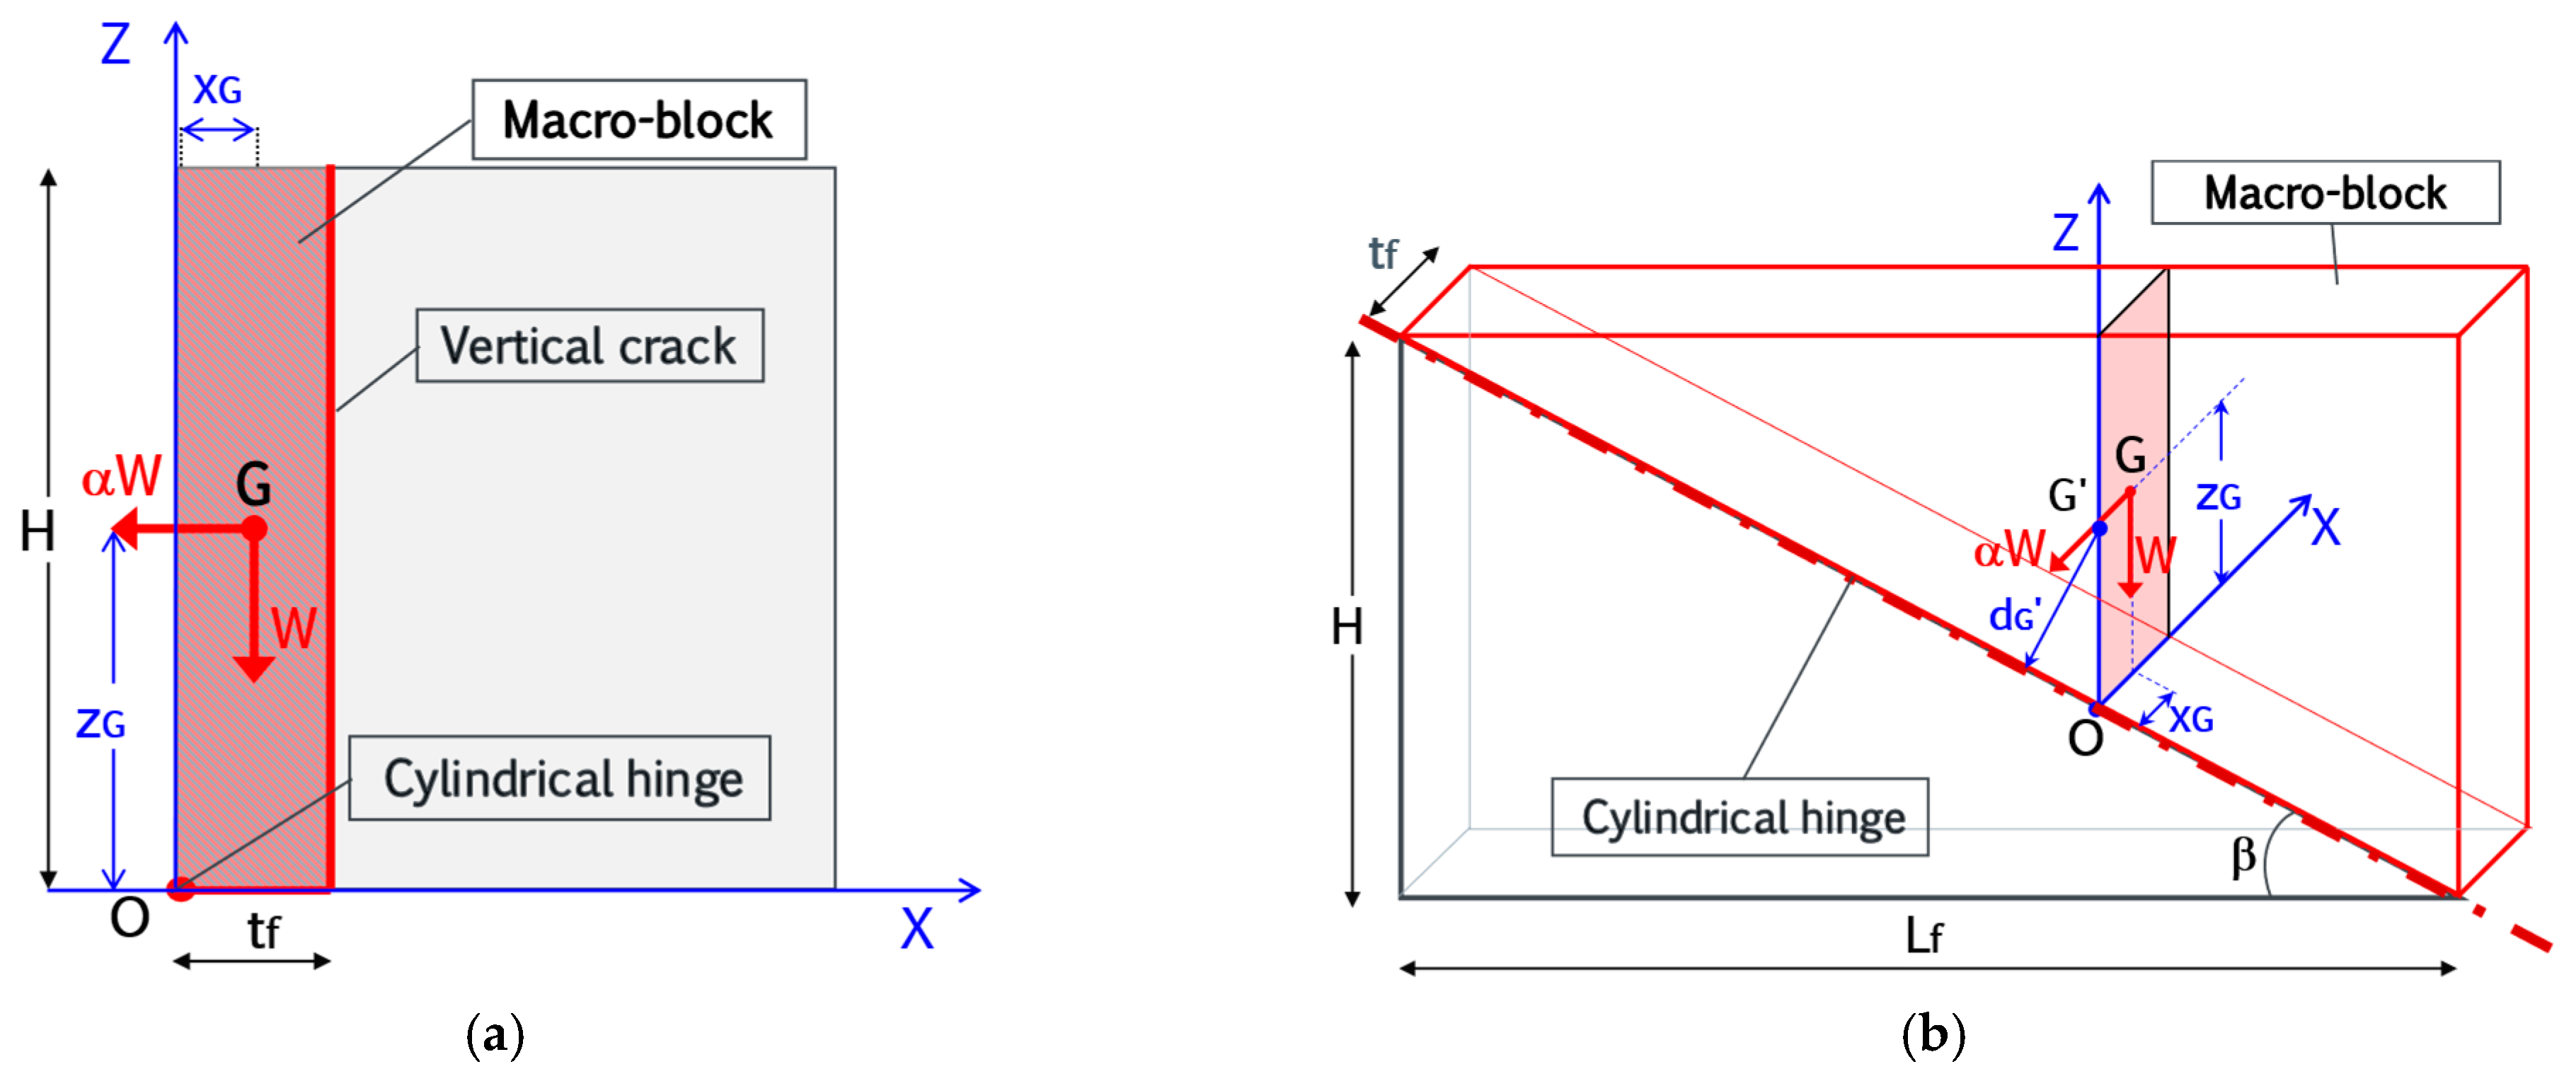
15] was employed to investigate walls with ‘poor’ connections. As is well-known, it is based on three key assumptions concerning masonry behaviour: zero tensile strength, infinite compressive strength, and no sliding along the joints. Under such assumptions, the OOP response of the wall is influenced solely by its geometrical parameters, provided that its self-weight is the only gravitational load considered. The corresponding load multiplier is presented here for the two configurations of the simple rocking failure mechanism analysed in
Section 4: (i) the rotation around a horizontal cylindrical hinge at the base of the wall (
Figure 5a), and (ii) the rotation around a hinge inclined by an angle β (
Figure 5b).
For both configurations, assuming
W as the self-weight of the involved macro-block and α
W as the horizontal force representing the inertial action, the load multiplier is derived from the rotational equilibrium around the hinge as follows:
where
xG and
zG are the coordinates of the mass centre G of the macro-block in the X-Z reference system, defined in the vertical cross-section of the wall passing through G, with origin O located at the cylindrical hinge. Obviously, the coordinates of G depend on the macro-block geometry, which in archaeological contexts may not be regular.
3.2.2. Modified Heyman Model
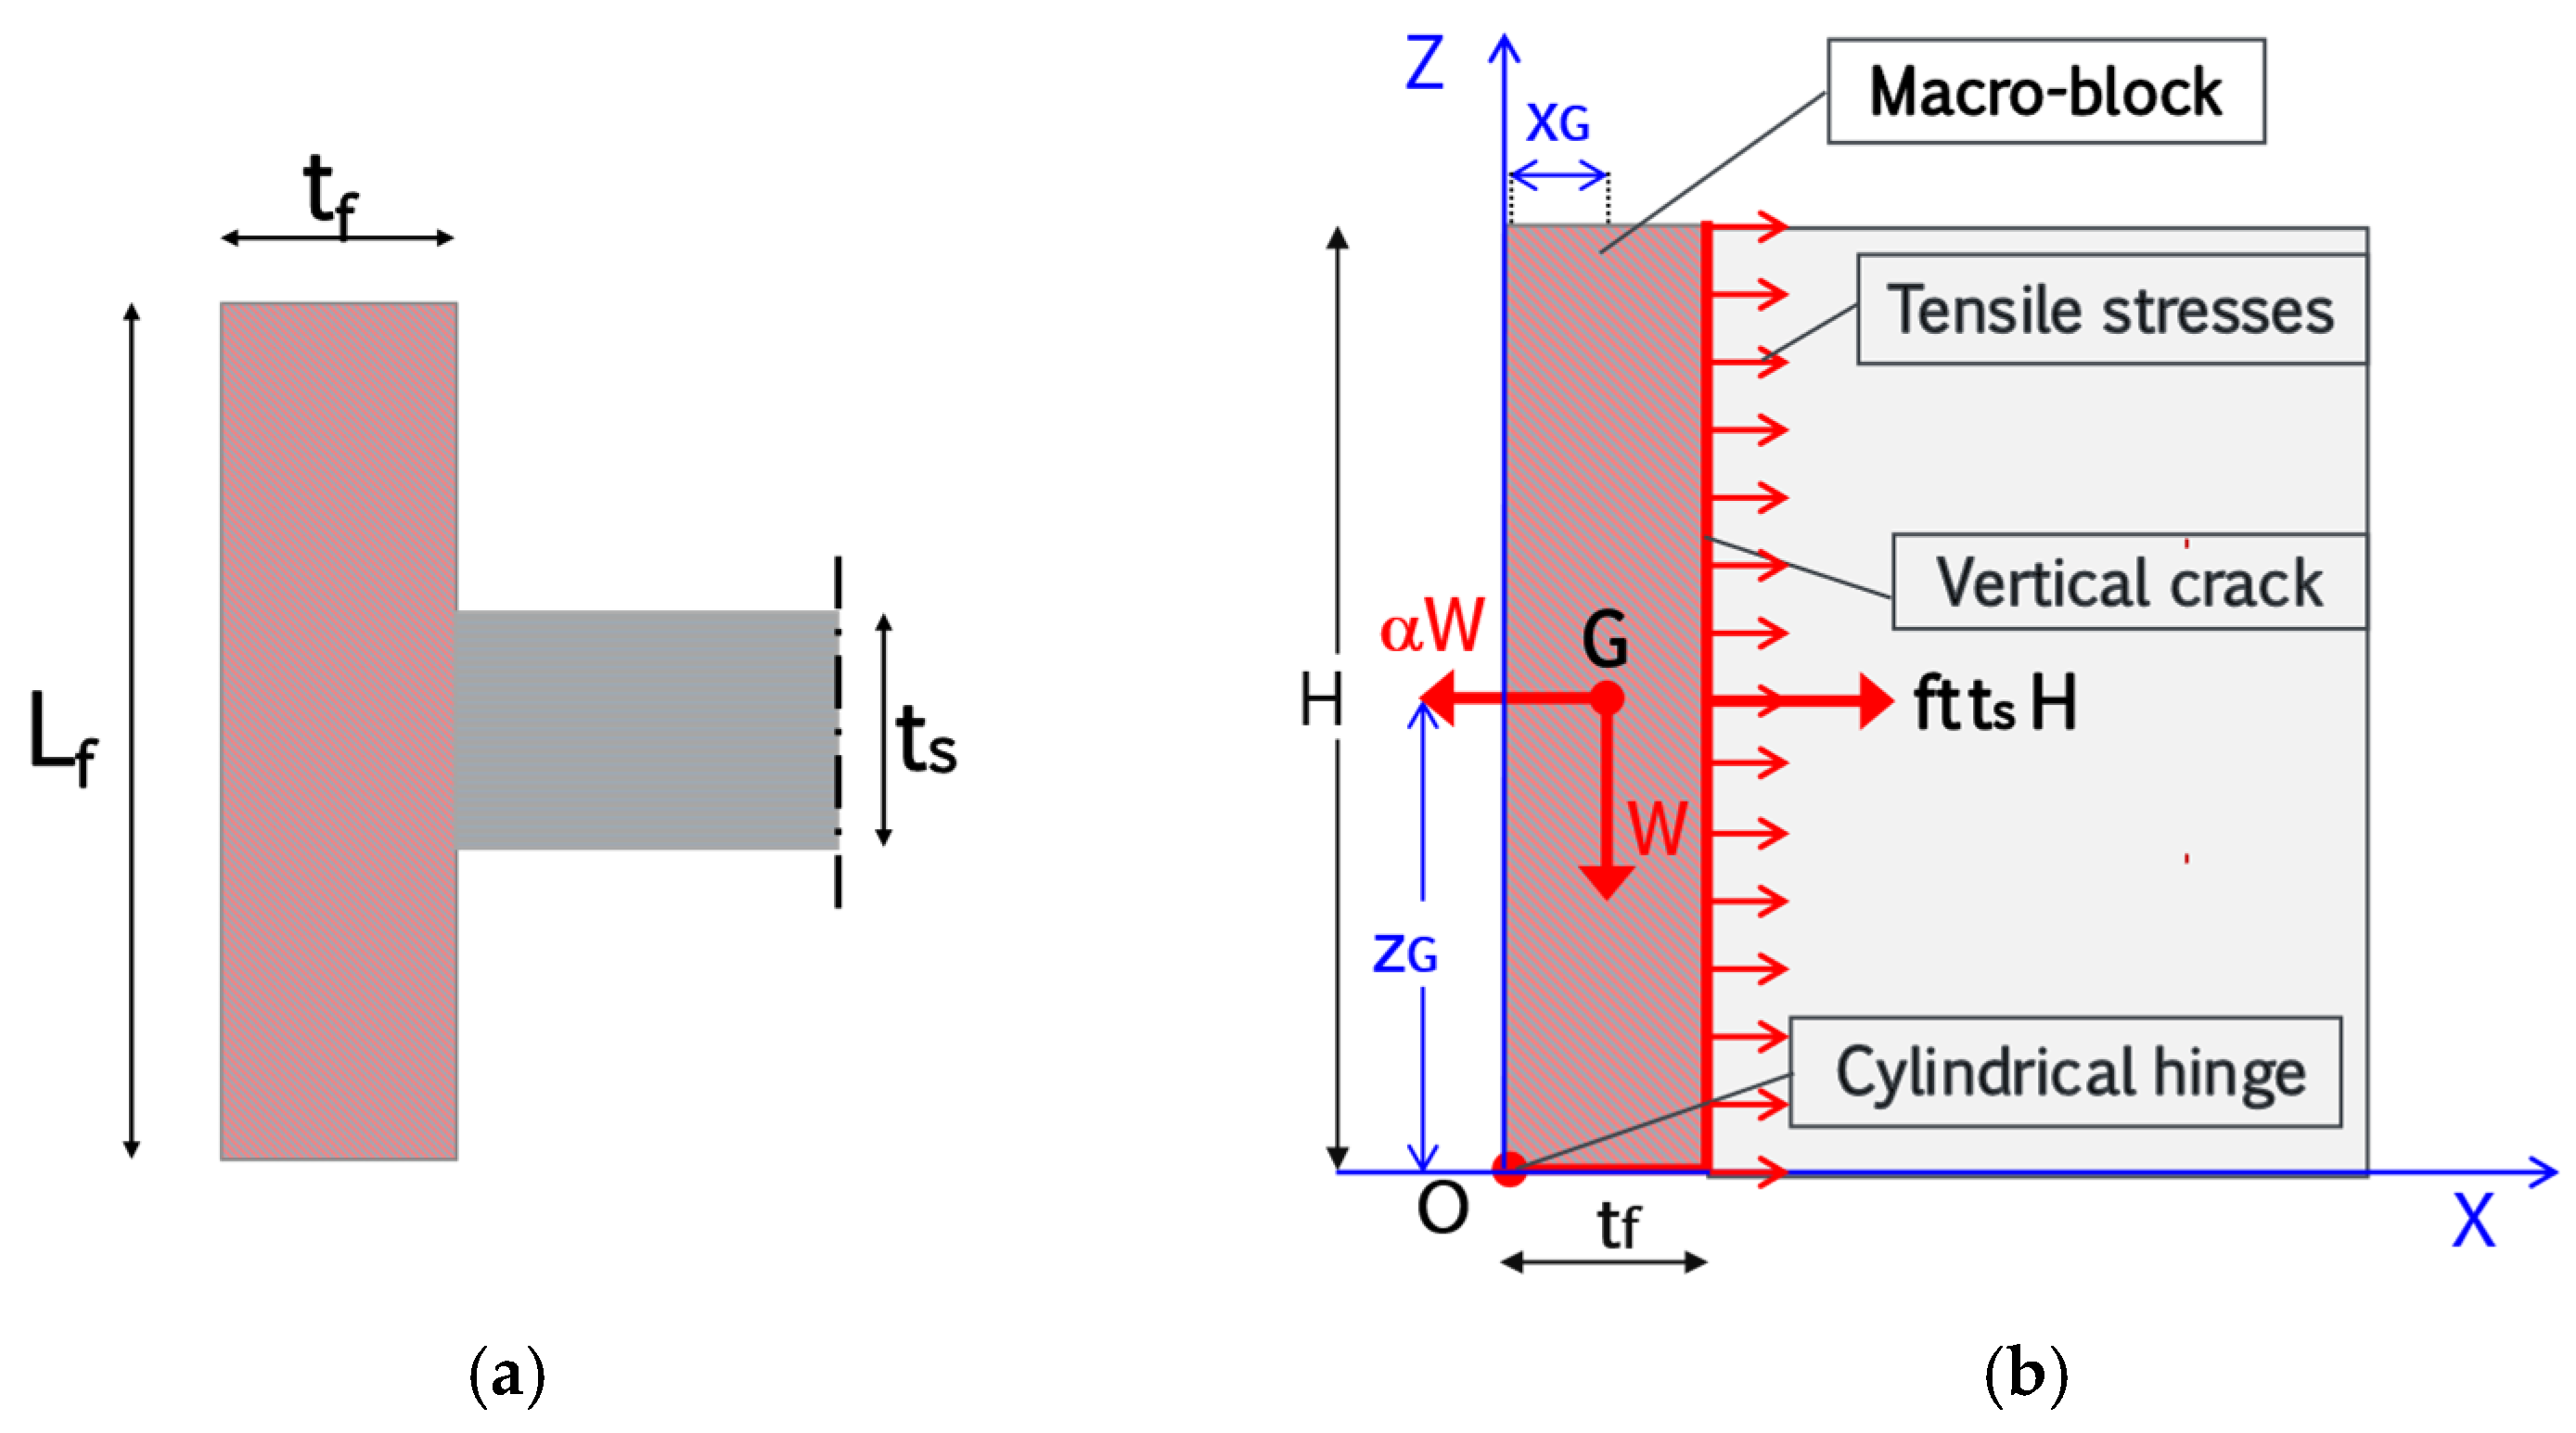
To investigate walls with ‘intermediate’ connections, a modified Heyman model can be employed. This approach relaxes the original assumption of zero tensile strength in masonry, allowing for a uniform distribution of tensile stresses ft along the cross-section intersected by the main crack.
Hereafter, the modified Heyman model was used to analyse the simple rocking mechanism of a Tf-shaped wall (
Figure 6a), characterised by a vertical crack separating the front wall from the transverse one, as shown in
Figure 6b. In this case, the load multiplier α is given by:
where
ts and
tf are the thickness of the transverse (grey coloured) and front (red coloured) wall, respectively,
γ the masonry unit weight, and
Lf the length of the front wall.
Assigning an appropriate value to the tensile strength of the Pompeii
opus incertum masonry is challenging, as available literature data are scarce and primarily derived from purpose-built test specimens [
21]. To address this limitation, Casapulla et al. [
11] adopted the lower and upper bounds recommended by the CNTC 2019 [
20] for the tensile strength of rubble stone masonry—namely, 0.027 MPa and 0.050 MPa. Although these values may be conservative compared to experimental results reported in the literature [
22,
23,
24], in the absence of more representative data, they provide a reliable basis for the analysis, particularly considering the ageing of Pompeii masonry walls.
3.2.3. Frictional Macro-Block Model
The frictional macro-block model developed by Casapulla and Argiento [
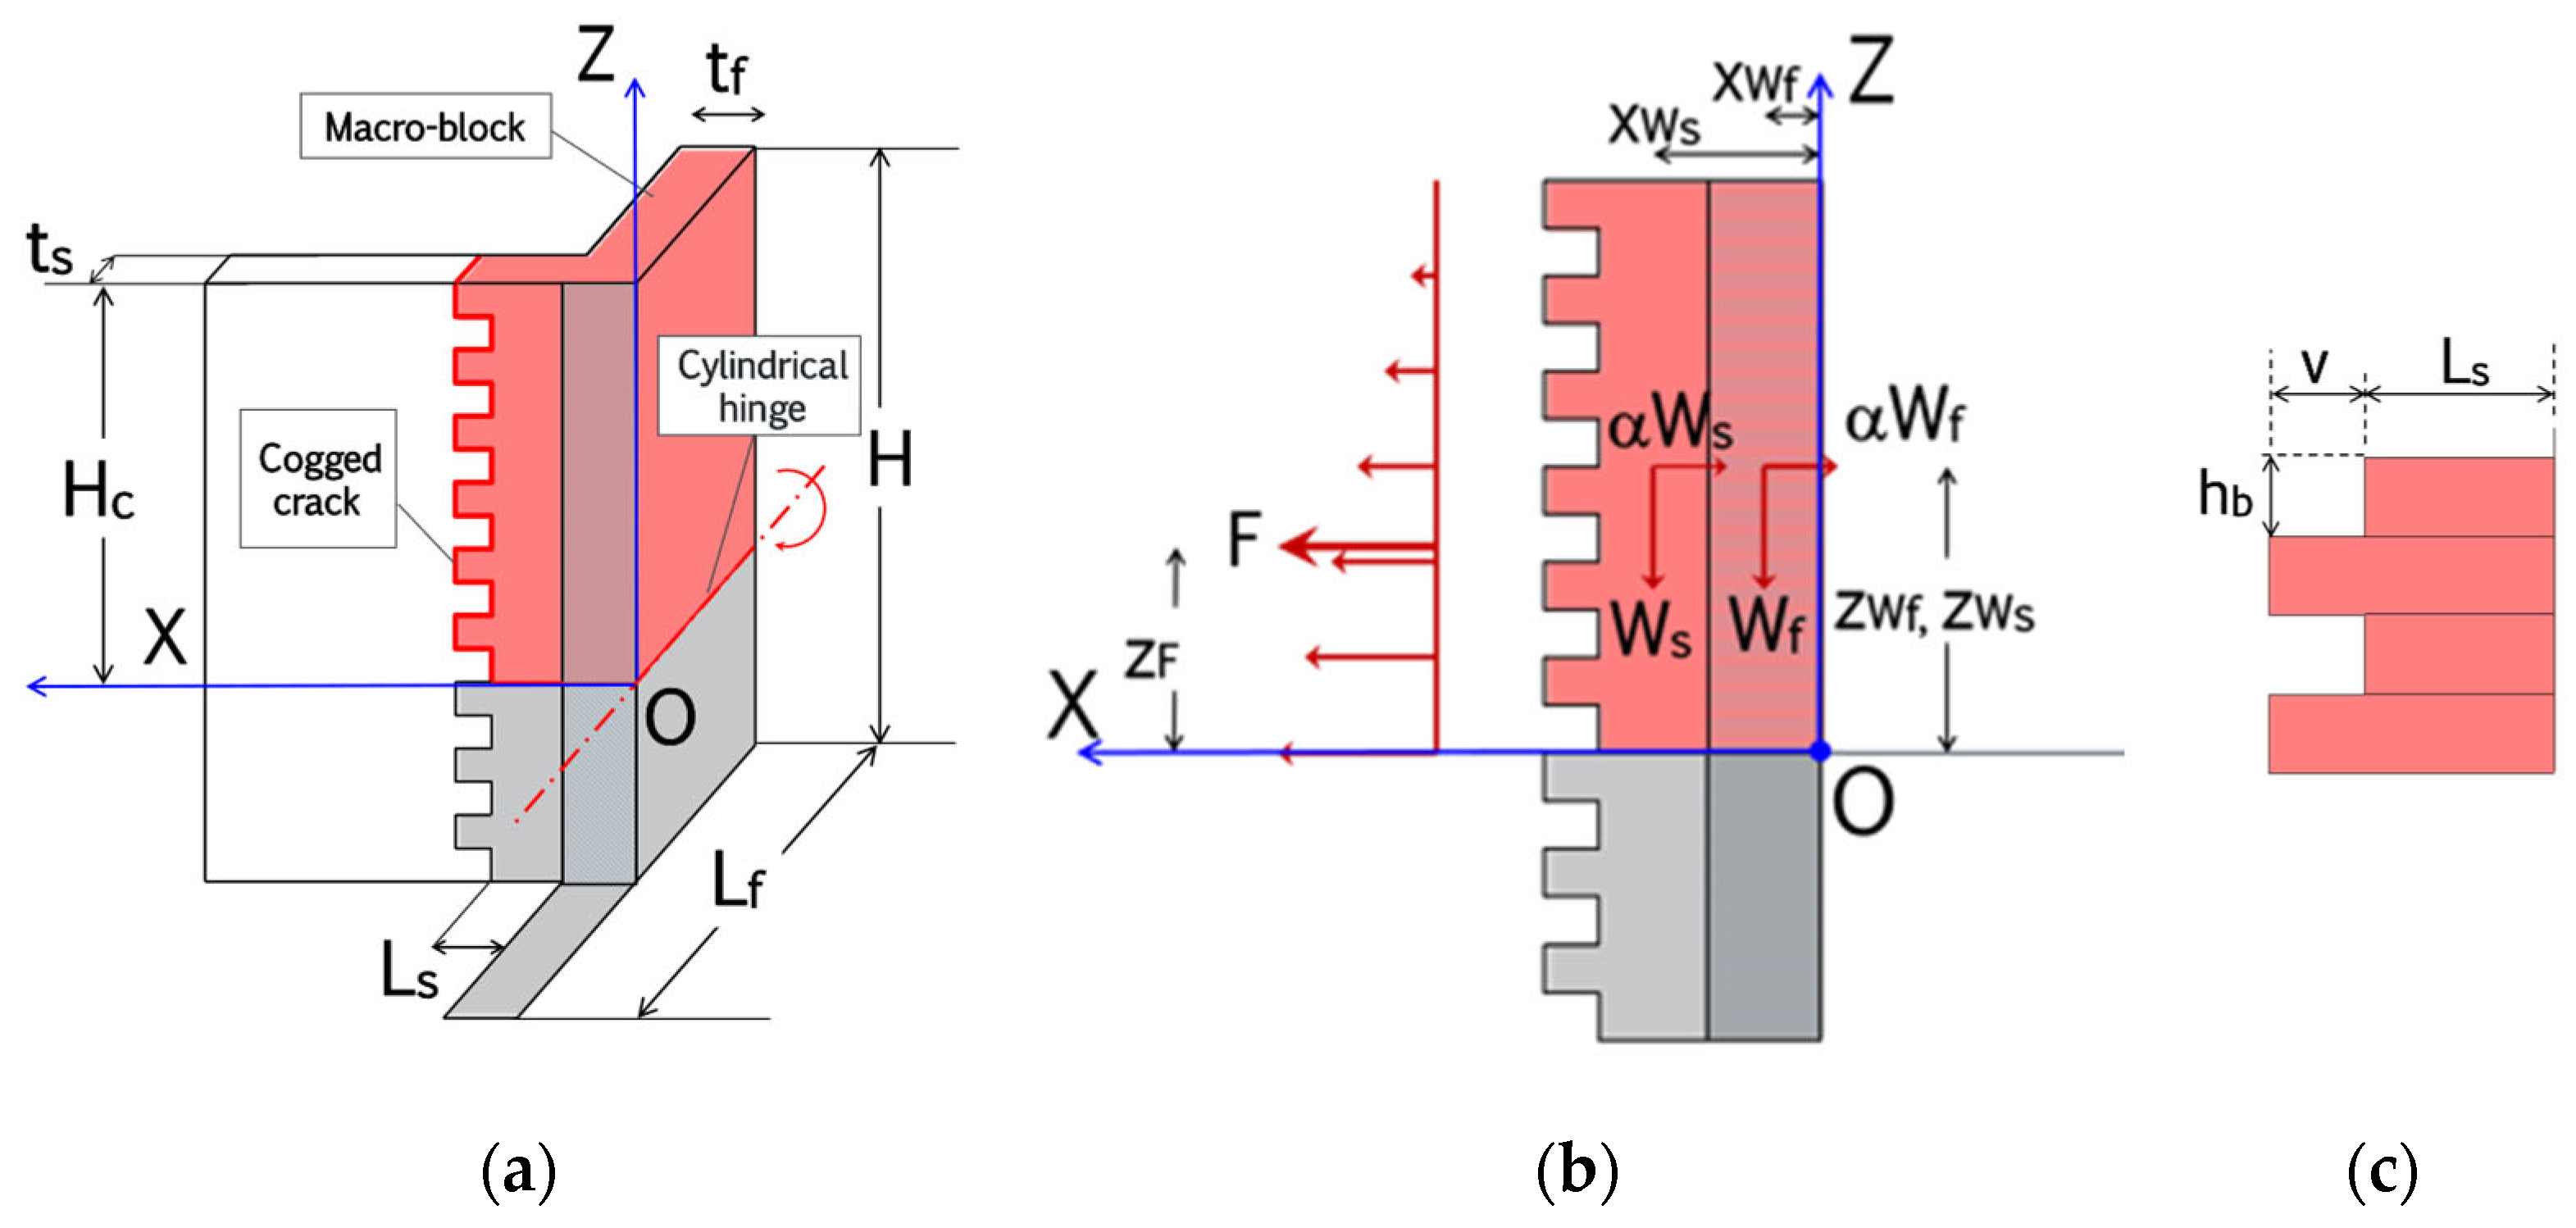
16] was adopted to analyse the simple rocking-sliding mechanism of walls characterised by ‘good’ connections. With reference to the Tf-shaped wall (see
Figure 2c) schematised in
Figure 7a, the model assumes that a cogged crack develops on the transverse wall along the teeth of the connection; moreover, since sliding may occur on their horizontal planes, frictional resistances are expected to act there (
Figure 7b). For this configuration, the horizontal cylindrical hinge may not be at the base of the wall; consequently, the unknown height
Hc of the macro-block rotating around the hinge derives from the minimisation of the load multiplier α according to the kinematic approach of limit analysis. Indeed, the stabilising contribution of the resultant
F of the frictional resistances (
Figure 7b) increases with the height, as well as the destabilising effects of the horizontal forces affected by α. Note that
Hc is expressed as a function of the featured number
nc of teeth, i.e.,
Hc =
nc hb, where
hb is the height of each tooth of the connection (
Figure 7c).
Thus, from the rotational equilibrium of the macro-block, the expression of the load multiplier as a function of
nc is:
where
n is the number of teeth along the entire height
H of the wall,
Wf and
Ws are the self-weights of the front and transverse wall portions, respectively,
xWf,
xWs,
zWf,
zWs are the coordinates of their application points in the X-Z reference system, defined in the vertical cross-section passing through the barycentre of the front wall, with origin O located at the cylindrical hinge (
Figure 7b),
F is the resultant of the frictional resistance, and
zF is its distance from the X axis.
Table 2 reports the expressions of the parameters in Equation (3), whereas
Figure 7 clarifies their geometrical meaning.
Note that the expression of the frictional force
F followed [
16]; however, a reduced value of
ts (equal to 2/3 of the original value) was assumed to account for the reduced contact surfaces associated with the chaotic inner core of the Pompeii walls.
It should also be noted that the forces and their corresponding application points reported in
Table 2 are functions of the unknown parameter
nc, which is obtained by minimising Equation (3). Thus, with
nc0 the number of teeth providing the minimum load multiplier α
0, it is:
Implementing this modelling approach requires a reliable estimation of the friction coefficient
f, which influences the resultant force
F. Experimental studies investigating frictional contact between masonry units and mortar joints have shown significant variability in the values of
f, influenced by the test setup as well as the types of mortar and masonry units used. Moreover, these results typically do not pertain to archaeological masonry and often neglect the effects of ageing and material degradation. Thus, a reasonable range for the friction coefficient is 0.4–0.6, as adopted in [
11], with 0.6 representing a commonly accepted upper bound in the literature for dry stone masonry with a regular bond pattern [
25,
26], which is the most favourable condition for developing frictional resistances.
3.3. Assessing the Acceleration Capacity
The analytical models described in
Section 3.2 allow for assessment of the kinematic load multiplier of the gravitational loads associated with each potential OOP mechanism of the wall under study. If different mechanisms are possible, the one yielding the minimum multiplier, α
0, of the gravitational load, is regarded as the most probable. Note that for both the original and modified Heyman models, α
0 is directly obtained from Equations (1) and (2), respectively, as no minimisation procedure is required. Based on this, the horizontal capacity of the wall in terms of acceleration,
a0, can be calculated according to the CNTC 2019 [
20] as:
where
g is the gravitational acceleration (9.81 m/s
2), CF is a confidence factor accounting for the uncertainties of the model, and
e* is the mass participating rate. Note that the acceleration capacity expressed by Equation (6) assumes that the displacements describing the kinematics of the mechanism correspond to the fundamental vibration mode of the affected portion of the wall.
To address the seismic assessment of the wall, once its acceleration capacity has been calculated, it must be compared to the expected seismic demand for the limit state under consideration, as illustrated in the following section. It should be noted that under the assumption of rigid behaviour for the masonry walls, the seismic demand associated with a given limit state coincides with the expected peak ground acceleration (PGA) at the site, including the effects of local soil amplification.
4. Applying the Proposed Methodology to Some Examples of Pompeian Walls
This section illustrates the application of the proposed methodology to some examples of Pompeian walls with reference to two possible conditions: (1) when the failure mechanism has already been triggered, and a well-defined crack pattern is observable; and (2) when the wall is still undamaged, and the failure mechanism must be predicted. As outlined in the previous section, in both scenarios, the proposed methodology allows for the identification of the expected failure mechanism and the corresponding triggering acceleration.
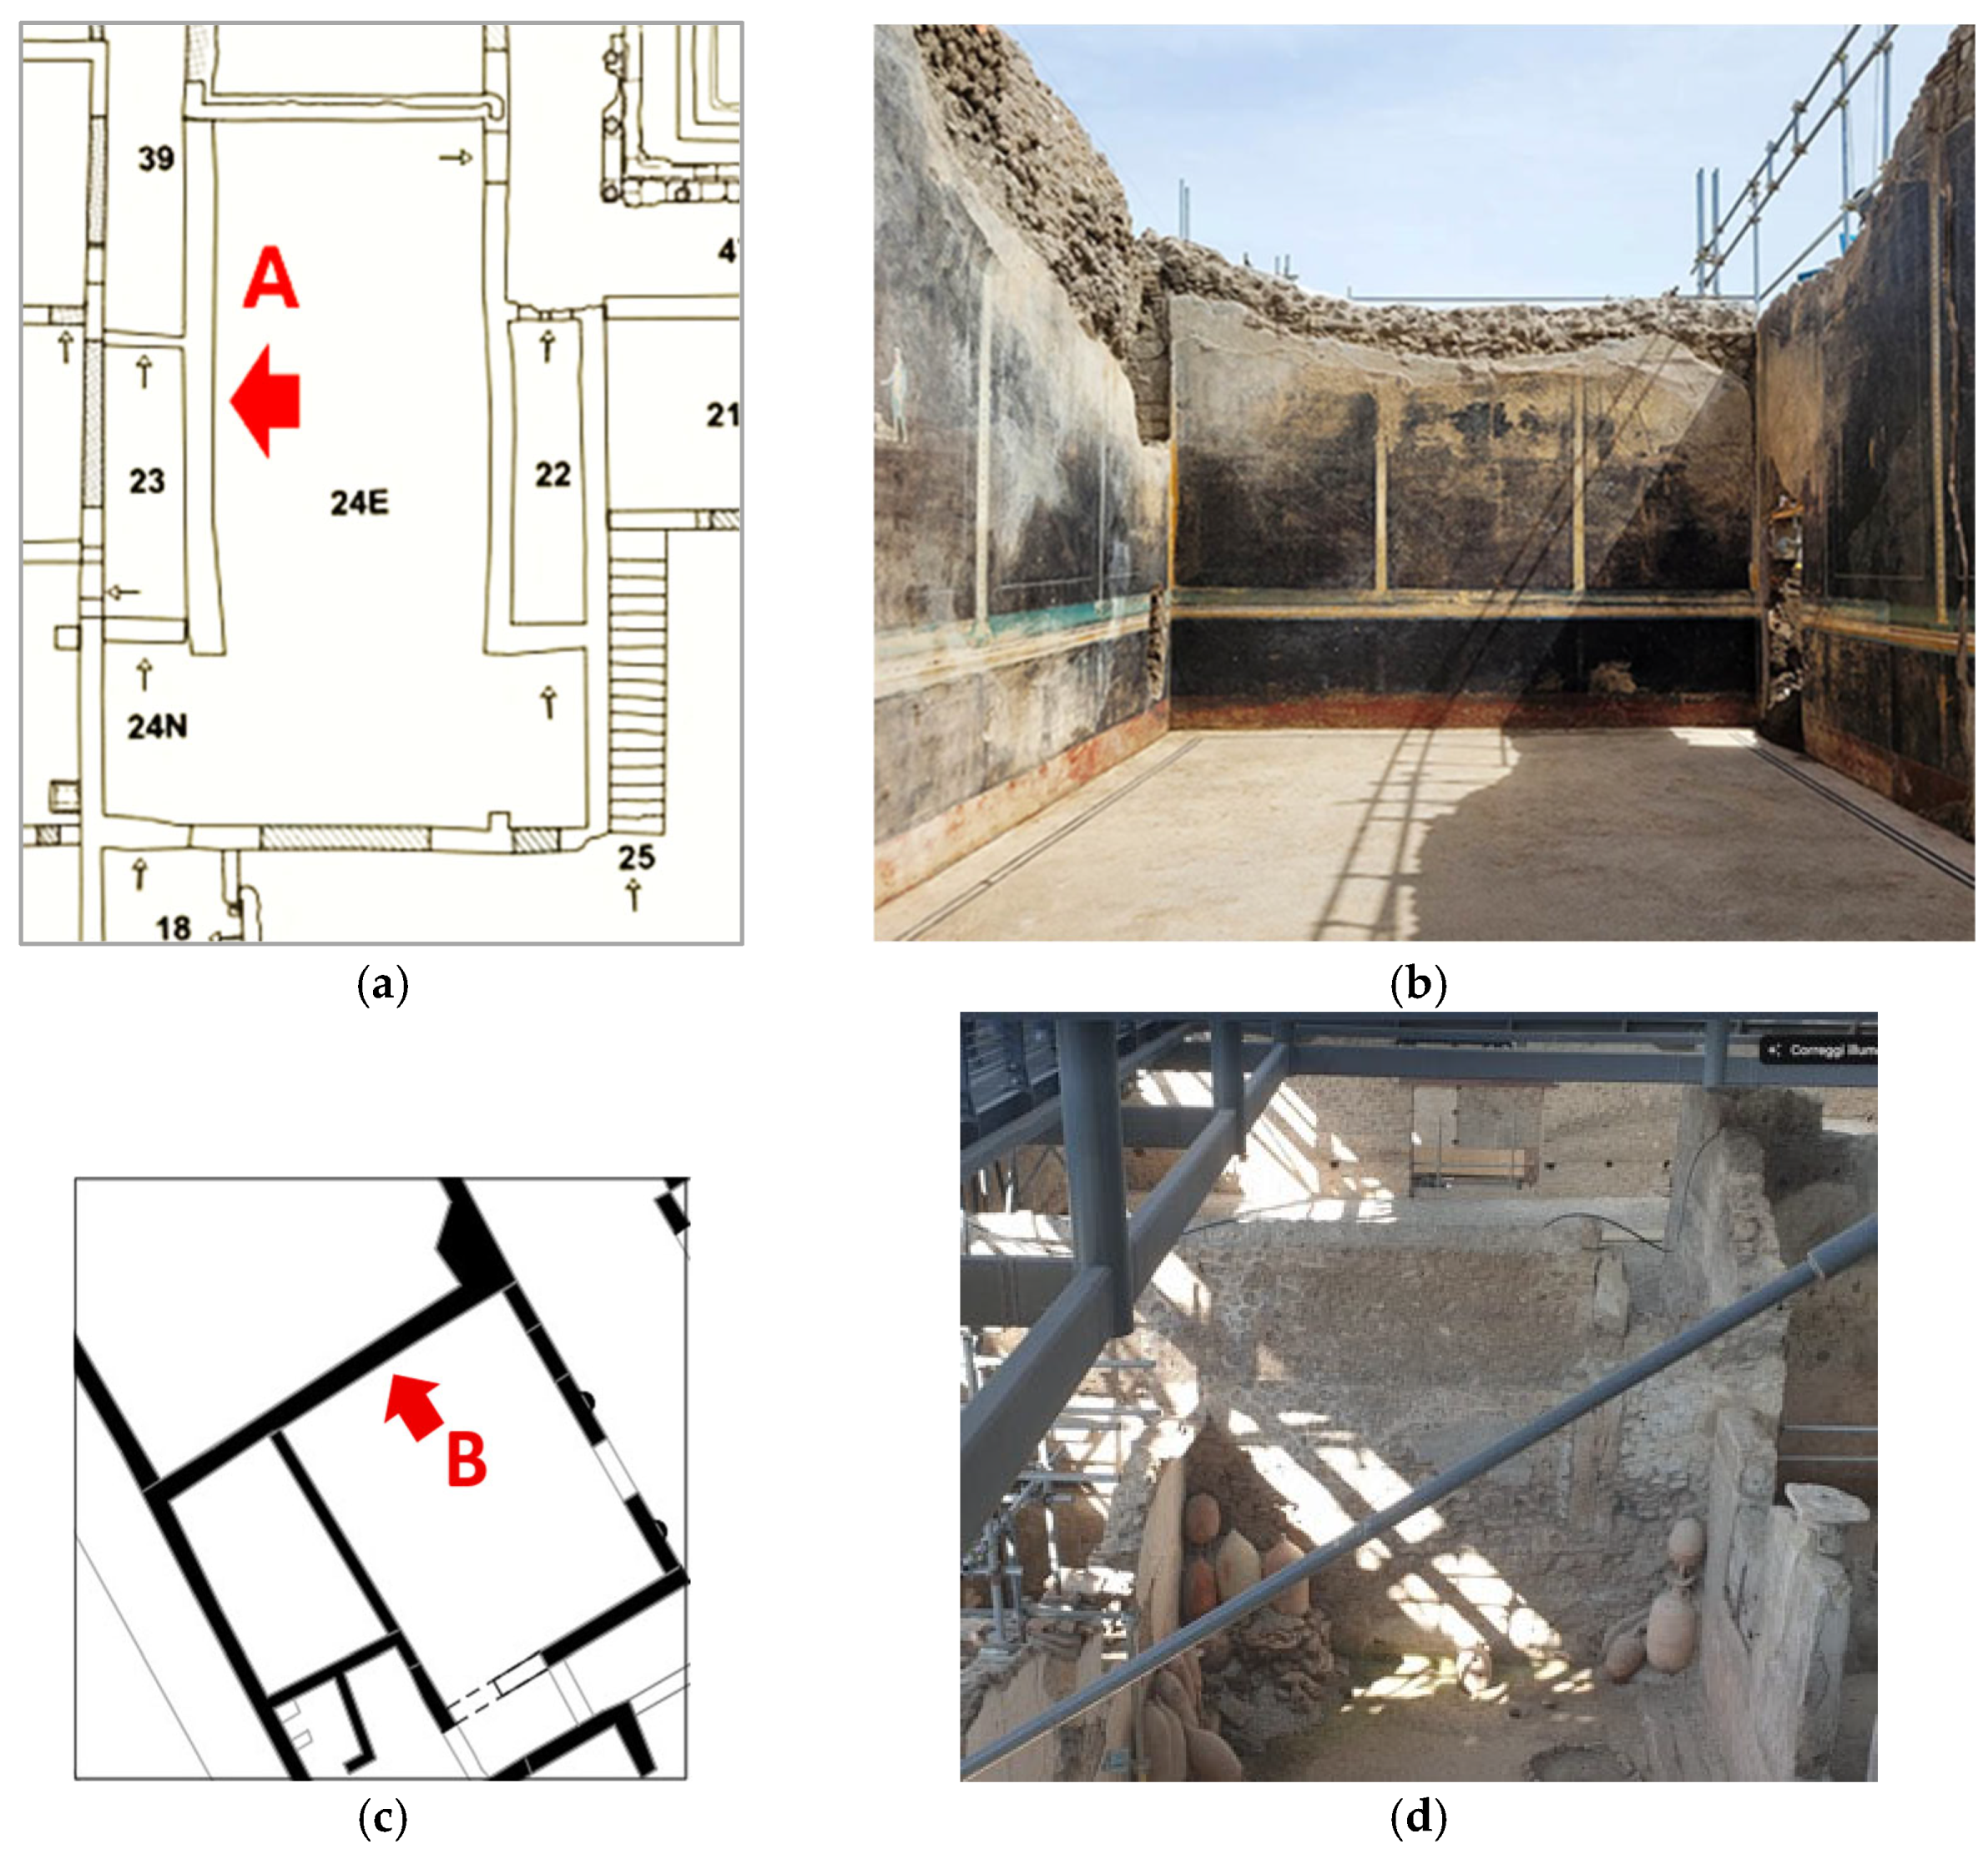
The first condition applies to Wall A, pointed by a red arrow in
Figure 8a, i.e., the longitudinal wall of the “Black Salon”, which has been brought to light by a recent excavation campaign in the Insula 10 of Regio IX (
Figure 8b) and is characterised by evident overturning mechanisms of some portions.
For the second condition, three wall cases, pointed by red arrows in the plan views in
Figure 8, are presented:
- (a)
Wall B in the Insula 12 of Regio IX (
Figure 8c,d), representative of ‘poor’ wall connections.
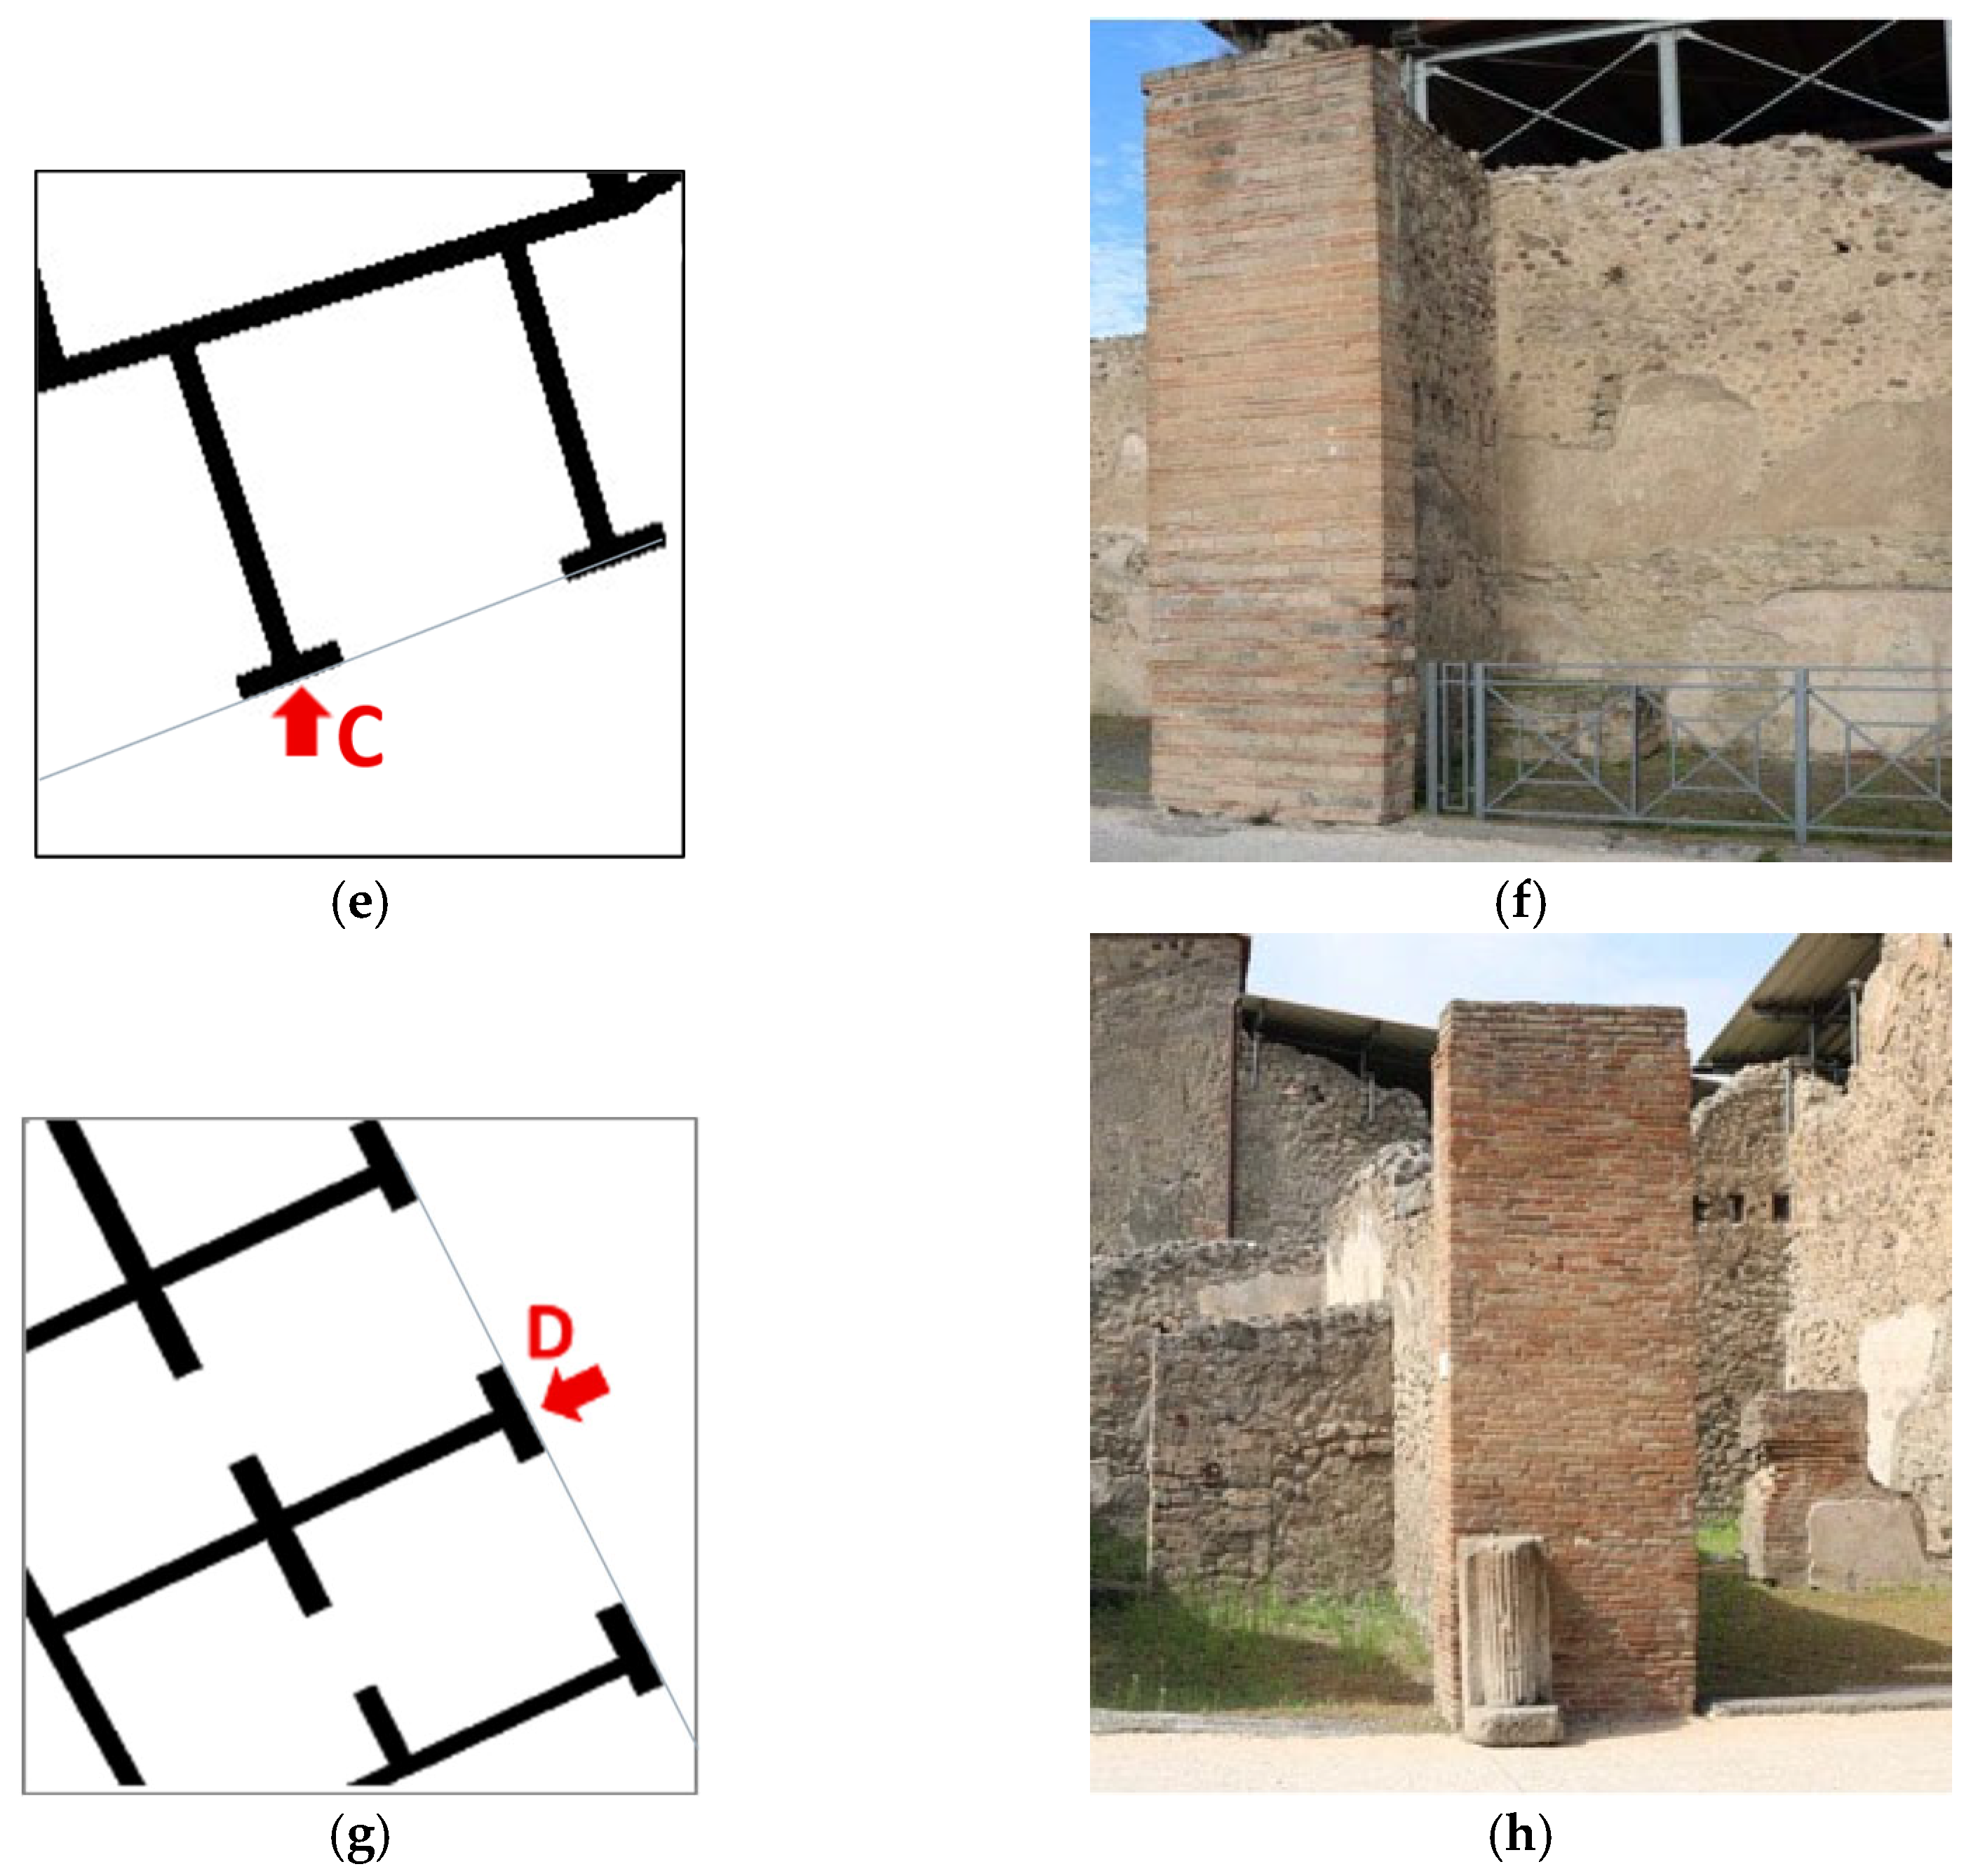
- (b)
Wall C in the Insula 1 of Regio VII (
Figure 8e,f), corresponding to ‘good’ connections.
- (c)
Wall D in the Insula 8 of Regio VI (
Figure 8g,h), illustrating the case of ‘intermediate’ connections.
4.1. Wall A of the “Black Salon”: Insula 10 of Regio IX
The “Black Salon” is a wide room, approximately 15 by 6 m, brought to light by a recent excavation campaign started in 2023 in Insula 10 of Regio IX to improve the safety of the fronts and the hydrogeological condition of the zone. The room holds a significant cultural value, particularly for its unique frescoes made on a black background and inspired by the Trojan War, which adorn the longitudinal walls [
27].
The analysis focused on the longitudinal wall, labelled A in
Figure 8a, which can be considered to fall within the E typology, according to the morphological classification presented in
Table 1. The observation of its restraining conditions (second level of the classification) shows that one end is free for a height of about 2.9 m from the top due to a partial collapse of the terminal portion (
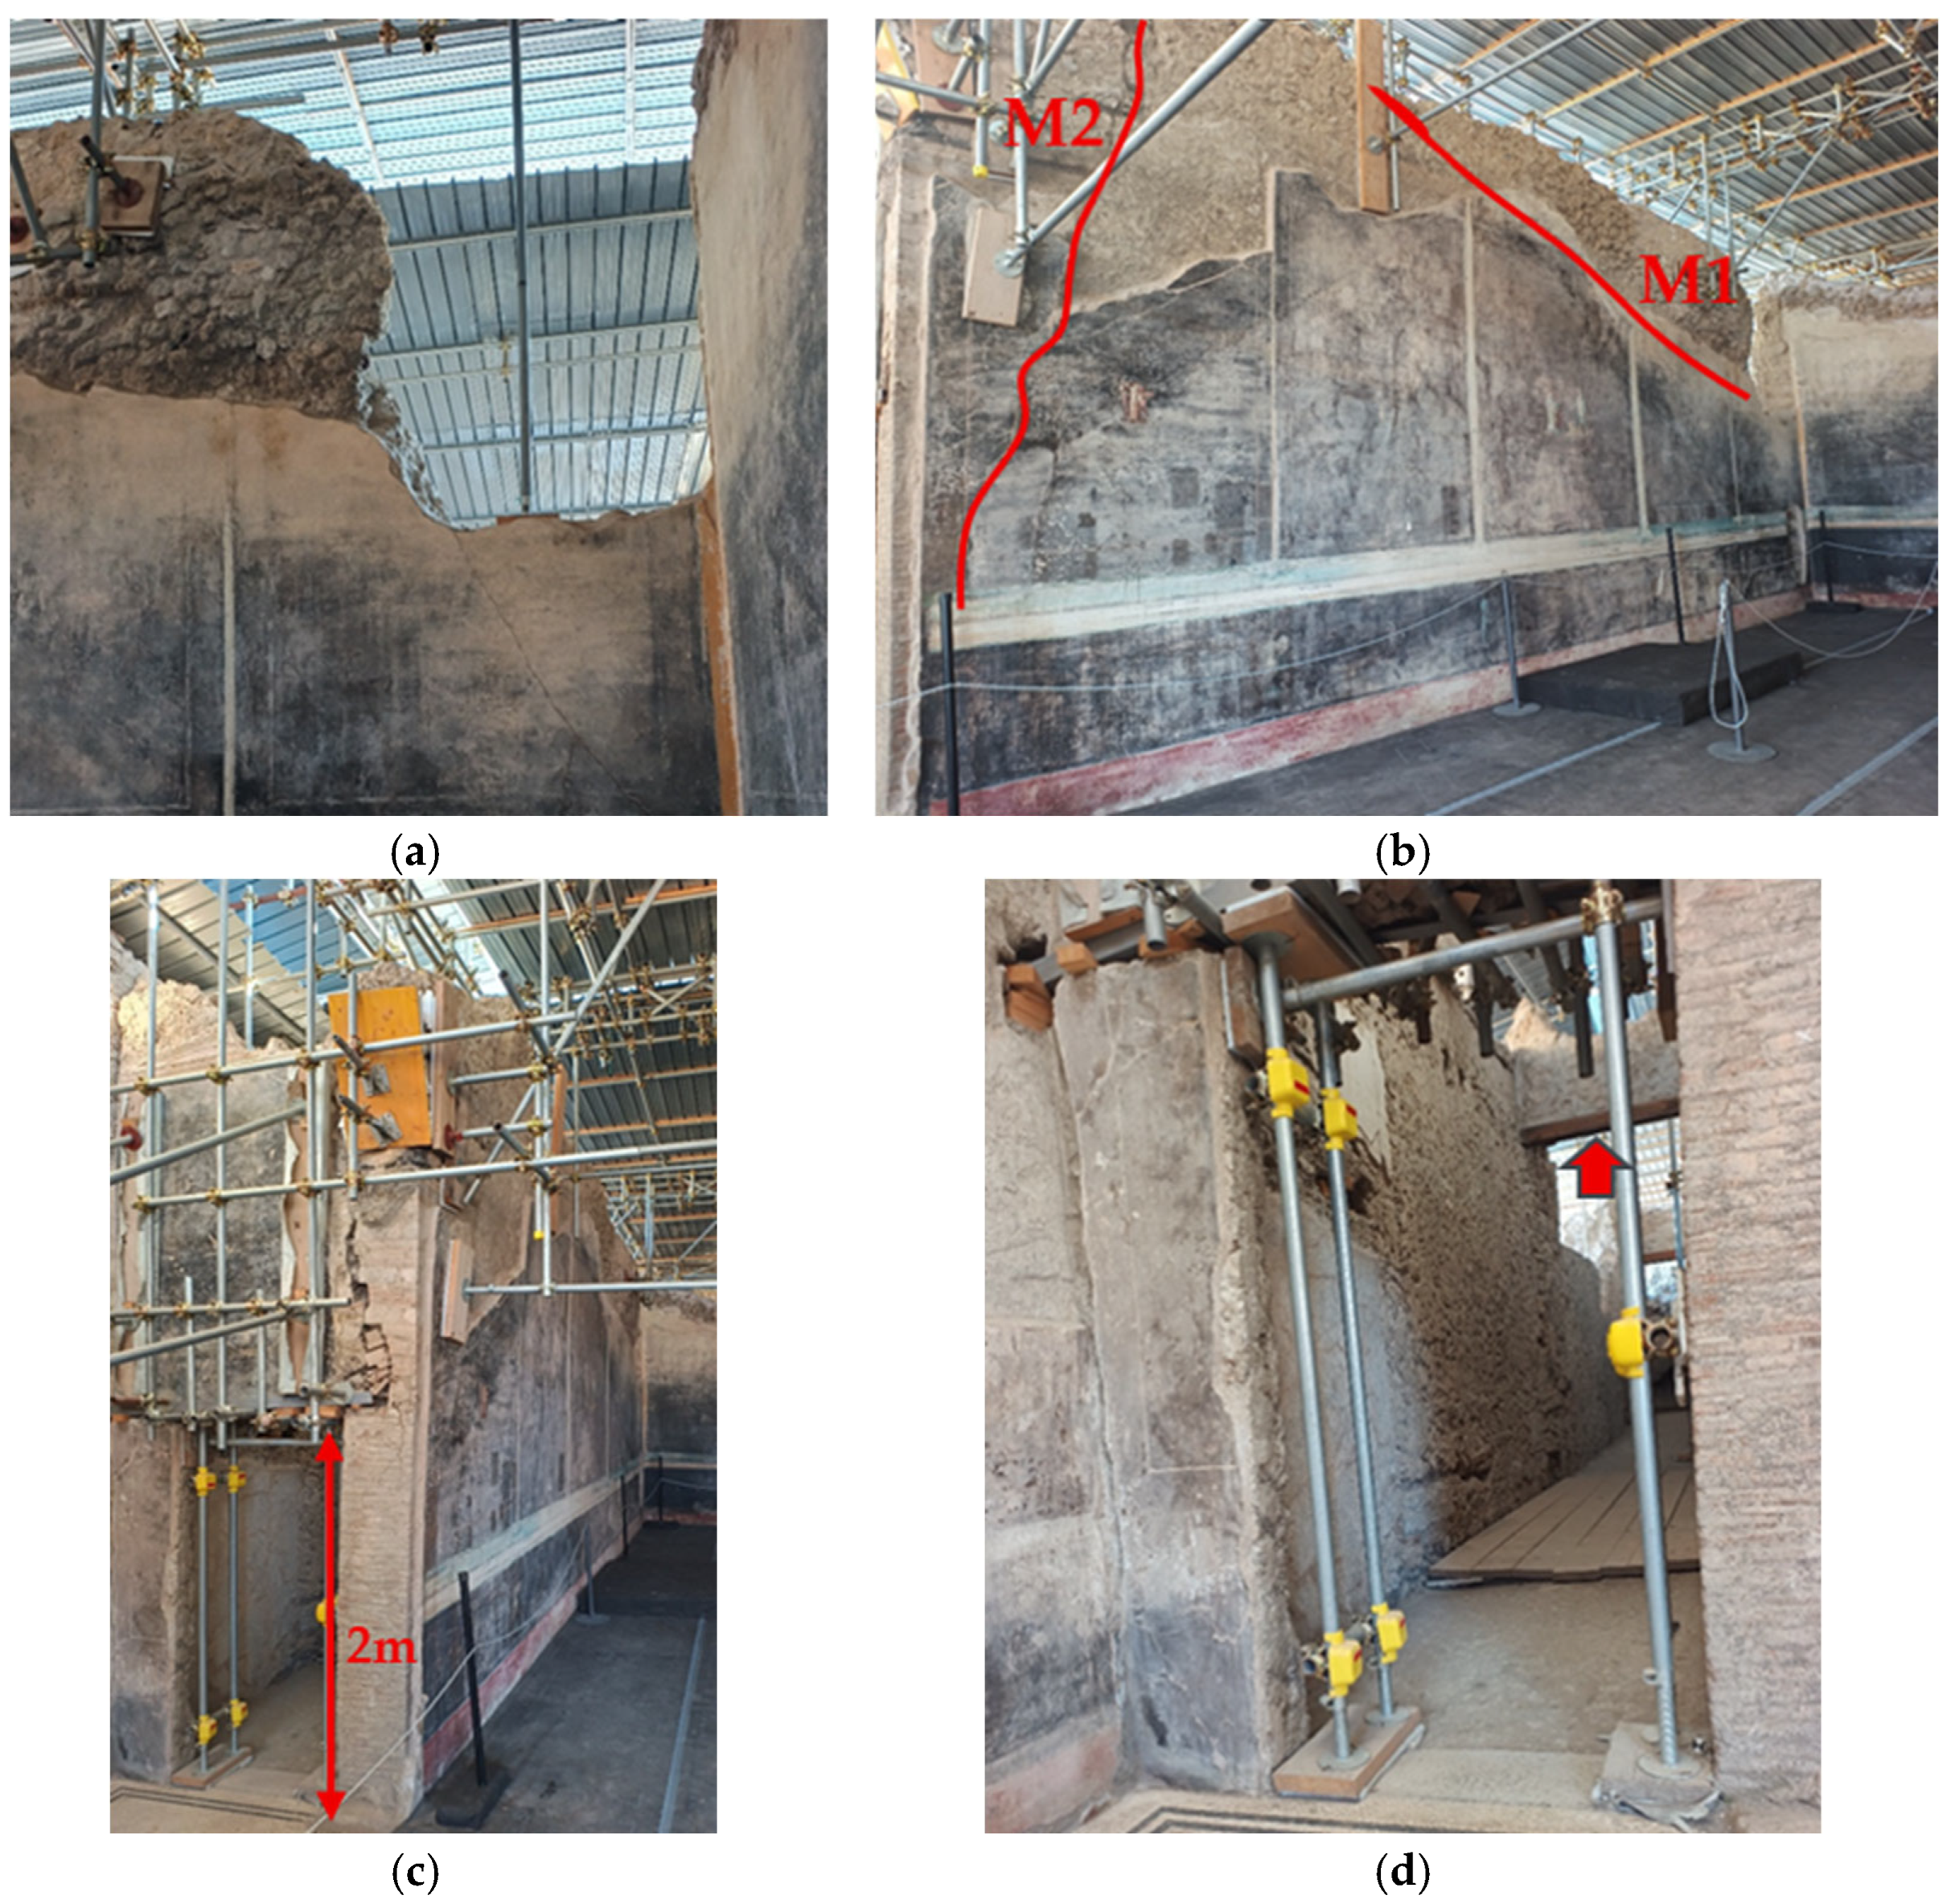
Figure 9a), which disconnected the wall from the orthogonal one; this collapse highlights that no interlocking is present between these two orthogonal walls. At the opposite end, the transverse connection is still weak, since a vertical crack separates Wall A from the adjacent transverse wall, which consists solely of the spandrel over an opening. During the excavation, this spandrel required support since the wooden lintel was likely burned during the eruption (
Figure 9c). Finally, a further traverse connection is visible from the corridor behind the room, as indicated by a red arrow in
Figure 9d. Based on the observation of the actual damage, Wall A exhibits two different ongoing failure mechanisms, M1 and M2, as identified by the crack patterns highlighted with red lines in
Figure 9b.
4.1.1. Mechanism M1 of Wall A
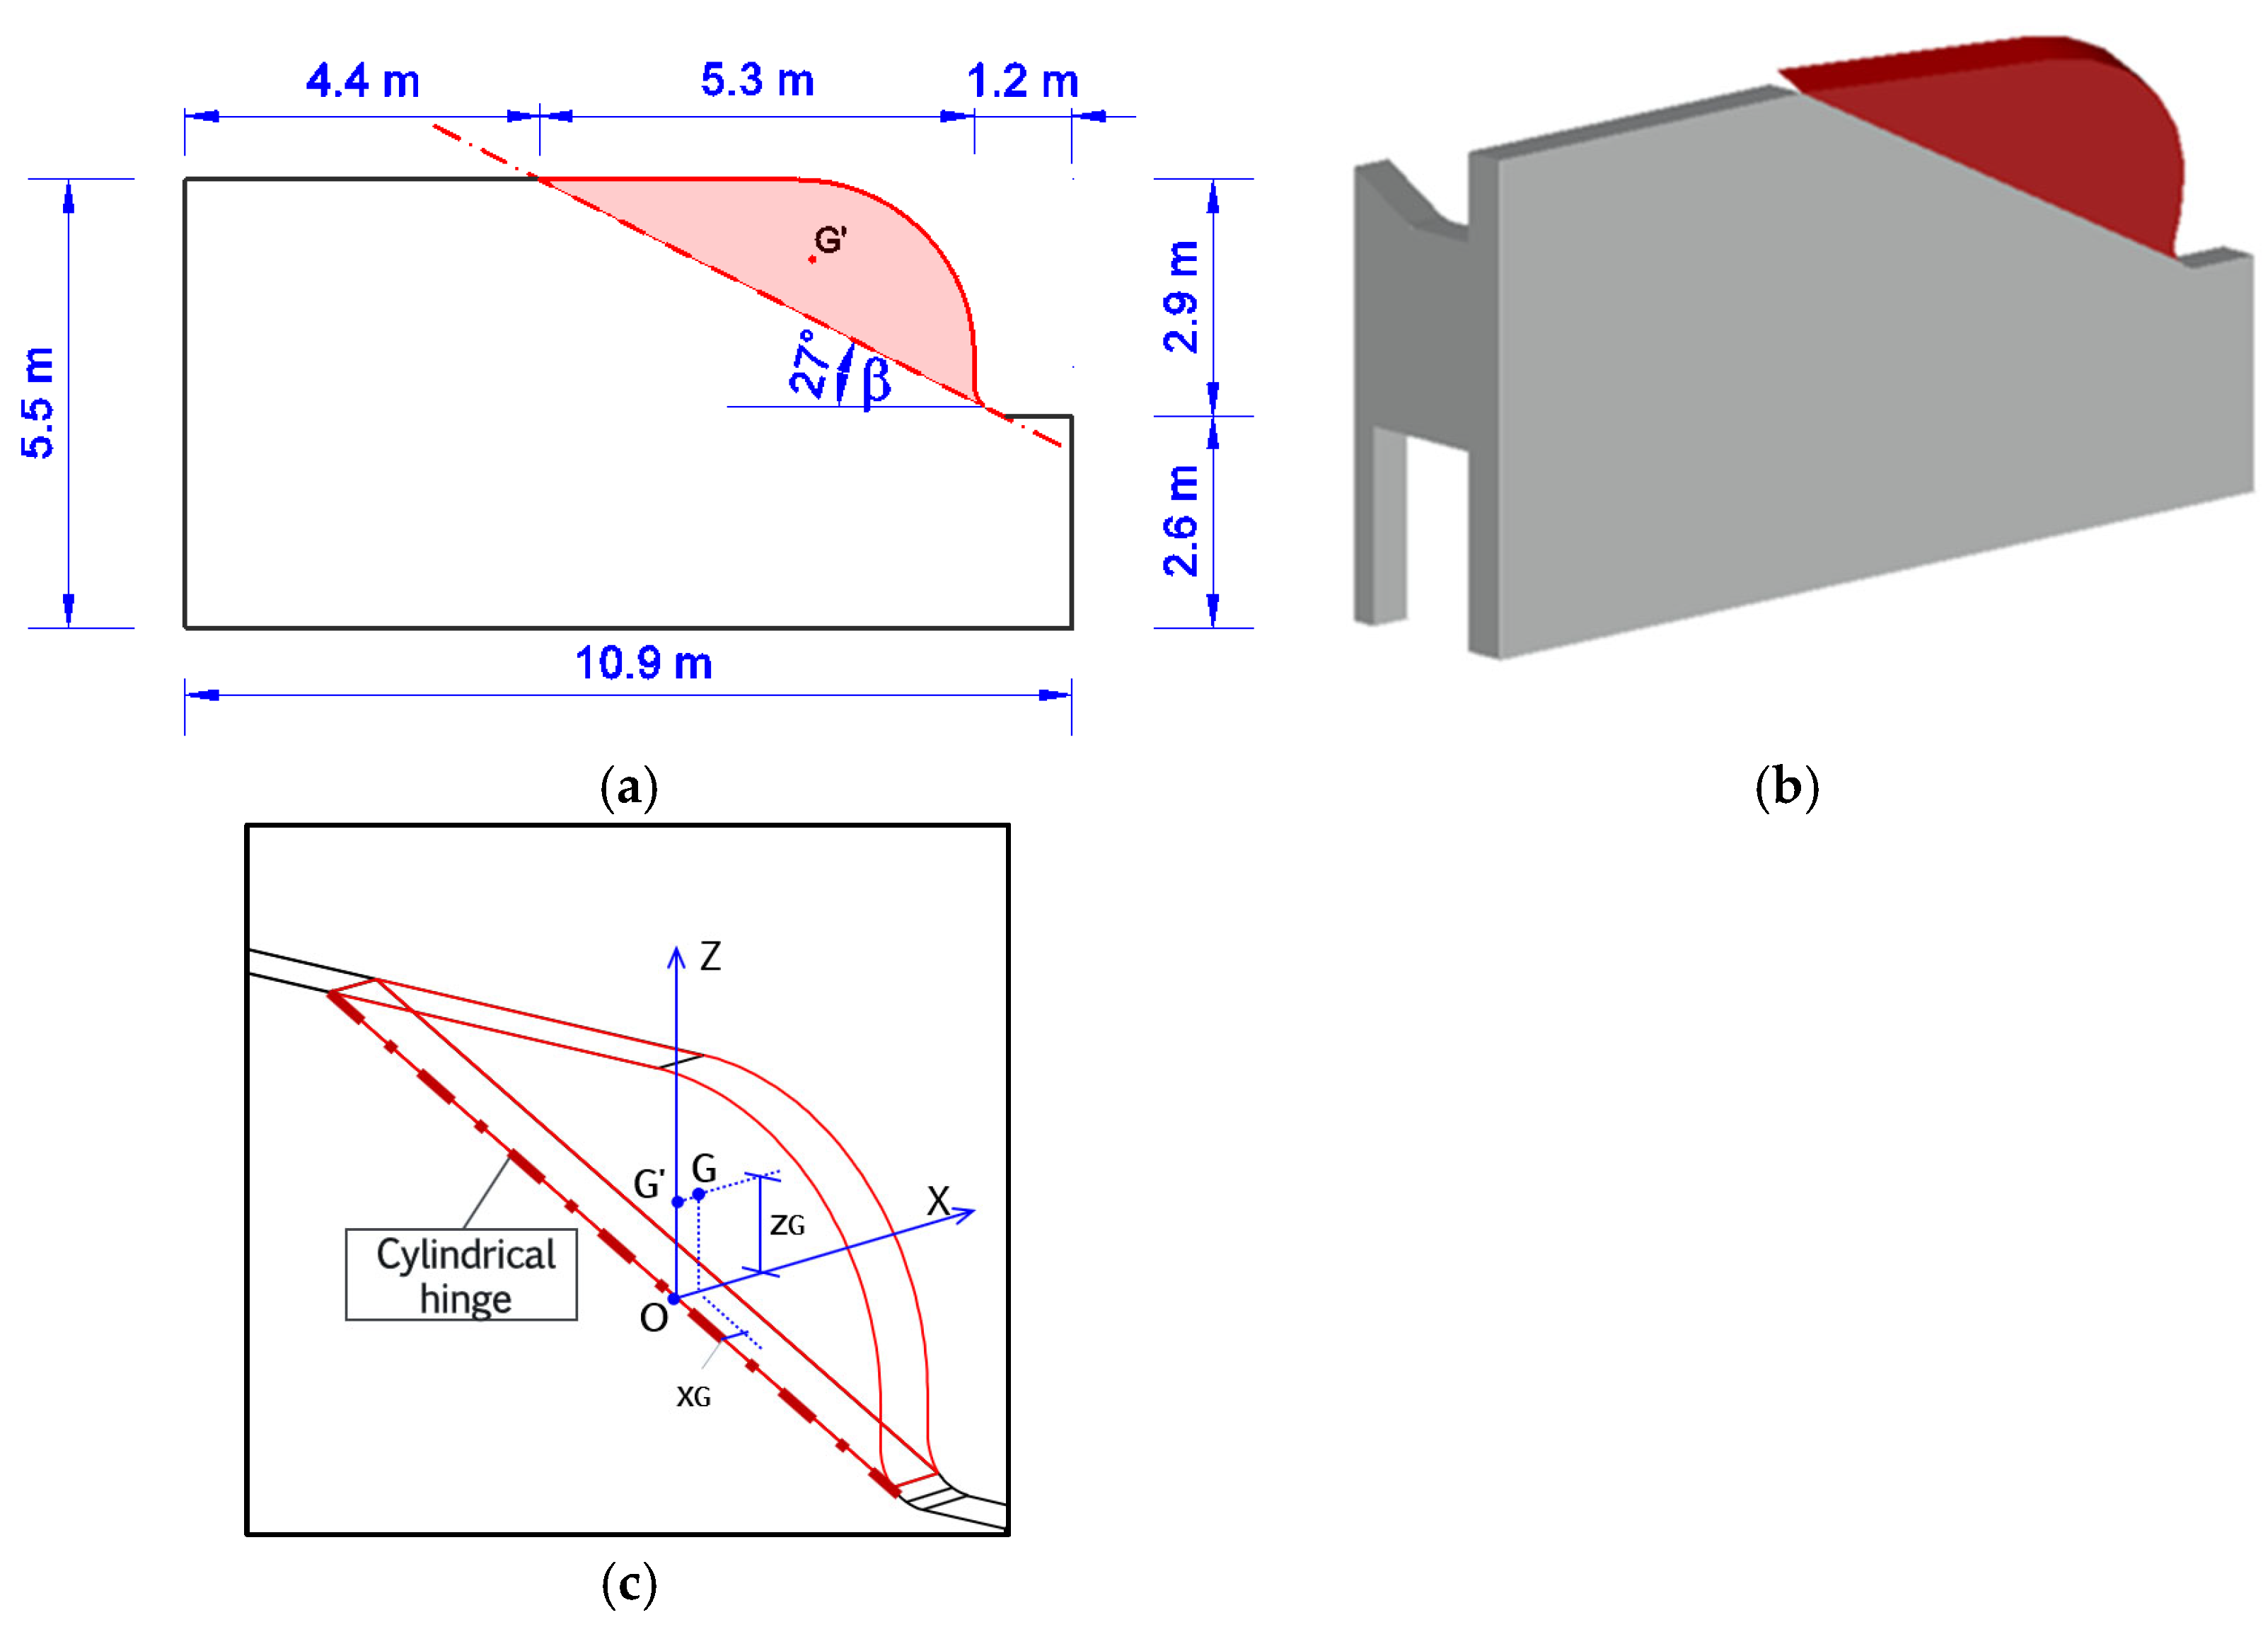
Mechanism M1 is characterised by a main inclined crack, which starts from the top of the wall, at about the middle length of the wall, and goes down for about 2.9 m, defining a pseudo-triangular macro-block, with a free vertical side due to the collapse that occurred at the end of the wall (see the sketches of the mechanism in
Figure 10, where the macro-block is shown in red). However, its longitudinal extension is limited by a transverse connection along the wall (
Figure 9b). Based on the crack pattern and restraining conditions, mechanism M1 can be classified as a simple rocking failure along a cylindrical hinge, which coincides with the inclined crack, and it is represented in
Figure 10a,c as a dashed line. The related load multiplier α
M1 can be evaluated through the Heyman model by using Equation (1). The values of the required geometrical parameters are reported in
Table 3 and depicted in
Figure 10c. Note that given the non-regular geometry of the macro-block,
zG is calculated from the 3D graphical model, whereas
xG is half the thickness of the wall.
Based on such parameters, the load multiplier related to mechanism M1 is:
4.1.2. Mechanism M2 of Wall A
The opposite end of Wall A also shows a quite clear crack pattern, defining a trapezoidal macro-block (shown in red in
Figure 9). The vertical side of the macro-block aligns with the head of the wall and is partially free for a height of approximately 2 m due to an opening on the transverse wall (see
Figure 9c). The top portion was connected to a transverse spandrel over the opening, but now a vertical crack develops along the connection, and the spandrel is currently shored up (
Figure 9c,d).
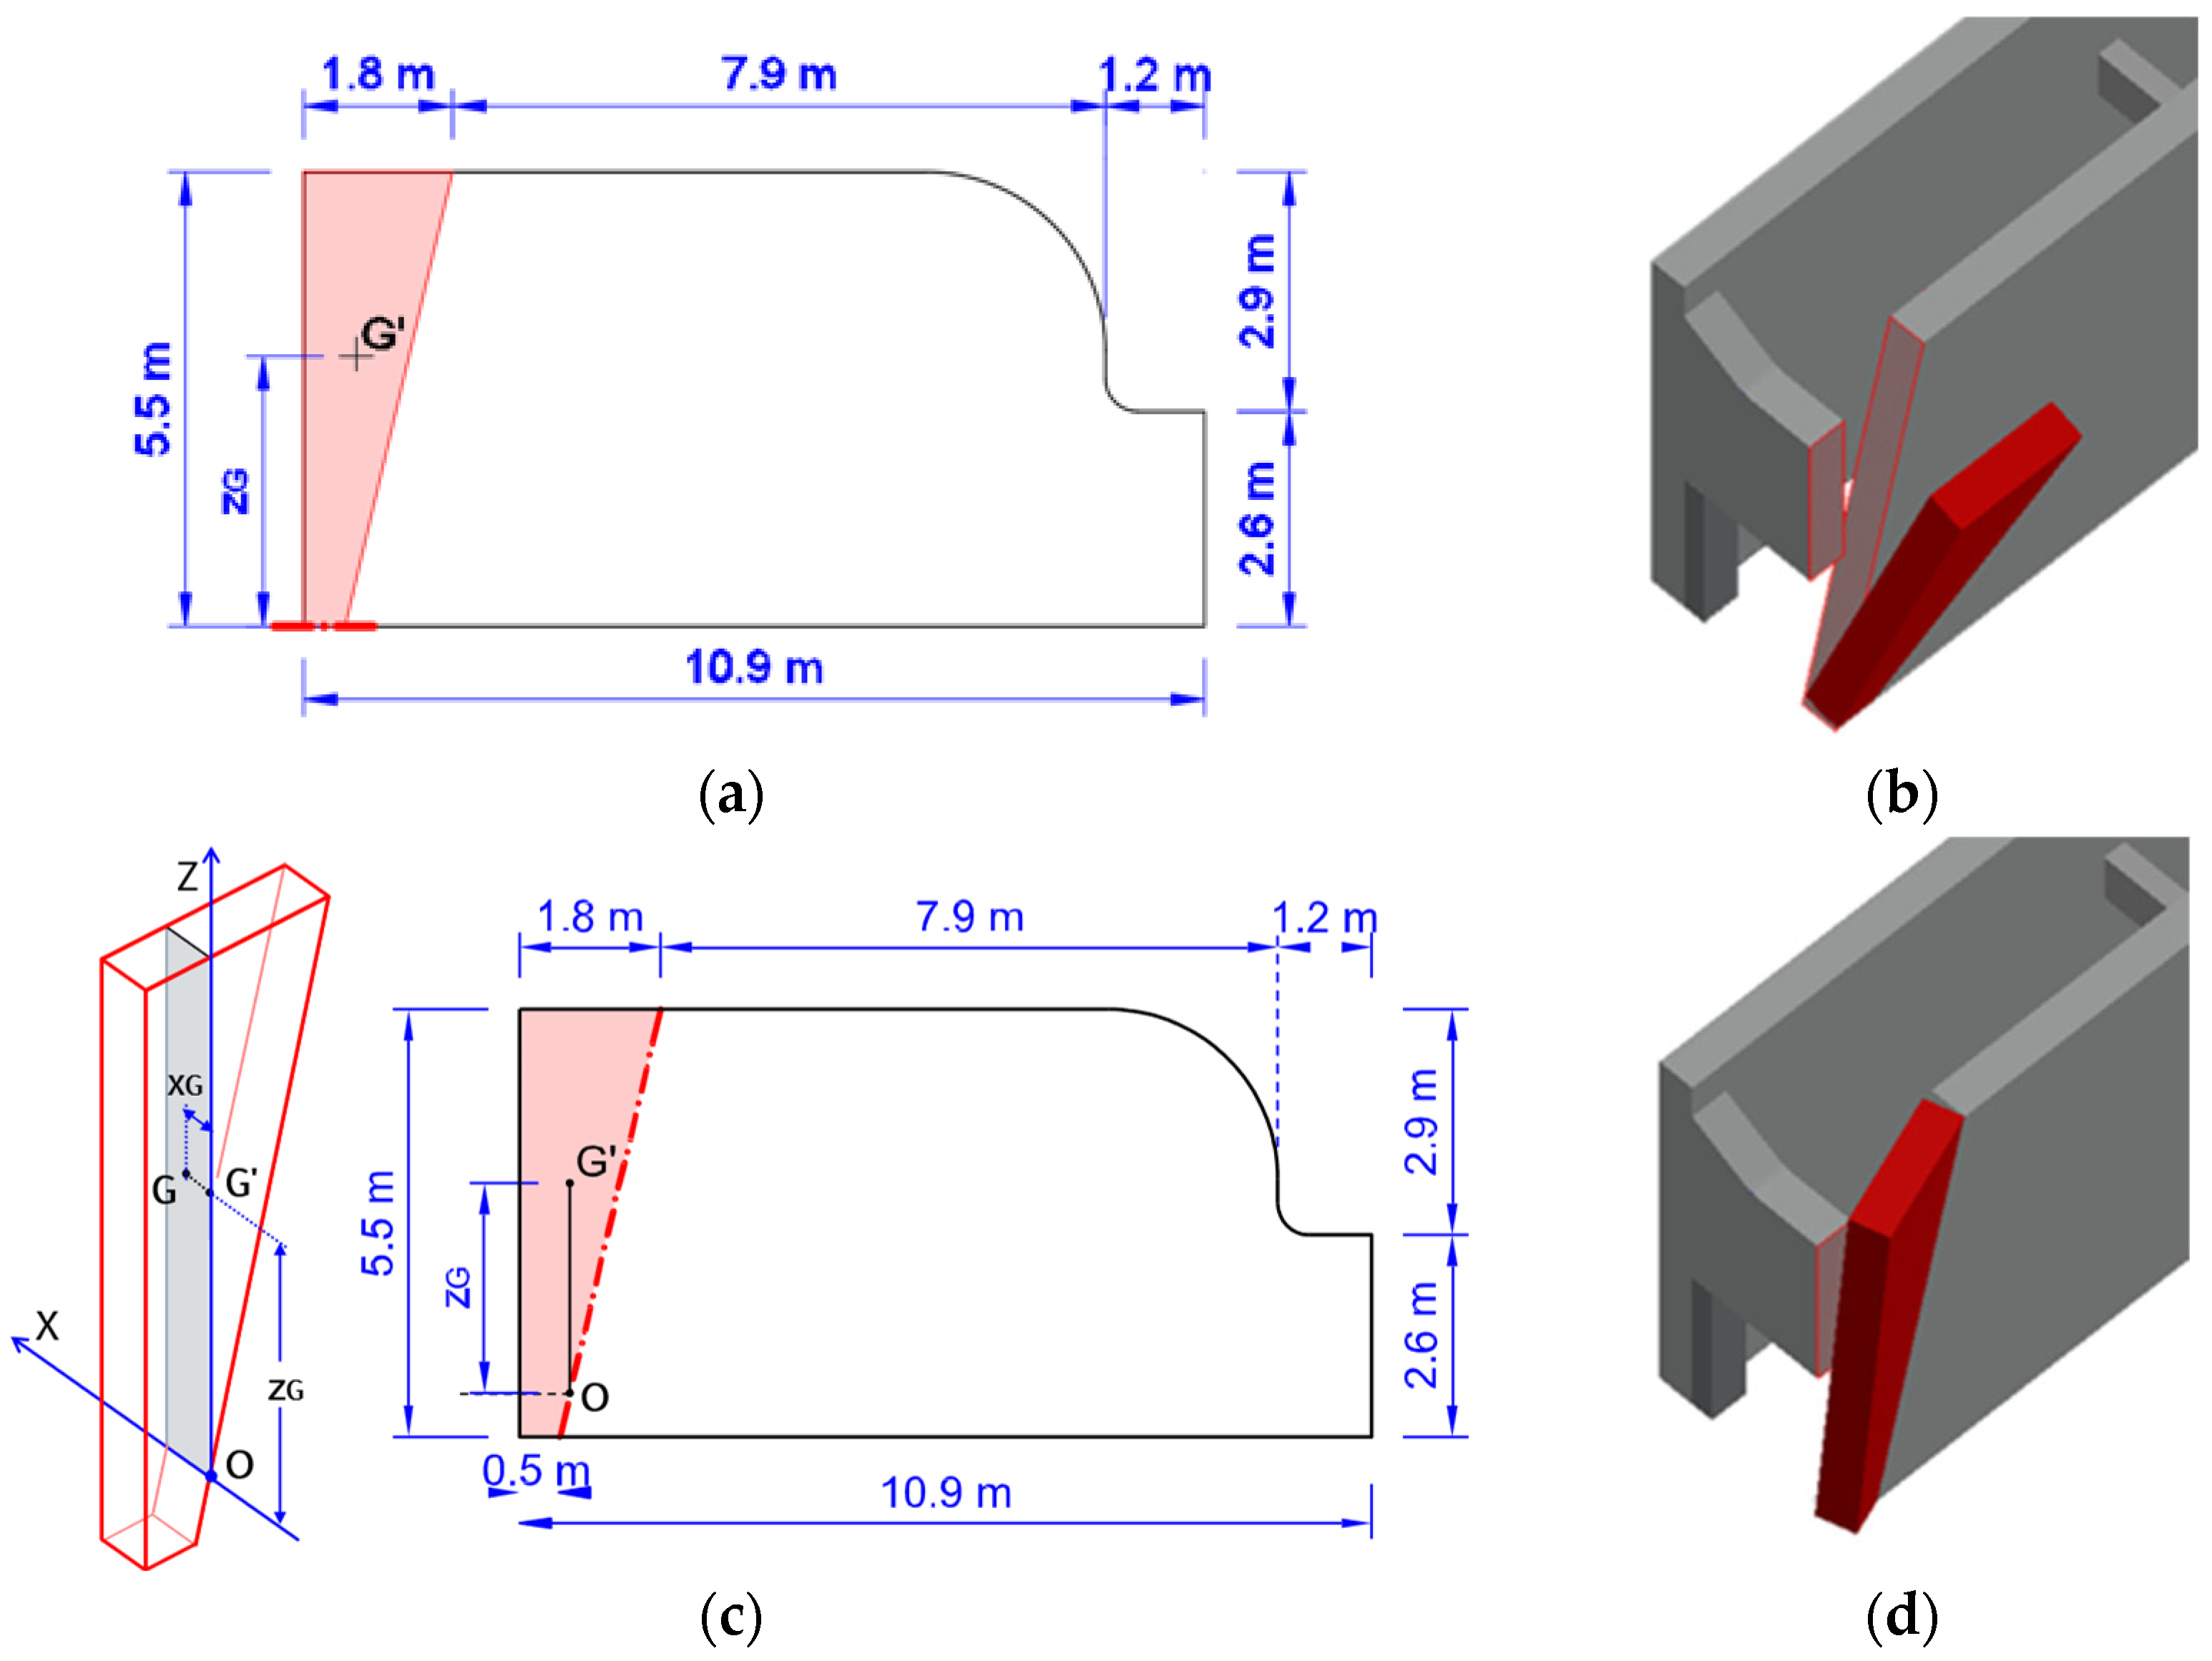
Based on such considerations, mechanism M2 can be classified as a simple rocking mechanism. However, it is not straightforward to identify the actual rotational hinge, since it should be along a horizontal crack at the base, for the variant M2.1, represented as a red dashed line in
Figure 11a,b, or along the crack inclined by β for the variant M2.2, represented in the same way in
Figure 11c,d. Both variants must be considered to identify which one provides the minimum multiplier. Moreover, since both belong to the class of simple rocking mechanisms, they can be analysed using the Heyman model, based on Equation (1).
Table 4 shows the values of the geometrical parameters required by Equation (1) for both variants.
Hence, based on Equation (1) and
Table 4, for mechanism M2.1 (
Figure 11a,b), the load multiplier α
M2.1 is:
It is worth pointing out that it was also verified that the assumed position for the horizontal hinge at the base provides the lowest value of the multiplier compared to a different position along the height of the macro-block.
For mechanism M2.2 (
Figure 11c,d), the load multiplier is still calculated through Equation (1), with the values of the geometrical parameters in
Table 4, as:
Hence, with αM2.1 < αM2.2, the variant M2.1 is the most likely for mechanism M2 of Wall A; thus, the minimum multiplier for mechanism M2 is α0,M2 = αM2.1.
4.1.3. Assessment of the Acceleration Capacity of Wall A
For Wall A, the acceleration capacities related to mechanisms M1 and M2 can be evaluated through Equation (6), assuming a confidence factor CF = 1.35 and
e* = 1. Based on the minimum load multipliers α
0,M1 = 0.343 and α
0,M2 = 0.091, they are, respectively:
The low value of acceleration capacity related to mechanism M2 shows that it represents a priority in planning interventions to mitigate the vulnerability of Wall A.
4.2. Wall B: Insula 12 of Regio IX
Wall B, as shown in
Figure 8c,d, has no evident crack at the moment and, thus, was chosen to illustrate the application of the proposed methodology when the most likely failure mechanism must be predicted. Indeed, in this case, it is necessary to formulate some hypotheses on the potential crack patterns considering the geometry of the wall, its connections, and its weakness.
From the morphological point of view, the wall seems to belong to the I typology, according to the first level of classification of the proposed methodology (
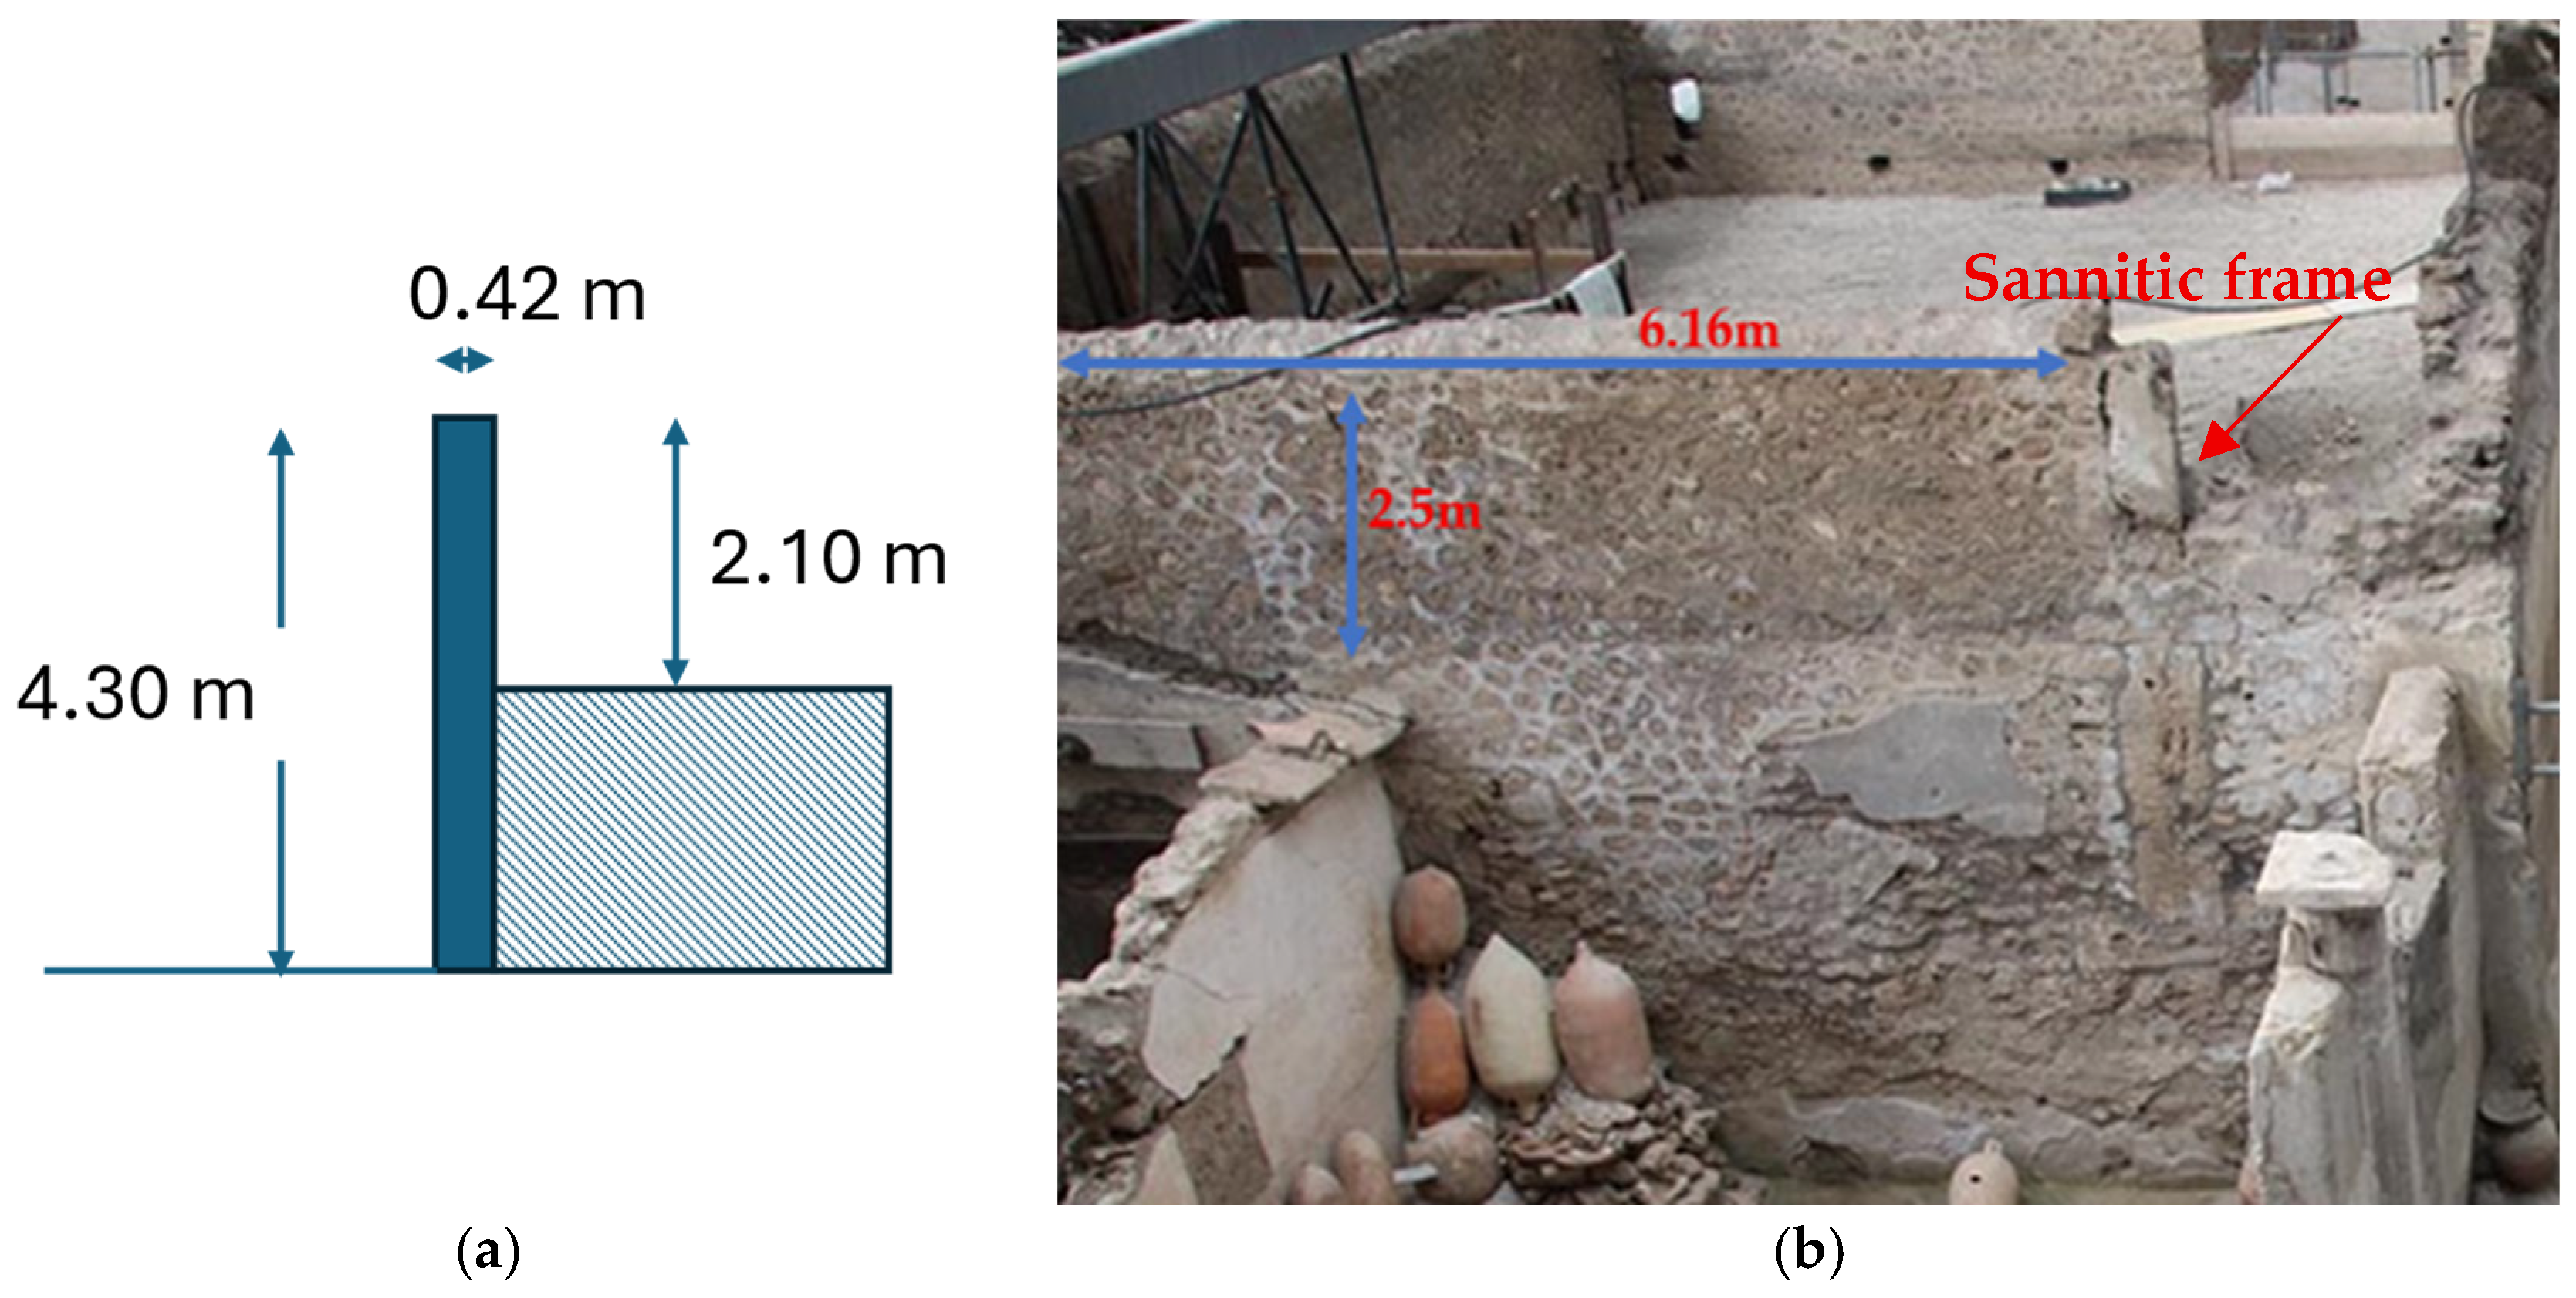
Table 1), though the intersecting walls have different heights. Indeed, Wall B divides the House of the Painters at Work, on the north side, from the House of the Second Cenaculum, on the south side. At the time of the present study, the ground level has a difference of about 2.2 m between the two sides, resulting in a free height of the wall of about 2.10 m on the north side and about 4.3 m on the other (see the sketch of the vertical section in
Figure 12a). The wall was built with the Roman technique called
opus incertum and also shows, near the right end in
Figure 12b, the use of a sort of frame made of alternating big vertical and horizontal calcareous stones, according to a Sannitic building technique [
28]. Indeed, such stones represent a constructive discontinuity and a sign of weakness. Focusing on its connections and restraining conditions, Wall B is connected to three transverse walls on the south side (see the plan in
Figure 8c): two walls at the ends, and one intermediate, which is quite a bit lower than Wall B; thus, the upper portion of Wall B, as high about 2.5 m, has no transverse restrain for a length exceeding 6 m (i.e., 6.16 m as shown in
Figure 12b).
Based on such considerations, two different OOP failure mechanisms are possible for Wall B, involving two distinct portions, as described in the following. For both, the Heyman model was used, assuming the assumption of poor-quality connections.
4.2.1. Mechanism M1 of Wall B
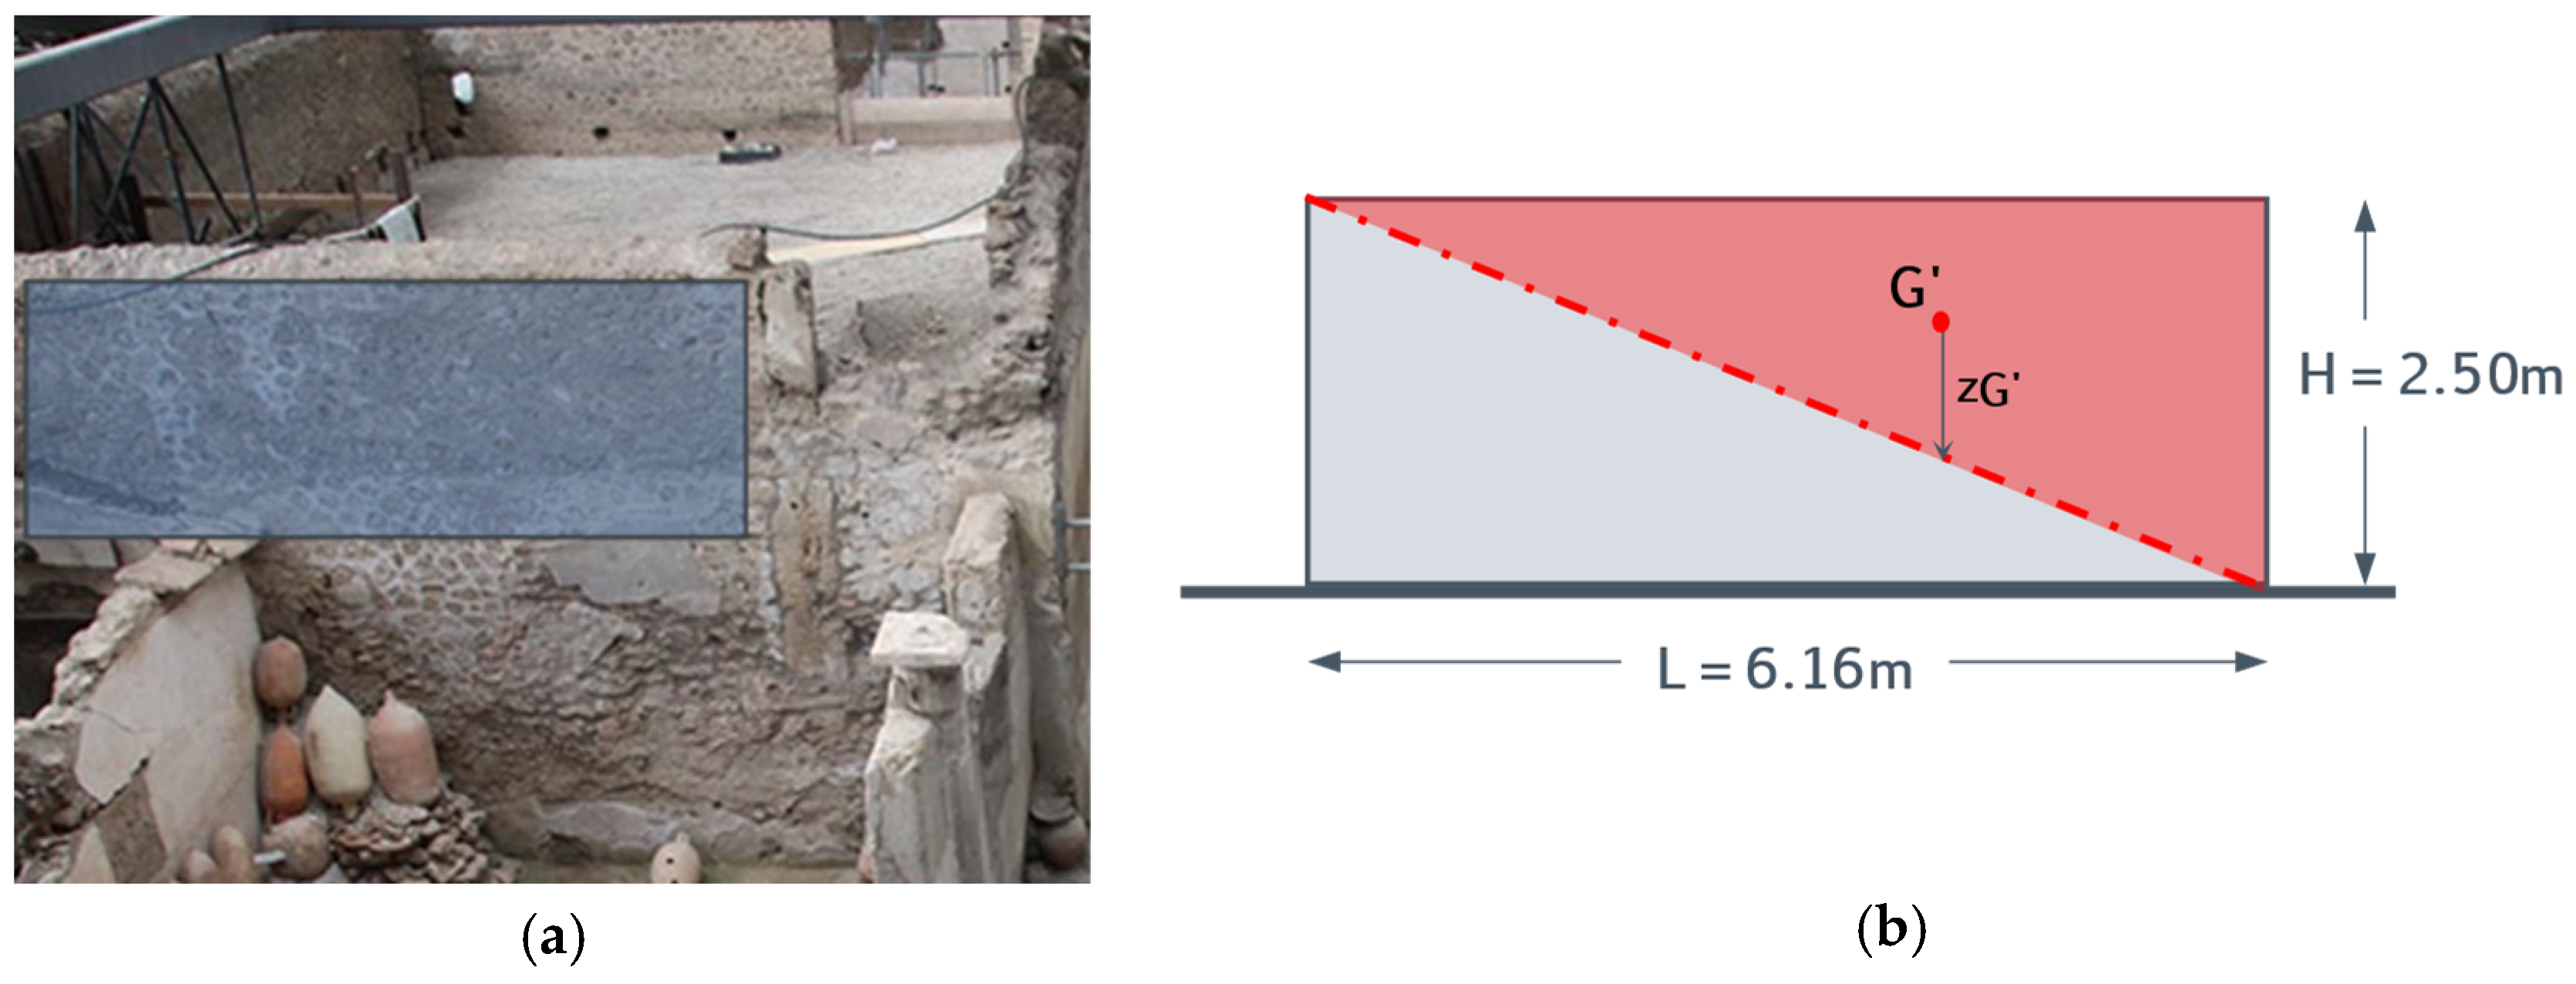
The first potentially vulnerable portion, low and wide (2.5 m by 6.16 m), is the upper part of the wall, highlighted in blue in
Figure 13a. Its left end can be considered restrained along the height by the existing transverse wall, whereas the right end can be regarded as free due to the presence of the mentioned constructive discontinuity (
Figure 13a). Thus, a failure mechanism of non-symmetric horizontal flexure, M1, can be supposed to involve a triangular macro-block, defined by a main inclined crack which starts from the top of the restrained end and goes down to the opposite end, affecting the free length of the wall. The macro-block is supposed to rotate along an inclined cylindrical hinge coincident with the main crack, shown in the sketch of
Figure 13b as a dashed line. Thus, the mechanism can be assimilated to a simple rocking around an inclined hinge, and the Heyman model can be employed to define the load multiplier through Equation (1). The values of the geometrical parameters required by Equation (1) are reported in
Table 5. Note that in Equation (1), z
G coincides with its proiection z
G’ on the front plane, shown in
Figure 13b, whereas x
G is equal to half the thickness of the wall.
Hence, the load multiplier for mechanism M1, α
M1, for Wall B is calculated as:
4.2.2. Mechanism M2 of Wall B
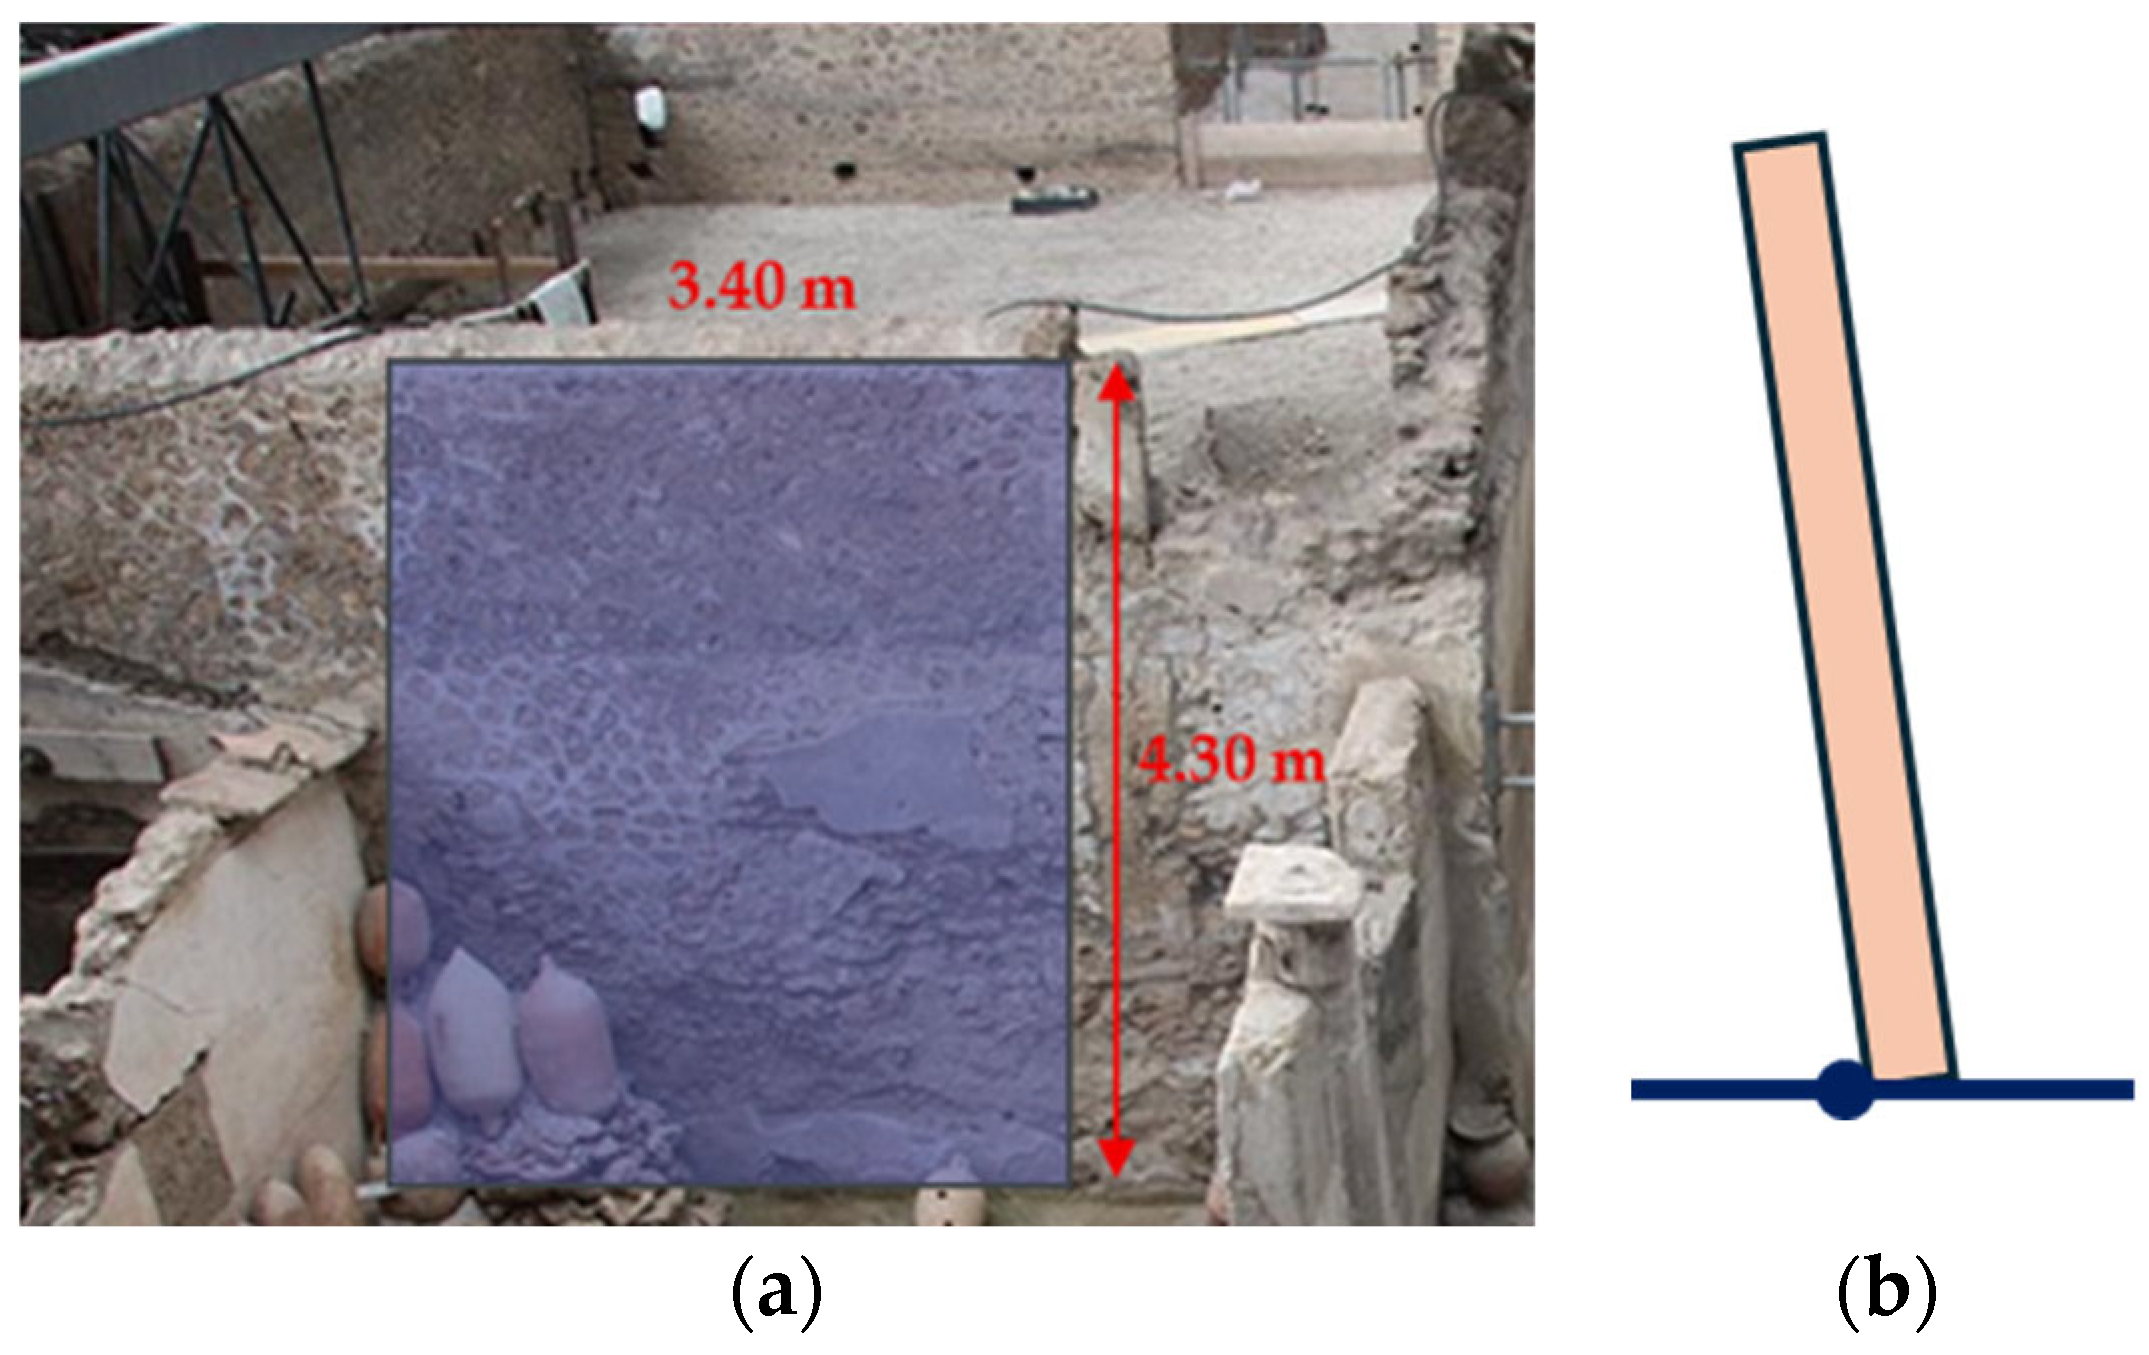
The second portion of Wall B, potentially vulnerable, is the rectangular one, highlighted in blue in
Figure 14a. It has dimensions of 4.30 m by 3.40 m and can be considered free along its vertical edges, since on the right side there is the same discontinuity already discussed for mechanism M1, while on the left side, the quite low intermediate transverse wall is not considered as a vertical restraint. Thus, a simple rocking failure mechanism, M2, is supposed to involve all of the rectangular portion, with a rotation along a horizontal cylindrical hinge at the base (
Figure 14b).
According to the Heyman model, the load multiplier α
M2 for mechanism M2 is calculated by Equation (1), accounting for the parameters in
Table 5, as:
4.2.3. Assessment of the Acceleration Capacity for Wall B
According to the previous calculation, with αM2 < αM1, the expected failure mechanism coincides with M2, and the related minimum multiplier is α0,M2 = αM2. The related acceleration capacity is a0,M2 = 0.073 g, based on Equation (6) with CF = 1.35 and e* = 1. It can be observed that this value is comparable to that related to mechanism M2 of Wall A.
4.3. Wall C: Insula 1 of Regio VII
The proposed methodology was applied here to Wall C, a Tf-shaped wall along
Via dell’Abbondanza in Insula 1 of Regio VII (
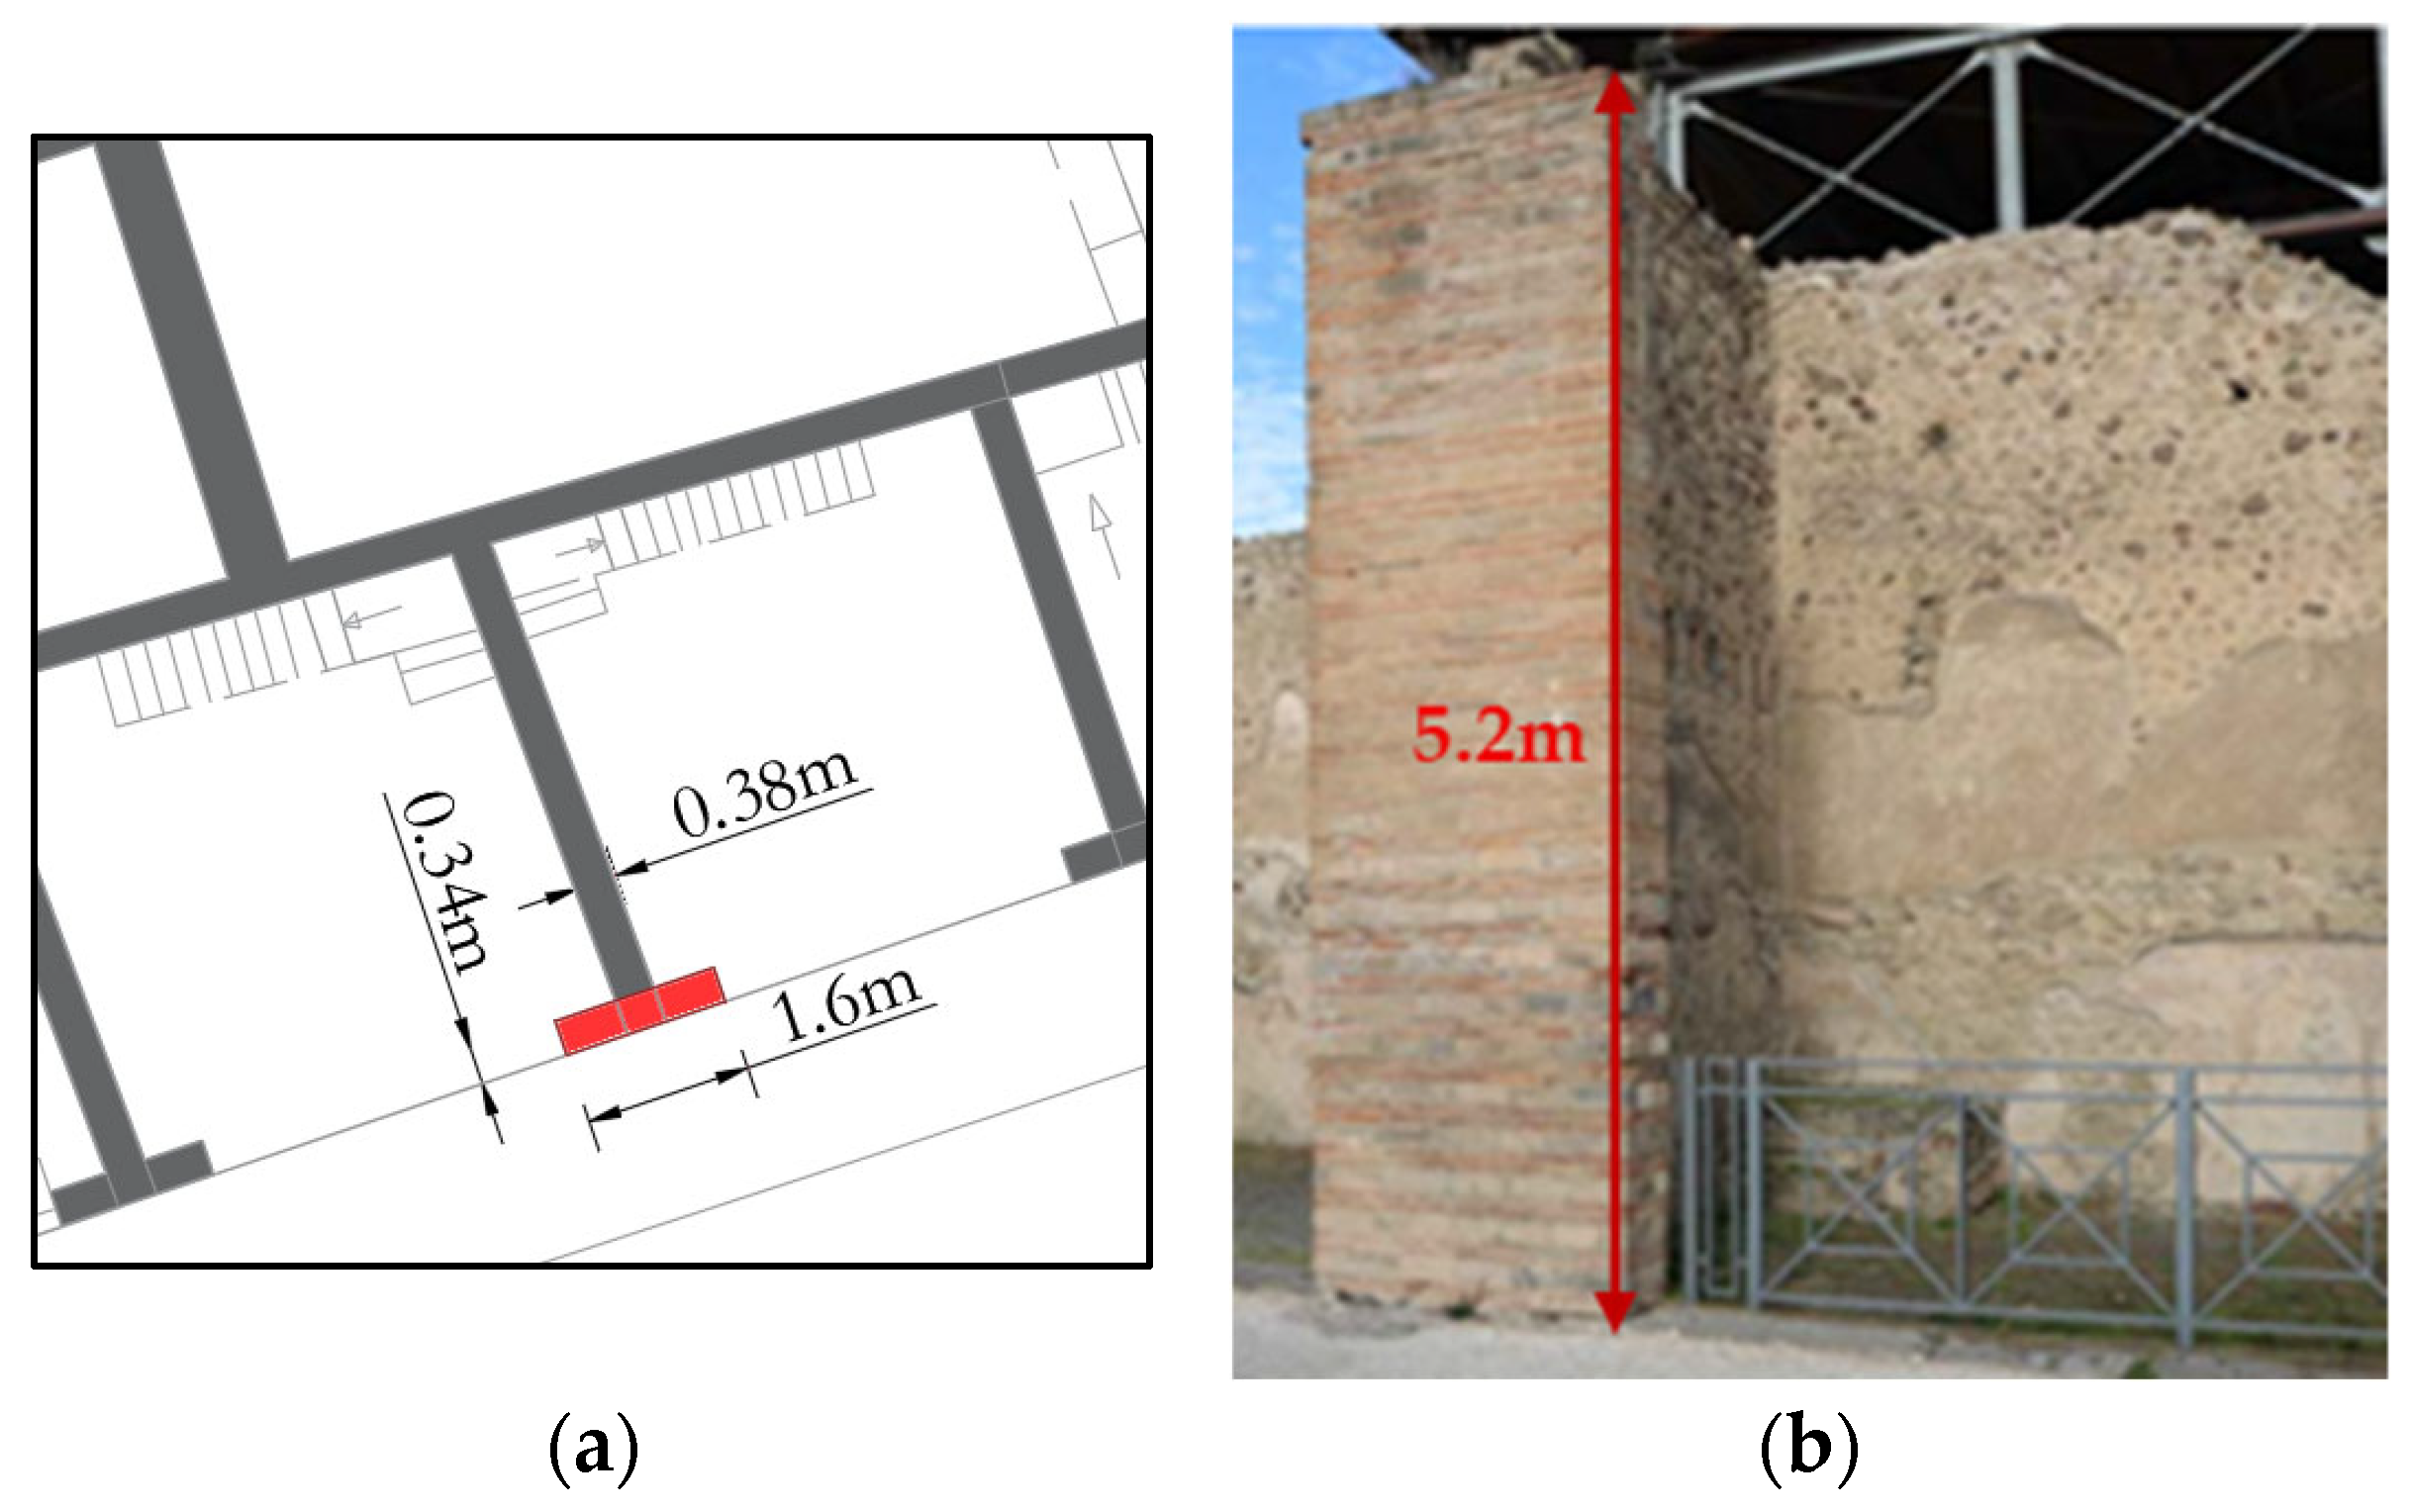
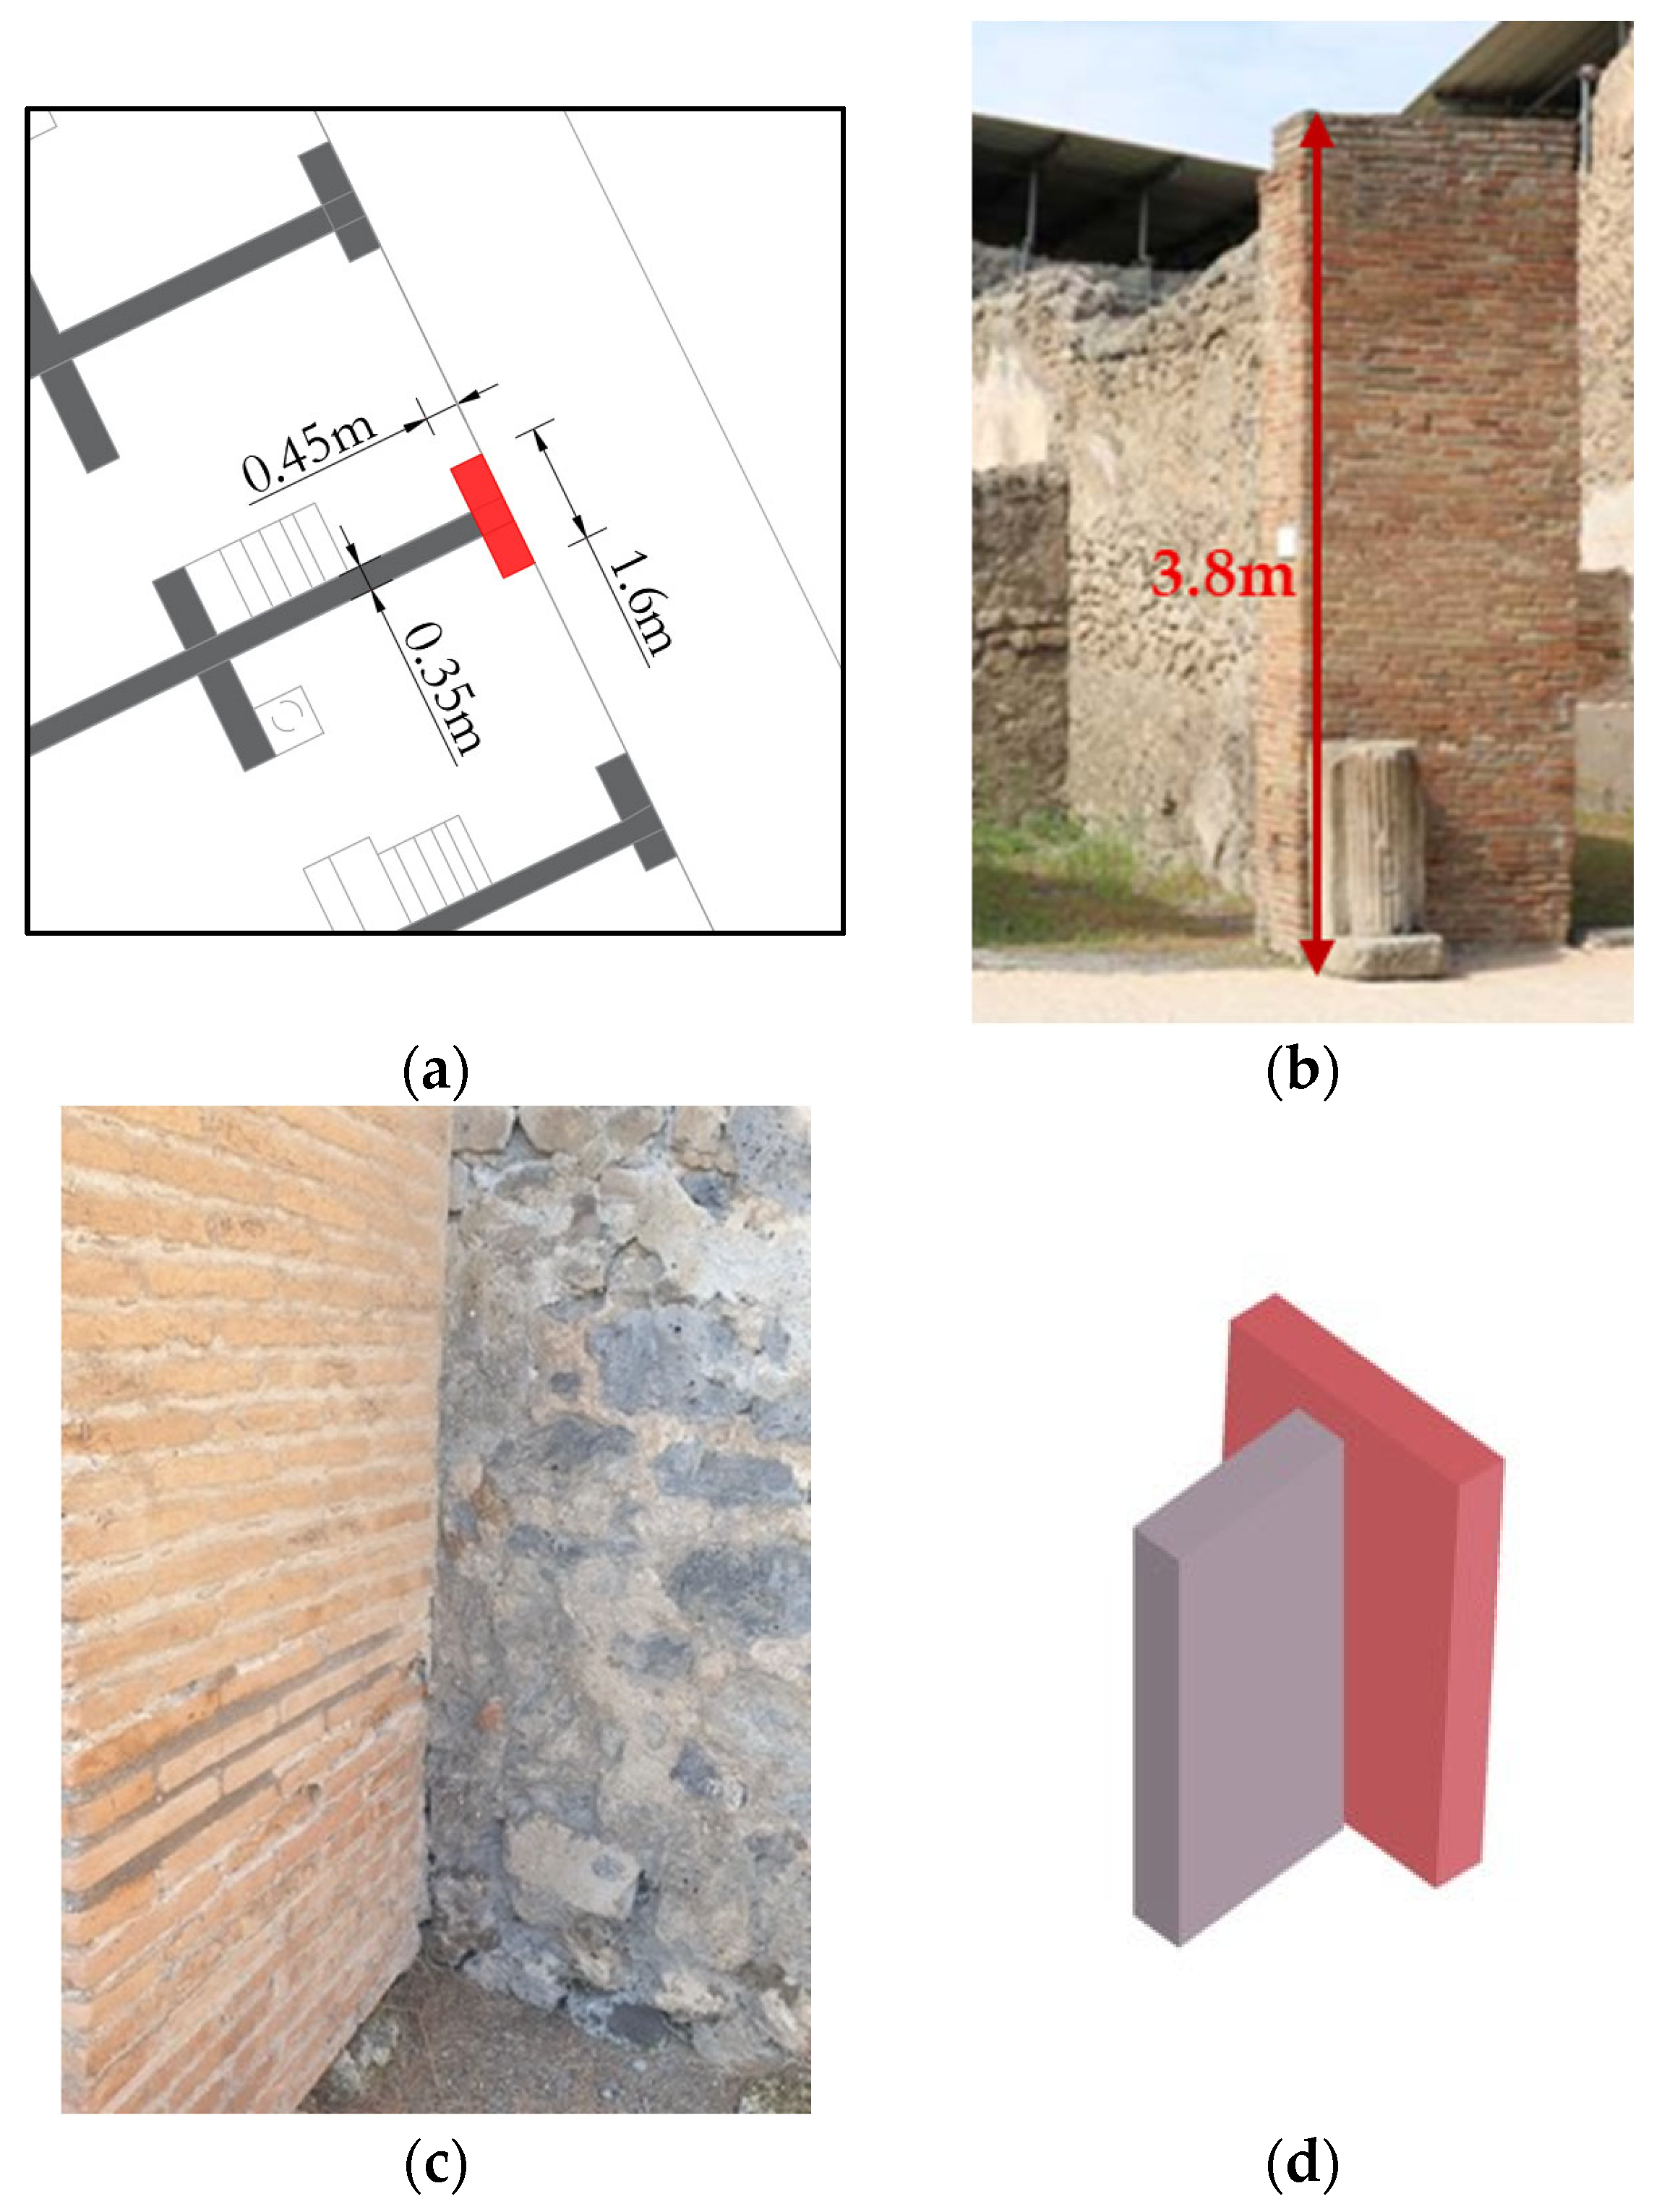
Figure 15a,b). The wall has a height of 5.2 m, a length of 1.6 m, and a thickness of 0.34 m. Since it does not exhibit a crack pattern, its failure mechanism must be inferred by considering the morphology and the effectiveness of the connection. The connection of Wall C with the single transverse wall can be considered ‘good’, as the constructive technique (
Figure 15c), commonly employed in the reconstructions following the AD 62 earthquake, is clearly identifiable, as described in
Section 2.2.
Based on the quality of the transverse connection and a quite short length of the front wall (1.6 m), a simple rocking-sliding failure mechanism is most likely under OOP actions (
Figure 15d); thus, the frictional macro-block model of Casapulla and Argiento [
16], summarised in
Section 3.2.3, was employed to determine the height
Hc of the macro-block affected by failure and the corresponding minimum multiplier of the gravitational loads, in accordance with Equations (3)–(5).
Table 6 reports the values of the geometrical parameters required by Equation (3) and
Table 2.
The results of the analysis are reported in
Table 7 in terms of α
0,
a0, and
Hc, and correspond to three values of the friction coefficient, i.e.,
f = 0.6 and
f = 0.4, which were assumed to bound its variability range, and
f = 0 for comparison. Note that assuming
f = 0 implies a ‘poor’ connection and the onset of a simple rocking mechanism, characterised by a hinge at the base of the front wall (
Hc =
H = 5.2 m) and a vertical crack along the contact surface with the transverse wall. The acceleration capacity
a0 is still based on Equation (6), with CF = 1.35 and
e* = 1.
The results show that for f = 0, the load multiplier α0, and the acceleration capacity a0 were significantly low, i.e., 0.065 and 0.048 g, respectively, whereas the height of the macro-block, Hc, coincided with the height of the entire wall, i.e., 5.2 m. When the walls are supposedly well-connected, for the lower bound of f (0.4), a0 increases by about 356%, whereas Hc reduces by 25%, thanks to the stabilising effect of the frictional resistances; when f increases by 50% (from 0.4 to 0.6), a0 further increases by 23%, and Hc reduces by approximately 19%.
These findings clearly demonstrate the effectiveness of the toothed connection adopted after the AD 62 earthquake and highlight that collecting data to characterise connection quality—as required by the second level of the proposed classification—enables a more accurate evaluation of the wall’s capacity.
4.4. Wall D: Insula 8 of Regio VI
Wall D in Insula 8 of Regio VI (
Figure 16a,b) is a Tf-shaped wall too, but its connection to the transverse wall can be classified as ‘intermediate’ (
Figure 16c), according to the criteria introduced in
Section 2.2. Indeed, the
opus incertum technique, based on good-quality mortar and irregular stone blocks, was used for both the transverse wall and the core of the front one, providing a sort of constructive continuity, even if it cannot realise a ‘toothed’ connection, as for Wall C. The quality of such a connection depends on the masonry tensile strength,
ft.
Based on the quality of the connection, a simple rocking failure mechanism is expected for the entire front wall under OOP actions. It is characterised by a cylindrical hinge at the base and by a vertical crack along the intersection with the transverse wall. The modified Heyman model, described in
Section 3.2.2, can be used to calculate the load multiplier through Equation (2), taking into account the restraining contribution related to the masonry tensile strength,
ft. Note that assuming the hinge at the base, the multiplier obtained from Equation (2) is the minimum one, α
0.
Table 8 reports the geometrical parameters required by Equation (2) to calculate the load multiplier according to the modified Heyman model.
In addition to the geometrical parameters, the specific weight,
γ, of the masonry and
ft are required by Equation (2). For this purpose, as in Casapulla et al. [
11], two reference values for
ft were assumed, corresponding to the lower and upper bounds of the range suggested by the CNTC 2019 [
20] for rubble stone masonry: i.e.,
ft = 0.027 and 0.50 MPa, respectively. For the specific weight, instead,
γ = 19 kN/m
3 was assumed.
Table 9 reports the load multipliers α
0 and the acceleration capacities
a0 based on Equation (6) with CF = 1.35 and
e* = 1, related to the two values of
ft; the case
ft = 0 was also considered for comparison. This table shows that for Wall D, if the contribution of the tensile strength
ft is completely neglected, the acceleration capacity is quite low, but when
ft assumes the lower bound of the range, i.e., 0.027 MPa, the acceleration capacity
a0 increases by 56%. If
ft increases from 0.027 to 0.05 MPa,
a0 increases further by about 31%.
Moreover, if the results of the examined walls are compared, it can be observed that when ‘intermediate’ connections are considered for Wall D (
ft ≠ 0 in
Table 9), its acceleration capacity consistently exceeds those of Walls A and B, which exhibited ‘poor’ connections, even when the lowest value of
ft (0.027 MPa) was assumed. If for Wall D the tensile strength is neglected, its capacity becomes comparable to those of Walls A and B, since all walls are assumed to have a ‘poor’ connection.
Finally, it can be noted that the acceleration capacity of Wall D was always lower than that of Wall C, which was characterised by ‘good’ connections, even when the minimum value of
f (0.4) was adopted for Wall C and the maximum value of
ft (0.05 MPa) was adopted for Wall D. In this case, the capacity of Wall D was about 82% of that of Wall C (see
Table 7 and
Table 9).
4.5. Seismic Assessment of the Walls of the Four Case Studies
Once the acceleration capacity had been identified for Walls A, B, C, and D, their seismic safety was assessed, following the indications of the Italian Guidelines related to the seismic risk for the cultural heritage [
29], which require considering at least two limit states (LS), i.e., the damage limit state and the life safety limit state, named SLD and SLV in the following, according to the Italian Technical Code notation. Moreover, only for Wall A, which contains frescos of significant value, the limit state for artistic assets (SLA) was considered, involving a more severe seismic demand than the SLD for the onset of damage.
Table 10 summarises the parameters required to define the seismic demand related to these limit states, according to the NTC 2018 [
14] and the mentioned guidelines [
29]. These are based on a nominal life V
N = 50 years and a coefficient of utilisation C
u = 2, which is usually adopted for strategic structures and, in this case, for preserving significant archaeological assets. Consequently, the reference life is V
R = V
N Cu = 100 years for all limit states, whereas the return period T
R of the seismic action is calculated for each limit state based on its specific exceeding probability P
VR% and V
R.
Note that the values of S
s are calculated according to the simplified approach provided by the NTC 2018 [
14] for a type E soil, which better matches the features of the site since the depth of the bedrock (lava layer) is lower than 30 m [
30]. Such values (1.54–1.60) are in good agreement with the results of detailed studies by de Sanctis et al. [
30], who evaluated site amplification effects by one- and two-dimensional analyses of wave propagation for Insula 12 of Regio IX. Indeed, for T
R = 949 years, they obtained amplification factors ranging from 1.25 to 1.79 for the area of Wall B, concluding that the stratigraphic amplification at the site is not negligible due to the presence of a thick layer (15 m–20 m depending on the section) of pyroclastic deposits resulting from the eruption of 79 AD.
Finally, it is worth noting that according to [
14], the seismic demand related to SLV was calculated assuming a behaviour factor
q = 2 to reduce the acceleration
ag S, as reported in
Table 10.
Hence, in
Table 11, the values of capacity previously calculated for each wall are compared with the seismic demands reported in
Table 7.
For Wall A, the failure mechanism M1 was triggered only by the seismic demand related to the limit state SLA, i.e., the most severe among those considered, which provided a C/D ratio just below unity; the failure mechanism M2, instead, was triggered under all limit states with a C/D ratio always lower than 0.5, i.e., 0.48 for LSD, 0.44 for SLV, and 0.22 for LSA.
Wall B was vulnerable under both the limit states SLD and SLV, with C/D ratios of 0.62 and 0.56, respectively.
Conversely, Walls C and D were deemed safe under both SLD and SLV. However, for Wall D, assuming a tensile strength of 0.027 MPa, the C/D ratio slightly exceeded unity under SLV.
Finally, the results clearly show that attention should be focused on Walls A and B, the former characterised by valuable frescos and the latter affected by ongoing excavation. Indeed, these walls are the most vulnerable to OOP failure, as the C/D ratio was lower than unity under all of the evaluated limit states. Therefore, appropriate interventions should be planned to mitigate this vulnerability and preserve their value.
5. Conclusions
The paper presented a methodological approach to assess the OOP capacity of archaeological masonry walls and exemplified its application through the detailed analysis of four real case studies located in the Pompeii Archaeological Park (PAP). The methodology accounts for specific features of the structures in archaeological contexts, such as the common absence of horizontal diaphragms, the prevalence of isolated or poorly connected elements, and existing damage, and tries to identify typical OOP failure mechanisms for the examined walls.
Hence, a two-level classification was proposed for the connections, based on progressive stages of knowledge: the first level is based only on their morphology, whereas the second level is based on their effectiveness and requires an investigation of the construction techniques and material properties that govern the OOP response.
Based on the investigation of the Pompeian walls, three classes of effectiveness were identified and, accordingly, three modelling approaches were adopted: the original Heyman model for ‘poor’ connections, a modified Heyman model incorporating tensile strength for ‘intermediate’ connections, and a frictional macro-block model for ‘good’ connections. All approaches, grounded in limit analysis, enabled the evaluation of the capacity in terms of the minimum gravitational load multiplier. The indications of the Commentary to the Italian Technical Code were assumed as a reference to obtain the capacity in terms of acceleration; such acceleration marks the onset of the failure mechanisms.
The proposed methodology can be used in two common scenarios: (1) when the failure mechanism has already been triggered, and a well-defined crack pattern is observable; (2) when the wall is still undamaged, and the failure mechanism must be predicted. Indeed, it was applied to four walls in the Pompeii Archaeological Park, which are emblematic of the identified levels of effectiveness.
The results highlight that the effectiveness of wall connections is the key parameter governing OOP behaviour, influencing both the type of failure mechanisms and the analytical models applicable for capacity assessment.
Then, the acceleration capacity of the analysed walls was compared with the seismic demand, accounting for relevant limit states in archaeological contexts. Moreover, in evaluating the PGA for each limit state, it was shown that the amplification effect of the soil stratigraphic features can be significant at the Pompeii site, due to the presence of a thick layer of pyroclastic deposits resulting from the AD 79 eruption. Indeed, integrating geotechnical as well as multidisciplinary scientific skills is crucial for addressing complex contexts, such as archaeological ones.
The comparison revealed that for some walls, the capacity-to-demand ratio was less than 1, suggesting the need for priority attention in programming specific interventions for their conservation. In particular, walls with ‘poor’ connections demonstrated the lowest safety margins, especially under limit states relevant to the preservation of artistic heritage.
By concluding, the analysis shows that the proposed methodology may support decision-making processes for planning and prioritising interventions on archaeological masonry walls. Moreover, the adopted analytical models, although quite simplified, can be useful to carry out large-scale vulnerability assessments. For this purpose, the development of mechanical-based fragility curves for each typology could be a valuable tool, and is currently under ongoing research. Finally, it is worth noting that the proposed methodology can easily be applied to other archaeological contexts, although the features of the investigated wall connections are specific to Pompeii, as well as many Roman archaeological sites.
Author Contributions
Conceptualisation, M.D.L., C.C. and F.C.; methodology, M.D.L., C.C. and F.C.; software, A.M.; validation, M.D.L., C.C., F.C., A.Z. and V.C.; formal analysis, A.M.; investigation, A.M. and G.D.M.; resources, A.Z. and V.C.; data curation, G.D.M. and A.M.; writing—original draft preparation, A.M.; writing—review and editing, all authors.; visualisation, C.C. and F.C.; supervision, M.D.L., C.C. and F.C.; project administration, M.D.L.; funding acquisition, M.D.L. All authors have read and agreed to the published version of the manuscript.
Funding
This research was funded by the Italian Ministry of University and Research (MUR), PRIN call 2022 PNRR project “Multi-Risk Analysis of the vulnerability of archaeological sites (MiRA)”. The APC was funded by the PRIN 2022 PNRR project “MiRA”.
Data Availability Statement
The data presented in this study are contained within the article. Further inquiries can be directed to the corresponding author.
Acknowledgments
This work was carried out under the financial support of PRIN (projects of significant national interest) call 2022 PNRR, Research project: Multi-Risk Analysis of the vulnerability of archaeological sites (MiRA). The authors gratefully acknowledge the Pompeii Archaeological Park for providing the GIS datasets used in this study.
Conflicts of Interest
The authors declare no conflicts of interest. The funders had no role in the design of the study; in the collection, analyses, or interpretation of data; in the writing of the manuscript; or in the decision to publish the results.
Abbreviations
The following abbreviations are used in this manuscript:
| PAP | Pompeii Archaeological Park |
| OOP | Out-of-plane |
References
- Zuchtriegel, G.; Zambrano, A.; Calvanese, V. A multilevel approach to monitor the Archaeological Park of Pompeii. In European Robotics Forum 2024 (ERF 2024); Secchi, C., Marconi, L., Eds.; Springer Proceedings in Advanced Robotics; Springer: Cham, Switzerland, 2024; Volume 33, pp. 351–356. [Google Scholar] [CrossRef]
- Calvanese, V. Strategie di tutela, conservazione, restauro e fruizione nel Parco Archeologico di Pompei: Il contributo dell’ingegneria ad un approccio multidisciplinare. In La Cultura dell’Ingegneria per la Conservazione del Patrimonio e del Paesaggio; Aveta, A., Ed.; Editori Paparo: Napoli, Italy, 2023. (In Italian) [Google Scholar]
- UNESCO. Recommendation on International Principles Applicable to Archaeological Excavations: Adopted by the General Conference at Its Ninth Session: New Delhi 11 December 1956; UNESCO: Paris, France, 1957. [Google Scholar]
- ICOMOS. Charter for the Protection and Management of the Archaeological Heritage (1990). Prepared by the International Committee for the Management of Archaeological Heritage (ICAHM) an Approved by the 9th General Assembly in Lausanne in 1990; ICOMOS: Paris, France, 2011. [Google Scholar]
- ICOMOS. International Charter for the Conservation and Restoration of Monuments and Sites; ICOMOS: Paris, France, 1966. [Google Scholar]
- Calvanese, V.; Zambrano, A. A conceptual design approach for archaeological structures, a challenging issue between innovation and conservation: A studied case in ancient Pompeii. Buildings 2021, 11, 167. [Google Scholar] [CrossRef]
- Galassi, S.; Ruggieri, N.; Tempesta, G. A novel numerical tool for seismic vulnerability analysis of ruins in archaeological sites. Int. J. Archit. Herit. 2020, 14, 1–22. [Google Scholar] [CrossRef]
- Gambilongo, L.; Chieffo, N.; Lourenço, P.B. A comprehensive approach to assess the seismic vulnerability of archaeological sites: The Wupatki Pueblo in Arizona. Bull. Earthq. Eng. 2024, 22, 4413–4445. [Google Scholar] [CrossRef]
- Aguilar, R.; Marques, R.; Sovero, K.; Martel, C.; Trujillano, F.; Boroschek, R. Investigations on the structural behaviour of archaeological heritage in Peru: From survey to seismic assessment. Eng. Struct. 2015, 95, 94–111. [Google Scholar] [CrossRef]
- Lourenço, P.B.; Trujillo, A.; Mendes, N.; Ramos, L.F. Seismic performance of the St. George of the Latins church: Lessons learned from studying masonry ruins. Eng. Struct. 2012, 40, 501–518. [Google Scholar] [CrossRef]
- Casapulla, C.; Maione, A.; De Martino, G.; Ceroni, F.; Di Ludovico, M. Fragility curves for out-of-plane failure mechanisms of masonry wall typologies in the archaeological sites: A focus on T-shaped elements in Pompeii. Eng. Struct. 2025, 340, 120757. [Google Scholar] [CrossRef]
- Dessales, H.; Cavero, J.; Tricoche, A. Post-earthquake reconstruction: Mapping and recording repairs in ancient Pompeii. In Handbook of Cultural Heritage Analysis; D’Amico, S., Venuti, V., Eds.; Springer International Publishing: Cham, Switzerland, 2022; pp. 1805–1821. [Google Scholar]
- Dessales, H.; Cavero, J.; Tricoche, A.; Pecchioli, L. The archaeology of post-earthquake repairs: New insights into building processes in Roman Pompeii. In Archaeoseismology: Methodologies and Case Studies; Springer International Publishing: Cham, Switzerland, 2023; pp. 61–76. [Google Scholar]
- Ministry of Infrastructure and Transport. D.M. 17/01/2018, NTC18. Aggiornamento Delle “Norme Tecniche per le Costruzioni”. GU Serie Generale N. 42/2018 (Suppl. Ord. N. 8). Available online: https://www.gazzettaufficiale.it/eli/id/2018/2/20/18A00716/sg (accessed on 26 March 2026). (In Italian)
- Heyman, J. The stone skeleton. Int. J. Solids Struct. 1966, 2, 249–279, IN1–IN4, 257–264, IN5–IN12, 265–279. [Google Scholar] [CrossRef]
- Casapulla, C.; Argiento, L.U. The comparative role of friction in local out-of-plane mechanisms of masonry buildings. Pushover analysis and experimental investigation. Eng. Struct. 2016, 126, 158–173. [Google Scholar] [CrossRef]
- Casapulla, C.; Argiento, L.U. In-plane frictional resistances in dry block masonry walls and rocking-sliding failure modes revisited and experimentally validated. Compos. Part B Eng. 2018, 132, 197–213. [Google Scholar] [CrossRef]
- Casapulla, C.; Maione, A. Experimental and analytical investigation on the corner failure in masonry buildings: Interaction between rocking-sliding and horizontal flexure. Int. J. Archit. Herit. 2020, 14, 208–220. [Google Scholar] [CrossRef]
- Maione, A.; Casapulla, C.; Di Ludovico, M.; Prota, A.; Ceroni, F. Efficiency of injected anchors in connecting T–shaped masonry walls: A modelling approach. Constr. Build. Mater. 2021, 301, 124051. [Google Scholar] [CrossRef]
- Consiglio Superiore dei Lavori Pubblici. Circolare 21/01/19 n. 7, CNTC19. Istruzioni per l’Applicazione dell’Aggiornamento delle “Norme Tecniche per le Costruzioni” di cui al DM 17 Gennaio 2018. GU Serie Generale N. 35/2019 (Suppl. Ord. N. 5). Available online: https://www.gazzettaufficiale.it/eli/id/2019/02/11/19A00855/sg (accessed on 26 March 2026). (In Italian)
- Autiero, F.; De Martino, G.; Di Ludovico, M.; Prota, A. Mechanical performance of full-scale Pompeii-like masonry panels. Constr. Build. Mater. 2020, 251, 118964. [Google Scholar] [CrossRef]
- De Luca, R.; Miriello, D.; Pecci, A.; Domínguez-Bella, S.; Bernal-Casasola, D.; Cottica, D.; Bloise, A.; Crisci, G.M. Archaeometric study of mortars from the Garum Shop at Pompeii, Campania, Italy. Geoarchaeology 2015, 30, 330–351. [Google Scholar] [CrossRef]
- Miriello, D.; Barca, D.; Bloise, A.; Ciarallo, A.; Crisci, G.M.; De Rose, T.; Gattuso, C.; Gazineo, F.; La Russa, M.F. Characterisation of archaeological mortars from Pompeii (Campania, Italy) and identification of construction phases by compositional data analysis. J. Archaeol. Sci. 2010, 37, 2207–2223. [Google Scholar] [CrossRef]
- Puppio, M.L.; Giresini, L. Estimation of tensile mechanical parameters of existing masonry through the analysis of the collapse of Volterra’s urban walls. Frat. E Integrità Strutt. 2019, 13, 725–738. [Google Scholar] [CrossRef]
- Vasconcelos, G.; Lourenço, P.B. Experimental characterization of stone masonry in shear and compression. Constr. Build. Mater. 2009, 23, 3337–3345. [Google Scholar] [CrossRef]
- Marino, M.; Neri, F.; De Maria, A.; Borri, A. Experimental data of friction coefficient for some types of masonry and its correlation with an Index of Quality Masonry (IQM). In Proceedings of the 2nd European Conference on Earthquake Engineering and Seismology, Istanbul, Turkey, 24–29 August 2014; pp. 25–29. [Google Scholar]
- Zuchtriegel, G.; Alesse, L.; Esposito, D.; Iovino, G.; Perrotta, A.; Russo, A.; Scarpati, C.; Trapani, A. Quando la Guerra di Troia non era ancora decisa. Il salone nero con affreschi di III stile nella Regio IX, insula 10 di Pompei. E-J. Degli Scavi Di Pompei 2024, 4, 2–30. (In Italian) [Google Scholar]
- Bianchini, M. Le Tecniche Edilizie nel Mondo Antico; Edizioni Dedalo: Bari, Italy, 2010. (In Italian) [Google Scholar]
- MIBAC, DPCM 9/2/2011, 2008. Linee Guida per la Valutazione e la Riduzione del Rischio Sismico del Patrimonio Culturale con Riferimento alle Norme Tecniche delle Costruzioni di cui al Decreto del Ministero delle Infrastrutture e dei Trasporti del 14 Gennaio 2008 (In Italian) Presidenza del Consiglio dei Ministri, DPCM 9/2/2011. Valutazione e Riduzione del Rischio Sismico del Patrimonio Culturale con Riferimento alle Norme Tecniche delle Costruzioni di cui al Decreto del Ministero delle Infrastrutture e dei Trasporti del 14 Gennaio 2008. GU Serie Generale N. 47/2011 (Suppl. Ord. N. 54). Available online: https://www.gazzettaufficiale.it/eli/id/2011/02/26/11A02374/sg (accessed on 26 March 2026). (In Italian)
- de Sanctis, L.; Iovino, M.; Maiorano, R.M.S.; Aversa, S. Seismic stability of the excavation fronts in the ancient Roman city of Pompeii. Soils Found. 2020, 60, 856–870. [Google Scholar] [CrossRef]
Figure 1.
Map of the morphological typologies identified in the PAP.
Figure 1.
Map of the morphological typologies identified in the PAP.
Figure 2.
Examples of wall connections: (a) ‘poor’; (b) ‘intermediate’; (c) ‘good’.
Figure 2.
Examples of wall connections: (a) ‘poor’; (b) ‘intermediate’; (c) ‘good’.
Figure 3.
Flowchart of the main steps of the proposed methodology.
Figure 3.
Flowchart of the main steps of the proposed methodology.
Figure 4.
Potential OOP mechanisms for E-shaped walls: (a) simple rocking; (b) simple rocking-sliding; (c) symmetrical horizontal flexure; (d) non-symmetrical horizontal flexure.
Figure 4.
Potential OOP mechanisms for E-shaped walls: (a) simple rocking; (b) simple rocking-sliding; (c) symmetrical horizontal flexure; (d) non-symmetrical horizontal flexure.
Figure 5.
Simple rocking failure mechanism configurations analysed using the original Heyman model: (a) rotation around a horizontal cylindrical hinge and (b) rotation around an inclined cylindrical hinge.
Figure 5.
Simple rocking failure mechanism configurations analysed using the original Heyman model: (a) rotation around a horizontal cylindrical hinge and (b) rotation around an inclined cylindrical hinge.
Figure 6.
(
a) Schematic plan view of a Tf-shaped wall; (
b) simple rocking failure mechanism of a Tf-shaped wall with ‘intermediate’ connection according to the modified Heyman model. Based on [
11].
Figure 6.
(
a) Schematic plan view of a Tf-shaped wall; (
b) simple rocking failure mechanism of a Tf-shaped wall with ‘intermediate’ connection according to the modified Heyman model. Based on [
11].
Figure 7.
(
a) Geometrical parameters of the macro-block involved in the simple rocking-sliding mechanism of the Tf typology; (
b) forces involved in the rotational equilibrium of the macro-block; (
c) geometrical parameters of the toothed connection. Based on [
11].
Figure 7.
(
a) Geometrical parameters of the macro-block involved in the simple rocking-sliding mechanism of the Tf typology; (
b) forces involved in the rotational equilibrium of the macro-block; (
c) geometrical parameters of the toothed connection. Based on [
11].
Figure 8.
Plan views and photos related to: (a,b) Wall A in the “Black Salon”, Insula 10 of Regio IX; (c,d) Wall B, Insula 12 of Regio IX; (e,f) Wall C, Insula 1 of Regio VII; (g,h) Wall D, Insula 8 of Regio VI.
Figure 8.
Plan views and photos related to: (a,b) Wall A in the “Black Salon”, Insula 10 of Regio IX; (c,d) Wall B, Insula 12 of Regio IX; (e,f) Wall C, Insula 1 of Regio VII; (g,h) Wall D, Insula 8 of Regio VI.
Figure 9.
Survey of the restraining conditions and crack patterns of Wall A: (a) partial collapse of the terminal portion; (b) main crack patterns related to failure mechanism M1 and M2; (c) collapse of the transverse spandrel; (d) transverse connection along the length of Wall A.
Figure 9.
Survey of the restraining conditions and crack patterns of Wall A: (a) partial collapse of the terminal portion; (b) main crack patterns related to failure mechanism M1 and M2; (c) collapse of the transverse spandrel; (d) transverse connection along the length of Wall A.
Figure 10.
(a) Geometrical features and (b) 3D sketch for mechanism M1. (c) Detail of the reference system and coordinates of the mass centre G of the rocking masonry macro-block.
Figure 10.
(a) Geometrical features and (b) 3D sketch for mechanism M1. (c) Detail of the reference system and coordinates of the mass centre G of the rocking masonry macro-block.
Figure 11.
Geometrical features and 3D sketches for the two variants of mechanism M2: (a,b) M2.1 and (c,d) M2.2.
Figure 11.
Geometrical features and 3D sketches for the two variants of mechanism M2: (a,b) M2.1 and (c,d) M2.2.
Figure 12.
Wall B in Insula 12 of Regio IX: (a) vertical section showing the different ground levels; (b) connection and restraining conditions of the wall.
Figure 12.
Wall B in Insula 12 of Regio IX: (a) vertical section showing the different ground levels; (b) connection and restraining conditions of the wall.
Figure 13.
(a) Portion of Wall B vulnerable to mechanism M1 and (b) geometry of the macro-block.
Figure 13.
(a) Portion of Wall B vulnerable to mechanism M1 and (b) geometry of the macro-block.
Figure 14.
(a) Portion of Wall B vulnerable to mechanism M2 and (b) geometry of the macro-block.
Figure 14.
(a) Portion of Wall B vulnerable to mechanism M2 and (b) geometry of the macro-block.
Figure 15.
Tf-shaped Wall C in Insula 1 of Regio VII: (a) plan view; (b) photo; (c) detail of the constructive technique used for transverse connection; (d) geometry of the simple rocking-sliding failure mechanism.
Figure 15.
Tf-shaped Wall C in Insula 1 of Regio VII: (a) plan view; (b) photo; (c) detail of the constructive technique used for transverse connection; (d) geometry of the simple rocking-sliding failure mechanism.
Figure 16.
Wall D in Insula 8 of Regio VI: (a) plan view; (b) photo; (c) detail of the transverse connection; (d) geometry of the simple rocking failure mechanism.
Figure 16.
Wall D in Insula 8 of Regio VI: (a) plan view; (b) photo; (c) detail of the transverse connection; (d) geometry of the simple rocking failure mechanism.
Table 1.
Morphological typologies of recurring masonry wall connections in the PAP.
Table 2.
Expressions of the parameters in Equation (3).
Table 2.
Expressions of the parameters in Equation (3).
| Forces | xi | zi |
|---|
| | |
| | |
| | |
Table 3.
Geometrical parameters required by the Heyman model for mechanism M1.
Table 3.
Geometrical parameters required by the Heyman model for mechanism M1.
| Parameter | ID | Unit | Value |
|---|
| Coordinates of the mass centre G | xG | [m] | 0.250 |
| zG | [m] | 0.729 |
Table 4.
Geometrical parameters required by the Heyman model for variants M2.1 and M2.2 of mechanism M2.
Table 4.
Geometrical parameters required by the Heyman model for variants M2.1 and M2.2 of mechanism M2.
| Parameter | ID | Unit | Values |
|---|
| M2.1 | M2.2 |
|---|
| Coordinates of the mass centre G | xG | [m] | 0.25 | 0.250 |
| zG | [m] | 3.30 | 2.756 |
Table 5.
Values of the geometrical parameters required by Equation (1) for mechanisms M1 and M2 of Wall B.
Table 5.
Values of the geometrical parameters required by Equation (1) for mechanisms M1 and M2 of Wall B.
| Parameter | ID | Unit | Values |
|---|
| M1 | M2 |
|---|
| Coordinates of the mass centre G | xG | [m] | 0.210 | 0.21 |
| zG | [m] | 0.833 | 2.15 |
Table 6.
Values of the geometrical parameters required by Equation (3) and
Table 2.
Table 6.
Values of the geometrical parameters required by Equation (3) and
Table 2.
| Parameter | ID | Unit | Value |
|---|
| Length of the front wall | Lf | [m] | 1.60 |
| Thickness of the front wall | tf | [m] | 0.34 |
| Thickness of the transverse wall | ts | [m] | 0.38 |
Geometry of the toothed connection
(see Figure 7a) | hb | [m] | 0.25 |
| v | [m] | 0.25 |
| Ls | [m] | 0.25 |
Table 7.
Load multiplier α0, acceleration capacity a0, and height Hc of the portion of Wall C involved in the simple rocking-sliding failure mechanism, obtained for different values of the friction coefficient f.
Table 7.
Load multiplier α0, acceleration capacity a0, and height Hc of the portion of Wall C involved in the simple rocking-sliding failure mechanism, obtained for different values of the friction coefficient f.
| f | α0 (Equation (4)) | a0 (Equation (6)) | Hc (Equation (5)) |
|---|
| [-] | [-] | [g] | [m] |
|---|
| 0 | 0.065 | 0.048 | 5.20 |
| 0.4 | 0.296 | 0.219 | 3.90 |
| 0.6 | 0.365 | 0.270 | 3.17 |
Table 8.
Geometrical parameters required by Equation (2) to calculate the load multiplier according to the modified Heyman model.
Table 8.
Geometrical parameters required by Equation (2) to calculate the load multiplier according to the modified Heyman model.
| Parameter | ID | Unit | Value |
|---|
| Coordinates of the mass centre | xG | [m] | 0.225 |
| zG | [m] | 1.90 |
| Length of the front wall | Lf | [m] | 1.60 |
| Thickness of the front wall | tf | [m] | 0.45 |
| Thickness of the transverse wall | ts | [m] | 0.35 |
Table 9.
Load multipliers α0 and acceleration capacities a0 related to the simple rocking failure mechanism of Wall D, based on three values of the masonry tensile strength ft.
Table 9.
Load multipliers α0 and acceleration capacities a0 related to the simple rocking failure mechanism of Wall D, based on three values of the masonry tensile strength ft.
| ft | α0 (Equation (2)) | a0 (Equation (6)) |
|---|
| [MPa] | [-] | [g] |
|---|
| 0 | 0.012 | 0.089 |
| 0.027 | 0.188 | 0.139 |
| 0.050 | 0.246 | 0.182 |
Table 10.
Parameters required to calculate the seismic demand for the considered limit states.
Table 10.
Parameters required to calculate the seismic demand for the considered limit states.
| Parameter | ID | Unit | SLD | SLV | SLA |
|---|
| Nominal life | VN | [years] | 50 |
| Coefficient of utilisation | Cu | [-] | 2 |
| Reference life | VR | [years] | 100 |
| Exceeding probability | PVR | [%] | 63 | 10 | 10 |
| Return period | TR | [years] | 101 | 949 | 949 |
| PGA on the bedrock | ag | [g] | 0.073 | 0.167 | 0.167 |
| Stratigraphic amplification factor | Ss | [-] | 1.60 | 1.54 | 1.54 |
| Topographic amplification factor | ST | [-] | 1.00 | 1.00 | 1.00 |
| Site amplification factor | S = Ss ST | [-] | 1.60 | 1.54 | 1.54 |
| Site PGA | ag S | [g] | 0.117 | 0.257 | 0.257 |
| Behaviour factor | q | [-] | 1 | 2 | 1 |
| Seismic demand | ag S/q | [g] | 0.117 | 0.129 | 0.257 |
Table 11.
Capacity-to-demand ratios (C/D) related to three LS for Walls A, B, C, and D.
Table 11.
Capacity-to-demand ratios (C/D) related to three LS for Walls A, B, C, and D.
| Wall | Case | Capacity
[g] | SLD | SLV | SLA |
|---|
Demand
[g] | C/D
[-] | Demand
[g] | C/D
[-] | Demand
[g] | C/D
[-] |
|---|
| A | M1 | 0.254 | 0.117 | 2.17 | 0.129 | 1.97 | 0.257 | 0.99 |
| M2 | 0.056 | 0.117 | 0.48 | 0.129 | 0.44 | 0.257 | 0.22 |
| B | M2 | 0.073 | 0.117 | 0.62 | 0.129 | 0.56 | - | - |
| C | f = 0.4 | 0.219 | 0.117 | 1.88 | 0.129 | 1.70 | - | - |
| f = 0.6 | 0.270 | 0.117 | 2.31 | 0.129 | 2.10 | - | - |
| D | ft = 0.027 MPa | 0.139 | 0.117 | 1.19 | 0.129 | 1.08 | - | - |
| ft = 0.05 MPa | 0.182 | 0.117 | 1.56 | 0.129 | 1.42 | - | - |
| Disclaimer/Publisher’s Note: The statements, opinions and data contained in all publications are solely those of the individual author(s) and contributor(s) and not of MDPI and/or the editor(s). MDPI and/or the editor(s) disclaim responsibility for any injury to people or property resulting from any ideas, methods, instructions or products referred to in the content. |




 ,
,