1. Introduction
Historic monuments built from natural stones are highly susceptible to material detachments, posing significant risks to both public safety and the structural integrity of the sites. In the field of geomorphological risk, two distinct scenarios for rockfalls affecting cultural heritage can be identified: (1) monuments exposed to rockfalls from nearby unstable formations, and (2) portions of the rock used to construct the monument itself, which detach and result in structural failures.
While the first scenario is well-documented (with remarkable examples including Pitigliano [
1] Civita di Bagnoregio [
2] and Taormina [
3] in Italy, Nisyros [
4] Monodendri [
5] Kipinas [
6] in Greece, Cortes de Pallas in Spain [
7], Gaziantep [
8] and Ortahisar [
9] in Turkey), the second scenario remains significantly underrepresented in the scientific literature.
A tragic instance of this second scenarios occurred in the UNESCO World Heritage historic centre of Florence (Italy) in October 2017, inside the Basilica of Santa Croce, where a falling stone from an architectural element resulted in a fatality. This incident prompted many public and private historic building owners to initiate a comprehensive monitoring programme for stone monuments in the city and surroundings [
10].
Several key factors influence the risk of stone detachments from monuments, including the structural integrity of the masonry, the effects of weathering and environmental processes, and the presence of pre-existing cracks or fissures within the rock mass. The structural integrity of stone-built heritage depends heavily on the progressive degradation of construction materials. Weathering phenomena significantly change the petrographic and physical-mechanical properties of natural stone, acting as a primary driver for conservation strategies [
11]. These processes range from chemical dissolution to physical stress caused by thermal cycles and moisture expansion, which can induce micro-cracking and decohesion even in durable lithotypes [
12]. Over time, this degradation predisposes architectural elements to instability, transforming minor defects into critical structural failures.
This study aims to enhance the management of such risks by proposing the Monument Rockfall Risk Assessment (MRRA), a heuristic prioritization framework designed to identify and prioritise interventions on unstable architectural elements. The MRRA was tested on the Ramps of Piazzale Michelangelo in Florence, a site characterised by the extensive use of Pietraforte sandstone, which exhibits complex decay patterns due to its heterogeneous nature and the presence of calcite veins.
State of the Art and Knowledge Gap
Rockfall susceptibility has been extensively studied over the last century, primarily focusing on natural vertical or subvertical cliffs [
13,
14]. Recent studies have significantly advanced this field by combining in-field investigations with 3D analysis of failure mechanisms [
15,
16]. Due to their high velocities and sudden occurrence, rockfalls are among the most damaging mass movements [
17].
To mitigate these risks, qualitative, heuristic, and quantitative methods have been developed over the past 30 years, mainly for mountain slopes, road cuts, and open-pit mines [
18,
19,
20,
21,
22,
23,
24,
25,
26,
27,
28]. A comprehensive summary of these failure hazard assessment strategies, highlighting the shift from kinematic tests to advanced 3D modelling, is provided by Jaboyedoff et al. [
29]. The latest approaches leverage UAV-based photogrammetry and machine learning algorithms to refine susceptibility mapping [
30,
31]. Methods such as the Mine Slope Instability Index and Slope Stability Assessment predominantly utilise numerical and geomechanical analyses to evaluate stability [
32,
33,
34].
Risk assessment methodologies are equally relevant in the context of Cultural Heritage preservation, where the stakes are high and the materials involved are often unique and irreplaceable [
35,
36].
Ramalhinho and Macedo [
37] reviewed various risk assessment models applied to both movable and immovable Cultural Heritage and review existing risk assessment models used in Cultural Heritage conservation between 1999 and 2016. Their study revealed that out of 27 models applied to heritage conservation, only seven addressed immovable assets, and most of these were qualitative or applied to large areas rather than individual monuments.
Recent studies have introduced “risk attitude” methodologies for sites like the Royal Palace of Caserta (Reggia di Caserta) [
38] or addressed rockfall hazards in monumental sites such as Petra [
39], historical urban centres like San Leo [
40], and geosites like the Tropea cliff [
41]. Nevertheless, research specifically focusing on the detachment of single blocks or portions of architectural elements remains scarce [
42,
43,
44].
A significant challenge in applying traditional geological techniques to architecture lies in the fundamental difference between natural rock masses and masonry. In natural outcrops, joints are typically organised into identifiable sets. In contrast, monumental structures consist of stone elements that have been artificially cut, moved from their original quarry context, and reassembled. This process makes it extremely difficult to extrapolate joint sets or spacing using standard geomechanical methods. To bridge this gap, the MRRA methodology adopts a heuristic prioritisation approach, following the conceptual framework of Jaboyedoff et al. [
29]. These authors highlight that when deterministic or temporal data (frequency-volume relationships) are lacking, heuristic techniques based on weighting internal and external parameters remain a standard and effective tool for susceptibility screening. By adapting this logic from the territorial to the architectural scale, the MRRA treats each stone element (coping) as a distinct “rock mass”. It calculates a relative risk index by assigning heuristic weights to parameters such as the degree of fracturing and centre of mass orientation (susceptibility), potential kinetic energy (vulnerability), and the accessibility of underlying areas (exposure). This allows for an objective ranking of priorities where traditional geomechanical modelling is unfeasible.
2. Materials and Methods
2.1. Study Area: The Ramps of Piazzale Michelangelo and the Pietraforte Sandstone
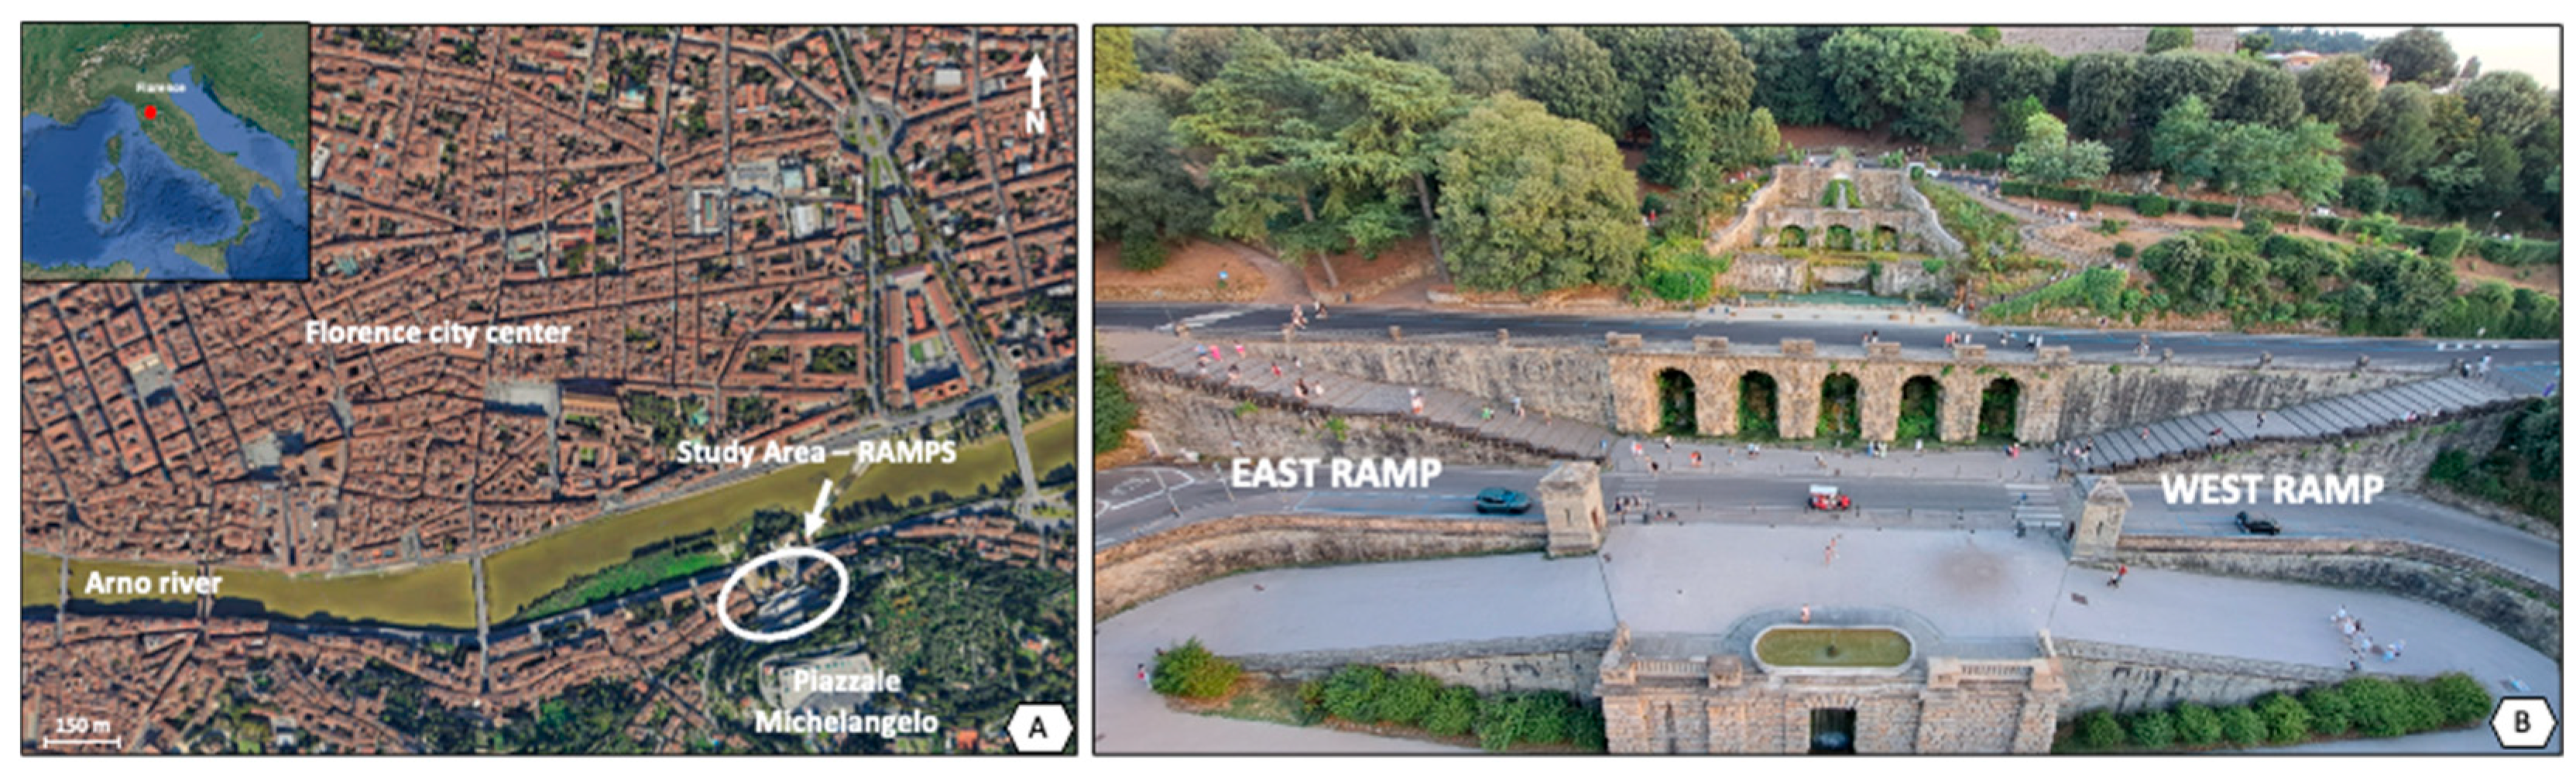
The Ramps of Piazzale Michelangelo in Florence, Italy (
Figure 1), represent a landmark of 19th-century architecture and urban planning, designed by the architect Giuseppe Poggi in 1869 during the Firenze Capitale (Florence Capital) urban renewal. The Ramps itself are a critical engineering feature designed to consolidate and drain the slope of Monte alle Croci, which connects the panoramic Piazzale Michelangelo square to the lower city level, an area historically prone to landslide [
45].
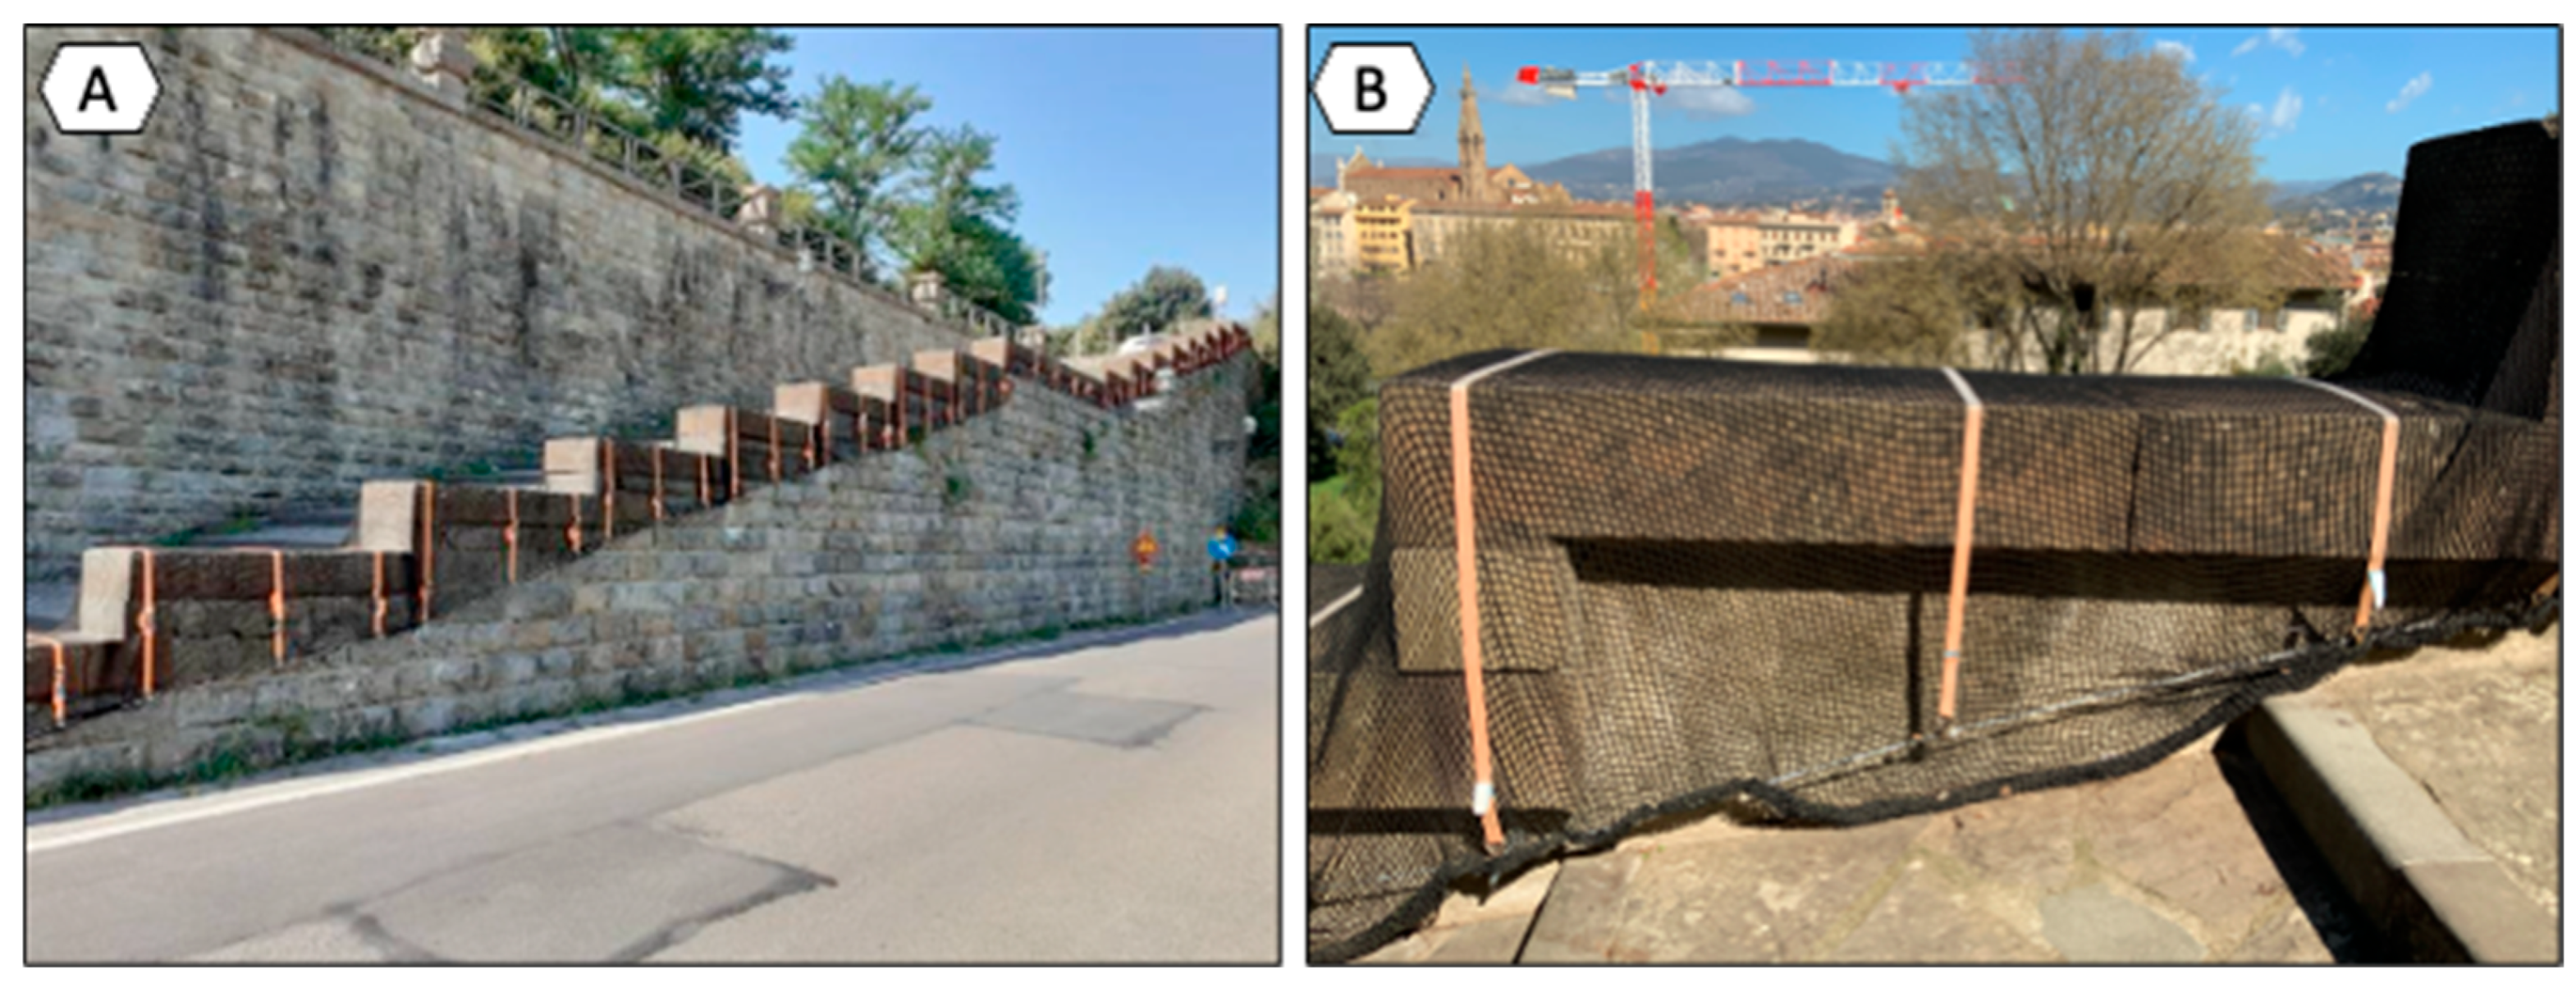
This architectural complex consists of a series of staircases, terraces, and fountains. The specific study area represents two mirrored stairways oriented east–west, characterized by stone parapets capped with rectangular stone blocks, known as copings. These elements are wider than the underlying masonry, providing both aesthetic completion and structural protection (
Figure 2).
The parapets follow the geometry of the staircases across 17 levels on each ramp; each level typically comprises two adjacent copings, approximately 29 cm thick and 65 cm wide, although their length exhibits significant variability. In total, the study focuses on 78 individual rock elements made entirely of Pietraforte sandstone.
Pietraforte is a turbiditic lithic sandstone belonging to the allochthonous Outer Ligurian complex and is the most representative building stone of Florence’s Renaissance heritage [
46,
47]. The rock exhibits a characteristic bluish-grey colour when freshly cut, turning to a typical ochre hue upon alteration due to iron oxidation [
48,
49,
50]. Recent experimental campaigns on samples from historical quarries have investigated its mechanical and physical behaviour through laboratory testing [
51,
52]. The geomechanical behaviour of the in situ Pietraforte is influenced by the inherent nature of this sandstone, both at a microscopic scale, significantly affecting the petrographic and physico-mechanical properties of the natural stone [
11,
12,
36] and at a macroscopic level, due to the presence of joints filled with sparry calcite and convoluted laminations (sandstones quarried from Tc levels of the Bouma sequence [
53]).
The typical weathering process of Pietraforte involves the chemical solubilisation of the calcitic filler, promoting both the opening of joints and intergranular decohesion, as well as physical disintegration caused by thermo-hygrometric cycles acting on the clay minerals within the sandstone matrix. Collectively, these alteration processes lead to the detachment of centimetre-to-decimetre-sized blocks through tensile, wedge, or planar failures.
Following the qualitative weathering recognition criteria proposed in similar contexts [
41,
54], visual inspections revealed differential degradation patterns. The stone surface of the copings exhibits delamination, erosion, mechanical damage, crusts, deposits, and biological colonisation, which progressively deteriorate the material.
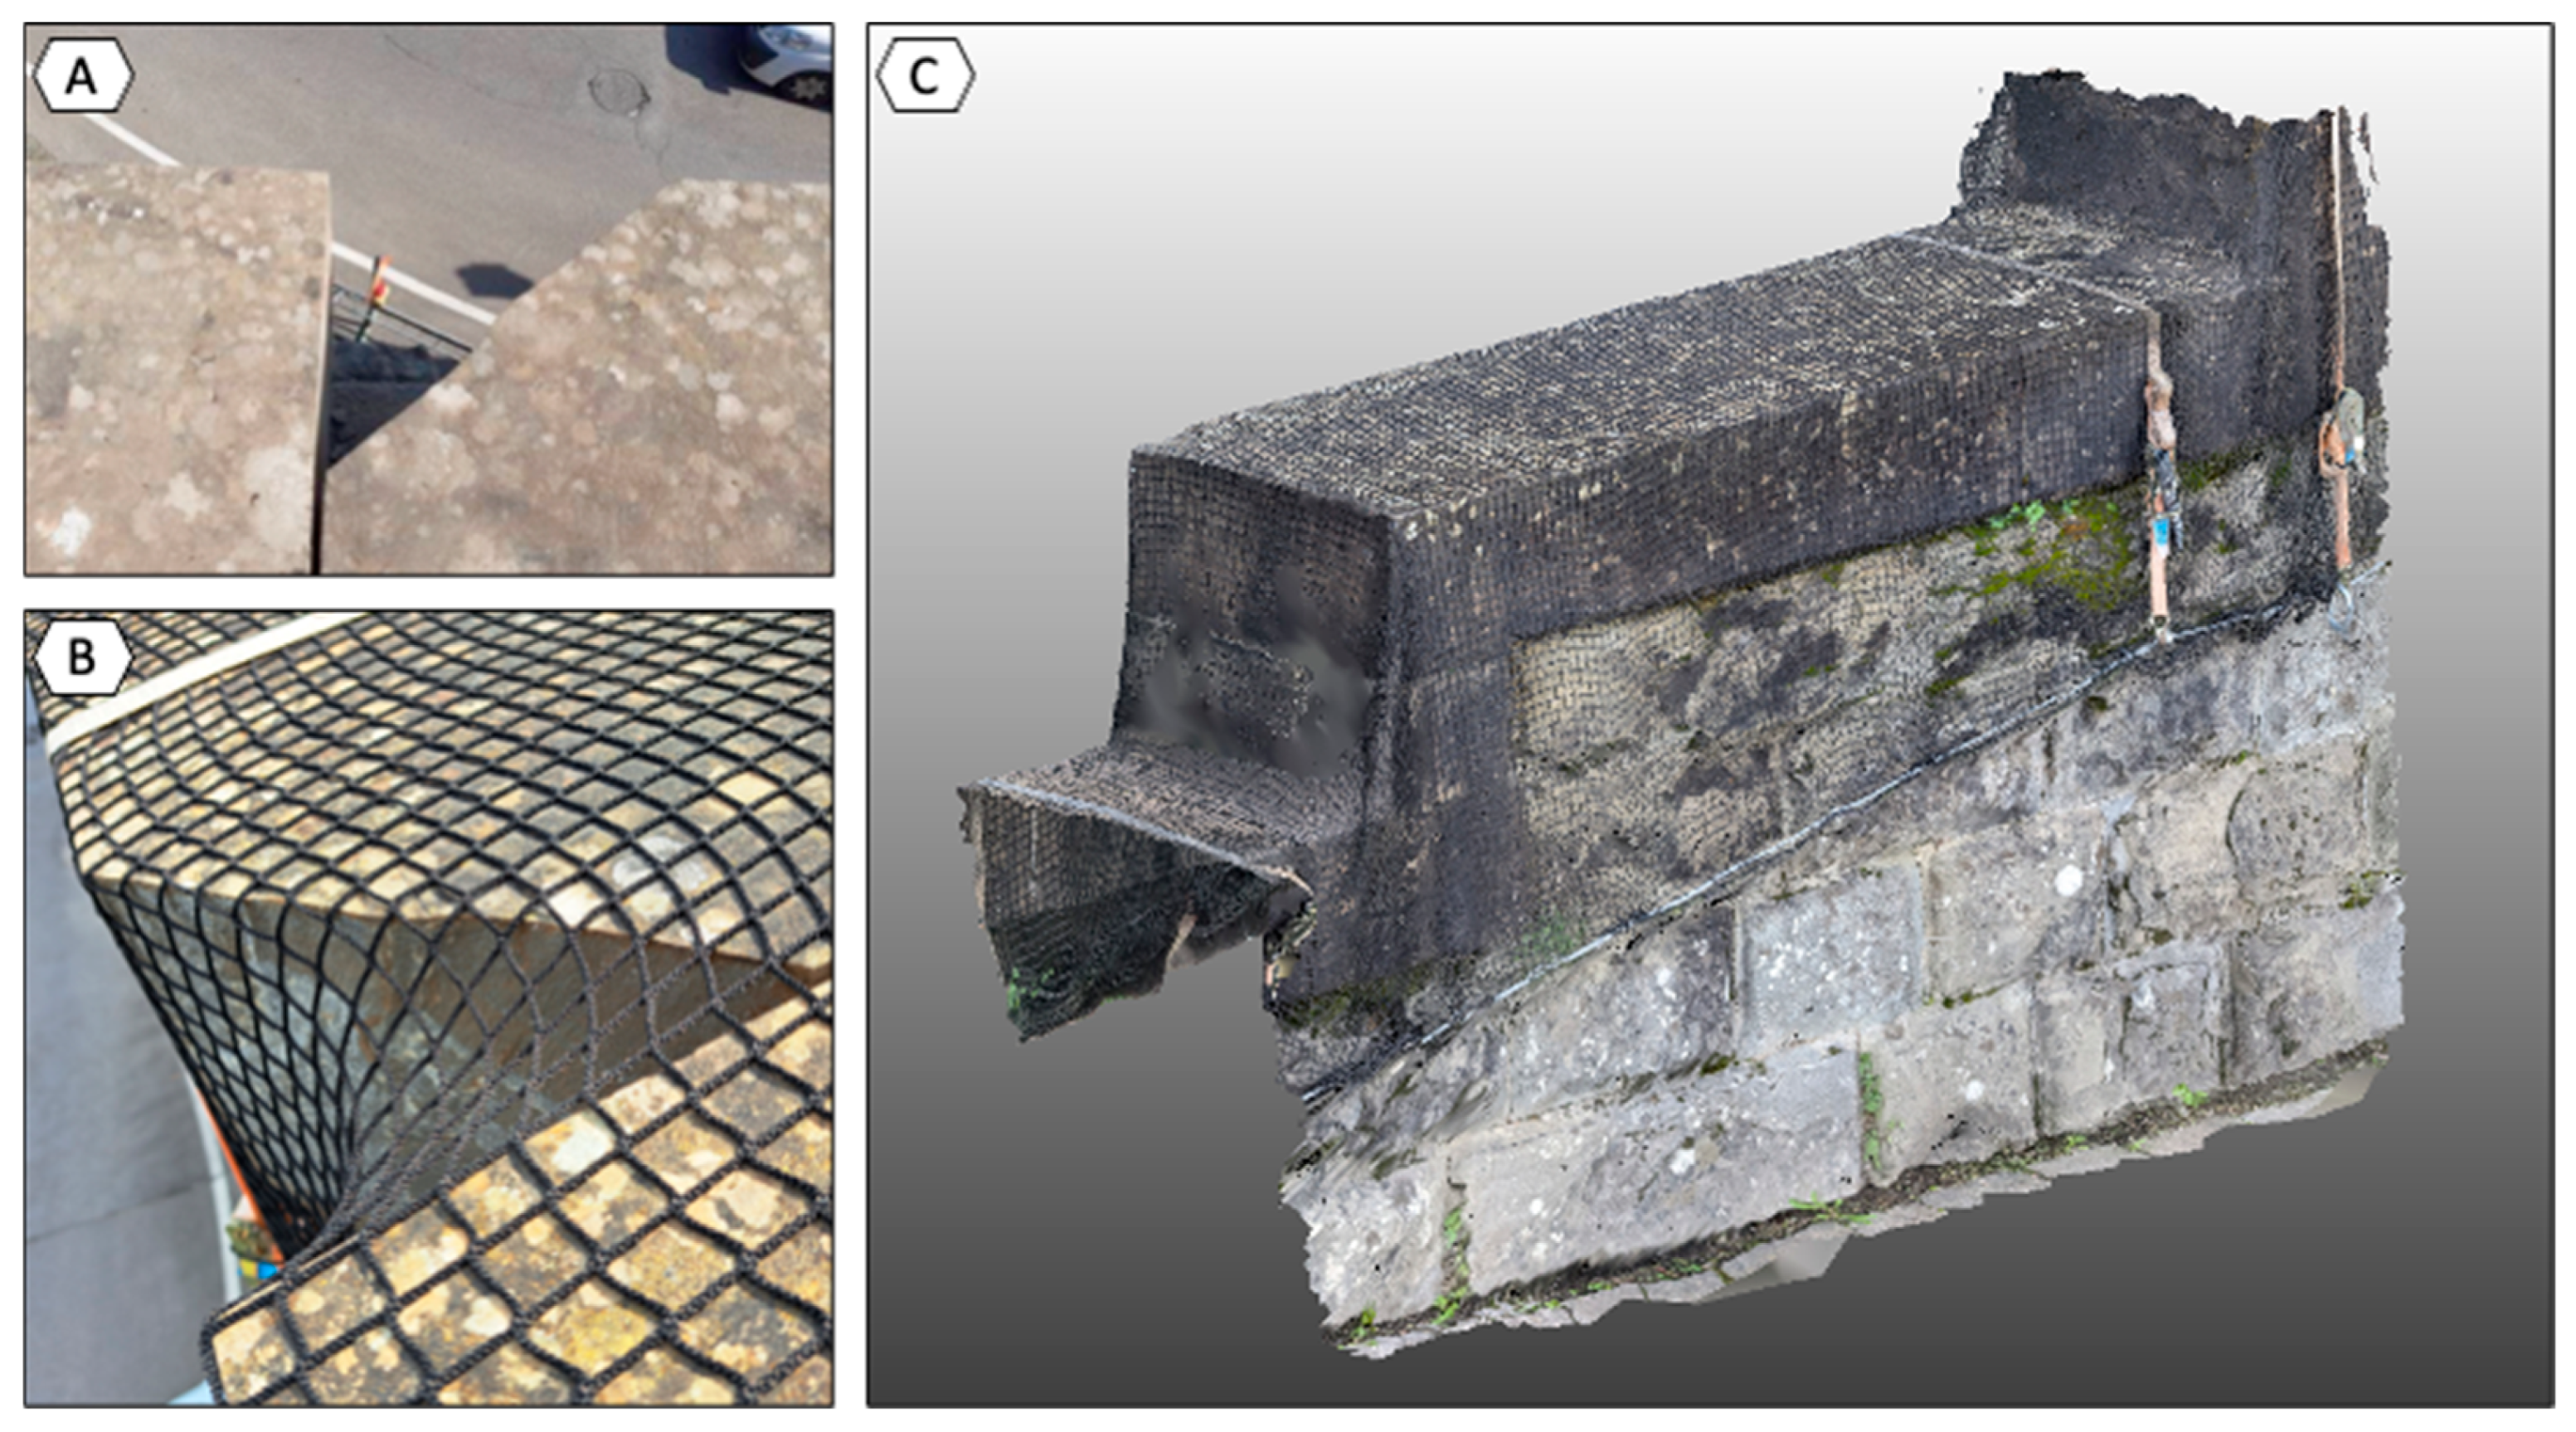
Despite a general renovation in 2019, a significant wedge failure occurred in July 2020, where a stone block detached from a coping and impacted a vehicle at the base of the structure (
Figure 3A,B). This event prompted urgent countermeasures; consequently, the copings of the ramps were secured by covering them with a net and tensioned ropes (
Figure 3C). These are temporary solutions that require in-depth risk assessment to properly design long-term countermeasures.
2.2. The Monument Rockfall Risk Assessment (MRRA) Methodology
The proposed MRRA methodology was developed as a heuristic framework to evaluate the relative detachment risk of stone elements in complex architectural environments where the use of traditional geomechanical equipment may be restricted. Due to the presence of safety nets installed after 2020, data collection was performed through close-range visual inspection and manual measurements. This approach allowed for the systematic identification and mapping of cracks, enabling the evaluation of the kinematic feasibility of potential block detachment.
The copings are larger than the underlying wall, resulting in a slight overhang of approximately 4 cm. This configuration implies that a possible fall would be vertical without involving significant rolling or sliding movements. Potential falls can occur on two sides: the “outer” side, facing the public roadway, and the “inner” side, facing the pedestrian staircase.
Within the MRRA framework, joints are identified and classified based on their persistence, aperture, and orientation. Each discontinuity was examined to assess its activity status, distinguishing between stable planes and those showing signs of potential movement, and identifying planar slides and wedge failures as the most common kinematic patterns. The stone portions delimited by these discontinuities are defined as “blocks”. The methodology specifically targets “potentially unstable blocks”, defined as rock sections with geometries prone to detachment, bounded by one or more exterior surfaces and random or persistent joints. Conversely, blocks that are geometrically constrained or structurally attached to the base are considered stable and were excluded from the assessment.
The MRRA approach adopts the landslide risk definition established by Varnes and the IAEG Commission on Landslides [
13], expressed as:
where
R is the landslide risk,
H is the landslide hazard,
VI is the vulnerability of elements considering the landslide intensity, and
E is the value of the element at risk (e.g., the number of people or monetary value of the damage).
The features of this case study can be described using the same categories as those used in rockfall events. Consequently, rockfall hazard assessment is the estimation of areas where rockfalls of a given type, volume, trajectory, and height may occur over a given period of time [
55]. This concept applies to the stone blocks examined here.
Hazard assessment can be based on the definition of the following probabilities: (i) spatial probability: the probability that a given area will be affected by a rockfall event; (ii) temporal probability: the probability that a given event will occur over time; (iii) size/volume probability: the probability that the rock will have a given size/volume [
55]. Specifically, spatial probability is defined as rockfall susceptibility.
While quantitative hazard assessments are ideal, heuristic techniques remain a standard and effective approach for susceptibility mapping, especially when temporal data are lacking [
29]. These methods, typically used in GIS environments to assign weights to internal and external parameters (e.g., slope, lithology) for large-scale screening, are adapted here to the architectural scale. By assigning heuristic weights to the specific geomechanical and geometric features of each stone block, the MRRA methodology provides a relative prioritisation of instabilities, consistent with the empirical screening logic proposed for larger rock masses.
Susceptibility (spatial probability of occurrence) was selected over hazard (spatial and temporal probability of occurrence) because of the challenge of finding sufficient data to assess the temporal probability of rockfall occurrence, which is typically expressed in terms of frequency, return period, or exceedance probability. The lack of a historical database of failure events for the site makes a deterministic frequency-volume relationship unfeasible. However, susceptibility evaluation can be viewed as a valid stand-alone tool for environmental impact assessments and spatial planning [
56]. This is especially relevant for small-scale analyses or when there are limited data on previous rockfall incidents, making it more challenging to determine the geographical and temporal probability of occurrence. Following the logic of heuristic screening for areas where temporal data are unavailable, the equation of landslide risk is adapted into a Relative Risk Index:
where
S is the susceptibility. Considering that damage
D is:
The final equation can be written as:
In this work, the risk assessment focused on cars and pedestrians. The Relative Risk of each unstable block (
Rb) was calculated as a dimensionless priority index considering its susceptibility, vulnerability, and elements at risk, following Equation (4). The methodologies used for the calculation of each parameter are described in the following paragraphs.
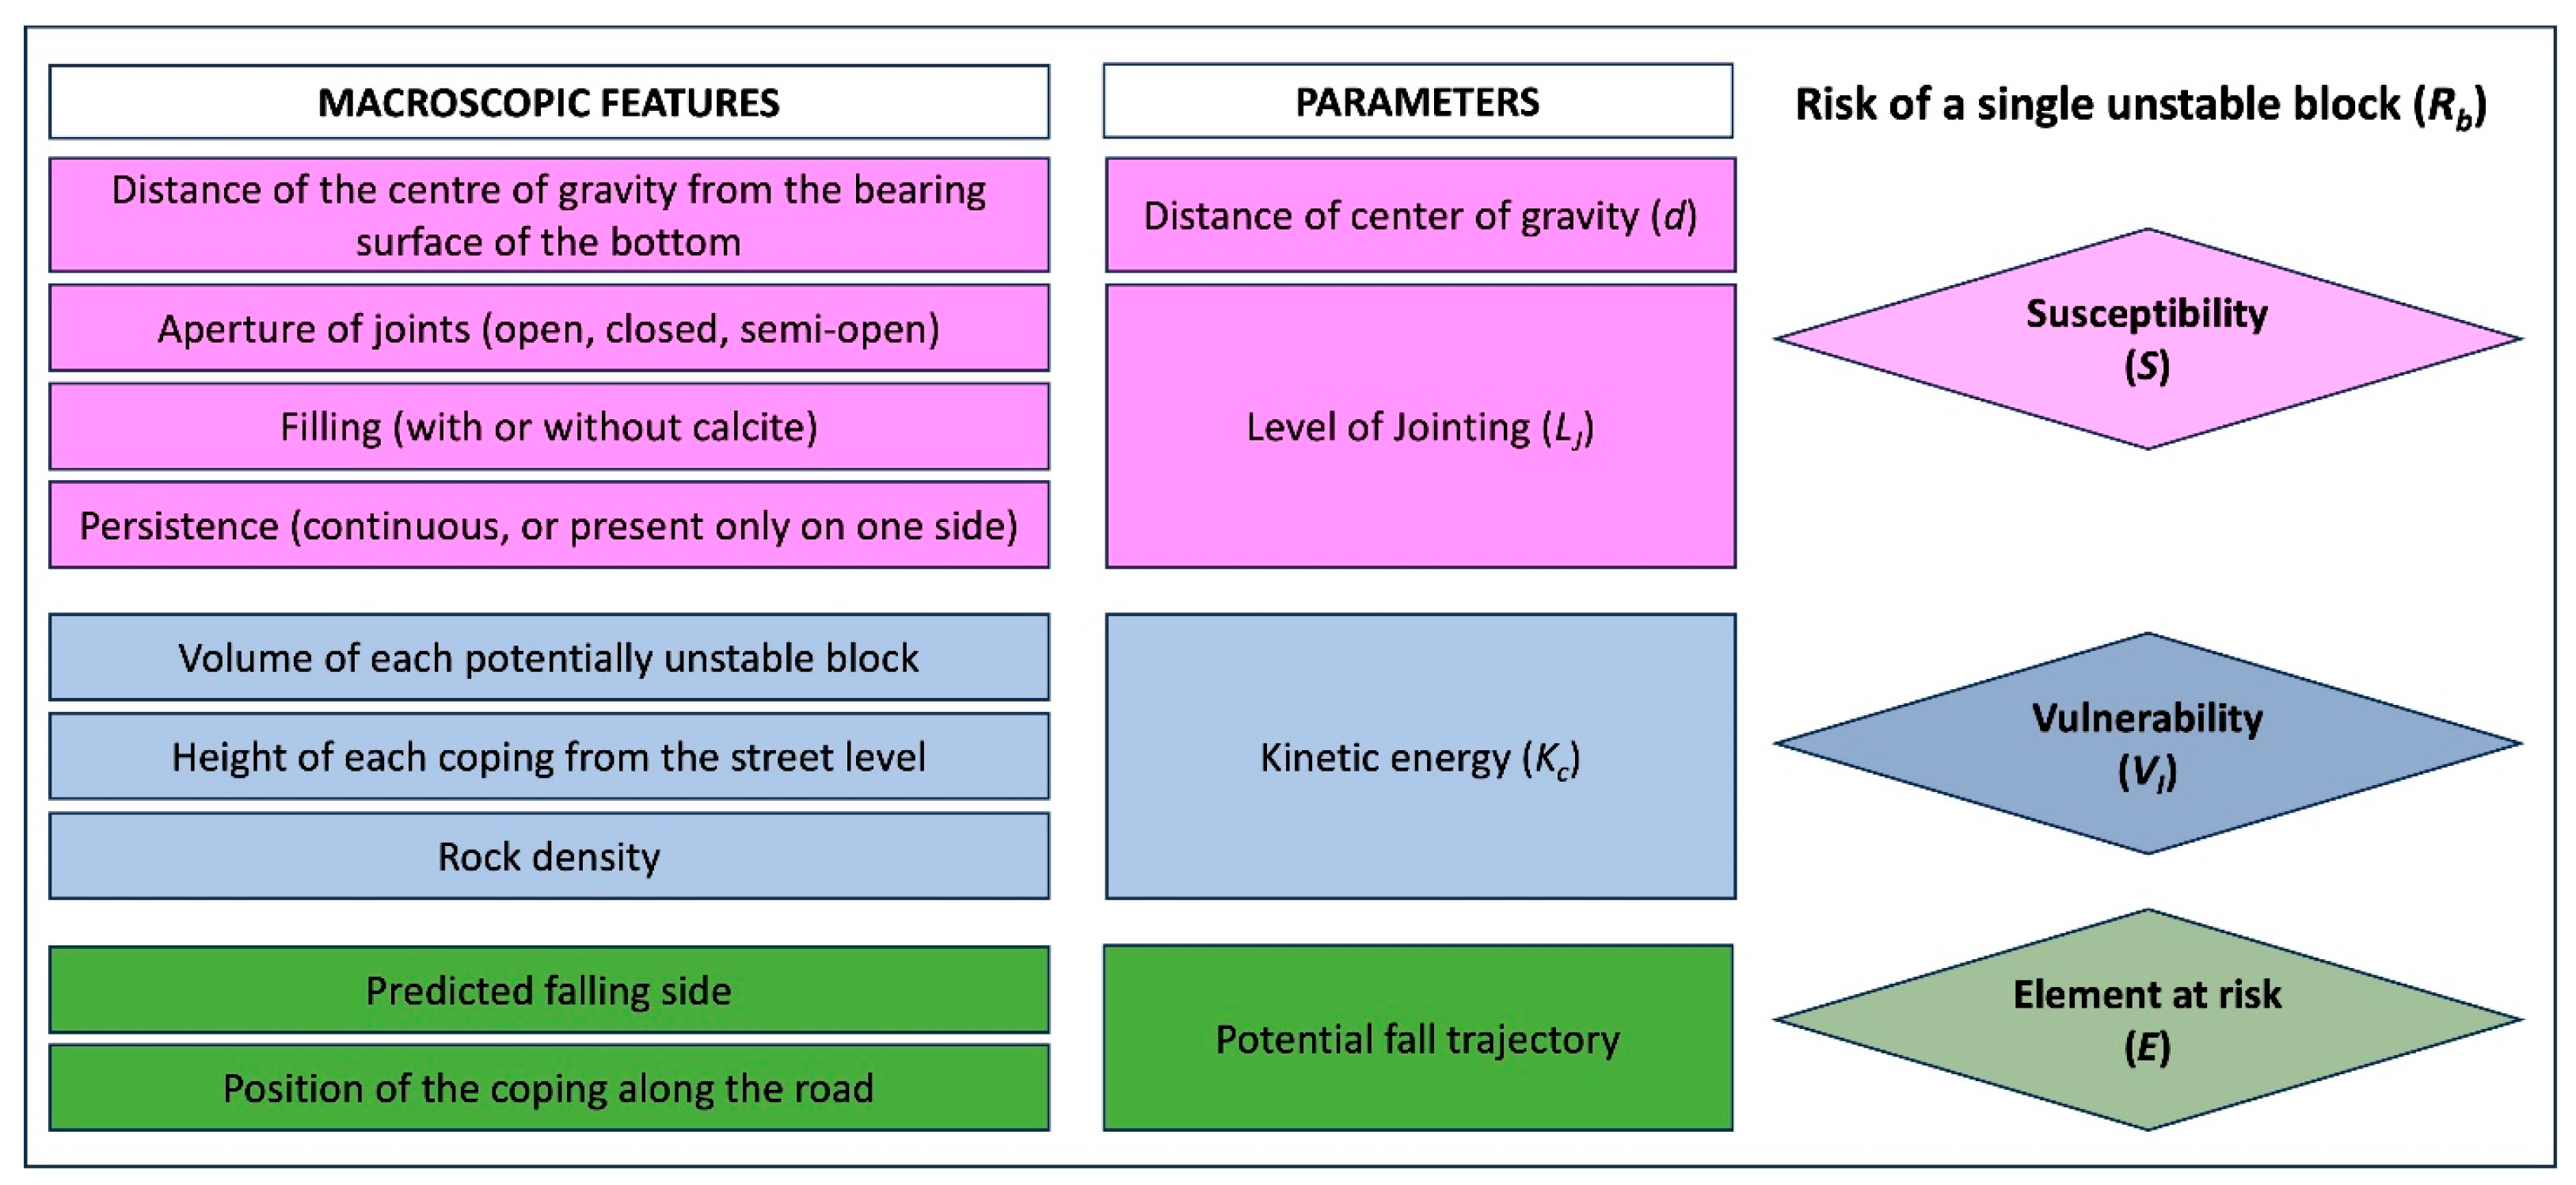
Figure 4 shows the macroscopic features that were considered as indicators for the parameters in the evaluation of detachment risk. The detailed rating system, including the physical rationale and the heuristic thresholds for each parameter (level of Jointing (
Lj), distance of centre of gravity (
d), vulnerability (
VI) and elements at risk (
E), is summarized in
Supplementary Materials, Table S1.
2.2.1. Susceptibility of Every Single Unstable Block
Susceptibility was calculated using heuristic indices and scores, evaluating two parameters: the Level of Jointing (Lj) and the Distance of Centre of Gravity (d).
The Level of Jointing (
Lj) of a block is obtained by assigning a score ranging from 0 (maximum continuity) to 5 (maximum discontinuity) (see
Table 1). This scoring system is based on the characteristics of the surfaces that define the block:
Maximum Discontinuity (Score = 5): The block is entirely bounded by open surfaces, indicating complete detachment and the highest potential instability.
Intermediate Cases (Score = 2 ± 0.5): Applies to blocks defined by a mix of open (1), semi-open (0.5), and closed surfaces (0).
Maximum Continuity (Score = 1): the block is fully bounded by closed surfaces, representing the greatest degree of cohesion with the rock mass and minimal risk.
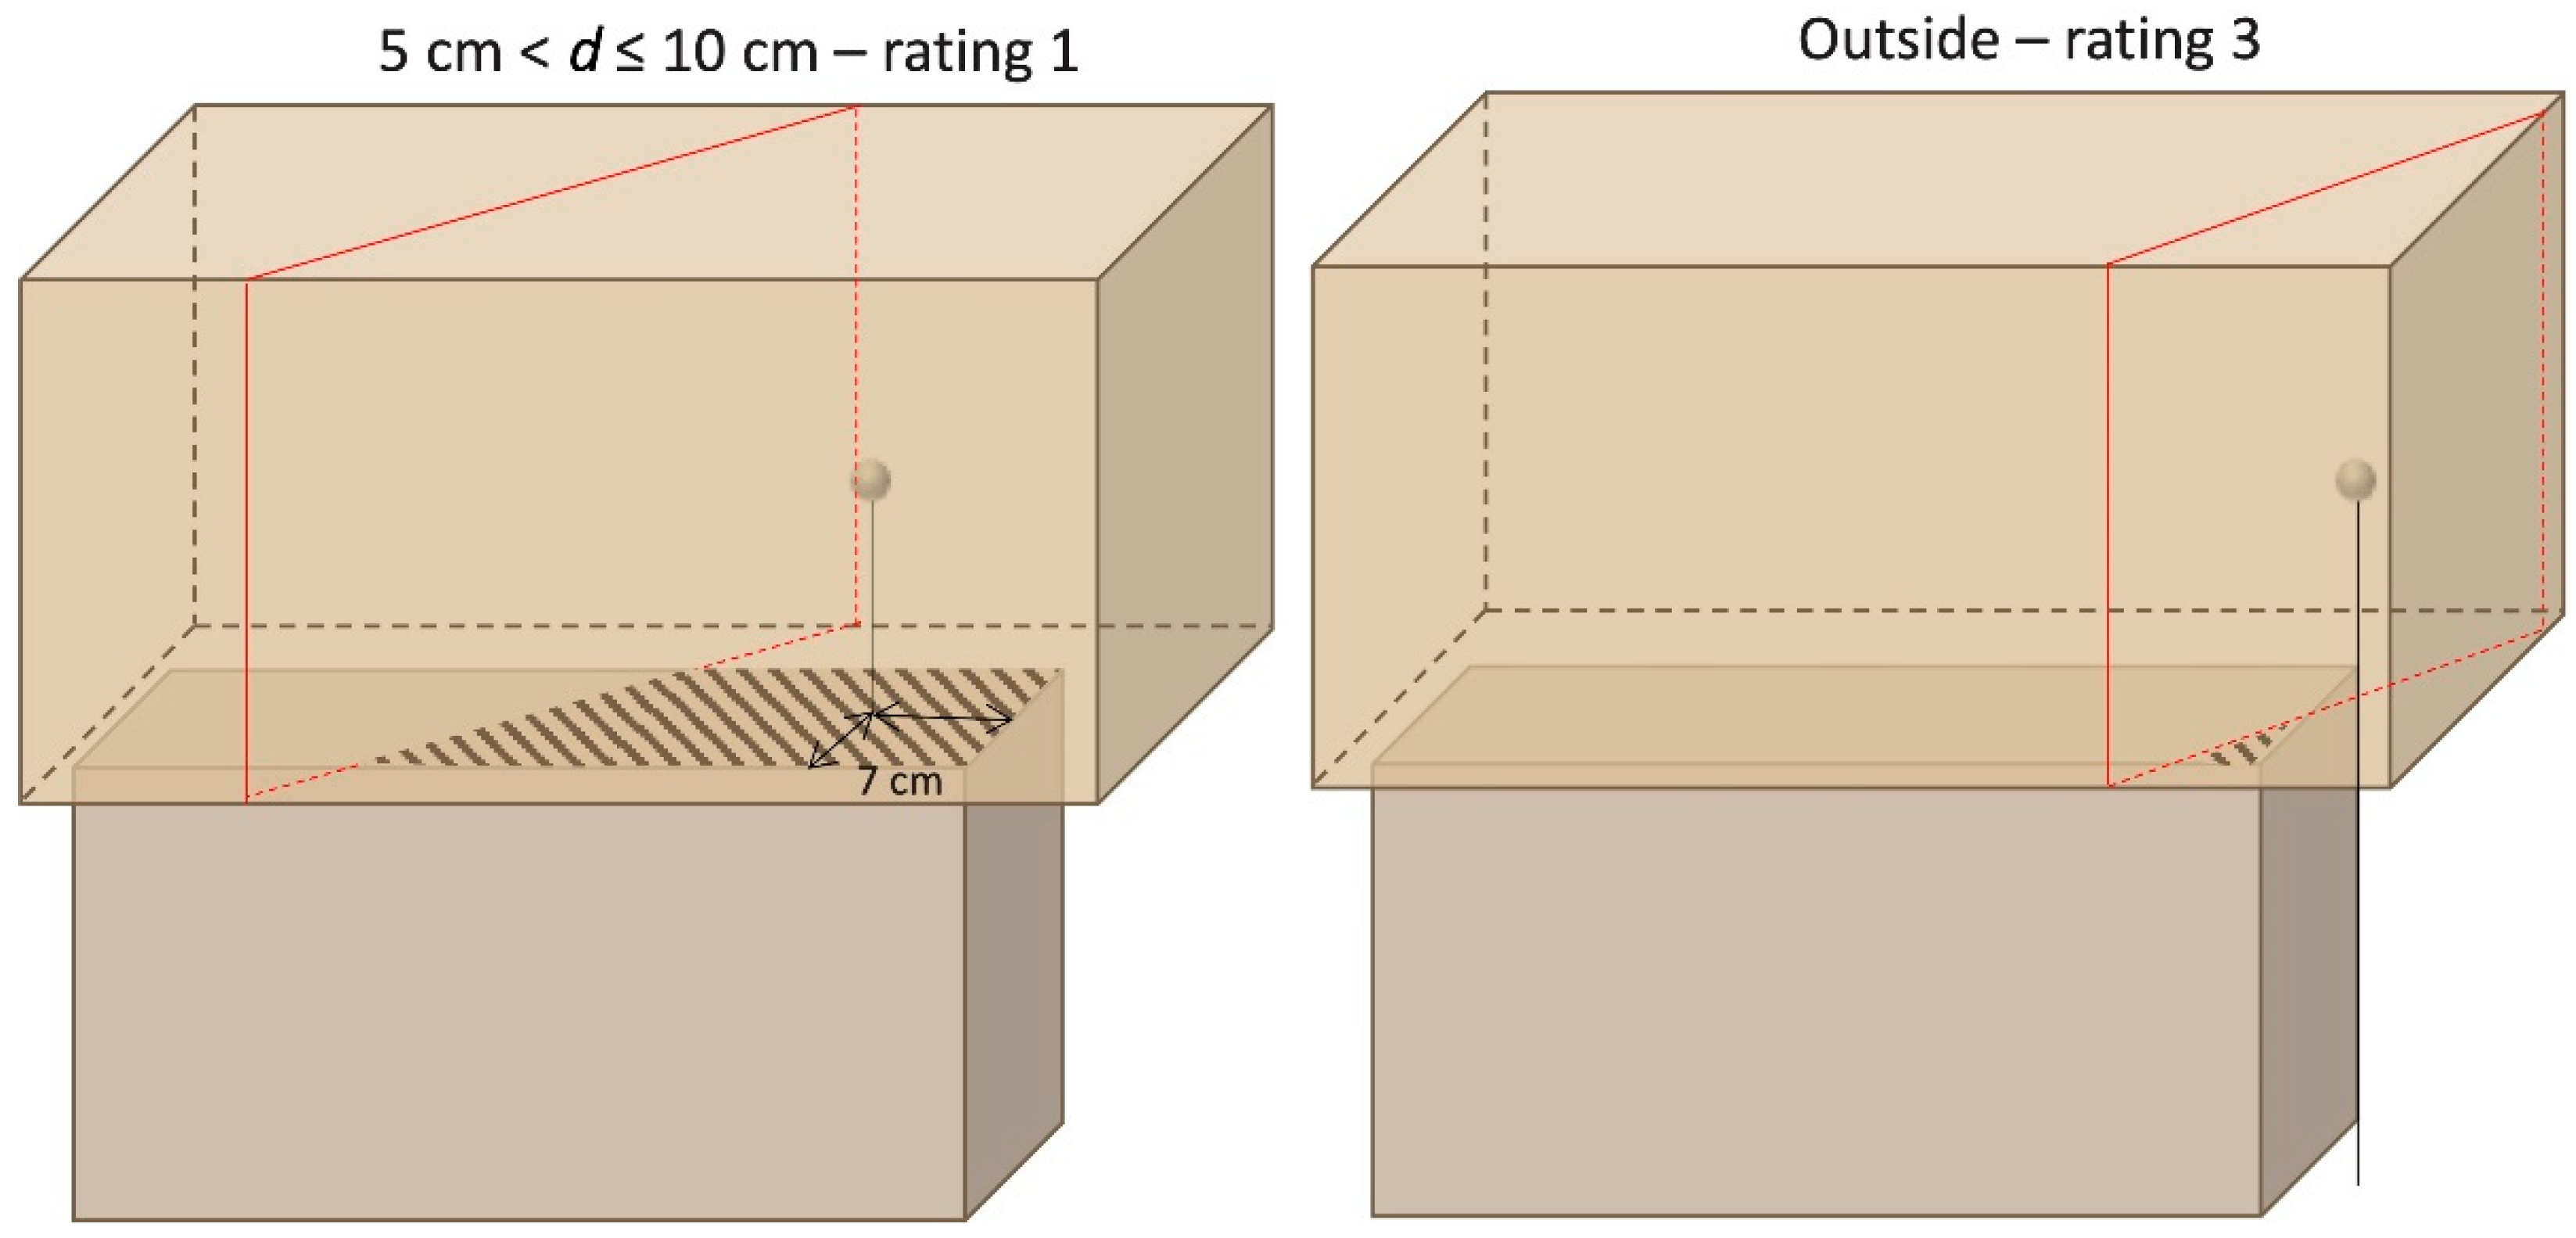
The Distance of Centre of Gravity (
d) is defined as the distance between the projection of the block’s centre of gravity on the base and its closest edge, an example is shown in
Figure 5. The rating values for the
d parameter are assigned as shown in
Table 1.
Susceptibility (
S) is calculated as follows (5):
2.2.2. Vulnerability of Each Unstable Block
Vulnerability is directly related to the intensity of the event. The calculated kinetic energy of a potentially unstable block on the wall determines the rockfall intensity. Consequently, the mass of the block (block volume and specific lithological density) and its initial position (or fall height) determine the magnitude of the rockfall.
Given the verticality of the wall and the protrusion of the copings, the fall trajectory is assumed to be vertical, with negligible dissipation of energy due to rolling or impact with other surfaces. Since the fall height is limited, air friction is neglected; therefore, the kinetic energy was calculated using the following equation:
where
Kc is the kinetic energy of the block,
h is the falling height of the unstable block,
ρ is the density of the boulder (the density value of 2.7 g/cm
3 was adopted for the Pietraforte [
51,
52]),
V* is the block volume and
g is gravitational acceleration.
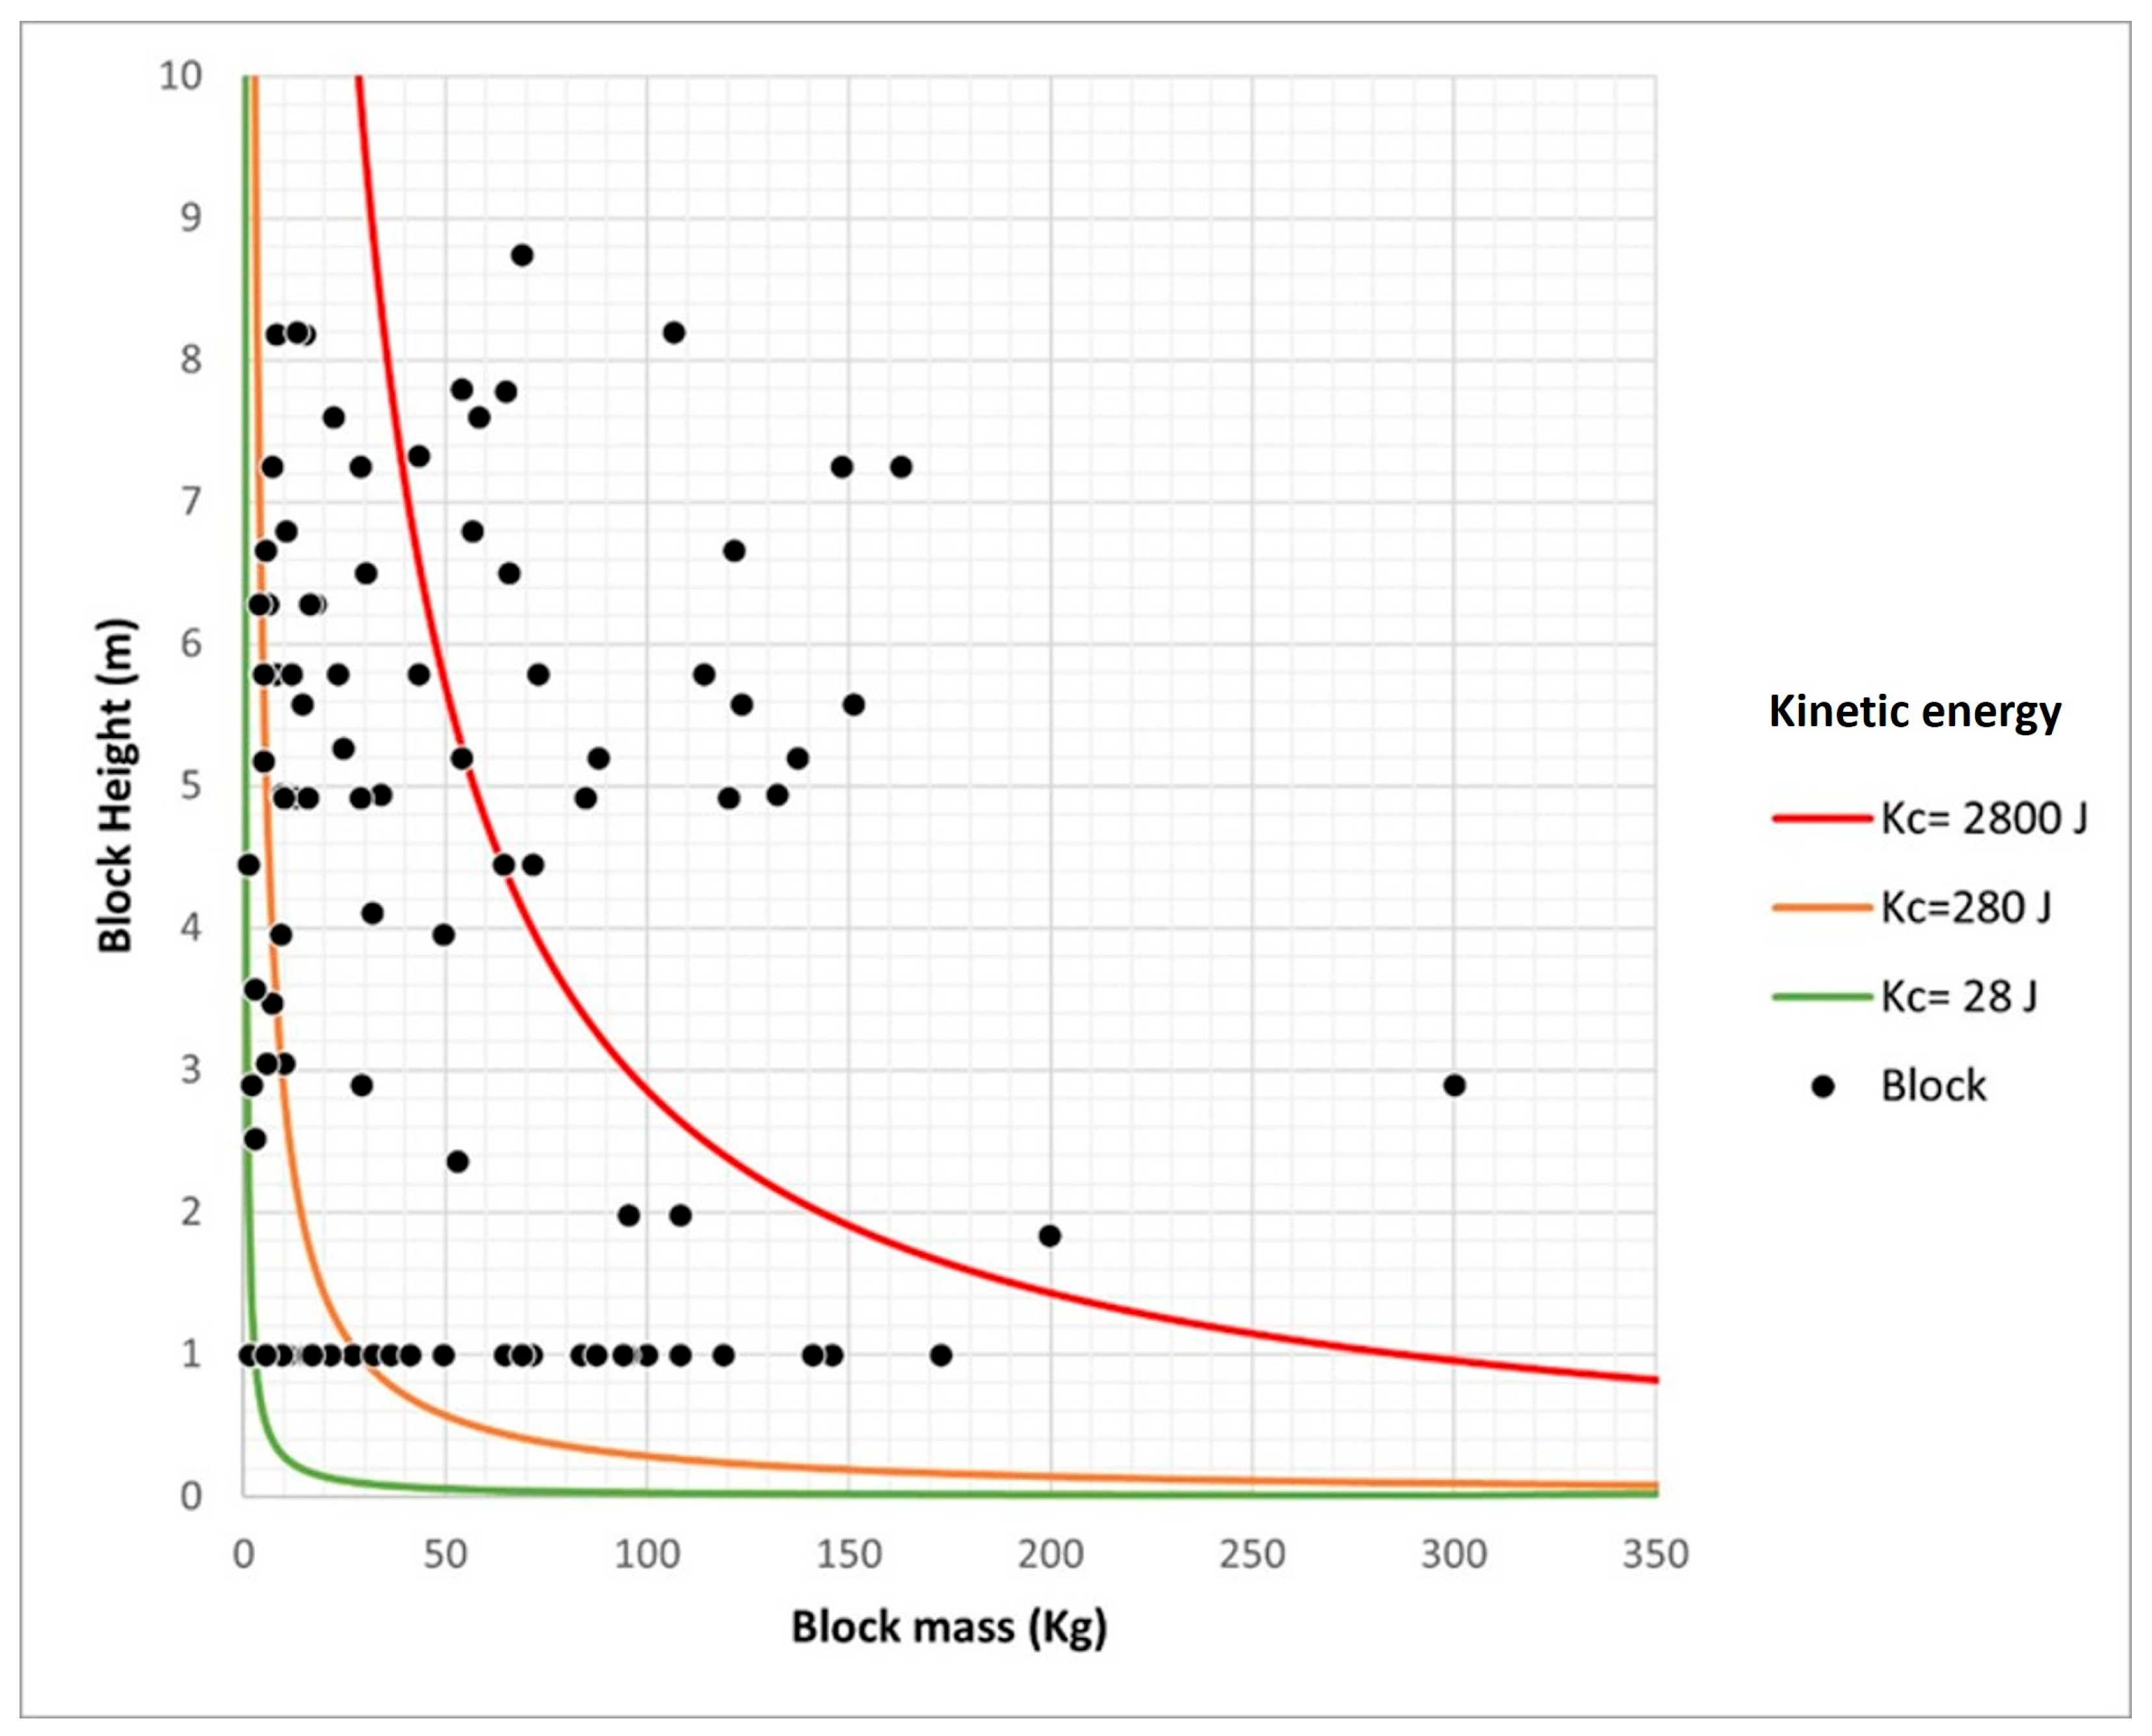
Specific thresholds were established to define low, medium, high, and very-high intensity classes based on the impact resistance of a human skull bone. This was evaluated in a study conducted to determine the biomechanics of the human head under quasistatic and dynamic loads [
57], and the overall average values for fracture were found to be 33.5 ± 8.5 J and 28.0 ± 5.1 J, respectively; this dynamic load value has been taken as the boundary for the lowest class. Given the elements at risk include individuals sheltered in vehicles or protected by helmets, higher thresholds are necessary. However, numerous uncertainties arise in such cases, influenced by various factors, such as windshield inclination, the impacted section of the vehicle, vehicle type (whether motorcycle or car), and variations in glass and sheet metal resistance across manufacturers. Therefore, the class boundaries were defined by powers of 10 (28 J, 280 J and 2800 J). To illustrate how the blocks analysed in the study fall within the different kinetic energy classes,
Figure 6 presents the plotted kinetic energy values of each block together with the thresholds adopted.
The Vulnerability value is based on the
Kc ranges and is assigned as shown in
Table 2.
2.2.3. Potential Damage of Every Unstable Block
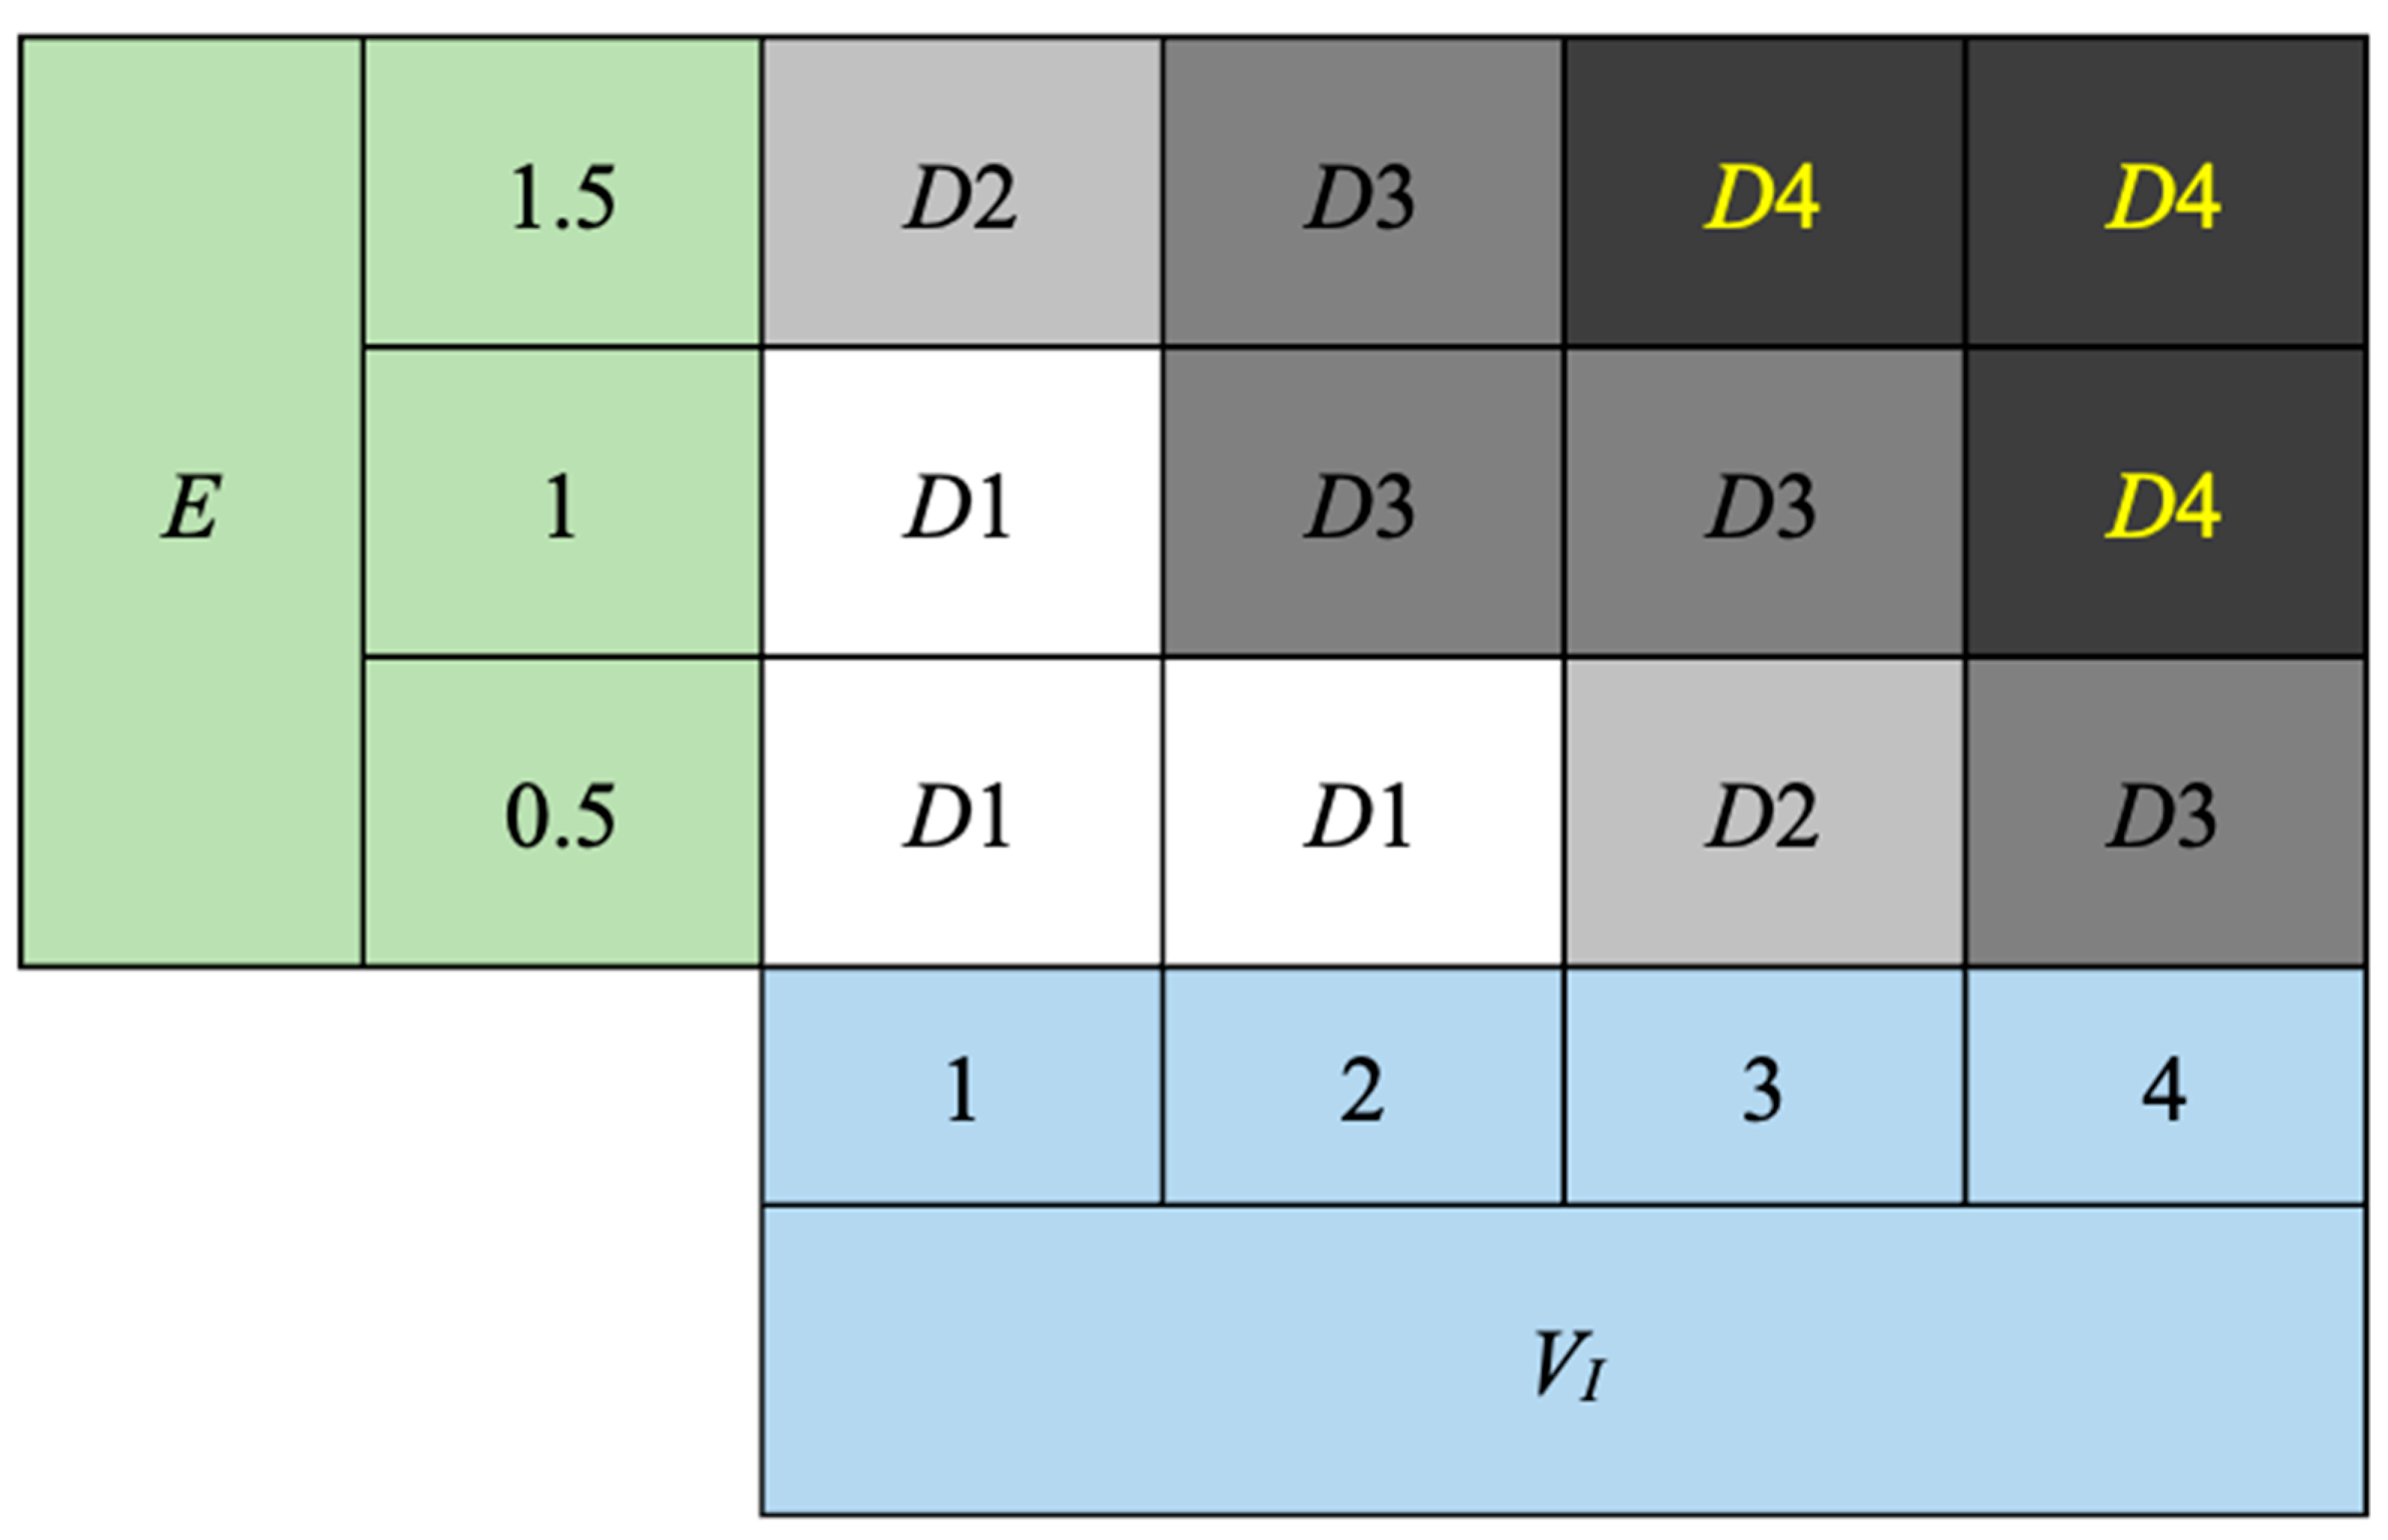
Damage (D) is calculated as the product of Vulnerability (VI) and Elements at Risk (E) (Equation (3)). Blocks falling onto the road, potentially striking both cars and pedestrians, were assigned a score of E = 1.5; those falling onto staircase side, where only pedestrians can pass, were assigned a score of E = 1; and blocks falling into fenced areas, where access is restricted but still possible, were assigned a score of E = 0.5.
The damage class value is obtained by multiplying the value of the element at risk by the vulnerability value. Notably, the falling height from the stairs side is always between 0.8 and 1.2 m. There are 4 classes of damage
D1,
D2,
D3,
D4, represented by a greyscale gradient ranging from white to deep grey (
Figure 7).
2.2.4. Risk of Unstable Blocks and Copings
The Relative Risk Index of each unstable block (Rb) was obtained using Equation (4), which incorporates the susceptibility value for each damage class.
The copings were defined as the minimum architectural unit for operational reasons, necessitating the grouping of blocks into units for field work and data processing. The coping risk index (
Rc) represents the cumulative risk of all unstable blocks within the coping, normalised to the maximum cumulative risk found in the dataset. This ensures that
Rc ranges from 0 to 100, making it a fast and intuitive way to highlight areas with the highest risk.
Rc is calculated using the following equation:
where
is the sum of all risk values of the blocks within a coping, and
is the maximum value obtained in each campaign where the MRRA method is applied.
2.2.5. Screening Performance Analysis
To assess the screening capacity of the model, the MRRA output was compared against independent expert judgement. Field-based expert observation remains the fundamental tool for identifying rockfall source hazards, as experienced professionals can identify potentially unstable compartments through direct wall inspection where automated methods might fail [
29]. Given the lack of a large historical dataset of failures, expert opinion was used as the operational benchmark, while acknowledging its inherent subjectivity compared to the geometric objectivity of the MRRA. A pool of eleven experts with experience in rock stability and risk assessment in stone-built Cultural Heritage independently judged every coping, flagging either Risk (1) or No Risk (0).
Given the inherent variability of the data, the parameter against which the model’s performance was compared is the mode of the value assigned values among all the experts. The confusion matrix for a binary classifier is a common tool used for performance assessments of classification models [
58] that compares reference and model-assigned outcomes. Actual values are labelled as True (1) and False (0), while predicted outcomes are categorised as Positive (P) and Negative (N). The classification model’s agreement is evaluated using four key metrics: TP (True Positive), TN (True Negative), FP (False Positive), and FN (False Negative), defined as follows:
TP (True Positive): a data point is classified as True Positive (TP) when a positive outcome is predicted, and the actual outcome is also positive.
FP (False Positive): a data point is classified as False Positive (FP) when a positive outcome is predicted, but the actual outcome is negative.
FN (False Negative): a data point is classified as False Negative (FN) when a negative outcome is predicted, but the actual outcome is positive.
TN (True Negative): a data point is classified as True Negative (TN) when a negative outcome is predicted, and the actual outcome is also negative.
The outcomes of the confusion matrix are then used to calculate the performance parameters of Accuracy, Precision and Recall described as follows:
Accuracy: the number of correct predictions (TP + TN) made by the model divided by the total number of predictions (TP + TN + FP + FN). This metric reflects the overall agreement of the model, but is insensitive to overfitting in imbalanced datasets, a common instance in risk assessment models where a high-risk event may be overlooked.
Precision: the number of correct positive predictions (TP), divided by the total number of positive predictions (TP + FP). Compared to accuracy, it emphasises the importance of the true/false positives ratio, highlighting the tendency to overestimate the diagnostic capacity of a risk assessment model that produces many false alarms.
Recall: the number of correct positive predictions (TP), divided by the number of positive instances (TP + FN). This is an important metric when evaluating a risk assessment model, where a false negative means a potentially hazardous situation is not flagged.
3. Results
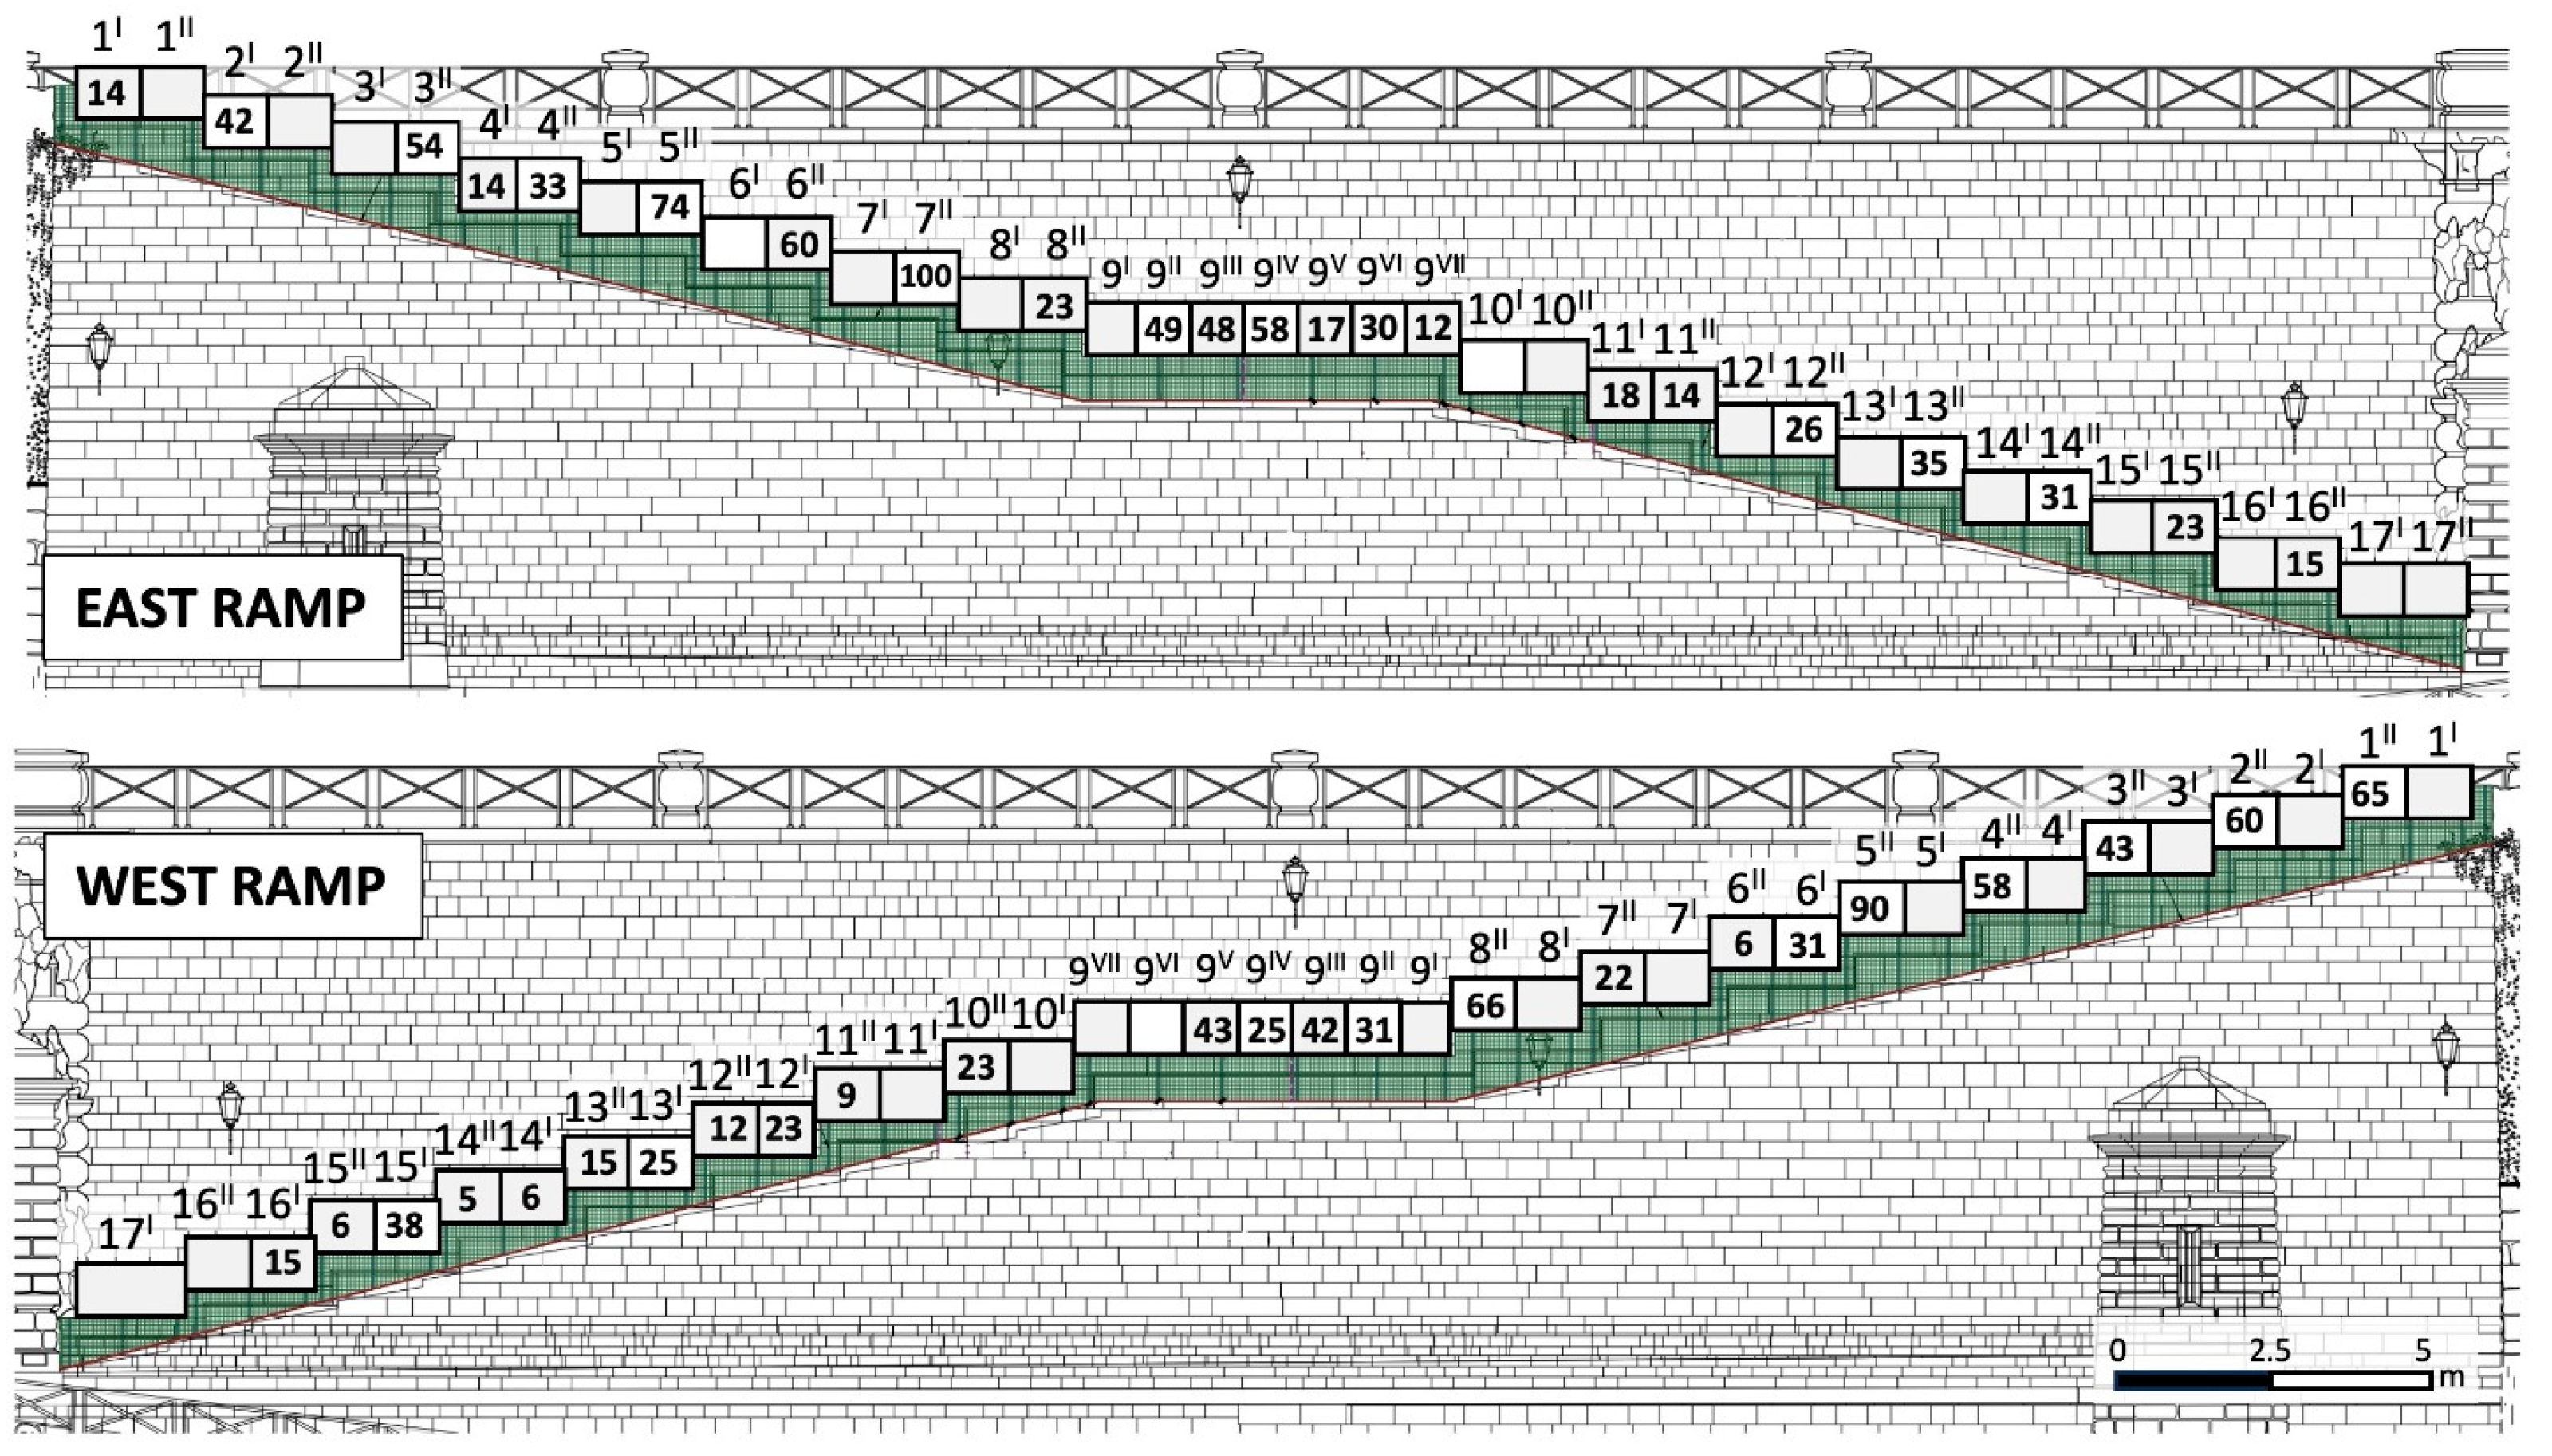
Out of the total 78 copings present in the Piazzale Michelangelo ramps, only 48 exhibited unstable blocks; among them, 100 potentially unstable blocks were identified. The MRRA method was applied to these copings (
Figure 8), focusing on a heuristic prioritisation of the most critical elements. The analysis identified several high-priority areas, particularly in the upper sections of both the eastern and western ramps. These areas were characterised by higher Relative Risk Index scores, driven by significant fall heights and proximity to pedestrian and vehicular areas. To demonstrate the application and effectiveness of the MRRA framework, three examples are presented: the first is the single-block back-analysis of the 2020 failure, while the remaining two illustrate the complete methodology applied to entire copings, representing different risk scenarios and instability conditions. The first example is the coping W4
II, which was the subject of the block failure previously presented in
Figure 3. The block was back-analysed as if it were still in place, although it had already detached. The block is bounded by open surfaces on all sides, and its centre of gravity is located outside of the supporting structure, yielding a susceptibility score of 8 (
Lj = 5,
d = 3). The block has an approximate mass of 16.1 kg and a height of about 7.6 m, resulting in a
Kc of approximately 1208 J (
VI = 3). Located on the outer side of the staircase, both pedestrians and cars are exposed to the falling block (
E = 1.5). The
D (
E ×
VI) is 3 × 1.5 (
D = 4), thus the Relative Risk Index of the block (
D •
S) is
Rb = 32 (4 • 8). Thus, the block that fell in July 2020 scores the maximum theoretical risk possible. Although limited to a single event, this illustrative back-analysis demonstrates the model’s capability to flag severe instabilities, though it does not constitute a statistical validation: the framework successfully assigned the actual failure mechanism the highest possible severity score.
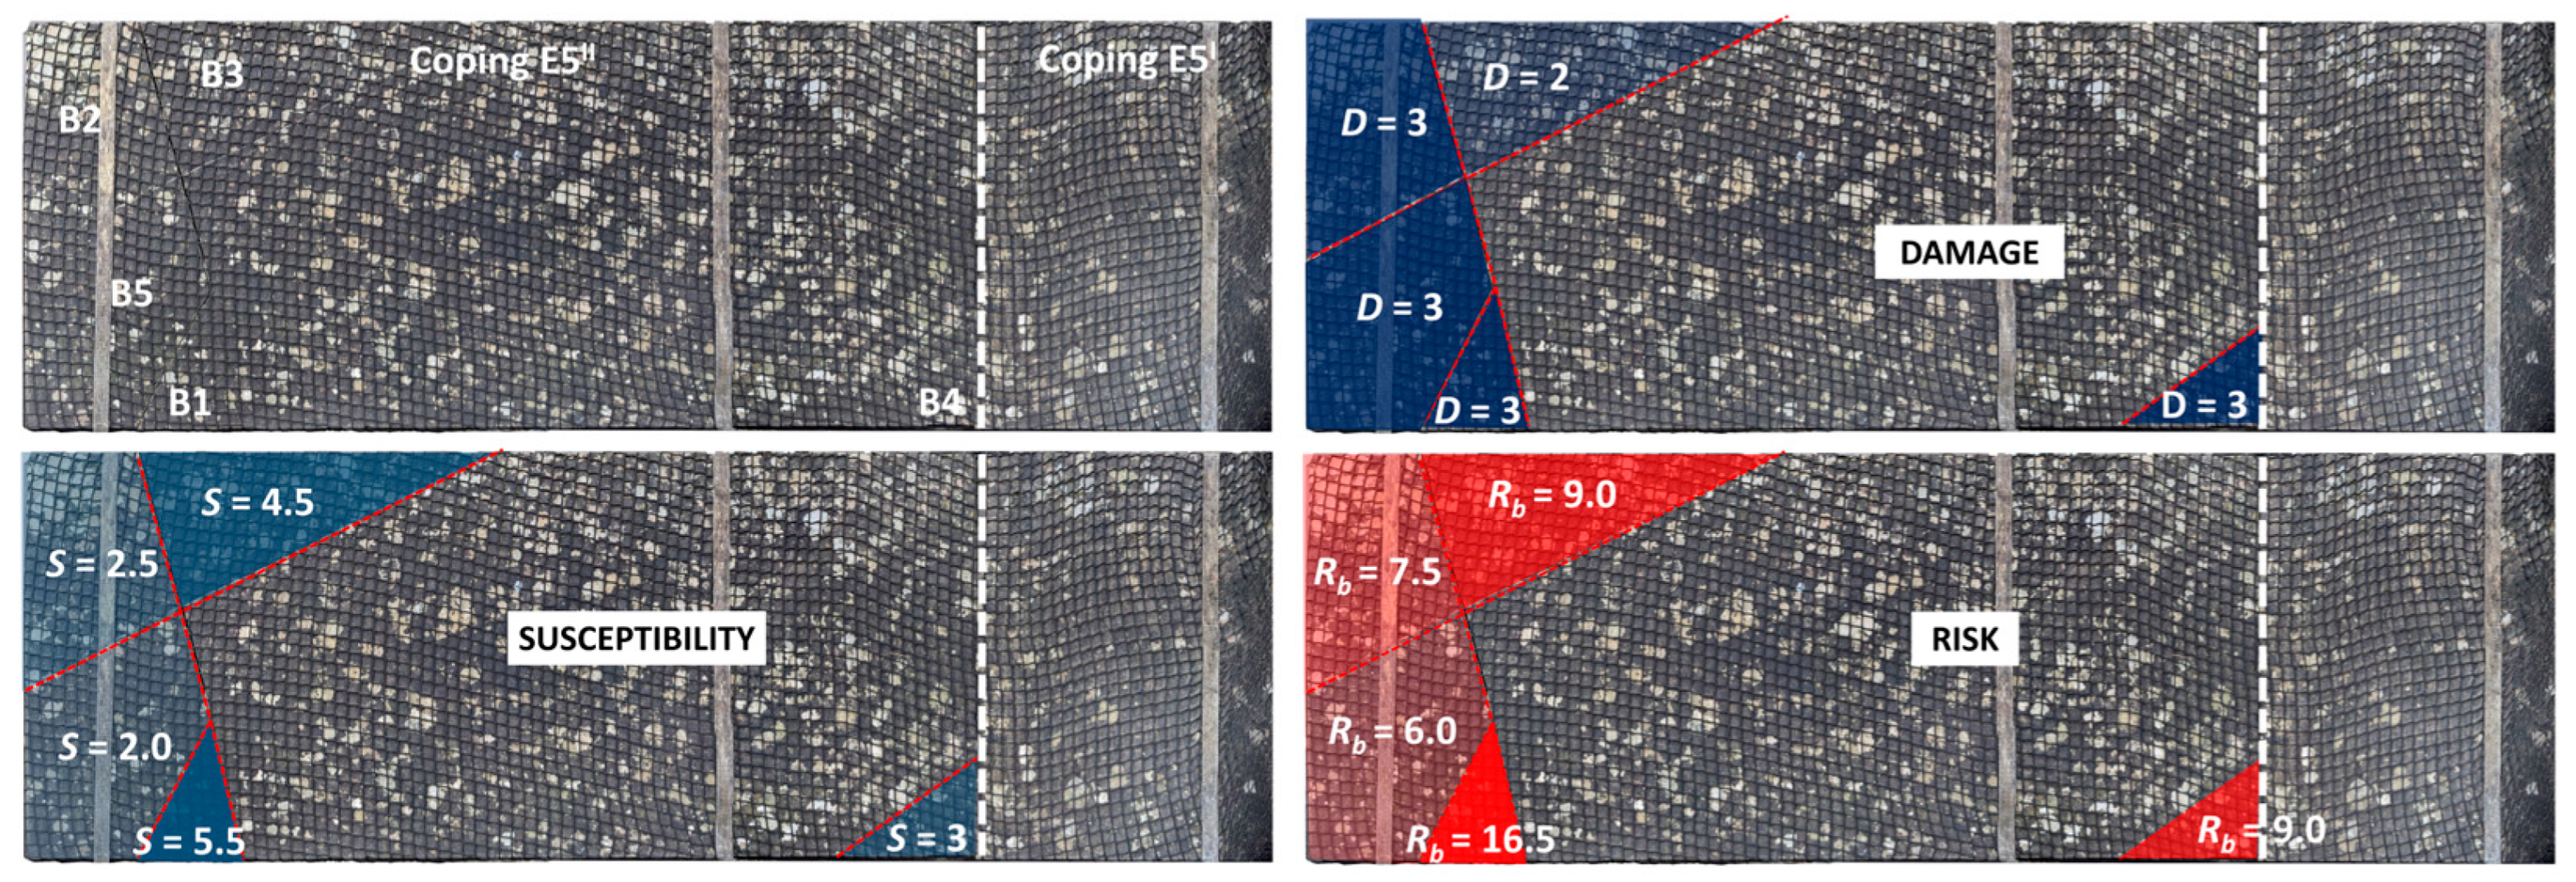
Figure 9 illustrates the other two examples, copings number E5
I and E5
II on ramp E. The coping E5
II has five potentially unstable blocks (B1, B2, B3, B4 and B5), while E5
I has no potentially unstable blocks.
Block B1 is situated on the inner side of the ramp, towards the staircase. It is bounded by an open fracture and a semi-closed fracture, with the centre of gravity positioned outside (i.e., overhang). Consequently, this block yields a susceptibility score of 5.5 (Lj = 2.5, d = 3). The block has an approximate mass of 14.6 kg and a height of about 1 m, resulting in a Kc of approximately 143 J (VI = 2). Located on the inner side, only pedestrians are at risk (E = 1). The D (E × VI) is 2 × 1 (D = 3), thus the Relative Risk Index of the block (D • S) is Rb = 16.5 (3 • 5.5).
Block B2 is situated on the external side of the ramp, adjacent to a fenced area. It is bounded by an open fracture and a semi-closed fracture, with the centre of gravity positioned 12 cm from the edge of the underlying block. This block has a susceptibility score of 2.5 (Lj = 2.5, d = 0). The mass of B2 is approx. 56.7 kg with a height of about 6.8 m, resulting in a Kc of approximately 3779 J (VI = 4). There are no elements at risk due to the presence of a fenced area (E = 0.5). The D is 0.5 × 4 = (D = 3), thus the Relative Risk Index of the block (D • S) is Rb = 7.5 (3 • 2.5).
Block B3 is situated on the external side of the ramp, towards a fenced area. It is bounded by an open fracture and a semi-closed fracture, with the centre of gravity of the block positioned 2 cm from the edge of the underlying block. This block has a susceptibility score of 4.5 (Lj = 2.5, d = 2). It has an approximate mass of 54 kg and a height of about 6.8 m, resulting in a Kc of approximately 3599 J (VI = 4). There are no elements at risk due to the presence of a fenced area (E = 0.5). The D is 0.5 × 4 (D = 2), thus the Relative Risk Index of the block (D • S) is Rb = 9 (2 • 4.5).
Block B4 is situated on the inner side of the ramp, towards the staircase. It is bounded by two closed fractures, with the centre of gravity of the block positioned 2 cm from the edge of the underlying block. This block has a susceptibility score of 3 (Lj = 1, d = 2). It has an approximate mass of 10.7 Kg and a height of about 1 m, resulting in a kinetic energy of approximately 105 J (VI = 2). The element at risk is solely pedestrians (E = 1). The D is 2 × 1 (D = 3), thus the Relative Risk Index of the block (D • S) is Rb = 9 (3 • 3).
Block B5 is situated on the inner side of the ramp, towards the staircase. It is bounded by one open fracture, and two semi-closed fractures, with the centre of gravity positioned 14 cm from the edge of the underlying block. This block has a susceptibility score of 2 (Lj = 2, d = 0). It has an approximate mass of 55.7 Kg and a height of about 1 m, resulting in a kinetic energy of approximately 546 J (VI = 3). The element at risk is solely pedestrians (E = 1). The D is 3 × 1 (D = 3), thus the Relative Risk Index of the block (D • S) is Rb = 6 (3 • 2). For the calculation of the risk for the copings (Rc), Equation (7) was applied. Since coping E5I has no potentially unstable blocks, its risk is not calculated. The coping E5II has 5 potentially unstable blocks with Rb 16.5, 7.5, 9, 9, 6, respectively, for a total of 48. Considering that the coping with the highest is E7II with a value of 65, the block in example (E5II) has Rc = 74 (48/65)/100).
4. Discussion
The MRRA was developed to bridge the gap between qualitative inspections and complex quantitative simulations, providing a scalable tool for heritage managers. As outlined in
Section 2.2.5, the MRRA output was compared against expert judgment, not as a validation against an “absolute truth”, but as an assessment of the model’s consistency with established human perceived risk.
A recognized limitation of the current MRRA framework is the absence of a formal sensitivity analysis on the heuristically assigned weights. Given the preliminary, screening nature (Tier 1) of the index, parameters were weighted based on expert consensus and observational principles established in rock mechanics applied to cultural heritage, similar to other widely accepted heuristic rating systems [
22,
26]. While a parametric sensitivity analysis would provide insights into the numerical robustness of the index, it falls outside the scope of this rapid qualitative assessment and might inadvertently imply a deterministic precision that the model does not claim to possess. Since the method produces a continuous risk value (0–100) rather than a binary output, the establishment of an operational risk threshold is a crucial step in the decision-making process. While studies on stone heritage [
41,
54] have provided essential benchmarks for the inventory and state of conservation of historical elements, the MRRA introduces a micro-scale heuristic prioritisation tool. This approach shifts the focus from descriptive decay mapping to an operational ranking system.
4.1. Risk Thresholds and Trade-Offs in Performance Metrics
The selection of risk thresholds involves complex considerations that extend beyond geomechanical parameters. As noted in the literature [
59], this choice must integrate social and economic factors, including the acceptable level of risk, financial capabilities for intervention, and the multi-faceted values of cultural heritage (historical, symbolic, and aesthetic). Because these factors are highly site-specific and dependent on local regulations or management’s sensitivity, the MRRA methodology was designed to be flexible.
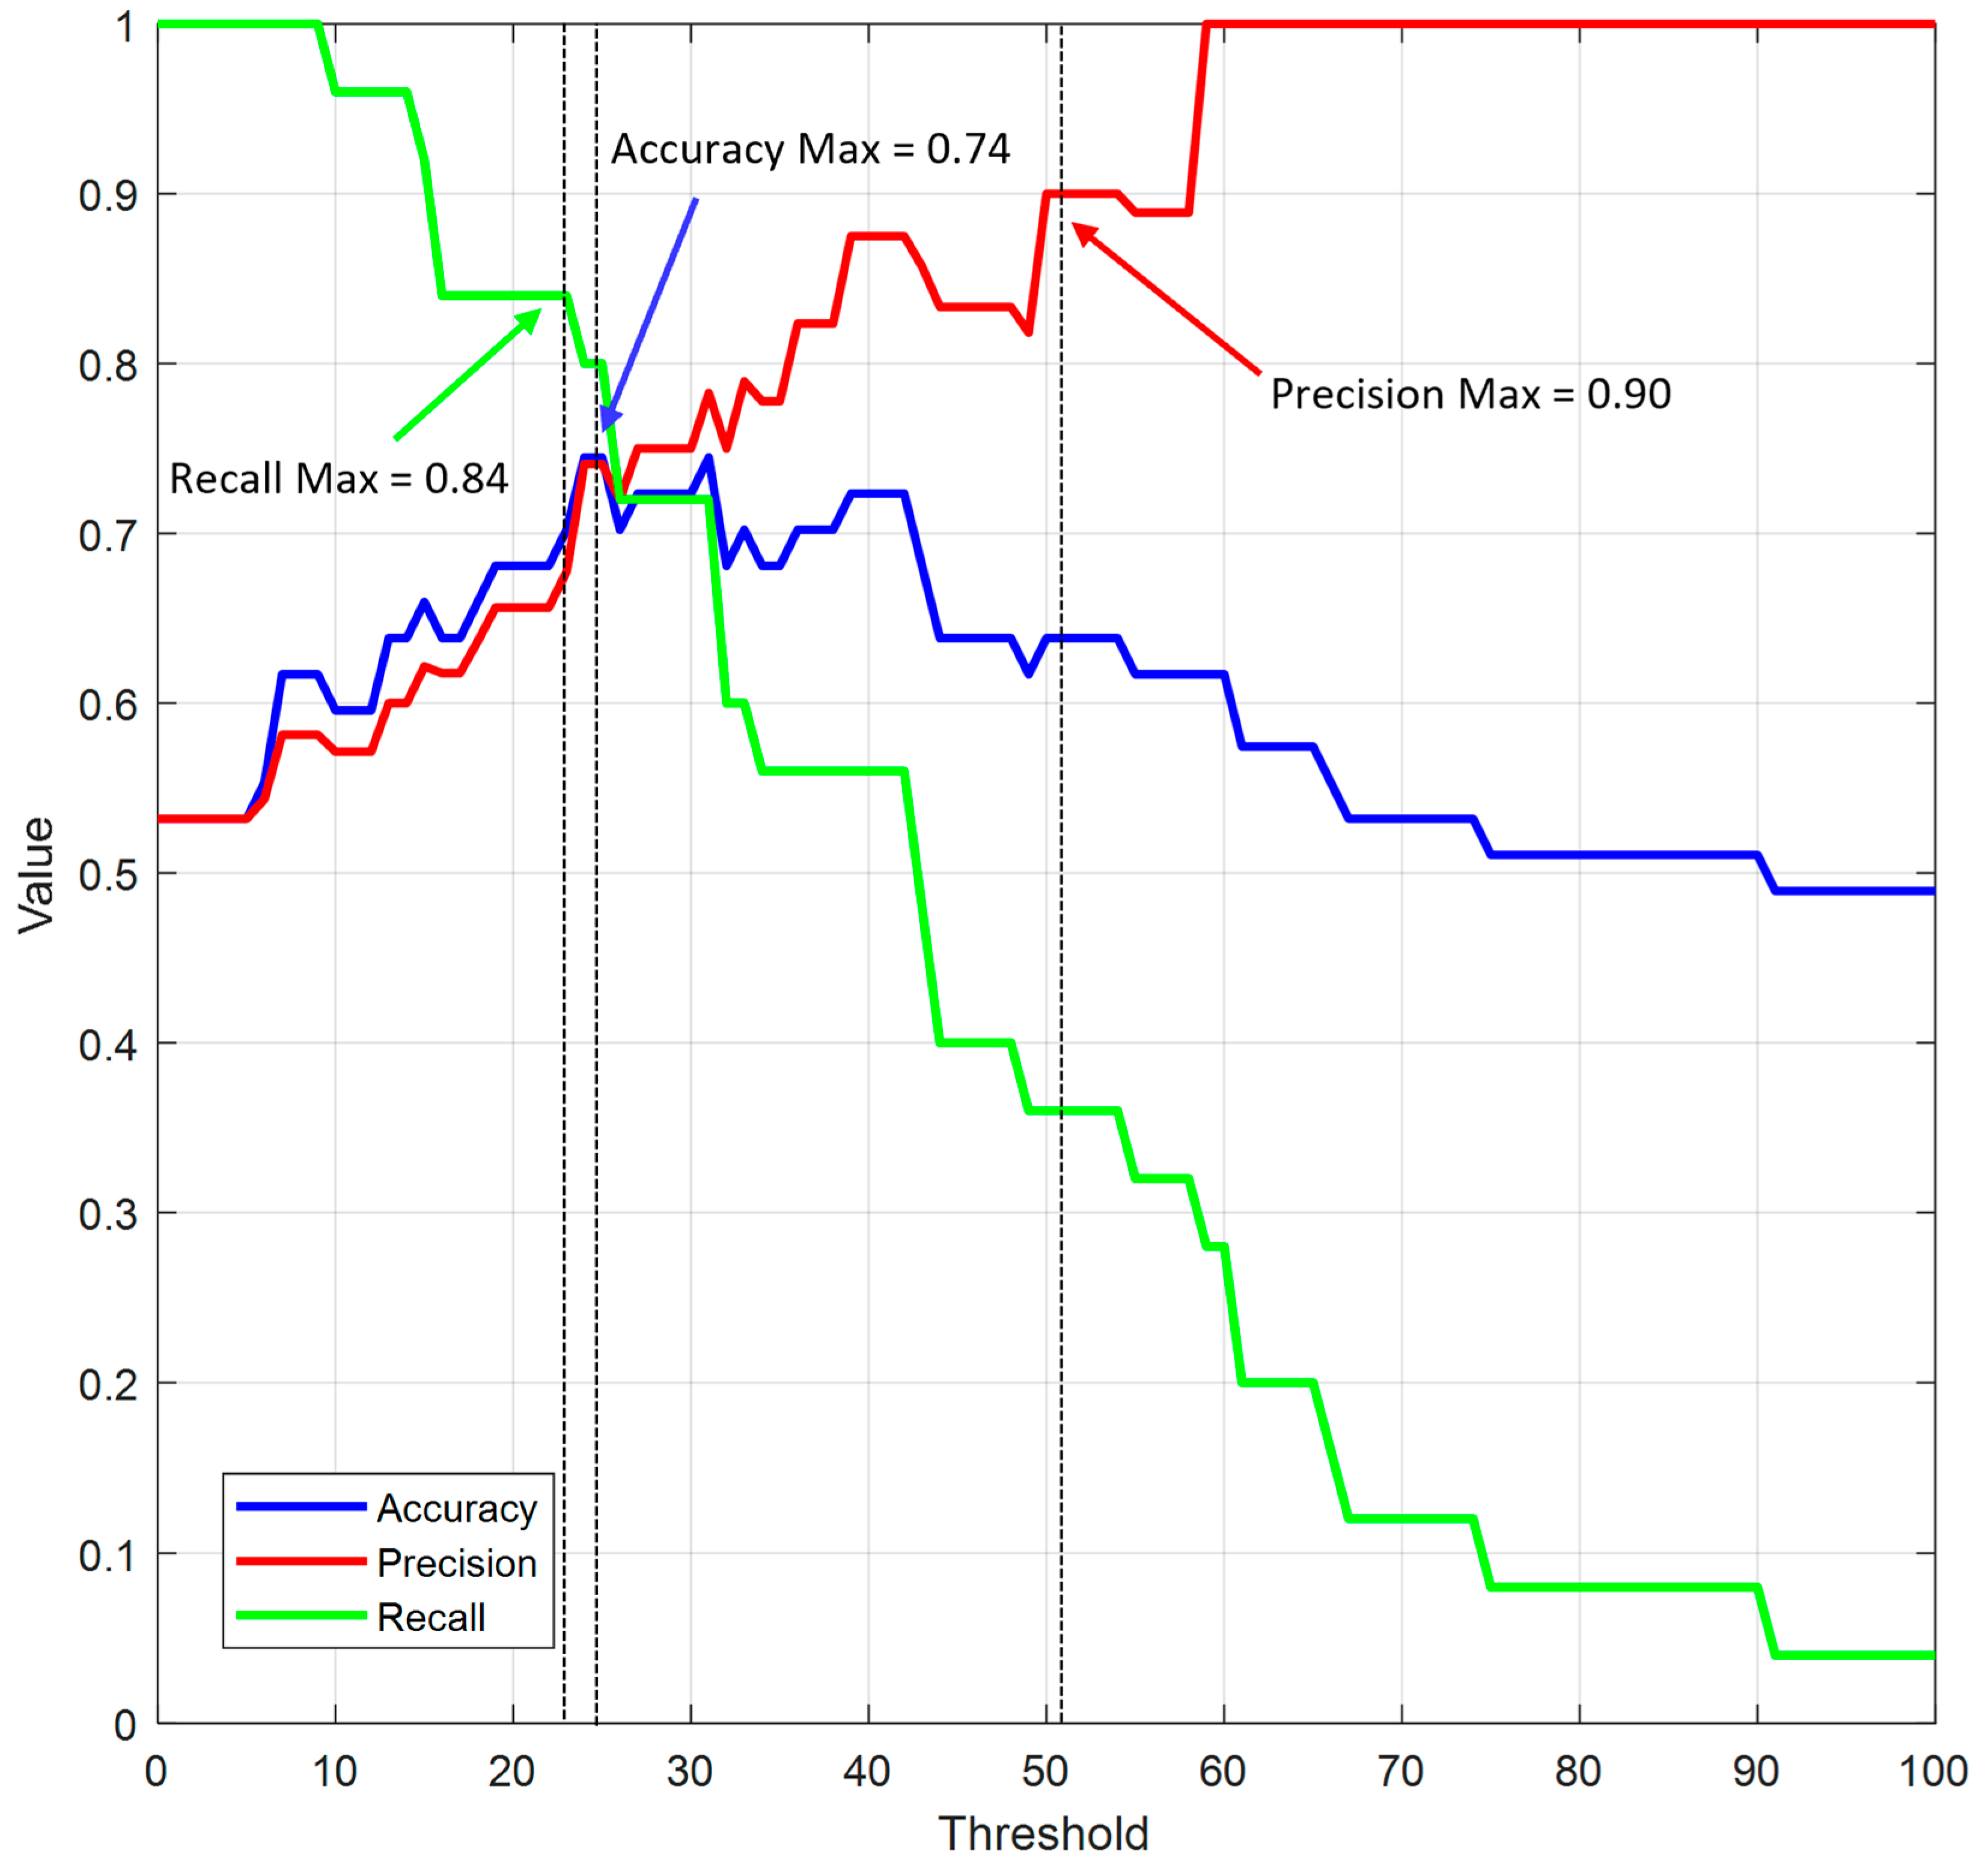
By calculating Accuracy, Precision, and Recall across all possible threshold values (0–100), as shown in
Figure 10, the methodology provides a visual tool for stakeholders to understand the implications of their choices.
The data indicates that:
The maximum accuracy value of 0.74 is achieved at a threshold of 24.
The maximum precision value of 0.9 is achieved at a threshold of 51.
The maximum recall value of 0.84 is achieved at a threshold of 22.
These values exclude outliers where the threshold is either sufficiently high or low to yield Precision and Recall values in proximity of 1 and 0, respectively.
The curves in
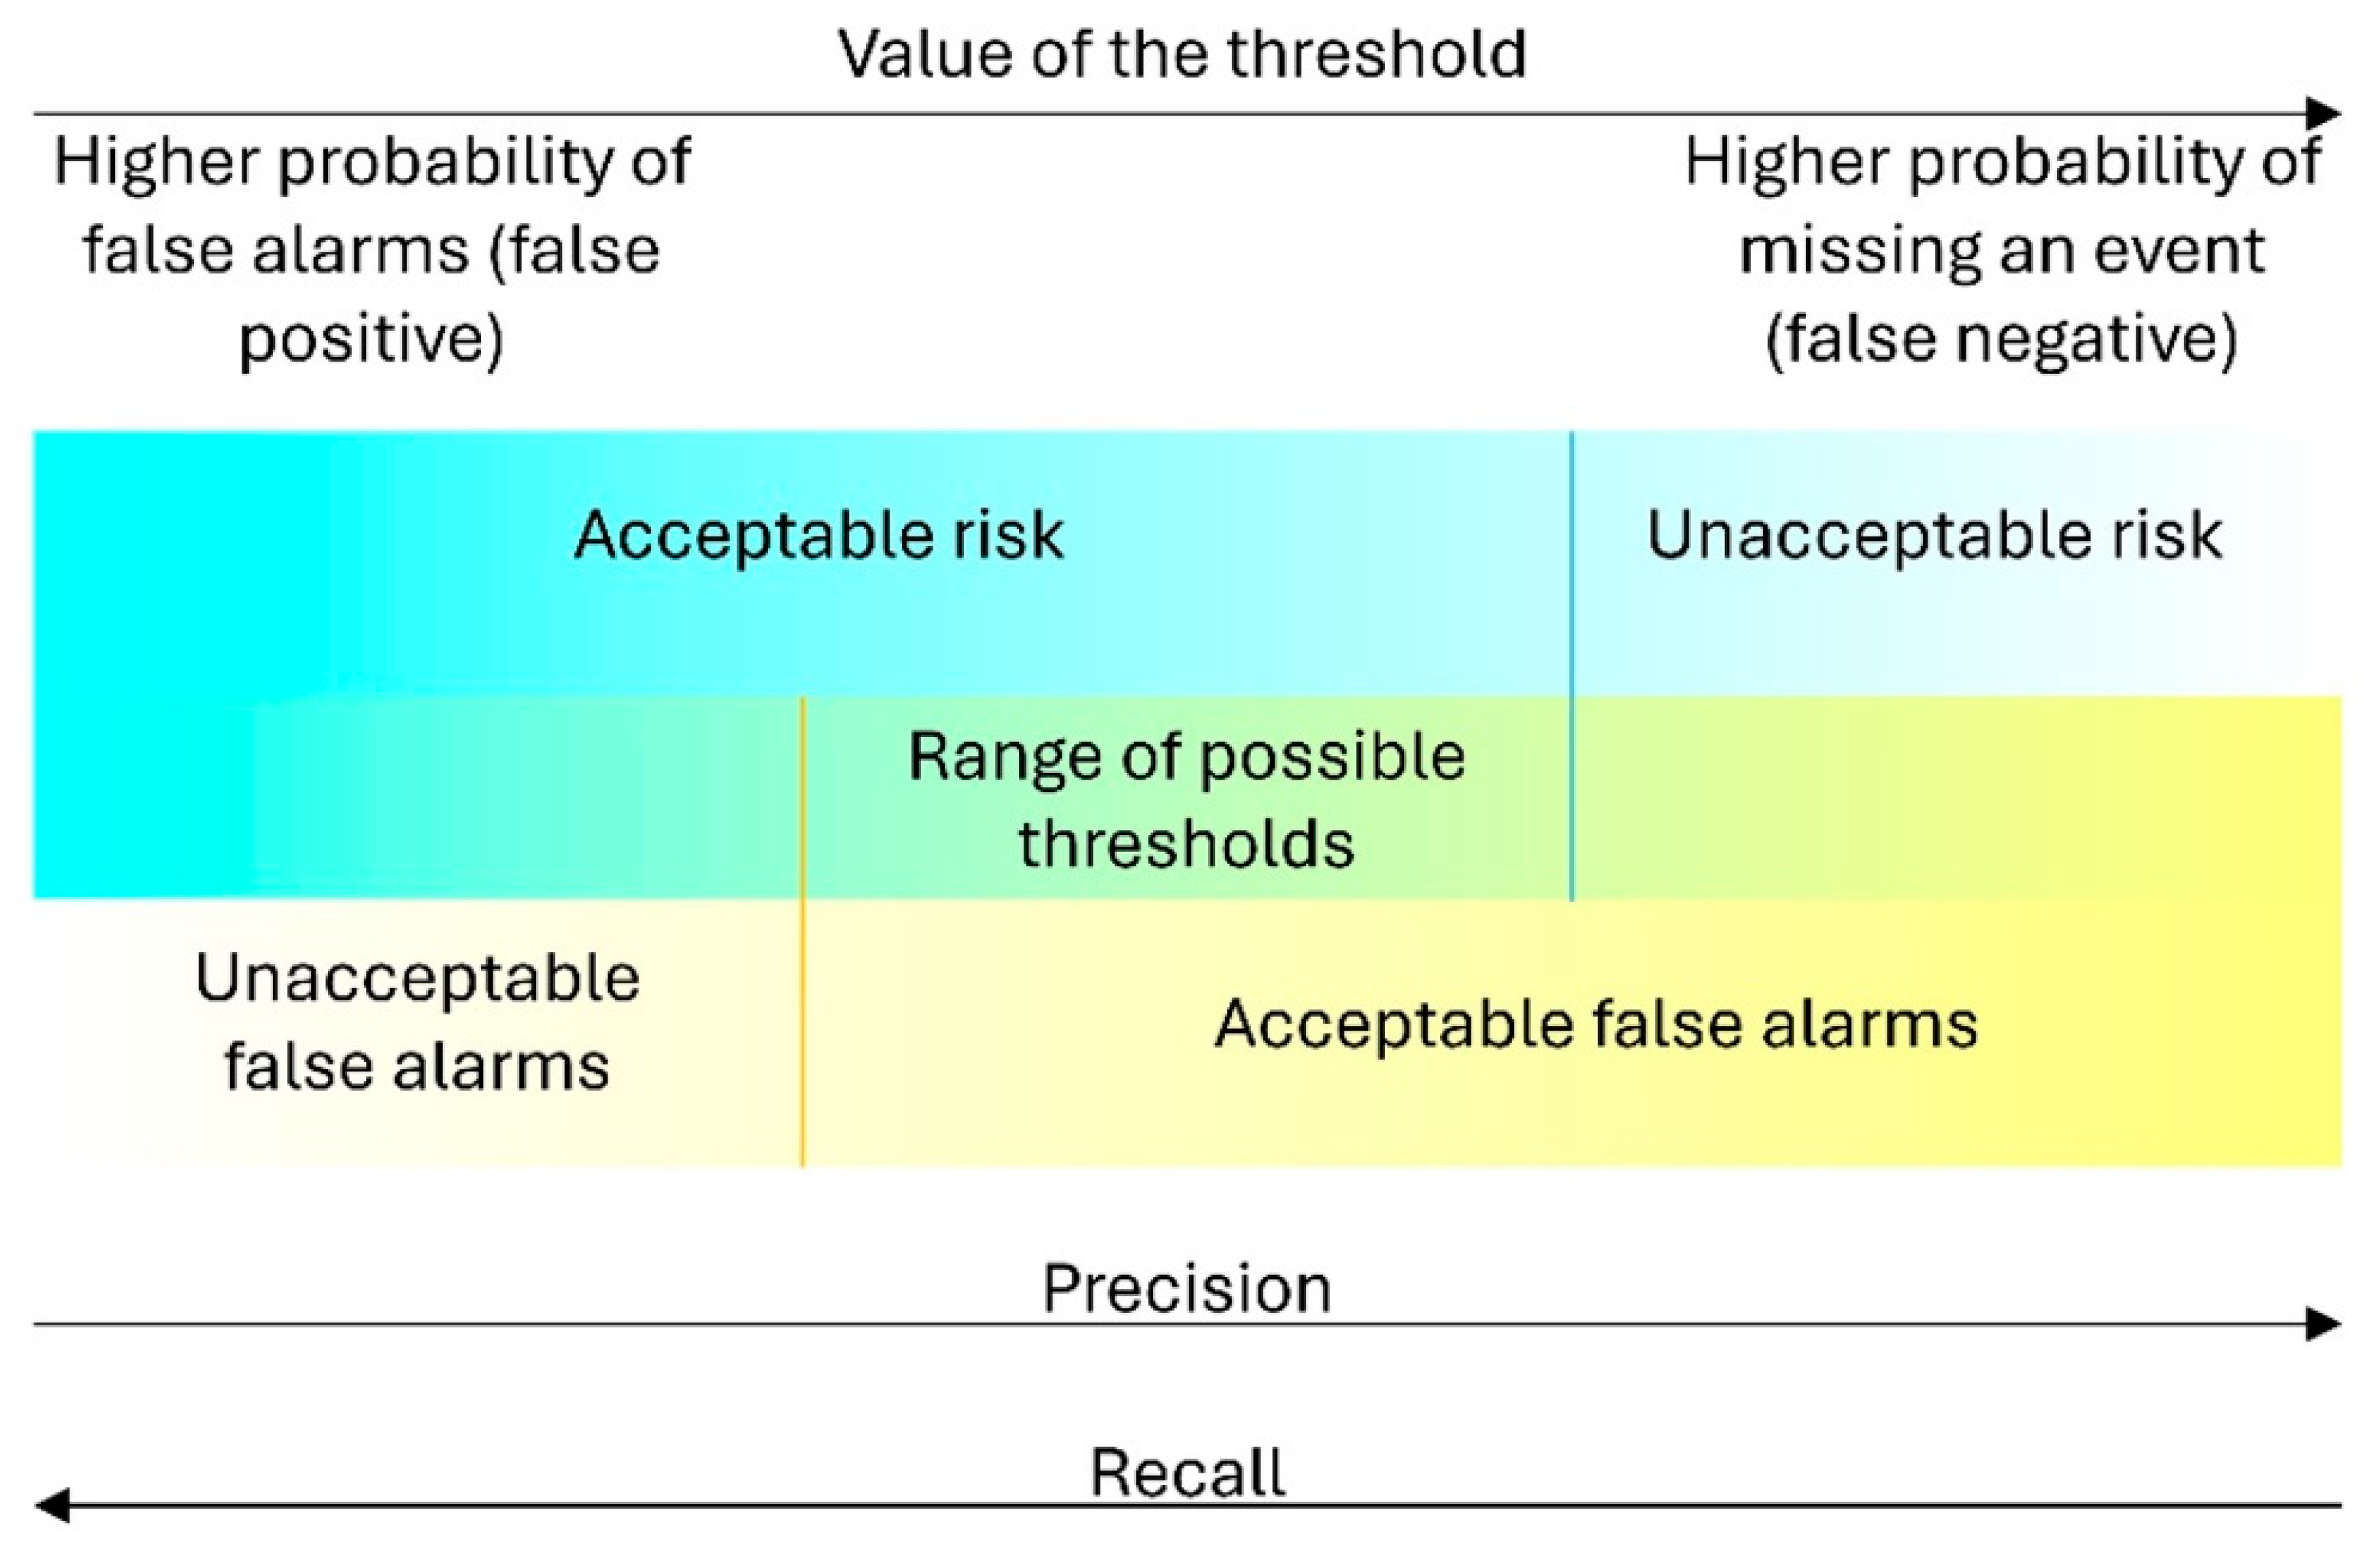
Figure 10 allow us to visualise how increasing the threshold value affects the model’s screening performance and its capacity to classify risk levels (blue and red lines, accuracy and precision) at the expense of its ability to avoid false negatives (green recall curve). Within this range of possible thresholds, the trade-off between an unacceptable number of false positives vs. false negatives depends on the needs and design criteria described above (
Figure 11).
For example, in cases where mapping only the highest-risk blocks is required for emergency safety measures, the threshold value can be raised. Conversely, if a higher safety margin is needed to minimise false negatives (blocks at risk that the method did not flag as such), the threshold value can be lowered. In both cases, the metric curves make it easy to observe the trade-offs made in terms of the model’s ability to make correct predictions while minimising errors. Possible balanced solutions include choosing the threshold value corresponding to the intersection among recall, precision and accuracy, or choosing the value where the sum of these three parameters is maximised.
4.2. Spatial Patterns and Model Limitations
As an example,
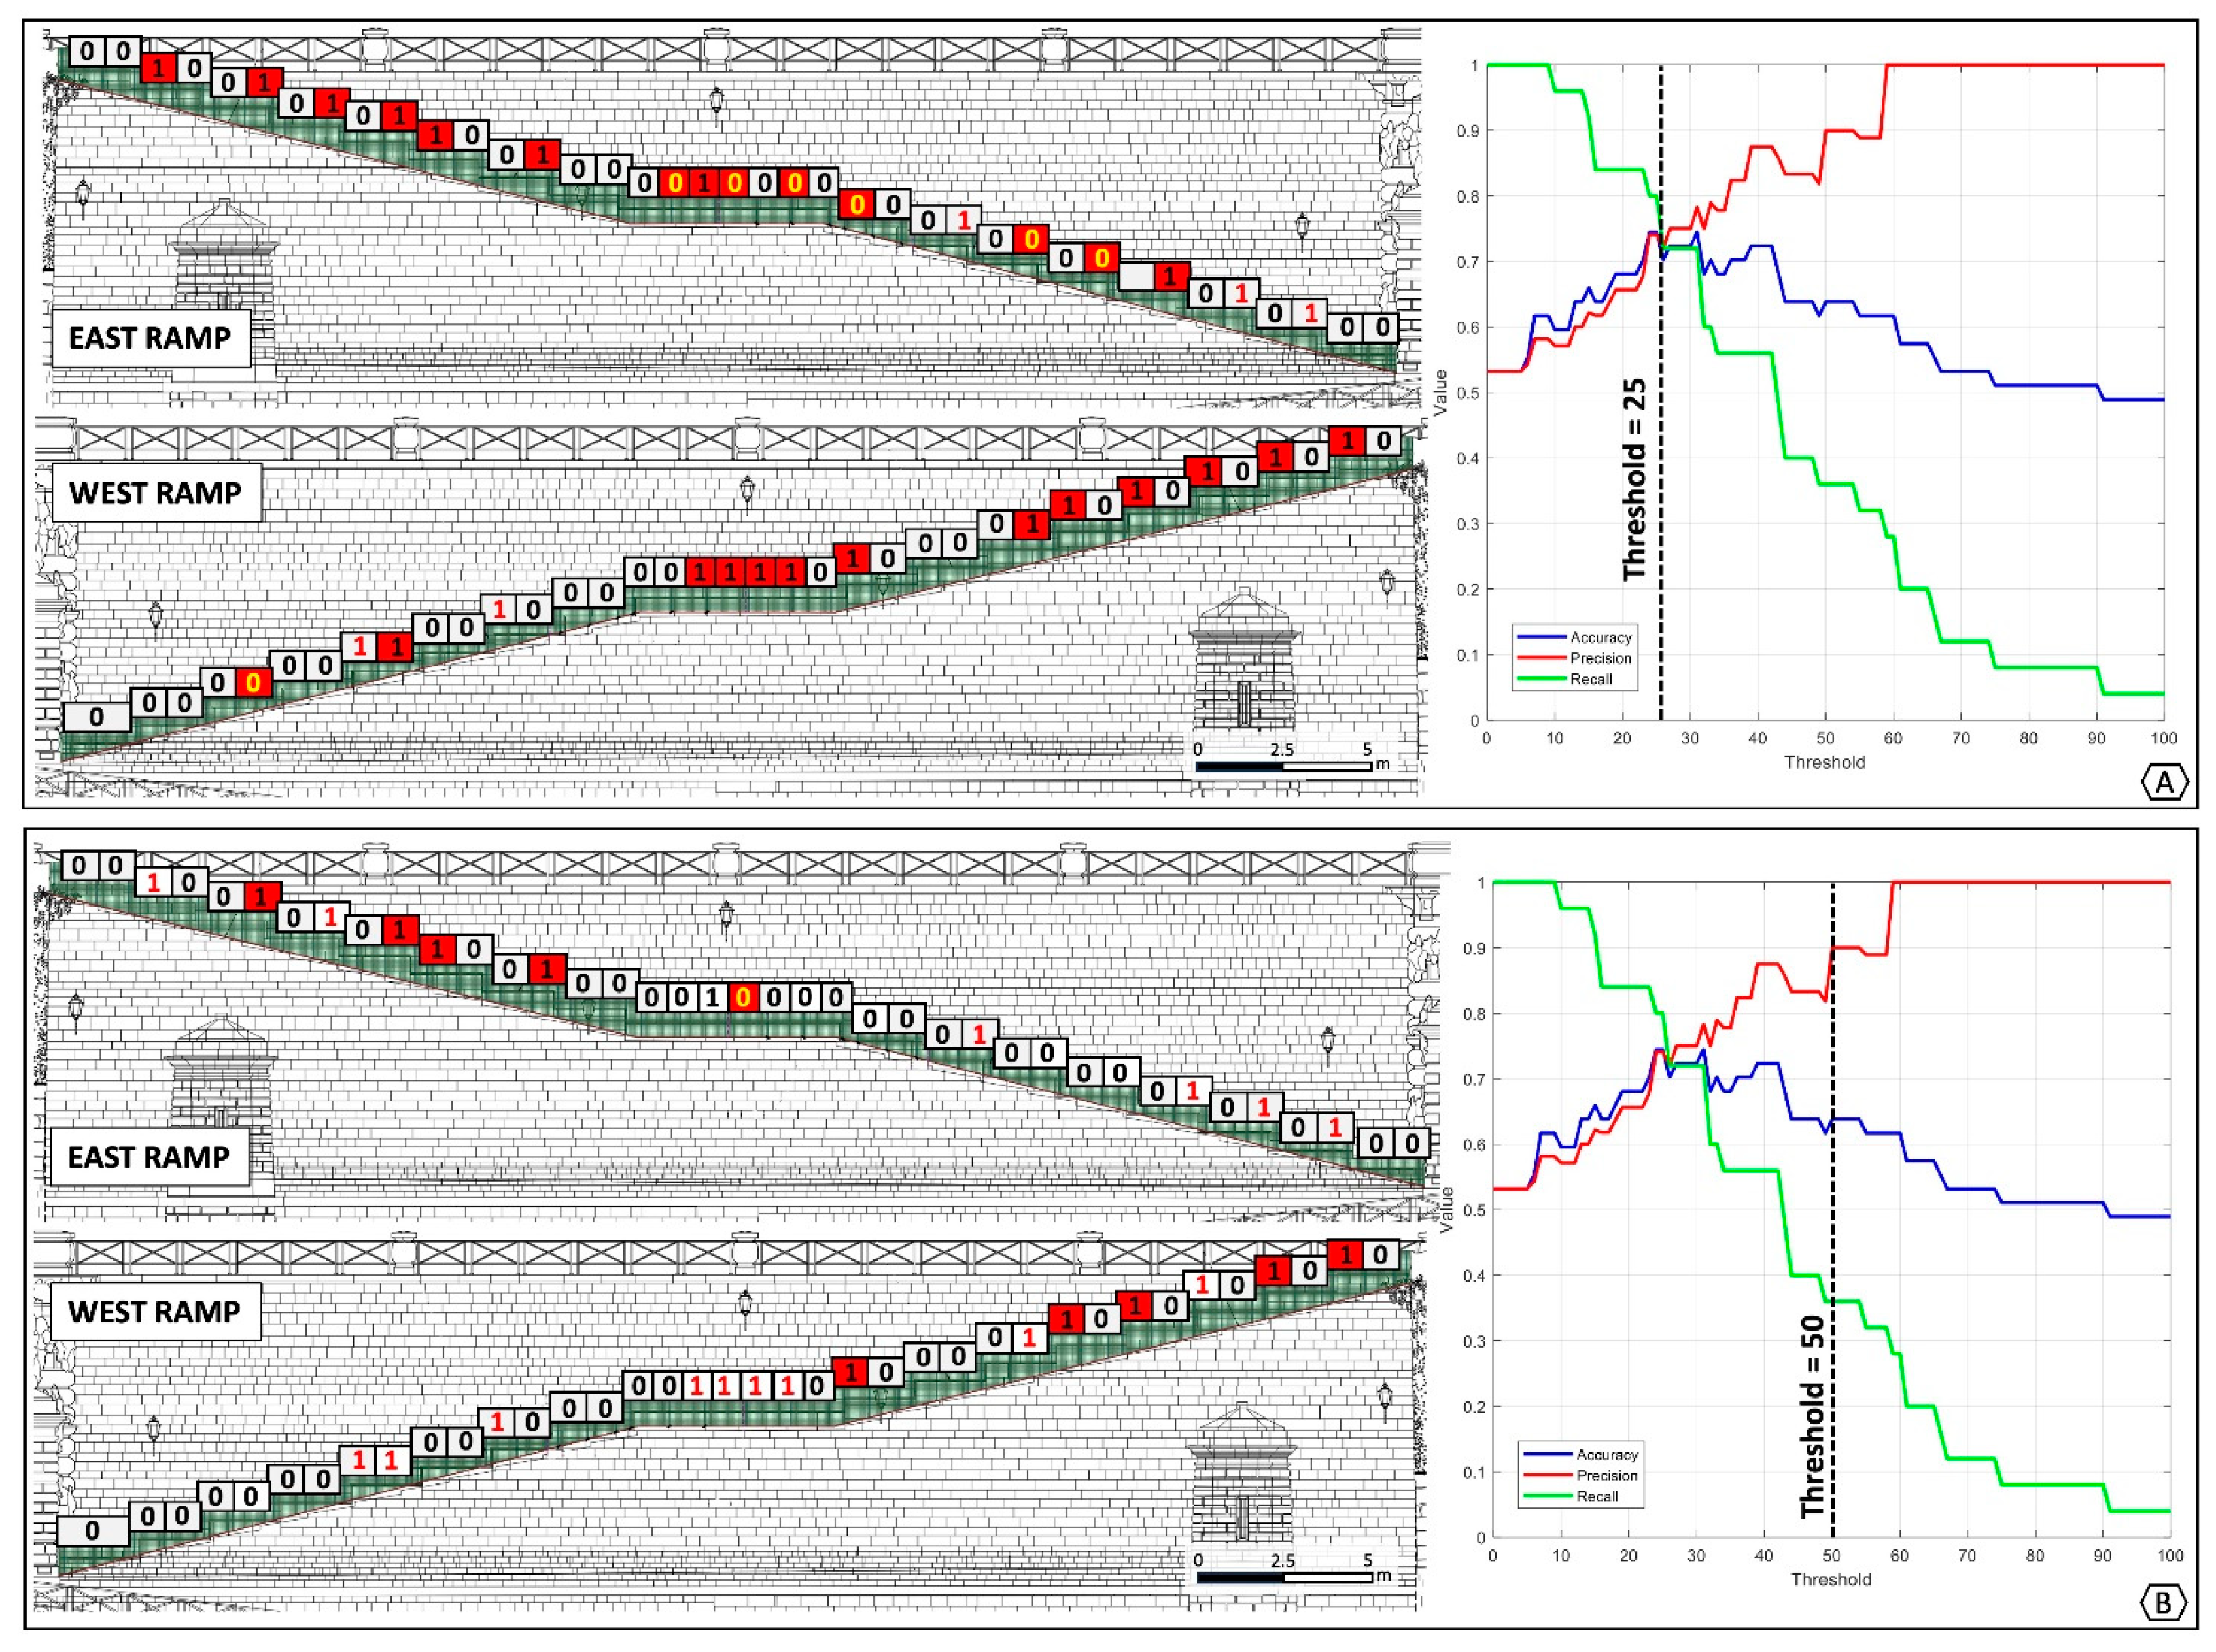
Figure 12 presents two risk maps highlighting blocks flagged using different thresholds. Specifically,
Figure 12A displays the results with a threshold set at 25 (first quartile), while
Figure 12B shows the results with a threshold of 50 (first and second quartiles). In these maps, each block is assigned a background colour representing the model’s screening output (white for no risk, red for risk) and a numerical value (0 or 1) indicating the expert-based classification. To facilitate a quick assessment of model performance, the reference values assigned by experts are colour-coded: black indicates agreement with the expert judgement (True Positives and True Negatives), yellow represents False Positives, and red signifies False Negatives.
Discrepancies between model’s assigned risk level and expert judgments were observed, revealing distinct patterns.
Some cases involved False Positives, where the model flagged risks that experts considered safe. In a conservation context, these discrepancies should not necessarily be viewed as model errors, but rather as “prudence warnings”. The MRRA strictly applies geometric constraints that the human eye might underestimate, thereby offering a conservative safety margin essential for public heritage protection. This mechanical sensitivity is supported by the back-analysis of the 2020 rockfall event. Although limited to a single case, the fact that the MRRA assigned the maximum theoretical risk score to the block that actually collapsed suggests that the model effectively prioritises the geometric precursors of instability.
Conversely, regarding False Negatives (copings deemed safe by the model but critical by experts), it was observed that these typically correspond to highly weathered elements. In these instances, the model assessed the blocks as geometrically stable because their centre of gravity was located well within the base (d > 10 cm), whereas the experts likely prioritised the material decay state.
Finally, another pattern that emerged from the analysis is that exposure (location relative to pedestrian areas and road) and the height of potential falls play significant roles in determining the overall risk. This highlights the importance of considering not only the stability of individual blocks but also their position within the monument’s structure. Two scenarios were considered: (1) if the block falls on the staircase side, where case the height is relatively low (ranging from a minimum of 80 cm to a maximum of 120 cm); and (2) if it falls on the street side, where the height ranges from a minimum of 80 cm to a maximum of nearly 9 m.
Beyond the spatial discrepancies observed, some intrinsic conceptual limitations of the MRRA must be acknowledged to define its scope of applicability. Firstly, the methodology functions as a heuristic prioritisation index rather than a deterministic risk model, as it lacks a temporal component; it identifies where a failure is more likely based on geometric precursors but cannot predict when it will occur. Secondly, because the normalization strictly depends on the maximum and minimum values of the specific dataset, the resulting index is inherently relative. This site-specific calibration limits the direct comparability of the risk scores across different monuments. Consequently, the MRRA must be acknowledged strictly as an intra-site prioritization tool rather than an absolute inter-site metric.
4.3. Assumptions on Kinetic Energy and Exposure
In this study, kinetic energy was calculated relative to ground level rather than considering the average height of potential targets, such as pedestrians or vehicles. This approach introduces a deliberate safety factor, as calculating energy at ground level yields maximum potential values. Such a conservative estimation facilitates an objective comparison between different blocks, providing valuable support for decision-makers when prioritising stabilization countermeasures.
While this simplification accounts for the maximum energy attained by a block, it is important to acknowledge that real-world impacts could occur at varying heights, affecting adults, children, or vehicle components like windshields. Furthermore, the assumption of rigid behaviour for struck objects was adopted. These simplifications may lead to an overestimation of impact forces, potentially resulting in more conservative safety measures. Although this could increase intervention costs, it significantly enhances overall public safety.
However, it should be noted that for vehicles, even a small stone detachment that does not directly strike the target can cause substantial damage by startling the driver, potentially leading to loss of control, tire punctures, or skidding. Consequently, the current risk calculation might underestimate the indirect risks to vehicles. Moreover, large blocks currently deemed stable (centre of gravity > 10 cm from the edge) were excluded from the assessment as they typically do not fall under normal conditions. Nevertheless, exceptional stresses, such as seismic events, human interaction, or vehicular collisions, could dislodge these elements. A potential future improvement could involve a more nuanced approach, integrating both maximum potential energy and weighted averages based on likely impact scenarios.
Beyond mechanical factors, the analysis revealed clear spatial pattern linking the monument’s architectural configuration and its state of conservation. It was observed that each step typically features two copings: one positioned against the wall of the step above, which provides lateral protection, and another with three sides fully exposed to the elements. As shown in the risk maps (
Figure 12), copings in better condition (Risk Class 0) are frequently those situated adjacent to the elevated section of the step. This pattern, observed in over 70% of the tiers, strongly suggests an influence of the east–west orientation of the staircase. A plausible hypothesis is that the top step presumably acts as a shield, providing protection from solar radiation and meteorological exposure, thereby mitigating the weathering processes of the Pietraforte sandstone.
5. Conclusions
This study presented the MRRA (Monument Rockfall Risk Assessment), a heuristic framework designed for the rapid prioritisation of detachment risks in stone-built heritage. Standard geomechanical models, typically designed for natural slopes, are often difficult to apply to architectural elements like copings, where the original rock mass properties and joint patterns have been altered by quarrying and construction.
The MRRA addresses this gap by offering a heuristic-based prioritisation tool. By integrating susceptibility, vulnerability, and exposure, the model transforms expert perception and geometric precursors into a scalable relative risk index. This approach provides a scientifically grounded compromise between qualitative visual inspections and computationally intensive numerical simulations. A key aspect of this work is the use of risk thresholds: by adjusting these values, heritage managers can calibrate the assessment to their specific needs, balancing the necessity to avoid “missed alarms” with the reality of limited maintenance budgets.
The MRRA framework represents a shift from traditional descriptive inventories towards a dynamic prioritization system for architectural heritage. This study demonstrates that by integrating geometric precursors with heuristic weighting, it is possible to transform expert perception into a ranking index.
The main novelty lies in the model’s ability to bridge the gap between qualitative conservation states and the need for immediate management decisions. Unlike established methods that focus on natural slopes, the MRRA is tailored for the architectural micro-scale, providing a scientifically grounded “urgency list” for practitioners. This is particularly relevant for the management of complex historical sites, where the MRRA can serve as an objective tool to justify the allocation of limited public funds for structural consolidation.
However, some limitations should be noted. The method is currently specific to architectural elements resting on a supporting base, such as sills or copings. Furthermore, the assessment was compared against expert judgment for its initial calibration. While the back-analysis of the 2020 single-block failure yielded encouraging results, documenting more detachment events will be necessary to achieve a broader statistical validation. Future developments of the MRRA framework will require sensitivity testing and probabilistic calibrations as larger datasets of detachment events become available.
Despite these points, the MRRA provides a practical and straightforward tool for prioritizing restoration works, allowing heritage managers to make informed decisions and improve safety in busy historical areas.




 ,
,