Abstract
Fiber-based black-and-white developing-out papers (DOPs) were among the most widely used photographic supports of the 20th century. Their broad use, structural complexity, and range of surface finishes, alongside evolving manufacturing practices, underscore the importance of understanding their material composition for authentication, dating, and conservation purposes. This study presents a multi-analytical characterization of three DOP sample sets: two from Ilford (ca. 1950) and one from Kodak (1972), complementing previous research with a deeper insight into general features, stratigraphy, and composition. Initial non-sampling techniques, including thickness measurements, colorimetry, optical microscopy, and UV–visible induced fluorescence, were used to classify papers into visually and physically distinct groups. This informed a targeted sampling strategy for further stratigraphic and compositional analysis using Scanning Electron Microscopy with Energy Dispersive X-ray Spectroscopy (SEM-EDS), X-ray fluorescence (XRF), Raman spectroscopy, and fiber/pulp identification tests. Significant differences were observed in base tint, surface gloss, optical brightening agents, fillers, and fiber content. Notable findings include the presence of iron (III) oxide–hydroxide pigment in Ilford cream papers, anatase titanium dioxide (TiO2) in a baryta-less Ilford sample, and the shift to more uniform tones and mixed pulps in Kodak papers by the 1970s. These results offer valuable insights into historical manufacturing and support improved dating and characterization of photographic papers.
1. Introduction
Photographic prints are intricate, multi-layered objects, and their widespread use throughout the 20th century led to countless variations. Despite their prevalence in collections and their susceptibility to degradation, much of the technical knowledge surrounding their manufacture remains unknown. Understanding a photograph’s composition, structure, and surface is crucial for informed conservation, curatorial work, and connoisseurship. This knowledge aids conservators in predicting degradation, selecting appropriate treatments, and ensuring safe storage. Identifying material composition can also help specialists to date and authenticate prints, providing insights into historical material availability, aesthetic preferences, and artistic movements [1,2,3].
Fiber-based black-and-white developing-out papers (DOPs) were a dominant photographic support in the 20th century, extensively used by both professionals and amateurs. Despite their commonality, detailed manufacturing information is scarce due to proprietary secrecy and lost technical records [4]. The 20th century saw rapid material changes, including shifts from rag to wood pulp [1], the introduction of optical brightening agents (OBAs) [5,6], and varied fillers, matting agents, pigments, and dyes that altered print characteristics [7]. DOPs typically feature a four-layer structure: paper support, baryta layer, image layer, and often a protective topcoat (Figure 1). However, variations exist, such as baryta-less DOPs [2,8]. Manufacturers created diverse papers differing in weight, thickness, base tint, texture, and gloss, with surface finishes peaking by the 1930s [3,9]. Sample sets, though increasingly rare, are invaluable for research, offering insights into material stability and production details [4,9].
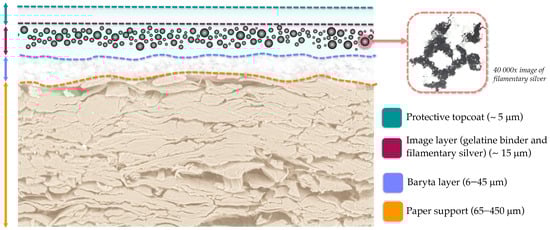
Figure 1.
Schematic cross-section of a typical baryta-coated, fiber-based DOP, showing the multilayer structure consisting of a paper support, baryta layer, image layer, and protective topcoat, along with the typical thickness ranges of each layer as reported in a previous study [10].
Previous research has emphasized the importance of characterizing reference papers and sample sets. Pioneers like Paul Messier have extensively investigated manufacturing trends [1,5,9,11,12], developed identification methods [13,14,15,16], and contributed to resources like Paperbase website [17], which compiles visual data from thousands of DOP samples. Other projects, like Object: Photo website [18] and recent work on GEVAERT production [19,20] further contribute to this understanding. While these studies provide rich data, continued research is essential to bridge knowledge gaps and support heritage conservation.
These projects demonstrate the importance of studying large sample sets to develop characterization methodologies and inform conservation strategies for photographic prints. Although the scope and approach of such studies vary, research on individual sample sets has also made important contributions to the field. Notable examples include analyses of the surface features and stratigraphy of the 1966 Kodak B/W Darkroom Dataguide [21], the characterization of a 1973 Agfa sample set [20], and investigations into how paper features influence external reflection (ER-FTIR) spectra in the 1967 Kodak B/W Darkroom Dataguide [22].
Beyond direct sample studies, researchers have established methods to document the physical and material features of photographic papers. These include gloss and texture analysis [3,11,13,14,15,16,18,20,23,24,25,26,27], OBA identification [1,5,6,28,29,30], pulp composition analysis [1,18,31,32], back printing [18,33], and measurements of thickness and weight [12,17,18]. Cross-sectional studies have further clarified layering and stratigraphy [21,34,35,36,37,38].
A range of analytical techniques has been used to study material composition, including infrared spectroscopy in attenuated total reflection (ATR-FTIR) [39,40], external reflection (ER-FTIR) [34,36,41], and near-infrared (NIR) in reflection mode [22,42], and elemental analysis via X-ray fluorescence (XRF) [1,4,18,39,40,43,44].
Despite significant advances, important questions remain about the influence of specific additives—such as OBAs, dyes, and pigments—on the visual characteristics, stratigraphy, and long-term stability of photographic papers. Moreover, comparative research systematically examining how these material features vary across manufacturers and production periods is still limited, leaving a gap in our understanding of how such differences affect both preservation and historical interpretation.
The present study addresses these gaps by analyzing three sample sets from Ilford and Kodak using a multi-analytical approach. While identifying trends linked to manufacturers, provenance, and production period is an ambitious long-term goal for photographic heritage research, this work is positioned as a targeted case study. By examining two manufacturers (Ilford and Kodak) and two time frames (ca 1950 and 1972), this study offers an initial contribution toward a broader framework for linking paper composition with historical production practices.
This study aims to analyze fiber-based DOPs across three levels: general features, stratigraphy, and composition. We begin with non-destructive (without sampling) techniques to identify groups of papers with similar characteristics (e.g., thickness, color, texture, gloss measurements, and OBA presence detection), allowing for targeted sampling for more detailed stratigraphic and compositional analysis. Our three main objectives are to support the identification of fiber-based black-and-white photographic papers by identifying key surface-level features; to investigate material aspects, like base tint colorants, surface texture treatments, fillers, pulp composition, and OBAs; and to correlate analytical findings with manufacturers’ commercial descriptions. This correlation will offer insights into historical production practices by manufacturers and production periods, artists’ material choices, and inform conservation strategies. We conducted a multi-analytical characterization on three sample sets: two from Ilford (circa 1950), and one from Kodak (1972). By sourcing sets from different locations (Ilford UK, Ilford Porto, Portugal, and Kodak USA), we consider how the production period, manufacturer, and geographic origin influence photographic paper properties.
2. Materials and Methods
2.1. Case Studies
Three photographic paper sample sets coming from private collections were analyzed in this study, differing in format, intended audience, production period, manufacturer, and geographic origin. A summary of their characteristics is presented in Table 1.
The first one is a small-format Ilford set that contains 18 samples distributed together with a booklet, Printing and Enlarging, which provides information on the material selection and printing techniques. This set was likely produced in 1948, as suggested by the alphanumeric codes (PE/PLH/D.48 and LUND HUMPHRIES 24524•3•48) printed on the last page of the booklet. These codes are consistent with internal production and print-batch identifiers used by Ilford and Lund Humphries during the late 1940s, where the suffix (e.g., “.3.48”) typically corresponds to the month (March) and year of publication [45].
The second Ilford set has a medium format, including 25 samples bound in an album-style format with rigid covers and a metal spiral. Although no explicit production date is given, the presence of Plastika paper, introduced in 1939 [46], and the absence of Multigrade paper, discontinued between 1945 and 1953 [47], suggests that the set may fall within that window. This is further supported by a handwritten note dated 1952 found in the album, and the use of Karl Pollak negatives for the printing of two samples, matching the original photographs dated to around 1948 in the collection of the National Portrait Gallery, London [48]. Taken together, this evidence places the production of the set likely between 1948 and 1952.
The third set comes from the 1972 Kodak Master Darkroom Dataguide, 4th edition. In this spiral-bound publication, 11 photographic paper samples are included, together with technical details about processing, enlarging, and printing.

Table 1.
Summary of the three photographic paper sample sets analyzed in this study, highlighting differences in provenance, production date, sample format, paper type, weight, base tint, and surface characteristics. All listed features are based on the manufacturers’ original descriptions.
Table 1.
Summary of the three photographic paper sample sets analyzed in this study, highlighting differences in provenance, production date, sample format, paper type, weight, base tint, and surface characteristics. All listed features are based on the manufacturers’ original descriptions.
| Sample Sets General Information | ● Ilford (Small Format) | ● Ilford (Medium Format) | ● Kodak (Small Format) |
|---|---|---|---|
| Image of the sample set |  |  |  |
| Produced in | UK | UK | USA |
| Acquired from | UK | Porto, Portugal | USA |
| Production Date | Ca. 1948 | Ca. 1948–1952 | 1972 |
| Number of samples | 18 | 25 | 11 |
| Sample format (cm) |  |  |  |
| Types of papers (and number of samples) | Bromide (9) Plastika (7) Contact (2) | Bromide (13) Plastika (9) Contact (3) | Polycontrast (1) Polycontrast Rapid (1) Kodabromide (1) Ektalure (3) Portalure (3) Medalist (1) Mural (1) |
| Weights | Single Weight (4) Double Weight (14) | Single Weight (5) Double Weight (19) +Light Weight (1) | Single Weight (3) Double Weight (7) Light Weight (1) |
| Base Tints | White (12) Cream (6) | White (15) Cream (10) | White (4) Warm-White (5) Cream (2) |
| Surfaces | Glossy (3) Matt (4) Semi Matt (1) Velvet Stipple (1) Rough Lustre (2) Rayon (4) Grained Half Matt (2) Satin (1) | Glossy (4) Matt (4) Smooth Lustre (2) Semi Matt (3) Velvet Stipple (2) Rough Lustre (2) Rayon (4) Light Weight Lustre (1) Grained Half Matt (2) Satin (1) | F: Smooth, Glossy A: Smooth, Lustre E: Fine grained, Lustre G: Fine grained, Lustre J: Smooth, High Lustre K: Fine grained, High Lustre M: Smooth, Matte N: Smooth, Lustre R: Tweed, Lustre X: Tapestry, Lustre Y: Silk, High Lustre |
2.2. Analytical Methods
The analysis began with a broad examination of the general features of all 54 prints, including thickness, base tint, gloss, surface texture, and the presence of optical brightening agents (OBAs). These observations enabled detailed visual documentation and the creation of clusters based on shared characteristics. From this preliminary classification, we selected a smaller group of representative samples for in-depth stratigraphic and material analyses. The selection was made to ensure that the chosen samples covered the full range of variability observed in the sets, including differences in manufacturer (Ilford and Kodak), production period, surface finish (e.g., glossy, satin, and matt), baryta layer presence or absence, and OBA content. This approach ensured that the detailed analyses reflected the diversity of materials and manufacturing practices present in the original collections.
2.2.1. General Features
Thickness Measurements
The thickness of all 54 prints was measured using a TOOGOND Electronic Digital Thickness Gauge (model 0–12.7 mm, TOOGOND, Deko Corporation, Xi′an, China), with a resolution of 0.01 mm. Measurements were taken in millimeters to two decimal places, following the methodology developed in the Object: Photo project [18]. Three random spots were selected from each print and measured three times. The average values and the standard deviation were calculated.
Colorimetry
Colorimetry measurements were conducted primarily for the documentation of prints’ base tint. A Konica Minolta® Spectrophotometer CM-700d (Konica Minolta, Inc., Tokyo, Japan) was used in the CIELab system. For the recto, measurements were taken from Dmin (minimum density) areas, typically located in the white borders or unprinted areas around the image, that were visually homogeneous (no stains, scratches, irregularities, or yellowing signs). For the verso, measurements were taken from a representative clean area of the paper support and free from damage or irregularities. For the recto, measurements were taken in both SCE (specular component excluded) and SCI (specular component included) modes, while for the verso, only the SCE mode was used. The average values and the standard deviation were calculated.
Glossiness was calculated using the difference between L* values in SCI and SCE modes (L*SCI–L*SCE), following the approach used by Carnazza et al. [26]. This method was previously used to assess paint samples’ glossiness, and it was observed that the curve obtained with a 60° gloss-meter measurement was similar to the one obtained with the spectrophotometer [26].
Optical Microscopy
All prints were examined under a Nikon SMZ745 stereomicroscope (67×–200× zoom range), equipped with a Nikon DS-Fi3 digital camera (Nikon Corporation, Tokyo, Japan) and a Leica KI 1500 LCD fiber-optic lighting system (Leica Microsystems, Wetzlar, Germany). Normal light observations were performed with fiber-optic lighting angled at 30° to the sample surface to examine the paper support.
To document surface textures, a raking light setup inspired by the TextureScope method [16,18] was used. The microscope was positioned to capture a 1.00 × 1.35 cm2 area. An LED light was placed at a 25° angle 7 cm laterally and 3 cm vertically from the paper surface. To flatten the prints and standardize the imaging field, they were held under a cardboard mask with a cut-out window.
In addition, the verso of all samples was examined under UV illumination using a Zeiss Axioplan 2 microscope (Carl Zeiss Microscopy GmbH, Jena, Germany) at 100× and 200× magnification, equipped with a Nikon Digital Sight 10 digital camera.
UV-Induced Visible Fluorescence Examination and Photo-Documentation
Both the recto and verso of each print were examined under long-wavelength ultraviolet (UVA) radiation (365 nm) to assess the presence and distribution of optical brightening agents [5,6,25,49]. The examination used a CLE Design UV Vertical Luminaire lamp (CLE Design, London, UK), fitted with two Philips TLD 36W/08 UV/BLB fluorescent tubes (low-pressure mercury discharge, 1200 mm, Eindhoven, The Netherlands). The lamp operates at 230 V, 3 A, 50 Hz, with a total power consumption of approximately 80 W. It illuminates an area of about 120 × 60 cm at the 40 cm working distance used, ensuring even coverage of the examined objects. The light source was positioned at 90° to the sample/paper surface. For photo-documentation, a Canon EOS digital camera (Canon Inc., Tokyo, Japan) with a Canon RF 24–70 mm f/2.8L IS USM lens was used.
2.2.2. Stratigraphy and Composition
Fiber and Pulp Identification
For the pulp and fiber characterization in the paper support, the selected samples were analyzed following ISO 9184 [50,51,52,53,54]. The samples were tested with Herzberg, Lofton-Merritt Staining, and Graff “C” stains and analyzed and photographed in bright field transmitted light under a Zeiss Axio-plan 2 microscope, equipped with a Nikon Digital Sight 10 digital camera, at 100× and 200× magnification. For this, six prints from the small-format Ilford set and eight from the medium-format Ilford set were selected based on emulsion type (Bromide, Plastika, and Contact), weight, surface texture, sheen, and base tint. If unexpected variability had been observed in this phase, additional samples would have been analyzed. Since prior examinations revealed differences across the Kodak set, all 11 Kodak prints were included in this analysis.
µ-EDXRF
Micro-energy dispersive X-ray fluorescence (μ-EDXRF) was used to identify the elemental composition of key paper layers, including the image material, baryta coating, potential pigments, fillers, and impurities embedded within the fiber matrix. Analysis was performed using an ArtTAX system (Intax GmbH, Oldenburg, Germany), equipped with a molybdenum (Mo) tube, an Xflash detector, and a mobile analytical arm. The element range was from aluminum (Al) to uranium (U) with an analysis spot size of approximately 70 μm. The spectrometer was used at a current of 300 μA, a voltage of 40 kV, and a collection time of 120 s. Measurements were performed in a helium atmosphere. The spectra were interpreted in the Bruker Spectra ArtTAX (version 7.4.0.0). All 54 prints were analyzed. Two points were measured on the emulsion side corresponding to maximum density (Dmax) and minimum density (Dmin) areas, and one on the paper support. Additional measurements were taken in areas with visible inclusions or staining. Each point was analyzed three times.
Raman Spectroscopy
Raman spectroscopy was used to identify possible colorants in the cream Ilford papers and additives in the Bromide B.2.23.P Light Weight Lustre. One white and three cream Ilford prints were analyzed. Additionally, two cross-section samples of the Ilford sets, previously prepared for SEM-EDS analysis, were examined to obtain more specific insights into the composition of the baryta layer. The laser beam was focused on ochre pigment-like particles in the cream papers, on selected areas of the Bromide B.2.23.P sample from the medium-format Ilford set, and on the baryta layer in the cross-sections. Analyses were performed using a Horiba LabRAM 300 Jobin Yvon Raman spectrometer (Horiba, Kyoto, Japan), equipped with a 17 mW HeNe laser operating at 632.8 nm, a 600 grooves/mm diffraction grating, and a 100 µm confocal aperture, coupled with an Olympus BX41 confocal microscope (Olympus Corporation, Tokyo, Japan). The laser beam was focused using an Olympus LMPlanFL N 100× objective, yielding a spot size of approximately 2 µm. Spectra were collected with a 5 s acquisition time over 5 accumulations. The laser power at the sample surface was controlled using neutral density filters (optical densities: 0.3, 0.6, and 1.0). Raman data were processed and interpreted using LabSpec 5 software.
Scanning Electron Microscopy with Energy Dispersive X-Ray Spectroscopy (SEM–EDS)
SEM-EDS was performed to understand the prints’ stratigraphy and the elemental attribution for each layer. Seventeen samples were analyzed: five from the small-format Ilford set, seven from the medium-format set, and five from the Kodak set. Samples were selected to represent a range of emulsion types, base tints, weights, and surface textures. In some cases, samples with identical surface features but differing emulsions or base tints were included to assess formulation variability. Small cross-sectional fragments (~1 × 0.5 mm) were manually collected from Dmax image areas using carbon steel single-edge blades. The samples were mounted on SEM stubs and examined at the Electron Microscopy Laboratory, Instituto Superior Técnico, Universidade de Lisboa. Imaging and elemental mapping were performed using a Hitachi S2400 analytical SEM (Hitachi High-Tech Corporation, Tokyo, Japan) with a Bruker light-element EDS detector (Bruker, Billerica, MA, USA).
3. Results
3.1. Collecting Historical Data on Ilford and Kodak DOPs
The literature review shows that Ilford, one of Europe’s leading photographic materials manufacturers, was founded in 1879 by Alfred Hugh Harman as Britannia Works, becoming Ilford Limited in 1902. The company introduced its first photographic paper, Bromide Paper, in 1894 and went on to expand its product line significantly throughout the 20th century. Although detailed production records are limited, it is known that Ilford sourced its paper supports from Wiggins Teape & Alex Pirie Ltd. (London, UK), applied the baryta layer through its associate company, Cassio Photographic Paper Co., Ltd. (Brentford, UK), and carried out the image layer coating in-house [46].
In the United States, George Eastman launched his photographic enterprise in 1880 with the manufacture of dry plates in Rochester, New York. The company was officially renamed Eastman Kodak Company in 1892. Kodak soon emerged as a key innovator in photographic paper production. Initially dependent on European suppliers for high-grade paper stock, the disruption caused by World War I led Kodak to establish its own high-purity paper mill. By the 1880s, it was already producing fiber-based developing-out papers (DOPs), and by 1900, both baryta and emulsion layers were applied in-house [7,55].
Some information is available regarding Kodak’s paper formulations. The early base consisted of a mix of 30% white rags, 20% sulfite wood pulp, and 50% soda wood pulp, since 100% rag was too absorbent and prone to curling. In 1923, the formula was adjusted to 75% rag and 25% sulfite pulp to reduce cockling, though it produced a duller paper tone. By 1924, high-alpha cellulose began to replace sulfite pulp, and by 1931, most Kodak papers were composed entirely of high-alpha pulp. By the late 1950s, the company was using up to ten different pulps, selected by species and function. In the 1960s, some bleached sulfite pulps were replaced with northern hardwood bleached kraft [7].
Kodak’s sizing methods also evolved: early wet-end sizing with rosin and aluminum sulfate was replaced around 1931 with stearic acid. Tub-sizing, where sheets were immersed in gelatin and hardened with formaldehyde or chromium chloride, remained common until the 1950s, when starch and dry-strength resins became more widely adopted. In the 1940s, melamine formaldehyde was also introduced to enhance wet strength [7].
In contrast, no comparable documentation was found regarding Ilford’s paper support composition or sizing practices.
Although the literature offers limited insight into the fillers used in Kodak’s paper base, some information can be inferred from patents by Wiggins Teape & Alex Pirie Ltd., Ilford’s paper supplier. These patents refer to the use of kaolinite [Al2Si2O5(OH)4] [56] and titanium dioxide (TiO2) to increase opacity in lightweight papers [57]. The use of iso-ascorbic acid crystals was also reported as a method to counteract iron contamination [58].
The disparity in available documentation between manufacturers such as Kodak and Ilford highlights the significant gaps in the historical and technical record of photographic paper production. Addressing these shortcomings will require further analytical and comparative material research. Such efforts are essential not only for reconstructing undocumented manufacturing practices but also for supporting conservation strategies and enhancing our understanding of the material and intangible heritage of 20th-century photographic materials.
3.2. General Features of the Samples
3.2.1. Thickness
Photographic paper manufacturers often classify their products by weight. Although surface density (g/cm2) can be a useful parameter to further discriminate photographic papers, this analysis was not performed because two of the sets contained perforations from the metallic spirals that bound them, making weight-based calculations of the whole prints inconclusive.
For both Ilford sets, Single Weight prints ranged from 0.16 to 0.20 mm in thickness. An exception was the Bromide B.2.23 P Light Weight Lustre from the medium-format Ilford set, which measured 0.09 mm. Double Weight papers exhibited greater surface variety, with thicknesses ranging from 0.26 to 0.31 mm. The thickest papers in the Ilford sample sets were the Cream Rough Luster and Cream Rayon types. Standard deviation values also provided useful insights into the surface texture of the papers.
In the Kodak set, the thickness of Single Weight samples was similar to that of Ilford (0.18–0.20 mm). However, the Light Weight Kodabromide A print was an exception, measuring 0.12 mm, making it thicker than Ilford’s Bromide B.2.23 P Light Weight Lustre. Kodak’s Double Weight papers were slightly thicker than Ilford’s, ranging from 0.31 to 0.35 mm. This difference was consistent both within the Kodak set and when compared with Ilford’s samples.
3.2.2. Base Tint
The Ilford samples utilized two distinct base tints: white and cream. These tints were not only easily discernible by eye but also strongly supported by colorimetric data. Scatter plots of the L*a*b* values, derived from both recto and verso measurements (Figure 2), clearly demonstrate the separation between white and cream Ilford papers. For both front and back measurements, the cream papers cluster toward higher b* values, ranging from 15.38 to 19.51. Conversely, white papers show lower b* values, between 3.62 and 11.73, confirming their cooler tone.
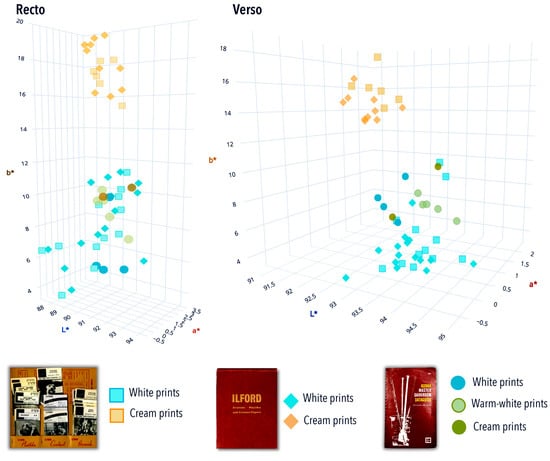
Figure 2.
Three-dimensional representation of the L*a*b* values measured on the recto and verso of the 54 Ilford and Kodak papers. The plot shows clear separation between white and cream Ilford papers, while Kodak samples cluster more closely, reflecting a narrower tonal range.
Unlike the Ilford samples, the Kodak set, which includes samples labeled as white, warm-white, and cream, does not exhibit distinct clustering patterns in the L*a*b* color space. The base tints appear more similar, with b* values overlapping across categories: white papers range from 6.19 to 10.46, warm-white from 8.29 to 10.75, and cream from 10.41 to 10.95. This narrower tonal spread suggests that Kodak employed a more limited color palette for its paper-based tints by 1972.
This reduced chromatic variation could reflect manufacturer-specific aesthetic choices. It might also be linked to the later production date of the Kodak samples, potentially indicating a shift toward more standardized tones in commercial black-and-white photographic paper during that period. These observations suggest that subtle differences in paper base tint could potentially aid in dating photographic prints. However, further research is needed to ascertain whether these variations are primarily influenced by time period, geographic region, or manufacturer practices.
3.2.3. Surface Features
Visual analysis of the raking light microphotographs (Figure 3) revealed that, despite variations in manufacturer nomenclature, many of the surface textures across both the Ilford and Kodak sets appeared strikingly similar. The most distinct textures observed were Velvet Stipple from the Ilford sets and Tweed Lustre and Tapestry Lustre from the Kodak set.
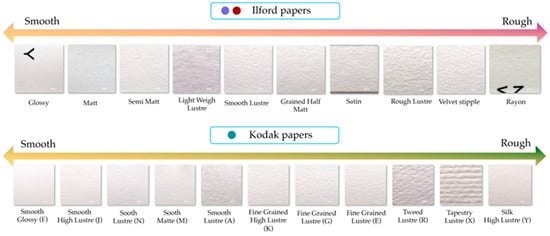
Figure 3.
Microphotographs of the paper’s texture in raking light, illustrating distinct surface features.
Regarding glossiness evaluated using colorimetry measurements (L*SCI–L*SCE), Ilford’s Glossy papers consistently measured just above 2.0, while matte surfaces showed very low gloss, with values under 0.3. The other surfaces displayed more variability, ranging from 0.39 to 1.32.
Kodak’s set presented slightly different values. Glossy (1.89) and High Lustre (1.83 and 1.89) prints were closely aligned, though variations were noted among the Lustre (0.82-1.05) samples. Interestingly, the Kodak matte print (0.21) was quite close to Ilford’s matte papers.
These results suggest that, despite manufacturers using different terms for gloss and texture, the actual surface properties often align. While not a standard method for gloss measurement, colorimetric assessment using the L*SCI–L*SCE formula shows promise for documenting the surface gloss of photographic papers. This approach could potentially help monitor changes from improper handling, storage, or conservation treatments, all of which can alter a print’s surface. However, further research is needed to evaluate the method’s reliability on photographic papers and to compare its accuracy with that of traditional glossmeter readings.
3.2.4. OBAs Assessment
The small Ilford prints did not present a considerable difference in fluorescence intensity. As shown in Figure 4, none of the Dmin areas of the Bromide, Plastika, or Contact samples exhibited the characteristic bright blue fluorescence typically associated with OBAs. The weak emission detected may originate from the baryta layer rather than from optical brighteners.
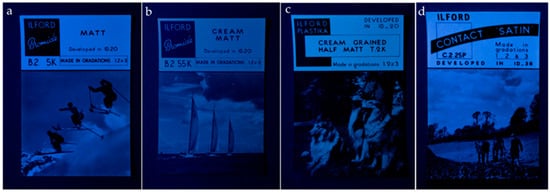
Figure 4.
UV-induced visible fluorescence of small-format Ilford prints: Bromide B.2. 5K Matt (a); Bromide B.2. 55K Cream Matt (b); Plastika T.2.K Cream Grained Half Matt (c); Contact C.2.25P Satin (d). Fluorescence comparisons were made by examining the Dmin areas of each print. None of the samples exhibits the bright blue fluorescence typical of OBAs, indicating their absence in this set.
In contrast, the medium-format Ilford set exhibited notable variation in fluorescence intensity (Figure 5). White Bromide and Contact prints fluoresced strongly (Figure 5a,d), while Plastika white papers displayed moderate fluorescence (Figure 5c). The cream-toned papers showed little to no fluorescence (Figure 5b). These observations suggest that optical brightening agents (OBAs) were used in all white papers in this set, likely in higher concentrations for Bromide and Contact papers, and to a lesser extent for Plastika, possibly due to their warmer image tone (as marketed by Ilford, [59]). Fluorescence was also observed on the verso of the white Ilford medium-format prints (Figure 6), likely in concentrations similar to those on the recto.
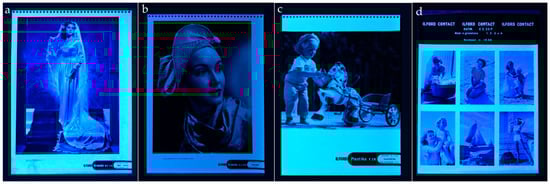
Figure 5.
UV-induced visible fluorescence of medium-format Ilford prints: Bromide B.2. 5K Matt (a); Bromide B.2. 55K Cream Matt (b); Plastika F.2.K Grained Half Matt (c); Contact C.2.25P Satin (d). Fluorescence comparisons were made by examining the Dmin areas of each print. White Bromide (a) and Contact (d) papers fluoresce strongly, while Plastika (c) papers show moderate fluorescence, and cream papers (b) show little to none, suggesting selective use of OBAs in white papers.
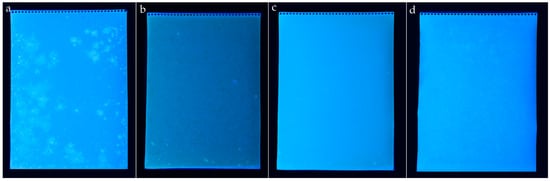
Figure 6.
UV-induced visible fluorescence of medium-format Ilford prints (recto): Bromide B.2. 5K Matt (a); Bromide B.2. 55K Cream Matt (b); Plastika F.2.K Grained Half Matt (c); Contact C.2.25P Satin (d). This confirms the stronger fluorescence in white papers compared to cream-toned samples, correlating with the use of OBAs.
Moreover, the Bromide B.2. 23 P Light Weigh Lustre print exhibited strong fluorescence on the recto but irregular violet fluorescence on the verso (Figure 7), possibly indicating variations in the additives used in the paper support.
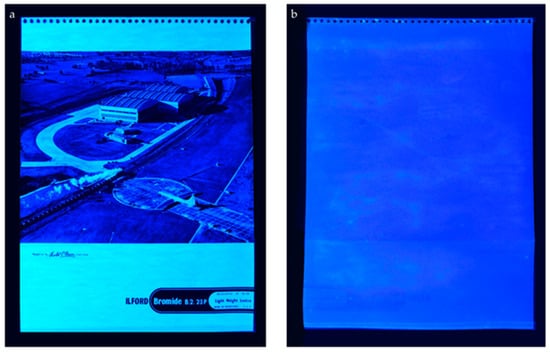
Figure 7.
UV-induced visible fluorescence of Bromide B.2. 23 P Light Weigh Lustre, recto (a), and verso (b), showing uneven fluorescence linked to the distribution of additives within the paper matrix.
Despite the small and medium Ilford sets being produced within a close timeframe, UV-induced fluorescence indicates they were not manufactured in the same year. These findings help narrow the production window of the medium set to 1949–1953, suggesting that Ilford likely started incorporating OBAs during this period. This is corroborated by a former photographic paper factory worker, who recalled that in 1949, Ilford Bromide paper already contained OBAs, specifically, Leucophor C fluorescent dye (4,4′-diaminostilbene-2,2′-disulfonic acid) from Sandoz in Czechoslovakia [60]. Another possible reason for the discrepancies between the sets may relate to the target audience for which the papers were produced, as previously discussed. These hypotheses warrant further investigation to confirm differences in paper composition, brightness, and UV fluorescence.
All Kodak prints exhibited fluorescence on both recto and verso, though at varying intensities (Figure 8a). This suggests the presence of OBAs in all samples, but at different concentrations. In several prints (Polycontrast F, Portalure G, and Ektalure X), parts of the verso fluoresced unevenly (Figure 8c,d), possibly indicating the use of different pulps in the paper support, as different pulps have variable degrees of dye absorption [5]. Notably, while OBAs were observed only in the white papers of the Ilford medium-format set, all Kodak papers, regardless of their marketed base tint, showed fluorescence, suggesting a broader and more uniform application of OBAs by Kodak. These results highlight the use of OBAs in the 1970s.
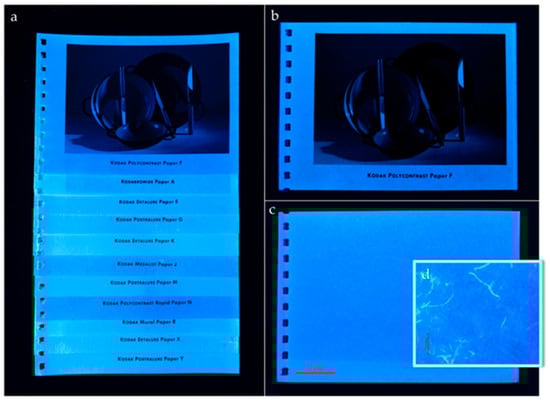
Figure 8.
UV-induced visible fluorescence of Kodak samples (a); Polycontrast F: recto (b), verso (c), and microphotograph of the paper support (d). All samples exhibit fluorescence on both recto and verso, though intensities vary. Polycontrast F shows uneven verso fluorescence, possibly indicating the use of mixed pulps with variable OBA absorption.
3.3. Structure and Composition
3.3.1. Paper Support
Pulp and Fiber Identification
A key distinction among the three sample sets was the type of pulp and fibers used in the paper support. As suggested by the UV-induced fluorescence, the Kodak set exhibited greater variability than the Ilford samples.
Pulp identification results are summarized in Table 2. All Ilford prints analyzed, along with five Kodak samples (Kodabromide A, Ektalure E, Ektalure J, Portalure M, and Portalure Y), were composed entirely of softwood bleached sulfite pulp. This finding aligns with Messier’s earlier observations that softwood bleached sulfite was widely used in photographic paper production during the mid-20th century and persisted into the 1970s [1].
Table 2.
Results for fiber identification microchemical tests.
In contrast, four Kodak prints (Polycontrast F, Portalure G, Polycontrast Rapid N, and Mural R) showed evidence of mixed pulps. Graff “C” staining revealed both light brownish fibers, indicating the use of softwood bleached sulfite, and bluish-gray fibers, suggesting hardwood bleached sulfite [53]. The ratio of hardwood to softwood appeared to vary across samples, as also observed with the UV fluorescence.
Ektalure X showed a slightly different result. While most fibers matched softwood bleached sulfite, one fiber stained light bluish-gray with the Graff “C” reagent but retained softwood morphology, suggesting the possible inclusion of softwood bleached kraft pulp [53]. Although this combination does not align with the general trends in photographic paper manufacturing [1], it reflects the shift during the 1970s, when sulfite pulps were gradually replaced by kraft processes in paper manufacturing [61].
Colorants
µ-EDXRF analysis was conducted on all 54 prints to assess the presence of colorants in the paper support. A clear difference emerged between the white and cream Ilford papers from both sets. While both base tints contained iron (Fe), the signal was significantly stronger in the cream papers. Under the microscope, the cream prints also revealed visible ochre-colored particles embedded in the paper fibers. These particles were further analyzed using Raman spectroscopy. The characteristic bands (Figure 9) centered around 243, 298, 394, and 549 cm−1 correspond to iron (III) oxide–hydroxide [FeO(OH)], suggesting the presence of goethite [62].
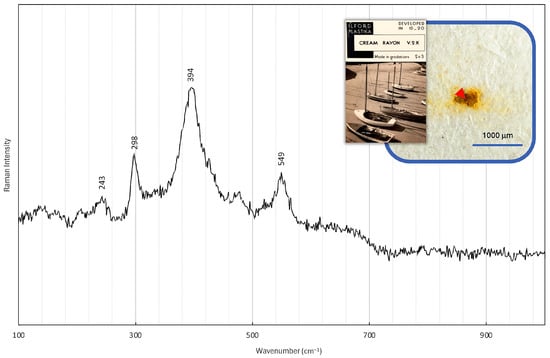
Figure 9.
Raman spectrum acquired from a yellow particle on the verso of Ilford Plastika V.2.K Cream Rayon. The inset shows the corresponding particle under magnification, with a red arrow marking the approximate measurement spot. The detected peaks (243, 298, 394, and 549 cm−1) are characteristic of the iron (III) oxide–hydroxide mineral goethite [62].
In contrast, none of the Kodak papers displayed detectable pigment particles under optical microscopy or Fe signals in µ-EDXRF analysis, and no elemental differences were observed among the white, warm-white, and cream samples. This may indicate that Kodak used an organic dye or pigment not detectable by µ-EDXRF, or possibly no colorant at all. Alternatively, the results could reflect changes in materials across different production periods or product lines.
Fillers and Additives
SEM-EDS analysis of cross-sections revealed numerous filler or additive particles embedded within the paper fibers of both Ilford sets (Figure 10). The EDS spectra showed the presence of aluminum (Al), silicon (Si), sulfur (S), carbon (C), and oxygen (O) (Figure 11a). This suggests the use of kaolinite [Al2Si2O5(OH)4] as a filler, a finding also noted in a patent from Ilford’s paper support supplier [56]. Alternatively, it could indicate the use of aluminum sulfate [Al2(SO4)3] as an additive to the sizing material, such as rosin [63]. In contrast, Kodak samples did not show observable particles in the paper support, with only C and O being detected (Figure 11b).
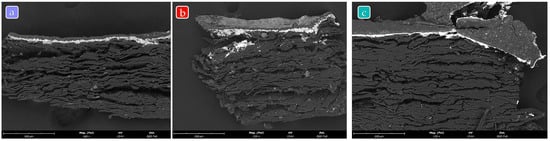
Figure 10.
SEM-EDS cross-sections of Ilford (blue and dark red letters) and Kodak (green letter) prints: Bromide B.2. 5K Matt (a); Bromide B.2. 55K Cream Matt (b); Portalure M (c). The paper supports of the Ilford samples contain multiple filler or additive particles embedded within the fibers, a feature not observed in the Kodak samples.
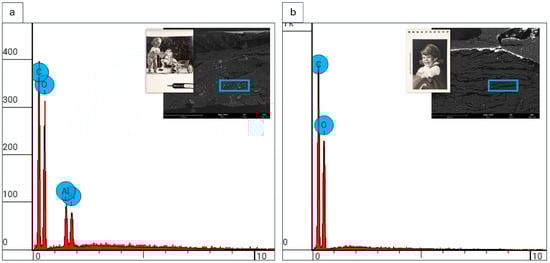
Figure 11.
(a) EDS spectrum and SEM image of the paper support in the Ilford Plastika R.2.K sample, showing embedded particles rich in Al, Si, and S, suggesting the presence of kaolinite or aluminum sulfate-based sizing agents. (b) Corresponding data for a Kodak Mural R sample, which showed no particles in the support, with only C and O detected. Blue rectangles indicate the EDS scan areas.
In the analyzed sample sets, the print Bromide B.2.23.P Light Weight Lustre from the medium-format Ilford set was particularly noteworthy. Its µ-EDXRF spectrum revealed the presence of titanium (Ti), while Raman spectroscopy further confirmed the presence of titanium dioxide (TiO2) in its anatase form through the presence of characteristic bands at 142, 396, 521, and 640 cm−1 [64] (Figure 12). This result corroborates descriptions found in a patent from Ilford’s paper supplier, which notes the use of TiO2 in lightweight papers to increase opacity [57].
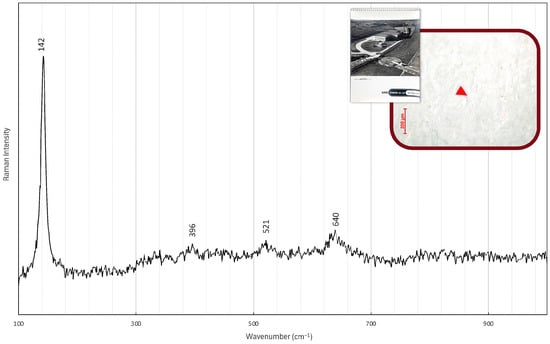
Figure 12.
Raman spectrum of the Ilford (dark red line) B.2.23.K Light Weight Lustre (paper support), showing characteristic bands at 142, 396, 521, and 640 cm−1, confirming the presence of anatase-form titanium dioxide (TiO2) as a filler. The red arrow marks the approximate measurement spot.
From a conservation perspective, the presence of anatase-form titanium dioxide (TiO2) is particularly significant. While it enhances paper brightness and opacity, anatase can promote oxidative reactions under light exposure, potentially contributing to the deterioration of silver images [65]. This highlights the critical importance of minimizing UV and visible light exposure during the storage and display of materials containing this compound.
3.3.2. Baryta Layer
µ-EDXRF analysis revealed that three prints, one Ilford medium-format sample (Bromide B.2.23.P Light Weight Lustre) and two Kodak samples (Kodabromide A and Mural R), did not present a signal for barium (Ba). This absence was later confirmed by SEM-EDS images of the cross-sections, which showed no intermediary layer between the paper support and the photographic emulsion (Figure 13).
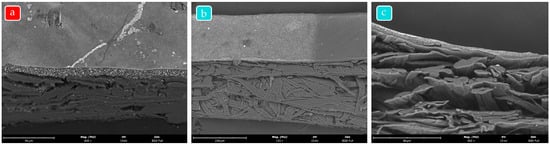
Figure 13.
SEM-EDS cross-sections showing Ilford Bromide B.2.23P Light Weight Lustre (a), Kodak Kodabromide A (b) and Mural R (c) prints. These samples lack a baryta layer, with no intermediary layer between paper support and emulsion.
Two of these papers, Bromide B.2.23.P Light Weight Lustre and Kodabromide A, were marketed as Light Weight, with thicknesses of 0.09 mm and 0.12 mm, respectively, making them thinner than the Single Weight papers (0.16–0.20 mm) in both sets. The third, Kodak Mural R, which was marketed as Single Weight, measured 0.20 mm, indicating that thinness alone is not a reliable indicator of the absence of a baryta layer.
The visual features of these baryta-less papers further reflect their compositional differences. All three showed the presence of optical brightening agents (OBAs). However, the Kodak baryta-less samples did not significantly differ in terms of colorimetric values from the other Kodak samples, and no dye or pigment was identified in their composition. In contrast, the Ilford baryta-less sample displayed the highest brightness among all analyzed papers (L* = 94.27), which can be attributed to the presence of anatase-form TiO2 in the paper support. This additive likely compensated for the absence of BaSO4 by increasing opacity and surface brightness [57]. These findings demonstrate that although the absence of a baryta layer is often accompanied by changes in paper thickness and the incorporation of alternative additives, the resulting optical properties depend largely on the specific fillers and brightening agents employed by each manufacturer. The Kodak baryta-less papers exhibited visual features similar to those of other Kodak prints with baryta layers, whereas the Ilford baryta-less paper stood out from the other Ilford samples, showing distinct variations in both brightness and material composition.
All other analyzed samples contained a baryta coating. Cross-sectional analysis revealed clear differences in this layer between Ilford and Kodak papers, as well as across the various surface finishes (Figure 14). Ilford baryta layers showed more variability. Glossy prints had the thickest and most compact layers with a flat top surface, while Bromide Matt papers featured coarser BaSO4 particles within a similarly thick layer. Papers with semi-reflective surfaces exhibited thinner baryta coatings, following the texture of the paper support, and containing BaSO4 particles that were coarser than those in glossy papers but finer than those in matte ones. The relationship between baryta layer structure and paper thickness was also evident. Glossy and Satin papers were both classified as Single Weight, and their measured mass was often similar; however, their thicknesses differed, with Glossy papers measuring 0.16 mm and Satin papers measuring 0.20 mm. This difference likely reflects variations in the calendaring process, where Glossy papers undergo heavier smoothing, resulting in a denser and thinner support [7]. No further correlations were observed between the baryta-coated Ilford papers’ features—such as brightness, OBA content, or colorants—and the variations in baryta layer structure. In comparison, Kodak baryta layers were consistently fine and compact, regardless of surface type.
Elemental analysis identified Ba, S, Sr, Ca, C, and O in Ilford baryta layers (Figure 15a), while Kodak baryta also contained Al (Figure 15b). Although Ca might originate from gelatin derived from bones and cartilages [63], the Al can be attributed to its common use as a gelatin hardener [66].
When considered alongside the baryta-less papers discussed above, these findings demonstrate how the Kodak papers maintained visual uniformity regardless of the presence of a baryta layer, while Ilford papers displayed a greater sensitivity to these factors, resulting in differences in thickness and additives.

Figure 14.
SEM-EDS cross-sections of Ilford small format (top, blue letters) and Kodak (bottom, green letters) showing variations of the baryta layer (white layer): Bromide B.1. 1P Glossy (a), Bromide B.2. 5K Matt (b), Bromide B.2. 26K Velvet Stipple (c), Polycontrast F (Glossy) (d), Portalure M (Matt) (e), and Portalure Y (Silk) (f). The cross-sections highlight distinct differences in baryta layer thickness, compaction, and particle size. Ilford samples display variability in BaSO4 layer characteristics, while Kodak baryta layers appear more compact and homogeneous.

Figure 15.
(a) EDS spectrum and SEM image of the baryta layer in the Ilford Bromide B.2.1 K sample, showing the presence of Ba, S, Sr, and Ca, indicating the use of barium sulfate with minor additives. (b) Corresponding data for a Kodak Portalure Y sample, where Al was additionally detected, possibly associated with gelatin hardeners. Blue rectangles indicate the EDS scan areas.
Raman spectroscopy was also used to confirm the composition of the baryta layer in selected samples. The spectrum displayed a sharp and intense peak at 988 cm−1, corresponding to the symmetric stretching vibration of SO42− in barium sulfate (BaSO4), confirming its presence [67]. Additional characteristic peaks appear at 453, 462, 619 and 646 cm−1 [67] (Figure 16). This further supports the findings from µ-EDXRF and SEM-EDS and demonstrates the complementarity of these techniques in characterizing stratigraphy and composition.
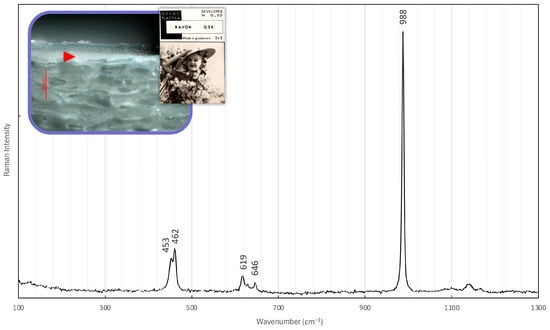
Figure 16.
Raman spectrum collected on the baryta layer of the Ilford Plastika Rayon G.2.K sample. The most intense band at 988 cm−1 corresponds to the symmetric stretching vibration (νₛ) of the sulfate ion (SO42−), confirming the presence of barium sulfate (BaSO4). Additional characteristic peaks appear at 453, 462, 619 and 646 cm−1. The inset shows the cross-section of the sample, with the red arrow indicating the area of laser focus on the baryta layer.
To facilitate the comparison across the three photographic paper sample sets and to summarize the key analytical findings, a comparative table (Table 3) is provided below. It highlights both shared characteristics and distinctive features in terms of thickness, gloss, base tint, OBAs, paper support composition, baryta layer structure, Raman spectroscopy results, and fiber composition.
Table 3.
Summary of analytical findings for the three photographic paper sample sets, highlighting shared characteristics and individual variations in thickness, gloss, base tint, optical brightening agents (OBAs), paper support composition, baryta layer, Raman spectroscopy results, and fiber identification.
3.4. Methodological Considerations and Future Perspectives
Defining an assessment and material characterization strategy for heritage objects is a complex process. Researchers must carefully consider whether sampling is necessary, which areas of the object can provide the most informative data, and how best to balance the acquisition of knowledge with the preservation of the object. Equally important is an understanding of the object’s cultural and historical value, which often limits the use of invasive analytical techniques that may cause irreversible damage. Photographic prints are a clear example: they are highly sensitive, and in the case of sample books, unique representatives of the production of photographic papers. Their rarity and representativeness make them particularly valuable for comprehensive studies but also demand caution when selecting the analytical approach. Lessons from these decision-making processes can also be applied to the study of other photographic print collections.
In this study, both non-sampling and sampling techniques were used in a complementary way to achieve a comprehensive understanding of the structure, composition, and features of photographic papers. Non-sampling techniques—including photo-documentation, thickness measurements, colorimetry, and µ-EDXRF—were particularly advantageous, as they allowed in situ analysis without material removal. These methods enabled the examination of all prints and provided baseline data that revealed compositional similarities and differences, as well as features such as gloss, surface texture, and the presence of optical brightening agents (OBAs). However, these techniques have limitations: they cannot fully resolve fine stratigraphic differences or material distributions within individual layers.
Analytical techniques such as ATR-FTIR, NIR, and Raman are often proposed as non-sampling approaches for the analysis of heritage objects. Preliminary tests with ATR-FTIR and Raman confirmed both the potential and risks of these methods. ATR-FTIR requires pressure to obtain high-quality spectra, which can physically damage fragile prints. Raman spectroscopy, while offering detailed molecular-level information useful for identifying pigments and compounds in complex layers, carries risks such as localized heating, sample burning, or crystallographic transformations [62].
Given these constraints, this study integrated selected sampling techniques where necessary. Fiber identification via microchemical tests, along with Raman and SEM-EDS analysis of cross-sections, provided precise information on layer structures and elemental composition. These approaches, however, required removing small fragments from the prints, a decision often unacceptable in heritage contexts.
This evaluation highlights the value of a tiered methodological approach: beginning with non-sampling analyses for broad characterization and progressing to minimally invasive sampling only when essential for detailed or layer-specific data. Such a strategy optimizes information gain while minimizing risk to the objects.
Future research directions can build upon these results. One priority is the quantitative assessment of surface gloss and roughness. While this study successfully used L* values to characterize gloss, profilometry and gloss meters could provide more accurate and reproducible measurements of surface roughness and gloss, respectively. For OBA detection, improved UV-induced photo-documentation with standardized calibration targets, spectrophotometry, or controlled Lightbox setups could allow for more consistent and semi-quantitative comparisons across samples [6].
Further work should also expand the use of spectroscopic techniques (ATR-FTIR, ER-FTIR, NIR, and Raman) to resolve compositional ambiguities observed here—for instance, distinguishing kaolinite from aluminum-based sizing agents (which overlap in SEM-EDS signals), or identifying organic colorants in Kodak samples with warm-white and cream tones, where inorganic pigments were absent. ER-FTIR could also provide insights into variations in surface features, compositions, and stratigraphic structures of DOP prints.
Finally, given the large datasets generated by these analyses, future studies should place greater emphasis on statistical methods such as Principal Component Analysis (PCA) and Hierarchical Cluster Analysis (HCA). These tools can enhance classification accuracy and reveal meaningful patterns in data from colorimetry, UV-induced fluorescence, and ER-FTIR spectra. Integrating advanced data analysis would significantly strengthen the identification and differentiation of photographic papers using predominantly non-sampling techniques.
4. Conclusions
This study provides a comparative analysis of three photographic paper sample sets: two from Ilford (ca. 1948–1952) and one from Kodak (1972). By employing a combination of analytical techniques, it was possible to document their general features, stratigraphy, and material composition. Despite the limited number of case studies, several noteworthy differences and similarities were identified. These findings offer new insights into historical manufacturing practices and present opportunities for dating and characterizing black-and-white fiber-based photographic papers.
The analysis of general features (thickness, base tint, gloss, and surface texture) revealed manufacturer-specific patterns. Thickness measurements were similar across sets, clearly differentiating Single and Double Weight samples while also highlighting subtle variations linked to surface texture production. Base tint distinctions were particularly pronounced in the Ilford samples, where colorimetric data clearly separated white from cream papers, a contrast less evident in the Kodak set. The reduced chromatic variability in Kodak papers may reflect a shift toward a narrower tonal range by the 1970s. If confirmed by future studies, this could serve as a useful parameter for dating photographic prints.
This study also demonstrated that UV-induced visible fluorescence can effectively differentiate production periods. The small-format Ilford set (ca. 1948) showed no OBA fluorescence, whereas white papers in the medium-format set (ca. 1949–1952) exhibited strong fluorescence. This narrows Ilford’s adoption of OBAs to between 1949 and 1952, aligning with information from a former Ilford employee. In contrast, the Kodak set exhibited consistent fluorescence across all samples, including cream and warm-white papers, reflecting widespread OBA usage by 1972.
Fiber and pulp analysis further expanded the understanding of manufacturing trends. All Ilford samples and most Kodak samples were composed of softwood bleached sulfite pulp, consistent with historical practices. However, four Kodak papers contained a mixture of softwood and hardwood pulps, and one included softwood bleached kraft pulp, indicating a diversification in fiber sourcing during the 1970s. These differences were also reflected in UV-induced fluorescence, likely due to varying OBA absorption in different pulp types.
One of the most distinctive findings was the identification of iron (III) oxide–hydroxide [FeO(OH)] yellow pigment, goethite, in the cream-toned Ilford papers. This pigment was absent in the Kodak samples, suggesting that Kodak may have used different (possibly organic) tinting agents or no added colorants at all.
A unique case in the Ilford medium-format set was sample Bromide B.2.23.P Light Weight Lustre, which lacked a baryta layer and instead contained anatase-form titanium dioxide (TiO2) as a filler. This sample stood out across all analyzed categories—thickness, fillers, fluorescence, structure, and composition. Notably, the presence of anatase TiO2 has been consistently associated with increased silver image degradation due to its photocatalytic activity under light exposure. While TiO2 has been more commonly studied in resin-coated papers, to our knowledge, no prior studies have addressed the production and stability of fiber-based photographic papers with TiO2.
This work provides new insights into the existence and material composition of lightweight photographic papers from the 1940s containing titanium dioxide (TiO2), expanding current understanding and establishing connections with the baryta-less papers studied in the Object:Photo project [2,8]. Although Bromide B.2.23.P Light Weight Lustre shares several physical characteristics with the baryta-less papers described in that study, like high opacity, flatness, a uniform surface, and a thin paper support, the analytical results clearly distinguish it: the present sample contains no barium sulfate, unlike those examined in [8]. These findings underscore the value of using complementary analytical techniques and highlight the need for continued research into under-documented photographic materials. Furthermore, they point to Ilford’s early use of TiO2 as a filler, well before the introduction of resin-coated papers in the 1960s.
The analysis of the baryta layers revealed differences in particle size, composition, and application between Ilford and Kodak papers.
These distinctions in manufacturing practices may serve as valuable markers for dating, authentication, and conservation of photographic prints. Non-invasive techniques such as UV examination and μ-EDXRF proved especially effective in identifying key differences without the need for sampling, making them particularly useful for large-scale collection surveys.
This study demonstrates the importance of a multi-analytical approach for the characterization of photographic papers. The use of sample books proved particularly valuable, as these unique resources provided a representative overview of the diversity of photographic papers produced while enabling the definition of analytical clusters. Sampling was limited to a minimal number of prints within these clusters, ensuring that the data obtained could serve as a reference framework while minimizing sample collection.
In this way, this study not only advances our knowledge of the structure, composition, and variability of photographic papers but also establishes a methodological reference that can guide future research on other collections. By prioritizing non-invasive analyses and reserving sampling for carefully chosen representative cases, this work provides a model for investigating photographic prints. Ultimately, the approach outlined here underscores the potential of sample books as key references for developing strategies that protect both the scientific and cultural value of photographic heritage.
Furthermore, characterizing photographic papers at this level not only contributes to technical art history and authentication but also supports more informed strategies for the active conservation and display of photographic prints.
Author Contributions
Conceptualization, É.R.; Methodology, L.-C.V., S.O.S., S.F.d.S. and É.R.; Validation, S.O.S. and S.F.d.S.; Formal analysis, L.-C.V.; Investigation, L.-C.V., S.O.S., S.F.d.S. and É.R.; Resources, É.R.; Data curation, L.-C.V.; Writing—original draft, L.-C.V. and É.R.; Writing—review & editing, S.O.S., S.F.d.S. and É.R.; Supervision, S.O.S., S.F.d.S. and É.R.; Funding acquisition, É.R. All authors have read and agreed to the published version of the manuscript.
Funding
This work was financed by national funds from FCT—Fundação para a Ciência e a Tecnologia, I.P., under the scope of the project UID/50006/2023 of the Associate Laboratory for Green Chemistry—LAQV REQUIMTE.
Data Availability Statement
The original data presented in the study will be openly available in the Run, Universidade NOVA de Lisboa repository at https://run.unl.pt/.
Acknowledgments
The authors would like to thank Lénia Oliveira Fernandes for generously sharing her Kodak sample book, which was a key component of this research, and for continuously offering valuable perspectives and suggestions. The authors are also deeply grateful to Márcia Vilarigues for her unwavering support throughout the course of this work. The authors acknowledge the support of the PRR project RE-C04-i01 and PRR Measure 6—STEAM and Impulso Adulto at NOVA University Lisbon (UNL), which provided access to the equipment used for the photo-documentation of the sample sets. Special thanks are also extended to Isabel Nogueira of Instituto Superior Técnico, Universidade de Lisboa, for conducting the SEM-EDS analysis and for her insightful contributions to the interpretation of the results.
Conflicts of Interest
The authors declare no conflicts of interest.
References
- Messier, P. Notes on Dating Photographic Paper. Top. Photogr. Preserv. 2005, 11, 123–130. [Google Scholar]
- Daffner, L.A. Assessing Photographic Collections. In Conservation of Photographs—Significance, Use and Care, 1st ed.; Norris, H.N., Kennedy, N., Lavédrine, B., Eds.; Routledge: London, UK, 2025; pp. 201–217. [Google Scholar]
- Weaver, G. A Guide to Fiber-Base Gelatin Silver Print Condition and Deterioration; Image Permanence Institute: Rochester, NY, USA, 2008. [Google Scholar]
- Stulik, D.; Kaplan, A. The Atlas of Analytical Signatures of Photographic Processes: Silver Gelatin; The Getty Conservation Institute: Los Angeles, CA, USA, 2013. [Google Scholar]
- Messier, P.; Baas, V.; Tafilowski, D.; Varga, L. Optical Brightening Agents in Photographic Paper. J. Am. Inst. Conserv. 2005, 44, 1–12. [Google Scholar] [CrossRef]
- Carranza, A. Optical Brighteners in Photographic Paper: New Methods, Data, and Results; Presented at Darkroom to Data; Yale University, 12 August 2024. Available online: https://www.youtube.com/watch?v=6LJs8xB0uoo&list=PL78n9l06zGylP5ZsdinPngOz40LAKJNoX&index=6&t=126s (accessed on 12 April 2025).
- Funderburk, K.; Weaver, G. A Guide to the Surface Characteristics Kodak Fibre Based Black and White Papers; Eastman Kodak Company: Rochester, NY, USA, 2007. [Google Scholar]
- Daffner, L.A. Dive: A Materialist History of the Photographic Industry in Germany and the Soviet Union between the wars. In Object: Photo: Modern Photographs, the Thomas Walther Collection 1909–1949; Abbaspour, M., Daffner, L.A., Hambourg, M., Eds.; Museum of Modern Art: New York, NY, USA, 2014; Volume 52. [Google Scholar]
- Messier, P. Image Isn’t Everything: Revealing Affinities across Collections through the Language of the Photographic Print. In Object: Photo. Modern Photographs: The Thomas Walther Collection 1909–1949; Abbaspour, M., Daffner, L.A., Hambourg, M.M., Eds.; The Museum of Modern Art: New York, NY, USA, 2014; Available online: http://www.moma.org/interactives/objectphoto/assets/essays/Messier.pdf (accessed on 5 July 2025).
- Duverne, R. Structural Measurements of DOP Photographic Paper and Article Size Analysis of Baryta Coating. In Understanding 20th Century Photographs: The Baryta Layer Symposium; Getty Conservation Institute and Paul Messier Inc.: Los Angeles, CA, USA, 24 January 2006. [Google Scholar]
- Johnson, C.R.; Messier, P.; Sethares, W.A.; Klein, A.G.; Brown, C.; Do, A.H.; Klausmeyer, P.; Abry, P.; Jaffard, S.; Wendt, H.; et al. Pursuing Automated Classification of Historic Photographic Papers from Raking Light Images. J. Am. Inst. Conserv. 2014, 53, 159–170. [Google Scholar] [CrossRef]
- Sexton, J.M.; Messier, P. Photographic Paper XYZ: ‘De Facto’ Standard Sizes for Silver Gelatin Paper. J. Am. Inst. Conserv. 2014, 53, 219–235. [Google Scholar] [CrossRef]
- Parker, C.; Messier, P. Automating art print authentication using metric learning. In Proceedings of the Twenty-First Innovative Applications of Artificial Intelligence Conference, Pasadena, CA, USA, 14–16 July 2009. [Google Scholar]
- Abry, P.; Roux, S.G.; Wendt, H.; Messier, P.; Klein, A.G.; Tremblay, N.; Borgnat, P.; Jaffard, S.; Vedel, B.; Coddington, J.; et al. Multiscale Anisotropic Texture Analysis and Classification of Photographic Prints: Art scholarship meets image processing algorithms. IEEE Signal Process. Mag. 2015, 32, 18–27. [Google Scholar] [CrossRef]
- Klein, A.G.; Messier, P.; Frost, A.L.; Palzer, D.; Wood, S.L. Deep learning classification of photographic paper based on clustering by domain experts. In Proceedings of the 2016 50th Asilomar Conference on Signals, Systems and Computers, Pacific Grove, CA, USA, 6–9 November 2016; pp. 139–143. [Google Scholar] [CrossRef]
- Messier, P.; Frank, E.B. Art into data | engineering WImBo. In Proceedings of the 2018 52nd Annual Conference on Information Sciences and Systems (CISS), Princeton, NJ, USA, 21–23 March 2018; pp. 1–4. [Google Scholar] [CrossRef]
- Lens Media Lab. Paperbase [Dataset]. Available online: https://paperbase.xyz (accessed on 23 August 2024).
- Abbaspour, M.; Daffner, L.A.; Hambourg, M.M. Object: Photo. Modern Photographs: The Thomas Walther Collection 1909–1949 at The Museum of Modern Art. 8 December 2014. Available online: https://www.moma.org/interactives/objectphoto/materials/material_analysis.html (accessed on 23 August 2024).
- Fotomuseum Antwerp. The Gevaert Paper Project, Unlocking a Historical Collection. Fotomuseum Antwerp Collection. Available online: https://fomu.be/en/watch-read/the-gevaert-paper-project-unlocking-a-historical-collection (accessed on 7 December 2023).
- Wei, W.; Stigter, S. Surface Roughness, Appearance, and Identification of AGFA-Gevaert Photograph Samples. Top. Photogr. Preserv. 2017, 17, 11–24. [Google Scholar]
- Dune, C.; Grinde, L.; Wiegandt, R. Characterization of black-and-white silver gelatin fibre-based photographic prints. Top. Photogr. Preserv. 2005, 11, 38–56. [Google Scholar]
- Martins, A.; Daffner, L.A.; Fenech, A.; McGlinchey, C.; Strlič, M. Non-destructive dating of fiber-based gelatin silver prints using near-infrared spectroscopy and multivariate analysis. Anal. Bioanal. Chem. 2012, 402, 1459–1469. [Google Scholar] [CrossRef][Green Version]
- Vessot, K.; Messier, P.; Hyde, J.M.; Brown, C.A. Correlation between Gloss Reflectance and Surface Texture in Photographic Paper. Scanning 2015, 37, 204–217. [Google Scholar] [CrossRef]
- Fisher, E. Decoding: A Guide to Kodak Paper Surface Characteristics. Collections 2018, 14, 207–225. [Google Scholar] [CrossRef]
- Warda, J. (Ed.) The AIC Guide to Digital Photography and Conservation Documentation, 3rd ed.; American Institute for Conservation of Historic and Artistic Works: Washington, DC, USA, 2017. [Google Scholar]
- Carnazza, P.; Francone, S.; Morelli, P.; Reale, R.; Sammartino, M. Retouching matt contemporary paint layers: A new approach using natural polymers. Ge-Conservacion 2020, 18, 384–393. [Google Scholar] [CrossRef]
- Wei, W. Innovative Technology in Art Conservation: Original Appearance and Viewer Perception. In Conservation in Focus; Routledge/Taylor & Francis Group: London, UK, 2024. [Google Scholar]
- Mustalish, R. Optical brighteners: History and technology. Stud. Conserv. 2000, 45, 133–136. [Google Scholar] [CrossRef]
- Wetzel, R. Optical Brighteners—A Study of Water Solubility. Top. Photogr. Preserv. 2005, 11, 73–78. [Google Scholar]
- Connors-Rowe, S.A.; Whitmore, P.M.; Morris, H.R. Optical Brighteners in Black-and-White Photographic Paper: Appearance and Degradation. J. Am. Inst. Conserv. 2007, 46, 199–213. [Google Scholar] [CrossRef]
- Daffner, L.A.; Messier, P. New applications for paper fiber analysis in characterizing photographs. In Proceedings of the AIC 9th Biannual Winter Meeting of the Photographic Materials Group, Tucson, AZ, USA, 28–29 September 2009. [Google Scholar]
- Daffner, L.A.; Martins, A.; McGlinchey, C. Context and content: Dating of photographic prints by Henri Cartier-Cresson based on visual examination and chemical analysis. In Proceedings of the AIC 10th Biannual Winter Meeting of the Photographic Materials Group, Ottawa, ON, Canada, 10 March 2011. [Google Scholar]
- Backprinting on 20th Century Photographic Paper. Available online: https://backprinting.com/ (accessed on 23 August 2024).
- Walker, J.M. ER-FTIR spectroscopy as a characterization tool for 20th century silver gelatin photographs. In Proceedings of the Materials of Photography: An Interdisciplinary Symposium, The National Archives and the Victoria and Albert (V&A) Museum, Online, 13 September 2023. [Google Scholar]
- Boatright, R. The Graphics Atlas: Applied. Top. Photogr. Preserv. 2011, 14, 229. [Google Scholar]
- Walker, J.M.; Berrie, B. Influence of image density and interfacial surfaces on ER-FTIR spectra of 19th century photographic print processes. J. Cult. Herit. 2023, 63, 1–10. [Google Scholar] [CrossRef]
- Fernandes, L.J.O. Characterization and Identification of Printed Objects. Master’s Thesis, Universidade NOVA de Lisboa, Lisbon, Portugal, 2008. [Google Scholar]
- Messier, P.; Stulik, D. Understanding 20th-Century Photographs: The Baryta Layer Symposium; Getty Conservation Institute: Los Angeles, CA, USA, 2006. [Google Scholar]
- Camille, M. An analytical study of Eugène Atget’s photographs at the Museum of Modern Art. Top. Photogr. Preserv. 2007, 12, 194–210. [Google Scholar]
- Zamboni, C.B.; Redígolo, M.M.; Miura, V.T.; Costa, I.; Nagai, M.L.E.; Salvador, P.A.V.; da Silva, D.G.N. Non-Destructive Analysis in the Study of Historical Photographs by pXRF and ATR-FTIR Spectroscopies. J. Forensic Sci. 2021, 66, 1048–1055. [Google Scholar] [CrossRef]
- Arrizabalaga, I.; Gomez-Laserna, O.; Aramendia, J.; Arana, G.; Madariaga, J.M. Specular Reflection FTIR: A Non-Contact Method for Analyzing Coatings on Photographs and Other Cultural Materials. J. Am. Inst. Conserv. 2020, 59, 123–136. [Google Scholar] [CrossRef]
- Oravec, M.; Haberová, K.; Jančovičová, V.; Machatová, Z.; Čeppan, M.; Huck, C.W. Identification of the Historic Photographic Print Materials Using Portable NIR and PCA. Microchem. J. 2019, 150, 104202. [Google Scholar] [CrossRef]
- Čechák, T.; Kopecká, I.; Trojek, T.; Štanzel, T.; Bártová, H. Application of X-ray Fluorescence in an Investigation of Photographic Heritage. Radiat. Phys. Chem. 2015, 116, 8–13. [Google Scholar] [CrossRef]
- Modica, A.; Alberghina, M.F.; Brai, M.; Bruno, M.; Di Bella, M.; Fontana, D.; Tranchina, L. XRF Analysis to Identify Historical Photographic Processes: The Case of Some Interguglielmi Jr.’s Images from the Palermo Municipal Archive. Radiat. Phys. Chem. 2017, 13, 76–80. [Google Scholar] [CrossRef]
- Photomemorabilia. ILFORD Chronology. Available online: https://www.photomemorabilia.co.uk/Ilford/Chronology.html (accessed on 5 July 2025).
- Hercock, R.J.; Jones, G.A. Silver by the Ton: The History of Ilford Limited, 1879–1979; McGraw-Hill Book Co.: London, UK, 1979. [Google Scholar]
- Photomemorabilia. ILFORD Multigrade Printing Paper. Available online: https://photomemorabilia.co.uk/Ilford/Multigrade.html (accessed on 5 July 2025).
- Pollak, K. Frederick William Charles John Farleigh. National Portrait Gallery. 1948. Available online: https://www.npg.org.uk/collections/search/portrait/mw14061/Frederick-William-Charles-John-Farleigh?LinkID=mp12161&search=sas&sText=Karl+Pollak+&role=art&rNo=11 (accessed on 5 August 2025).
- Lough, K. Imagin Technique for Photographs. In Conservation of Photographs—Significance, Use and Care, 1st ed.; Norris, H.N., Kennedy, N., Lavédrine, B., Eds.; Routledge: London, UK, 2025; pp. 263–269. [Google Scholar]
- ISO 9184-1; Paper, Board and Pulps—Fibre Furnish Analysis—Part 1: General Method. International Organization for Standardization: Geneva, Switzerland, 1990.
- ISO 9184-2; Paper, Board and Pulps—Fibre Furnish Analysis—Part 2: Staining Guide. International Organization for Standardization: Geneva, Switzerland, 1990.
- ISO 9184-3; Paper, Board and Pulps—Fibre Furnish Analysis—Part 3: Herzberg Staining Test. International Organization for Standardization: Geneva, Switzerland, 1990.
- ISO 9184-4; Paper, Board and Pulps—Fibre Furnish Analysis—Part 4: Graff “C” Staining Test. International Organization for Standardization: Geneva, Switzerland, 1990.
- ISO 9184-5; Paper, Board and Pulps—Fibre Furnish Analysis—Part 5: Lofton-Merritt Staining Test. International Organization for Standardization: Geneva, Switzerland, 1990.
- George Eastman History. (n.d.). Kodak. Available online: https://www.kodak.com/en/company/page/george-eastman-history/ (accessed on 1 June 2025).
- Wiggins Teape & Co. Ltd. Improvements in the Production of Photographic Printing Paper. GB Patent 908075A, 17 October 1962. [Google Scholar]
- The Wiggins Teape Group Limited. Improvements in and relating to the manufacture of paper and other cellulosic sheet materials. UK Patent GB627759A, 14 February 1947.
- Farnley, A. My Life in the Photographic Industry: Part 2. Quarterly. J. Br. Assoc. Pap. Hist. 2017, 101, 15–20. [Google Scholar]
- Ilford. Printing and Enlarging, 1st ed.; Ilford Limited: London, UK, 1948. [Google Scholar]
- Farnley, A. My Life in the Photographic Industry: Part 1. Quarterly. J. Br. Assoc. Pap. Hist. 2016, 99, 8–13. [Google Scholar]
- Sixta, H. (Ed.) Handbook of Pulp; Wiley-VCH: Weinheim: Germany; John Wiley: Hoboken, NJ, USA, 2006. [Google Scholar]
- Stuart, B. Analytical Techniques in Materials Conservation; John Wiley & Sons: Chichester, UK, 2007. [Google Scholar]
- Herrera Garrido, R. Conservación y Restauración de Fotografía; Editorial Síntesis: Madrid, Spain, 2022. [Google Scholar]
- Sacco, A.; Mandrile, L.; Tay, L.-L.; Itoh, N.; Raj, A.; Moure, A.; Del Campo, A.; Fernandez, J.F.; Paton, K.R.; Wood, S.; et al. Quantification of titanium dioxide (TiO2) anatase and rutile polymorphs in binary mixtures by Raman spectroscopy: An interlaboratory comparison. Metrologia 2023, 60, 055011. [Google Scholar] [CrossRef]
- Wagner, S. An Update on the Stability of B+W Resin Coated Papers. Top. Photogr. Preserv. 1999, 8, 60–66. [Google Scholar]
- James, T.H. (Ed.) The Theory of the Photographic Process, 4th ed.; Macmillan: New York, NY, USA, 1977. [Google Scholar]
- Bell, I.M.; Clark, R.J.H.; Gibbs, P.J. Raman Spectroscopic Library of Natural and Synthetic Pigments (Pre-≈1850 AD). Spectrochim. Acta A Mol. Biomol. Spectrosc. 1997, 53, 2159–2179. [Google Scholar] [CrossRef]


Disclaimer/Publisher’s Note: The statements, opinions and data contained in all publications are solely those of the individual author(s) and contributor(s) and not of MDPI and/or the editor(s). MDPI and/or the editor(s) disclaim responsibility for any injury to people or property resulting from any ideas, methods, instructions or products referred to in the content. |
© 2025 by the authors. Licensee MDPI, Basel, Switzerland. This article is an open access article distributed under the terms and conditions of the Creative Commons Attribution (CC BY) license (https://creativecommons.org/licenses/by/4.0/).