1. Introduction
Colorful and gilded glass tesserae were extensively used in the mosaics of the Roman world. An early use of glass can be noticed in floor decorations as early as the end of the second century BCE, but, in this first phase, proper glass tesserae are extremely rare. A systematic diffusion of glass tesserae in floor and wall mosaics can be noticed starting from the first century CE on. The increasing diffusion of glass tesserae can be explained with the development of the glassblowing technique, which was spreading across the Mediterranean during the same period [
1]. This new forming technique, which originated in the Levant around the middle of the first century BCE, caused a proper economic revolution of the glass market. Glass became cheaper and, for the first time, was used to make objects for everyday use [
2]. By the middle of the first century CE, glass tesserae became the preferred material for wall mosaics, and, in the same period, the first gilded tesserae were introduced [
3]. Roman floor mosaics always tended to privilege stone tesserae, but, especially during late antiquity, floor revetments were sometimes enriched by details in colored glass [
4].
During the Roman era, chunks and lumps of raw glass were produced in the large glassmaking ‘primary’ furnaces mainly located in ancient Palestine and Egypt, where suitable glassmaking raw materials (sand and flux) were largely available. The raw glass was then transported to ‘secondary’ workshops across the Mediterranean, where it was reworked and colored [
5]. Nevertheless, the archaeological record completely lacks evidence documenting where the raw glass was colored [
6]. If this point is nowadays still debated, scientific studies on third- to sixth-century CE glass tesserae have frequently identified markers of mixing and recycling different base glasses [
7,
8,
9]. This trend is likely to reflect that glass was colored in workshops located far from the primary furnaces and that had access to base glasses of different origin [
10].
Several studies of Roman mosaics also indicate a widespread practice of recycling and coloring cullet for the manufacture of glass tesserae [
11]. In later periods, glass tesserae were widely reused as a readily available source of opaque and colored glass.
The thousands of loose glass tesserae excavated in the Roman villa of Aiano, a late-Roman villa built between the end of the third and the beginning of the fourth century CE and then abandoned in the late fifth century CE (but still used for looting and recycling until the middle of the seventh century CE), are an interesting case study to investigate the impact of mixing and recycling in the production of mosaic tesserae. The period of life of the villa is particularly interesting because important changes of the glass industry can be observed during the fourth century CE, when Roman mosaic art reached its greatest geographic expansion [
4,
12]. Concerning glass technology and materials, Sb-based opacifiers used for the white and yellow glass start to be replaced systematically by Sn-based compounds from the beginning of the century [
13]. At the same time, the Ni-rich cobalt sources used during the Roman period are replaced by new low-Ni raw materials [
14,
15]. From the middle of the century, new Egyptian base glasses start to circulate on the market, after three centuries dominated by the nearly exclusive presence of the Mn- and Sb-decolored glass produced, respectively, in the Levantine and Egyptian furnaces [
16].
Portable analytical techniques represent nowadays well-accepted methods for the investigation of historical and archaeological materials [
17]. The potentialities of analytical surveys on archaeological glass via portable devices are increasingly popular due to the non-invasiveness of the analytical approach and the reduced analytical time and costs, if compared to traditional techniques. This thus results in the chance to carry out wide in situ surveys that are welcomed by archaeologists and conservators and represents the main advantage of portable analytical techniques.
If the potentialities of the application of colorimetry, Raman and fiber optic reflectance spectroscopies (FORS) are well known [
18,
19], p-XRF still suffers from several drawbacks for the investigation of ancient glass, mainly represented by the significant limitation in providing accurate information for light elements (Z < 14) and the limited accuracy in the quantification of some elements due to the overlapping of specific fluorescence lines. Matrix effects have also to be considered [
20,
21,
22].
Besides a pure qualitative evaluation of the results, a semi-quantitative approach via built-in algorithms or external calibration methods based on standard or reference materials can be also carried out. Although more or less accurate quantitative information are provided, a direct comparison of the results with external data is, however, not possible. Nevertheless, a recognition and characterization of large chemical datasets can also be carried out following the application of robust multivariate statistical methods that can provide for the identification of compositional clusters. The clusters can then be studied for preliminary provenance or technical-related studies and/or be further investigated via more accurate methods.
This said, pXRF can represent an extremely powerful alternative in those cases where an internal grouping of ‘closed’ populations of delicate and/or highly abundant repertories is required [
23,
24]. The identification of carefully tailored measurement and processing protocols might provide good statistical results in accordance with those that are obtained through lab-based methods and can strongly support the archaeological interpretation.
3. The Archaeological Context: The Roman Villa of Aiano
The Aiano villa is located in present-day Tuscany, in the territory of the San Gimignano municipality (
Figure S1). The building is near the Fosci stream, a tributary of the Elsa River, and it is not far from the ancient roads towards
Florentia (Florence),
Saena Iulia (Siena) and
Volaterrae (Volterra). The ongoing archaeological investigations, carried out by a Belgian and Italian team from UCLouvain, began in 2005.
During the archaeological excavation, an outstanding late antique villa was found: the main feature is a large central hall with three apses (M), surrounded by an
ambulatio with five apses (N). A small vestibule (O) was set in the southern part of the room M. It was connected to a corridor, oriented north–south (R) and facing three rectangular rooms on the west side (A-B-C). From the corridor R towards the east, there were six small rooms (area 5000 east), where some pits with hundreds of
sectilia glass fragments were found. The principal feature of the northwestern wing of the building is a large rectangular hall (U) that opened on the east side to an open area (V). Room β is the most recent discovery in the site: a huge room with six pilasters, with
dolia still in situ, perhaps used as storage for edible items (such as wine) [
25].
The building was inhabited from the end of the third century CE to the middle of the seventh century [
26] (
Figure 1): after the foundation (end of the third—first half of the fourth century CE) of the southwestern sector (rooms A, B), the large central hall was added between the end of the fourth and the second half of the fifth century. During a first phase, a hall with six apses was created, surrounded by a five-apsidal
ambulatio and with a rectangular vestibule. Later, three of the six apses of the main hall were demolished, and three new rectangular rooms were built.
At the end of the fifth century CE, the villa was abandoned. From the beginning of the sixth century CE, the building hosted various productive activities: all the materials of the former villa (marble, glass, lead, bronze, bricks) were systematically collected and recycled [
27].
Between the second half of the sixth and the middle of the seventh century CE all the workshops were closed, and the building was eventually abandoned.
During the sixth century, almost every room of the site was dedicated to an activity practiced with a high level of specialization. For example, room B was a blacksmith’s workshop, room I was dedicated to the transformation of copper alloys, activities in room H were probably linked to a nearby pottery kiln (room F), while room L shows traces of gold working [
27,
28,
29].
Several activities related to glass working were also identified. In room O, a glass-recycling furnace was found, for the melting of cullet and mosaic glass tesserae. These kinds of glass items, together with hundreds of glass inlays, were found mostly in the small open spaces along corridor R, such as room S, where they were probably stored before being melted and recycled inside the kiln of the nearby room O. This kiln was probably linked also with the activities in room A, where about 6000 mosaic glass tesserae were found. In this space the tesserae were stored before being recycled, and two pits were used for roasting and washing the tesserae to remove the mortar.
4. Materials and Methods
The assemblage investigated in the present study is part of a large repertory of glass tesserae (more than six thousand) found in Aiano and distributed within 99 stratigraphic units. A representative selection of 392 tesserae belonging to the more represented US, i.e., the pit of room A (US 1095, 59%), and US 5010 and US 5015 (18%) from room S, were considered for the present study. The tesserae were part of destroyed mosaics and had been stored for recycling. From an archaeological point of view, US 1095 dates back to the second quarter of the sixth century CE (when the workshops for recycling were active), US 5015 to the end of the sixth—beginning of the seventh century CE, and US 5010 to the first decades of the seventh century (the last period of the archaeological site, when the workshops were abandoned).
The selection of the tesserae was based on preliminary observations (also carried out via optical microscopy) that allowed the identification of seven main color groups (blue, red, green, yellow, deeply colored, white and transparent). Different sub-categories based on colorimetric investigation were also identified, as reported in
Table 1.
4.1. Optical Microscope–OM
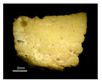
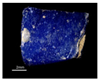
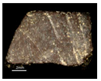
Glass tesserae were photographed with 1× and 4× magnification, in visible light, using a Nikon Eclipse E 600 microscope (Nikon Corporation, Tokyo, Japan) equipped with a Nikon camera.
4.2. Colorimetry
Color measurements were acquired by using a Konica-Minolta spectro-colorimeter (model CM-700d, Konica-Minolta, Inc., Tokyo, Japan). It was equipped with a pulsed xenon lamp with UV cut filter as the source, an integrating sphere (d/8° measurement geometry), and a silicon photodiodes array as the detector, working in the 400–700 nm spectral range with a 10 nm acquisition step. The instrument’s white reference (100% reflective) and black reference (0% reflective) boxes were used for calibration. Color measurements were acquired using D65 illuminant and a 10° supplementary standard observer, and excluding the specular component of light. For each measurement, the SAV head (Ø 5 mm) of the instrument was used. Each measurement was the average of three acquisitions.
For the calculation of the colorimetric parameters, the CIEL * a * b * 1976 colorimetric space (CIELAB 1976, Commission Internationale de l’Eclairage) was used. L*, a* and b* ranges are reported in
Table 1.
Colorimetry was mainly used as a preliminary screening, to get a first grouping of the tesserae based on the measured color. Given the archaeological nature of the material, the surfaces of many tesserae were uneven or corroded, often retaining traces of mortar or soil within surface pores. Although all samples were gently cleaned with distilled water, the resulting colorimetric data were inevitably influenced by their state of conservation and/or the presence of surface alterations.
Table S1 shows the results of the tesserae identified as dark blue (DB). Despite their good conservation, their colorimetric values show considerable variability. Similar trends were observed for tesserae of other colors, making it unreliable to use colorimetric data for further discussions.
4.3. Fiber Optic Reflectance Spectroscopy—FORS
FORS measurements in the 350–2200 nm range were performed using two single-beam Zeiss spectrum-analyzers (Carl Zeiss AG, Oberkochen, Germany), model MC601 (190–1015 nm range) and model MC611 NIR 2.2WR (910–2200 nm range), housed together in a compact and portable chassis for in situ analyses. The data acquisition step was 0.8 nm/pixel for the 1024-element silicon photodiode array detector (MCS601), and 6.0 nm/pixel for the 256-element InGaAs diode array detector (MCS611 NIR 2.2WR). The radiation between 320 nm and 2700 nm, which was provided by a voltage-stabilized 10 W halogen lamp (mod. CLH600), was conveyed to the sample by means of a quartz optical fiber bundle that also transported the reflected radiation to the detectors. The geometry of the probe head was 8°/8°. Each measurement was the average of 3 acquisitions. Calibration was performed by means of a 99% Spectralon® diffuse reflectance standard. Spectra were processed using Aspect Plus® 1.80 software. Due to the surfaces of the tesserae, often uneven and corroded, the quality of the recorded spectra was frequently quite low, and sometimes it was impossible to obtain a significant result. The presence, in some cases, of a discontinuity at 1000 nm is due to an artifact generated by the instrument that does not perfectly recombine the parts of the spectrum recorded by the two different detectors. This problem can be due to various factors, the main one being even a very small movement of the probe during acquisition. Sometimes the problem can be solved by repeating the measurement and/or renewing the reference spectrum, but there is no rule. So, in many cases, the FORS measurements were repeated several times on the same sample to try to find the conditions to obtain a good quality spectrum.
4.4. X-Ray Florescence—XRF
XRF non-invasive analyses were performed using a portable device, Tracer III SD Bruker, equipped with a rhodium X-ray tube, a palladium anticathode and a solid-state silicon detector energy dispersion system. The set-up was as follows: 40 keV and 12 μA for 120 s. The measuring area was an elliptical spot of 4 mm × 7 mm. Where possible, the acquisitions were taken on well-preserved areas where no surface treatment or corrosion sub-products were visible.
Internal calibration methods provided by the factory generally allow poor analytical responses and the development of empirical calibrations targeted to the material are recommended when a semi-quantitative analysis is required. In this framework, the use of certified reference materials (CRMs) is essential to determine the instrument’s accuracy and precision [
22].
Quantitative analysis was performed using the ATRAX software (Artax best 7.4) which enables the construction of calibration models based on certified reference glasses. For this purpose, standard materials such as NIST 1412 and Corning B, C and D were used, covering a representative range of concentrations for most of those elements used to describe archaeological glasses. The recommended concentrations of the reference glass standard reported in previous works [
21,
30] were used in this study.
For each element, net peak areas were extracted and plotted against certified concentrations to produce linear calibration curves (R2 > 0.95). The resulting equations were then applied to unknown samples acquired under the same analytical conditions. Concentrations were obtained through interpolation, with limited extrapolation applied where necessary.
XRF quantification was based on calibration curves constructed for Cu and Sr (Kα emission lines), and Sb and Pb (Lα lines). Linear regression was applied to construct calibration curves for each of these elements, yielding correlation coefficients (R
2) between 0.918 and 0.999 (
Figure S2).
In cases where the peak area slightly exceeded the range of available standards, a limited linear extrapolation was applied, based on the slope and intercept of the calibration curve. The range of extrapolation was kept minimal to reduce associated uncertainty. No extrapolation was applied for elements with highly non-linear behavior or lacking reliable reference values. The accuracy of interpolated concentrations was evaluated by cross-checking chemically correlated element pairs (e.g., K–Rb, Ca–Sr). Additional elements of interest—including Ti, Fe, Mn, Co, K, Ca, Rb, Zr, Zn and Sb—were interpolated based on their spectral proximity and chemical behavior relative to these reference elements. This approach enabled a consistent semi-quantitative estimation suitable for compositional comparisons among the assemblage.
Cu, Sr, Pb and Sb were selected for quantitative interpolation and cross-sample comparison due to their analytical stability, strong signal-to-noise ratio and absence of significant spectral interference, making them particularly well-suited for quantification in complex glass matrices. These elements exhibited high linearity (R2 ≥ 0.97) and low errors (Mean Absolute Error, MAE, and Relative Standard Deviation, RSD), enabling their use as primary references to interpolate concentrations of chemically and spectrally related elements. Although Pb showed a higher MAE value—attributable to its wide calibration range (0–35 wt%)—this remains consistent with the semi-quantitative objectives of the analysis. In the case of Sb, the A-RSD was comparatively higher (9.85%) than for the other calibrated elements, but still acceptable given the comparative and cluster-based focus of this study, rather than a need for absolute quantification.
Glass standards Corning A and NIST 610 and 611 were used as secondary standard to measure accuracy and precision of the calibration.
The spectra acquired on glass samples were processed using the ARTAX 7.4 (Bruker™, Berlin, Germany) software and the generated net areas of the fluorescence lines were normalized to the counts of the Rh Kα lines of the 40 kV mode in order to compensate for differences in morphology and the total irradiated mass per sample [
22]. The concentration of each element was obtained using empirical calibration corrections. Results are reported as weight percent (wt%) or parts per million (ppm) for trace elements.
Origin 2024 was used to perform PCA and k-means cluster analysis of the semi-quantitative data. PCA analysis was performed on log10 transformed data in order to compensate for differences in magnitudes between the major elements and the trace elements [
31]. The Factor Analysis and Optimal Cluster Number plug-ins were, respectively, used to identify key variables for PCA—to capture dataset variability—and to determine the most appropriate number of clusters for the k-means analysis.
4.5. Micro-Raman Spectroscopy
Raman measurements were carried out using a Renishaw InVia Qontor spectrometer (Renishaw plc, Kensington, Australia) equipped with a Peltier cooled (−70 °C) NIR enhanced CCD camera and a Leica DM2700 microscope. The excitation wavelength was 785 nm, and LWD20× (NA 0.35—WD 6.9 mm) and LWD 50× (NA 0.50—WD 8.2 mm) were the microscope objectives used. The laser power was around 1–5 mW, with a total acquisition time of 25 s (5 s and 5 accumulations) and a spectral resolution of 1200 L/mm. As for the FORS measurements, Raman spectra suffered from the surface conditions of the tesserae, not allowing us, in some cases, to obtain the desired information.
5. Results
The mean composition of each color group, as determined by pXRF, is reported in
Table S3.
The instrumental configuration selected for the chemical analysis of the glass tesserae imposed significant limitations in providing accurate information for light elements (Z < 14). This did not allow for a comprehensive investigation of the base glass since some fundamental markers—such as Al, Na and Mg—could not be detected. Nevertheless, useful indications were derived from the investigation of heavier elements that allowed for the definition of compositional clusters that have been used as markers for a first technological and chronological definition of tesserae [
21].
The similarities in ionic charge and radius of Rb, Sr and Zr with those of K, Ca and Ti, respectively, allowed these elements to substitute for major elements and enter the glass via raw materials. As demonstrated in previous studies [
21,
32], the analysis of heavier elements proved to be largely unaffected by surface corrosion and was therefore useful to a preliminary characterization of the raw materials.
Rubidium and strontium, specifically, are more sensitive to differences between batches [
33,
34,
35]. High values of Sr were commonly detected in Roman glass because of the widespread use of seashells as a source of carbonates. A high Sr/Rb ratio was detected in all the samples belonging to deeply colored glass tesserae, as well as dark blue (DB), light blue (LB), emerald green (EG), TU (turquoise), W (white) and transparent ones. Some green (G) and red (R) tesserae from unit 1095 also showed a similar Sr/Rb ratio.
On the contrary, yellow and green tesserae, together with red tesserae from units 5010 and 5015 and white samples from unit 5015, were characterized by a low Sr/Rb ratio likely related to a significant contribution of the felspathic fraction of the sand to the glass composition [
36].
Variable levels of other heavy elements (e.g., Co, Cu, Mn, Pb, Sb and Sn) were considered as the consequence of an intentional addition of colorants/decolorants and/or opacifiers [
37], whose nature will be discussed in the following sections.
5.1. Colorless Tesserae
The Aiano site returned many colorless and gilded tesserae, most of them preserving traces of both the original cartellina and the gold leaf. However, only the results of the investigation of the base glass will be discussed in the present paper. The 43 transparent tesserae selected for the present study mainly belonged to US 1095, except for a few samples from US 5010 and 5015.
Due to the limits imposed by the analytical set-up, an in-depth study of the base glass could not be carried out. However, distinct compositional clusters were inferred based on the presence of different decoloring agents—manganese, antimony or a combination of both.
Most of the transparent tesserae (23 fragments) revealed the typical features of a mixture of Egyptian Sb- and Roman Mn-decolored glass due to recycling activities. Three different sub-groups were also identified according to an average Sb/Mn ratio, respectively, of 1.9, 0.6 and 0.1 (
Figure S3).
Egyptian Sb-decolored glass (11 samples) and Levantine Mn-decolored glass (9 samples) were also identified. The former group included tesserae from room A (US 1095) and room S (US 5010 and 5015), characterized by high antimony values (Sb > 0.5 wt%). In contrast, the Mn-decolored glass group was mainly represented by tesserae from room A (US 1095) and characterized by high manganese contents (Mnavg, 1.20 wt%).
Rare examples of naturally decolored glass (2 samples), likely derived from high pure raw materials, were also identified. The samples showed low contents of impurities (Mn < 0.06 wt%, Sb below detection limits and Fe < 0.4 wt%).
Due to the high transparence of the glass, the backscattered signal in the FORS spectra was very poor and only a weak absorption at 470–490 nm, due to Mn
3+ and/or [Fe
3+O
3S
2−]
5− complex, was detectable [
38,
39]. In a few spectra, the presence of Fe
2+ absorption band in the NIR region was also observed [
40].
5.2. Colored Glass
The main coloring agents and opacifiers representing each color group were investigated by means of FORS and Raman spectroscopy. The results were also supported by chemical analyses, which also provided additional technological insights.
Furthermore, multivariate statistical methods were carried out to highlight the variability within the chemical dataset—both across the entire assemblage and within individual color groups—with the aim of distinguishing different production batches, identifying evidence of mixing and/or recycling, and defining potential chronological or geographical markers for a better understanding of the large glass assemblage from Aiano.
5.3. Blue, Aquamarine and Turquoise Tesserae
The nature of the coloring agent—cobalt and/or copper—was the main discriminant within this large group of tesserae comprising dark blue (DB), light blue (LB), transparent dark blue (DBtr), and corroded light blue (LBC), turquoise (TU) and aquamarine (AQ) glass. The distinction between copper- and cobalt-based colorants was clearly illustrated in the Cu vs. Co biplot (
Figure S4), where two distinction series were observed.
The chemical composition of
Co-blue glass (a total of 90 tesserae, consisting of opaque DB and LB tesserae) was characterized by elevated cobalt (Co 100–2000 ppm) and antimony values (Sb up to 2.25 wt%). The FORS spectra showed the typical absorption bands of pseudo-tetrahedral Co
2+ in the VIS and NIR regions, respectively at 540, 595 and 650 nm and 1280, 1500 and 1790 nm [
18,
38,
41] (
Figure 2a). Raman spectroscopy allowed the identification of the presence of hexagonal CaSb
2O
6 crystals dispersed in the glassy matrix, as suggested by a strong peak observed at 670 cm
−1 (
Figure 3d), while no evidence of the rhombic form, Ca
2Sb
2O
7, was observed [
42,
43,
44].
In contrast, copper in its oxidized state was responsible for the blue hue of Cu-blue glass (TU and DBtr and LBC glasses). Copper-based glass showed different chemical and spectroscopic features which can be summarized as follows:
- -
Turquoise tesserae (TU): the main chemical features of TU opacified tesserae were represented by high amounts of Cu and Sb (Cu
avg 1.23 wt% and Sb
avg 0.72 wt%), with variable amounts of Pb (0.18–2.54 wt%) (
Figure 2b). The reflectance spectra showed a deep absorption band in the range 380–420 nm, due to Fe
3+, and a broad band in the NIR region, due to the sum of the contributions of d-d transition in octahedral Cu
2+ and Fe
2+. In a few spectra, a weak band at 485 nm related to Mn
3+ was also present [
38,
45]
- -
Transparent dark blue (DBtr) and corroded light blue (LBc) tesserae: the series were characterized by variable amounts of Cu (0.60–0.95 wt%), with Mn representing the main decoloring agent (Mn
avg of 0.90 wt%). Aquamarine tesserae (AQ) represented a well-defined sub-group showing significant differences in terms of opacifying agents. XRF analysis allowed discriminating between high-Sb (Sb
avg 1.29 wt% and Pb
avg 0.39 wt%) and high-Sn (Sn
avg 0.25 wt% and Pb
avg 6.58 wt%) series within AQ tesserae. The FORS spectra of Cu-colored glass was represented by a broad band in the NIR region due to d-d transition of octahedral Cu
+ (
Figure 2b). Furthermore, additional spectral features Co
2+ in the visible region were also observed in AQ spectra.
5.4. Red Tesserae
Copper represented the main coloring agent of all the samples from this group. However, a technological discrimination according to peculiar chemical features was also possible through the screening of the chemical dataset. The average contents of contaminants, such as lead, iron and tin, were particularly useful for a discrimination of different compositional clusters.
A
high-Pb series was represented by six samples from US 5010 and US 5015. It was mainly characterized by high Fe contents (average value of 1.36 wt%), together with non-negligible amounts of Zn (average value of 0.36 wt%, except of sample 5010_R3 where Zn was very low). Sb generally was very low (below 0.02 wt%). The FORS spectra showed a broad S-shaped absorption band between 400 and 550 nm due to the spectral contributions of trivalent iron (370 and 430 nm) and colloidal copper Cu
0 (550–560 nm), as also suggested by an inflection point between 590 and 595 nm (
Figure 4a) [
46]. A shoulder at 640 nm and a further absorption band centered at 780 nm were related to the oxidized Cu
2+ ion [
47].
The formation of colloidal copper was also confirmed by XRD analysis carried out on some copper crystals observed on the surface of some of the red tesserae (
Figure S5). The Raman investigation of a few random small crystals dispersed within the glassy matrix allowed the identification of the presence of lead stannate, represented by the very strong band at 138 cm
−1 assigned to the Pb-O stretching mode [
48] (
Figure 3e).
On the contrary, the
low-Pb series was characterized by moderate antimony (mean Sb = 0.16 wt%) and high iron (Fe = 2.8 wt%) values. As observed for the high-Pb series, the FORS spectra (
Figure 4b) were coherent with the presence of colloidal metallic copper (inflection point between 587 and 593 nm). A further absorption band centered at 480 nm was assigned to Mn
3+, while a slight inflection around 650 nm could indicate the presence of several iron oxides which could influence the final hue of the samples [
49].
Within the low-Pb series, four samples showed slight differences in the chemical composition, especially in terms of antimony (0.14–0.59 wt%) and copper (below 0.8 wt%). Iron was abundant (up to 4.21 wt%) and likely intentionally added to promote the redox reaction (average Fe/Cu = 5). The FORS spectra again showed the typical features of colloidal metallic copper. A broad absorption band due to Fe
2+ centered at 1060 nm was also observed (
Figure 4c) and likely formed from metal iron added to promote reducing conditions within the batch [
50].
5.5. Yellow and Light Brown Tesserae
The yellow tesserae (Y) showed peculiar chemical features in terms of coloring/opacifying agents.
The
high Sn-series (Sn
avg 0.45 wt%) was represented by samples from US 1095, 5010 and 5015. The tesserae were also characterized by high lead (Pb 5.90–11.90 wt%), low iron and potassium (Fe
avg 0.54 and K
avg 0.15 wt%) and negligible amounts of antimony (Sb below 0.1 wt%). The FORS spectra showed the typical S-shaped trend with an inflection point around 500 nm and a maximum between 395–410 nm (
Figure 5, black line). The presence of lead tin yellow type II was confirmed by the Raman investigation (
Figure 3b), where two peaks at 136 and 330cm
−1 were observed [
48].
In contrast, the
high-Sb series was mainly represented by samples from US 1095 and could be characterized by a general increase in Sb (up to 0.40 wt%) followed by a progressive decrease in Sn (0.03–0.28 wt%), with Pb ranging between 1.67 and 8.56 wt%. The Raman spectra (
Figure 3a) showed a strong band at 510 cm
−1 related to the stretching of the SbO
6 octahedra, together with weaker bands in the range 200–400 cm
−1 assigned to vibrational modes of both Sb–O and Pb–O bonds. The presence of a strong peak at 140 cm
−1 was related to the Pb–O lattice vibration modes. The FORS spectra (
Figure 5, red line) were characterized by the typical absorption bands of Fe
3+ and Fe
2+, respectively at 390 nm and 1040 nm. An intense signal at 440 nm, together with a shoulder at 590 and a further, but less intense, band around 670 nm, were related to the presence of lead antimonate [
51].
5.6. Green Tesserae
The chemical analysis of the green tesserae provided a first discrimination according to differences in both the chromophores and opacifying agents.
Group G1 was primarily composed of emerald green tesserae from US 1095 (7 samples), along with a few from US 5010 (2 samples). The FORS spectra showed a strong absorption band around 390 nm attributable to Fe
3+, along with broader bands centered at approximately 800 and 1040 nm, corresponding to Cu
2+ and Fe
2+, respectively (
Figure 6, blue line). An additional absorption band at 480 nm was attributed to Mn
3+ [
38,
50]. XRF analysis revealed elevated contents of Cu (0.65–1.52 wt%), Fe (0.55–1.04 wt%) and Sb (up to 1.23 wt%), with variable levels of Pb (0.43–1.26 wt%).
Group G2 included emerald green tesserae from US 1095 (9 samples), US 5010 (2) and US 5015 (5). As in G1, the reflectance spectra showed typical absorption bands of Fe
2+, Mn
3+ and Cu
2+, resulting in a broadening of the reflectance band between 400–570 nm and the absorbance band between 700–1100 nm (
Figure 6, magenta line). XRF analysis showed a higher Pb/Sb ratio compared to G1, with average concentrations of Pb and Sb at 1.73 wt% and 0.33 wt%, respectively. Non-negligible levels of Sn were also detected (average 0.8 wt%).
Group G3 was mainly represented by green tesserae from US 1095 (16 samples), along with a few from US 5010 (1) and US 5015 (2). The FORS spectra revealed a decrease in the intensity of the Cu
2+ absorption band and an increase in bands related to both Fe
2+ and Fe
3+ (
Figure 6, black line). The presence of lead antimonate was suggested by a characteristic inflection point at 500 nm and confirmed by micro-Raman analysis, which also detected hematite (Fe
2O
3) and anatase (TiO
2) crystals (
Figure 3f). Group G3 showed increased Pb content (up to 6.42 wt%) and average Sn levels of 0.13 wt%, while copper was less abundant (average 0.70 wt%).
Group G4 consisted of a few emerald green tesserae from US 1095 and 15 additional green tesserae from US 5010 and 5015. This group showed distinctive composition features compared to the others. The FORS spectra (
Figure 6, red line) displayed a clear Cu
2+ absorption band centered at 800 nm. Micro-Raman analysis confirmed the use of lead stannate (PbSnO
3) as the opacifier. XRF analysis showed high Pb (5.99–9.31 wt%) and Sn (0.21–0.45 wt%) contents, with Cu concentrations up to 1.00 wt%. Trace amounts of Sb were also observed (below 0.2 wt%).
5.7. Deeply Colored Tesserae
A first observation via optical microscopy revealed different optical features—both in terms of the colors and opacity of the glass—allowing the tesserae to be classified as dark purple (DP), dark amber/brown (BR), dark green (DG) and black (BK).
Deeply colored glass was characterized by a highly heterogenous composition, with the presence of multiple chromophores and impurities. The chemical analysis showed peculiar compositions, particularly with regards to manganese and iron contents.
The high-Mn series was represented by black (BK), dark purple (DP) and brown (BR) tesserae, mainly belonging to US 1095 (20 samples), with a few exceptions related to US 5010–5015.
The BK and DP tesserae exhibited similar manganese (Mn
avg 2.05 wt%) and iron (Fe
avg 0.94 wt%) contents—with Mn/Fe ratio ranging from 1 to 5—suggesting that the purple color was primarily due to the combined presence of manganese and iron. Nevertheless, the two groups showed significant differences in terms of impurities and/or secondary chromophores that affected the final color. BK tesserae were characterized by Cu and Pb up to 1.07 and 1.32 wt%, respectively, while DP tesserae showed high Sb (0.18–0.85 wt%, except for a few samples where Sb was under the detection limit). In DP tesserae, moreover, Sr concentration (Sr
avg 0.15 wt%) resulted in slightly above average values detected within the Aiano assemblage. The FORS spectra of BK tesserae showed a broad absorption band between 450 and 700 nm, suggesting the role of different chromophores in the generation of the final dark purple color (
Figure 7a, red line).
The BR tesserae showed a quite homogeneous composition, mainly represented by lower contents of both Mn and Fe (Mn
avg 1.06 wt% and Fe
avg 0.83 wt%, respectively), resulting in an average Mn/Fe ratio of 1.2. No impurities were here detected in relevant concentrations. The reflectance spectra showed an absorption band centered between 420 and 450 nm, which could be associated with the Fe
3+O
3S
2− chromophore responsible for the amber color, together with a Fe
2+ absorption band centered at 1045 nm (
Figure 7a, black line).
The
high-Fe series was represented by dark green (DG) tesserae. High contents of iron (Fe 2.29–4.10 wt%), coupled with Co up to 250 ppm, were considered responsible of the dark color. Low amounts of Cu and Pb (Cu
avg 0.12 wt%, Pb
avg 0.19 wt%), together with traces of Sb and Sn, were also observed, but the low concentrations detected for these elements suggested a contamination with raw materials or may have been due to recycling procedures instead of the intentional addition of opacifying agents [
52]. An exception was represented by two tesserae where high amounts of potassium (K up to 4.94 wt%) and calcium (Ca up to 16.70 wt%) were observed. Rubidium and strontium (Rb
avg 200 ppm and Sr
avg 0.12 wt%) also resulted in higher than average values obtained for the Aiano assemblage.
The FORS spectra were poorly defined, but the spectral signatures of bivalent and trivalent iron were observed. A weak band at 480 nm was assigned to Mn3+, while Co2+ was responsible for the small inflections at 590–650 nm.
5.8. White Tesserae
White tesserae mainly belonged to US1095 (11 tesserae), with a few examples from US 5015 (2). The results from pXRF allowed the identification of the use of two different opacifying agents that defined a high-Sb and a high-Sn series.
The high Sb-series—exclusively represented by tesserae from US1095—showed notable concentrations of antimony and iron, with Sb and Fe reaching 3 wt% and 0.77 wt%, respectively. Non-negligible amounts of lead (Pb 1.45 wt%) were also observed in sample 1095_IND10. The FORS spectra (
Figure 7b) showed two absorption bands at 380 and 415 nm due to Fe
3+ and a third one at 470–490 nm attributable to Mn
3+ and/or an Fe
3+ cluster with S. Raman analysis showed two weak peaks at 480 and 633 cm
−1 and an intense one at 670 cm
−1, along with other four peaks at 520, 337, 324 and 238 cm
−1, the first two attributable to CaSb
2O
7 and the others to Ca
2Sb
2O
6 (
Figure 3c).
The high-Sn series was defined by two white tesserae from US5015 characterized by average tin and lead contents of 0.5 wt% and 9.6 wt%, respectively. These samples also showed low calcium content (below 4 wt%) and potassium below detection limits.
6. Discussion
Given the semi-quantitative nature of the results, the accuracy of an intra-instrument comparison is not without issues, and direct integration with other datasets must be approached cautiously. Nevertheless, an accurate processing of the chemical dataset could be helpful to describe the variability within the assemblage, offering internally consistent results for archaeological interpretations—raw materials selection, technological practices and recycling processes [
23,
24,
53].
The identification of chromophores and opacifying or decoloring agents, when integrated with a statistical treatment of the chemical dataset, enables a first chronological and geographical contextualization of the Aiano assemblage within the broader framework of the Roman glass industry.
A multivariate statistical analysis was carried out to explore compositional variability across the assemblage. Principal Component Analysis (PCA) was applied to six major and trace elements (Si, Ca, K, Rb, Sr and Zr), selected for their relevance in distinguishing among different sources for raw material (
Table S4)—since they represent well-established proxies for the silicate matrix (Si, Zr), flux composition (K, Rb) and carbonate fraction (Ca, Sr).
The PCA, performed on four components, explained 98.91% of the total variance. PC1 (driven primarily by K and Rb) and PC3 (characterized by high loadings of Ca, Sr and Zr) were identified as the most indicative dimensions to describe variations in raw-material composition. As shown in
Figure 8, the distribution of the samples in the PC1/PC3 biplot clearly reveals distinct compositional groups reflecting different technological traditions and/or compositional features. A following K-means clustering (k = 4, based on PCA scores) resolved four chemically coherent subgroups (Clusters 1–4), each reflecting a peculiar combination of raw material—silica source, carbonate input and fluxing agents.
Cluster 1 (grey ellipse; 62 tesserae; 15.5% of the assemblage) was defined by high Si-Ca-Sr-Zr signatures, consistent with mature, quartz-rich continental sands [
54]. The low potassium content (<1.5%) and the lack of correlation with Rb, strongly suggested the use of mineral soda as a flux. Minor accounts of K were, thus, likely introduced via feldspathic sand inclusions, or through contamination during secondary melting and/or recycling activities, as also supported by Fe, Ti and Pb contents [
5,
13]. The mean Sr concentration (~1000 ppm) exceeded typical natron glass values, suggesting additional source of SrO, either an Sr-rich carbonate source or the intentional addition of seashells, as also supported by the positive Ca-Sr correlation [
35,
55,
56]. The tesserae in this cluster were predominantly colorless, although some lightly colored ones were also present. The overall chemical signature of these tesserae is consistent with the recycling of natron-based glass produced between 3rd BCE and 3rd CE centuries [
57]. Anomalous samples within this group—including two deeply colored tesserae with elevated K and Ca—might reflect the use of halophytic plant ashes as an alternative flux.
Cluster 2 (blue ellipse; 60 tesserae; 15.0%) showed lower levels of Ca, Sr, Zr and K (mean K = 0.37 wt%). The compositional signature is compatible with the use of relatively pure siliceous sands combined with limestone as a source for carbonate [
57,
58]. The low Sr/Rb and weaker Ca-Sr correlation further support this interpretation. Such chemical features are consistent with standardized natron-based Roman glass produced during the Imperial period (1st–3rd century CE) and related to production centers located in internal areas [
59,
60]. Nevertheless, further investigations are mandatory for a more accurate validation of the results. The cluster includes a wide variety of Sn-opacified tesserae, including many yellow and green, together with some red ones.
Cluster 3 (green ellipse; 18 tesserae; 4.5%) can be distinguished by low K, Si and Sr contents and a strong positive correlation with Rb, resulting in a low Sr/Rb ratio. In Roman glass production, low contents in K coupled with traces of Rb (e.g., tens of ppm) is typically associated with the use of natron as a flux, with Rb coming from the silica source, such as sand [
61]. The group consists exclusively of Pb-Sn yellow tesserae and may reflect a specialized production.
Cluster 4 (red ellipse; 259 tesserae; 64.9%) formed the largest group and was characterized by a strong association with K (mean K = 0.75 wt%). As observed in cluster 1, this feature is indicative of contamination from secondary processing or recycling, particularly through repeated melting of cullet or contact with fuel ashes.
Strontium-to-rubidium ratios (
Figure S6) further supported the raw material distinction among clusters, with high-Sr samples consisting of seashell-derived lime additions and low-Sr/Rb glass relating to continental, feldspathic sand sources [
62].
6.1. Colorless Tesserae
A multivariate statistical analysis (PCA and K-means cluster analyses) was performed in order to investigate compositional variability within the transparent glass tesserae. Seven heavy elements (Cu, Co, Fe, Mn, Pb, Sb, Ti) were selected for their relevance in describing different decoloring agents and tracking recycling indicators.
The PCA was performed on four components which accounted for 98.42% of the total variance (
Figure 9). PC1, representing the 71.61% of the total variance, was primarily associated with the use of different decoloring agents—Sb and/or Mn. PC2 (18.87%) reflected compositional variability related to the presence of contaminants (
Table S5).
K-means clustering (k = 5) based on PCA scores allowed identifying distinct compositional groups, corresponding to the use of different raw materials and decoloring agents.
Cluster 1 (purple ellipse; 8 tesserae; 17.8% of the total transparent tesserae) consisted of Mn-decolored glasses with variable Cu and Fe contents. On the other hand, copper is not typically associated with the silica source, and its presence in cluster 1 may be attributed to minor contamination from recycled cullet, rather than intentional addition [
62,
63]. Mn was, thus, deliberately added to counteract the greenish tint caused by iron [
64].
Cluster 2 (grey squares; 2 tesserae; 4.4%) included naturally decolored glasses obtained via the exploitation of high pure sands characterized by negligible contents in Sb, Mn and Fe. The absence of decolorants is consistent with the deliberate selection of high-quality sands.
Cluster 3 (red ellipse; 11 tesserae; 24.4%) was represented by Sb-decolored glasses with a minimal presence of contaminants, suggesting the exploitation of refined sands. Recycling was limited or absent.
Cluster 4 (blue ellipse; 14 tesserae; 31.1%) consisted of mixed Sb/Mn glass exhibiting elevated levels of contaminants—such as Fe, Ti, Pb and Cu. This chemical signature is consistent with repeated recycling activities and/or mixing cullet with different technological features.
Cluster 5 (green ellipse; 10 tesserae; 22.2%), also represented by mixed Sb/Mn glass, showed lower levels of impurities, likely reflecting fewer episodes of recycling. The positive correlation between (Ti + Zr) and Fe (
Figure 10) is considered indicative of the use of non-refined continental or feldspathic sands with a relevant presence of accessory minerals (such as ilmenite, rutile and/or magnetite).
Mixed Sb/Mn glasses constituted the most abundant group within the colorless tesserae Aiano. Pure Sb- and Mn-decolored glasses represented 24.4% and 20%, respectively, of the total colorless glass tesserae. This distribution is in accordance with trends in Roman glassmaking. Previous studies stressed a considerable variability in Sb and Mn oxide ratios over time, with mixed Sb/Mn glass becoming predominant during the late Roman period—coinciding with the maximum expansion of the villa of Aiano. During the same period, Mn- and Sb-decolored glasses were documented to a lesser extent—18% and 7%, respectively [
13].
The higher frequency of Fe, Ti, Pb and Cu in the Mn- and mixed Mn/Sb groups supported the evidence of recycling activities or batch contamination, while no evidence of recycling was observed in antimony and naturally decolored glasses.
6.2. Colored Tesserae
A multivariate statistical approach was applied to colored tesserae to assess compositional variability in relation to the main coloring and/or opacifying agents during Roman glassmaking. PCA was performed on seven key elements (Co, Cu, Fe, Mn, Sb, Sn and Pb,
Table S6). Four principal components extracted from PCA allowed explaining the for 93.76% of the total variance (
Figure 11). PC1 (46.04%) described Sb- and Sn-based opacifying/coloring agents, while PC3 (17.71%) explained a smaller, but significant, portion of the variability primarily associated with the use of Cu-based chromophores.
K-means clustering (k = 5) allowed the identification of five distinct compositional clusters reflecting compositional groupings according to different technological features.
Cluster 1 (green ellipse, 27 tesserae, 7.6% of the colored assemblage) showed a minimal influence from metallic oxide. The group included yellow tesserae colored with lead antimonate—most of them characterized by a faint yellow or light brown color, along with several deeply colored ones. The chemical signature of this group likely reflects dilution on the original chemical composition due to recycling.
Cluster 2 (grey ellipse, 114 tesserae, 32.2%) showed a strong correlation with copper and included Cu-colored tesserae—such as blue (Cu-blue), turquoise, aquamarine, red (low-Pb series), green (groups G2 and G3) and deeply colored glasses (black high-Mn series with high-Mn, Fe and Cu contents). The low influence of Pb, Sb and Sn may suggest a limited use of opacifiers, either due to extensive recycling—resulting in the dilution of the original additives—or the intentional use of refined copper.
Cluster 3 (blue ellipse, 35 tesserae, 9.9%) was defined by high Pb and Sn contents and consisted exclusively of high-Sn yellow tesserae—most of which corresponded to the samples grouped in cluster 3 in
Figure 8. The homogeneous and well-defined chemical composition of this group, both in terms of raw material and opacifying/coloring agents, suggests the application of a standardized glass recipe. Such consistency might be indicative of a specific production center or workshop.
Despite cluster 4 (red ellipse, 54 tesserae, 15.3%) was also strongly influenced by Pb and Sn, it showed a broader variability and a stronger association with Cu if compared with cluster 3. The group also showed a more heterogeneous population, including red (high-Pb series), yellow (high-Sn with high-Cu, mean Cu = 0.21 wt%), and green tesserae (G4 together with some G3), together with white and aquamarine ones.
Custer 5 (violet ellipse, 124 tesserae, 35.0%) was associated with Sb and Co and was represented mainly by Co-blue and white tesserae, along with most of the deeply colored ones (high-Fe and high-Mn series). The chemical composition of this group is consistent with the deliberate use of cobalt ores and calcium antimonate opacifiers, while complex mixtures involving multiple colorants could be assumed for the deeply colored tesserae.
This multivariate statistical analysis performed on colored tesserae provided a robust strategy for exploring intra-group variation and technological signatures within each color category. Following this first classification, the results were further discussed in order to investigate different materials and technologies, also within the same color group.
6.3. Blue, Aquamarine and Turquoise Tesserae
The large group of blue, turquoise and aquamarine tesserae were further investigated based on the nature of the coloring and opacifying agents.
Chemical and spectroscopic profiles of
Co-blue tesserae (classified as DB and LB glasses by preliminary observations) supported the deliberate use of cobalt, often associated with elevated levels of Sb due to the presence of hexagonal CaSb
2O
6 crystals, firing time and temperature, as well as lead and calcium contents in the batch, are fundamental to determine whether the hexagonal or the rhombic phase of Ca-antimonate will be favored [
52]. The occurrence Ca-antimonate in its hexagonal phase, as observed by Raman spectroscopy, was thus considered indicative of short firing times and high temperature (likely above 1100 °C) and was in accordance with the low lead contents (0.3 wt%) detected by the pXRF analysis [
65].
The variability of Cu (0.05–0.30 wt%), Fe (0.42–1.49 wt%), Pb (0.07–3.47 wt%) and Mn (0.11–0.94 wt%) was consistent with recycling activities and/or the use of mixed cullet, although a contamination due to the cobalt ore cannot be discounted [
66]. The correlation between Co and other elements—Ni and Cu, as well as As and Pb—could be considered a reliable indicator for provenance studies of cobalt ores exploited during the first millennium BCE, since it is highly indicative of a contamination from the cobalt ore via accessory phases [
15]. Nevertheless, the significant influence of processing activities on the variability of the chemical signature of Co-based chromophores must also be considered.
The positive trend observed in the Ni vs. Co biplot (
Figure S7) is compatible with the use of primary cobalt ores, likely derived from arsenide-rich polymetallic deposits—skutterudite or safflorite—which introduced trace elements like Ni, As and Fe as accessory phases. Nevertheless, additional trace elements and isotopic analyses are mandatory to support provenance studies.
Turquoise (TU), aquamarine (AQ) and some transparent blue tesserae (DBtr, LBC) were colored with copper in its oxidized form (Cu
2+). In TU and AQ glasses, the correlation between Zn and Sn with Cu suggested the use of metalworking scraps (bronze and/or brass) as a source for copper [
67].
Two AQ tesserae from US 1095 showed high amounts of Sn (0.12–0.37 wt%) and Pb (above 5.5 wt%), suggesting the exploitation of different sources for copper (such as a leaded bronze) or the use of different opacifying materials (e.g., lead–tin opaque yellow glass that could be responsible of the greenish-blue hue of these two samples) [
68].
LBC and DBtr constituted a third compositional group characterized by a combination of copper and Mn, introduced as a decoloring agent. LBC and DBtr tesserae also showed a weaker correlation between Cu, Sn, Zn and/or Pb—here likely related to contaminations due to recycling—suggesting a different source for copper (
Figure S8). The lower association with alloying elements could indicate the use of
Cu-minerals, which were commonly employed in Roman glass production to obtain transparent or light blue colors under oxidizing conditions
6.4. Red Tesserae
Even though all the red glass tesserae showed the spectroscopic features of metallic copper (Cu0), clear technological distinctions based on their chemical composition, particularly in terms of lead, zinc, iron and tin, can be stressed. Two main technological groups were identified—a high-Pb and a low-Pb series—each associated with different raw materials.
The
high-Pb series was characterized by significant Fe (mean Fe = 1.36 wt%) and Sn (mean Sn = 0.27%), along with moderate Zn (avg. 0.36 wt%). A positive correlation between Zn and Cu (Zn/Cu < 0.4) was also observed in these tesserae (
Figure S9), suggesting a contamination due to the addition of brass scale to the batch. Micro-Raman analysis of few random small crystals dispersed within the glassy matrix identified the presence of lead stannate (
Figure 3), represented by the very strong band at 138 cm
−1 assigned to the Pb-O stretching mode [
48].
Tin and lead are considered two key components in the production of red glasses. While the presence of Sn could be mainly related to the source for copper, the deliberate addition of lead to promote cuprite (Cu
2O) has been discussed elsewhere [
69]. In the present study, the heterogeneous composition of the high-lead series was considered unequivocally related to recycling activities. Nevertheless, it was not possible to define whether lead stannate was added to the batch or it formed following an in situ precipitation by the diffusion and the combination of the elements present in the raw material mixture or in the melt [
70]. The presence of lead stannate could, however, indicate the recourse to a frit containing Cu, rather than metallurgical scraps, but further investigations are needed.
Within the high-Pb series, an exception was represented by sample 5010_R3, where zinc was absent and the value of the ratio Cu/Sn = 5 suggested the use of bronze scraps. The high lead concentration (14.1 wt%) could indicate the use of a leaded bronze (Cu-Sn + Pb binary alloy) [
71].
The low-Pb red tesserae consisted of samples characterized by high Fe (up to 3.04 wt%) and Cu (mean Cu = 1.40 wt%), together with moderate K (0.79–1.36 wt%) contents.
The negligible amounts of Zn and Sn observed for these samples (
Figure S9) suggested a different source for copper, such as slag, litharge, or secondary metalworking waste, while the higher amounts of Fe and K provided crucial technological evidence, such as the deliberate addition of carbon or fuel ashes to the batch to promote reducing conditions together with an excess of iron [
69].
The chemical and spectroscopic features of all the red tesserae from Aiano were in accordance with previous studies on Roman dull red-brown mosaic tesserae colored by metallic copper and obtained via the deliberate addition of tin or iron as reducing agents [
49]. According to the classification proposed by Freestone et al. [
69], all the opaque red tesserae from Aiano were represented by the low-Cu/low-Pb type. Although the variability in lead could be explained in terms of different areas and/or periods of production, the effects of recycling activities must be considered, too.
6.5. Yellow and Green Tesserae
The chemical investigation of yellow and green tesserae revealed a high heterogeneity, both in terms of raw materials and technological processes. To better assess this variability, a dedicated PCA was performed on a subset of variables related to coloring and opacifying agents (Cu, Pb, Sn, Sb, Sr, Rb, Ca, K). The first four principal components accounted for 97.69% of the total variance, highlighting distinct compositional groups (
Table S7).
PC1 (67.75% of the total variance) primarily distinguished samples characterized by the use of Sb-and Sn-based opacifying agents, effectively acting as a technological axis. PC2 (16.42%) captured additional variability related to Cu contents. The PC2/PC1 biplot (
Figure 12) was particularly effective in separating four distinct subgroups among the yellow tesserae (Clusters 1, 3, 4 and 5).
Cluster 1 (green ellipse) included the high-Sb yellow tesserae. The cluster was strongly associated with Ca, K, Sb and Sr, suggesting the use of carbonate-rich continental sands—possibly with the addition of seashells. Raman and FORS analyses confirmed the presence of lead antimonate as the main opacifier.
Many previous studies on Roman glass agreed on the diffused use to add pre-synthetized Pb-antimonate crystals to the molten glass [
10,
72,
73,
74]. Nevertheless, it was difficult to confirm whether iron was deliberately added to the
anime mixture to stabilize the lead antimonate and obtain a stronger yellow, or introduced as contaminant from iron-rich minerals [
72]. The occasional presence of Sn and variable Fe contents could be indeed associated to incidental contamination through raw mineral gangue—such as antimony-rich litharge produced during the smelting and cupellation of galena ores—or from recycling [
67].
Clusters 3, 4 and 5 (blue, grey and red ellipses, respectively) included high-Sn yellow glasses, showing a strong Sn–Pb correlation, consistent with the use of lead stannate as opacifying agent, as confirmed by spectroscopic data. The positive correlation with Rb suggested the use of feldspathic sands.
Elevated levels of Cu, K, Mn, Fe and Ti observed in clusters 3 and 4 likely reflected a contamination during recycling activities. Pb/Sn ratio (~1) was typical of late antique glass production, where an excess Pb was deliberately added to improve the fluidity of the melt in order to facilitate a rapid mixing of glass components during coloring [
72]. In this context, an excess of Pb could also promote the formation of cassiterite, which is consistent with the results from the Raman investigation on the tesserae from this series.
Cluster 2 (violet ellipse) included the whole green tesserae assemblage. The cluster is associated with Cu and Sb, suggesting the use of copper-based coloring in combination with lead antimonate. Correlations with Ca and Sr also indicated the use of carbonate-rich raw materials.
A detailed investigation of compositional ratios—particularly between Pb, Sb, Sn, Fe and Mn—allowed the identification of four technological subgroups within the green glass tesserae (G1–G4), as previously discussed in the results section. The interaction of Cu with other elements—like iron, manganese and antimony—played a relevant role in the redox state of the coloring elements to the determination of the final color [
50,
75].
Groups G1 and G2 included emerald green tesserae with low Pb/Sb ratios and non-negligible Fe and Sn contents. In these tesserae, the Pb contents were considered too low to support the formation of discrete Pb-antimonate phases [
76], while elevated levels of Fe and Sn (
Figure S10, left) indicated the use of bronze scraps as a source of copper, iron and tin [
77,
78]. The positive correlation between Pb and Sb observed in G2 may also reflect the use of recycled Sb-rich cullet [
5]. The overall chemical composition of samples from groups G1 and G2 was also in agreement with Roman emerald green glasses [
79].
Group
G3 showed a high Pb/Sb ratio consistent with the presence of Pb-antimoniates, as further confirmed by Raman spectroscopy (
Figure S10, right). In these samples, copper no longer represented the primary coloring agent and the greenish hue was more likely attributable to an Fe
2+/Fe
3+ equilibrium, as also indicated by reflectance spectra [
50]. Lower Cu, Pb and Sb levels compared to copper-green and lead-antimonate yellow tesserae suggested a dilution effect due to mixing different glass types, rather than deliberate addition of copper to a yellow matrix [
80].
Group G4 consisted of green glasses where a significant change in raw materials was observed. Strong Pb–Sn correlation and Raman evidence confirmed the use of lead stannate as an opacifier, while the green color was mainly due to copper in the oxidized form. The overall composition of these glasses agrees with late antique tradition, which was characterized by the use of copper in a Sn-opacified matrix [
52,
81].
In conclusion, the distinction between Sb- and Sn-opacified glasses observed within the yellow and green tesserae is in line with the broader technological evolution described by Verità et al. [
72]. It is worth noting that tin- and antimony-based pigments were not confined to specific chronological phases or geographic regions, but often employed simultaneously, even within the same production centers. As such, their presence alone cannot be used as a chronological or geographic marker.
Moreover, the presence of trace elements observed in several subgroups—such as Fe, and Sn, as well as Cu (where not used to impart a green hue)—points to widespread recycling, as also reported by Basso et al. [
10], who stressed a high compositional complexity introduced by the unintentional mixing of older glass materials.
The Raman and FORS analyses further support the identification of both Pb
2Sb
2O
7 and PbSnO
3 pigments, in agreement with Molina et al. [
73], who showed that both compounds could be produced ex situ or in situ depending on the technical process adopted.
6.6. Deeply Colored Tesserae
Deeply colored tesserae—including black (BK), dark green (DG), dark amber/brown (BR) and dark purple (DP)—represent a distinct compositional and technological group within the assemblage. These tesserae were characterized by a considerable chemical heterogeneity, suggesting the use of multiple raw materials and recycled cullet from different periods and provenances.
The results of the chemical and spectroscopic investigation suggested the intense coloration to be mainly responsible for the low reflectance observed for these tesserae obtained by the controlled addition of transition metals and the manipulation of the furnace atmosphere, rather than through the addition of crystalline opacifiers [
82].
The production of glasses with such chromatic features during Roman times was discontinuous and strongly related to regional consumption [
36]. A first distinction was based on the coloring agents employed, with Fe and Mn being the most common chromophores used to achieve a deep coloration. Additionally, a few examples of Co/Cu dark blue hue and dark brown glasses (Fe-S complex) were also documented [
83].
Although the deeply colored tesserae of the Aiano assemblage could be clustered as high-Fe and high-Mn glasses, in agreement with Roman tradition, the presence of impurities and multiple chromophores strongly suggested a mix of cullet of different color, period and/or provenance to obtain the final hue.
The high-Fe series was represented by Fe and Co, as the main coloring agents, together with Ti and Rb that were likely related to the glassmaking sand. Despite the non- negligible amounts of titanium, the lack of a correlation between Fe and Ti indicated iron to have been intentionally added as a colorant, while Ti was introduced via the raw materials [
83]. The relatively low content of K indicated the use of mineral soda as a flux. The green hue was strictly related to the Fe
2+/Fe
3+ ratio, while Co (up to 250 ppm) was considered the main cause of color deepening [
50]. Within the high-Fe series, an additional group was represented by two samples from US 1095 characterized by high concentrations of K, Ca and Ti (1095_BRtr3 and 1095_DG7), related to glassmaking raw materials, as well as Fe and Co that were responsible for the dark green color. The low concentrations of Mn, Sb and Pb indicated that the glass had not been subjected to recycling. The chemical features of these samples could indicate a different production area/period [
83].
High-Fe dark green glass manufacture during Roman times could be discriminated according to differences in raw material supplies over centuries. High-Fe soda-lime green glasses were commonly related to Syro-Levantine production (dated between the mid- 2nd century and the mid-4th century) and to late Roman HIMT tradition originating from the eastern Mediterranean area. Pure iron in the form of magnetite, or hammer scale, was commonly intentionally added to the batch [
84]. Naturally colored plant-ash green glasses were also documented [
83,
85] and found to be related to earlier and later periods and/or to areas that were not under Roman domination.
Although further analyses are necessary to better understand the provenance of DG glasses from Aiano, the intentional addition of Fe and the soda-lime nature of the base glass might be considered good indicators for a Syro-Levantine provenance of the tesserae belonging to the DG1 group. Nevertheless, if the low concentration of Fe and the presence of recycling indicators are considered, the reuse of deeply colored cullet should also be considered.
The
high-Mn series was represented by DP, B and DA tesserae. Dark purple tesserae were defined by Sr and Mn, together with Ni and Sb. Recycling indicators (Co, Cu, Sb, Pb) were also present. Although manganese was considered as the main coloring agent, the broad absorption band observed in the reflectance could suggest that the role of other chromophores in the definition of the final hue was also evident. In the visible region the FORS spectra showed intense absorption bands of Mn
3+ around 490–510 nm and 670–710 nm [
86] and those of the [Fe
3+O
3S
2−]
5− complex around 420 nm (shoulder at 440 nm) and 474 nm (shoulder at 483 nm) [
87]. The contribution of the Co
2+ in the 540–640 nm region should be also considered, as suggested by the positive Co/Ni correlation observed for these samples, likely indicating the use of a Co-ore as a source for cobalt [
15,
66]. An average concentration of Sr of 900 ppm was above the common strontium levels detected in the majority of the other samples from the Aiano assemblage, but the absence of a close correlation between strontium and manganese was considered an indication of the exploitation of a pure Mn-ore or mineral (e.g., pyrolusite, MnO
2) [
83] as a source for manganese, instead of an Sr-rich one as observed in some previous studies [
84,
88,
89]. The use of a different source for lime, or silica, was thus considered responsible for the anomaly in Sr, as also suggested by the slight positive Sr/Ca correlation.
The black tesserae group was in contrast characterized by Cu, Sn and Pb. The excess of manganese and the high Mn/Fe ratio (average 1.8) were responsible for the purple hue, while the precipitation of Cu
0 promoted a dullish red color that contributed to the dark brown/black opaque color of the tesserae [
88]. A good Sn + Pb/Cu correlation suggested tin and lead to have been introduced together with copper and indicated a leaded bronze as a possible source [
71]. Tin and lead had a significant role in the precipitation of the copper phase, as well in the size of the crystals [
90]. Antimony was here detected in very low concentrations (mainly below 100 ppm), suggesting a recycling of high-Mn glasses likely mixed with opaque Cu-red glass.
The FORS spectra (
Figure 7a), although showing a weak absorption at about 440nm, attributable to Fe
3+, is mostly characterized by a deep band at 470–490nm due to high concentration of Mn
3+. The two weak bands that appear at about 720 and 860nm could be ascribable to the presence of MnO
2 [
91].
A further high-Mn sub-group was represented by dark amber glasses from US 1095 and was chemically defined by Mn and Sb, likely related to the mixed Mn/Sb nature of the base glass. Nevertheless, the lower average amount of Mn (1 wt%) and the lower Mn/Fe ratio (mean value 1.3) was not adequate to generate a purple color. The FORS spectra showed the typical band of the [Fe
3+O
3S
2−]
5− complex, the dark amber color thus achieved in presence of iron oxides, sulfur (or sulfides) and a reducing atmosphere [
87]. The average iron content (0.8 wt%) and the positive correlation between Fe and Ti could indicate the iron to be related to the original silica source.
The chemical features of the deeply colored tesserae from the villa of Aiano reflect the evolution of glassmaking technologies during Roman times. According to Van Der Linden et al. [
82] the 2nd century CE could be established as a clear threshold between the so-called period A and B. Prior to the 2nd century CE, two main types were used—dark purple Mn-glass of Syro-Levantine origin and dark green glass derived from Fe-rich sands and halophytic plant ashes. After the 2nd century, the naturally colored glass disappeared and was replaced by Levantine base glass obtained with mineral soda and colored with a high amount of iron. During the 4th century, a decline in the use of the more refined raw glass in favor of less pure and cheaper HIMT glass was observed [
16]. Some rare cobalt- or copper-colored blues, and Fe-S derived browns, were also detected.
The chemical features of the deeply colored tesserae align with Group B as defined by Van der Linden [
82], particularly in Fe/Ti ratios that suggest an eastern Mediterranean origin—except for certain dark green tesserae, which show elevated Fe/Ti values indicative of later production using low-Ti iron sources. By contrast, green glasses based on plant ash and characterized by high Mn/Fe and Fe/Ti ratios resemble Sasanian HMG types predating the 2nd century CE [
85,
92].
6.7. White Tesserae
The presence of large amounts of Ca and Sb suggests the use of calcium antimonate as opacifier.
In contrast with opacified blue glasses, where hexagonal Ca-antimonate was the only phase detected by Raman analysis, the presence of both the hexagonal and rhombic phases in the white samples has important technological implications. The presence of both phases, with a prevalence of the hexagonal one, is indicative of longer firing times at higher temperatures. Non-negligible amounts of Pb could be also responsible of the formation of Ca
2Sb
2O
7, as already observed in previous studies on Roman and modern opaque glass with high lead contents [
52,
74].
In the high-Sn series, the lead and tin contents were consistent with the use of Sn-based opacifiers. Tin started to replace antimony during the 4th century, with the first examples documented in the eastern Mediterranean through northern Europe. From the 5th century onwards, the use of tin-based opacifiers widely diffused in mosaic tesserae manufacture in Roman Spain [
93] and in Byzantine contexts in Israel and Greece [
94], as well as in Italy.
6.8. Archaeological Implications
The significant chemical variability observed across the colored tesserae assemblage from Aiano provides important insight into the dynamics of supply and production during late antiquity. The assemblage includes a wide range of chromatic and compositional types, consistent with the broader dynamics of Roman glass production, distribution and consumption across the Mediterranean [
5].
The coexistence of glass types based on distinct raw materials—evidenced by the variability in key elements such as Sr, Rb, K and Ca—suggests a complex system of supplying that involved both primary production centers and extensive recycling practices. The identification of distinct opacifying and coloring technologies, as well as decoloring agents, suggests a multiplicity of sources and overlapping regional traditions.
These observations are consistent with findings from other late Roman contexts [
9,
37,
95,
96,
97,
98]—where similar chemical heterogeneity has been linked to reuse and recycling practices—as well as circulation of glass all over the Roman Empire. In this framework, the Aiano assemblage therefore resulted in accordance with the adaptive strategies of glass supplying that characterized late Roman mosaic production.
Glassmaking in the Roman world was subject to significant changes in raw materials, production centers, and recycling techniques [
5,
7,
99]. These variations can be effectively tracked through specific chemical signatures, offering valuable information for the chronological and technological contextualization of archaeological glass assemblages.
The comprehensive investigation of the glass tesserae from the Aiano site has revealed a remarkable chemical and technological diversity, reflecting the complex dynamics of glass production, coloring practices, and raw material procurement in the Roman and late antique periods. The combination of spectroscopic techniques and multivariate statistical analyses allowed for the identification of distinct technological traditions, including both early and late Roman glassmaking recipes.
The observed variability in opacifying and coloring agents, as well as in trace elements such as Sr and Rb, supports the hypothesis of multiple production centers and recycling practices. The widespread use of low-potassium soda-lime glasses (<1.5 wt% K) suggests reliance on natron as a fluxing agent, with higher potassium concentrations mostly linked to recycling episodes.
Exceptions are represented by two dark green tesserae with elevated K and Ca levels, possibly indicating the use of plant ash fluxes—compositions not typically associated with standard Roman glass production [
5]. Nonetheless, elevated Mg and K levels (>1.5 wt%) have been recorded in late Roman and Byzantine colored glasses, often reflecting the activity of specialized workshops. In emerald green glasses, in particular, the use of plant ash is known to intensify the green hue and is considered a technological marker [
82,
100,
101].
Colorless tesserae in the assemblage were made from different base glasses, including Levantine Mn glass (1st–3rd century CE), Egyptian Sb glass and mixed Sb/Mn glasses, the latter appearing in the 2nd century CE and becoming widespread by the 4th century CE (coherent with the expansion of the villa during the late 4th to mid-5th centuries) [
4].
Additional chronological insights emerge from the analysis of colorants and opacifiers. The colored glass tesserae reflect a diversity of recipes and technologies, closely linked to different chronological and production contexts. These patterns, combined with evidence of recycling and the coexistence of multiple glass recipes, serve as a key indicator for technical practices and glass circulation dynamics in the Roman period and support a gradual chronological transition from early to late Roman glassmaking practices within the site’s occupational sequence.
This also emerges from the peculiar distribution of antimony and tin-opacified tesserae within the site (
Figure 13). Antimony-based opacifiers (e.g., Pb
2Sb
2O
7) were predominant in tesserae from room A (the villa’s earlier phase), whereas Sn-based opacifiers (e.g., PbSnO
3 and cassiterite) were more frequent in room S (later construction phase). While tin- and antimony-based pigments often coexisted, and cannot be used as precise chronological markers, their relative distribution supports a broad temporal framework, as also indicated by Verità et al. [
72], who observed a prevalent use of antimony in earlier Roman Imperial production and a gradual introduction of tin-based compounds from the 4th century CE onwards, especially in eastern Mediterranean contexts.
7. Conclusions
The large number of mosaic tesserae analyzed in this study revealed an extensive use of recycled glass, as indicated by the lack of compositional homogeneity, both concerning the same color group or stratigraphic unit. This inhomogeneity in the coloring techniques can be ascribed to a supply of raw materials from multiple sources.
The results confirmed the potentialities of multivariate analysis in resolving compositional signatures related to raw material procurement, technological practices and recycling strategies within the Aiano assemblage.
The chemical and technological variability observed among the tesserae from Aiano, provides valuable chronological insights. The widespread use of natron-based soda-lime glass with low potassium content is consistent with standard Roman glass production between the 1st and 4th centuries CE. The presence of mixed Sb/Mn-decolorized glass and the progressive replacement of antimony-based opacifiers with tin-based ones reflect a shift occurring around the 4th century CE. Similarly, the detection of HIMT-type deeply colored glasses, along with the introduction of Sn-opacified matrices, suggests a late Roman to early Byzantine technological tradition.
The presence of different opacifiers again points out a different place and, perhaps, a different period of production. Indeed, antimony was largely used by Romans as an opacifier, as with calcium or lead antimonate, until the 2nd–4th century CE, but it was then largely replaced by tin salts such as tin oxide or lead stannate. It is worth nothing that Sb- and Sn-opacified glasses were found in rooms belonging to different phases of the villa, respectively in room A, among the oldest in the villa (late 3rd—early 4th century AD), and room S, among the more recent (at least the 5th century). Following the dismantling of the mosaics from different areas of the villa, the storage of the tesserae in adjoining rooms can be assumed, thus explaining the compositional differences observed so far. These data agree with the complex history of the villa, and the high technological heterogeneity that is observed is in accordance with the procurement of materials from multiple sources, as was customary in the ancient world.
Finally, the data obtained so far derive from the application of a totally non-invasive protocol. The results obtained allowed us to select a reduced number of samples for a new step in which they will be subjected to invasive measurements to further deepen the knowledge of these finds, mainly from a quantitative point of view, and to try to confirm the results and the hypothesis here reported.


 ,
, 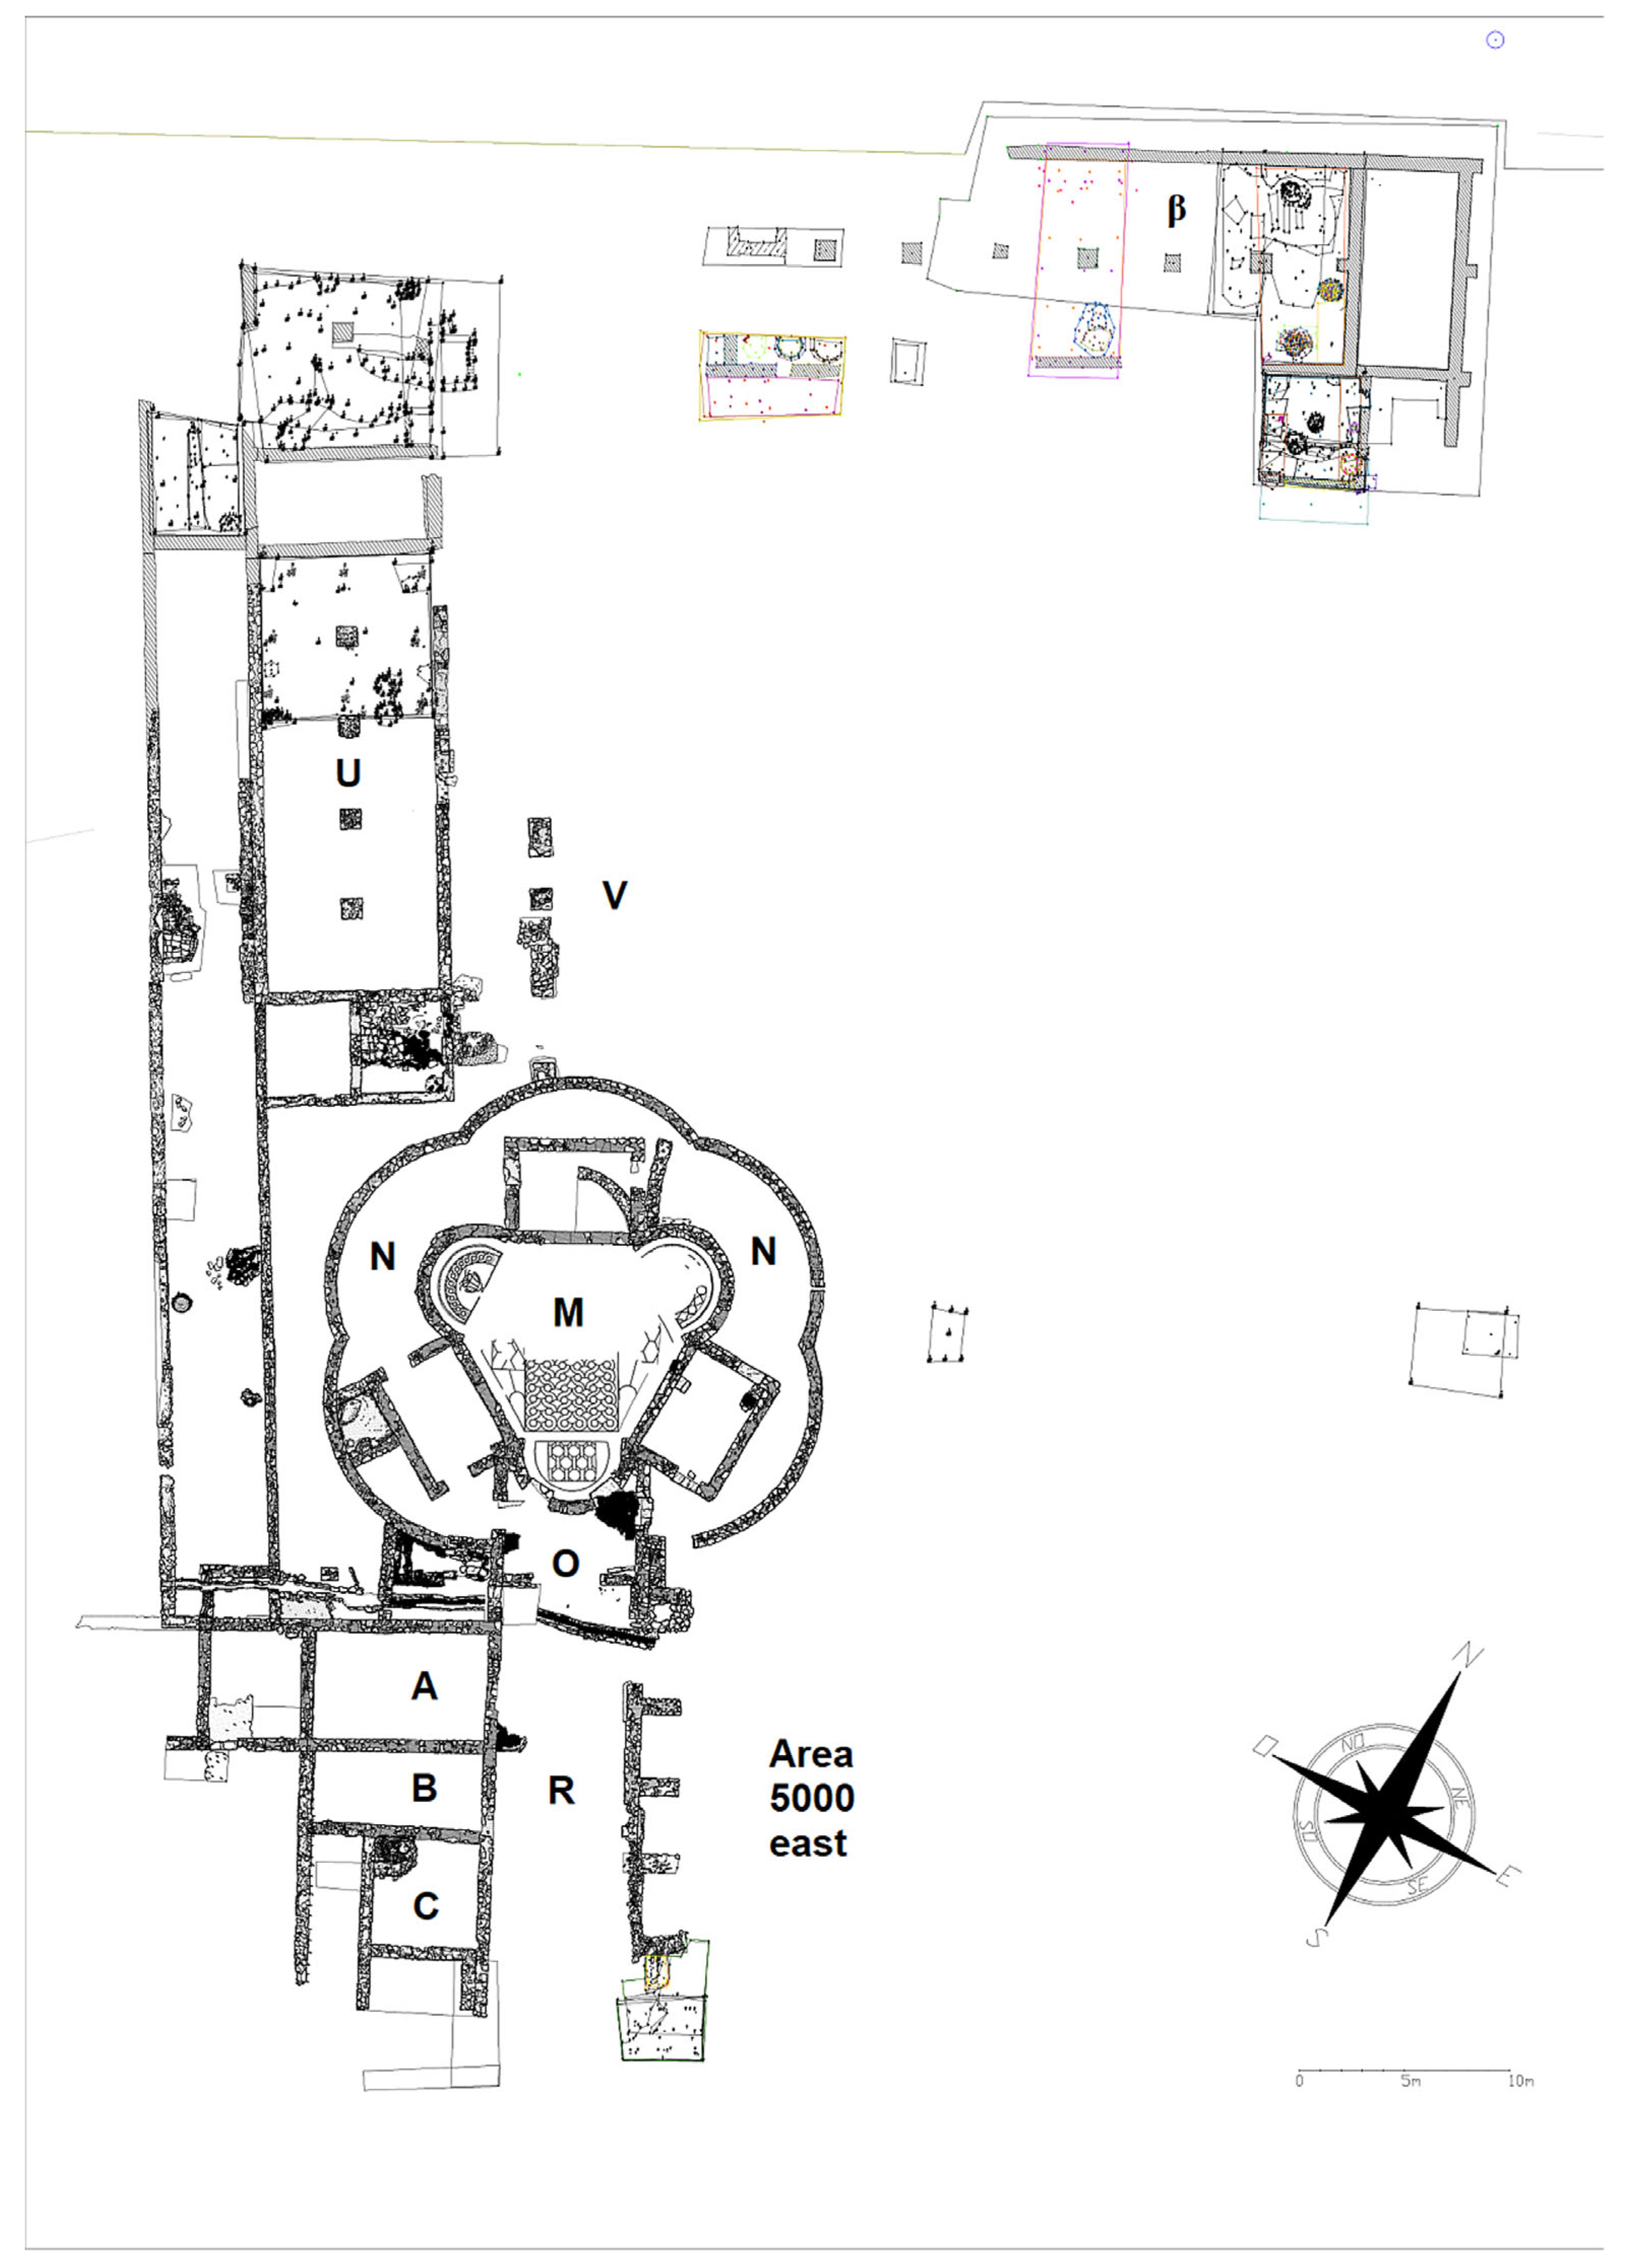
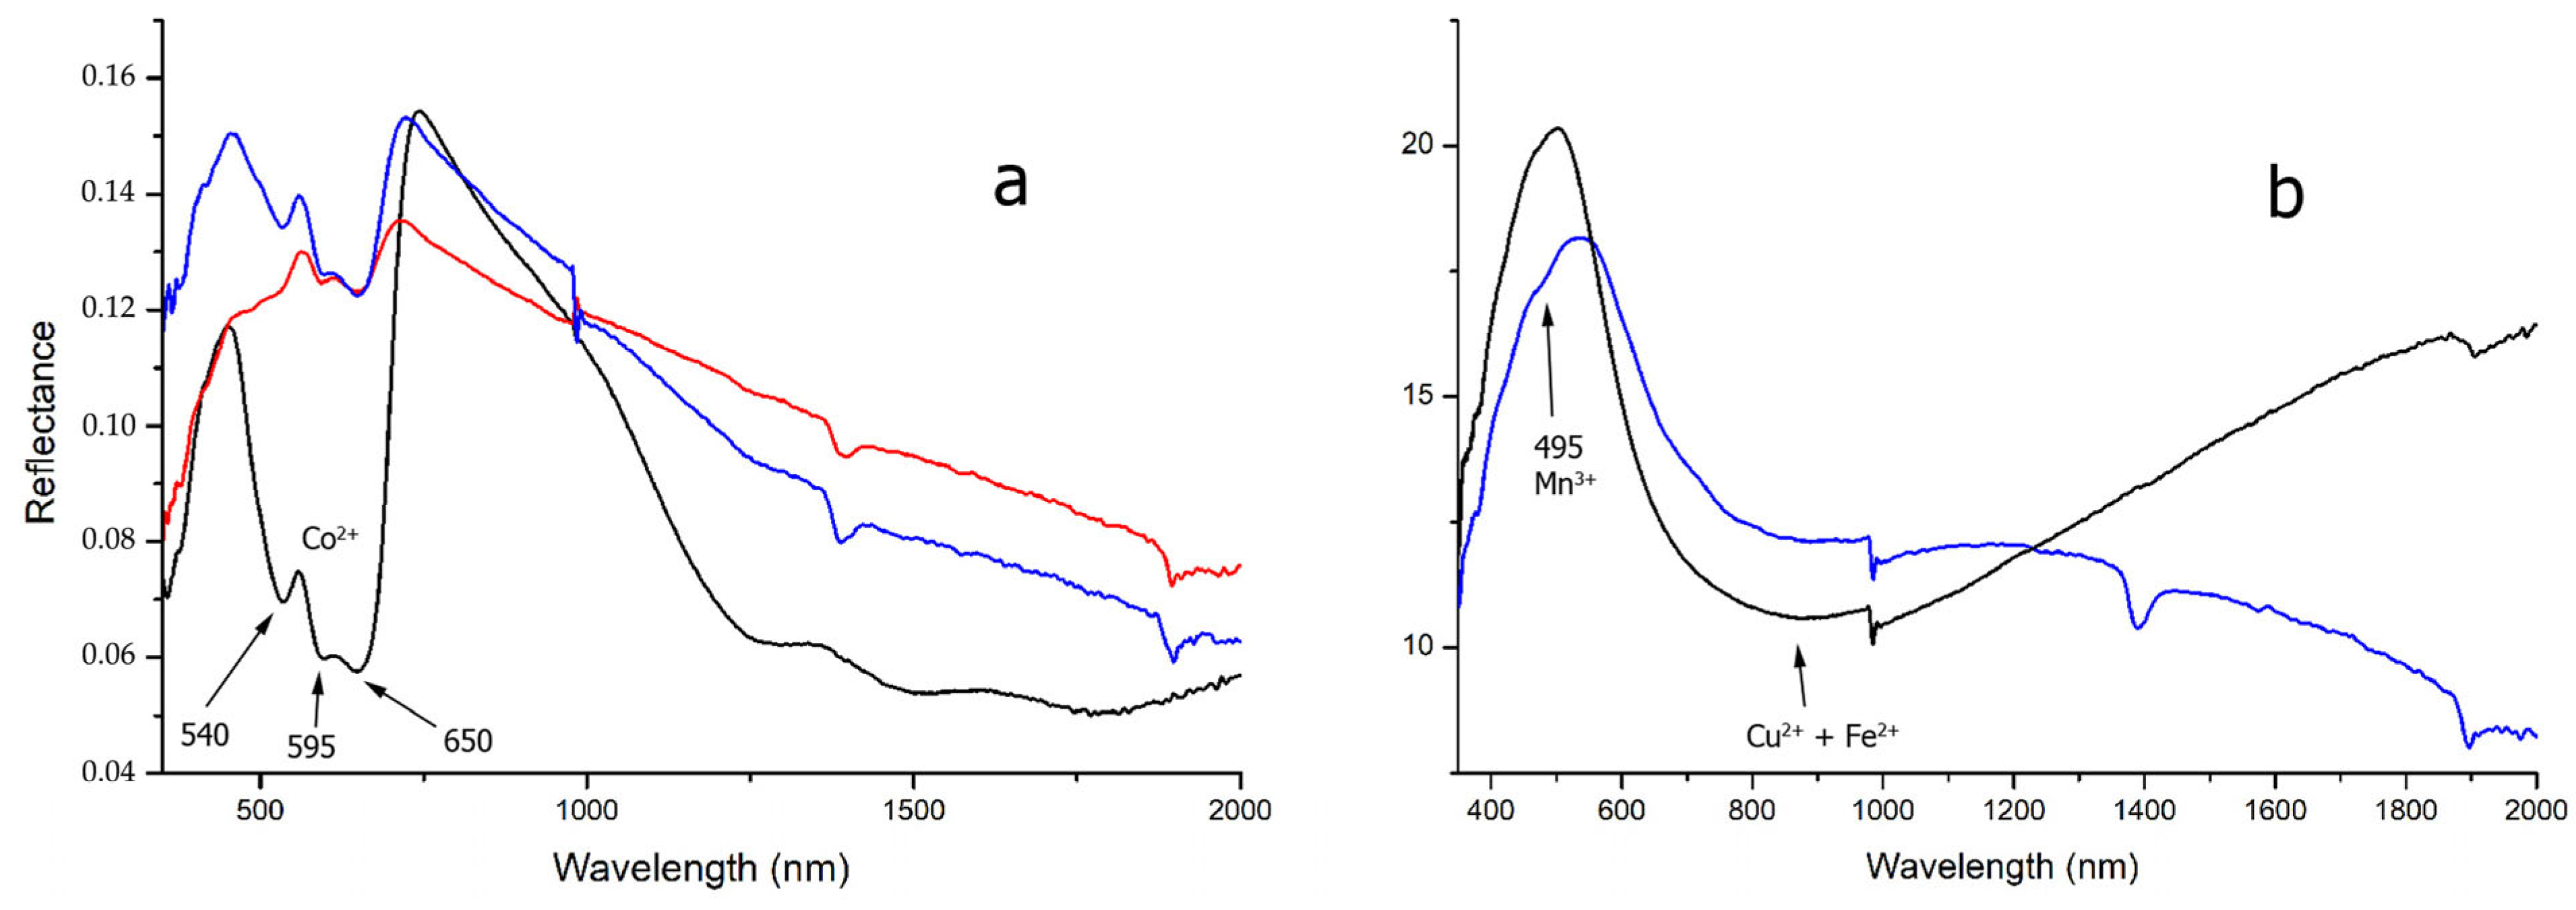
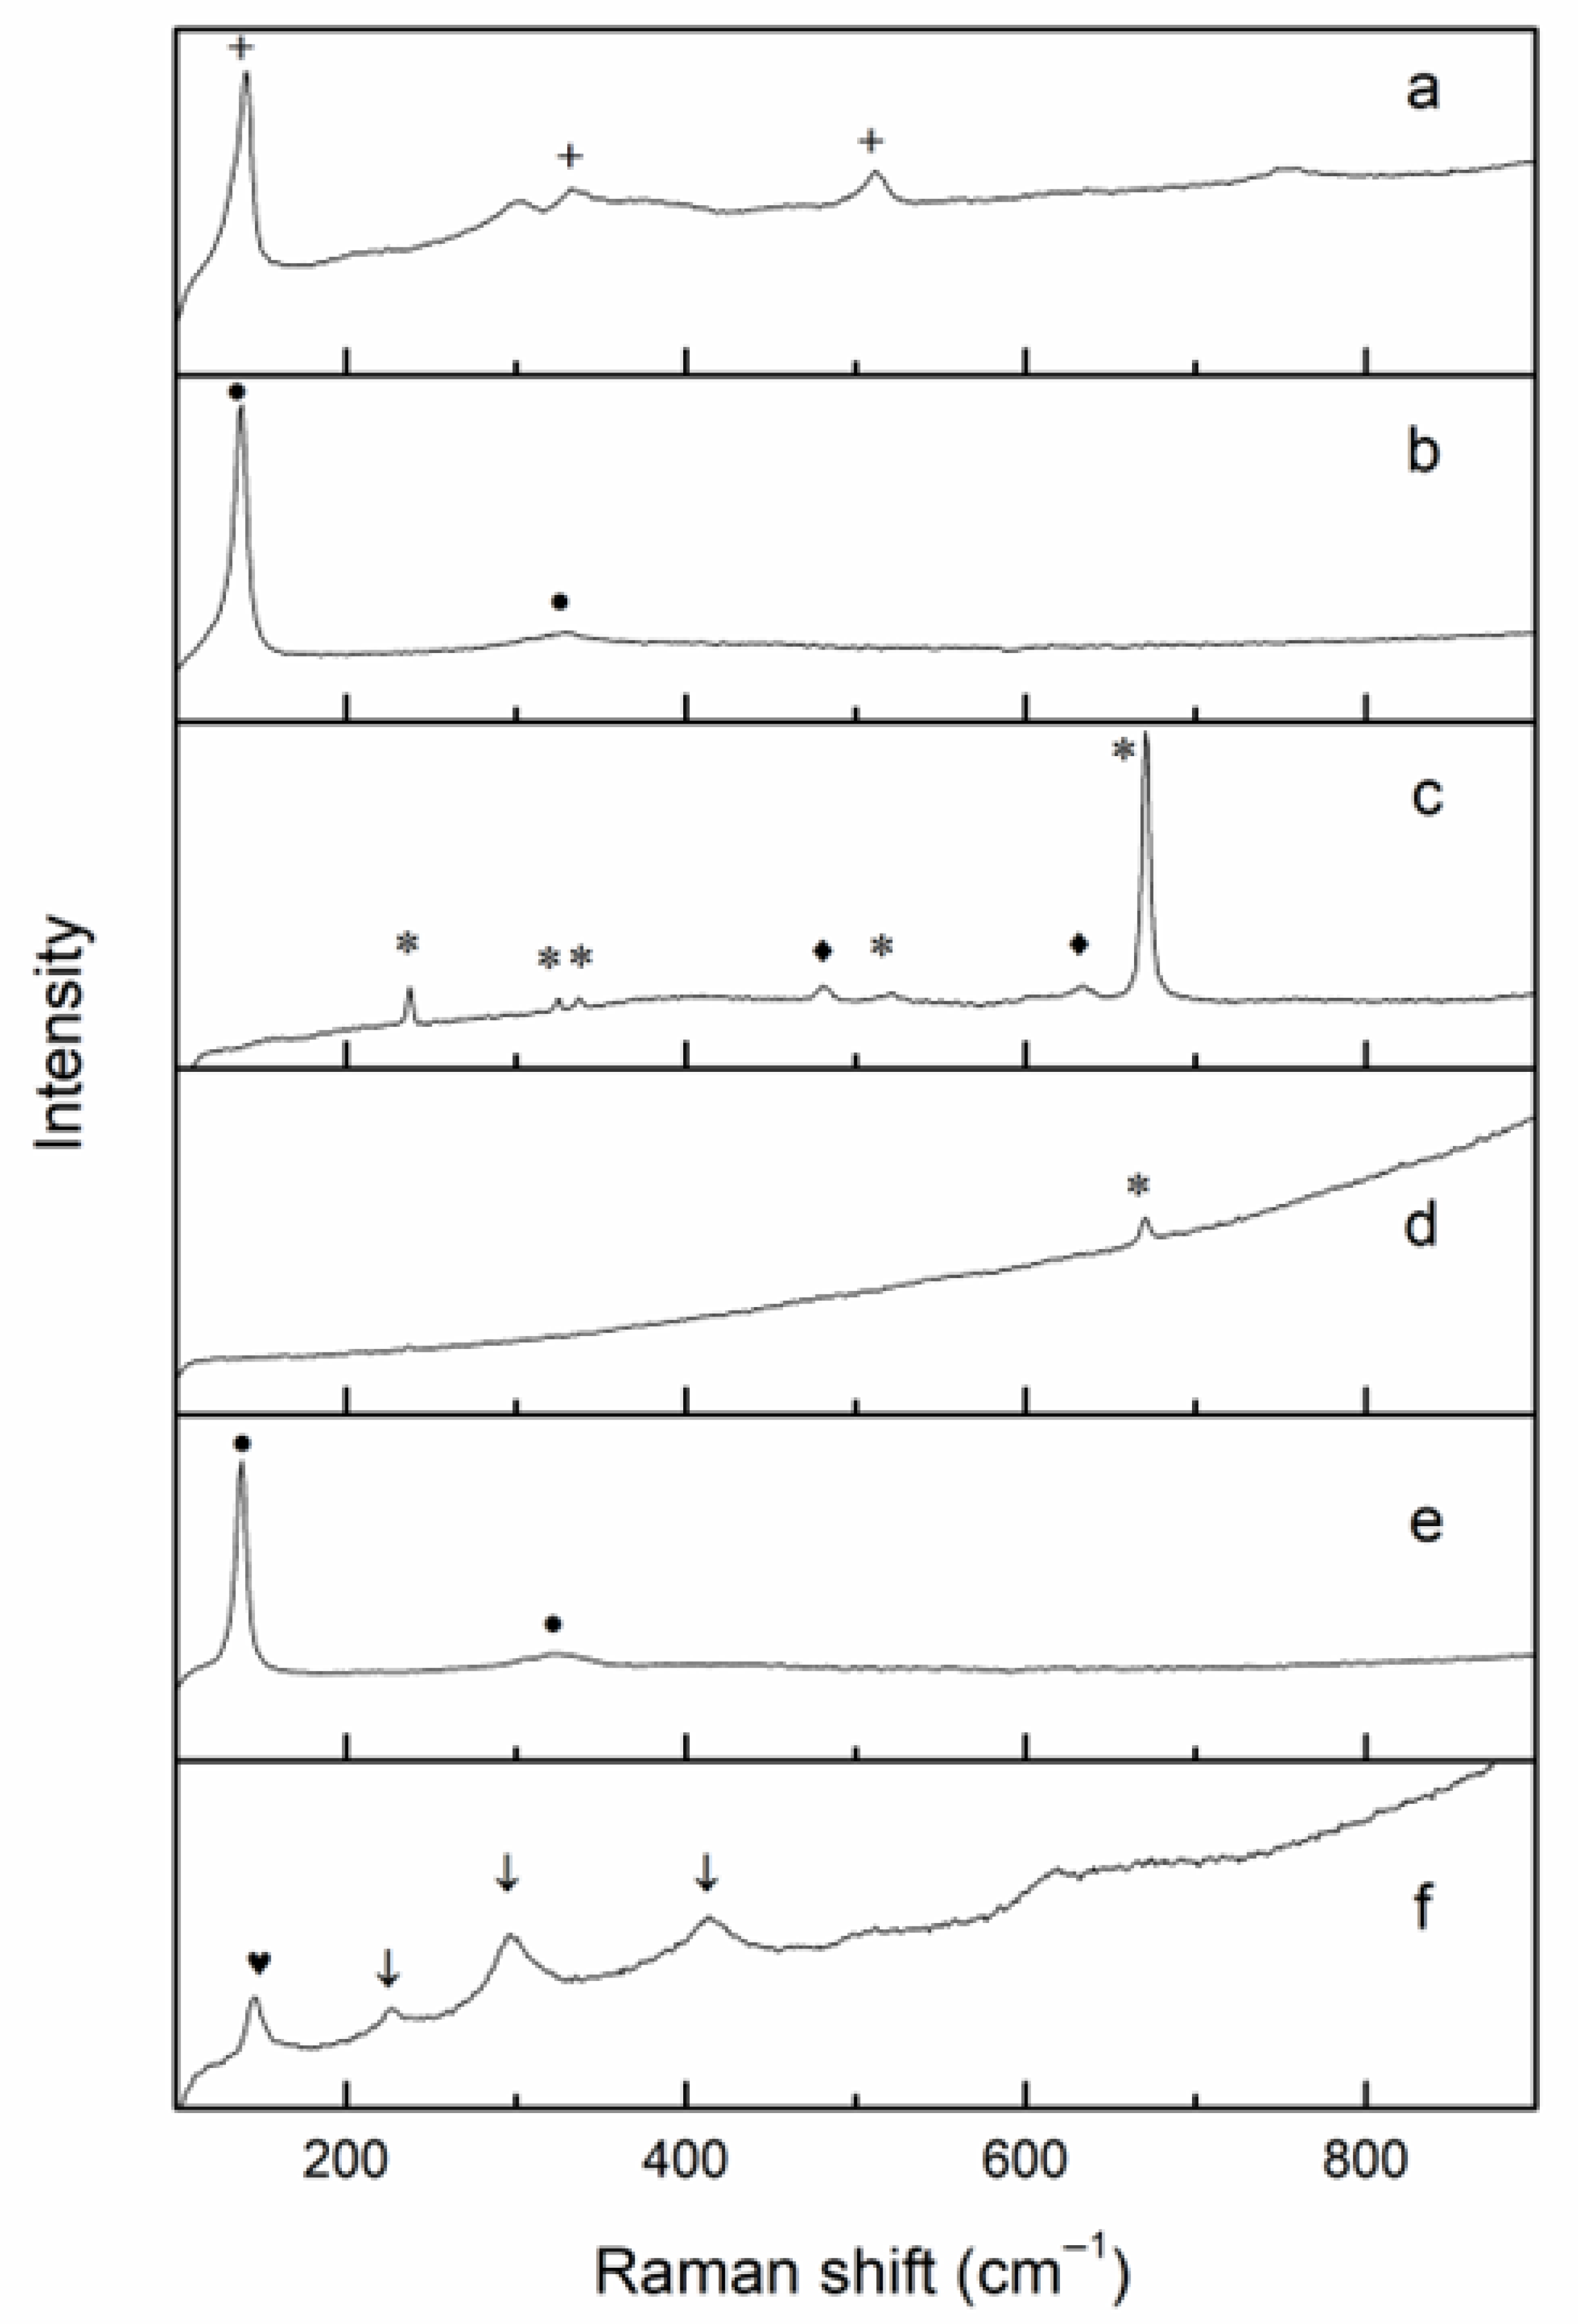
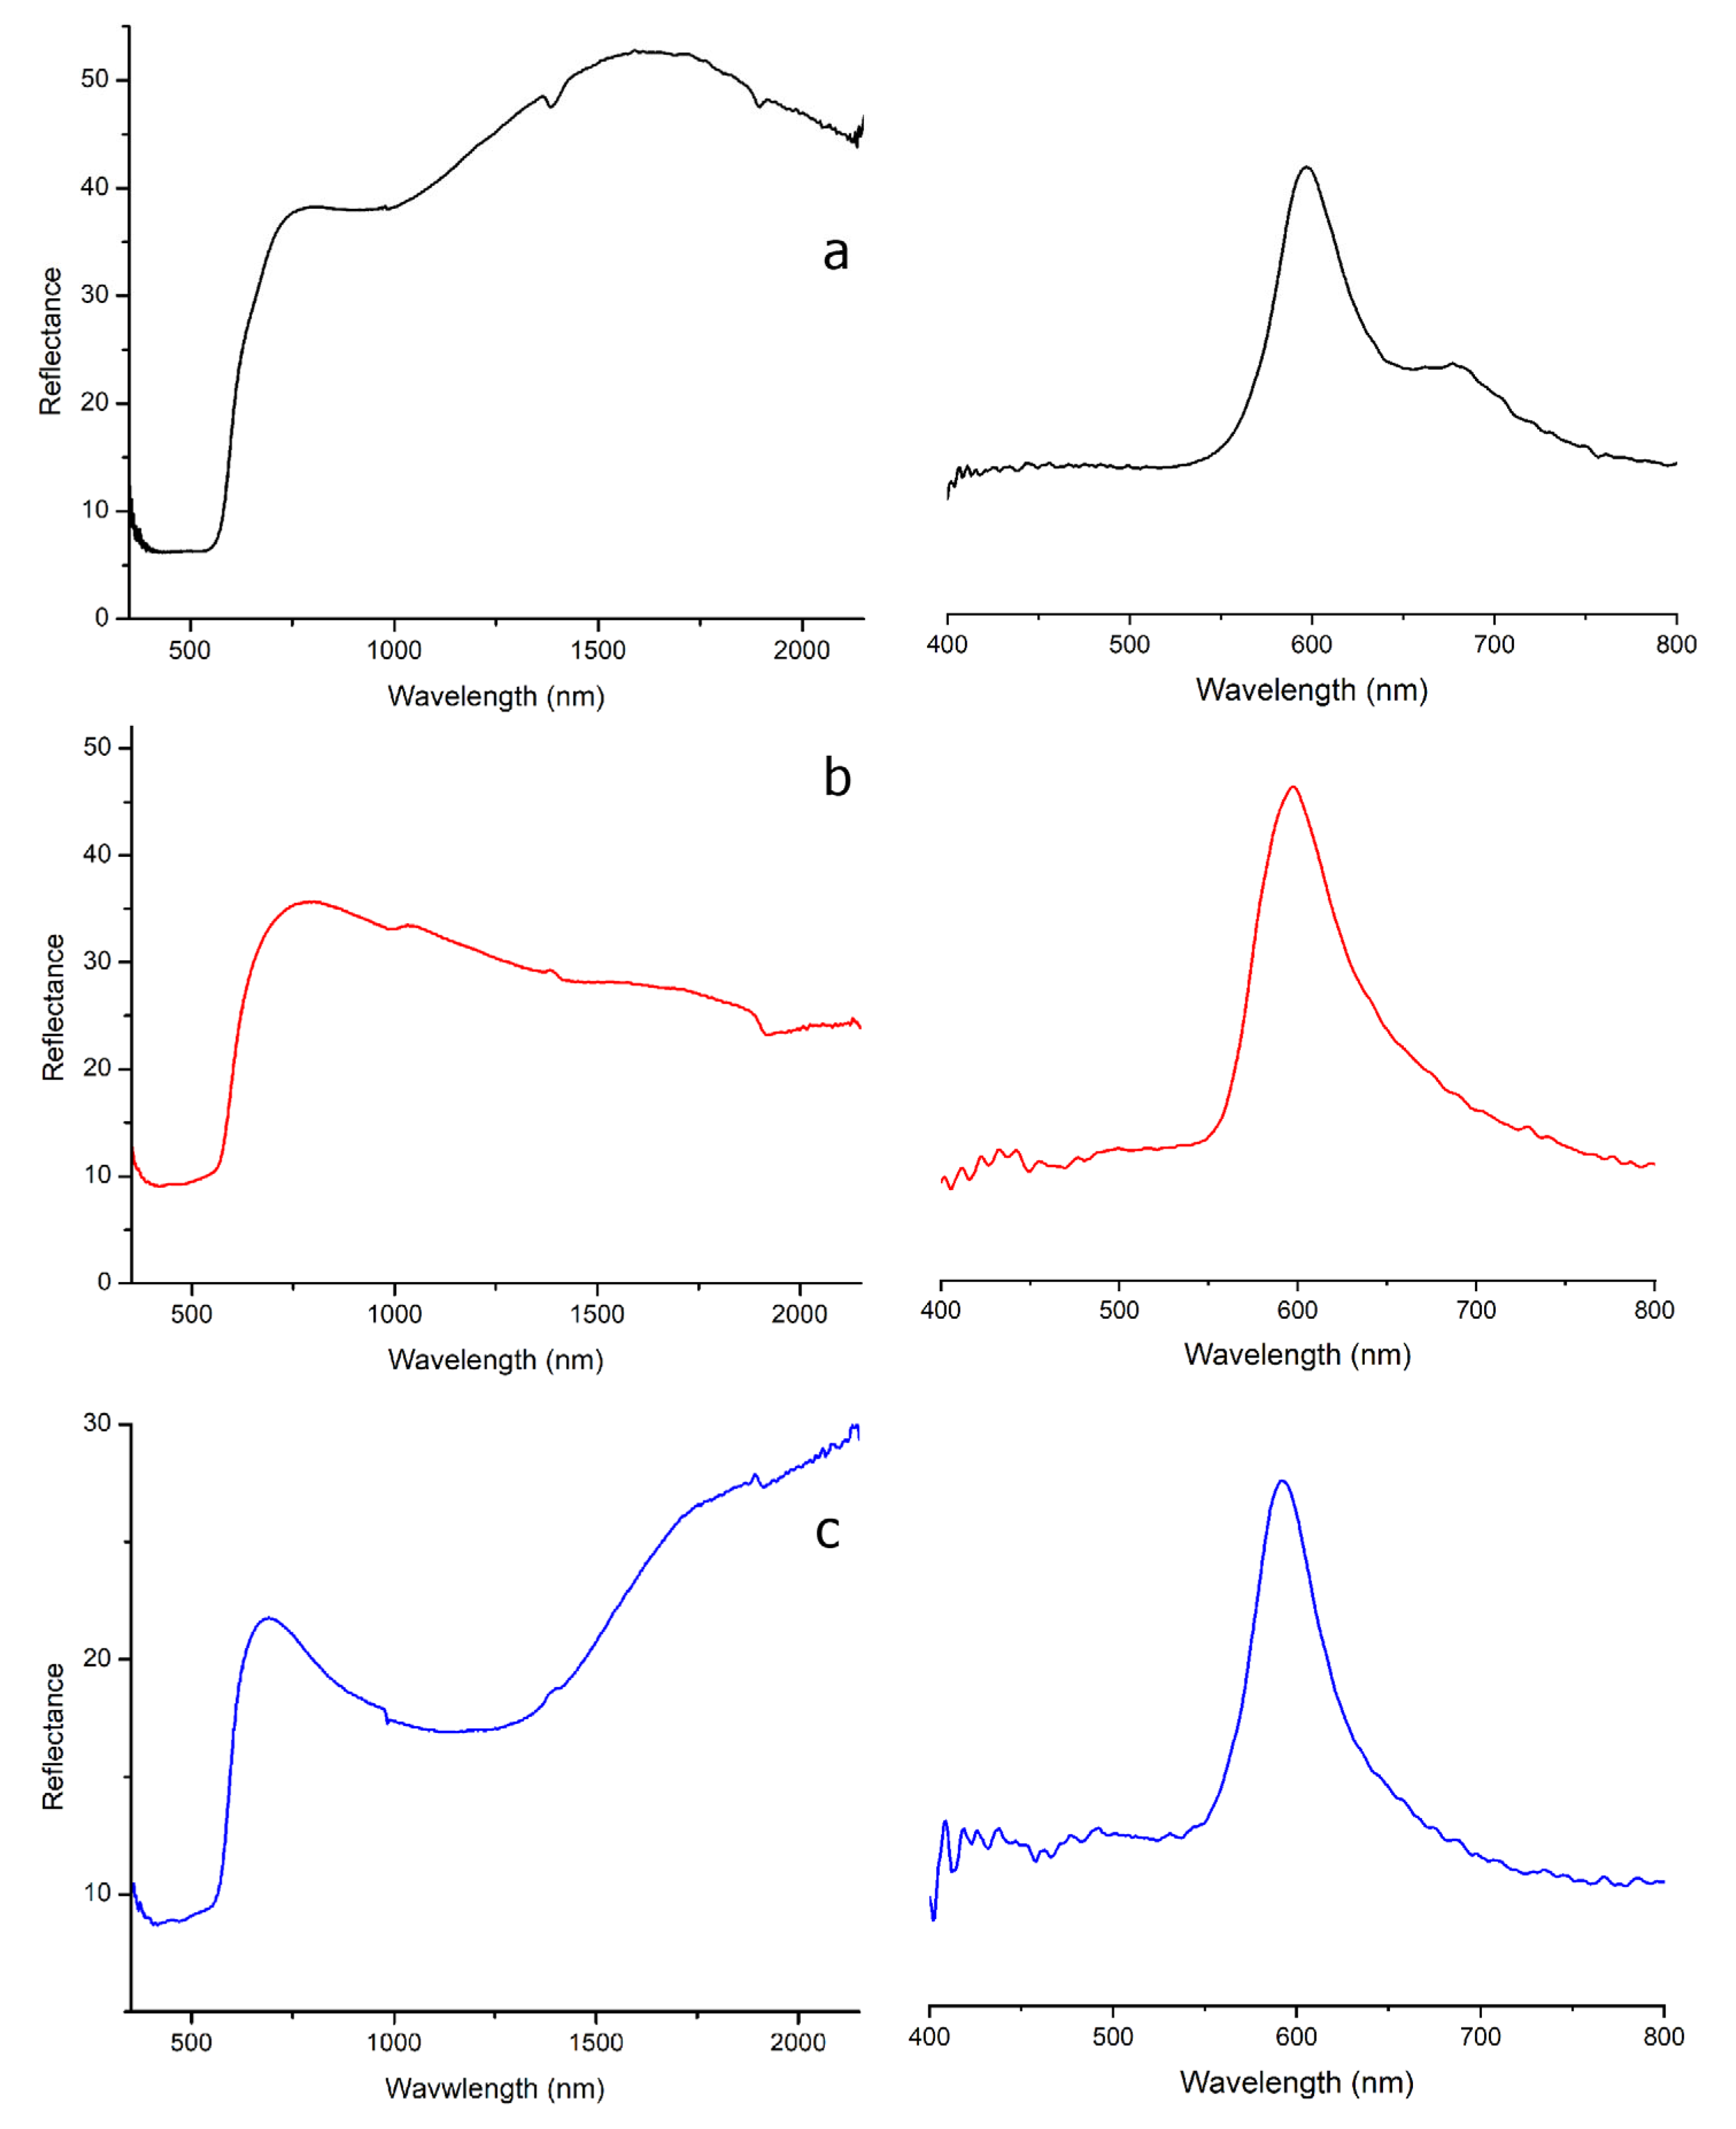
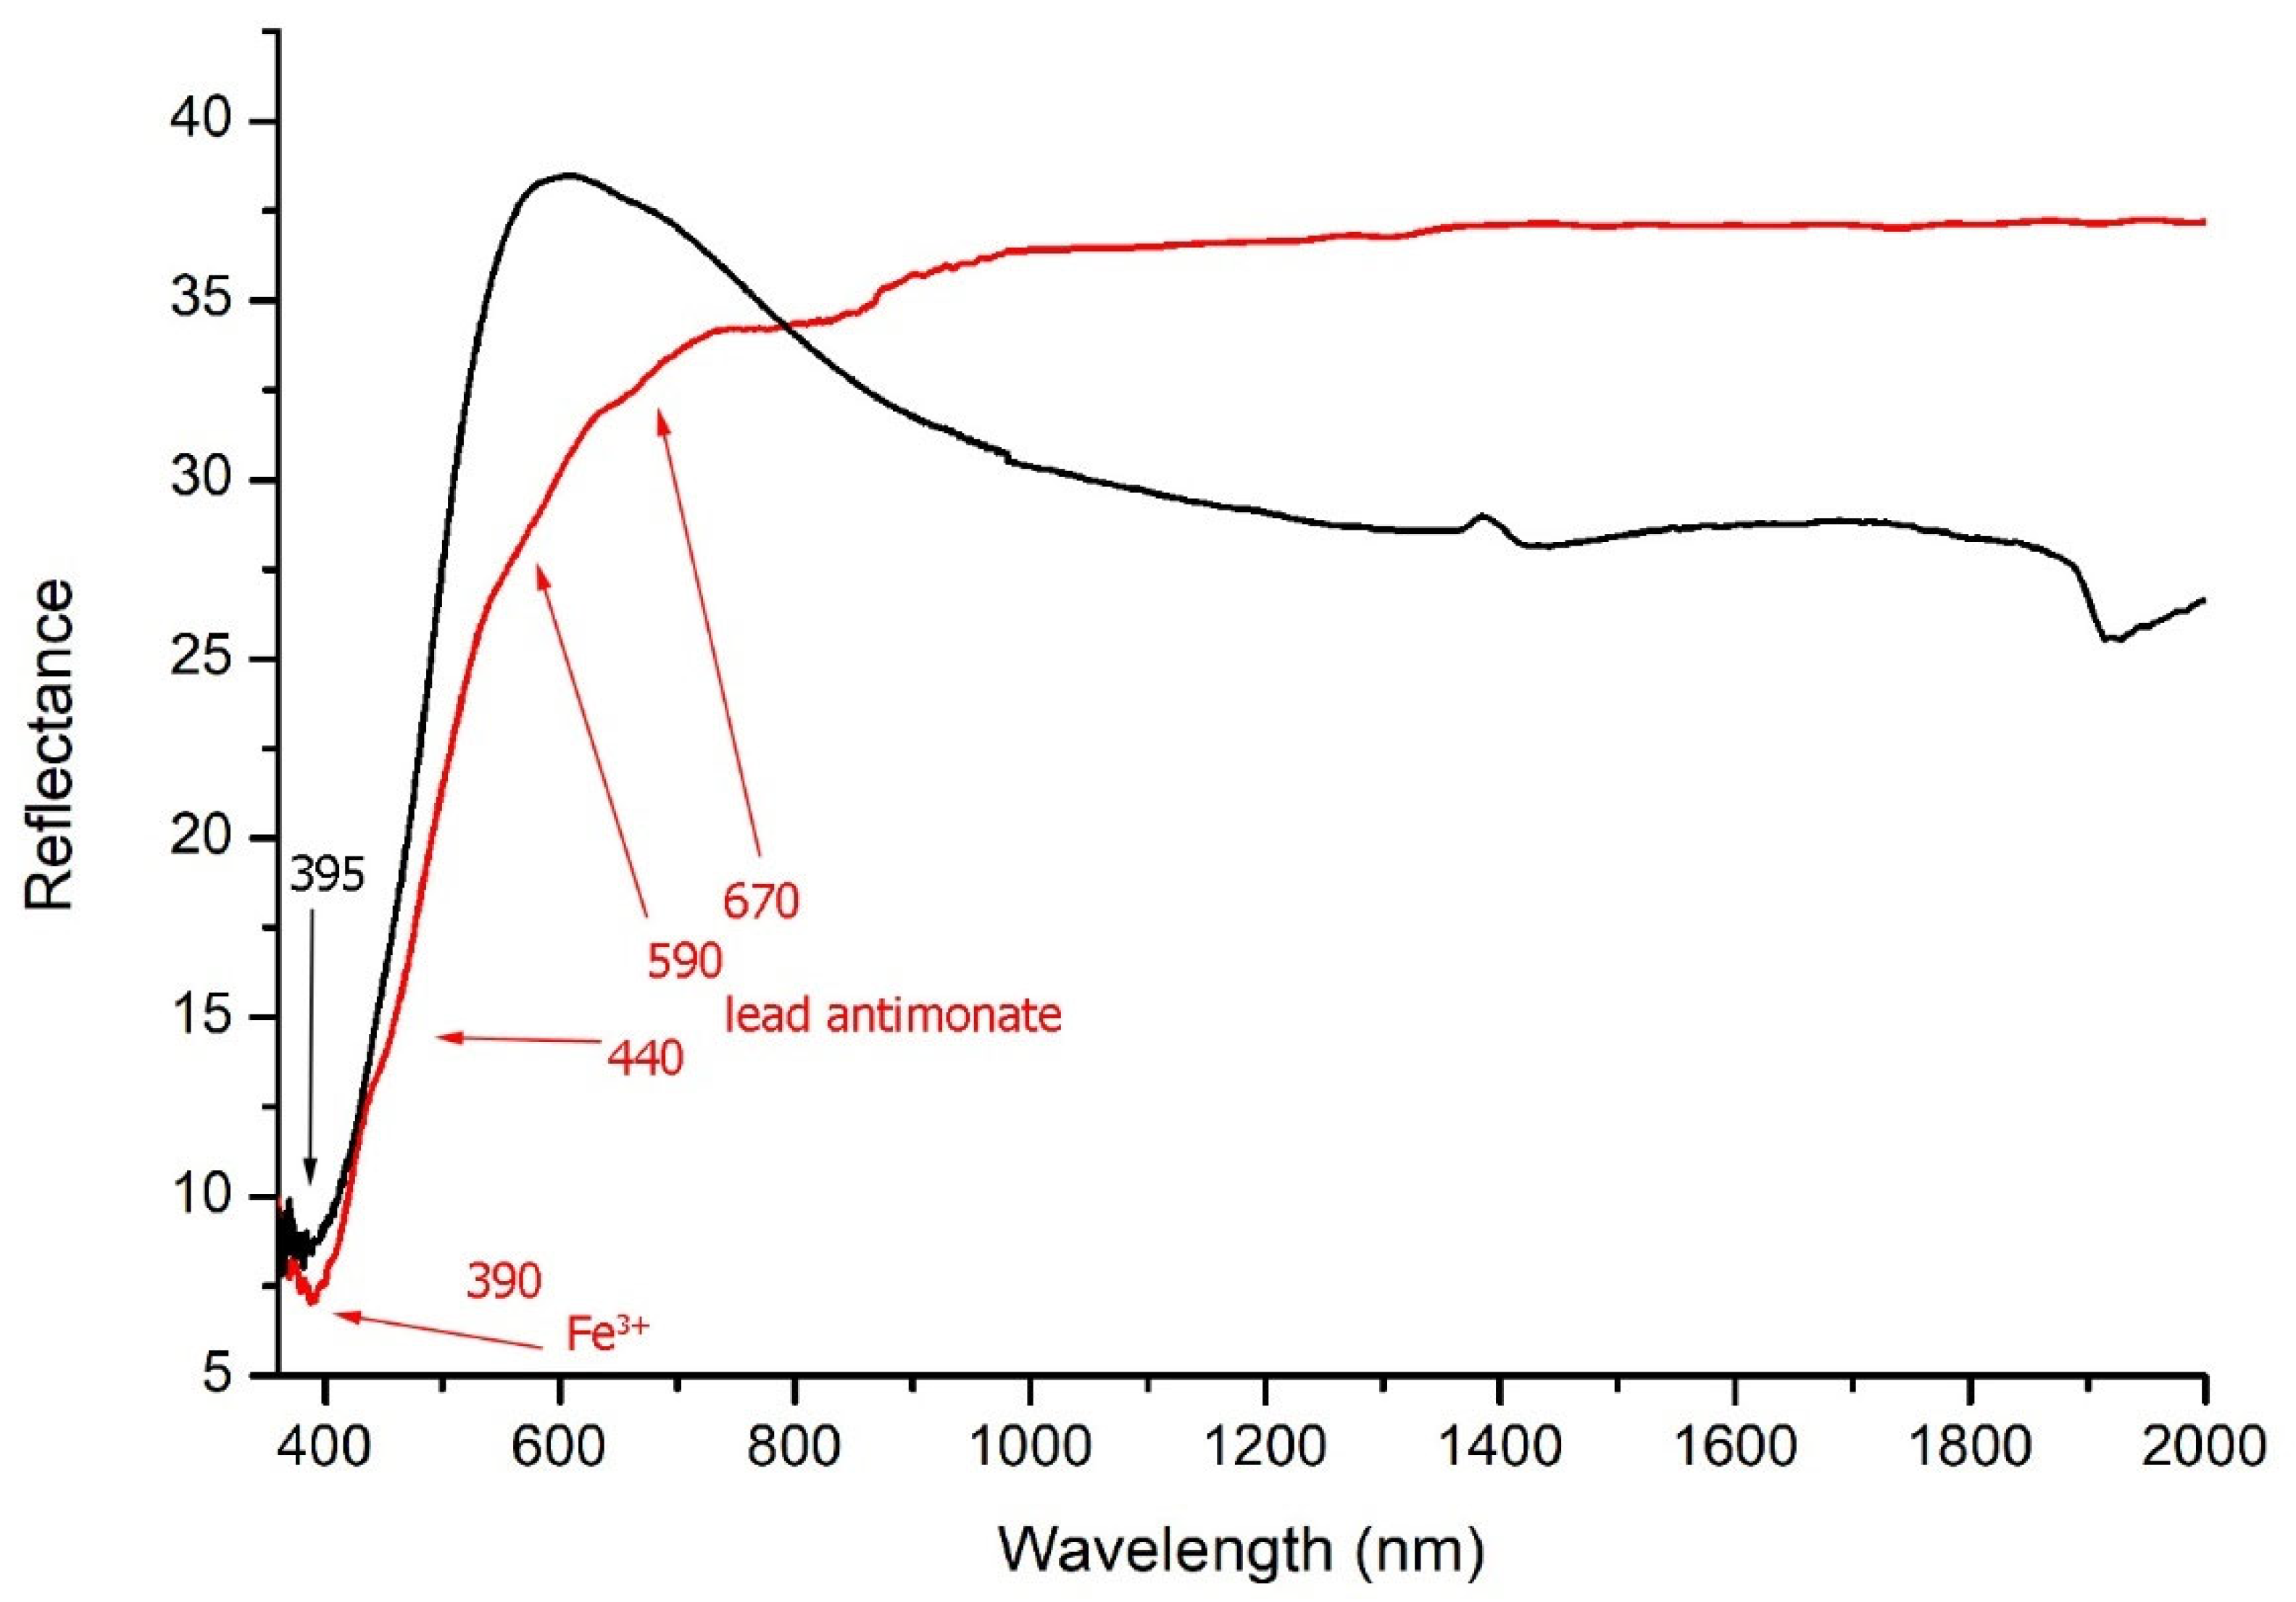
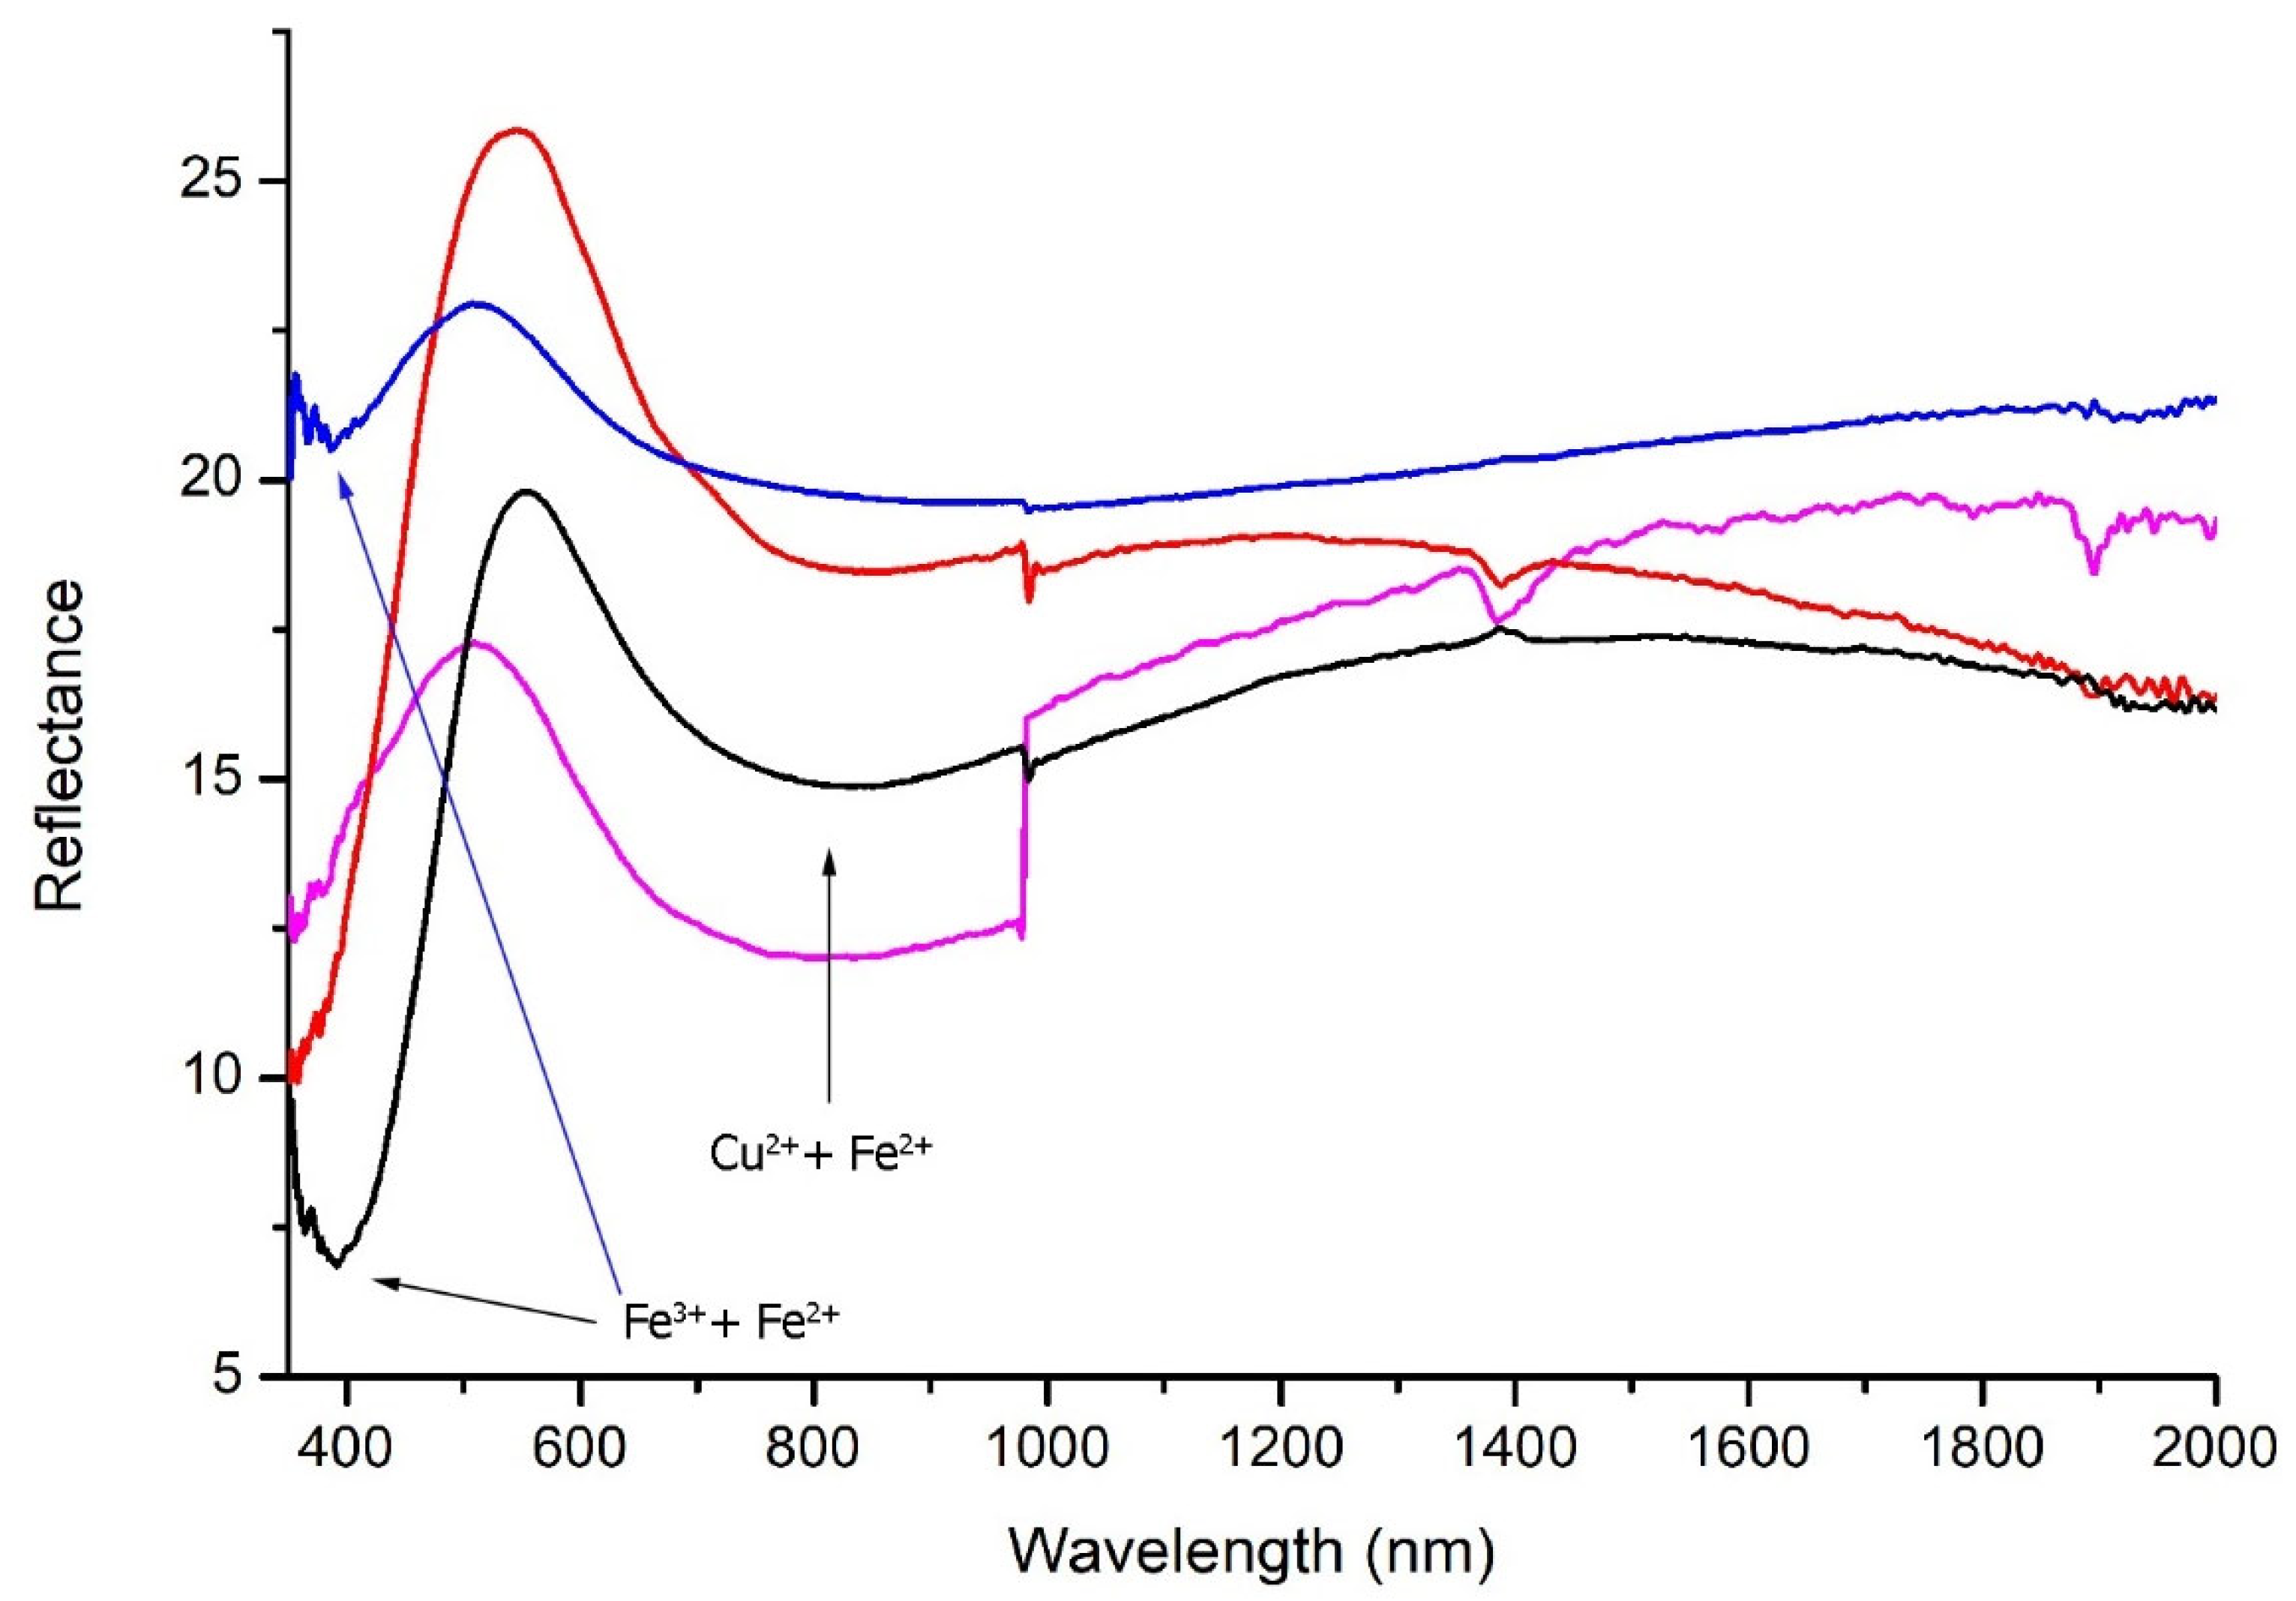
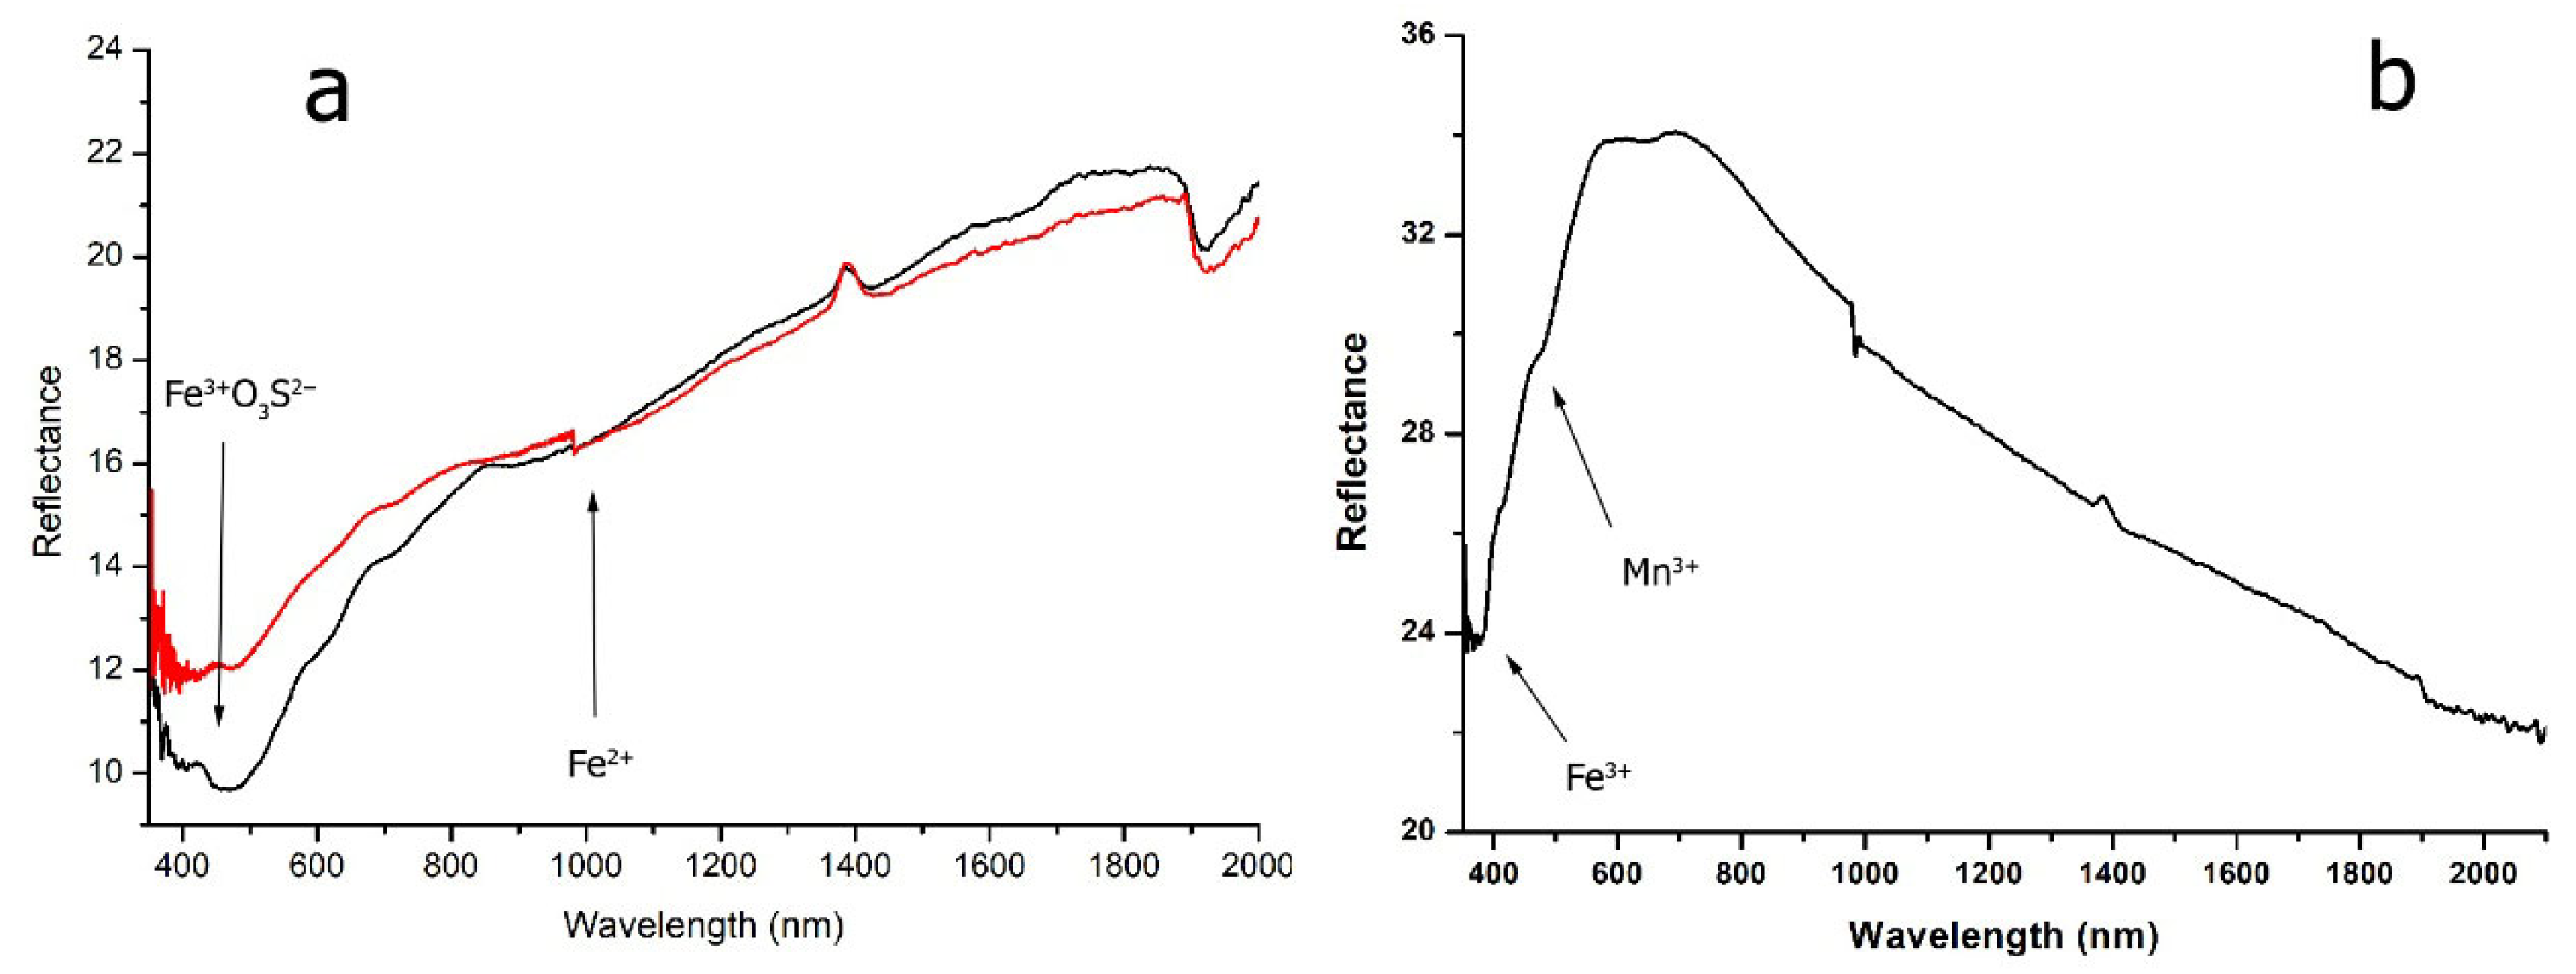

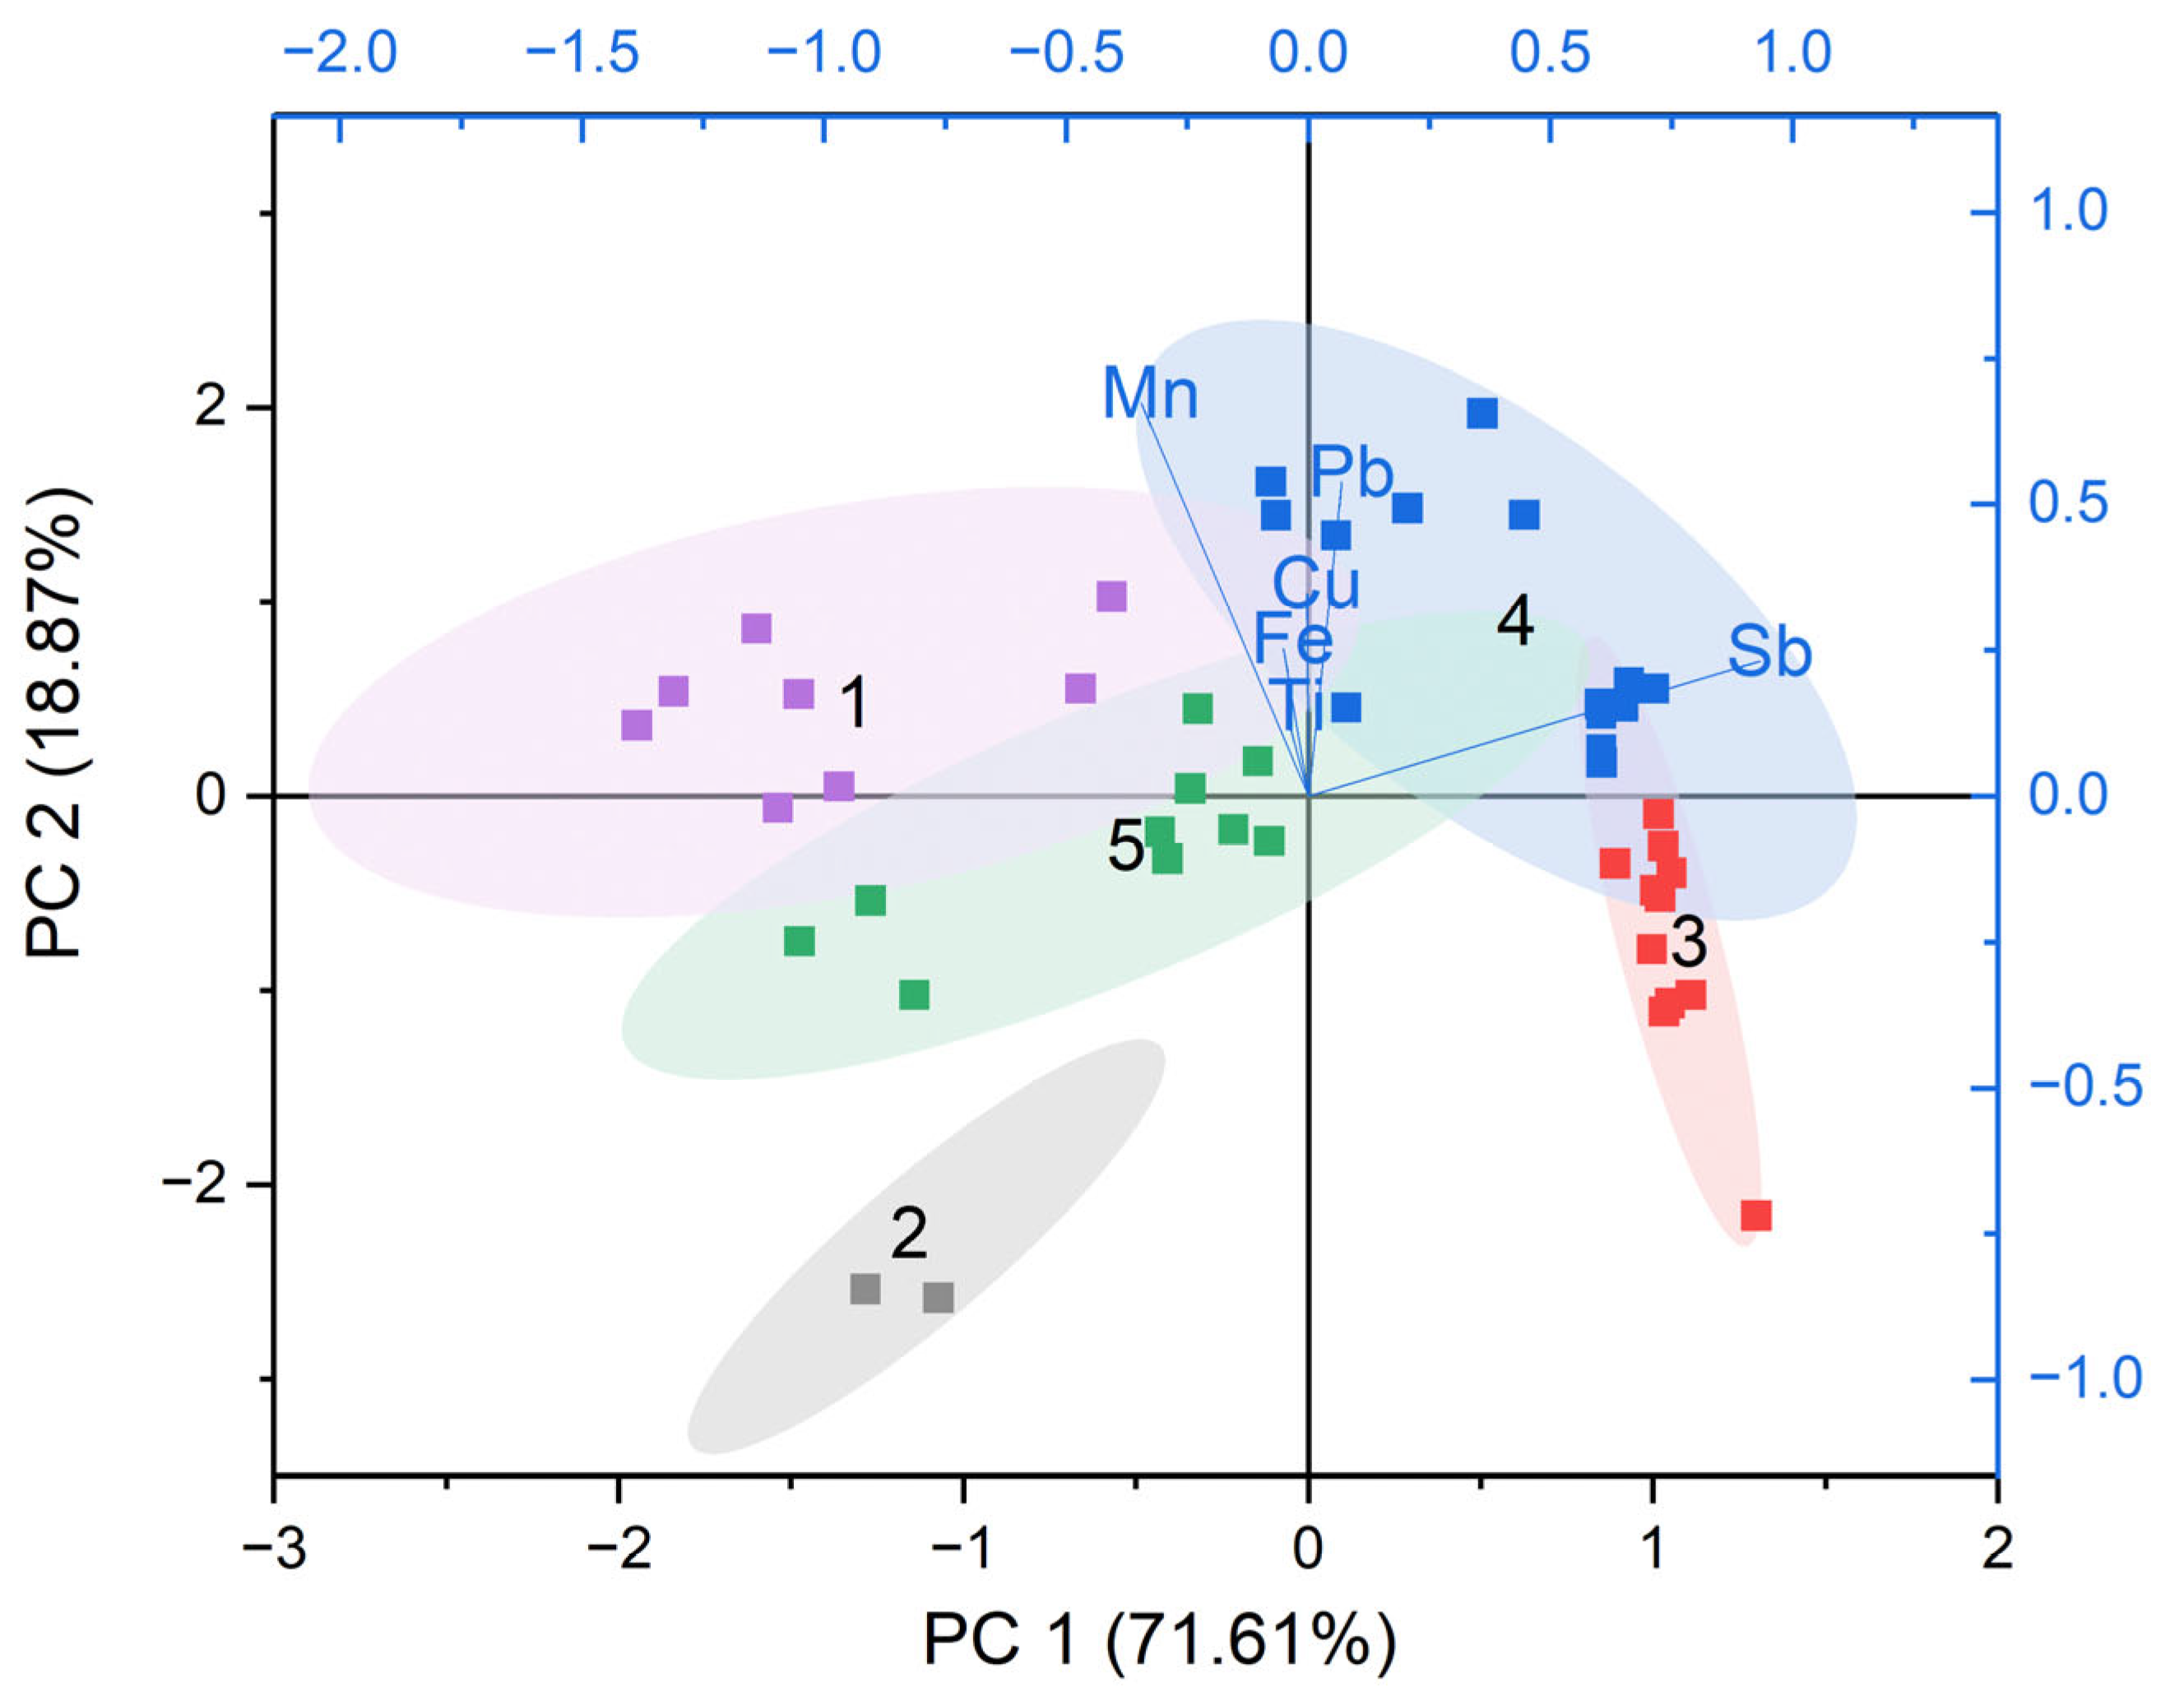
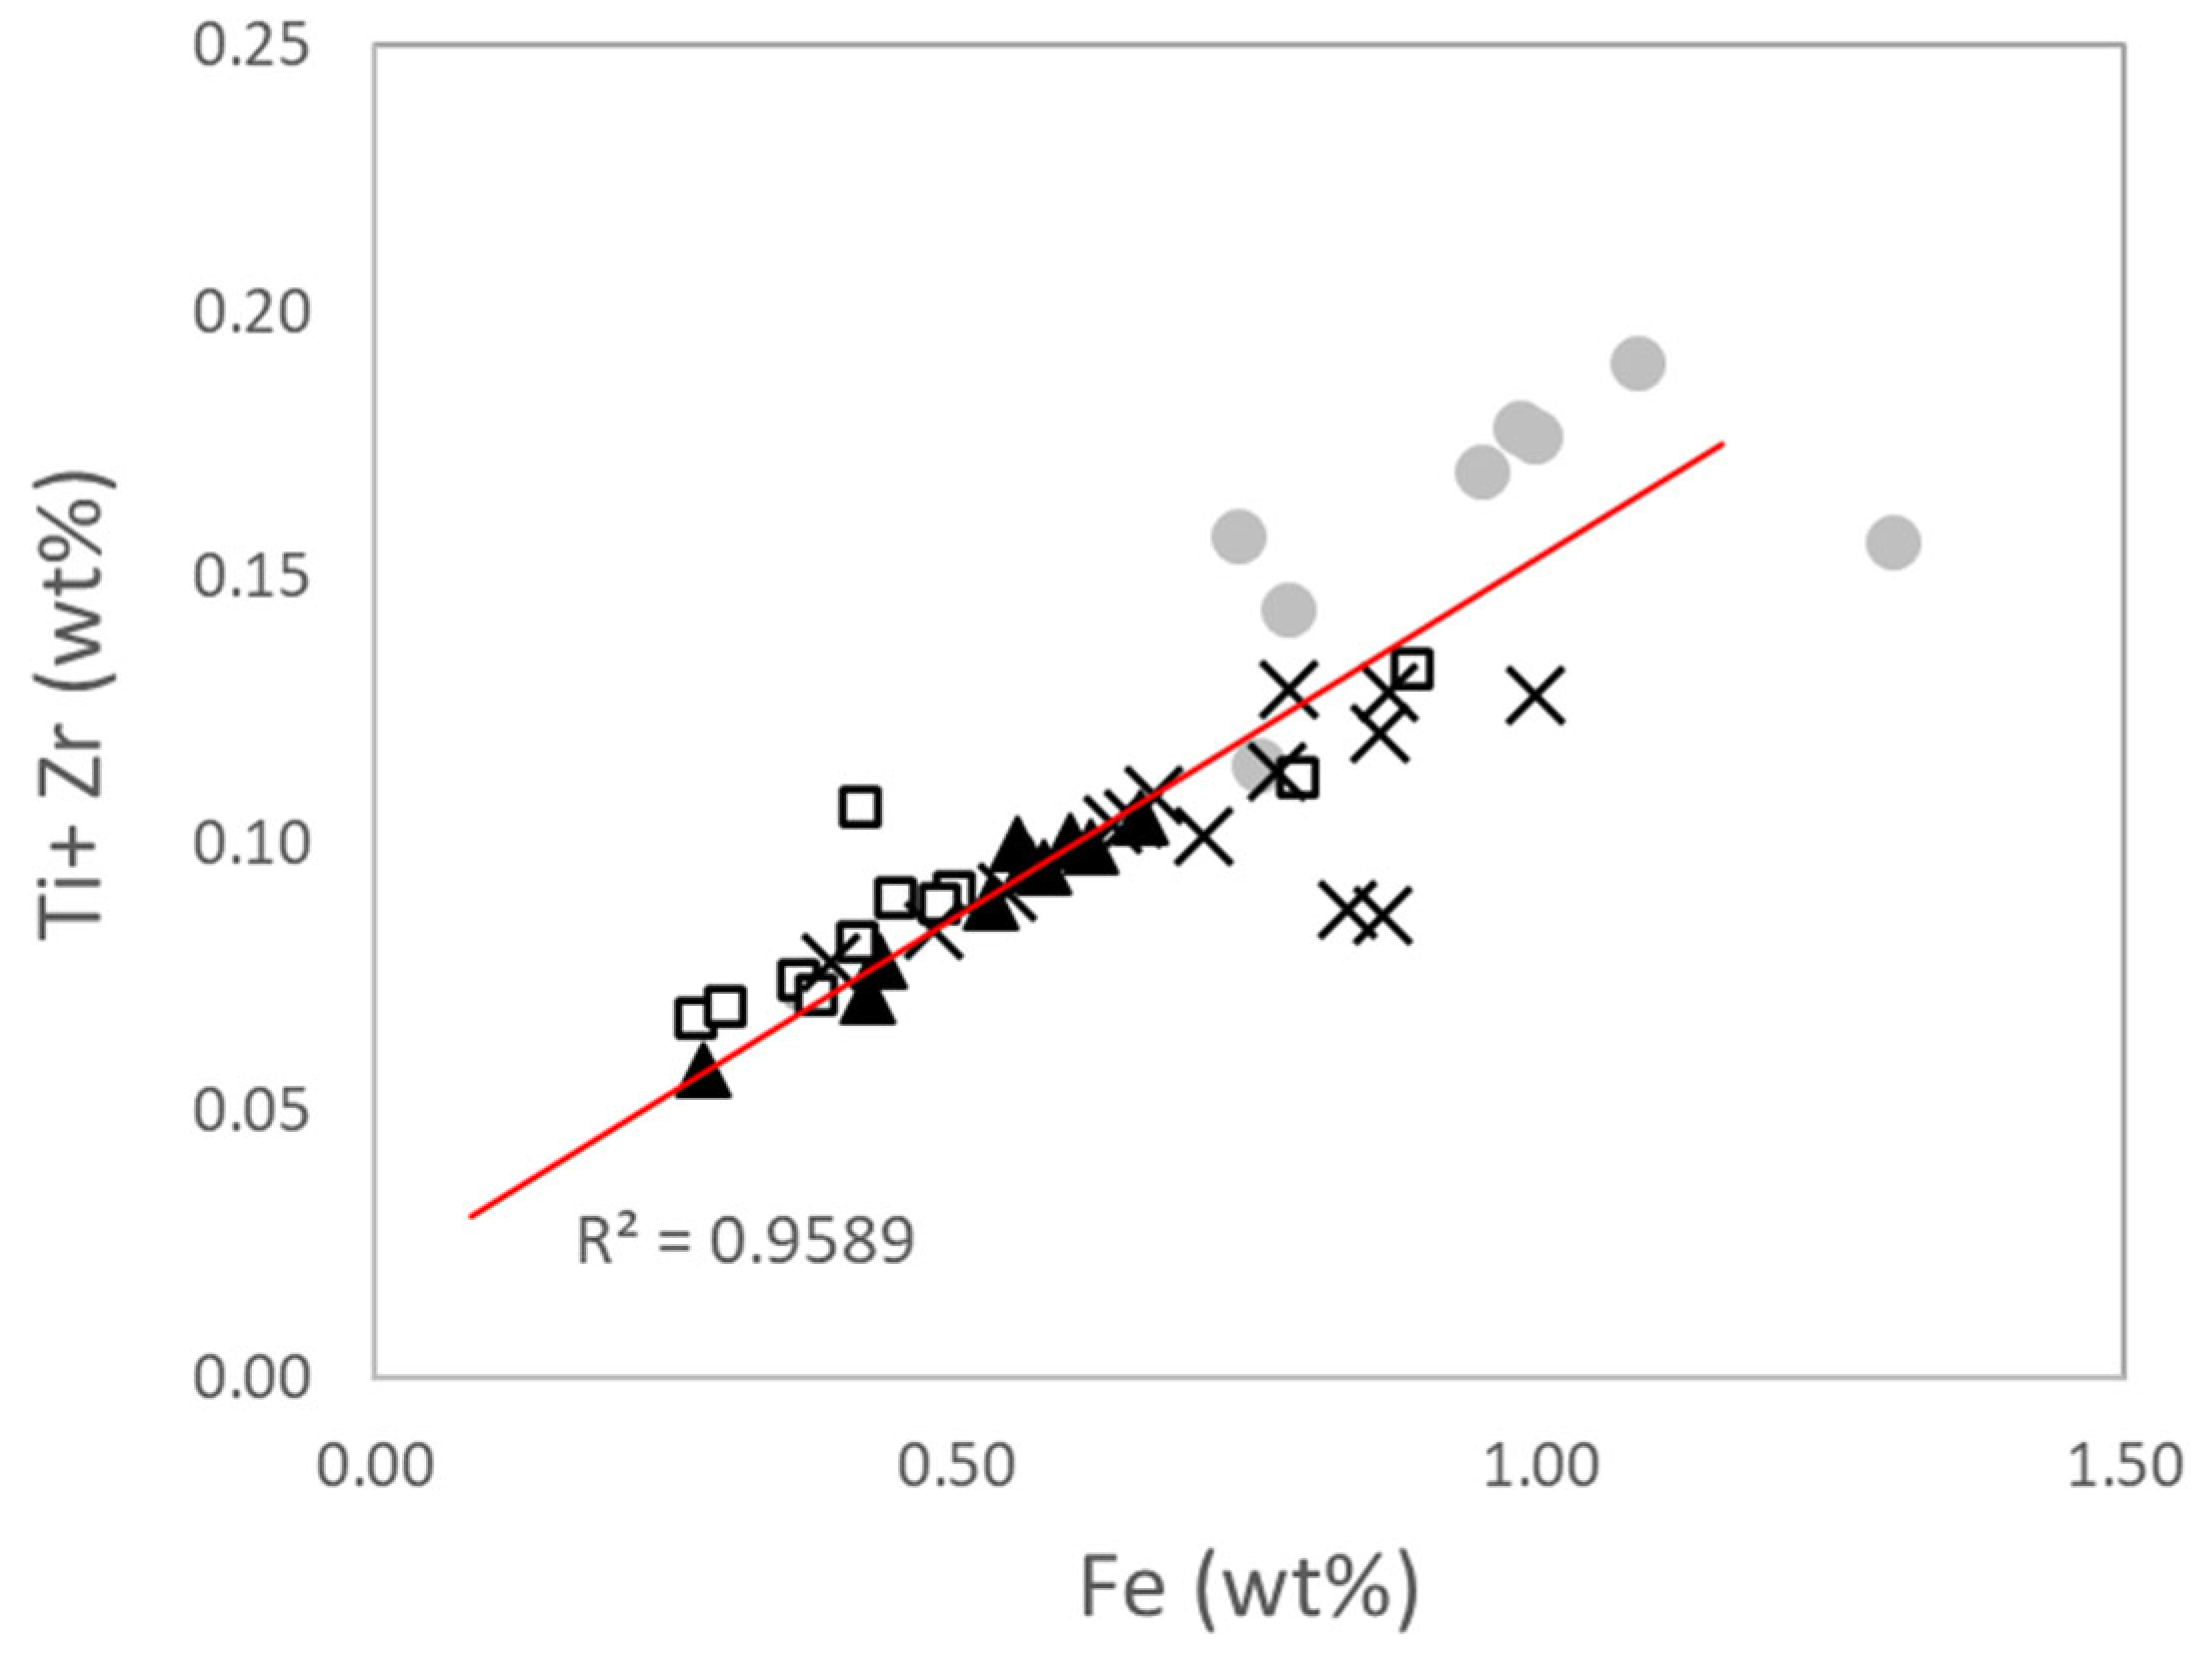

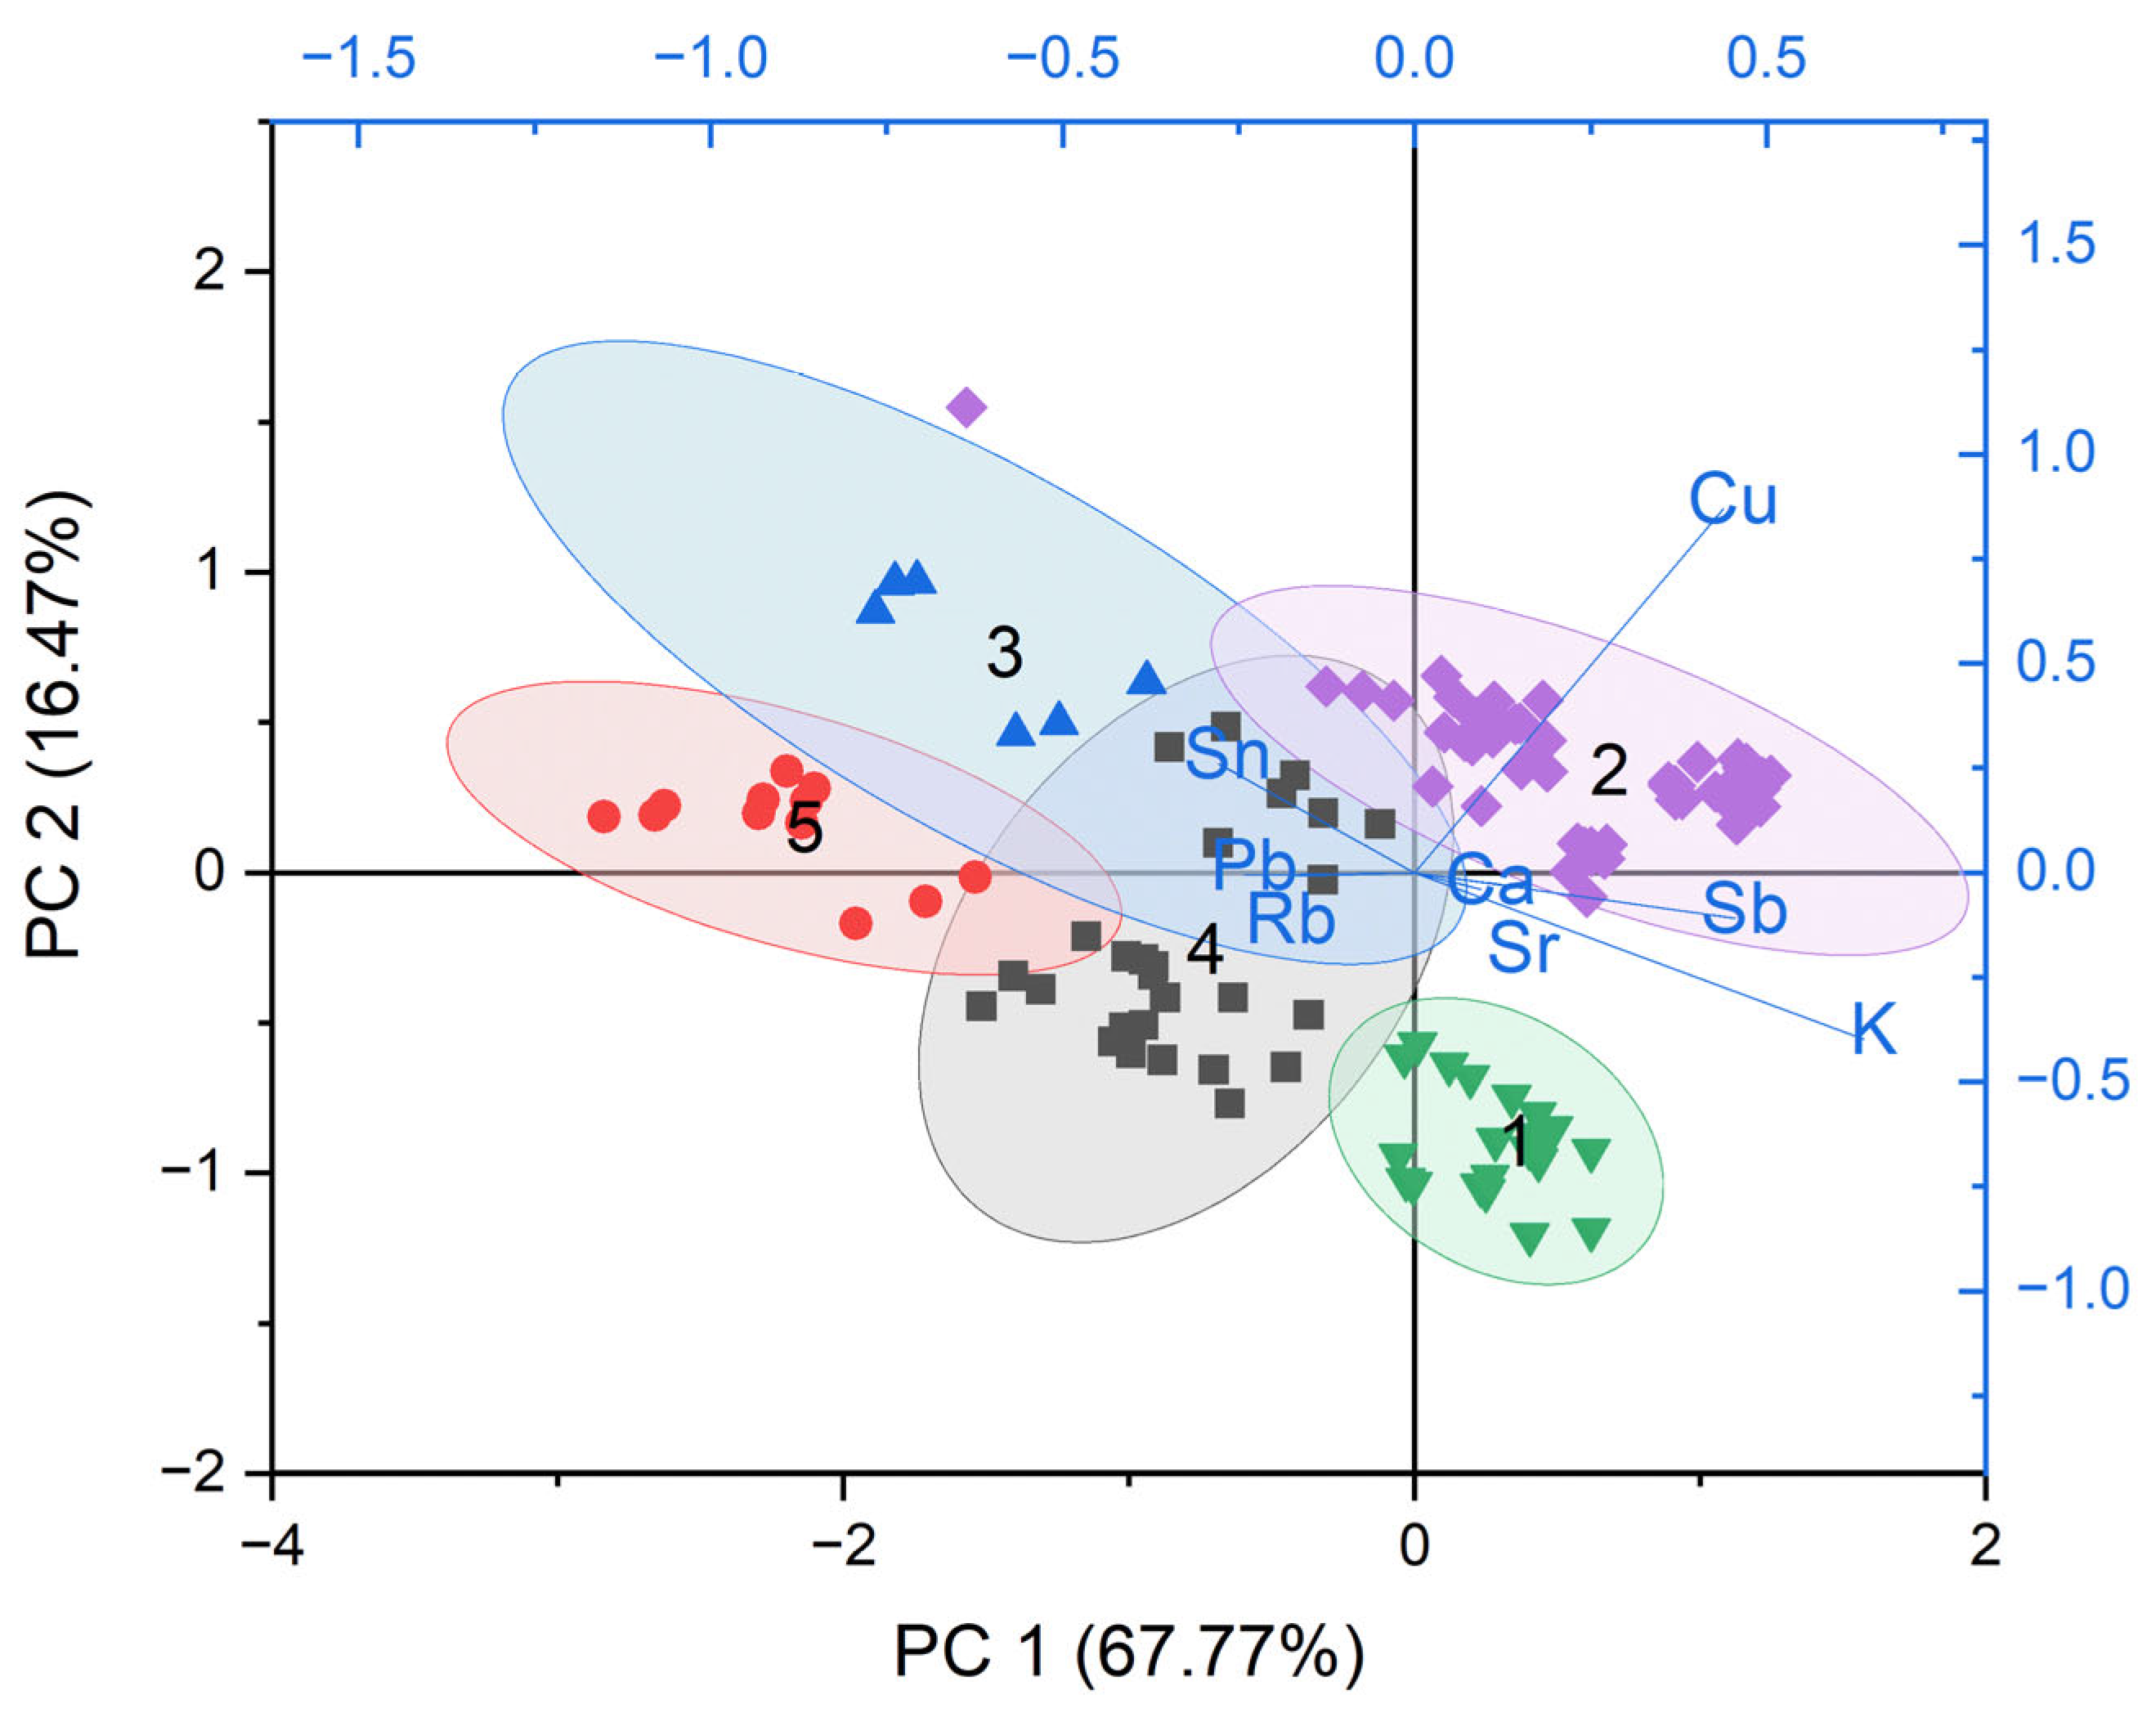

