Abstract
In recent years, automatic segmentation and classification of data from digital surveys have taken a central role in built heritage studies. However, the application of Machine and Deep Learning (ML and DL) techniques for semantic segmentation of point clouds is complex in the context of historic architecture because it is characterized by high geometric and semantic variability. Data quality, subjectivity in manual labeling, and difficulty in defining consistent categories may compromise the effectiveness and reproducibility of the results. This study analyzes the influence of three key factors—annotator specialization, point cloud density, and sensor type—in the supervised classification of architectural elements by applying the Random Forest (RF) algorithm to datasets related to the architectural typology of the Franciscan cloister. The main innovation of the study lies in the development of an advanced feature selection technique, based on multibeam statistical analysis and evaluation of the p-value of each feature with respect to the target classes. The procedure makes it possible to identify the optimal radius for each feature, maximizing separability between classes and reducing semantic ambiguities. The approach, entirely in Python, automates the process of feature extraction, selection, and application, improving semantic consistency and classification accuracy.
1. Introduction
In recent years, automatic segmentation and classification of data acquired through digital surveys, such as images and point clouds, have become increasingly proven practices in the field of built heritage studies. Machine Learning (ML) and Deep Learning (DL) techniques have proven effective in labeling images [1,2]; however, the segmentation of point clouds, acquired through range-based or image-based techniques, is more complex, especially in the field of Cultural Heritage (CH) [3,4].
Difficulties arise because of the geometric complexity and low repeatability of architectural elements, which make it difficult to define common patterns even within the same typological class. Although benchmarks exist to facilitate automatic recognition of historical elements, these are based on very heterogeneous and non-CH-specific training datasets. Moreover, architectural elements are generally grouped into higher hierarchical macrocategories, such as ‘Roof’, ‘Wall’, or ‘Floor’, without fully considering the meronymic relationships typical of historic architecture. This problem is amplified by the need to process a large amount of pre-annotated data to train the algorithms, as well as the quality and type of data used in training, which can lead to default categorization that is inconsistent with the conventions of the scientific community.
In fact, a significant problem is related to the subjectivity of manual labeling, which is an onerous activity influenced by the training and specialization of annotators, resulting in difficulties in the reproducibility of the process [5].
Considering these challenges, there is a growing need to enhance the efficiency, control, and clarity of recognition workflows, particularly within the field of Cultural Heritage (CH). This study seeks to investigate the various factors that influence the identification of homogeneous regions and to assess the extent to which these factors impact the overall recognition process, beginning with the formulation of the following hypotheses:
H1.
Given the reliance of classification tasks on the annotators’ domain expertise, manual labeling performed on the same dataset by specialists from diverse educational backgrounds may improve the recognizability of architectural elements by mitigating subjectivity in the annotation process.
H2.
The density of point clouds—defined by the number and spatial concentration of points within a given neighborhood—affects the accurate identification of homogeneous regions sharing similar features. Consequently, determining an optimal threshold for point spacing may support a more effective data structuring strategy for segmentation purposes.
H3.
The nature of the acquired data, depending on the digitization technique employed, specifically, Terrestrial Laser Scanning (TLS) and terrestrial and/or aerial photogrammetry, results in datasets with heterogeneous structures and point distributions that are often non-uniform. Therefore, the type of input data, particularly in relation to the specific reality-based sensor used, can significantly affect the performance and efficiency of the recognition pipeline.
The analysis was conducted through a review of popular AI learning approaches, which corroborated the choice of the Random Forest (RF) algorithm. This was applied to specific pre-processed datasets of point clouds related to a selected specific architectural typology for the study (Figure 1), namely monastic cloisters of the Franciscan religious order (see Section 2). The dataset was manually labeled by annotators with different specializations to assess the impact of their training on shape recognition. The analysis of the quality of the annotations allowed us to test a methodological approach aimed at measuring the degree of agreement between annotators and the uncertainty associated with labeling the training data. In addition, a procedure was developed to encode fuzziness in labeling by generating a point cloud with appropriate classes for training, with the aim of improving the semantic consistency of automatic segmentation in the context of CH, as formulated in Hypothesis 1 (H1).
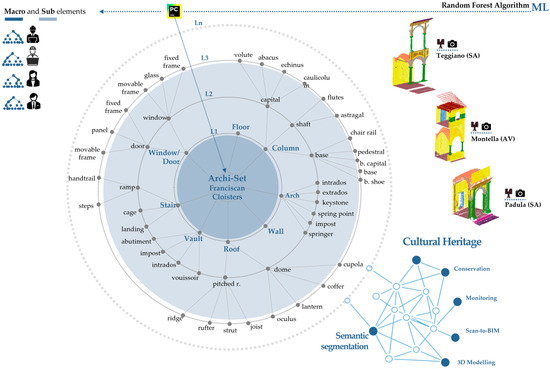
Figure 1.
General overview of the research on the semantic segmentation of Cultural Heritage (CH), illustrating the approach of deconstruction into elements and sub-elements, with an optimized implementation of the Random Forest algorithm tailored to the specific building typology under investigation.
As outlined in Hypothesis 2 (H2), the optimal threshold for point spacing was determined—that is, the minimum point density required for the model to reliably distinguish between different architectural typologies.
In parallel, the role of the sensor type was examined in relation to Hypothesis 3 (H3), with the aim of assessing the extent to which the characteristics of the acquired data influence both the geometric and radiometric accuracy of subsequent processing. This phase was essential for understanding how the quality and nature of the collected information can impact the precision of the final model.
This parameter is critical, as it enables a balance between the efficiency of the data acquisition process and the quality of morphological recognition.
In order to optimize the segmentation and classification of architectural elements with a high degree of precision, the research subsequently focused on developing a new criterion for feature selection. The choice of features plays a critical role in class recognition, as it directly influences the predictive model’s effectiveness and its ability to distinguish between different architectural components. However, identifying the most suitable features is a complex process, shaped by the heterogeneous nature of the datasets and the variability of architectural forms. To pursue the goal of optimization, a final hypothesis H4 was therefore formulated: the selection of features and the definition of the neighborhood radius within which to extract them, which may vary across different architectural classes, can enhance the predictive model’s ability to differentiate between distinct architectural elements.
The application of the RF algorithm to the semantic segmentation of the monastic cloister confirmed the effectiveness of the proposed method, obtaining a highly performing predictive model. In addition, the developed workflow made it possible to automate the computational process and optimize the classification of point clouds, eliminating the need for external calculators due to full integration in Python 3.7. The introduction of this new feature selection criterion represents a significant step forward in the automatic segmentation of built heritage elements, improving the consistency and reliability of recognition in the context of CH.
State of the Art
Recent years have seen major developments in automatic classification systems through the use of Artificial Intelligence techniques, particularly Machine Learning (ML) and Deep Learning (DL) (Figure 2), for semantic segmentation of point clouds, with the goal of supporting digital documentation of cultural heritage [6,7,8,9].
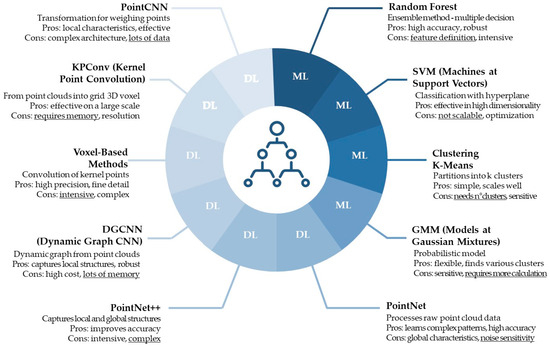
Figure 2.
Most widely used ML and DL algorithms, with pros and cons. The most critical cons have been highlighted.
While supervised ML techniques require algorithms to learn from manually annotated portions of point clouds and from “features”-geometric and/or radiometric attributes-selected by the user to facilitate distinction between different classes, DL strategies enable automatic feature extraction, making learning possible through the use of large amounts of annotated data [10,11]. Despite differences between DL and ML in how information is extracted and the level of autonomous learning, the use of large annotated datasets to effectively train models to recognize new scenes remains a necessary and indispensable condition [12]. In this regard, there is no lack of recent research that focuses its attention on the possibility of using synthetic data to significantly reduce the need for large annotated datasets as well as improve segmentation on real data using transfer learning [13,14,15,16]. In this context, the adoption of algorithms based on convolutional neural networks is growing, as it facilitates certain stages of the process [17,18,19]. However, the currently most widely used method remains the Random Forest (ML-RF) (Figure 3), which is considered among the most reliable [20,21,22,23].

Figure 3.
Random Forest (RF) workflow used for semantic classification.
A central issue in the use of AI for semantic segmentation concerns the quality and quantity of the training dataset. First, the problem of generalizability of the models arises, that is, the possibility of applying them to different contexts than those on which they were trained. Adaptability of an ML model, trained on a specific dataset in the CH domain, to the recognition of other similar datasets has been analyzed [24]. What emerges is that generalization is highly dependent on the characteristics of the dataset itself, being particularly complex in the case of very distinctive architectural styles or the absence of color information (RGB).
At the same time, the availability of large amounts of data that can be used for training also plays a crucial role, especially when working in the field of CH, which is rich in variation and exceptionality.
Thus, to address the lack of architectural data useful for algorithm training, a collection of pre-annotated point clouds was released [25].
A benchmark was, therefore, prepared in which 10 classes of architectural components were identified to guide the semantic point cloud segmentation of the existing building heritage [26]. The benchmark includes 17-point clouds acquired with different survey technologies (TLS, terrestrial, and aerial photogrammetry), all homogeneously sampled.
However, to date, the effects that data quality, particularly point cloud density, may have on feature class recognition, including in relation to the acquisition modes adopted, do not appear to have been thoroughly explored. This is an aspect that, in the experience of practitioners, would deserve special attention, in addition to a number of additional factors known to influence the quality and characteristics of point clouds [27,28,29].
A further aspect of considerable importance, highlighted in the literature, concerns the fact that, even today, many of the methodologies applied to cultural heritage rely to a large extent on manual interventions, both for the interpretation of the objects within the point clouds and for the creation of the annotated datasets needed to train the models [30,31,32]. Although the first semi-automated annotation solutions, mainly based on semantic image segmentation with subsequent 3D back-projection, are gradually becoming popular [33,34], the phase of pre-annotation and interpretation of point clouds still remains a particularly challenging step. This is not only because of the high degree of complexity of geometries and the lack of repetitiveness of elements across architectural types, but also because of the critical delicacy of the task, which requires accurate and consistent identification of architectural components and sub-components. This process is often influenced by the cultural background, education, and experience of the annotator, factors that can generate ambiguity in the classification and association of elements to categories shared and recognized by the scientific community [35,36]. The annotators’ educational background plays a significant role in determining the quality and consistency of the annotation process. Annotators with a background in art history or architectural history tend to adopt a stylistic or typological perspective, focusing on chronological, decorative, or symbolic aspects of architectural elements. In contrast, annotators trained in Architecture or engineering—particularly in the fields of restoration or design—may apply a more structural and functional approach, classifying elements based on their construction role or their position within the spatial and distributive system [37].
This distinction reflects different “points of view” from which the built environment is observed and interpreted, directly related to the specific knowledge of each annotator [38]. If left unmanaged, such methodological divergences can compromise the semantic consistency of the classification, particularly in contexts where reproducible recognition of architectural classes is essential. For this reason, estimating the degree of inter-annotator agreement becomes a crucial step. It allows for an objective evaluation of the convergence in annotation choices, highlighting potential semantic ambiguities or interpretative misalignments [39]. Ultimately, such analyses contribute to improving annotation protocols, refining the definition of semantic classes, and enhancing the robustness of computational models—particularly automated ones—used for the recognition of complex historical architecture.
Toward that direction, automated and shared annotation of large datasets in the form of point clouds is still an open issue. This is because such semantic description models require a specialized vocabulary and a clear definition of concepts in standardized and recognizable formats. To date, there does not appear to have been extensive research on the application of machine learning-based classification methods to cultural heritage that explicitly examines how well a supervised classification model can, or cannot, express the uncertainty associated with meaning attribution in the manual annotation process during the preparation of training data. Integrating uncertainty mapping with supervised classification methods could, in the future, address ambiguities present in the semantic description of architectural artifacts. In this, it could help improve interoperability and interpretability, including in artificial intelligence application contexts.
Another key aspect to consider for proper feature classification and segmentation concerns features, and particularly their selection [40]. Features provide descriptive information about the data. In the context of point clouds, these can be geometric, useful for representing the shape, arrangement, and spatial properties of objects, or radiometric, related to material characteristics, such as reflectance, which describes the light response of objects. Geometric features are derived from the computation of the three-dimensional covariance matrix based on a spherical surround of defined radius [41]. Analysis of the eigenvalues and eigenvectors associated with the matrix provides invariant information with respect to translations, rotations, and scaling [42]. Additional measurements can be derived from these eigenvalues to describe local dimensionality, such as linearity, planarity, and sphericity, which are useful for characterizing linear, planar, and volumetric structures, respectively [43,44,45].
Feature determination and choice are critical for point cloud segmentation in the context of CH. One study [46] found that integrating meaningful features, such as normals and radiometric components, into a Dynamic Graph Convolutional Neural Network improves accuracy in semantic segmentation of historical architectural features. However, feature selection presents significant challenges. Some research [47,48] has pointed out that choosing the right geometric features and range for calculation is crucial for the effective identification of architectural elements. In addition, the difficulty of defining common patterns for segmentation has been highlighted [49], due to the complexity of shapes and limited repeatability of elements in historic buildings, further complicating the selection of the most appropriate features. After feature extraction, as pointed out, it is crucial to select the most relevant ones to reduce model complexity and improve generalization ability. The selection techniques fall into three main categories [50]:
- filter-based methods: evaluate intrinsic properties of variables;
- wrapper-based methods: use model performance to select subsets of features, albeit with a higher risk of overfitting and higher computational costs;
- embedded methods: integrate feature selection during the training process, simultaneously optimizing the model and selected variables.
Such techniques have been widely used in several studies [24,41,51], but it should be kept in mind that wrapper-based methods provide better performance than filter-based methods, but at the same time present a significant risk of overfitting that would cause the selected subset of features not to fit in a different context. The same is true for embedded methods. In general, effective feature selection for point cloud segmentation in cultural heritage requires a balance between the representativeness of the chosen features and the ability of the model to generalize over different architectural structures, taking into account computational limitations and the availability of annotated data. For these reasons, one of the objectives of this study is to investigate a new feature selection approach so as to reduce classifier dependence and obtain good results related to the generalization of the process.
2. Materials and Methods
The application of AI techniques for modeling and understanding the building elements of historical architecture is, as mentioned, a field of investigation in full development. In this study, RF was chosen as the algorithm to perform semantic segmentation of the dataset because of certain peculiarities [52], analyzed against evaluation parameters:
- Robustness and accuracy even on large datasets with noise: RF is an algorithm based on a multitude of decision trees, each of which is trained on a random subset of the dataset. This approach allows the model to be particularly robust to the presence of noisy data or outliers, while still maintaining good predictive performance on large volumes of data.
- Reduced susceptibility to overfitting: Using the ensemble learning technique, RF combines the predictions of multiple decision trees. This combination mitigates variability in individual models and allows for better generalization over test data, reducing the risk of overfitting that often plagues more complex models.
- Feature importance estimation: One of the most interesting aspects of RF is the ability to estimate the relative importance of different features used in the model via the feature_importances_ attribute. This allows not only greater transparency of model decision making but also a useful understanding of the most relevant factors for semantic segmentation, facilitating a more in-depth and interpretable analysis.
- Less dependence on annotated data: Unlike other machine learning algorithms, especially those based on deep neural networks, RF requires less labeled data to perform well. This is a crucial advantage in contexts such as Architectural Heritage, where manual data collection and annotation can be costly and time-consuming.
The choice was directed by a comparative evaluation preliminarily conducted among the main ML and DL algorithms, evaluating parameters such as robustness to noise, ease of use, implementation, effectiveness on large datasets, and adaptability to historical architectures, which were evaluated on a scale of 1 to 5, where 1 represents the minimum value and 5 the maximum, resulting in a qualitative analysis of the various algorithms of both ML and DL.
Specifically, with reference to the size of the dataset for training, a value of 5 was assigned to the algorithm with the lowest demand for data, while 1 was assigned to the algorithm with the highest demand. By calculating both arithmetic and weighted averages of these values (Figure 4), assigning higher weights to parameters considered more significant, it was found that the Random Forest algorithm stands out for high performance, comparable to DL models, yet requiring smaller volumes of data for training.
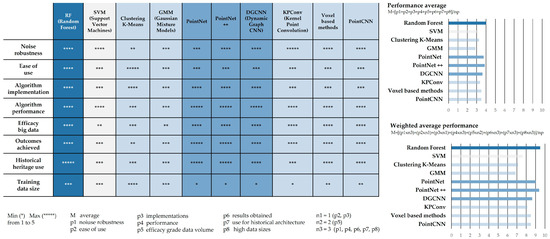
Figure 4.
Comparison of the most used ML and DL algorithms based on key parameters. Values from 1 to 5 have been assigned according to the influence of the selected parameters. Weighted average of the performance of the algorithms, assigning a value of 3 to the most significant parameters, 2 to moderately significant ones, and 1 to the least significant ones. The intensity of the colors is related to the average values calculated in the histograms on the right of the figure.
Therefore, the methodology adopted is based on the implementation of the RF4PCC (Random Forest for Point Cloud Classification) algorithm, developed by the 3DOM research unit of the FBK Bruno Kessler Foundation [53].
RF4PCC is a tool designed for automatic point cloud classification, with the ability to accurately identify and distinguish building elements. The methodological workflow of the analyzed algorithm consists of four main steps (Figure 5):
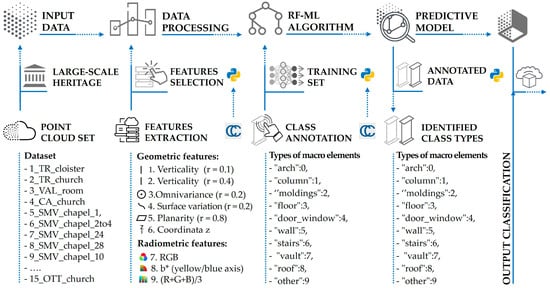
Figure 5.
Workflow of the RF4PCC algorithm for automatic point cloud classification.
- Data input and dataset creation, with the selection of 15 manually annotated point clouds and the introduction of the cloud to be classified, partially annotated.
- Processing of geometric and radiometric features, carried out with Cloud-Compare [54] to extract information useful for training.
- Training phase in Python, exploiting the RF algorithm to optimize class recognition.
- Application of the predictive model allows new point clouds to be automatically segmented and classified.
Each of the steps described suggests some critical insights that need to be evaluated (Figure 6). In particular, at the initial stage of defining the input data set, a key critical issue concerns the influence of the annotators’ specialization and cultural background in the process of manually annotating point clouds, which is essential for training the algorithm.
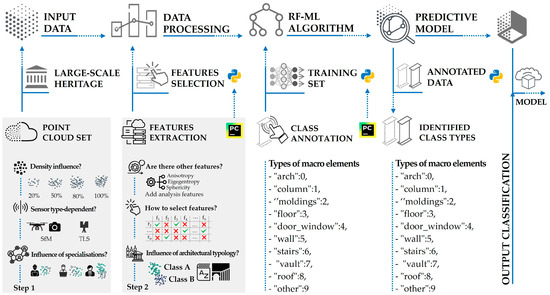
Figure 6.
Proposed methodological structure and research questions associated with the first two procedural phases, concerning data quality, source, and manual segmentation.
In addition, there are further operational and methodological issues that are central to the automatic classification process. Among them, the effect of spacing, i.e., the distance between points in the clouds, has a direct impact on the density of the data and, consequently, on the quality of the calculation of geometric features, affecting the possibility of correctly recognizing different architectural elements. Therefore, what is the threshold density value below which segmentation loses effectiveness is investigated in order to optimize the trade-off between model accuracy and computational complexity.
Another aspect addressed is the dependence on the type of sensor used for acquisition, comparing results obtained from point clouds derived from range-based techniques (e.g., terrestrial laser scanning) with those obtained from image-based techniques (e.g., terrestrial and aerial photogrammetry). The goal is to understand how different technologies affect the features derived and their effectiveness in the training process.
Further questions arise in the later stages of the work, particularly the appropriateness of including specific new features to improve the recognition of hard-to-distinguish features, such as arches, columns, or moldings, which are often subject to semantic overlap in the results. The impact of feature selection with respect to variation in the radius of the surround used in their calculation is also analyzed, assuming that certain radii are more effective for specific architectural classes. This leads to the development of a methodology for optimal feature and ray selection, based on statistical metrics (e.g., p-value analysis and comparative boxplots), in order to maximize separability between classes, reduce semantic ambiguity, and improve the robustness and objectivity of the predictive model.
This approach is discussed and tested in the following sections through a series of focused experiments that analyze the influence of dataset density, data sensory provenience, and annotator agreement, leading to the definition of an optimized workflow, fully integrated in Python, for the automatic classification of architectural elements in Franciscan cloisters.
Focusing on the initial aspects of the research, the first phase aimed to structure a methodology to assess the influence of annotative variability on the classification process.
To this end, a shared typological nomenclature, consistent with the disciplinary tradition, was adopted to guide the manual annotation of point clouds by annotators with different formations. This allowed the construction of a dataset segmented according to homogeneous Architectural classes, useful for analyzing the degree of agreement between annotators and emerging semantic ambiguities. In parallel, the comparative analysis of the classificatory effectiveness of data acquired with different sensors was addressed, evaluating the incidence of geometric and radiometric information in the calculation of features. The optimal threshold value of spacing, necessary to ensure sufficient discriminability between classes while avoiding computational overhead, was then determined through controlled tests.
To integrate these results into a functional operating system, a unified workflow was developed in Python, which automates the entire process: from feature generation to final segmentation. The elimination of dependence on external software made it possible to implement a more efficient, replicable, and adaptable workflow, which is essential for the systematic processing of heterogeneous datasets in the context of Architectural Heritage.
Operationally, the research started with the selection of a specific dataset for experimentation. In particular, the scientific collaboration between the Department of Civil, Construction and Environmental Engineering (DICEA), the Department of Architecture (DiARC) of the University of Naples Federico II and the Religious Provinces of the Monastic Order of St. Francis in Campania led to the construction of a dataset dedicated to the cloister typology (Figure 7). This choice represents an ideal compromise between the geometric variety typical of historical architecture and a certain degree of standardization.
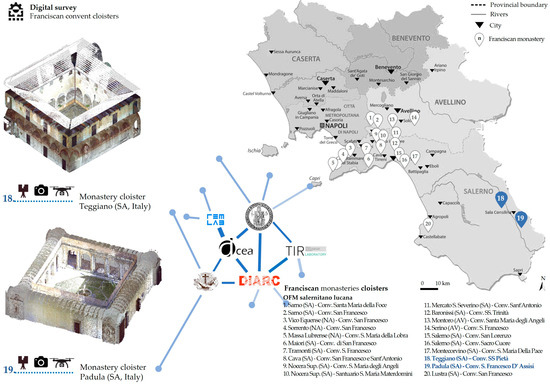
Figure 7.
As part of a census of Franciscan monasteries, the image shows the selected monasteries in the Salerno-Lucania province that were the subject of the integrated digital survey campaign. In blue, two of the case studies are highlighted.
The work began by examining the religious architecture of the Province of Salerno-Lucania. Starting from a mapping and census of the convents belonging to the Order of Friars Minor, an extensive digital survey campaign was conducted. For each case study, the digitization was performed by combining range-based techniques with TLS and image-based techniques with both terrestrial and aerial acquisitions.
Specifically, phase-modulated static LiDARs were used to record the morphometric data of the various architectural complexes at ground level, with particular attention to some environments representative of the religious confession, such as the church and cloister, the latter being the object of specific analysis.
The acquired data is characterized by an average accuracy of approximately 0.02 m, with color maps discretized in a network of points with a maximum distance of 5 mm over 5 m. At the same time, photograms were captured with Reflex cameras for the frescoed apparatus decorating the aforementioned environments, in order to perfect the relative colorimetric data. In this case, the discretization respected a GSD of 0.16 cm/pix. Finally, the survey campaign was completed with an aerial photogrammetric survey with a prosumer drone, in order to also find information on the coverage systems of the observed artifacts. The integration of the different information resources allowed us to prepare a data set that, evidently, is characterized by an irregular and differentiated density of point clouds, but which was useful for the evaluations that will be discussed below.
Once processed, the point clouds were subjected to a manual annotation process (Figure 8), involving the students of the II level Master’s Degree “BIM and Sustainable Integrated Design” of the University of Naples Federico II as annotators. Specifically, the sample of annotators was composed of 7 specialists in the architectural domain, differentiated by age, years of experience, and specific training. The experts involved, in fact, have a seniority that varies from 28 to 54 years, related to a professional experience accumulated in a minimum of 3 years to a maximum of 20 years. Although they are all experts in the architectural domain, the annotators attest to a training that ranges from the architectural field itself to that of civil or building engineering, which was followed by a specialization in specific aspects ranging from restoration to design and structural analysis.
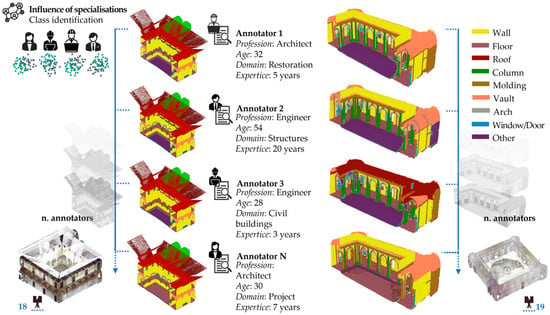
Figure 8.
Comparison between manual segmentations of the same point cloud portion, highlighting the influence of annotator specialization.
Each expert was asked to annotate sections of point clouds, specifically identifying 10 classes of elements, in line with what was done in the construction of the Arch benchmark, namely: Wall, Floor, Roof, Column, Molding, Vault, Arch, Window/Door, Stairs, and Other. These annotations were used to refine the training phase, improving the recognition of architectural elements and reducing ambiguities and uncertainties typical of specialist interpretation.
3. Discussion and Results
In the initial phase of the work, the ability of the 3DOM model to recognize architectural classes in certain case studies belonging to the Franciscan Order was evaluated.
The model, already trained to classify different architectural types, was applied to a large dataset consisting of TLS point clouds, selected for their high data density.
The results of the annotation of the Franciscan dataset showed a partial recognition of macro-elements in the cloister typology. The segmentation obtained is therefore inaccurate. In fact, classes such as ‘Column’ and ‘Wall’ were identified as unique. The same applies to the classes ‘Molding’ and ‘Window/Door’, which are not distinguishable in the result obtained. A possible cause of these problems is that the algorithm was pre-trained on an annotated dataset not exclusively dedicated to historical cultural heritage, nor specifically related to the architectural typology under analysis.
For these reasons, to answer the research questions formulated in the workflow described above, three fundamental steps of the methodological process were defined to optimize and implement the algorithm of the 3DOM unit and make it more centred on the architectural typology under investigation.
The first step focuses on the impact of the density of the point cloud and the type of sensor used, identifying an optimal density threshold and evaluating the differences between data acquired by laser scanning and aerial photogrammetry (H2 and H3).
Furthermore, the role of manual annotation is examined, highlighting the degree of agreement between annotators and developing a strategy to achieve more consistent segmentation (H1).
Finally, it delves into the implementation, extraction, and selection of geometric features most suitable for class recognition, defining specific criteria for their selection and optimizing the calculation radius to maximize class separability (H4). These steps thus represent the backbone of the study, providing concrete answers to the problems identified and helping to improve the quality and accuracy of the RF segmentation and classification process for the architectural typology under examination.
3.1. The Impact of Dataset Density on Annotation Results
The first step of the study focused on analysing the effects of varying the density of the point clouds and the influence of the type of sensor used. This investigation was conducted because the alignment and registration of point clouds, acquired from different stationary positions, generate irregular geometric structures, lacking a grid and characterized by high density variability. Consequently, subsampling the geometries is crucial in order to be able to determine the maximum density reduction threshold in order to streamline the calculation and speed up the segmentation process.
Therefore, three subsamples were analysed, referring to TLS point cloud portions of the dataset. The first subsampling retains the original density, while the subsequent subsamples present a reduced density, with a step size of 4 cm and 8 cm, respectively.
The clouds were classified using the predictive model obtained from the 3DOM unit study [24]. Subsequently, the analysis was conducted in Python, comparing the number of points correctly recognised and classified against the total number of points for each portion (Figure 9).
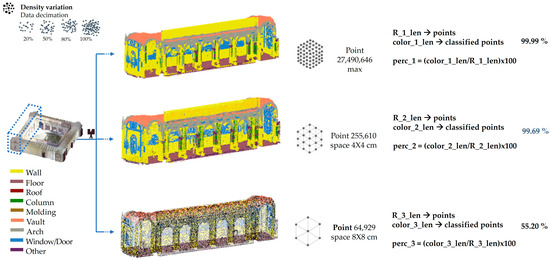
Figure 9.
Comparison between the number of classified points and total points in point cloud portions at different densities acquired by laser scanner. Optimal classification achieved with spacing of 4 × 4 cm (99.69%).
The comparison shows that a significant percentage, 99.69%, of the recognised classes were obtained with the second sub-sampling, characterised by a 4 × 4 cm spacing (Figure 9). While it can be observed that with a greater reduction in density, in the case of the 8 × 8 cm spacing, the percentage of recognised classes decreases significantly, to 55.20%.
This reduction is due to the smaller number of points within each neighbourhood, on which the covariance matrix and, consequently, the geometric features are calculated.
This results in a singular matrix, with an increase in the ‘Nan values’, null values, of the features. With this procedure, the optimal maximum threshold for effective class recognition was thus identified, offering the possibility of considerably streamlining the computational complexity without compromising the results and thus guiding the choice of cloud weight to be used in the processes.
Consequently, it is worth emphasizing the importance of accurate planning of digital survey procedures, as this is crucial for obtaining data at an adequate resolution for the calculation of geometric and radiometric features, thus ensuring consistent identification of architectural components and sub-components. Furthermore, well-structured planning allows for the optimization of resources and reduction of error margins, facilitating the accuracy of the final model and its application in subsequent stages of analysis.
In addition, the impact of the sensor type was examined, comparing classification results obtained from point clouds generated by laser scanning and aerial photogrammetry. Even in the case of the cloud obtained by photogrammetry, the classification process showed good results for clouds subsampled with a spacing size of 4 × 4 cm (Figure 10).
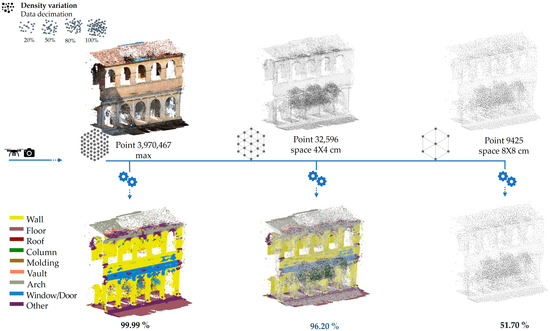
Figure 10.
Comparison of classified versus total points for point clouds acquired via photogrammetry, showing slightly lower accuracy than laser scanning (96.20%).
However, clouds from laser scanning showed a higher percentage of correctly classified points than those from aerial photogrammetry, with 99.69% of points recognized compared to 96.20%. This difference in class identification is mainly due to the photogrammetric acquisition mode.
From the analysis of the results, as already highlighted, in both cases, not all the classes were correctly identified; this is due to the use of a dataset for preliminary training that is not completely congruous with the case study analysed.
For this reason, the need arose to expand and adequately structure the dataset, in order to refine the data on which the training will be carried out and harmonize those manually annotated by the various specialisations considered in this phase.
3.2. Training Dataset Implementation: Evaluation of the Degree of Agreement Between Annotators
In the next phase of the study, the dataset was implemented and expanded with the aim of improving the effectiveness of class recognition. To this end, each TLS cloud was manually segmented by several professionals with different specializations, ranging from heritage restoration to civil and construction engineering. All the selected figures have prior knowledge of architectural and/or engineering principles. In particular, seven Master’s students participated in the annotation process, representing a heterogeneous sample in terms of age and experience (Figure 11).
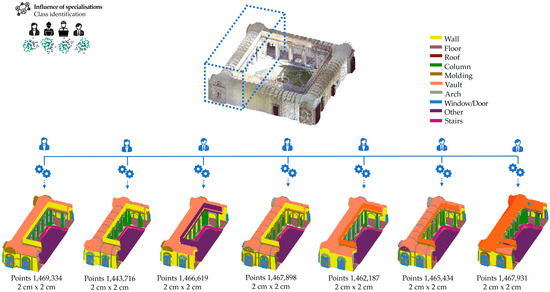
Figure 11.
Point cloud annotations produced by seven annotators with different academic and professional backgrounds. The visible differences between segmentations highlight the high degree of subjectivity in interpreting architectural elements. Furthermore, a variation in the number of classified points is observed for each cloud, due to non-uniform data cleaning operations. These led to the removal of different portions of the point cloud by each annotator, complicating the subsequent comparison phase.
Through the use of the segmentation tools, Segment, Copy and Merge, of the CloudCompare v.2.13.2 software, each student performed the annotation with reference to predefined object classes, such as ‘Wall’, ‘Floor’, ‘Column’, ‘Arch’, ‘Vault’, ‘Window/Door’, ‘Molding’, ‘Roof’, ‘Other’. Each class was subsequently assigned a colour.
The result of this operation produced, as expected, 7 diverse annotations, creating a heterogeneous picture (Figure 11).
In particular, the classes with the greatest ambiguity and variability in the annotations were ‘Column’ and ‘Arc’. In the first case, some annotators included in the definition of Column not only the traditional elements such as shaft, base, and capital, but also pillars and pilasters distributed along the corridors of the cloister. Similarly, for the category ‘Arch’, the geometric boundaries assigned varied from the intrados surface alone to the entire three-dimensional element. In summary, the cultural background, experience, and training of the annotators influenced the selection of geometric portions to be labelled.
These discrepancies guided the next phase of the work, which focused on the critical interpretation of the data collected by the different operators.
The goal was to obtain a more objective annotation of the dataset, reducing the degree of subjectivity in class recognition by assessing the level of agreement between the domain experts. To achieve this goal, a script was developed in Python capable of comparing different annotations and producing a unified annotation.
Observing a variation in the number of points in each annotated portion, probably caused by cleaning operations that make a direct comparison difficult, the comparison was nevertheless carried out by starting with the cloud with the smallest number of points (chunk) and comparing the others, to finally obtain the final cloud. In particular, this is an iterative process in which if a point is not present in even one classified cloud, it is excluded (Figure 12).
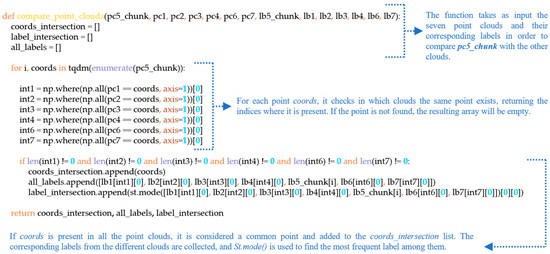
Figure 12.
Python script developed to compare different annotations and generate a unified annotation. The iterative process begins with the point cloud containing the fewest points (pc5_chunk) and compares it to the others, excluding points that are not present in at least one of the classified clouds.
All common points are assigned labels according to the highest frequency in the different annotations, via the ‘st.mode’ function, thus obtaining a point cloud with a higher degree of agreement (Figure 13).
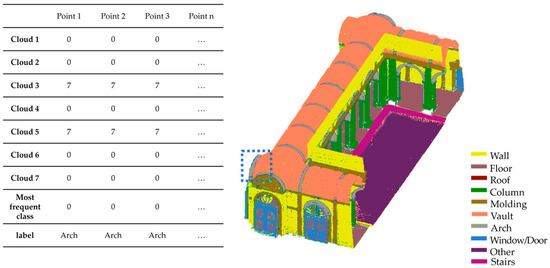
Figure 13.
On the right, the point cloud with the highest level of agreement among annotators, obtained by considering the most frequent label assigned to each point in the different segmented portions. The table on the left exemplifies the process for the portion identified by the blue box.
Next, the degree of agreement between the annotators for each class was analysed, displaying the percentage of agreement via a ‘colour bar’. The results showed that the classes with the highest degree of disagreement were ‘Arc’ and ‘Column’. Specifically, the ‘Arc’ class recorded a 70% disagreement, with only two out of seven annotators assigning the same classification, while the ‘Column’ class recorded a 55% disagreement (Figure 14).
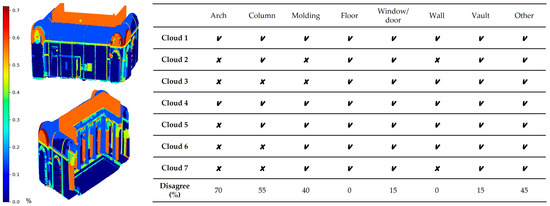
Figure 14.
Level of agreement among annotators for each class. ‘Arch’ (70%) and ‘Column’ (55%) show higher semantic disagreement.
The results show that the training and skills of annotators play a crucial role in the recognition of architectural elements.
Even among experts in the field, there is variation in the attribution of semantics and the definition of geometric boundaries of such elements. This approach aims to reduce disagreement between annotators by homogenising the subjectivity of annotation. The goal is to generate a more objective and consistent annotated cloud, thereby increasing its validity and usefulness for the machine learning process. In this way, we try to overcome the problems related to the interpretive variability of the operators, improving the quality of the training dataset and, consequently, the performance of the predictive model, making the classification process more accurate and robust.
3.3. Calculation of Features and Definition of Radii for Each Class
Class recognition depends crucially on the extraction and selection of features, so it is necessary to think about the possibility of calculating additional features and the impact their choice may have on the final results. So, the next step of the work then focused on the extraction of geometric features and the definition of a guiding criterion for their selection, with the aim of improving the recognition of specific architectural elements. In this phase, several geometric features, already analyzed in the literature, such as verticality, omnivariance, surface variation, and planarity [24], were implemented and transcribed in Python to optimise the process and reduce the need to resort to external software such as Cloud Compare. Starting from the calculation of the surroundings of each point and the covariance matrix, the eigenvectors (e) and eigenvalues (λ) of the matrix were obtained, which, from the definition of each feature, allowed their direct calculation in Python. In addition, new features, including linearity, sphericity, anisotropy, and eigenentropy [38], were introduced to explore the most suitable for the recognition of the selected classes (Figure 15) and to define a corresponding selection criterion (Figure 16).
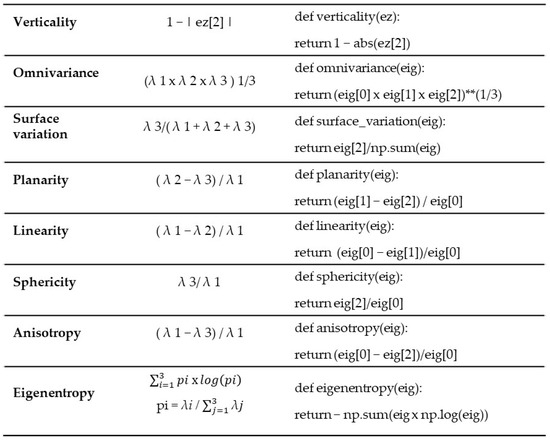
Figure 15.
Geometric features. In the center, the relationships that connect the features to the eigenvalues and eigenvectors of the covariance matrix are shown. On the right, the functions used in the Python script are presented.
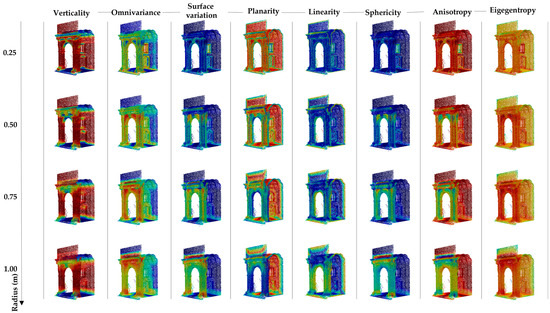
Figure 16.
Calculation of the geometric features of a module of the Franciscan cloister analyzed with four different radii.
The selection of the most appropriate features was based on a criterion involving the analysis of a range of radii specifically calibrated for the architectural context of monastic cloisters. The selected range (from 0.25 m to 1.00 m) was determined by considering the typical dimensional scale of the architectural elements found in these complexes. The minimum radius of 0.25 m was chosen to capture small-scale architectural details, such as Moldings, decorative elements, and surface transitions, while the maximum radius of 1.00 m enables the analysis of medium-scale geometric characteristics, such as Column curvature, Vault profiles, and spatial relationships between adjacent structural elements.
This range allows for the capture of both local details (0.25 m radius) and geometric features that define the overall shape of elements (1.00 m radius), thereby ensuring a multi-scale representation appropriate for the semantic discrimination of various construction categories. Neighborhoods and the covariance matrix were computed for these radii, from which eigenvalues and eigenvectors were derived for the calculation of geometric features (Figure 16).
The preliminary analysis made it possible to visually identify the classes most easily distinguishable on the basis of the features calculated for the different radii selected, which was subsequently deepened through the creation of ‘boxplots’, i.e., a statistical graph summarizing the distribution of a data set.
The selection of the most discriminative features for classifying architectural point clouds requires a methodological approach that goes beyond traditional feature selection techniques [50], which neither quantify the statistical significance of differences between architectural classes nor offer a visual interpretation of feature distributions. To address this methodological gap, the present study adopts an integrated statistical approach that combines p-value analysis with boxplot visualization.
p-values were calculated using Mood’s median test [55], a non-parametric test that compares the medians between pairs of architectural classes. This test was selected due to the nature of the geometric features extracted from point clouds, which often exhibit non-normal distributions and outliers. Prior to applying the test, distribution normality was assessed using the Shapiro-Wilk test [56], confirming the appropriateness of the non-parametric approach for the majority of the features analyzed.
p-values provide an objective measure of the statistical significance of differences in feature distributions across architectural classes, enabling the identification of which geometric characteristics effectively discriminate among elements such as Columns, Walls, and Arches. Simultaneously, boxplot analysis allows for the visualization of distribution, variability, and separability of features across classes, offering an intuitive interpretation of each feature’s discriminative power. This combination of quantitative rigor and visual interpretability is particularly suitable for the field of architectural heritage, where understanding the geometric relationships between structural elements is fundamental for accurate and interpretable classification.
These plots were generated for each feature in relation to the four selected radii, in order to represent the value distribution of each feature across the different classes. Boxplots follow specific interpretive criteria: the wider the box, the greater the variability of that feature within a given class, while the line within the box indicates the median value (Figure 17). Two classes are considered distinguishable when their boxplots occupy different positions along the vertical axis and their medians do not overlap. Conversely, overlapping boxplots with coinciding medians indicate similar distributions and, therefore, low discriminative capacity of the analyzed feature for those specific classes. The visual analysis of boxplots thus enables immediate identification of features that, for specific radii, are effective in separating certain class pairs.
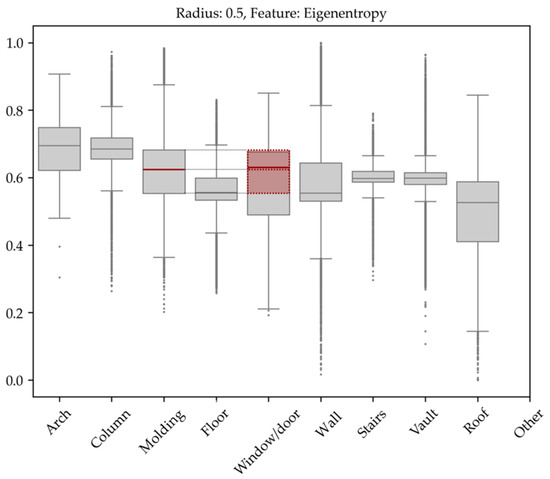
Figure 17.
Boxplot of the eigenentropy feature at a radius of 0.50 m. The red segment represents the median of the values; the red dashed line represents the projection of the ‘Molding’ class box, which overlaps with the ‘Window/Door’ class box. The overlap of the boxes and medians indicates a similar distribution of the feature values. The analyzed feature is not discriminative for the ‘Molding’ and ‘Window/Door’ classes.
To make the procedure faster and more systematic, triangular matrices (Figure 18a) were generated using a statistical approach based on the p-values of each feature. p-values represent the probability of observing the sampled data (or more extreme values) under the null hypothesis that the feature distributions among the different classes are identical. These triangular matrices are intuitively interpreted through a color-coded scheme: low p-values (indicative of significantly different distributions) are shown in blue, while red areas correspond to high p-values, indicating class pairs that cannot be discriminated by the analyzed feature. This color-based representation allows for rapid identification of problematic class-feature combinations where statistical testing confirms the similarity of distributions.
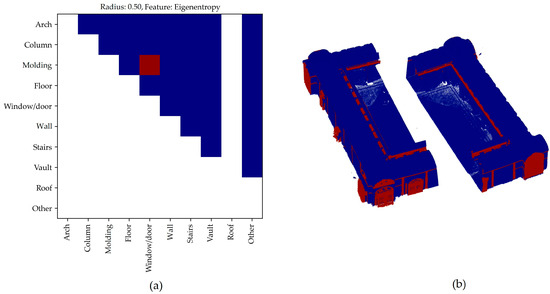
Figure 18.
p-value matrix related to the Eigenentropy feature at a radius of 0.50 m (a). Representation of the point cloud where the classes with feature value distributions that are not distinguishable are highlighted in red (b).
The integrated approach, which combines the visual analysis of boxplots with the statistical quantification provided by triangular matrices, enabled a systematic analysis of all features computed for the four selected radii within the 0.25–1.00 m range (see the Supplementary Materials in Figures S1–S8).
This dual-mode methodology ensures both an intuitive understanding of inter-class relationships (via boxplots) and rigorous statistical validation (via triangular matrices), allowing for precise identification of features that are not useful in discriminating between two or more classes at specific radii (Figure 19).
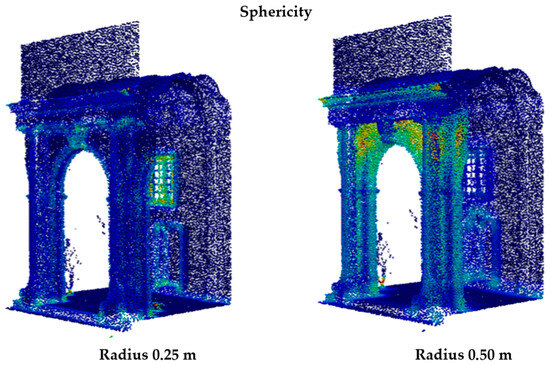
Figure 19.
Example of the Sphericity feature calculated for two radii of 0.25 m and 0.50 m. In the first case, the distinction between the window and the door from the Wall is clearly visible.
This approach effectively addressed previously encountered issues, such as confusion between the ‘Column’ and ‘Wall’ classes, through the identification of the most discriminative features for these specific categories. The effort to improve the recognizability and distinguishability of classes is particularly valuable and meaningful across a variety of application contexts, especially those characterized by diverse cultural heritage and frameworks, where the identification of individual architectural elements serves as a foundation for critical and interpretative analyses.
Accurate predictions by the model can, in fact, facilitate the subsequent development of parametric information models, such as those used in increasingly widespread and necessary Scan-to-BIM processes, for the maintenance of the built heritage and, more broadly, for monitoring its state of conservation.
The implementation carried out using the specific typology of the monastic cloister—as previously noted, chosen for its balanced combination of geometric complexity and formal repetitiveness—makes the approach potentially applicable to a wide range of heritage contexts and typologies. By training the model on a more complex and potentially more inclusive dataset, the likelihood of successful generalization is increased. At the same time, this approach can support a variety of heritage enhancement initiatives, even across different cultural contexts, particularly those that rely on the structuring of information around interactive and exploratory models. These models are semantically segmented, enabling the association of documentary resources with the geometries of three-dimensional representations.
Following this analysis, the optimal radii for each feature were chosen to maximize class separation and improve recognition accuracy:
- Anisotropy (r: 0.25)
- Eigenentropy (r: 0.08–0.10)
- Linearity (r: 0.25)
- Omnivariance (r: 0.10–0.25)
- Planarity (r: 1.2)
- Sphericity (r: 0.15–0.25)
- Surface variation (r: 0.15–0.25)
- Verticality (r: 1.70)
The analysis conducted allowed for the effective identification of the most relevant features for the recognition of architectural classes, optimizing the selection of rays to maximize the separability of the categories analyzed.
Furthermore, the targeted selection of rays highlighted how the scale of analysis significantly affects the ability to distinguish geometries, showing that some features are more effective at smaller scales, while others are more representative at larger scales. This methodological approach thus helped to improve recognition accuracy, providing a solid basis for future developments and refinements of the model.
3.4. Training and Evaluation of Improvement in Class Recognition
After concluding the analyses relating to the dataset and the choice of features, we proceeded with the training phase of the predictive model. The initial dataset chosen consisted of four-point clouds of monastic cloisters, three of which were used to train the model, while the fourth was chosen to validate the model’s performance. The selection of a small number of case studies was motivated by the desire to assess the extent to which this choice could favor the refinement and optimization of the process. And even more so to understand how much and how well RF performs with a small dataset.
In addition, feature calculation and training were performed on a representative module of each cloister, including all classes considered, to reduce calculation times. In addition to geometric features, radiometric features were also calculated and which were also implemented directly in Python. The training process was handled via a script provided by RF4PCC, which was modified by adapting it to the specific case, as all calculations were performed directly in Python.
This study implements an optimized version of the training script for the existing RF4PCC (Random Forest for Point Cloud Classification) framework (Figure 20).
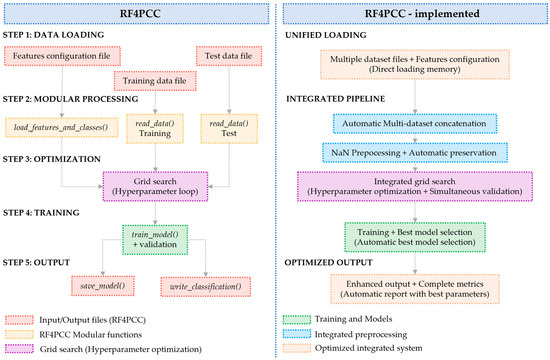
Figure 20.
This flowchart compares two RF4PCC implementation strategies. The modular approach (left) follows a traditional 5-step workflow with separate data loading, individual processing functions, grid search optimization, model training, and distinct output steps. The integrated implementation (right) streamlines the process through unified data loading, automatic preprocessing, simultaneous optimization, and enhanced output generation. Color coding distinguishes processing stages: input/output files (red), modular functions (yellow), optimization (purple), training (green), and integrated systems (blue-orange). While the modular approach offers flexibility, the integrated implementation provides greater efficiency and automation with reduced error potential.
The original RF4PCC script follows a modular design philosophy characterized by the separation of responsibilities through specialized functions (load_features_and_class, read_data, train_model) and the use of external configuration files for dynamic management of features and classification parameters.
This architecture emphasizes flexibility and code reusability through parameterized interfaces and separate input/output handling. However, it requires external configurations and intermediate steps for data management.
The implementation redesigns the original architecture by consolidating the processing logic into an integrated workflow that directly manages multi-dataset loading, preprocessing with preservation of geometric indices, and model optimization in a unified process. This reimplementation offers significant operational advantages over the original approach: it eliminates the computational overhead of intermediate steps, optimizing processing efficiency; it automatically integrates the handling of heterogeneous datasets, reducing configuration complexity; it preserves the correspondence between features and original coordinates, facilitating the geometric analysis of results; and it produces enriched outputs that directly combine predictions with complete spatial information.
Moreover, the linear structure of the workflow simplifies debugging and reduces cognitive load for the end user, while direct in-memory data handling eliminates the intermediate input/output operations required by the original modular implementation. The new implementation retains the methodological robustness of the original RF4PCC approach through systematic model parameter optimization and internal validation techniques, ensuring result comparability. However, it is particularly well-suited to streamlined workflows where computational efficiency and the ability to automatically integrate heterogeneous datasets from different acquisitions are prioritized over the need for dynamic reconfiguration via external files, as required in the original implementation.
During training, the decision trees are constructed on the basis of the calculated features, operating through a series of queries on the data to determine the most probable class for each point, progressively reducing the possibilities through the evaluation of the feature conditions.
At the end of the process, the resulting predictive model was compared to a test dataset to verify its reliability and generalization capability. Specifically, it was tested on two different portions of the point cloud to assess its effectiveness and generalization capability. For the evaluation of the models, the chosen portion was compared with the corresponding manually annotated portion. The number of predictions, correct and incorrect, were reported within the ‘confusion matrix’, where each row of the matrix represents the actual classes (ground truth), while each Column represents the predicted classes. Several accuracy metrics can be derived from the confusion matrix. The first test was performed on a portion partly known to the computer from the dataset used during training (Figure 21).
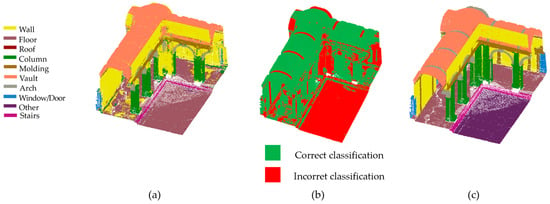
Figure 21.
Classification of the partially known point cloud (a). The incorrectly classified parts are marked in red (b). Ground truth (c).
From the matrix (Figure 22), it emerges that the most robust classes are ‘Floor’, ‘Wall’, and ‘Vault’, showing high performance, with high values along the diagonal of 74,455, 124,020, and 140,747 correctly classified samples, respectively. This result emphasizes that the features used for these classes are well-defined and distinct, making them easily recognizable by the model. However, there are also significant issues related to confusion between certain classes, such as ‘Moldings’ and ‘Wall’, where 48,957 samples were incorrectly classified.
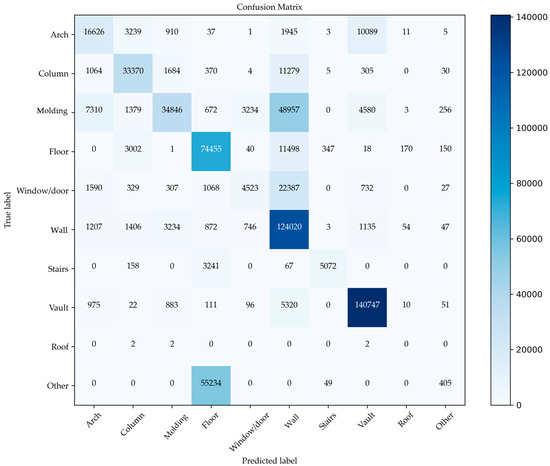
Figure 22.
Confusion matrix for a partially known point cloud. The ‘Floor’, ‘Wall’, and ‘Vault’ classes show high performance with strong diagonal values (e.g., 124,020 for ‘Wall’), while errors are noted between ‘Molding’ and ‘Wall’ (48,957), and ‘Arch’ and ‘Vault’ (10,089).
This is probably due to shared features between the two categories. Another issue is the confusion between ‘Arch’ and ‘Vault’; 10,089 samples of ‘Arch’ were misclassified as ‘Vault’. This confusion is related to the sharing of geometric or structural aspects that the model is unable to distinguish effectively. This could also be due to the still insufficient number of examples in the training dataset.
The second comparison was made with a portion of a cloud that is totally unknown to the computer, to assess the possibility of being able to generalize the model (Figure 23).
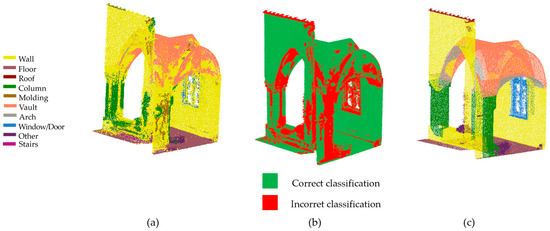
Figure 23.
Classification of an unknown point cloud (a). The incorrectly classified parts are marked in red (b). Ground truth (c).
The ‘confusion matrix’ (Figure 24) shows that the model is able to classify some main classes, such as ‘Floor’, ‘Wall’, and ‘Vault’, with good accuracy, with 20,065, 44,319, and 22,113 correct samples, respectively. This shows an adequate ability to recognize these main categories. However, as in the previous case, there is considerable confusion between the classes ‘Arch’ and ‘Vault’, with 2220 errors, probably due to their geometric and spatial similarities, and between ‘Arch’ and ‘Wall’, with 5920 misidentified points.
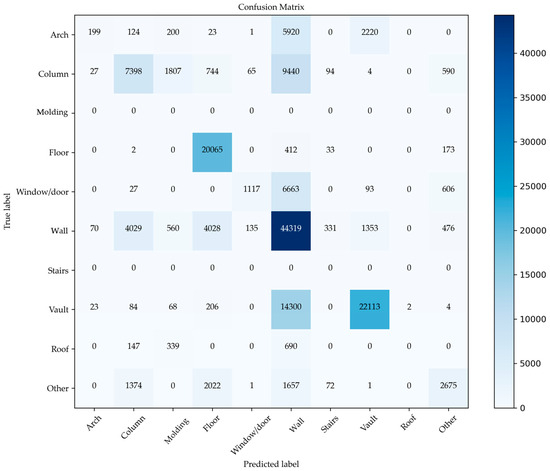
Figure 24.
Confusion matrix for the classification of the completely unknown point cloud. Notable confusion between ‘Arch’ and ‘Vault’ (2220 errors), ‘Arch’ and ‘Wall’ (5920), and ‘Column’ and ‘Wall’ (9440).
Another critical point is marked by the confusion between the classes ‘Column’ and ‘Wall’, with 9440 errors. In addition, some classes, such as ‘Moldings’ and ‘Stairs’, are misclassified due to a lack of training data or a lack of distinctive features to guide the model in their correct identification.
The ‘Other’ class remains problematic. It collects a significant number of samples that should belong to other categories, such as ‘Floor’ (2022 errors) and ‘Column’ (1374 errors). This indicates that the ‘Other’ class is defined too broadly, effectively becoming a catch-all for misclassifications. To address this issue, two main strategies are proposed. The first involves the gradual elimination of the ‘Other’ class by completely removing it from the set of target classes, thereby forcing the model to choose among the available specific categories. Alternatively, a minimum confidence threshold can be implemented: when the model’s prediction falls below this threshold, the sample is labeled as ‘Unclassified’ rather than being automatically assigned to the ‘Other’ class. This approach makes it possible to distinguish between samples that genuinely belong to a residual category and those for which the model exhibits uncertainty.
The second strategy involves the hierarchical subdivision of the ‘Other’ class into more specific and semantically coherent subcategories, such as ‘Urban furniture’ and ‘Vegetation’. This hierarchical classification can be implemented through a two-level approach: the first level identifies the macro-category, while the second level refines the classification within a specific subcategory. Such a method preserves the ability to handle heterogeneous elements while improving semantic specificity and reducing the accumulation of classification errors in the overly generic ‘Other’ class.
At the end of these initial verifications, to be able to analyze the validity of the approach adopted, the predictive model from the previously analyzed 3DOM unit study was used again in relation to the analyzed portion of the cloud (Figure 25).
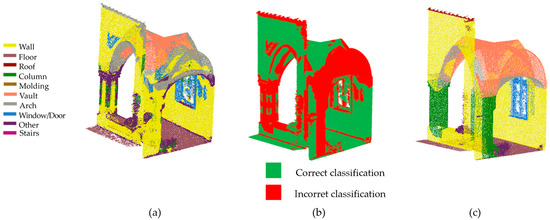
Figure 25.
Classification of an unknown point cloud—RF4PCC predictive model (a). The incorrectly classified parts are marked in red (b). Ground truth (c).
A reading of the matrix (Figure 26) shows that the class ‘Arch’ is correctly labelled for 3466 samples, but for other classes such as ‘Molding’ and ‘Column’, there is a systematic difficulty of the model in recognizing these classes. In fact, the class ‘Column’ has 12,355 points incorrectly labelled as ‘Wall’.
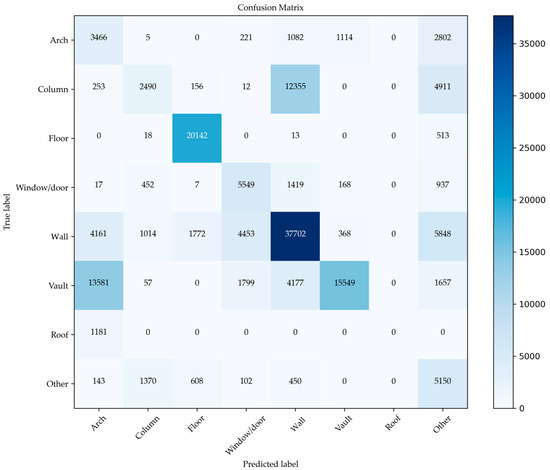
Figure 26.
Confusion matrix for the point cloud classified with RF4PCC. Errors persist between ‘Roof’ and ‘Arch’ (1181) and between ‘Vault’ and ‘Arch’ (13,581). The generic ‘Other’ class gathers many misclassified samples.
Another major problem is the confusion between classes, such as ‘Roof’ and ‘Arch’, with 1181 errors. Likewise, the classes ‘Vault’ and ‘Arch’, with 13,581 errors, could be linked to insufficient criteria for distinguishing the two categories. Furthermore, the class ‘other’ continues to collect a large number of samples belonging to other categories, increasing the error.
To summarize, the class ‘Roof’ in both cases does not present correctly classified samples, and the class ‘Other’, which is too general, collects errors. The class ‘Window/Door’ finds a greater number of recognized samples in the second case, underlining the importance of identifying features that can further facilitate the distinction between the indicated class and the class ‘Wall’, in which more classification errors are present. But it should be emphasized that using the predictive model derived from the new feature selection approach, improvements were obtained in the recognition of the ‘Column’ class, with 7398 correctly classified points compared to 2490, and the ‘Vault’ class, with 22,113 correctly classified points compared to 15,549 (Figure 27).

Figure 27.
Classification of the partially known point cloud (a). Ground truth (b). Classification of an unknown point cloud—RF4PCC predictive model (c).
For a more in-depth study of which features had more value in the training process, a graph was produced (Figure 28) concerning the weights assigned by the computer during the training phase, with respect to each feature and its radii, using the indicator for estimating the RF features_importance.
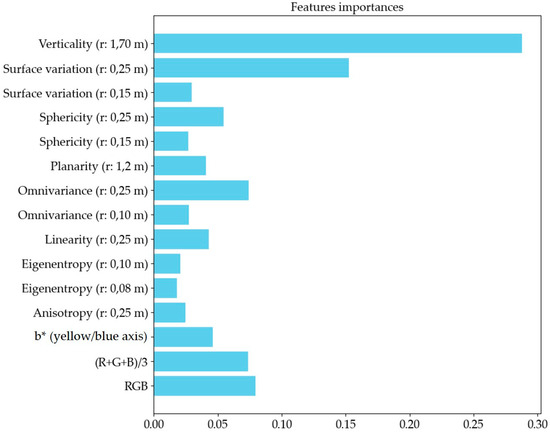
Figure 28.
Feature importance calculation during the training process. Bars represent the weight assigned by the RF model to each feature and its corresponding radius.
This analysis is necessary in order to be able to make improvements to the new feature selection approach, taking into account the most relevant features, so as to be able to extend the reasoning with respect to a more generic view.
Figure 29 presents a detailed comparison between the results obtained using the predictive model of the 3DOM study and those derived from the proposed new approach. The graph is structured as a colour-intensity plot, where the rows represent the different architectural classes analyzed and the Columns indicate the evaluation metrics: precision, recall, and F1-score, calculated separately for both methods.
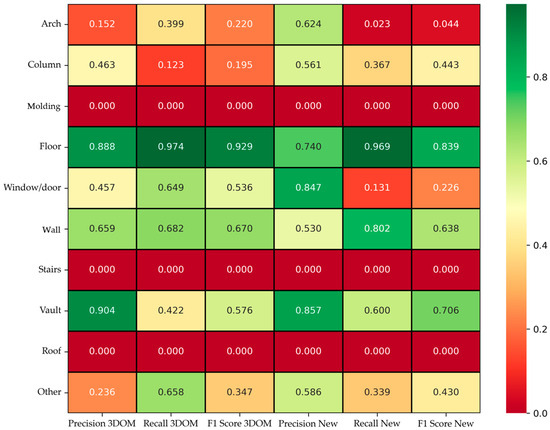
Figure 29.
Comparison of the results obtained using the predictive model derived from RF4PCC and the new approach, through the calculation of evaluation metrics. Green cells indicate good performance, while red cells represent values close to 0, reflecting poor performance.
To interpret these values correctly, one must consider that:
- Precision: indicates the percentage of correctly classified items out of the total number of items that the model predicted to belong to that class. A high value means that the class has few false positives;
- Recall: represents the percentage of elements of a class that the model has actually identified compared to the total number of actual elements belonging to that class. A high value indicates that the class has few false negatives;
- F1-score: is the harmonic mean between precision and recall, providing an overall indication of the model’s effectiveness on a specific class. High values suggest a good balance between precision and recall.
In the graph of Figure 29, the colors help to quickly identify the performance for each class:
- Values close to 1 (in dark green) indicate good model performance for that specific metric and class;
- Intermediate values (in yellow/orange) show moderate performance;
- Low or zero values (in red) indicate poor performance, signaling difficulty in correctly recognizing that class.
Analyzing the table, we see that the new approach shows significant improvements in precision for some classes, such as ‘Vault’ (0.857 compared to 0.904), suggesting greater reliability in recognizing these categories. However, there is a decrease in precision for other classes, such as ‘Window/Door’ (0.457 with 3DOM compared to 0.847 with the new method), suggesting that the new model tends to generate more false positives for these categories.
About Recall, the 3DOM model scores higher in some categories, such as ‘Floor’ (0.974 compared to 0.969), while the new method shows improvements for others, such as ‘Wall’ (0.802 compared to 0.682). A high recall value indicates that the model is able to capture most of the elements belonging to the class but can also lead to an increase in false positives if not balanced by adequate precision.
The F1-score confirms these trends, showing improvements for some classes and decreases for others. However, some categories, such as ‘Molding’, ‘Stairs’, and ‘Roof’, obtain zero values in both models, signaling difficulties in their classification. This could be due to the scarcity of data for these classes, their morphological complexity, or the intrinsic limitations of the models used.
In conclusion, the comparison shows that the new approach brings improvements in some classes, but does not guarantee uniform progress. To optimize the model, it might be useful to better balance the training data or to refine the selection of features used in the classification in order to improve overall performance.
4. Conclusions and Future Developments
This study highlighted the important potential and efficiency of artificial intelligence in the semantic segmentation of point clouds for the recognition of architectural elements. Through the study of specific case studies, such as monastic cloisters, it was possible to develop a methodological approach that optimizes the classification process, addressing the challenges related to the quality and density of the acquired data.
The RF algorithm proved to be an effective choice due to its robustness to noise in the data and its ability to be applied even to a small annotated dataset, showing a good compromise between accuracy and computational complexity. Furthermore, the analysis highlighted the importance of annotation quality (H1) and the optimal point cloud density, which is also related to the type of sensors used (H2 and H3), also showing how the choice of features can significantly impact model quality (H4).
Although the results obtained are promising, this work has highlighted several open challenges. These include the difficulty in distinguishing classes with similar geometries and materials, the heterogeneity in outcomes caused by different acquisition sensors and their respective operational modes, and the influence of subjective manual annotations. Particular attention was given to the issue of the ‘Other’ class, which, functioning as a generic container, compromised the classification accuracy of specific elements such as ‘Floor’ and ‘Column’. Nonetheless, the proposed approach represents a significant step forward in the digitization and valorization of Architectural Heritage, paving the way for new interdisciplinary applications.
To ensure further progress and broaden the applicability of the developed model, it is essential to undertake a few initiatives that can improve generalization, accuracy, and efficiency in different contexts:
- Expansion of the dataset: diversification of the data will increase the model’s ability to adapt to a variety of architectural contexts, thereby improving the generalization of the model.
- Optimization of the features used: the inclusion of metrics that better reflect the peculiarities of the materials and geometries specific to the historic heritage will help to develop a more accurate and reliable segmentation.
- Interdisciplinary collaboration: the involvement of experts in historical conservation, archaeologists, computer scientists, etc., will favour an integrated approach that guarantees not only technically advanced results, but also full applicability in operational contexts.
This work lays the foundation for a more structured and technologically advanced approach to the management and modeling of cultural heritage. The study conducted on the architectural typology under examination enabled the implementation of the recognition algorithm, enhancing its predictive accuracy. The improved ability of the predictive model to label different architectural classes more effectively may prove beneficial for its application in other contexts where the identification of architectural components serves as a foundational step in interpretative processes. The potential to evolve toward increasingly specific and detailed classifications opens up innovative prospects for the documentation, stylistic analysis, and conservation of historical architecture. It contributes to the valorization of cultural heritage through the innovative use of artificial intelligence and three-dimensional acquisition technologies.
Supplementary Materials
The following supporting information can be downloaded from: https://www.mdpi.com/article/10.3390/heritage8070265/s1, Figures S1–S4: boxplots for the other features calculated at each of the four selected radii (0.25 m, 0.50 m, 0.75 m, 1.00 m) are shown, illustrating the variability of class distributions; Figures S5–S8: p-value matrix for the other features calculated at each of the four selected radii (0.25 m, 0.50 m, 0.75 m, 1.00 m) are shown, illustrating the variability of class distributions.
Author Contributions
This paper resulted from the authors’ joint research work. The specific written contributions of the authors are as follows: “Conceptualization, V.C., G.A., M.C. and P.D.; methodology, V.C. and G.A.; software, V.C. and G.A.; validation, M.C. and P.D.; formal analysis, V.C. and G.A.; investigation, V.C. and G.A.; resources, V.C. and G.A.; data curation, V.C. and G.A.; writing—original draft preparation, V.C. and G.A.; writing—review and editing, V.C., G.A., M.C. and P.D.; visualization, V.C. and G.A.; supervision, M.C. and P.D.; project administration, V.C. and G.A. In particular, the contribution texts are so attributed among the authors: State of the Art Section, Section 3.1 and Section 3.3 to V.C.; Section 2, Section 3.2 and Section 3.4 to G.A.; Section 4 to M.C.; Section 1 to P.D.; Section 3 to M.C. and P.D. The graphic elaborations are by V.C. and G.A. All authors have read and agreed to the published version of the manuscript.
Funding
This research received no external funding.
Data Availability Statement
The most important data presented in this study are available within the article, while the in-depth analysis of the data used and/or analyzed during the current study is available from the corresponding author on reasonable request.
Acknowledgments
The authors would like to thank Daniela Ciarlo for the support provided during the operational phases of the analysis, and Raffaele Alfano, Marco Cantelmi, and Michele Sanseviero for their collaboration during the activities carried out as part of a research project launched in 2024. The project was made possible thanks to the agreement signed between the Department of Architecture and the Department of Civil, Construction and Environmental Engineering of the University of Naples Federico II and the Religious Provinces of the Franciscan Order in Campania, whose scientific coordinators are G. Antuono and V. Cera.
Conflicts of Interest
The authors declare no conflict of interest. They facilitated the access and acquisition of the data and had no role in the design of the study, the collection, analysis, or interpretation of the data, the drafting of the manuscript, or the decision to publish the results.
References
- Brar, K.K.; Goyal, B.; Dogra, A.; Mustafa, M.A.; Majumdar, R.; Alkhayyat, A.; Kukreja, V. Image segmentation review: Theoretical background and recent advances. Inf. Fusion 2025, 114, 102608. [Google Scholar] [CrossRef]
- Antuono, G.; Elefante, E.; Vindrola, P.G.; D’Agostino, P. A methodological approach for an Augmented HBIM experience the architectural thresholds of the Mostra d’Oltremare. Int. Arch. Photogramm. Remote Sens. Spat. Inf. Sci. 2024, XLVIII-2/W4-2024, 9–16. [Google Scholar] [CrossRef]
- Grilli, E.; Teruggi, S.; Fassi, F.; Remondino, F.; Russo, M. Approccio gerarchico di machine learning per la segmentazione semantica di nuvole di punti 3D. Boll. Della Soc. Ital. Fotogramm. Topogr. 2020, 1, 38–46. [Google Scholar]
- Malinverni, E.S.; Pierdicca, R.; Paolanti, M.; Martini, M.; Morbidoni, C.; Matrone, F.; Lingua, A. Deep Learning for Semantic Segmentation of 3D Point Cloud. Int. Arch. Photogramm. Remote Sens. Spat. Inf. Sci. 2019, XLII-2/W15, 735–742. [Google Scholar] [CrossRef]
- Cera, V.; Campi, M. Segmentation protocols in the digital twins of monumental heritage: A methodological development. Disegnarecon 2021, 14, 14.1–14.10. [Google Scholar] [CrossRef]
- Xie, Y.; Tian, J.; Zhu, X.X. Linking Points with Labels in 3D: A Review of Point Cloud Semantic Segmentation. IEEE Geosci. Remote Sens. Mag. 2020, 8, 38–59. [Google Scholar] [CrossRef]
- Gaber, J.A.; Youssef, S.M.; Fathalla, K.M. The Role of Artificial Intelligence and Machine Learning in preserving Cultural Heritage and Art Works via Virtual Restoration. ISPRS Ann. Photogramm. Remote Sens. Spat. Inf. Sci. 2023, 10, 185–190. [Google Scholar] [CrossRef]
- Gîrbacia, F. An Analysis of Research Trends for Using Artificial Intelligence in Cultural Heritage. Electronics 2024, 13, 3738. [Google Scholar] [CrossRef]
- Yang, S.; Hou, M.; Li, S. Three-Dimensional Point Cloud Semantic Segmentation for Cultural Heritage: A Comprehensive Review. Remote Sens. 2023, 15, 548. [Google Scholar] [CrossRef]
- Grilli, E.; Özdemir, E.; Remondino, F. Application of Machine and Deep Learning strategies for the classification of Heritage point clouds. Int. Arch. Photogramm. Remote Sens. Spat. Inf. Sci. 2019, XLII-4/W18, 447–454. [Google Scholar] [CrossRef]
- Guo, Y.; Wang, H.; Hu, Q.; Liu, H.; Liu, L.; Bennamoun, M. Deep Learning for 3D Point Clouds: A Survey. IEEE Trans. Pattern Anal. Mach. Intell. 2021, 43, 4338–4364. [Google Scholar] [CrossRef]
- Matrone, F.; Grilli, E.; Martini, M.; Paolanti, M.; Pierdicca, R.; Remondino, F. Comparing Machine and Deep Learning Methods for Large 3D Heritage Semantic Segmentation. ISPRS Int. J. Geo-Inf. 2020, 9, 535. [Google Scholar] [CrossRef]
- Morbidoni, C.; Pierdicca, R.; Paolanti, M.; Quattrini, R.; Mammoli, R. Learning from Synthetic Point Cloud Data for Historical Buildings Semantic Segmentation. J. Comput. Cult. Herit. 2020, 13, 34. [Google Scholar] [CrossRef]
- Yang, X.; del Rey Castillo, E.; Zou, Y.; Wotherspoon, L. Semantic segmentation of bridge point clouds with a synthetic data augmentation strategy and graph-structured deep metric learning. Autom. Constr. 2023, 150, 104838. [Google Scholar] [CrossRef]
- Ma, J.W.; Czerniawski, T.; Leite, F. Semantic segmentation of point clouds of building interiors with deep learning: Augmenting training datasets with synthetic BIM-based point clouds. Autom. Constr. 2020, 113, 103144. [Google Scholar] [CrossRef]
- Battini, C.; Ferretti, U.; De Angelis, G.; Pierdicca, R.; Paolanti, M.; Quattrini, R. Automatic generation of synthetic heritage point clouds: Analysis and segmentation based on shape grammar for historical Vaults. J. Cult. Herit. 2024, 66, 37–47. [Google Scholar] [CrossRef]
- Zhuheng, L.; Peng, Z.; Yuewei, D.; Weiqing, L.; Zhiyong, S. Hypergraph convolutional network based weakly supervised point cloud semantic segmentation with scene-level annotations. Neurocomputing 2025, 620, 129264. [Google Scholar] [CrossRef]
- Xiaoyong, Z.; Shan, M.; Xiuhuan, F.; Weiying, D. Urban Architectural Landscape Recognition Based on Deep Convolutional Neural Networks and LiDAR. Comput.-Aided Des. Appl. 2025, 22, 259–271. [Google Scholar] [CrossRef]
- Wu, W.; Qi, Z.; Fuxin, L. PointConv: Deep Convolutional Networks on 3D Point Clouds. In Proceedings of the 2019 IEEE/CVF Conference on Computer Vision and Pattern Recognition (CVPR), Long Beach, CA, USA, 16–20 June 2019; pp. 9613–9622. [Google Scholar] [CrossRef]
- Teruggi, S.; Grilli, E.; Russo, M.; Fassi, F.; Remondino, F. A hierarchical machine learning approach for multi-level and multi-resolution 3D point cloud classification. Remote Sens. 2020, 12, 2598. [Google Scholar] [CrossRef]
- Ni, H.; Lin, X.; Zhang, J. Classification of ALS point cloud with improved point cloud segmentation and random forests. Remote Sens. 2017, 9, 288. [Google Scholar] [CrossRef]
- Gil, A.; Arayici, Y. Point Cloud Segmentation Based on the Uniclass Classification System with Random Forest Algorithm for Cultural Heritage Buildings in the UK. Heritage 2025, 8, 147. [Google Scholar] [CrossRef]
- Xue, D.; Cheng, Y.; Shi, X.; Fei, Y.; Wen, P. An Improved Random Forest Model Applied to Point Cloud Classification. IOP Conf. Ser. Mater. Sci. Eng. 2020, 768, 072037. [Google Scholar] [CrossRef]
- Grilli, E.; Remondino, F. Machine Learning Generalisation across Different 3D Architectural Heritage. ISPRS Int. J. Geo-Inf. 2020, 9, 379. [Google Scholar] [CrossRef]
- Arch dataset. Architectural Cultural Heritage Point Clouds for Classification and Semantic Segmentation. Available online: https://archdataset.polito.it/ (accessed on 20 May 2025).
- Matrone, F.; Lingua, A.; Pierdicca, R.; Malinverni, E.S.; Paolanti, M.; Grilli, E.; Remondino, F.; Murtiyoso, A.; Landes, T. A benchmark for large-scale heritage point cloud semantic segmentation. Int. Arch. Photogramm. Remote Sens. Spat. Inf. Sci. 2020, XLIII-B2, 1419–1426. [Google Scholar] [CrossRef]
- Kim, H.; Hilton, A. Influence of Colour and Feature Geometry on Multi-modal 3D Point Clouds Data Registration. In Proceedings of the 2014 2nd International Conference on 3D Vision, Tokyo, Japan, 8–11 December 2014; pp. 202–209. [Google Scholar] [CrossRef]
- De Geyter, S.; Vermandere, J.; De Winter, H.; Bassier, M.; Vergauwen, M. Point Cloud Validation: On the Impact of Laser Scanning Technologies on the Semantic Segmentation for BIM Modeling and Evaluation. Remote Sens. 2022, 14, 582. [Google Scholar] [CrossRef]
- Kavulya, G.; Jazizadeh, F.; Becerik-Gerber, B. Effects of Color, Distance, And Incident angle on Quality of 3D point clouds. Comput. Civ. Eng. 2011, 2011, 169–177. [Google Scholar] [CrossRef]
- Murtiyoso, A.; Grussenmeyer, P. Automatic heritage building point cloud segmentation and classification using geometrical rules. Int. Arch. Photogramm. Remote Sens. Spat. Inf. Sci. 2019, XLII-2/W15, 821–827. [Google Scholar] [CrossRef]
- Grilli, E.; Remondino, F. Classification of 3D digital heritage. Remote Sens. 2019, 11, 847. [Google Scholar] [CrossRef]
- Spina, S.; Debattista, K.; Bugeja, K.; Chalmers, A. Point cloud segmentation for cultural heritage sites. In VAST’11, Proceedings of the 12th International Conference on Virtual Reality, Archaeology and Cultural Heritage, Prato Italy, 18–21 October 2011; Dellepiane, M., Niccolucci, F., Pena Serna, S., Rushmeier, H., Van Gool, L., Eds.; Eurographics Association: Goslar, Germany, 2011; pp. 41–48. [Google Scholar] [CrossRef]
- Manuel, A.; M’Darhri, A.A.; Abergel, V.; Rozar, F.; De Luca, L. A semi-automatic 2D/3D annotation framework for the geometric analysis of heritage artefacts. In Proceedings of the 2018 3rd Digital Heritage International Congress (DigitalHERITAGE) Held Jointly with 2018 24th International Conference on Virtual Systems & Multimedia (VSMM 2018), San Francisco, CA, USA, 26–30 October 2018; pp. 1–7. [Google Scholar] [CrossRef]
- Pellis, E.; Murtiyoso, A.; Masiero, A.; Tucci, G.; Betti, M.; Grussenmeyer, P. An image-based Deep Learning workflow for 3D Heritage point cloud semantic segmentation. Int. Arch. Photogramm. Remote Sens. Spat. Inf. Sci. 2022, XLVI-2/W1-2022, 429–434. [Google Scholar] [CrossRef]
- Campi, M.; Cera, V. Approcci H-BIM e Semantica: Riflessioni e stato dell’arte sulla classificazione delle informazioni. In BIM VIEWS Esperienze e Scenari; Papa, L.M., D’Agostino, P., Eds.; CUA Cooperativa Universitaria Athena: Fisciano, Italy, 2019; pp. 165–174. [Google Scholar]
- Lo Buglio, D.; Lardinois, V.; De Luca, L. What do thirty-one Columns say about a “theoretical” thirty-second? J. Comput. Cult. Herit. 2015, 8, 6. [Google Scholar] [CrossRef]
- Cera, V. Semantics and Architecture: Reflections and Method Proposal for the Recognition of Semantically-Defined Architectural Forms. In Impact of Industry 4.0 on Architecture and Cultural Heritage; Bolognesi, C.M., Santagati, C., Eds.; IGI Global: Hershey, PA, USA, 2020; pp. 330–356. [Google Scholar] [CrossRef]
- De Luca, L. Relevè et Multi-Represèesentations du Patrimoine Architectural. Dèfinition D’une Approche Hybride Pour la Reconstruction 3D D’edifices. Ph.D. Thesis, Arts et Métiers, Ecole Nationale Supérieure d’Arts et Métiers, Centre d’Aix-en-provence, Aix-en-Provence, France, 2006. [Google Scholar]
- Cera, V. La significazione digitale dell’elemento architettonico. In Dal Rilievo alla Strutturazione Semantica dell’Architettura; Editori Paparo srl: Roma, Italy, 2019; pp. 269–279. [Google Scholar]
- Harshit, H.; Kushwaha, S.K.P.; Jain, K. Geometric Features Interpretation of Photogrammetric Point Cloud from Unmanned Aerial Vehicle. ISPRS Ann. Photogramm. Remote Sens. Spat. Inf. Sci. 2022, 10, 83–88. [Google Scholar] [CrossRef]
- Weinmann, M.; Jutzi, B.; Mallet, C. Feature Relevance Assessment for the Semantic Interpretation of 3D Point Cloud Data. ISPRS Ann. Photogramm. Remote Sens. Spat. Inf. Sci. 2013, II-5-W2, 313–318. [Google Scholar] [CrossRef]
- Jutzi, B.; Gross, H. Nearest Neighbour Classification on Laser Point Clouds to Gain Object Structures from Buildings. Int. Arch. Photogramm. Remote Sens. Spat. Inf. Sci. 2009, XXXVIII-1-4-7/W5, 4–7. [Google Scholar]
- Mallet, C.; Bretar, F.; Roux, M.; Soergel, U.; Heipke, C. Relevance assessment of full-waveform lidar data for urban area classification. ISPRS J. Photogramm. Remote Sens. 2011, 66, S71–S84. [Google Scholar] [CrossRef]
- Toshev, A.; Mordohai, P.; Taskar, B. Detecting and parsing architecture at city scale from range data. In Proceedings of the IEEE Conference on Computer Vision and Pattern Recognition, San Francisco, CA, USA, 13–18 June 2010; pp. 398–405. [Google Scholar] [CrossRef]
- West, K.F.; Webb, B.N.; Lersch, J.R.; Pothier, S.; Triscari, J.M.; Iverson, A.E. Context-driven automated target detection in 3D data. In Proceedings of the SPIE The International Society for Optical Engineering, Orlando, FL, USA, 12–16 April 2004; Volume 5426, pp. 133–143. [Google Scholar] [CrossRef]
- Pierdicca, R.; Paolanti, M.; Matrone, F.; Martini, M.; Morbidoni, C.; Malinverni, E.S.; Frontoni, E.; Lingua, A.M. Segmentazione semantica delle nuvole di punti utilizzando tecniche di apprendimento profondo per il patrimonio culturale. Boll. Della Soc. Ital. Fotogramm. Topogr. 2021, 1, 1–9. [Google Scholar]
- Buldo, M.; Agustín-Hernández, L.; Verdoscia, C. Semantic Enrichment of Architectural Heritage Point Clouds Using Artificial Intelligence: The Palacio de Sástago in Zaragoza, Spain. Heritage 2024, 7, 6938–6965. [Google Scholar] [CrossRef]
- Grilli, E. Metodi di classificazione automatica texture e geometry-based applicati a beni culturali. Boll. Della Soc. Ital. Fotogramm. Topogr. 2019, 1, 8–16. [Google Scholar]
- Morbidoni, C.; Pierdicca, R.; Paolanti, M.; Quattrini, R.; Mammoli, R. Approcci deep learning su nuvole di punti sintetiche per la segmentazione semantica di edifici monumentali storici. Boll. Della Soc. Ital. Fotogramm. Topogr. 2020, 1, 27–37. [Google Scholar]
- Guyon, I.; Elisseeff, A. An introduction to variable and feature selection. J. Mach. Learn. Res. 2003, 3, 1157–1182. [Google Scholar] [CrossRef][Green Version]
- Moyano, J.; Musicco, A.; Nieto-Juliàn, J.E.; Domìnguez-Morales, J.P. Geometric characterization and segmentation of historic buildings using classification algorithms and convolutional networks in HBIM. Autom. Constr. 2024, 167, 105728. [Google Scholar] [CrossRef]
- Biau, G.; Scornet, E. A Random Forest Guided Tour. TEST 2016, 25, 197–227. [Google Scholar] [CrossRef]
- 3DOM-FBK/RF4PCC. Available online: https://github.com/3DOM-FBK/RF4PCC (accessed on 2 September 2024).
- CloudCompare. 3D Point Cloud and Mesh Processing Software Open Source Project. Available online: https://www.danielgm.net/cc/ (accessed on 20 May 2025).
- Mood, A.M. Introduction to the Theory of Statistics; McGraw-Hill: New York, NY, USA, 1950. [Google Scholar]
- Shapiro, S.S.; Wilk, M.B. An analysis of variance test for normality (complete samples). Biometrika 1965, 52, 591–611. [Google Scholar] [CrossRef]
Disclaimer/Publisher’s Note: The statements, opinions and data contained in all publications are solely those of the individual author(s) and contributor(s) and not of MDPI and/or the editor(s). MDPI and/or the editor(s) disclaim responsibility for any injury to people or property resulting from any ideas, methods, instructions or products referred to in the content. |
© 2025 by the authors. Licensee MDPI, Basel, Switzerland. This article is an open access article distributed under the terms and conditions of the Creative Commons Attribution (CC BY) license (https://creativecommons.org/licenses/by/4.0/).