Article

HBIM-Based Multicriteria Method for Assessing Internal Insulation in Heritage Buildings

Department of Architecture, University of Bologna, 40136 Bologna, Italy
*
Author to whom correspondence should be addressed.
Heritage 2025, 8(7), 259; https://doi.org/10.3390/heritage8070259
Submission received: 23 May 2025 / Revised: 16 June 2025 / Accepted: 27 June 2025 / Published: 1 July 2025

Abstract

Energy retrofitting of historic buildings presents complex challenges, particularly when using internal insulation strategies. While such interventions can enhance thermal comfort and reduce energy demand, they can also pose risks of condensation and mold formation, thereby reducing usable space. This paper proposes an evaluation methodology for assessing the performance of internal insulating panels within a multicriteria framework to support decision-making during the design phase. The approach, scalable to various contexts, is grounded in a digital workflow that integrates heritage building information modeling (HBIM), visual programming (VP), and building energy modeling (BEM) to create a decision-support tool for renovation designers. The methodology, tested on a building located in Bologna (Italy), allows for assessing internal insulation systems with varying thermophysical properties and performance characteristics, and evaluating how they affect space- and wall-level key performance indicators, including condensation risk, energy efficiency improvement, and usable space reduction. The research was conducted under the Horizon Europe HERIT4AGES project, which aims to develop reversible, innovative insulation panels fabricated from local and recycled materials for historic building retrofitting.

1. Introduction

The built environment stands at the intersection of numerous policies and European Directives and initiatives, including the Energy Performance of Buildings Directive (EPBD) and Energy Efficiency Directive (EED), the European Green Deal [1], the Renovation Wave [2], and the New European Bauhaus [3], serving as an essential field for achieving a growing range of EU targets. However, according to the Built4People Agenda 2021–2027 [4], this sector currently faces three significant challenges. First, there is an absence of integrated, systemic approaches that consider the entire life cycle of buildings. Second, the construction sector continues to contribute significantly to carbon emissions and environmental impact. Third, there is a low uptake of transformative, long-lasting solutions.
When addressing the built cultural heritage, these challenges become even more complex. Although upgrading such buildings is crucial for their preservation, multiple issues should be considered during energy renovation design. Historic buildings were originally built to accommodate past lifestyles and uses, employing construction techniques that are now outdated. These structures frequently prove incompatible with contemporary functional requirements. Furthermore, conventional energy retrofit interventions, such as external insulation, may fail to preserve the inherent aesthetic and cultural value of these architectures [5,6,7,8]. Reversible, low-disruption solutions that are also cost-effective are essential. Moreover, digitalization could offer significant potential to enhance monitoring, management, and operation, ultimately linking energy savings with reduced maintenance costs and better preservation outcomes [9].
One suitable solution for enhancing the energy performance of opaque envelopes while preserving their external aesthetics is the application of internal insulation [10]. This technique effectively reduces the thermal transmittance of the building envelope; however, it presents a complex balance of advantages and disadvantages that must be evaluated during the design phase.
Internal insulation is particularly beneficial because it allows the original external façade to remain unaltered, thereby maintaining its historic character. Moreover, it permits the insulation of individual apartments or sections in a phased manner, which can eliminate the need for extensive scaffolding during renovations. When installed correctly, internal insulation can also enhance indoor thermal comfort by reducing heat loss and mitigating temperature fluctuations [10]. Conversely, introducing internal insulation can significantly alter the hygrothermal balance of walls. Such alterations may lead to condensation and moisture accumulation, conditions that promote mold growth and potentially cause structural damage. Insulation discontinuity, especially at junctions such as those between floor beams and partition walls, can create thermal bridges that result in localized heat loss and condensation issues [11]. Furthermore, modifying the thermal dynamics of historic walls may accelerate the degradation of original materials, as variations in temperature and moisture can hurt their conservation. An additional concern is the reduction in usable floor area, a factor that is particularly critical in small rooms and can lower the commercial value of the building.
Given these multifaceted considerations, conducting a thorough assessment, including hygrothermal simulations and material compatibility studies, is essential before implementing internal insulation in historic buildings to ensure that improvements in energy efficiency do not compromise the material integrity of these culturally significant structures.
Funded by the European Commission, the Horizon Europe project “HERIT4AGES” (“User-centric and data-driven retrofitting solutions for a resilient, energy efficient, low-emission and inclusive cultural heritage”, Grant Agreement: 101123175) has been advanced within this requirement framework [12]. Among its many objectives, the project aims to develop innovative solutions that enhance the energy efficiency of historic buildings while safeguarding their architectural and cultural features. One of the solutions explored in the project involves installing insulating panel modules on the interior, assembled using dry methods and designed to be fully reversible.
Within this broad project, this paper illustrates a method for assessing the impacts of internal insulation strategies from a multicriteria perspective. The assessment methodology relies on parametric algorithms integrating various digital tools to support designers throughout the analysis and project development phases, in line with specific performance and architectural requirements. The process begins with surveying the building’s geometric features using terrestrial laser scanning (TLS) technology, whose output point cloud is imported into a BIM environment to manually create a heritage building information model (HBIM) based on accurate geometric data. This model, enriched with information relevant to energy simulations (i.e., material and thermal characteristics of envelope elements, occupancy, HVAC, and lighting requirements of the space, thermal setpoints of main zones, etc.), allows for the generation of a building energy model (BEM) representing the current state of the building. Next, the model is modified by adding the insulation panels, each defined by a range of geometric, construction, and performance parameters. By setting numerical targets for the desired final performance, the algorithm identifies and compares multiple design solutions for enhancing the building envelope through a multicriteria optimization process that enables the identification of various project priorities and the comparison of different design options. The workflow, implemented in a visual programming (VP) environment, makes the analysis applicable in other contexts with only minor adjustments, offering a robust framework for optimizing renovation design and its decision-making processes. The method is demonstrated in one of the pilot cases of the project: the Faculty of Engineering of the University of Bologna (Italy), a historic building designed by the architect Giuseppe Vaccaro in the 1930s [13].
The contribution of this work is the development of a simulation-driven evaluation methodology for internal insulation strategies in historic buildings, which utilizes clustering techniques to identify typological solutions and inform design decisions within a multicriteria framework. The methodology is seamlessly integrated into a parametric HBIM–VP–BEM workflow and supported by custom-developed software components compliant with UNI standards for energy performance and condensation risk analysis.
This paper is structured as follows. Section 2 presents the materials and methods employed in the study. After outlining the research context and describing the case study under consideration, the digital workflow implemented for assessing internal insulation strategies is detailed. In Section 3, the algorithm is applied to the case study, and the results of the parametric multicriteria analysis are reported. Section 4 discusses these results by contextualizing the findings within the case study and examining the selection of intervention strategies in relation to selected key performance indicators. Finally, Section 5 summarizes the study’s conclusions and identifies future developments, referencing them within the broader research framework of the HERIT4AGES project.

2. Background

2.1. The HERIT4AGES Project

The HERIT4AGES project originates from the need to adapt built heritage to contemporary environmental, economic, and societal challenges. It is premised on the notion that resilient cultural built environments should offer opportunities comparable to those provided by modern constructions. These environments must ensure optimal comfort and a healthy living experience for occupants while remaining affordable and accessible. Moreover, they should be digitally and technologically equipped, with Internet of Things (IoT) functionalities, to contribute to EU and global decarbonization targets.
The HERIT4AGES consortium, composed of 12 partners, integrates a broad spectrum of complementary expertise to address its key target solutions. This expertise encompasses the development of digital solutions, sensor technologies, heritage conservation, and energy monitoring systems, as well as the creation of innovative recycled materials through specialized laboratories. In addition, the consortium brings together proficiencies in policy development, citizen engagement, business model innovation, and universal design oriented towards co-creation practices.
The HERIT4AGES team aims to develop and validate various technical and social solutions to enhance and preserve the cultural heritage built environment. Whether implemented in combination or independently, these solutions will enhance energy efficiency and user comfort, reduce carbon emissions, and safeguard cultural heritage values. Moreover, they promote superior conservation by ensuring that the measures remain reversible and are compatible with the existing materials.
The solutions proposed by the HERIT4AGES consortium encompass a range of technical and methodological approaches. The “Co-creation Toolkit” provides a comprehensive framework that integrates social innovation processes and co-creation, specifically designed to enhance cultural heritage buildings. The “Digital Twin Ecosystem” platform provides an intelligent monitoring system, complemented by tailored tools for preventive conservation, ensuring that the entire lifecycle of built heritage is comprehensively addressed. The “Green Environmental Sensor” represents an innovative, eco-friendly solution designed to measure humidity and temperature, as well as detect volatile organic compounds, pollutants, and chemical agents associated with material degradation, utilizing both electrochemical and physical sensing methods. The “Smart Energy Router” and “Non-intrusive Load Monitoring System” are advanced power electronics solutions that integrate and efficiently manage energy flows from diverse sources, loads, and storage systems. Finally, the “Renovation Solutions” involve internal retrofitting strategies characterized by reversible interventions that are not permanently anchored to existing building elements. These interventions apply to walls, floors, and ceilings, and are based on recycled or local materials that are compatible with the characteristics of traditional building materials.
As a data-driven project, five listed buildings across Spain, Italy, Portugal, and Estonia are designated as heritage living or testing labs for demonstrative purposes, hosting residential and non-residential functions.

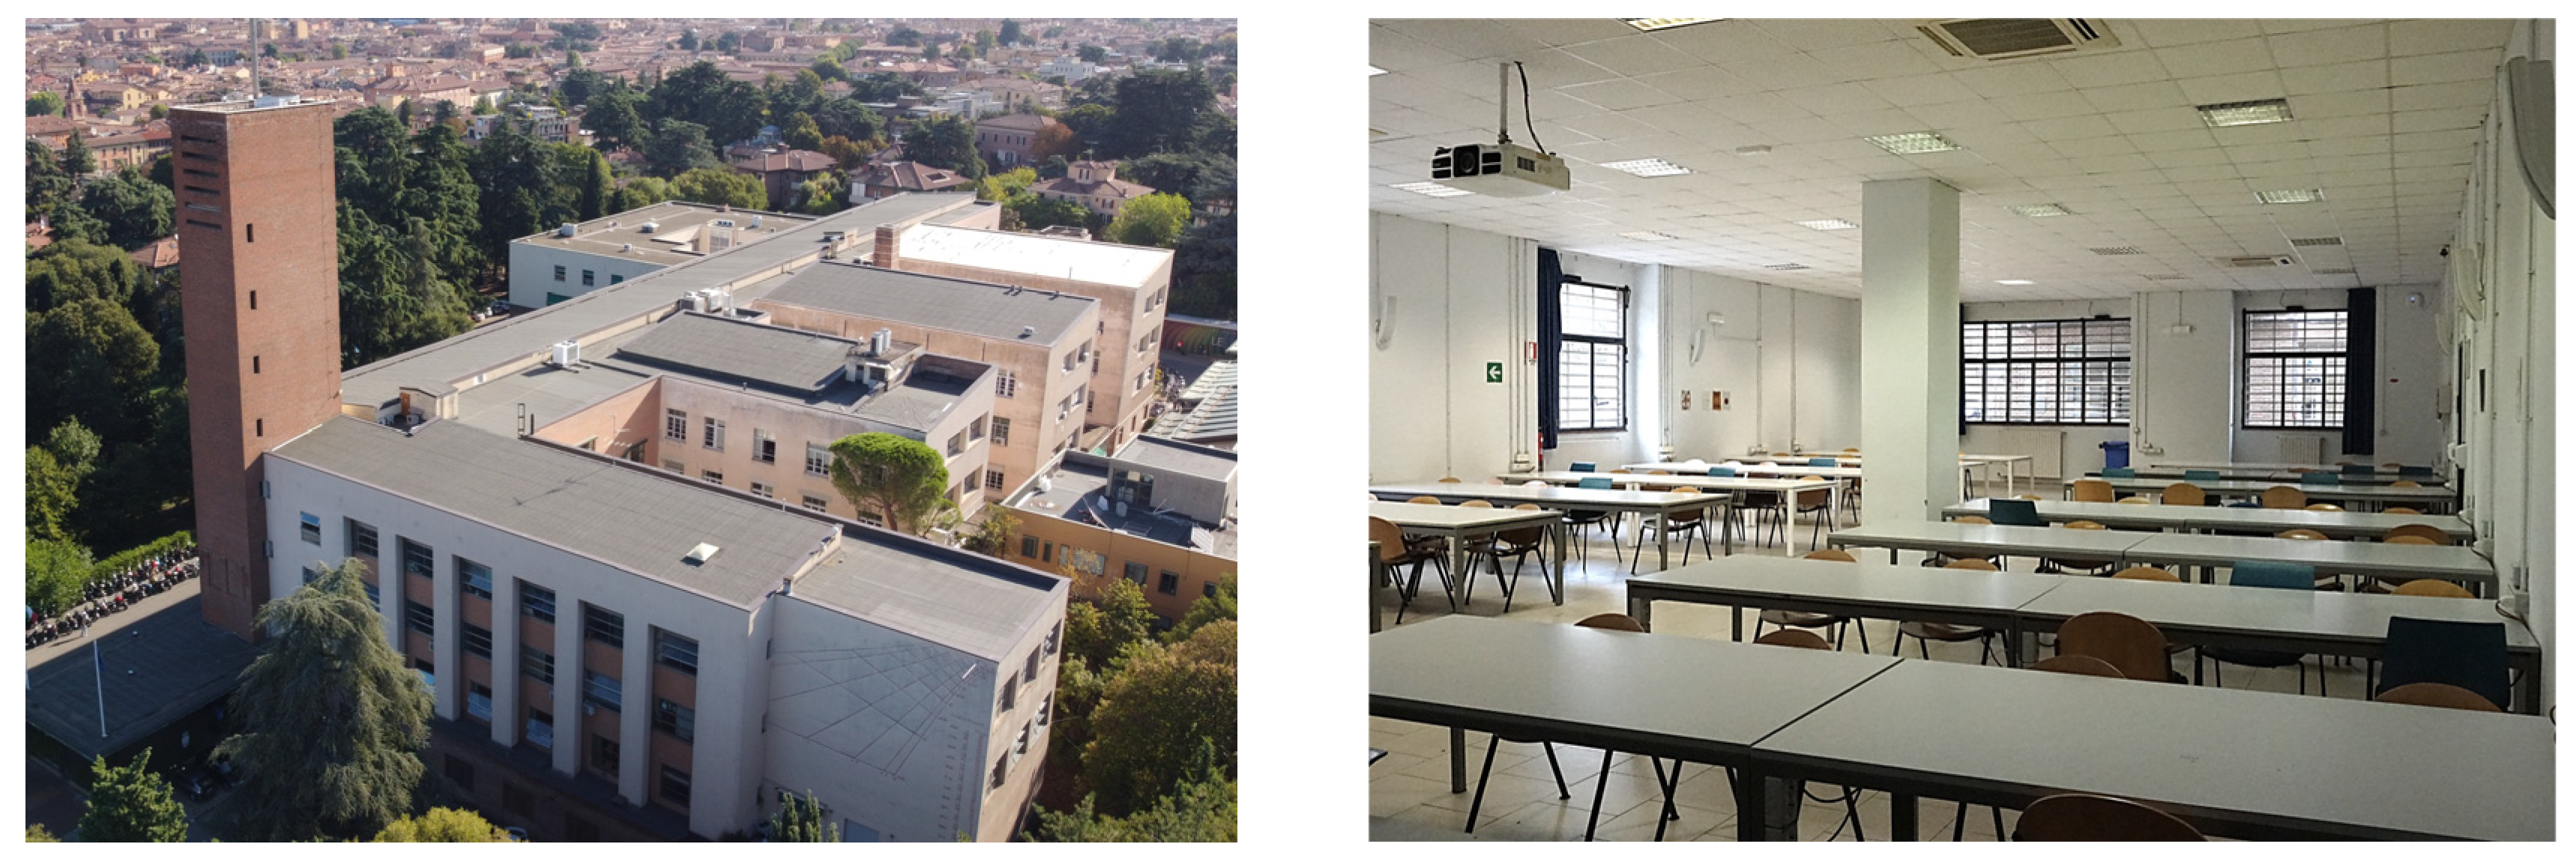
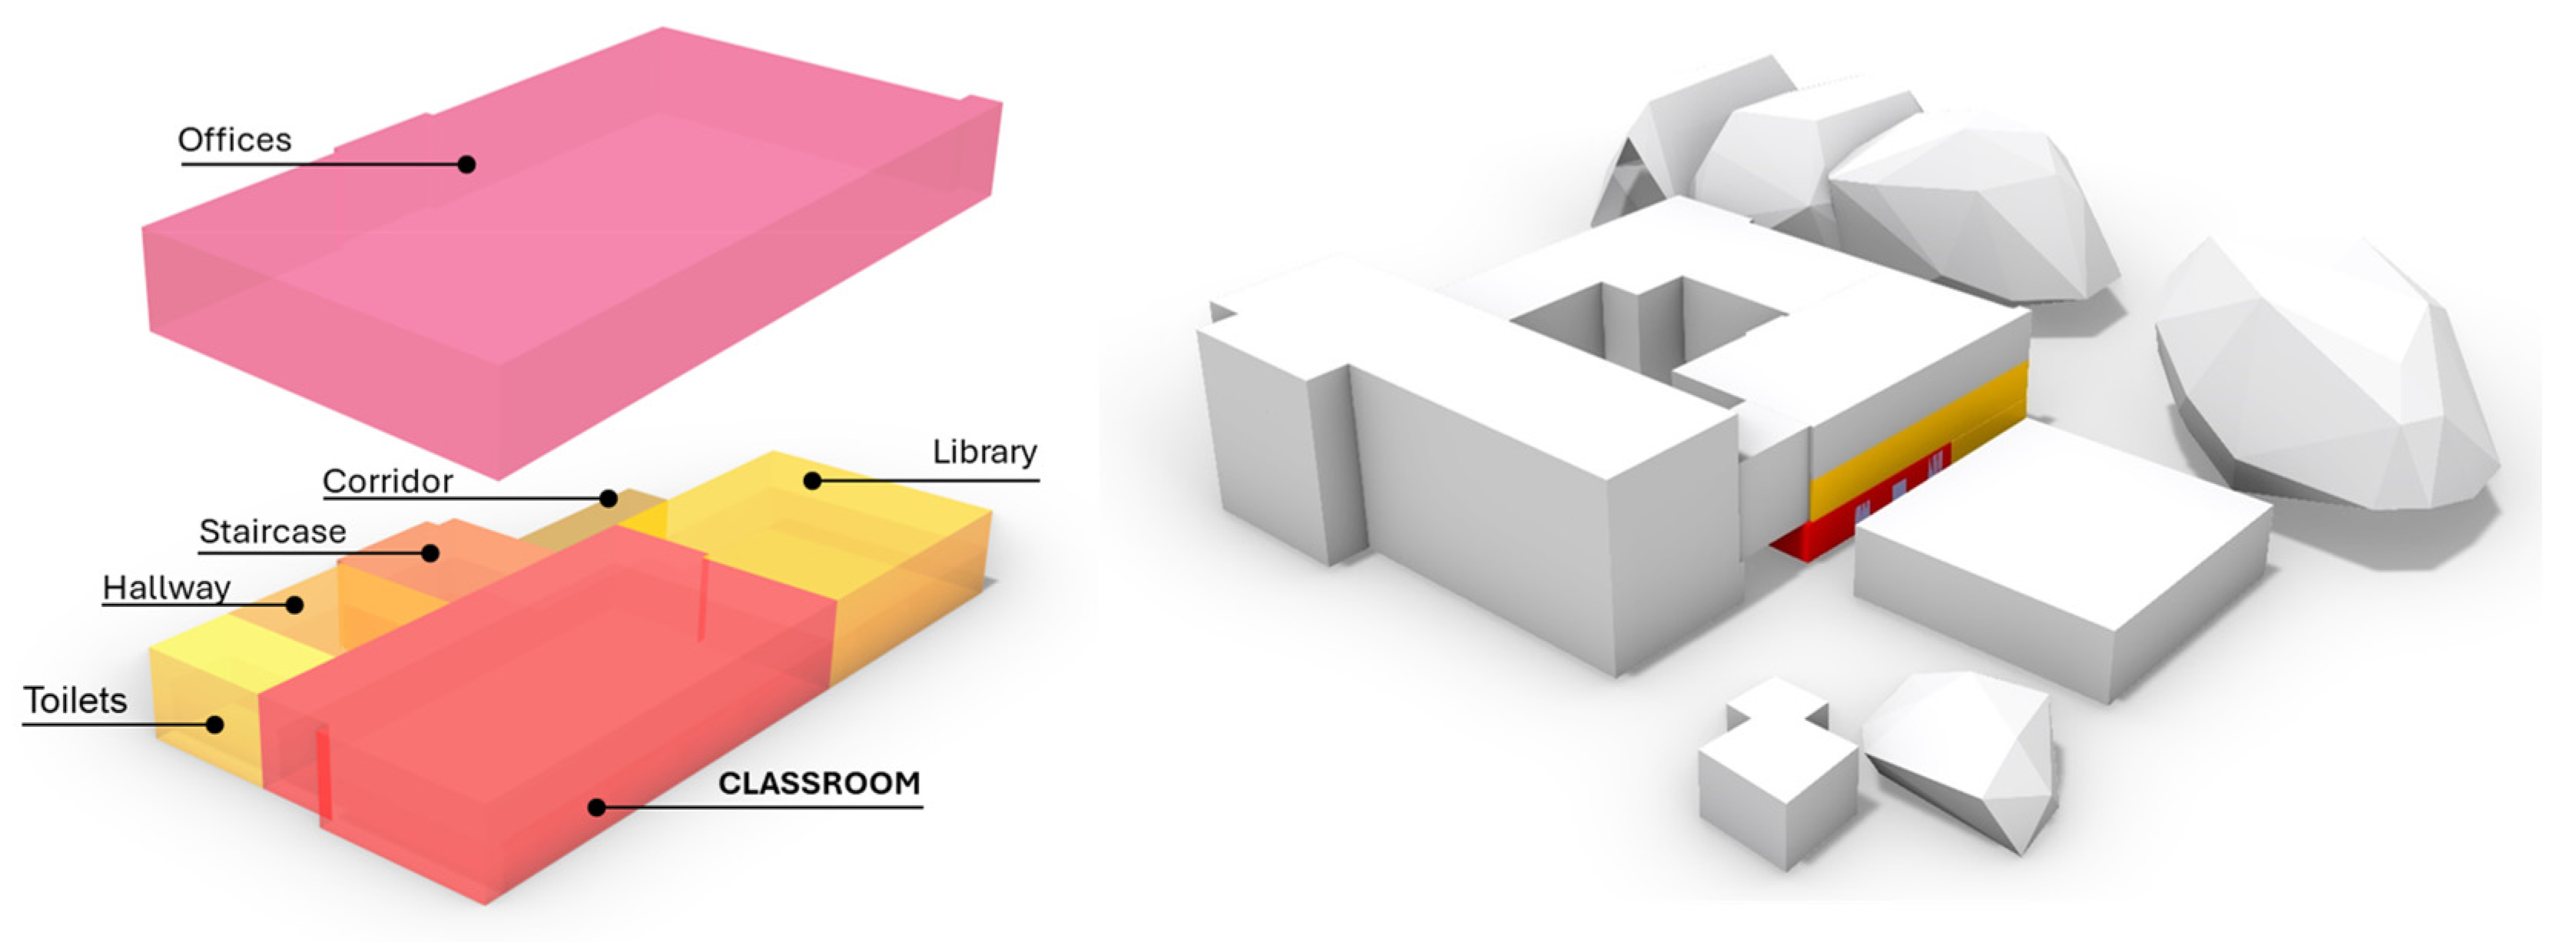
2.2. Case Study: The Faculty of Engineering in Bologna

The Faculty of Engineering at the University of Bologna has been selected as the Italian pilot site for the HERIT4AGES project (Figure 1). Constructed between 1932 and 1935 and designed by architect Giuseppe Vaccaro, the building emphasizes the adaptation of Modernist principles to the local context. It is regarded as a jewel of Bolognese rationalist heritage. The original design incorporated industrial systems and materials, advanced plant equipment, and innovative finishing components. Its adherence to modern architecture principles is also underscored by the absence of decorative elements, enabled by the adoption of a reinforced concrete framework. A balance between the solid, static masses and the dynamic articulation of layouts and windowed façades aesthetically characterizes the resulting architecture.
The evolution of the building was shaped by a series of significant events, commencing with the careful site selection within Bologna’s urban fabric. Initially, the Technical Office of the Consortium for University Buildings supervised the project’s internal planning, while structural design responsibilities were managed by Giuseppe Grazzini & Figli. From 1931 onward, Giuseppe Vaccaro’s involvement was decisive in defining the building’s architectural forms as well as its functional and distributive schemes. His meticulous design marked a pivotal moment in Bolognese architecture during the first half of the twentieth century. Starting in December 1933, the construction works were completed in October 1935, culminating with the official inauguration in January 1936.
Over the ensuing decades, the building underwent multiple modifications. Initial interventions addressed damages incurred during the Second World War, while subsequent changes (primarily involving the installation of modern heating and ventilation systems, enhancements in fire safety, and window replacements) were implemented to comply with evolving university standards and functional requirements. Notably, the building was listed under ministerial protection in 1995 and is safeguarded by the Italian Code of Cultural Heritage and Landscape [14].
The building spans a net floor area of approximately 19,200 m2 across four levels, accommodating a maximum of 5000 users, including researchers, employees, students, and visitors, with an estimated 2500 students utilizing the space during academic hours over 11 months each year. The surrounding context comprises urban settings with green areas, including parks and courtyards. Adjacent areas include private parking and a park to the north, educational facilities and additional green spaces to the south, and residential buildings to both the east and west.
The overall structural framework of the building is based on a reinforced concrete system featuring pillars and beams of varying dimensions. The pillars range from 20 × 30 cm to 60 × 135 cm, and the beams vary from 20 × 30 cm to 60 × 185 cm, depending on the span. The reinforced concrete framework is integrated with solid brick masonry walls, a spreading practice in Italian public construction sites of that period. The envelope of the building is mainly composed of solid brick walls and mixed RC-hollow block slabs.
A specific zone within the building has been designated for detailed analysis (Figure 1). This selected room is situated in the northeast wing on the ground floor and covers a net floor area of 204 m2. The room, with dimensions of approximately 3.8 m in height, 10.2 m in width, and 19.4 m in length, regularly accommodates up to 64 occupants. During lecture periods, from March to June and from September to December, the room is typically occupied near full capacity, with additional usage during exam periods in January, February, July, and September. The room is actively used from 9 a.m. onward on scheduled days.
The vertical opaque envelope of the room is characterized by walls constructed using a composite assembly comprising a solid brick layer, an air gap, another solid brick layer, and a plaster finish, achieving an overall thickness ranging from 70 to 135 cm and estimated U-values ranging from 0.45 to 0.80 W/m2K. The floor slab, constructed using hollow blocks and RC joists, materials typical of the period, is estimated to have a U-value between 2.5 and 3.0 W/m2K. Additionally, the room features externally exposed windows and doors with single glazing and metal frames, with a U-value of 5.70 W/m2K, complemented by movable blinds for solar and shading protection.
In terms of energy systems and controls, the lighting system comprises ceiling-mounted luminaires with fluorescent lamps. The heating, ventilation, and air conditioning (HVAC) configuration includes an independent variable refrigerant volume system for cooling, with cold air distributed via ceiling-mounted fan coil units located behind a false ceiling, while heating is provided by a centralized system consisting of three modulating centralized natural gas condensing boilers (each rated at 750 kW and operating at 98% efficiency at 80 °C), with heat distributed via radiators positioned below the windows. Heating control remains limited, with only the output water temperature from the boilers being regulated at the building scale.

3. Methodology

3.1. Workflow Overview

The workflow adopted for the study is divided into four main phases, as shown in Figure 2. These phases are (1) data acquisition, (2) building information modeling, (3) building energy modeling, and (4) multicriteria analysis.
In the first phase, all necessary information (geometric, functional, material, occupancy- and system-related) is collected for use in the subsequent steps. In the second phase, an HBIM model of the building is created and enriched with the information gathered in the previous step. The third phase involves using the data in the HBIM to develop a baseline BEM, representing the building in its current state. In the final phase, various internal insulation solutions are applied to the baseline model, and their impacts are evaluated using a multicriteria approach.

3.2. Data Acquisition

During the data-acquisition phase, various information related to the case study was collected.

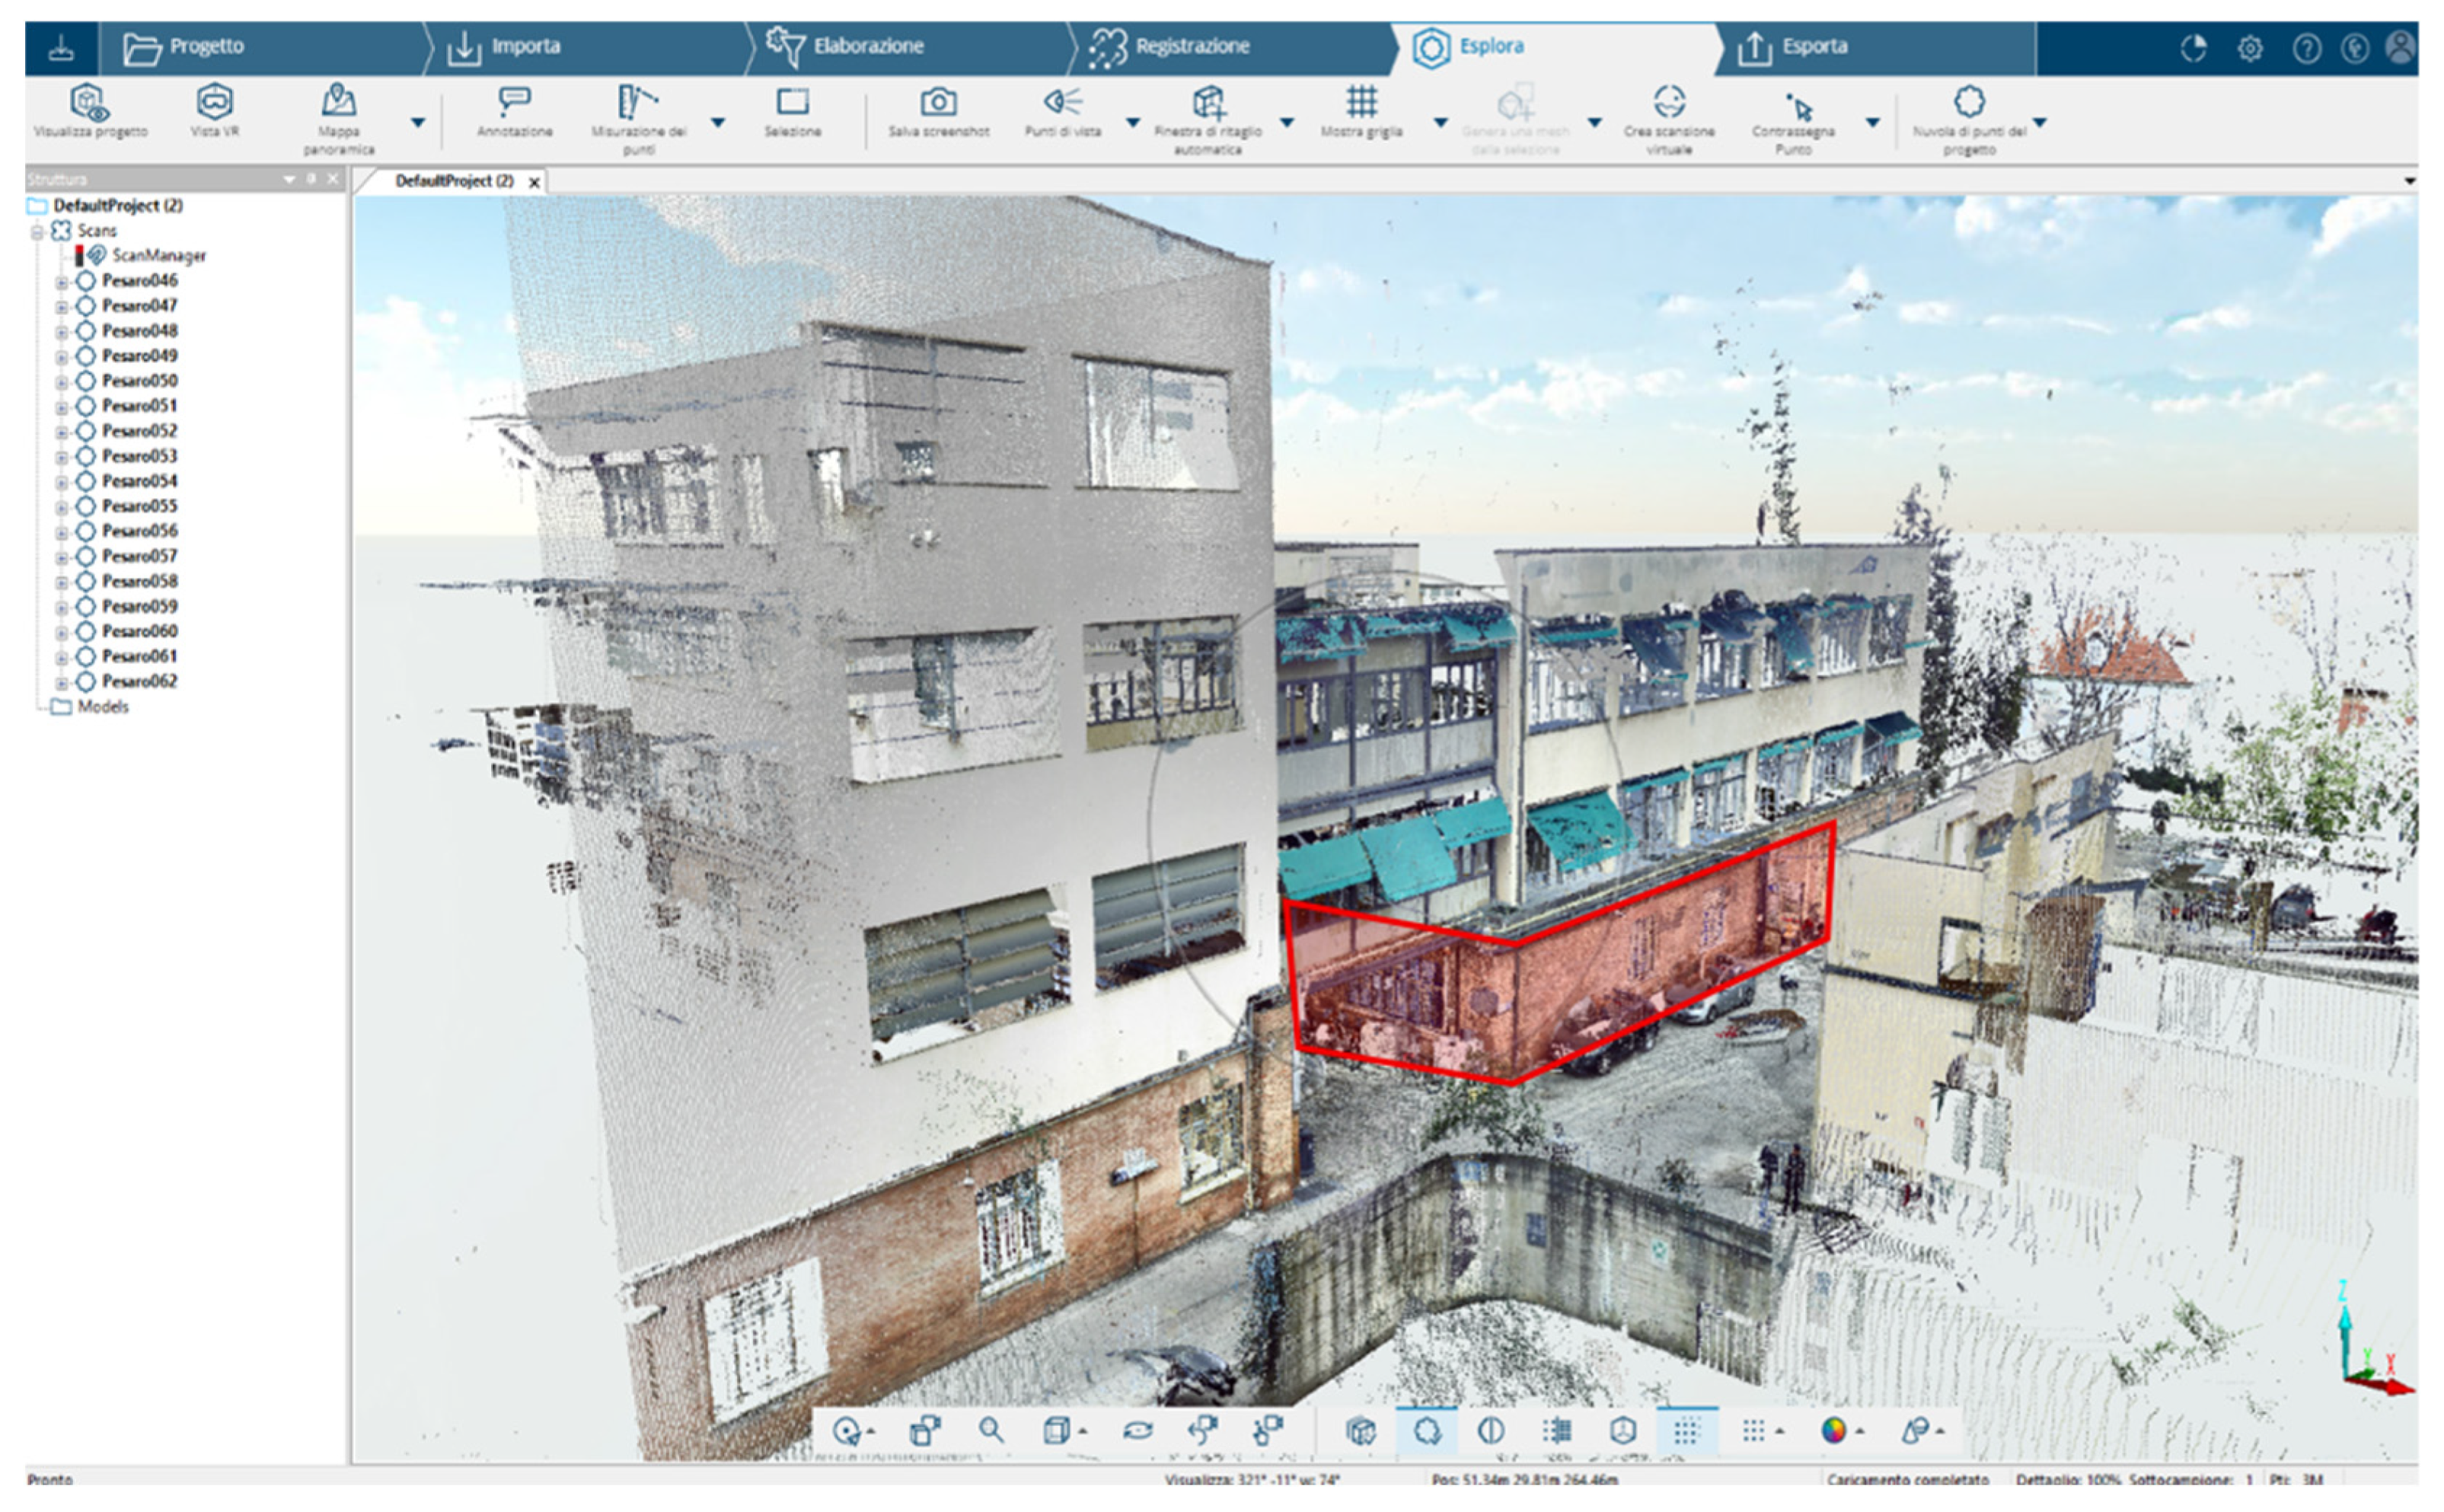
3.2.1. Geometric Data

Geometric data were obtained through a digital survey conducted using terrestrial laser scanning to record the classroom’s geometric characteristics from both the interior and exterior (Figure 3). For other spaces, including those adjacent to the analyzed classroom, geometric data were derived from the floor plans provided by the university’s asset managers.

3.2.2. Construction Data

Construction data were initially gathered from previous research on the building, which has long been the subject of studies by the Department of Architecture at the University of Bologna [13,15,16]. These data primarily concern the stratigraphy of the classroom’s envelope and the identification of the material characteristics of the window frames. Historical studies of the building have confirmed that both the opaque envelope (comprising solid brick walls with an aerated gap) and the transparent envelope (featuring single-glazed metal-framed windows) date back to the original construction in the 1930s. The analysis of construction documents and on-site photographs was particularly relevant, and enabled the identification of the wall compositions in certain parts of the building. Additionally, comparisons were made with the technical solutions available at the time for reinforced concrete floors, which horizontally delimit almost all the spaces within the building.
To complement this approach, destructive and non-destructive diagnostic tests were conducted to validate the acquired data and gain more profound knowledge of the material characteristics. The following analyses were performed:
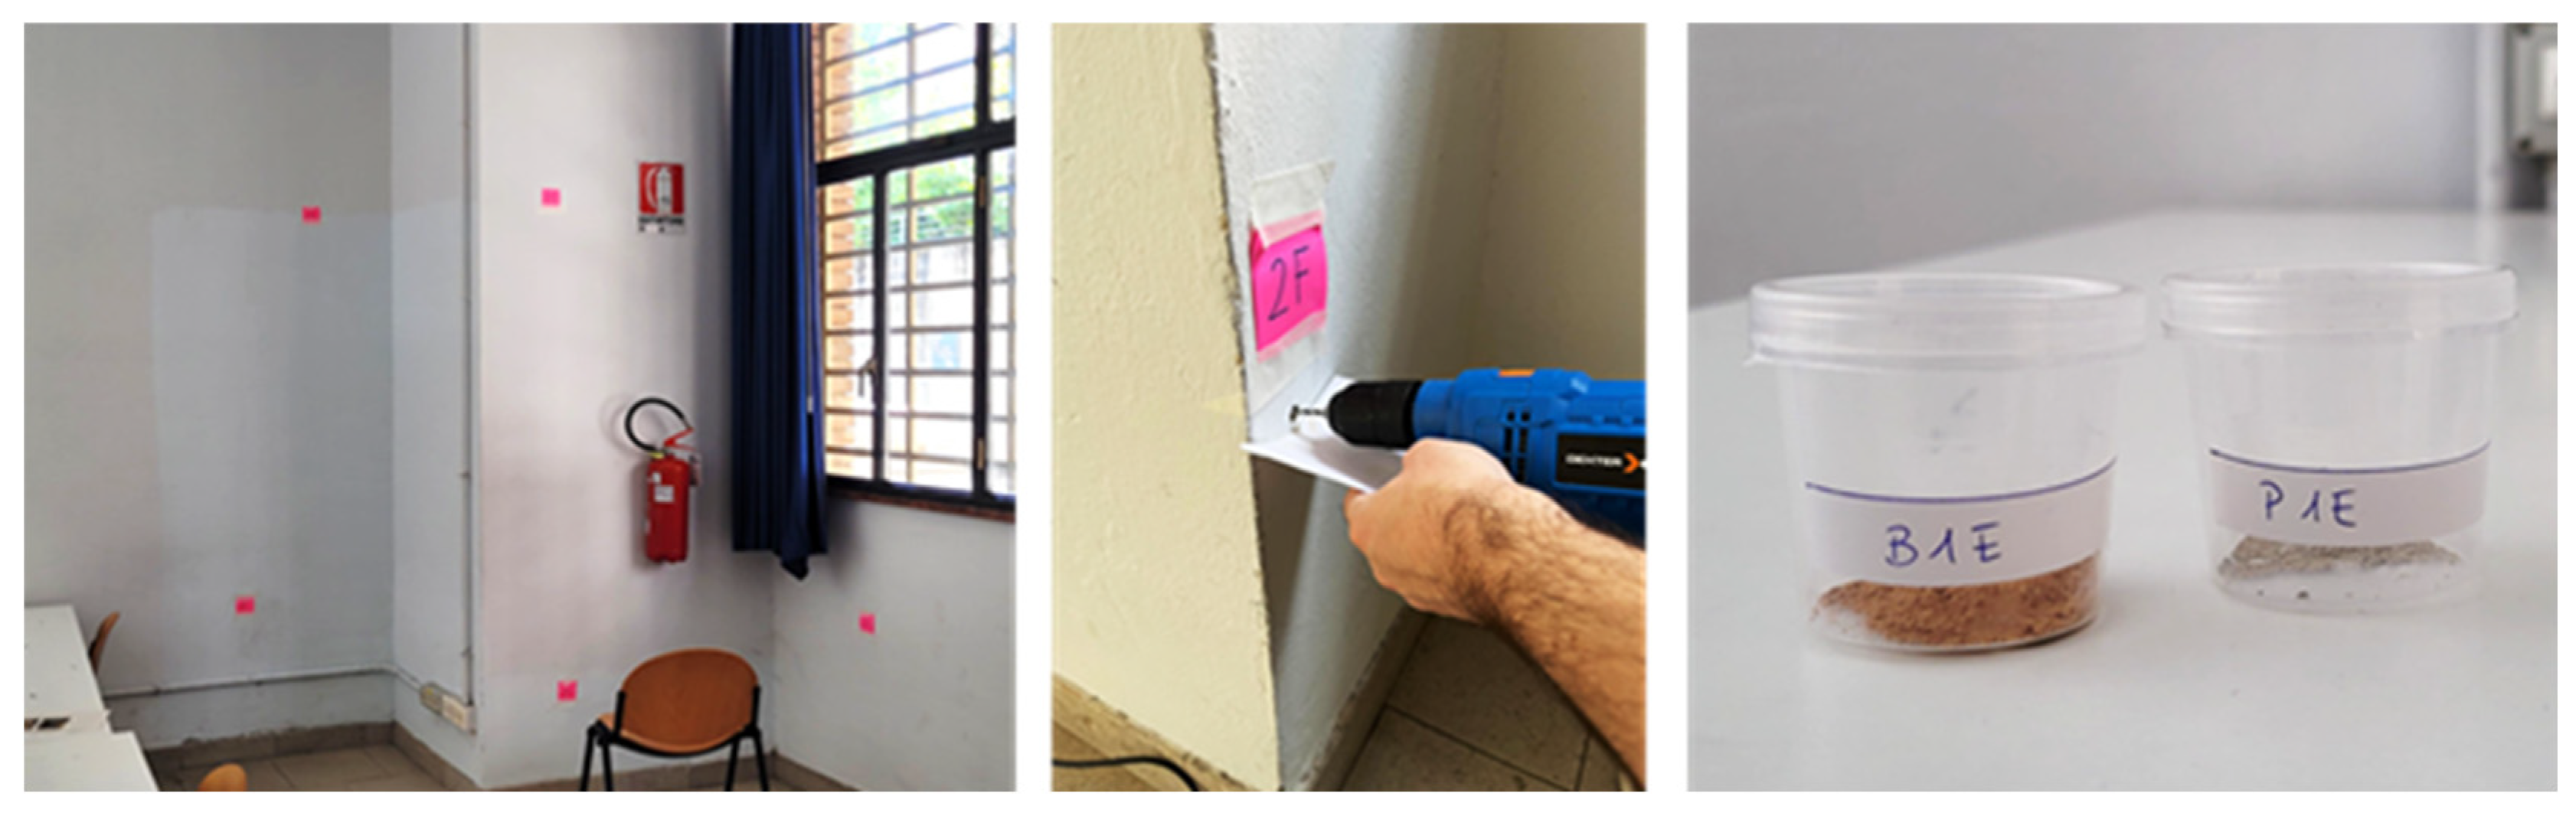
  • X-ray diffraction (XRD): Small material samples were extracted from the walls to investigate the chemical composition of the materials (Figure 4), identify the primary mineralogical phases, and comprehend the nature of the inner walls. All this information will be used to identify renovation solutions compatible with existing materials and develop accordingly the HERIT4AGES’ renovation solutions.
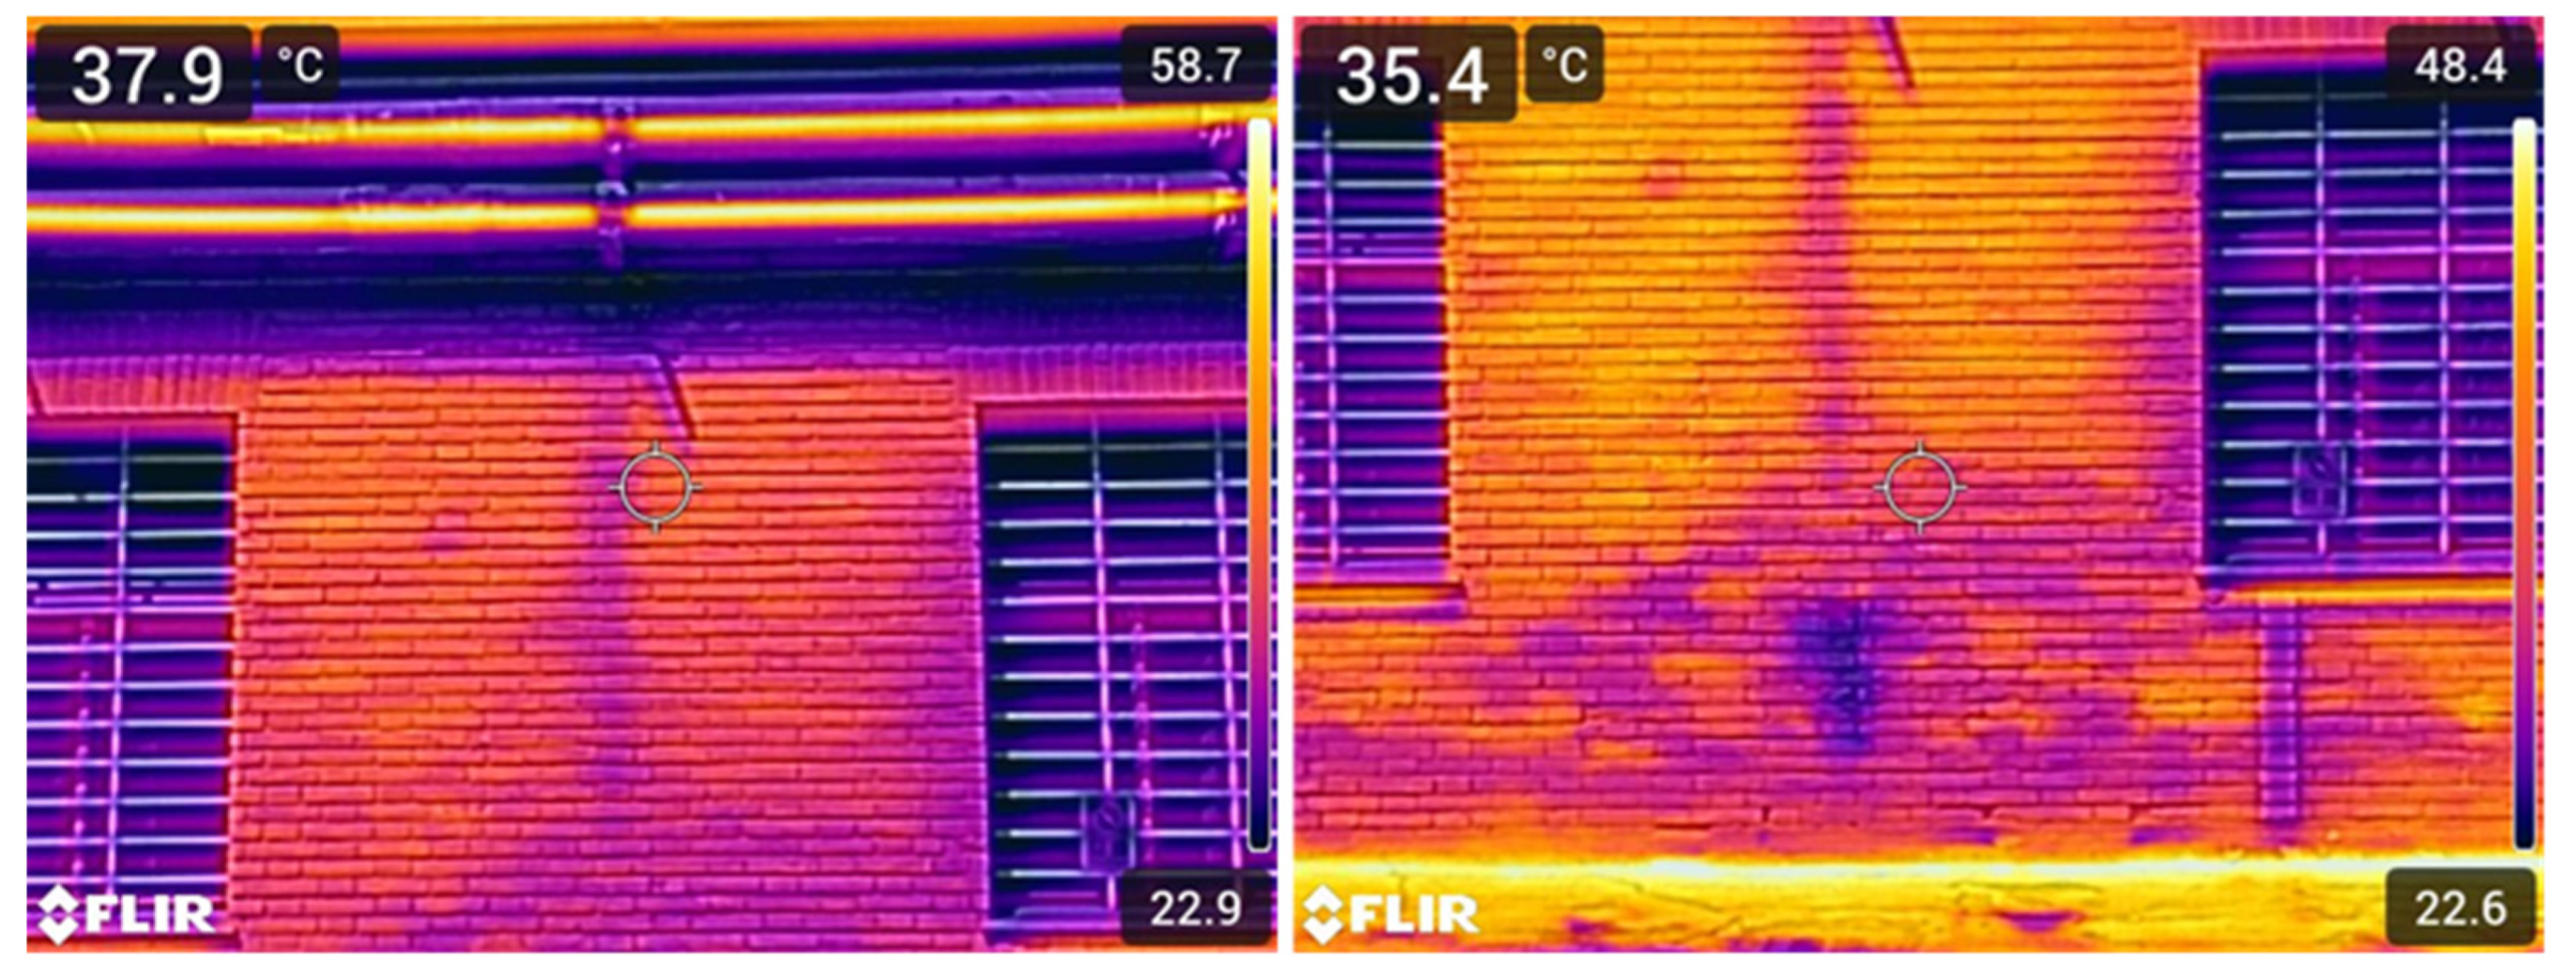
  • Thermal imaging: Thermal images were used to analyze potential construction anomalies on the façade and to identify signs of superficial degradation (Figure 5). For instance, rising damp phenomena were experienced in the exteriors along all the perimetral walls of the classroom.
Additionally, analyses conducted throughout the building in the last decade by the university’s technical office provided insights into the structural properties of the concrete and steel forming beams and columns. However, these data are not directly relevant to the present study.

3.2.3. Occupancy Data

Occupancy data for the classroom were derived from the university’s academic calendar, which provides an hourly schedule of courses based on room reservations. Furthermore, the asset managers provided energy bills for the past five years, which is necessary to understand the building’s energy consumption. A sensor system was also installed in the classroom to monitor both the electrical consumption and number of occupants; this will facilitate improved modeling of energy usage and occupancy characteristics in the HERIT4AGES digital twin, both essential factors in evaluating the energy performance of university buildings like the one under study.

3.2.4. HVAC Data

Data regarding the building systems was instead collected through site surveys and in collaboration with building managers. These data primarily concern the power ratings and efficiencies of the generation devices serving the classroom, as well as the operational schedules of these systems during the winter and summer seasons.

3.3. Building Information Modeling

After collecting all this data, the building’s BIM model was developed (Figure 6). Specifically, an existing BIM model (previously constructed and presented in other studies [17,18]) was enriched with geometric, construction, energy, and operational data acquired during the data collection process. Special attention was given to the information about the classroom under investigation and the interacting construction elements that influence its energy performance.
Autodesk Revit 2024 was chosen as the BIM authoring software. The TLS point cloud and floor plan drawings were imported into the software and manually re-traced to develop a LOD200 BIM model. This level of development allowed us to maintain a high degree of geometric detail without oversimplifying the geometries, thanks to the relatively simple forms of the rationalist-style building.
The BIM integrates the geometric data of building components with information about space usage, thermal envelope characteristics, and zone energy loads. It incorporates spatial elements such as spaces, levels, and zones and construction elements, including walls, floors, roofs, windows, and doors, along with their properties. Element quantities are those automatically calculated by the software (e.g., net and gross height, area and volume of spaces and zones).
The mapped properties for each element class are EnergyPluspresented in Table A1, Table A2 and Table A3 (Appendix A), aligned as possible with the element properties defined by the Industry Foundation Classes (IFC) [19] and the EnergyPlus Input Data Format (IDF) [20].

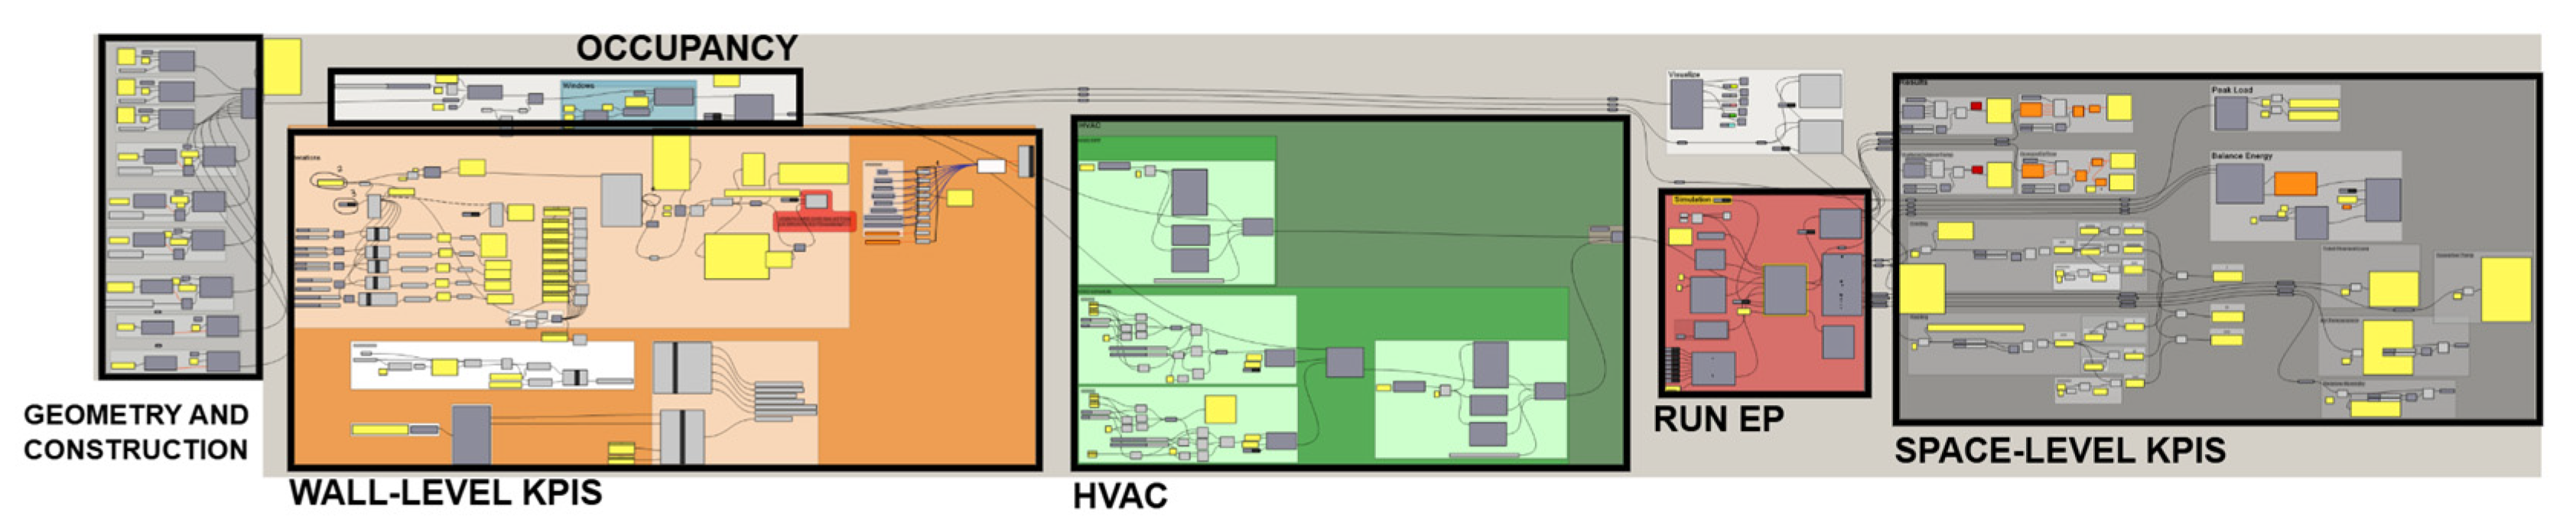
3.4. Building Energy Modeling

Once all the previously listed data were incorporated into the HBIM, we moved on to the geometric modeling phase.
The first step involved recreating only the volumetric part of the building under analysis. In Rhino [21], a 3D modeling software package, the geometries of the relevant zones from the BIM model (the classroom and its adjacent spaces) were imported and re-traced using Grasshopper (GH) (vv.1.0.00008) and Rhino Inside Revit [22] via the algorithm presented in previous articles [17], which allows direct connection between Revit and EnergyPlus in a biunivocal manner to recognize three-dimensional BIM objects.
In the energy model, the geometries of the spaces consisted simply of closed 3D BRep volumes generated by vertically extruding the space boundaries extracted from the BIM model. The surface meshing techniques documented in Massafra et al. [17] were then applied to ensure that all surfaces and edges aligned in the energy model, thereby ensuring high quality. Each surface in these geometries represents a heat diffusive element, such as walls, floors, or ceilings.
Subsequently, using the same algorithm, the surfaces corresponding to openings (i.e., doors and windows) were positioned according to the placements and dimensions defined in the HBIM. This step was crucial because these elements influence both the entry of natural light and the thermal behavior of the classroom. Next, geometries representing the context, which were absent in the Revit model, were created in Rhino as BRep objects, including surrounding elements such as adjacent or nearby buildings and vegetation. These elements were considered significant since they affect the solar radiation of the analysed building.
Once the geometric modeling of the BEM was completed, we proceeded to the energy modeling phase using HoneyBee and LadyBug [23], environmental analysis tools available in GH that enable detailed dynamic simulations of the building’s energy behavior using the EnergyPlus engine. As shown in Figure 7, this task was subdivided into several sub-steps.
The first sub-step involved defining all the materials and construction assemblies for each enclosure element of the building.
For every wall, floor, and roof type present in the BIM model, corresponding EnergyPlus constructions were created within EP’s materials and stratigraphy library. These constructions, referred to as construction types in Revit, were retrieved via the “callFromEPConstrLibrary” component and associated with the corresponding surfaces in the Rhino model; unlike in Revit, EnergyPlus does not require an explicit definition of thickness during the 3D modeling phase, relying on the thickness of each construction package associated with the respective surface.
The surfaces from the geometric model were then converted into HB_Surfaces, which were grouped to form “HB Zones” using the “Honeybee_createHBZones” component—an HB Zone represents a thermal zone within the building, grouping adjacent spaces with similar thermal, equipment, operational, and occupancy characteristics. Next, the geometries of openings, such as windows and doors, were then assigned their respective materials via the “addHBGlz” command and linked to their corresponding zone. Honeybee (HB) automatically calculated the adjacencies between all zones, determining which surfaces are adiabatic, exterior, ground-contact, or interzonal.
Each zone was then assigned a usage “schedule” defining its function by selecting from the available libraries the schedule that best represents the current state of the spaces. Each schedule specifies parameters such as occupancy rate, type of activity, setpoint temperature for heating and cooling systems, lighting levels, appliance and equipment consumption, and potential infiltration rates. This detailed programming allows simulation of how the environment is used throughout the day and how these characteristics influence its internal climate.
To simulate the proper functioning of these systems, an HVAC system was created by selecting the appropriate system type from the default libraries and, when necessary, supplementing it with the most relevant performance data and characteristics. The “setEPZoneSchedules” component was used to configure the operating schedule, specifying when the system is active and when it is not. The HVAC system was then assigned to the various HB Zones using the “Honeybee_AssignHVACSystem” command, where details for the ventilation (“airDetails”), heating (“heatingDetails”), and cooling (“coolingDetails”) systems were provided.
The HB Zones, complete with system and usage data, were then connected to the EP Simulation Engine using the “Run_EP_Simulation” node. This node required several inputs: the model’s orientation (“north”) to accurately simulate solar incidence; the specific climatic data for the location (“epwFile”), here selected for Bologna from the EPW map [24]; the simulation period (“analysisPeriod”); various shading parameters (“energySimPar”); the HB Zones and the contextual geometries (“HB Context”), which define all surrounding elements; and settings that determine which outputs are generated and at what frequency (“simulationOutputs”).
Once all simulation options were configured, the “runEnergyPlus_” input was activated to initiate the energy simulation. The final model was a BEM, both in the HB and EP format, establishing the reference baseline for the multicriteria analysis. (Figure 8).

3.5. Multicriteria Analysis

Once the baseline model was obtained, it was modified for the multicriteria analysis. The primary modification involved adding a new insulation layer to the interior surfaces of the opaque envelope. In this case study, the insulation was applied exclusively to the interior side of perimetral walls facing toward the exteriors, as ground floor insulation was deemed impractical due to space accessibility issues, and insulating the ceiling was considered unnecessary because the classroom is located beneath the office spaces, which are conditioned.
The added insulation material was created as an “EP Opaque Material” using the “Honeybee_EnergyPlus Opaque Material” GH component, with the input properties “thickness”, “conductivity”, “density”, and “specific heat” serving as the variable parameters in the multicriteria analysis. This material was then incorporated into the EnergyPlus Constructions previously assigned to the walls, which were redefined using the “Honeybee_EnergyPlus Construction” command and subsequently updated via “Honeybee_Add to EnergyPlus Library”. Custom GHPython components were developed to calculate the condensation risk, which needed the “waterVapourResistanceFactor” as an additional variable input of the insulation material.
A further GH algorithm was finally executed to perform the multicriteria analysis, evaluating performance metrics at both the wall and zone levels. This algorithm was conceived through an iterative logic that allows for comparing multiple insulation solutions by randomly varying input material properties within specified ranges and calculating their performance characteristics and impacts. The iterative model was implemented using the GH Anemone component [25], which enables the creation of loops and the definition of the number of iterations to be performed. It was paired with a script that, at each iteration, generates a random value within a predefined input range. During each cycle, the five input parameters change in a semi-random manner, producing corresponding numerical values for the outputs under analysis. At the end of each iteration, Anemone’s “LoopEnd” component records the generated values, thus ensuring the traceability of the results. These results are exported to Excel at the end of the process for further analysis. Figure 9 outlines the logic behind this algorithm.
The performance metrics examined at the wall level are as follows:
  • Thermal transmittance (UTOT): Measured in W/(m2K), it represents the amount of heat that passes through 1 square meter of surface per unit Kelvin of temperature difference. A lower value indicates reduced heat transfer, preferable for energy efficiency. This parameter is critical in retrofit processes and is subject to regulatory limits (e.g., Emilia Romagna standards set a maximum of 0.26 W/m2K for renovated walls [26]).
  • Periodic transmittance (YIE): Measured in W/(m2K), it is defined as the ratio between the overall amplitude of the thermal flux density through the component’s surface adjacent to a given zone and the overall amplitude of the temperature variation in the adjacent zone, when the temperature in the first zone is maintained constant (EN ISO 13786:2017 [27]).
  • Damping factor (DF): Dimensionless parameter defined as the ratio of the amplitude of the temperature oscillation on the internal surface to that on the external surface. A lower damping factor indicates a more significant attenuation of external thermal fluctuations, enhancing thermal comfort and reducing heating/cooling loads (EN ISO 13786:2017 [27]).
  • Phase shift (PS): Measured in hours, the phase shift is the time delay between the peak external temperature and the corresponding peak internal surface temperature. A larger phase shift indicates that the thermal wave is delayed as it passes through the envelope, contributing to improved thermal inertia and indoor comfort (EN ISO 13786:2017).
  • Weight (W): Weight in kg/m2 of the installed insulation panel, calculated by multiplying the thickness of the panel and its density.
  • Surface density (SD): Expressed in kg/m2, surface mass refers to the mass per unit area of the building component (including existing and new materials). Higher surface mass implies greater thermal inertia, which helps to moderate temperature variations by storing and releasing heat more effectively.
  • Periodic internal/external areal heat capacity (AHCI/AHCE): Measured in kJ/m2K, it corresponds to the thermal capacity per unit area of the element on the internal/external side.
Additional wall-level metrics that account for contextual climatic data include the following:
  • Maximum monthly condensation (MMC): It evaluates the potential for condensation formation and quantifies the total amount of condensation present in a month, expressed in g/m2.
  • Total yearly condensation (TYC): It evaluates the potential for condensation formation and quantifies the amount of total condensation present in the year, expressing it in g/m2. For the purposes of this study, the drying effects were not taken into account.
  • Internal/external surface temperatures (STI/STE): They represent the temperatures on the interior and exterior sides of each surface, respectively.
At the zone level, the following outputs are provided:
  • Total energy demand for heating (EDH): The annual energy demand required for heating the space in kWh.
  • Total energy demand for cooling (EDC): The annual energy demand required for cooling the space in kWh.
  • Total energy demand (EDTOT): The sum of the heating and cooling energy demands in kWh.
  • Energy Load Reduction (ELR): The percentage of energy load reduction calculated by comparing the total energy demand of the renovation state with that of the current state.
  • Reduced space (RS): The percentage of floor reduction due to the installation of internal insulation panels.
The listed performance metrics were computed using GH components, especially HB for energy calculations. Moreover, custom Python nodes were developed in GH to implement calculation procedures based on established standards and regulations. Table 1 provides a detailed summary of the methods and references used for these calculations.

4. Results

The proposed methodology was initially applied to analyze the building in its current condition (baseline model) and subsequently employed to evaluate potential interventions.

4.1. Baseline Model

The first simulation was carried out on the baseline configuration of the building. The energy model included the classroom under study, treated as an independent thermal zone, along with all adjacent areas such as restrooms, circulation spaces, and the library on the ground floor, as well as the offices located on the upper level.
The classroom envelope consists of several construction elements with specific stratigraphies. The floor slab between the classroom and the offices above is composed of ceramic tiles, screed, a reinforced concrete beam-and-block slab, and internal plaster, for a total thickness of 0.52 m. The floor on grade includes ceramic tiles, a screed, a reinforced concrete slab, and a gravel layer, with a total thickness of 0.50 m. Internal partitions between the classroom and the entrance area, restrooms, and former library are composed of brick with internal and external plaster, with a total thickness of 0.17 m. The wall separating the classroom from the stairwell includes three layers of solid brick and a 0.14 m air gap, reaching a total thickness of 0.62 m. The windows are single-glazed, three-panel steel frames.
With regard to the opaque vertical envelope, three different wall typologies were identified. The first wall type (east-facing), corresponding to the eastern façade, covers approximately 79.36 m2 and consists of three layers of solid brick separated by a 0.30 m air cavity and finished with internal plaster. This assembly, with a total thickness of 0.77 m, exhibits a thermal transmittance of 0.73 W/m2K, a phase shift of 16 h, and a surface mass of 740 kg/m2. The second wall type (south-facing), with an area of about 31.30 m2, features four layers of solid brick separated by a 0.71 m air cavity, with internal and external plaster finishes. With a total thickness of 1.35 m, it achieves a lower thermal transmittance of 0.43 W/m2K, a phase shift of 14 h, and a higher surface mass of 1568 kg/m2. The third wall type (south-facing) covering 13.28 m2 has a similar composition to the first variant but with a thinner air cavity (0.25 m), resulting in a slightly higher transmittance of 0.74 W/m2K, a phase shift of 22 h, and a surface mass of 968 kg/m2. The first wall type was selected as the reference for external walls in the simulation model due to its greater surface area and hence stronger influence on the overall thermal performance of the classroom.
Specific usage profiles were assigned to the thermal zones. The classroom zone was associated with a significant default program from Ladybug Tools vv.0.0.69 (0.25 ppl/m2, 50% occupancy). The same was done for other zones: toilets (0.00 ppl/m2), circulation spaces (0.10 ppl/m2), storage rooms (0.02 ppl/m2), and offices (0.05 ppl/m2). A custom HVAC schedule was defined with heating allowed from October 22 to April 7 (7:00–20:00), in line with Bologna’s regulations for public buildings, and cooling active from June 1 to September 30 (7:00–20:00).
The EP simulation engine was configured by orienting the model, linking Bologna’s EPW climate file, and integrating the 3D context previously modeled. The simulation covered a full year with monthly output to balance detail and performance. Once set, the energy simulation was run.
At this stage, the total annual energy demand (EDTOT) for the classroom was calculated to be 21,777 kWh.

4.2. Design Model

Subsequently, a design-phase analysis was conducted focusing on various internal insulation solutions commonly used in the study area and/or based on locally sourced materials currently under investigation within the research project. The area of the case study, located in Bologna, falls within Climate Zone E according to Italian standards, for which the following minimum performance criteria for retrofitted vertical opaque envelopes should be evaluated:
  • The thermal transmittance must comply with the limit U ≤ 0.26 W/m2·K.
  • The attenuation factor (thermal decrement factor) should preferably be below 0.10.
  • A thermal phase shift of at least 10–12 h is recommended to ensure effective summer performance.
  • The surface mass should be no less than 230 kg/m2 to provide adequate thermal inertia.
  • The internal areal heat capacity is considered optimal when above 40 kJ/m2·K. Historic buildings often meet or exceed this threshold due to their construction characteristics.
  • Although no strict threshold is defined for external areal heat capacity, higher values are preferable, as they enhance the building’s thermal inertia, mitigating summer overheating and thereby reducing cooling demand.
  • Regarding hygrothermal performance, the risk of surface condensation must be checked to prevent potential mold growth. Additionally, monthly moisture accumulation must not exceed 500 g/m2, and any residual moisture should fully evaporate by the end of the annual cycle.
The design analysis served both as a preliminary assessment for retrofit strategies and as a validation exercise for the simulation tool developed. Where possible, results obtained through the custom Python components, developed through GHPython nodes, were cross-checked using established tools such as PAN 8.0 and Excel spreadsheets compliant with relevant UNI standards, to verify the accuracy of calculations related to relevant factors like UTOT, YIE, and condensation risk.
In the simulations, an internal insulation layer was added to the vertical wall assemblies, testing each proposed material. For each insulating material, a minimum and maximum thickness range was defined, allowing performance to be evaluated within predictable boundaries. For instance, a reed-based insulation panel showed thermal transmittance values ranging from 0.52 W/m2K at 2 cm thickness to 0.44 W/m2K at 10 cm. The thermophysical properties of investigated materials, reported in Table 2, were derived from a market survey of typical insulation panels; values correspond to the most recurrent products identified. The key results of this analysis are presented in Table 3. This parameterization enabled a comparative evaluation of insulation solutions, assessing both their impact on the usable interior space of the classroom and their effectiveness in improving overall energy performance depending on the material used.

4.3. Design Iterations

The GH algorithm was subsequently re-executed to perform a multicriteria analysis, evaluating performance indicators at both wall and zone levels over a broader set of solution iterations. To represent insulation materials available on the market, the following parameter ranges were defined: thickness from 0.01 m to 0.20 m, thermal conductivity from 0.01 to 0.10 W/m·K, density from 10 to 500 kg/m3, specific heat capacity from 700 to 2000 J/kg·K, and water vapor resistance factor (μ) from 1 to 300. For this study, the algorithm was iterated 10,000 times to enable comparison among an equivalent number of insulation solutions. The full calculation process took approximately 22 h on a standard workstation.
An overview of the generated dataset is illustrated in Table 4. This dataset includes a detailed recording of insulation material’s properties, i.e., thickness, thermal conductivity, density, specific heat capacity, and water vapor resistance factor. Additionally, the dataset captures thermal and hygrometric performance parameters such as thermal transmittance, periodic transmittance, damping factor, phase shift, surface mass, weight, internal and external thermal capacities, annual and maximum monthly condensation quantities, overall energy requirements, and reduced space.
The initial dataset (10,000 rows) underwent rigorous cleaning, initially removing rows with invalid or null entries (195 rows). Subsequently, an interquartile range (IQR) method was employed at the 1st and 99th percentile thresholds to identify and eliminate extreme outlier values. This resulted in a cleaner and more representative dataset of 9764 rows. Following the cleaning process, the dataset was divided into two distinct subsets based on the occurrence of MMC: (a) condensation-present dataset (1173 rows), containing entries with MMC and TYC greater than zero, (b) condensation-free dataset (8591 rows), containing entries without condensation (MMC and TYC are null).
After cleaning, these datasets underwent clustering analysis aimed at identifying groups of solutions sharing similar KPIs. The K-means algorithm was utilized for this clustering task [30]. Prior to applying K-means, however, data were prepared for clustering by normalizing the variables using a RobustScaler. This normalization mitigated the influence of potential outliers, ensuring comparability across variables. To determine the optimal number of clusters for subsequent K-means clustering, two methods were employed: the elbow method, which evaluates the sum of squared distances (inertia) between data points and their respective cluster centroids to identify the optimal point (“elbow”) at which adding more clusters no longer yields significant improvement [31]; and silhouette analysis, which measures the similarity of data points within clusters relative to other clusters, with higher scores indicating better clustering quality [32] (Figure 10). Analyzing the graphical results (Figure 11) revealed the optimal number of clusters to be k = 3 for the condensation-present dataset and k = 2 for the condensation-free dataset. After determining the optimal cluster count, the K-means algorithm was applied to the normalized data, utilizing 100 initializations to ensure the reliability and stability of cluster assignments. The properties considered for the clustering were UTOT, MMC, RS, YIE, SD, and the water vapor resistance factor. Each data point in the two datasets was classified into a cluster that represents similar performance characteristics.
To facilitate a clearer interpretation of the clustering outcomes, subsets of 500 randomly selected rows from each clustered dataset were chosen for visual analysis. Visualization included pairplots and boxplots to comprehensively explore the distribution and relationships among variables within and across clusters. Pairplots illustrate distributions of individual variables through histograms and pairwise relationships through scatter plots, color-coded by clusters to clearly highlight group separations and correlations (Figure 11). Boxplots were generated to investigate clusters’ variables and KPIs in detail (Figure 12). The visualization efforts aimed to identify clear patterns, distinct cluster separations, and potential correlations among variables, and evaluate the robustness and quality of the clustering analysis.

5. Discussion

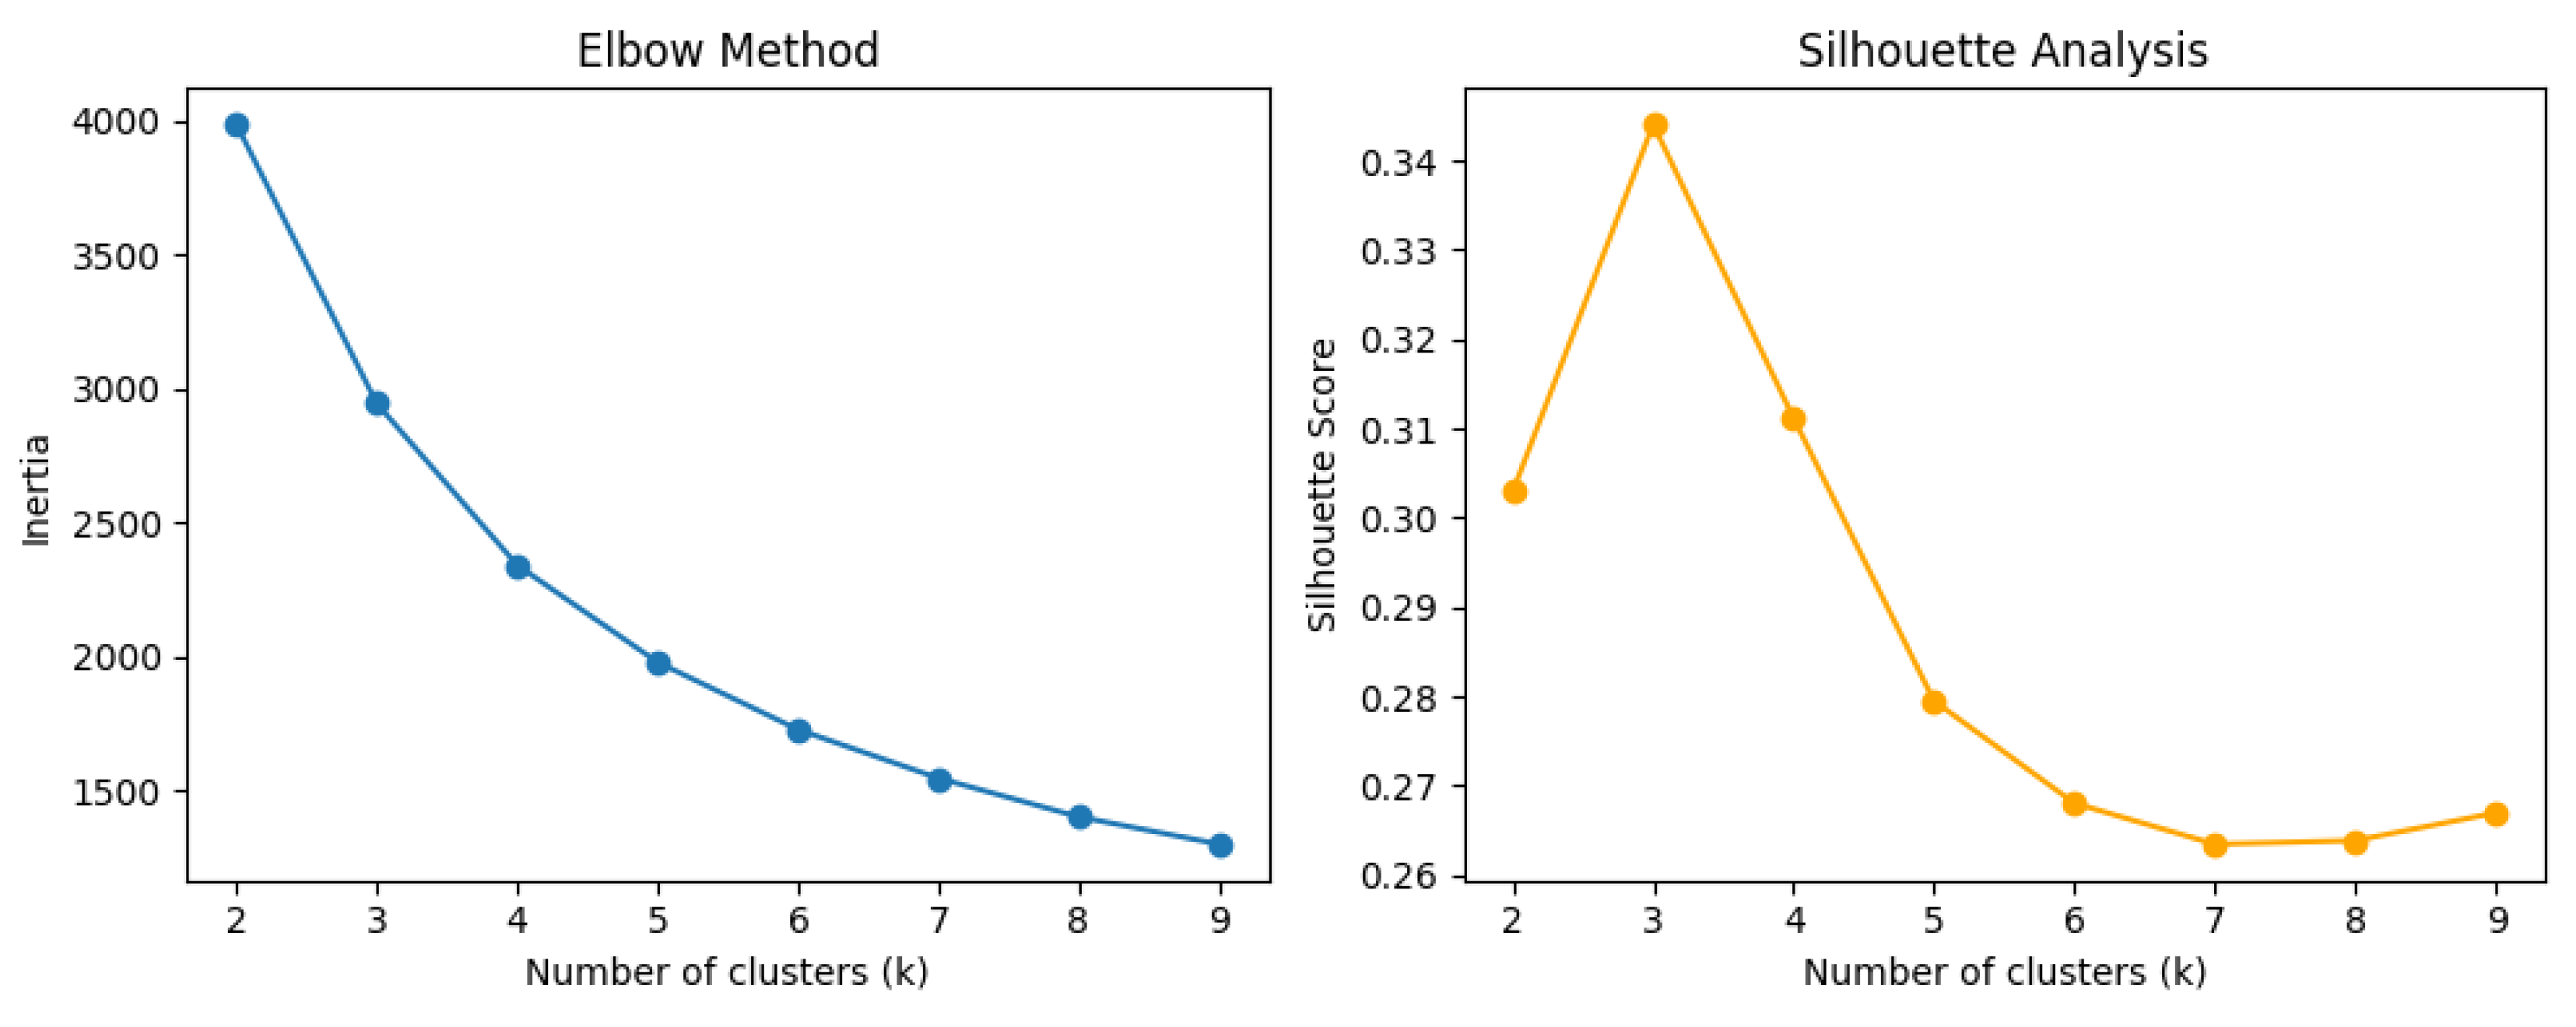
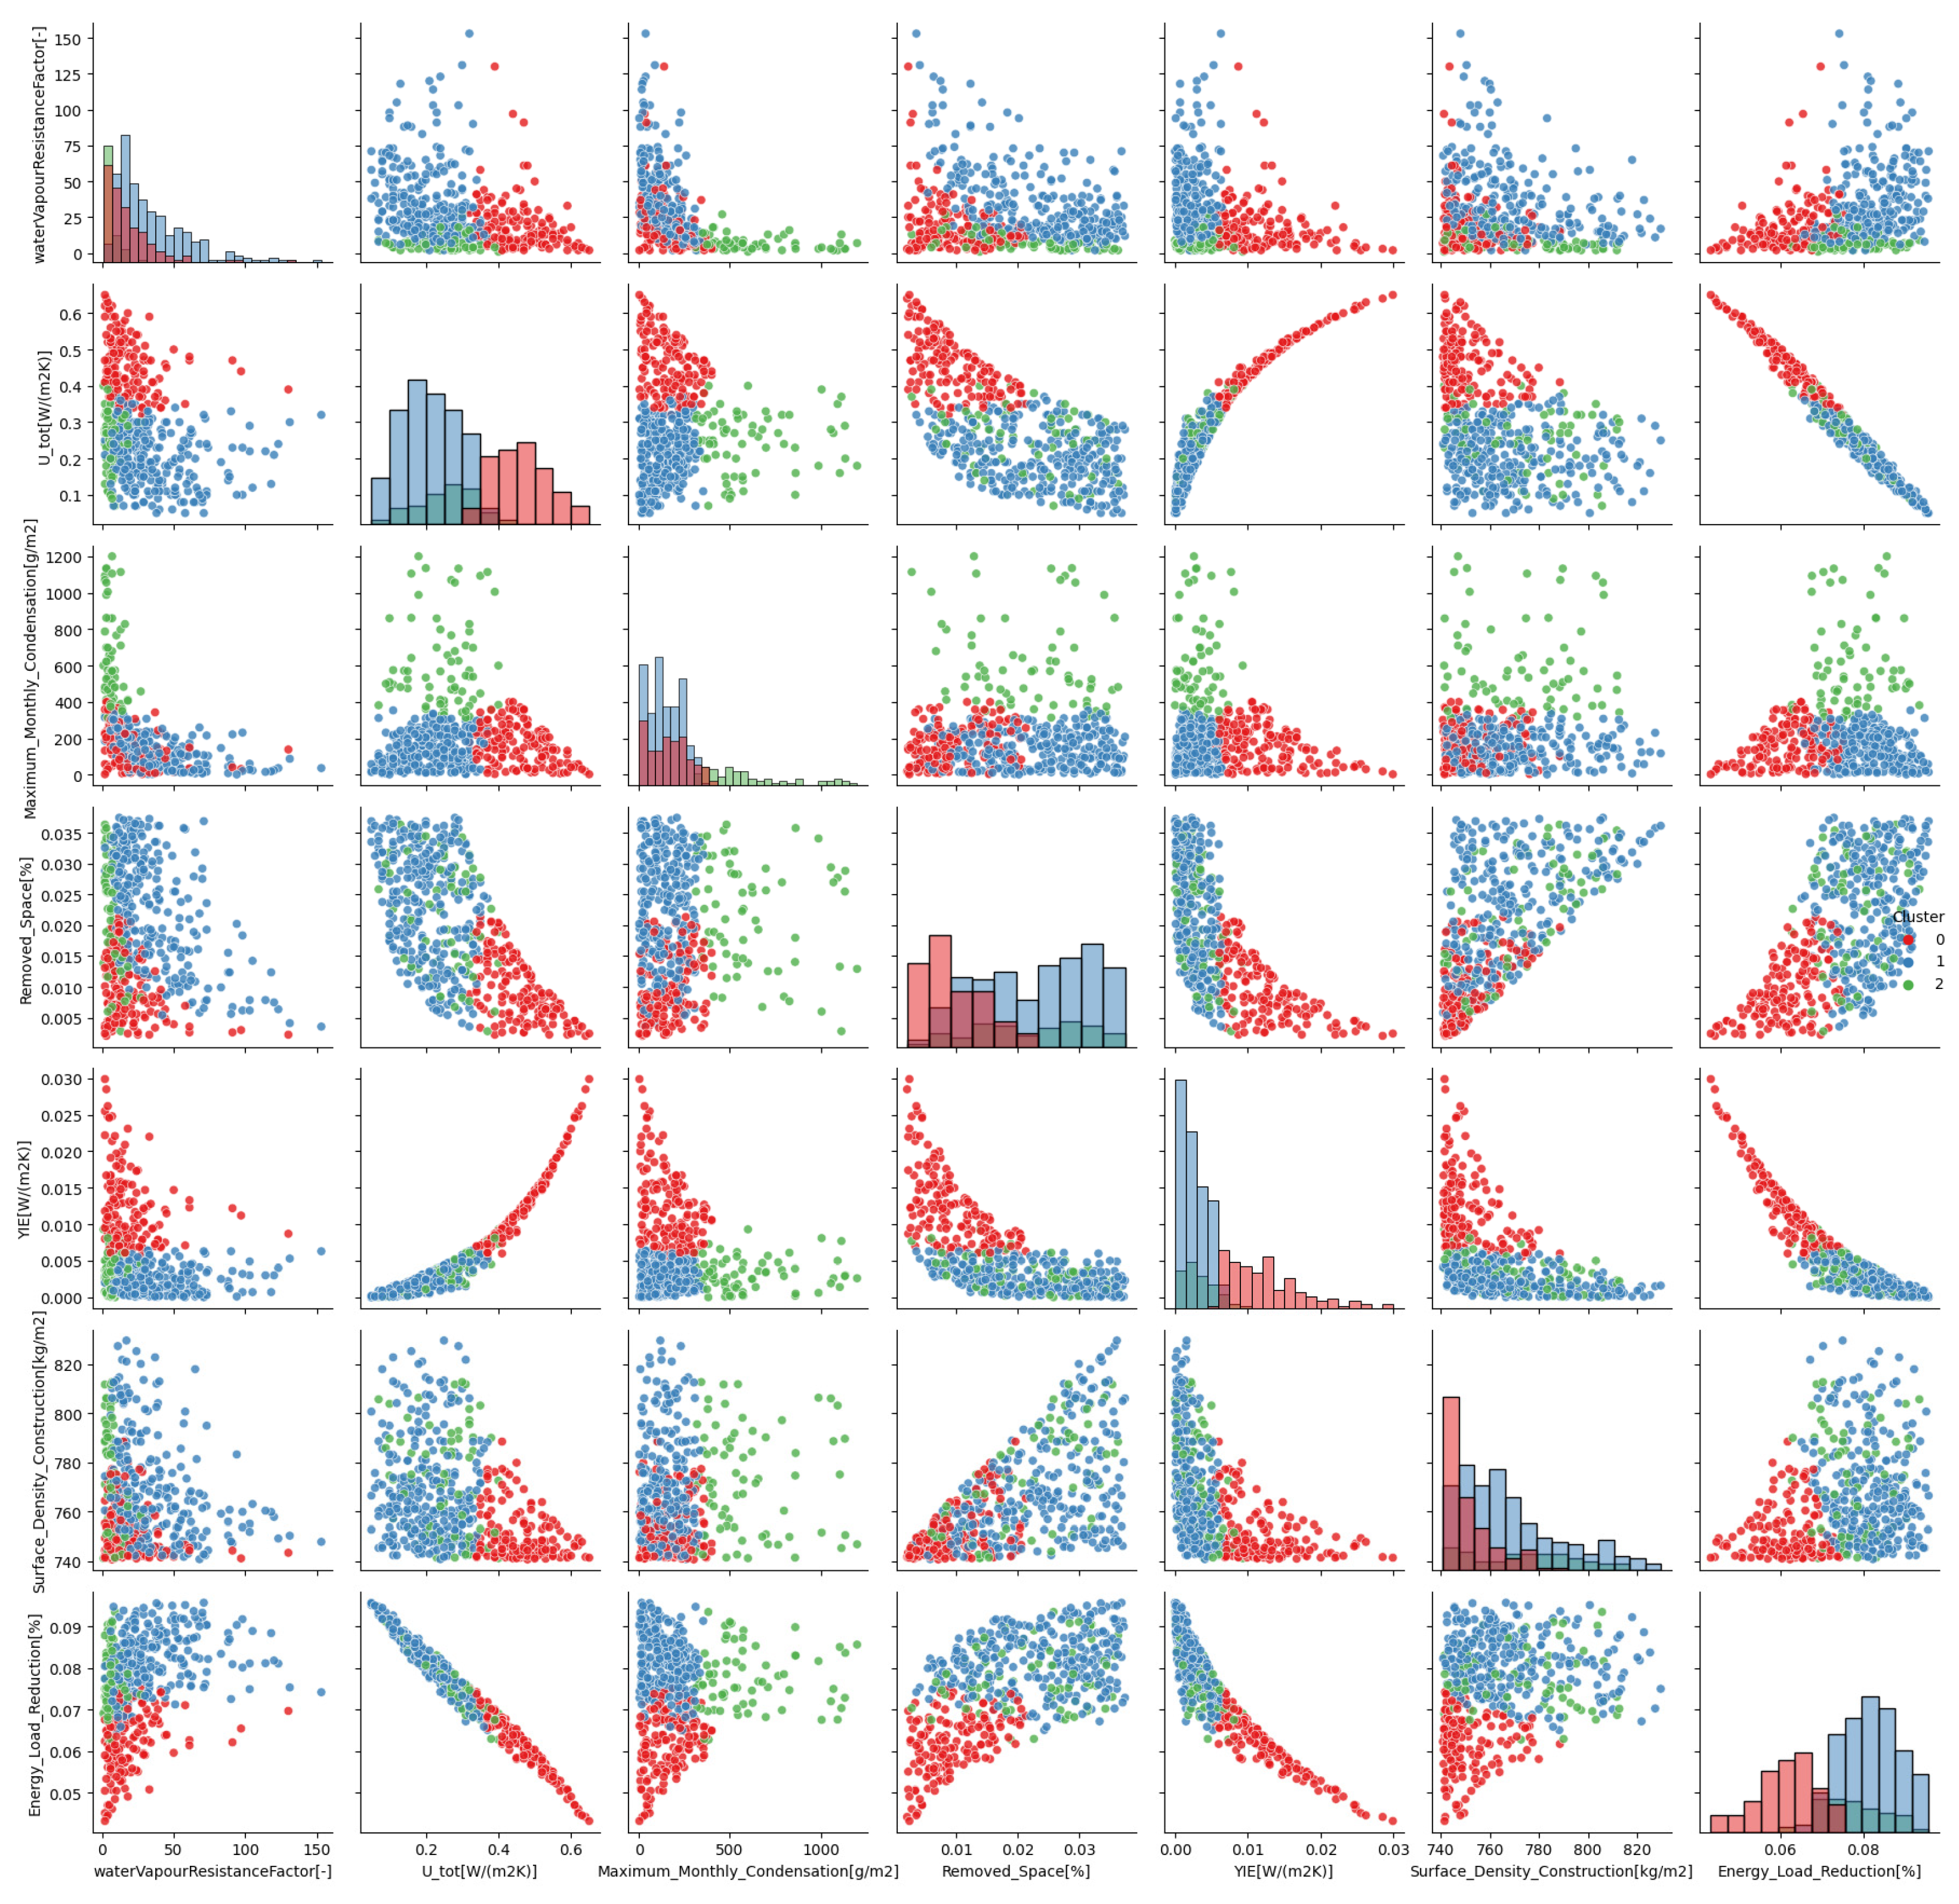
5.1. Interpretation of Multicriteria Analysis

Based on the graphical analyses, each identified cluster was associated with commercially available materials, characterized by distinct thermal and hygrometric properties. This evaluation aims to bridge theoretical analytical findings with actual materials, facilitating comparative assessments of real-world solutions.
Within the dataset exhibiting condensation formation, three clusters (C1, C2, and C3) were distinctly identified. These clusters represent solutions with higher vapor permeability.
  • Cluster C1 represents solutions characterized by high thickness, low thermal conductivity, and medium-to-low vapor resistance. This cluster shows the lowest U-values, typically below the regional regulatory threshold of 0.26 W/m2K, coupled with low YIE values, resulting in the highest energy load reduction (up to 9%). Furthermore, solutions in this cluster present a low condensation risk, consistently remaining below the critical threshold of 500 g/m2 monthly condensation (as defined by UNI standards). However, these solutions also necessitate considerable space removal (up to 3.2%) and have a medium panel weight (ranging approximately from 15 to 40 kg/m2).
  • Cluster C2 consists of solutions characterized by high thickness, medium-to-low thermal conductivity, and low vapor resistance. This cluster has a relatively low U-value (averaging around the regulatory limit of 0.26 W/m2K) and exhibits low YIE and acceptable energy load reduction. However, it demonstrates a very high risk of condensation, typically exceeding the threshold of 500 g/m2. The space reduction is similar to that of Cluster C1, and the panel weight is also medium. Due to the significant condensation risk, this cluster should generally be avoided unless additional vapor barriers or retarders are implemented, potentially compromising overall envelope breathability.
  • Cluster C3 groups solutions with reduced thickness, medium thermal conductivity, and low vapor resistance. These solutions consistently exhibit U-values above 0.26 W/m2K, medium YIE, thus resulting in lower energy load reduction but maintaining low condensation risk (always below 500 g/m2). Additionally, these solutions offer minimal space reduction and lighter weight.
In the dataset without condensation formation, two distinct clusters were identified: N1 and N2.
  • Cluster N1 represents solutions characterized by high thickness, medium thermal conductivity, and high vapor resistance. This cluster typically demonstrates moderate-to-low U-values (often below 0.26 W/m2K), low YIE, significant space removal, good energy load reduction, and relatively high panel weight.
  • Cluster N2 consists of solutions characterized by low thickness, high thermal conductivity, and high vapor resistance. This cluster consistently shows high U-values (well above the regulatory threshold of 0.26 W/m2K), high YIE, minimal space reduction, and negligible energy consumption reduction. Solutions in this cluster are lightweight but significantly underperforming.
In summary, Cluster C2 should be avoided due to the high risk of condensation. To mitigate this issue, it would be necessary to add a vapor barrier or vapor retarder, which would however limit the breathability of the building envelope. Cluster C3 provides smaller energy improvements but occupies less space and includes lighter materials. Cluster C1 offers the best performance, but as a downside, it requires significant space. Cluster N2 should be discarded due to inadequate performance, whereas Cluster N1 remains interesting despite offering limited breathability.
In other words, Clusters C1, C3, and N1 emerge as the most viable options. Cluster C1 is optimal when prioritizing substantial reductions in energy consumption. Clusters C3 and N1 are preferable for projects where interior space conservation is a priority. Specifically, Cluster C3 provides higher breathability with minimal condensation risk compared to Cluster N1, which presents lower condensation risk but reduced breathability.
Cluster C1 can be associated with insulating materials such as medium-thickness polymeric panels (for example, EPS). These materials provide high insulation performance but are not the most breathable. Cluster C2 can be associated with natural insulating materials characterized by low vapor resistance and good thermal conductivity, such as hemp fiber, wood fiber, and reed panels, or mineral insulating materials like rock wool with low vapor resistance. Among these, reed panels and hemp fiber are locally available near Bologna. However, due to their relatively low vapor resistance, they should be combined with vapor barriers to prevent excessive condensation. Cluster C3 can be associated with insulating materials such as panels based on calcium silicate hydrates, which offer medium thermal conductivity and good breathability. In this cluster, panels made of clay and expanded clay with average conductivity and moderate-to-low vapor resistance can also be included. The use of clay is particularly relevant in the Bologna context, where the historic city center has been built almost exclusively with clay-based bricks since ancient times. Moreover, these materials demonstrate a good hygrothermal balance. Nevertheless, it should be noted that it is rare to find clay-based market-available materials with the conductivity identified by the cluster (i.e., 0.04–0.08 W/mK versus 0.12 W/mK, as stated in one of the technical data sheets of the clay panels with highest thermal performance found on the web); hence, if oriented towards this material, there is the need to develop custom clay-based solutions. On the other hand, Cluster N1 and Cluster N2 can be associated with synthetic insulating materials which, although they can achieve high thermal insulation performance in reduced thicknesses, must be carefully evaluated for use in historic buildings (they can form excessively rigid vapor barriers, potentially altering the hygrothermal behavior of the masonry), or they may be represented by lightweight concretes that inherently exhibit low insulating performance.
The Implications of this analysis are twofold. First, from an operational perspective, it will support the development of panels within the HERIT4AGES project, which, based on the Cluster C3 solutions, will be designed, prototyped, optimized, manufactured, installed, and tested on the selected case study over the course of the project. Second, from a methodological standpoint, we believe this analysis exemplifies a broader framework, presented in the paper, that can guide the design processes for such solutions. In professional practice, it may happen to rely on technological options (e.g., thermal insulation systems) chosen according to external contextual factors (such as market availability) rather than intrinsic characteristics of the element being modified. In some circumstances, professionals might assume that a given solution is universally applicable, failing to match specific solutions to the object of intervention because decisions are taken on an “experiential bias” driven by operational constraints. Moreover, the software tools typically used for energy analysis allow the evaluation of a single solution against local regulations but do not enable comparison of multiple options to identify the most suitable from various standpoints. This approach risks overlooking the multiplicity of the many critical factors when intervening in the built heritage.

5.2. Contribution of the Paper

The methodology for multicriteria analysis of internal insulation strategies in historic buildings is discussed below, highlighting its advantages and limitations.
From a design-support perspective, the proposed method acts as a decision-making aid by exploring a wide range of insulation options rather than relying on a traditional deterministic approach. While conventional workflows typically begin with the assumption of a specific material and evaluate its performance afterwards, the methodology introduced here reverses this logic: it starts from the desired performance criteria and identifies a spectrum of compatible materials. This approach allows for the early exclusion of unsuitable options and clarifies the trade-offs between viable solutions. As a result, the process helps overcome potential biases in material selection during the early design stages. It enhances accessibility for non-experts—such as building owners—who may benefit from a qualitative understanding of insulation strategies through performance-based clustering before making financial decisions or planning interventions.
This logic aligns well with the goals of the HERIT4AGES project, which aims to develop innovative internal insulation panels using recycled and/or local materials (solutions not necessarily available on the market). The insights generated through this methodology will directly support the development of custom panels for the Bologna demo site, combining simulation outcomes with user feedback to enable data-driven retrofit strategies and improve stakeholder awareness through the use of clear performance metrics and KPIs.
From a methodological standpoint, the paper introduces a digital framework combining structured information management through HBIM with performance analysis conducted via VPL. The HBIM model serves as a structured repository of the data required for simulation and forms the foundation for the future development of a digital twin of the classroom under study. This approach merges the benefits of having a centralized, organized data structure with the flexibility of using interoperable, customizable performance assessment tools independent from commercial software environments.
Although multicriteria decision-making approaches—such as the Analytic Hierarchy Process (AHP), Technique for Order Preference by Similarity to Ideal Solution (TOPSIS), and ELimination and Choice Expressing REality (ELECTRE)—are commonly employed to rank retrofit alternatives via weighted scoring [33,34,35], our methodology departs from these paradigms in two fundamental ways. First, it relies on data-driven grouping instead of weighted ranking. By applying K-means clustering directly to the simulated performance indicators (e.g., condensation risk, energy savings, usable-space loss), we identify homogeneous clusters of internal insulation solutions without prescribing subjective criterion weights. This uncovers distinct “performance archetypes” that designers can then select according to project-specific priorities. Second, the clustering is integrated with the HBIM–VP–BEM workflow. Whereas most MCDM implementations require manual data export and standalone decision-support tools, our clustering routine is embedded within a single parametric script that seamlessly links HBIM geometry, visual programming, and energy simulation. The result is an end-to-end, scalable, and reproducible data management strategy, which can be extended to integrate additional key performance indicators, such as Life Cycle Cost (LCC) analyses for estimating investment and payback periods or Life Cycle Assessment (LCA) analyses to evaluate emissions associated with the production, transport, installation, and disposal of materials. Similarly, it can be adapted to assess design for disassembly and reversibility of solutions, which are key aspects in the context of interventions in historic heritage. Given its structured parametric process and clear performance criteria, the methodology is also scalable and replicable for other case studies. It supports the contextual tailoring of retrofit solutions, ensuring not only energy efficiency but also compatibility with the specific characteristics of the existing buildings.
A noteworthy added value of this work is the development and integration of custom GHPython components, specifically designed to calculate performance metrics according to UNI standards. This represents a significant step forward, as these components can be further consolidated into a dedicated GH plugin for envelope performance analysis, enabling parametric evaluation in a fully visual and programmable environment. The development of these components was motivated by the lack of existing plugins capable of addressing all required aspects, aside from Ladybug Tools (which presented limitations themselves, particularly in condensation risk assessment).

5.3. Limitations and Future Work

Despite the advantages outlined above, several limitations of the current approach must be acknowledged, many of which open up avenues for future improvement and research.
First, the current condensation analysis is simplified and would benefit from integration with more specialized finite element (FEM) tools. As such, the results presented should be interpreted as comparative rather than predictive. Regarding this aspect, it is essential to note that accurately estimating the exact amount of condensation remains challenging—even with advanced tools—due to the limited knowledge of historic buildings’ material and hygrothermal properties. These uncertainties are often caused by the heterogeneity of traditional construction materials, which are challenging to characterize comprehensively, especially when destructive testing is not allowed.
Second, the energy simulations can be refined. In the present study, model calibration was performed by aligning the annual energy demand of the simulated classroom with data from previous research, maintaining a deviation of ±5%. This approach offers only an approximate calibration and does not provide precise predictions of actual heating and cooling energy use. Rather, it serves as a reliable basis for comparing different retrofit solutions. In other words, the model may be subject to the “performance gap” [36]. Future work will focus on improving calibration by integrating real-time indoor temperature data, actual occupancy patterns, and natural ventilation rates, currently being collected via a dedicated sensor network. This will allow for a more accurate comparison of design alternatives and improved predictive capability.
Third, at this stage, the performance of retrofit solutions is to be considered as indicative. As part of the HERIT4AGES project, the results of this study will feed the necessary analysis of prototype panels, which will be developed and installed in the case study building. Through the use of a sensor-based monitoring system and integration into the digital twin, it will be possible to assess real-world impacts, going beyond simulation outputs. Future research will aim to bridge this gap by validating predicted benefits with actual performance data.
Finally, the current analysis framework evaluates the impact of retrofitting a single type of building surface (e.g., opaque vertical walls). Future updates to the GH script are necessary to enable simultaneous assessment of multiple components—such as walls, floors, and roofs—as well as transparent envelope elements when interventions in these components are permissible under cultural heritage regulations.

6. Conclusions

Applying internal insulation is a viable strategy for enhancing the energy performance of historic buildings, especially when preserving external aesthetics is essential. This approach can reduce energy demand and improve thermal comfort. However, careful assessment of potential challenges, such as alterations to the hygrothermal balance that may lead to condensation and moisture accumulation, is required. Therefore, comprehensive, multicriteria evaluations can be helpful to ensure that energy efficiency improvements do not compromise the structural integrity of these constructions.
This paper introduces an assessment methodology that employs parametric algorithms and integrates various digital tools (including VP, HBIM, and BEM) to support designers throughout the analysis and design phases, aligning them with specific performance requirements. The process begins with a detailed survey of the building’s geometric features using laser scanning technology, leading to the creation of an HBIM. This model, enriched with comprehensive data, facilitates the generation of a BEM. An initial analysis of this BEM establishes the baseline energy performance. Subsequently, the model is enhanced by incorporating insulation panels, each defined by a range of geometric, construction, and performance parameters. The algorithm identifies and compares multiple design solutions for improving the building envelope through a multicriteria optimization process by setting numerical targets for the desired final performance. Despite the uncertainties discussed in calibrating the energy models, this approach allows for identifying various project priorities and comparing different design options.
The algorithm has been applied to a case study within the Horizon Europe project HERIT4AGES: the Faculty of Engineering at the University of Bologna, a historic building built in the 1930s. Nonetheless, given its foundation on an information system with procedurally established workflows, the algorithm could be easily extended to other case studies within the project.
In future developments, uncertainties in model calibration will be addressed more thoroughly using real data from sensors installed within the pilot studies. Additionally, the project plans to prototype the so-called “renovation solutions”, which consist of easily demountable internal insulation panels made from local and recycled materials. Pilot buildings will install these panels to monitor specific output values using real data. Subsequently, real and simulated data will be compared to strengthen the methodology and enhance its scalability beyond the project’s context.
A significant contribution of this work is the development of the GH components, implemented in Python, for calculating the performance requirements of construction stratigraphies according to EN ISO 13786:2017 [27] and UNI EN ISO 13788:2012 [28]. These components are fundamental within the study’s framework, as they enable a parametric analysis to evaluate multiple intervention solutions and allow support for the designer’s decisions, highlighting the most critical priorities.
In conclusion, this work demonstrates the importance of digital tools and information systems through process modeling—and not only object modeling—for the performance analysis of historic buildings, which is a critical aspect to be considered in renovation design to preserve our heritage and make it adaptable to the contemporary context.

Author Contributions

Conceptualization, A.M. and C.M.; methodology, A.M., L.M. and C.M.; software, A.M. and L.M.; validation, C.M. and I.K.; formal analysis, L.M.; investigation, L.M.; resources, A.M., G.P. and R.G.; data curation, L.M.; writing—original draft preparation, A.M.; writing—review and editing, C.M., I.K., G.P. and R.G.; visualization, A.M. and L.M.; supervision, G.P. and R.G.; project administration, R.G.; funding acquisition, R.G. All authors have read and agreed to the published version of the manuscript.

Funding

Funded by the European Union under Grant Agreement No. 101123175. Views and opinions expressed are however those of the author(s) only and do not necessarily reflect those of the European Union or CINEA. Neither the European Union nor the granting authority can be held responsible for them.

Data Availability Statement

This study is part of the ongoing HERIT4AGES project. Data supporting the findings are available upon reasonable request from the corresponding author, subject to applicable restrictions.

Acknowledgments

The authors thank the companies that generously contributed by providing some of the local materials analyzed in this study, particularly La Banca della Calce Srl (Bologna, Italy) for supplying reed panels, hemp-based thermal plaster, and hemp panels, and Ecofelsinea Srl (Bologna, Italy) for providing clay, reclaimed earth, and construction demolition waste.

Conflicts of Interest

The authors declare no conflicts of interest.

Abbreviations

The following abbreviations are used in this manuscript:
AHCEPeriodic external areal heat capacity
AHCIPeriodic internal areal heat capacity
BEMBuilding energy modeling/model
BIMBuilding information modeling/model
DFDamping factor
EDHTotal energy demand for heating
EDCTotal energy demand for cooling
EDTOTTotal energy demand
ELREnergy load reduction
EPEnergyPlus
GHGrasshopper
HVACHeating, ventilation, air conditioning
HBHoneybee (Ladybug Tools)
HBIMHeritage building information modeling/model
IDFInput Data Format
IFCIndustry Foundation Class
IoTInternet of Things
KPIKey performance indicator
LCCLife Cycle Cost
LCALife Cycle Assessment
MMCMaximum monthly condensation
PSPhase shift
RSReduced space
SDSurface density
STEExternal surface temperature
STIInternal surface temperature
TLSTerrestrial laser scanner
TYCTotal yearly condensation
UTOTThermal transmittance
VPVisual programming
YIEPeriodic thermal transmittance

Appendix A

Table A1. Mapped properties for space and zone elements in the BIM.
Property NameDescriptionQuantity
Artificial LightingIndication whether this space requires artificial lighting.Boolean [-]
Equipment Power DensityThe maximum electrical power input to using electric appliances in a zone, including PCs, plotters, elevators and other equipment.Power Density [W/m2]
IlluminanceRequired average illuminance value for this space.Illuminance [lux]
IsCooledIndicates whether this space requires air conditioning provided.Boolean [-]
IsHeatedIndicates whether this space requires heating provided.Boolean [-]
Is Mechanically VentilatedIndicates whether the space is required to have mechanical ventilation.Boolean [-]
Is Naturally VentilatedIndicates whether the space is required to have natural ventilation.Boolean [-]
Is OccupiedIndicates whether the space is permanently occupied or not according to energy modeling purposes.Boolean [-]
Lighting Power DensityThe maximum electrical power input to lighting in a zone, including ballasts, if present.Power Density [W/m2]
Mechanical Ventilation RateIndication of the requirement of a particular mechanical air ventilation rate, given in air changes per hour.Air Changes [h−1]
Mechanical Ventilation Rate Per PersonMechanical ventilation rate per person standard value for mechanical ventilation of spaces given by UNI EN 10339.Air Changes [L/s pp]
Mechanical Ventilation Rate Per VolumeMechanical ventilation rate standard value for mechanical ventilation of special spaces given by UNI EN 10339.Air Changes [L/s pp]
Natural VentilationRateIndication of the requirement of a particular natural air ventilation rate, given in air changes per hour.Air Changes [L/s pp]
Occupancy DensityDesign occupancy loading for this type of usage assigned to this space according to UNI EN 10339.Occupancy Density [pp/m2]
Occupancy Density PeakNumber of people estimated to be in an area of the facility in occupancy peak hours.Occupancy Density [pp/m2]
Occupancy NumberNumber of people required for the activity assigned to this space.People Count [pp]
Space Humidity MaxMax humidity of the space or zone that is required from user/designer view pointRelative Humidity [%]
Space Humidity MinMin humidity of the space or zone that is required from user/designer view pointRelative Humidity [%]
Space Temperature Summer MaxMaximal temperature of the space or zone for the hot (summer) period, that is required from user/designer view point.Temperature [°C]
Space Temperature Summer MinMinimal temperature of the space or zone for the hot (summer) period, that is required from user/designer view point.Temperature [°C]
Space Temperature Winter MaxMaximal temperature of the space or zone for the cold (winter) period, that is required from user/designer view point.Temperature [°C]
Space Temperature Winter MinMinimal temperature of the space or zone for the cold (winter) period, that is required from user/designer view point.Temperature [°C]
Space Wind Load RatingWind load resistance rating for the window and doors located in the space (according to EN15254).Label [-]
Table A2. Mapped properties for wall, floor, and roof elements in the BIM.
Property NameDescriptionQuantity
Construction TypeName of the set of materials associated with walls, roofs, floors, windows, and doors modeled in BIM (i.e., wall type, floor type, or roof type)Label [-]
Is ExternalIndicates whether the element is designed for use in the exterior or not.Boolean [-]
Surface TypeType of surface according to EnergyPlus: can be “Exterior”, “Adiabatic”, “Underground”, “Interzone”Label [-]
Thermal Transmittance *Thermal transmittance coefficient (U-Value) of the interface element.Thermal Transmittance [W/m2K]
Thickness **Thickness of the interface element.Length [m]
* Property value automatically calculated by Autodesk Revit after entering the data for the materials comprised by the construction type, including layer thickness [m], density [kg/m3], specific heat capacity [J/kg°C], and thermal conductivity [W/mK]. ** Property value automatically calculated by Autodesk Revit after entering the thickness data for the materials comprising the material layerset.
Table A3. Mapped properties for window and door elements in the BIM.
Property NameDescriptionQuantity
Frame MaterialMaterial of the frame of the openingLabel [-]
Frame Thermal Transmittance *Thermal transmittance of the frame of the openingThermal Transmittance [W/m2K]
Frame ThicknessThickness of the frame of the openingLength [m]
Glass1 ThicknessThickness of the first (inner) glass layer.Length [m]
Glass2 ThicknessThickness of the second (intermediate or outer) glass layer, if present.Length [m]
Glass3 ThicknessThickness of the third (outer) glass layer, if present.Length [m]
Glass LayersNumber of glass layers within the frame.Count [-]
Glass Thermal Transmittance *Thermal transmittance coefficient (U-Value) of the gas.Thermal Transmittance [W/m2K]
Glazing Area FractionFraction of the glazing area relative to the total area of the filling element.Ratio [%]
HeightTotal outer height of the window liningLength [m]
Is ExternalIndication whether the element is designed for use in the exterior or not.Boolean [-]
Solar Heat Gain Transmittance *The ratio of incident solar radiation that contributes to the heat gain of the interior, it is the solar radiation that directly passes plus the part of the absorbed radiation that is distributed to the interior.Ratio [%]
Solar ReflectanceThe ratio of incident solar radiation that is reflected by a glazing system.Ratio [%]
Solar TransmittanceThe ratio of incident solar radiation that directly passes through a system.Ratio [%]
Thermal Transmittance *Overall thermal transmittance coefficient (U-Value) of the opening element.Thermal Transmittance [W/m2K]
Visible Light ReflectanceFraction of the visible light that is reflected by the glazing at normal incidence. It is a value without a unit.Ratio [%]
Visible Light TransmittanceFraction of the visible light that passes the object at normal incidence. It is a value without a unit.Ratio [%]
WidthTotal outer width of the window lining.Length [m]
Wind Load RatingWind load resistance rating for this object. It is provided according to the national building code.Label [-]
* Property values estimated according to the suggestions of UNI TS 11300-1:2014.

References

  1. European Green Deal. Available online: https://commission.europa.eu/strategy-and-policy/priorities-2019-2024/european-green-deal_en (accessed on 5 June 2025).
  2. Renovation Wave. Available online: https://energy.ec.europa.eu/topics/energy-efficiency/energy-efficient-buildings/renovation-wave_en (accessed on 5 June 2025).
  3. European Commission, New European Bauhaus. 2021. Available online: https://new-european-bauhaus.europa.eu/index_en (accessed on 5 June 2025).
  4. European Commission, Built4People. 2023. Available online: https://build-up.ec.europa.eu/en/resources-and-tools/links/built4people-b4p (accessed on 5 June 2025).
  5. Ide, L.; Gutland, M.; Bucking, S.; Santana Quintero, M. Balancing Trade-offs between Deep Energy Retrofits and Heritage Conservation: A Methodology and Case Study. Int. J. Archit. Herit. 2022, 16, 97–116. [Google Scholar] [CrossRef]
  6. Pagoni, P.; Møller, E.B.; Peuhkuri, R.H.; Jensen, N.F. Evaluation of the performance of different internal insulation systems in real-life conditions—A case study. Build. Environ. 2025, 267, 112319. [Google Scholar] [CrossRef]
  7. Andreotti, M.; Calzolari, M.; Davoli, P.; Dias Pereira, L. Hygrothermal performance of an internally insulated masonry wall: Experimentations without a vapour barrier in a historic Italian Palazzo. Energy Build. 2022, 260, 111896. [Google Scholar] [CrossRef]
  8. Zhou, X.; Derome, D.; Carmeliet, J. Analysis of moisture risk in internally insulated masonry walls. Build. Environ. 2022, 212, 108734. [Google Scholar] [CrossRef]
  9. Angrisano, M.; Fabbrocino, F.; Iodice, P.; Girard, L.F. The Evaluation of Historic Building Energy Retrofit Projects through the Life Cycle Assessment. Appl. Sci. 2021, 11, 7145. [Google Scholar] [CrossRef]
  10. Lisitano, I.M.; Laggiard, D.; Fantucci, S.; Serra, V.; Fenoglio, E. Evaluating the Impact of Indoor Insulation on Historic Buildings: A Multilevel Approach Involving Heat and Moisture Simulations. Appl. Sci. 2021, 11, 7944. [Google Scholar] [CrossRef]
  11. Hutkai, K.; Katunský, D.; Zozulák, M. Internal insulation systems and their assessment for historic buildings by hygrothermal simulation. IOP Conf. Ser. Mater. Sci. Eng. 2022, 1252, 012069. [Google Scholar] [CrossRef]
  12. Herit4Ages-User-Centric and Data-Driven Retrofitting Solutions for a Resilient, Energy-Efficient, Low Emission and Inclusive Cultural Heritage. Available online: https://www.herit4ages.eu/ (accessed on 5 June 2025).
  13. Predari, G.; Prati, D.; Massafra, A. Modern Construction in Bologna. The Faculty of Engineering by Giuseppe Vaccaro, 1932–1935. In Digital Modernism Heritage Lexicon; Springer Nature Switzerland AG: Cham, Switzerland, 2021; pp. 233–258. [Google Scholar]
  14. Decreto Legislativo 22 Gennaio 2004, n. 42. Codice dei Beni Culturali e del Paesaggio, ai Sensi Dell’articolo 10 Della Legge 6 Luglio 2002, n. 137; 2004. Available online: https://www.torrossa.com/en/resources/an/2461925 (accessed on 5 June 2025).
  15. Gulli, R.; Predari, G. Il Moderno a Bologna: La Facoltà di Ingegneria di Giuseppe Vaccaro (1932–1935). ANANKE 2018, 83, 101–108. [Google Scholar]
  16. Predari, G.; Gulli, R. Types and models of Italian Modern Heritage. The work of Giuseppe Vaccaro in Emilia Romagna Region (1930–1950). Tema Technol. Eng. Mater. Archit. 2017, 3, 37–48. [Google Scholar]
  17. Massafra, A.; Gulli, R. Enabling Bidirectional Interoperability Between BIM and BPS Through Lightweight Topological Models. In Proceedings of the eCAADe 2023: Digital Design Reconsidered, Graz, Austria, 18–23 September 2023; pp. 187–196. [Google Scholar] [CrossRef]
  18. Massafra, A.; Costantino, C.; Predari, G.; Gulli, R. Building Information Modeling and Building Performance Simulation-Based Decision Support Systems for Improved Built Heritage Operation. Sustainability 2023, 15, 11240. [Google Scholar] [CrossRef]
  19. buildingSMART International, Industry Foundation Classes (IFC). Available online: https://technical.buildingsmart.org/standards/ifc (accessed on 18 August 2023).
  20. EnergyPlus. Available online: https://energyplus.net/ (accessed on 8 May 2023).
  21. Robert McNell & Associates, Rhino-Rhinoceros 3D. Available online: https://www.rhino3d.com/it/ (accessed on 30 April 2024).
  22. Rhino.Inside.Revit. Available online: https://www.rhino3d.com/inside/revit/beta/ (accessed on 5 June 2025).
  23. LadyBug Tools. Available online: https://www.ladybug.tools/ (accessed on 18 January 2023).
  24. LadybugTools, EPW Map. Available online: https://www.ladybug.tools/epwmap/ (accessed on 8 January 2024).
  25. Zwierzycki Mateusz, Anemone. 2015. Available online: https://www.Food4rhino.com/en/app/anemone (accessed on 10 April 2025).
  26. Regione Emilia Romagna. Approvazione Delle Modifiche all’ “Atto di Coordinamento Tecnico Regionale per la Definizione dei Requisiti minimi di Prestazione Energetica degli Edifici” di cui alla Propria Deliberazione N. 967/2015 e S.M.I.; Regione Emilia Romagna: Bologna, Italy, 2022; Volume DGR 1261/2022. [Google Scholar]
  27. ISO 13786:2017; Thermal Performance of Building Components—Dynamic Thermal Characteristics—Calculation Methods. ISO: Geneva, Switzerland, 2017. Available online: https://www.iso.org/standard/65711.html (accessed on 5 June 2025).
  28. UNI EN ISO 13788:2012; Hygrothermal Performance of Building Components and Building Elements—Internal Surface Temperature to Avoid Critical Surface Humidity and Interstitial Condensation—Calculation Methods. ISO: Geneva, Switzerland, 2012. Available online: https://www.iso.org/standard/51615.html (accessed on 5 June 2025).
  29. EnergyPlus Input Output Reference, Version 8.0. Big Ladder Software. Available online: https://bigladdersoftware.com/epx/docs/8-0/input-output-reference/index.html (accessed on 5 June 2025).
  30. MacQueen, J.B. Some Methods for Classification and Analysis of Multivariate Observations. In Proceedings of the Fifth Berkeley Symposium on Mathematical Statistics and Probability, Davis Davis, CA, USA, 18–21 July, 27 December 1965–7 January 1966; Le Cam, L.M., Neyman, J., Eds.; University of California Press: Berkeley, CA, USA, 1967; Volume 1, pp. 281–297. Available online: https://projecteuclid.org/euclid.bsmsp/1200512992 (accessed on 27 February 2025).
  31. Thorndike, R.L. Who Belongs in the Family? Psychometrika 1953, 18, 267–276. [Google Scholar] [CrossRef]
  32. Rousseeuw, P.J. Silhouettes: A graphical aid to the interpretation and validation of cluster analysis. J. Comput. Appl. Math. 1987, 20, 53–65. [Google Scholar] [CrossRef]
  33. Daniel, S.; Ghiaus, C. Multicriteria Decision Analysis for Energy Retrofit of Residential Buildings: Methodology and Feedback from Real Application. Energies 2023, 16, 902. [Google Scholar] [CrossRef]
  34. Choi, S.; Lim, H.; Lim, J.; Yoon, S. Retrofit building energy performance evaluation using an energy signature-based symbolic hierarchical clustering method. Build. Environ. 2024, 251, 111206. [Google Scholar] [CrossRef]
  35. Villalba, P.; Sánchez-Garrido, A.J.; Yepes, V. A review of multicriteria decision-making methods for building assessment, selection, and retrofit. J. Civ. Eng. Manag. 2024, 30, 465–480. [Google Scholar] [CrossRef]
  36. de Wilde, P. The gap between predicted and measured energy performance of buildings: A framework for investigation. Autom. Constr. 2014, 41, 40–49. [Google Scholar] [CrossRef]
Figure 1. Left: The Faculty of Engineering at the University of Bologna. Right: The designated classroom serves as a heritage living lab within the HERIT4AGES project (2024).
Heritage 08 00259 g001
Figure 2. Methodological workflow.
Heritage 08 00259 g002
Figure 3. Terrestrial laser scanner of the classroom (highlighted in red) and adjacent zones in FARO SCENE 2022.2 (2024). The survey was conducted using a FARO CAM2 FOCUS 3D laser scanner (University of Bologna, Bologna, Italy) using a targetless approach, necessitating 15 scans with a resolution of 7.67 mm/10 m and a quality filter of 3×.
Heritage 08 00259 g003
Figure 4. XRD tests performed on the building. Left: identification of sampling points; center: extraction of samples; right: selected brick and plaster samples used for analysis. XRD enabled precise identification of the mineralogical composition of original masonry and plaster, overcoming gaps in historical documentation of the building. The technique confirmed the presence of traditional fired-clay brick substrates and mapped the locations of concealed reinforced-concrete pillars within the wall assemblies.
Heritage 08 00259 g004
Figure 5. Thermal images of the exterior façade of the classroom in summer conditions, taken with a FLIR E8 PRO thermal camera (University of Bologna, Bologna, Italy). The thermograms were used to map material discontinuities in the masonry and identify moisture-related degradation, including percolation paths and rising damp, by pinpointing localized low-temperature anomalies (visible as cooler zones) on a sun-exposed wall surface.
Heritage 08 00259 g005
Figure 6. Left: the HBIM of the Faculty of Engineering; right: a zoomed view of the classroom investigated in this study.
Heritage 08 00259 g006
Figure 7. The GH algorithm used to create the building energy model.
Heritage 08 00259 g007
Figure 8. The building energy model of the case study. On the left, the thermal zones modeled. On the right, the energy model within the context.
Heritage 08 00259 g008
Figure 9. Multicriteria evaluation logic.
Heritage 08 00259 g009
Figure 10. Elbow method and silhouette analysis used to determine the optimal number of clusters for the condensation-present dataset (k = 3).
Heritage 08 00259 g010
Figure 11. Pairplot depicting the results of K-means analysis on the condensation-present cluster.
Heritage 08 00259 g011
Figure 12. Boxplot depicting the results of K-means analysis on the whole dataset.
Heritage 08 00259 g012
Table 1. Methods, tools and references used to calculate the output values for the multicriteria analysis.
OutputCalculation Methods and ToolsReference
UTOT“Honeybee_Decompose EP Construction” GH component, supported by custom GHPython node for better computational speed.EN ISO 13786:2017
[27]
YIECustom GHPython node compliant, developed following the calculation procedures of reference standards.EN ISO 13786:2017
[27]
DFCustom GHPython node compliant, developed following the calculation procedures of reference standards.EN ISO 13786:2017
[27]
PSCustom GHPython node compliant, developed following the calculation procedures of reference standards.EN ISO 13786:2017
[27]
WMultiplication of panel’s thickness and density, computed through basic GH components.-
SDCustom GHPython node compliant, developed following the calculation procedures of reference standards.EN ISO 13786:2017
[27]
AHCI/AHCECustom GHPython node compliant, developed following the calculation procedures of reference standards.EN ISO 13786:2017
[27]
MMCCustom GHPython node compliant, developed following the calculation procedures of reference standards.UNI EN ISO 13788:2012
[28]
TYCCustom GHPython node compliant, developed following the calculation procedures of reference standards.UNI EN ISO 13788:2012
[28]
STI/STECalculated through the “Honeybee_Run EP Simulation” GH component, assumed equal to the EP variable “Surface Inside Face Temperature”.EnergyPlus Input Output Reference [29]
EDHCalculated through the “Honeybee_Run EP Simulation” GH component, assumed equal to the EP variable “Zone Ideal Loads Zone Total Heating Energy”.EnergyPlus Input Output Reference [29]
EDCCalculated through the “Honeybee_Run EP Simulation” GH component, assumed equal to the EP variable “Zone Ideal Loads Zone Total Cooling Energy”.EnergyPlus Input Output Reference [29]
EDTOTSum of EDH and EDC, computed in GH through the “Addition” component.EnergyPlus Input Output Reference [29]
ELRDifference between current EDTOT and design EDTOT, computed through basic GH components.-
RSRatio between the footprint area of the panel and the net floor area of the space, computed through basic GH components.-
Table 2. Hygrothermal characteristics of insulation materials applied to the classroom envelope.
MaterialThermal Conductivity [W/mK]Density
[kg/m3]
Specific Heat [J/kgK]Vapor Resistance
[-]
Thickness
[m]
UTOT
[W/m2K]
YIE
[W/m2K]
DF
[-]
PS
[hh]
SD
[kg/m2]
Reed panels0.05520015002.00.0300.520.01580.03017.32746.36
0.0500.440.01060.02417.98750.36
Hemp-based thermal plaster0.08540015005.00.0200.630.02590.04116.99748.36
0.1000.390.00640.01621.06780.36
Hemp panels (lower density)0.0364013002.00.0300.460.01180.02617.13741.56
0.2000.140.00190.01420.06748.36
Hemp panels (higher density)0.0348017003.90.0200.450.01120.02517.07742.76
0.1600.160.00180.01221.89753.16
Clay panels0.353145011007.50.0160.710.04120.05816.67763.56
0.0220.520.01580.03017.32746.36
Table 3. Performance metrics of insulation materials applied to the classroom envelope.
MaterialThermal Conductivity [W/mK]Density
[kg/m3]
Specific Heat
[J/kgK]
Vapor Resistance
[-]
Thickness
[m]
MMC
[g/m2]
EDTOT
[kWh]
ELR
[%]
RS
[%]
Reed panels0.05520015002.00.03041021,2572.40.6
0.05040421,1133.10.9
Hemp-based thermal plaster0.08540015005.00.02017821,4771.40.4
0.10021421,0843.21.8
Hemp panels (lower density)0.0364013002.00.03038521,1113.10.5
0.200146620,5895.53.7
Hemp panels (higher density)0.0348017003.90.02039021,1003.10.4
0.16094920,6375.22.9
Clay panels0.353145011007.50.016021,7330.20.3
0.022021,7180.30.4
Table 4. Overview of the dataset generated through the 10,000 iterations.
Thermal Conductivity [W/mK]Density
[kg/m3]
Specific Heat
[J/kgK]
Vapor Resistance
[-]
Thickness
[m]
UTOT
[W/m2K]
YIE
[W/m2K]
DF
[-]
PS
[hh]
SD
[kg/m2]
AHCI
[kJ/m2K]
MMC
[g/m2]
TYC
[g/m2]
EDTOT
[kWh]
ELR
[%]
RS
[%]
0.0941261547390.0860.440.01040.02418.0975114.140020,4046.31.6
0.0242901841490.1650.120.00020.0028.6178812.15161619,8698.83.1
0.03533216381560.1970.140.00020.0028.6480514.530019,9228.53.7
0.0121691745100.1690.060.00010.0019.847686.6690530219,7319.43.2
0.0432728742340.0960.280.00440.01619.907669.950020,1237.61.8
0.0709111372300.0370.530.01640.03117.0874318.370020,5375.70.7
0.039464180040.0920.270.00210.0080.6678318.4576546920,1667.41.7
0.055251077980.1930.210.00330.01618.217454.230019,9448.43.6
0.0321481479200.1890.140.00080.0061.997689.2217910419,8788.73.5
0.034251369190.1430.180.00280.01518.327433.6618912419,9018.62.7
Disclaimer/Publisher’s Note: The statements, opinions and data contained in all publications are solely those of the individual author(s) and contributor(s) and not of MDPI and/or the editor(s). MDPI and/or the editor(s) disclaim responsibility for any injury to people or property resulting from any ideas, methods, instructions or products referred to in the content.

