1. Introduction
The method of dating ancient masonry based on systematic observation and measurement of the dimensions of architectural elements (in particular building materials) has its roots in a moment long before the definition of mensiochronology.
With regard to the Italian context and ancient Roman architecture, already at the beginning of the 20th century, Esther Boise Van Deman drew attention to dimensional variations in building materials and deduced that such variations could be used to date ancient structures [
1,
2]. The insight was based on the assumption that the measurements taken in ancient building sites were not random but reflected specific units of measurement in use in certain historical and geographical contexts. Through the recognition of recurring modules in the dimensions of stone blocks and bricks and their evolution over time, it was thus possible to establish a chrono-typology and to attempt relative dating hypotheses, on the construction phases of a building, and absolute ones.
In a time when the stratigraphic method had not yet become part of archaeological practice, Van Deman’s approach offered a supplement to traditional stylistic studies by providing a more objective and quantitative reading of ancient building.
Despite the path traced by the American scholar, the study of Roman building techniques remained, for a long time, characterised by ”stylistic-comparative” analyses on which the reconstruction of the diachronic development of building techniques was mainly based on the description of the formal characteristics of the wall face.
Giuseppe Lugli, with particular reference to the brickwork, introduced a more standardised method that led to a chronological–typological classification based on objective parameters aimed to illustrate the processing of materials and their composition in the masonry [
3]. According to Lugli, the analysis of brickwork must take into account 10 fundamental issues through which the characteristics of brick masonry can be described briefly and objectively:
Quality of the brick;
Shape of the brick;
Quality of the mixture;
Colour of the mixture;
Length of the bricks in the wall face;
Thickness of the bricks in the wall face;
Thickness of mortar joints;
Thickness of mortar beds;
Quality and appearance of mortar;
Module measurement of 5 rows of bricks + 5 mortar beds.
Finally, a very important contribution of Lugli’s is that he was the first to define the procedures for cutting bricks and how they determine the measurable length in the wall face. In fact, he produced the first table showing for each module (
bessale,
sesquipedale, and
bipedale) the measurements, both theoretical and practical, of the bricks in the wall face; many other studies followed this one with the aim of making corrections to the number of pieces obtained from each format and to the measurements of the diagonals resulting from the processing [
4] (see
Table 1).
Starting from the 1970s, at the same time as archaeology was showing increasing interest in the early medieval and medieval ages, particular attention began to be paid to the analysis of historic post-antique buildings.
It was in fact the potential offered by the post-antique built heritage, rich in material evidence still mostly preserved in urban contexts, that stimulated the development of a new disciplinary field from which the “archaeology of architecture” was born and which was followed, between the 1980s and 1990s, by the scientific debate on the relationship between archaeology and restoration and on the methods of analysis, intervention, and conservation with particular attention to urban contexts [
8].
The analysis of the architecture built between Late Antiquity and the Middle Ages revealed a production and technological context characterised by a strong regionalisation both in materials, affected by local resources, and consequently in building techniques, in contrast to the Roman age marked by a strong standardisation of building materials, which were mass-produced and employed according to a widely diffused construction process. It was therefore essential to study buildings from a global perspective by analysing individual constructions in close relation to the territory in which they are located and creating regional references, understanding the building characteristics of the territory and its changes over time [
9,
10].
In this context lies the work of Tiziano Mannoni and the Istituto di Storia della Cultura Materiale (ISCUM), who, starting from past experience, developed the definition of mensiochronology as a dating method based on the mathematical and statistical analysis of measurements and the construction of regional mensiochronological curves [
11].
From the 1990s to the present day, although the journal
Archaeology of Architecture was founded in 1996 as a supplement to
Medieval Archaeology, the archaeology of architecture has rapidly spread, establishing itself as an independent discipline characterised by specific methods and tools [
12].
This preferred link with the post-antique period has now been completely overcome, and it is especially with regard to ancient buildings that, over the last 20 years, archaeological investigation has flanked the technical and stratigraphic analysis of masonry with an in-depth study of issues related to building site dynamics and construction processes.
The term “building archaeology” today identifies a specific field of investigation in which the construction of a building is assimilated into the production of an artefact, whereby the researcher’s attention is focused on the analysis of the material traces relating to the sequence of operations connected with it [
13,
14].
This approach aims to highlight not only the construction sequence of the individual masonry units but also the resources; the transport and supply of construction materials; the working and setting up; the spatial and functional organisation of the building site (work and/or material storage areas, preliminary works and infrastructures); the figures involved; such as the workers, the client or the contractor; the technologies employed; and finally the construction time and costs. The analysis of these aspects intersects with and explores historical–geographical (construction materials, building techniques and technologies), social (work organisation and the figures involved) and economic (design, construction times and costs) issues, which once again bring us back to a global perspective that is well suited to the study of ancient architecture.
2. Materials and Methods
In the field of building archaeology, mensiochronology, in addition to being an alternative to more expensive archaeometric dating methods, represents an important quantitative analysis tool useful for understanding the procedures of brick manufacture, working and finishing, and for evaluating the quality of the setting up and the level of expertise of the workers.
In more recent years, as far as brickwork is concerned, there have been several contributions that deal with procedures of dimensional analysis and quantification of wall face materials and that have led to significant updates regarding the knowledge of the “chaîne opératoire” of the Roman age brick [
15,
16,
17].
Among these, for the city of Rome, the studies conducted by Evelyne Bukowiecki should be underlined. Based on the observation and measurements of the bricks in the wall face, whose variability in the buildings analysed for different periods is illustrated by graphs, she determines whether pieces of bessale, sesquipedale or bipedale were used more in a specific wall, while, at the same time, highlighting brick-cutting practices [
7,
8,
9,
10,
11,
12,
13,
14,
15,
16,
17,
18].
In the same direction is the methodological contribution of Maura Medri and her team, who introduce rigorous procedures and parameters to quantify the bricks in the wall face and to measure their dimensional variations. The aim of the study is in fact an in-depth analysis of masonry in order to recognise possible differences in the setting up and materials used even within the same building site [
19,
20].
According to the method introduced by Medri, the first operation concerns the choice of the masonry samples, for which homogeneous surfaces of 1 sqm are selected that do not present elements of discontinuity and are in a good state of conservation.
Once the lengths and thicknesses of the individual bricks have been obtained, an operation conducted manually, brick by brick, on the basis of the restitution in CAD of the orthophotos of each sample (see
Figure 1), the measurements are passed through mathematical and statistical analysis, which is presented as the most reliable procedure for tracing the original modules from which the bricks were cut, and, at the same time, estimating the quantity of bricks needed to make each square metre of masonry.
The first indexes to be calculated are the coverage ratio between bricks and mortar per square metre, the average area of the partial and whole bricks (where whole bricks are all those bricks not cut by the sample perimeter) and the total number of reconstructed whole bricks, i.e., the number of bricks ideally present in the sample. This value is calculated by dividing the sum of the areas of the partial bricks with the average area calculated for the whole bricks. The number of whole bricks in the sample is then added to the result.
In addition, the values concerning the average length and the average height are calculated; these values, however, and especially the lengths, may be misleading in describing the overall behaviour of the masonry as they are conditioned by random dimensional variables resulting from the cutting and/or reuse of materials. In this regard, the calculation of the standard deviation, i.e., the index according to which the measurements of each constituent deviate from their average value, is very effective; in other words, a low index indicates that the measurements of the individual bricks are close to the general average of the sample; on the other hand, the higher the index, the farther the individual measurements are from the average.
Translated into archaeological terms, we could say that, if, for a masonry sample, the standard deviation index is low, this would indicate a homogeneous stock of materials and/or a high level of expertise in the cutting and preparation of the bricks, while, on the other hand, if the standard deviation index is high, we could be faced with different stocks and/or a lower level of expertise. Applying this assumption to the dynamics of the construction site and the knowledge regarding the supply of building materials, it could be supposed that, in the case of homogeneous stocks, the material used is newly made, transported from the factory to the construction site and worked there. On the other hand, for non-homogenous stocks, we could be in the presence of reused material, recovered from pre-existing buildings, or from different stocks of materials, left in storage, and recovered for new construction.
Finally, among the studies presented until now, there is the unique case, difficult to replicate, of the analysis conducted by Stefano Camporeale and Mirella Serlorenzi on structures from the Roman period whose building materials, following the dismantling of the walls, were accurately sampled and counted [
4]. In this way, the analysis was able to penetrate beyond the surface of the wall face and observe the building technique “from the inside”, thus providing a concrete example of comparison for previous quantitative studies. One of the most significant results is undoubtedly the finding that the different types of bricks were subjected to a more complex cutting and working process than traditionally assumed. On the other hand, the detection of the starting module on the basis of the visible measurements in the wall face must be considered as a purely theoretical method, where the reality of the facts shows that, inside a masonry, there were brick pieces of different shapes (triangles, trapeziums, rectangles) assembled according to logics dictated by the internal economy of the building site and/or random circumstances linked to the dynamics of the construction process itself.
These conclusions, which seem to call into question the entire approach applied to Roman brickwork, especially if one considers what was found for medieval buildings, in which bricks were used in their entirety and not in pieces, which was nevertheless not sufficient to invalidate the method but rather led to a deeper reflection on the dynamics of the building site and the supply and working of bricks. In fact, if on the one hand, the lengths of the facing bricks are the result of a cutting operation carried out on site and subject to variables that are difficult to calculate, on the other hand, the measurements of the thicknesses represent a value of great importance since this dimension is not modified during the phases of preparation and setting up of the bricks.
As recently demonstrated by Camporeale [
21], it is always possible, through the direct observation of the profiles of the wall face bricks and the analysis of measurements conducted based on objective parameters, to reconsider notions that have been traditionally consolidated or only rarely examined in depth. This is the case for the so-called “small tiles” of the Roman period, a type of production that does not fit into the three well-known modules indicated by Vitruvius (although he clearly mentions the use of “tegulae fractae” for the composition of the wall face) but which, in the past, had already been highlighted by other researchers at many buildings in Rome and Ostia in the second century A.D.
In order to complete the overview of the problems related to mensiochronology applied to Roman-age brick masonry and its development and diffusion in the scientific community, one cannot fail to address the issues concerning the consumption of time, the subjectivity of the technical solutions implemented and, consequently, the incoherence of the results.
The mensiochronological analysis, even today, largely uses traditional methods with enormous time and fieldwork costs and is therefore mostly conducted in restricted contexts and only in specific cases or for special needs.
The lack of quick and common procedures that can increase the possibilities of application and return coherent and truly comparable data has for a long time forced the carrying out of these analyses to more and more rare occasions, neglecting, moreover, the broader meaning of mensiochronology, whereby the data must be included in a global perspective dedicated to the study of the brick masonry of a given place and period, intersecting with historical–geographical, socio-economic and technological aspects.
Although the development of this methodology already counts several decades, it is clear that in the scientific panorama, there are still too few cases in which it has been or is being systematically applied to the study of masonry.
The reasons for this are to be found mainly in the technical solutions that have been adopted for the collection and processing of measurements and which, until now, have not led to any significant improvement in terms of the time consumption and standardisation of procedures.
First of all, a distinction must be made between acquisition techniques and the processing of measurements, where acquisition techniques refers to survey techniques (direct or indirect) and the processing of measurements refers to mathematical and statistical analysis.
While for survey activities there are established standards and quick and accurate acquisition solutions (laser scanners and photogrammetry) [
22], the extraction of measurements remains a manual activity with enormous time consumption.
In addition, there is a lack of rigorous and standardised procedures, so the data collected is processed using subjective criteria as regards both the choice of parameters and the indices to be calculated. Consequently, the results of the analyses are today hardly comparable, and their statistical value remains fixed to the individual case of applications without being able to be reliably compared with other experiences.
3. Survey Techniques and Tools
Over the last 40 years, architectural and archaeological survey methodologies have been continually pushed by the quick development of digital techniques and tools that have gradually joined the more traditional methodologies without, however, ever completely replacing them. Briefly reviewing the wide range of survey solutions available today is not possible, but it is opportune to underline a few fundamentals: first of all, any analysis that aims to know and study a building must start from the survey.
If direct survey procedures and analogical instruments initially represented the only possible methodology, today, there are digital and multi-scale solutions that make it possible to adapt the surveying activity to different degrees of detail both on the entire building and on portions of it. This flexibility brings undeniable advantages, but it is nevertheless essential to know the objectives of the study in order to consciously choose the most suitable solution. The key factor of this “digital transformation” mainly concerns the possibility of greatly accelerating the surveying activity in the field, gaining not only time but also acquisition accuracy [
23].
Among indirect surveying methodologies, acquisition techniques using laser scanners and photogrammetry, both close-range and drone, are now widespread. One aspect to be considered, just as with any restitution, is the scale factor: it is evident that both laser scanners and photogrammetry can be used for acquisition at various scales, so the possibility of reading detailed elements, such as individual masonry components, is subject to the planning and the objective chosen for the survey itself. If the mensiochronological analysis is part of the activities planned for the study, it is necessary to have surveys comparable to a 1:1 scale, regardless of the technique used [
4] (p. 388).
Recent contributions have compared laser scanner techniques with photogrammetric ones, demonstrating that, although at the cost of longer acquisition and processing times, the photographic quality of the textures and orthophotos obtained with photogrammetry are certainly the most efficient tool for analysing ancient masonry [
24]. Another advantage concerns the autonomy of acquisition in the field so that, with little but essential survey knowledge, an archaeologist can carry out all the surveys necessary for the study by himself.
Starting from the survey, the next step concerns the extraction of measurements, the true starting point for the mensiochronological analysis [
25,
26].
With regard to the archaeological investigation, if, on the one hand, the direct measurement, brick by brick, and the paper annotation of the measurements directly in the field is now an outdated practice, on the other hand, there are many experiences that involve the use of orthophotos later processed in a CAD environment for the brick by brick survey. This procedure represents the main cause of time consumption, although, in recent years, semi-automatic and/or automatic methods of object classification and segmentation based on machine learning algorithms have been establishing themselves [
27].
4. AI and Deep Learning Segmentation for Mensiochronology
The semi-automatic and/or automatic segmentation of the objects represented in an image is a fundamental tool from the perspective of reducing time consumption and thus of great interest in the field of mensiochronology.
These techniques can be briefly divided into two groups: those that use image-processing models and those that involve convolutional neural networks (CNNs) for machine learning models. From a practical point of view, the major disadvantage of image-processing models lies in their sensitivity to image exposure, contrast and colour, whereby the quality of segmentation is directly proportional to the quality of the images. In contrast, the main advantage of artificial intelligence is that the algorithm is trained to identify elements with predetermined characteristics from sub-optimal images by learning to ignore noise and other interferences. Consequently, a large and varied dataset for training the model is necessary to obtain satisfying results.
Although, in archaeology, the application of these methodologies is treated with some suspicion, in other disciplines, especially in the field of engineering, they show important progress. Numerous contributions have been made by researchers who, using computer vision algorithms, have developed image-based procedures for the semantic classification and automatic extraction of objects at various scales, from architectural elements (pillars, columns, doors, windows, roofs, etc.) [
28], to crack detection in masonry [
29], to single building materials [
30]. These procedures, although promising, are developed and applied by specialists from scientific fields far away from archaeology, even though there are already several experiences concerning the study, monitoring and conservation of the building heritage.
Attempting a synthesis, the two main approaches recently applied to the building heritage concern, on the one hand, a stratigraphic analysis, starting from a point cloud survey, of the irregular stone masonry of Linlithgow Palace in Scotland [
31] and, on the other hand, a large-scale study, starting from a photogrammetric drone survey, of the brick construction technique of the Basilica of St. Anthony of Padua, starting from a photogrammetric drone survey [
32].
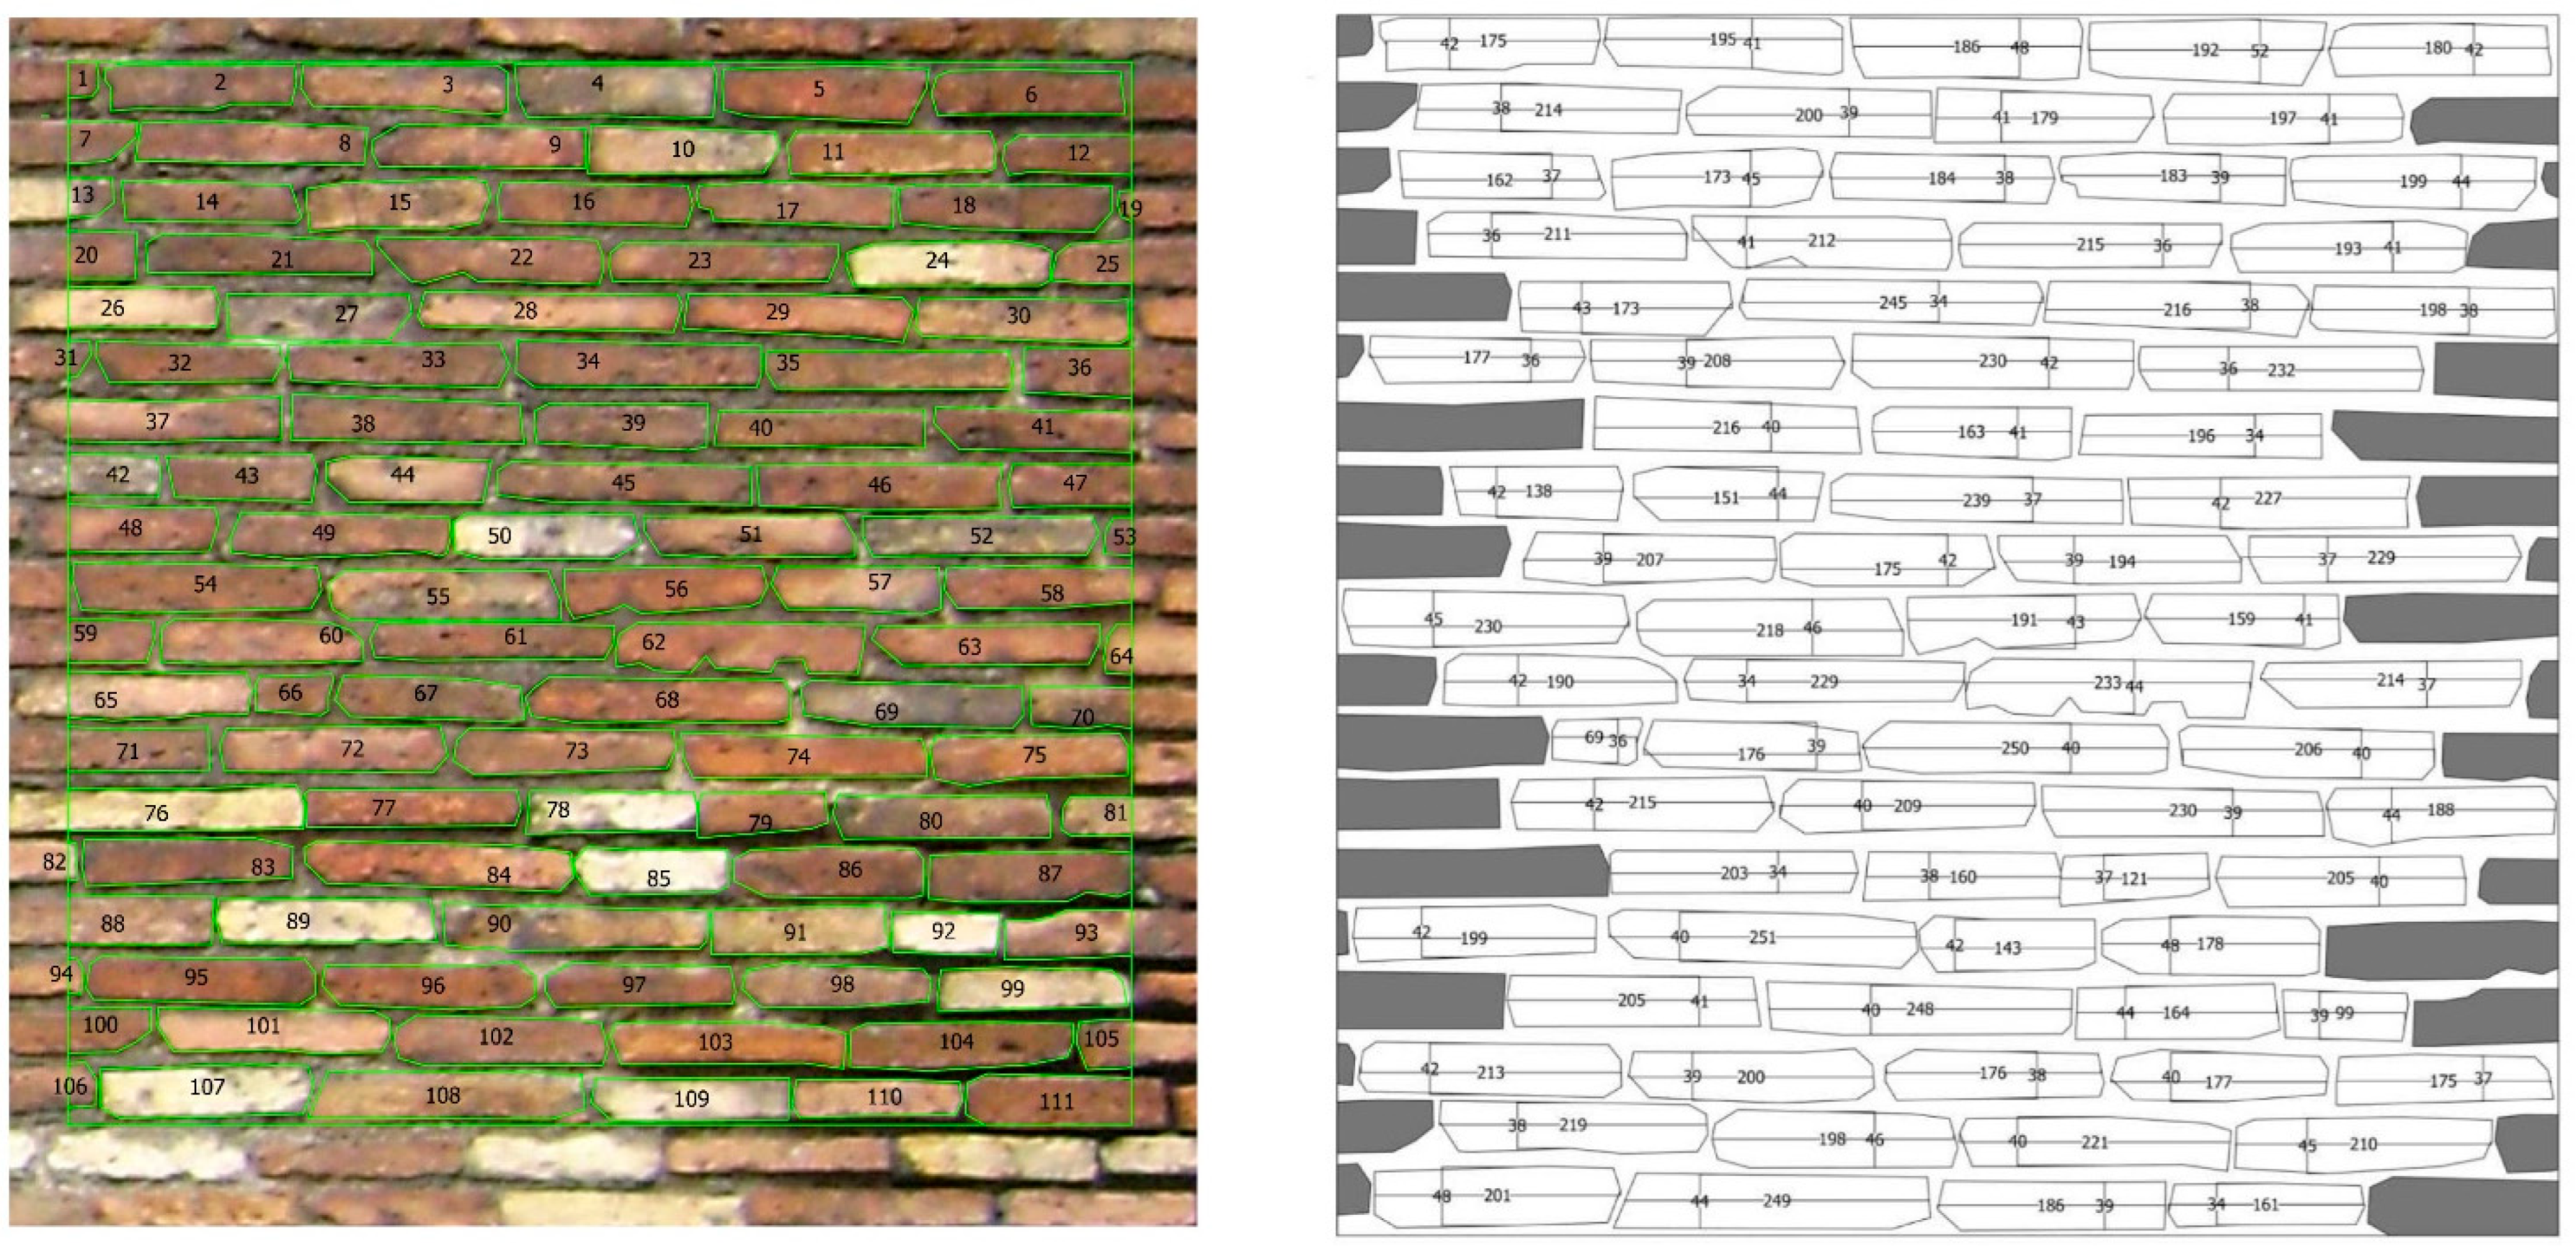
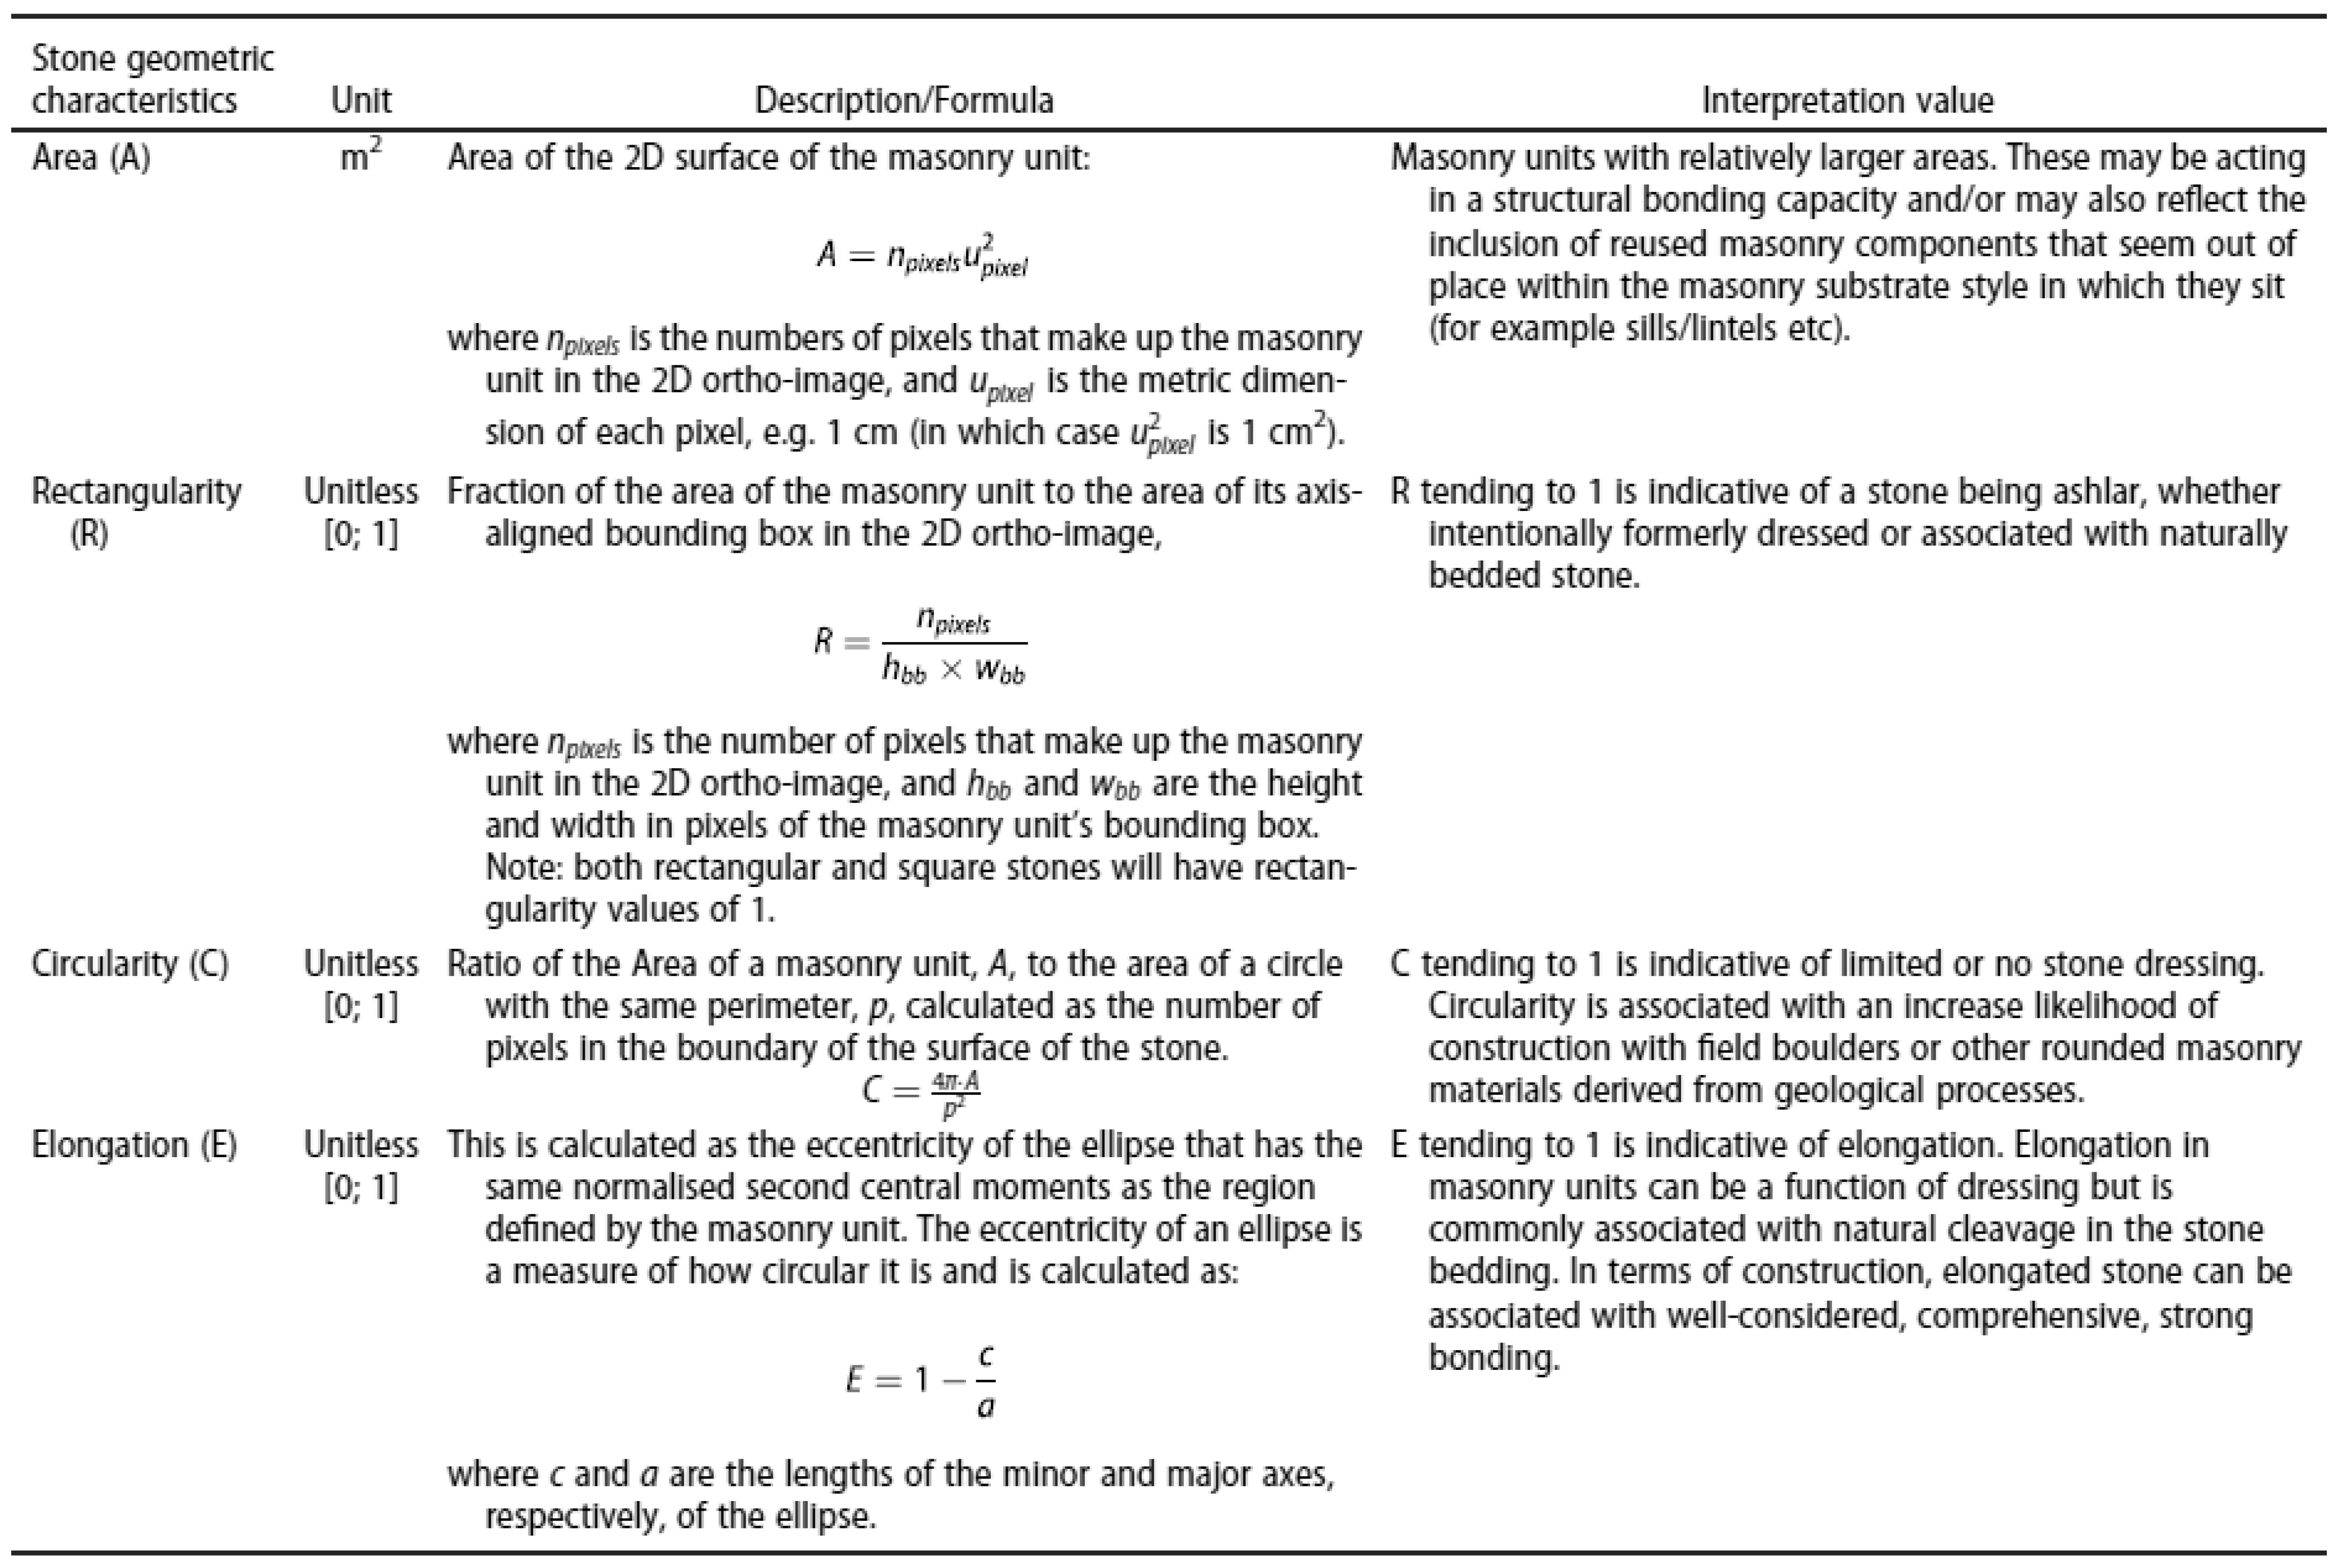
For Linlithgow Palace, the researchers used an image-processing toolkit that includes the automatic segmentation of individual stones that are rendered through a binary image followed by geometric characterisation according to quantitative values that differentiate the shape of each stone. These include stone area (A), rectangularity (R), circularity (C) and elongation (E).
Figure 2 [
33] illustrates these geometric characteristics calculated on the binary image, while
Figure 3 [
31] details the calculation formulae and explains their value for architectural interpretation.
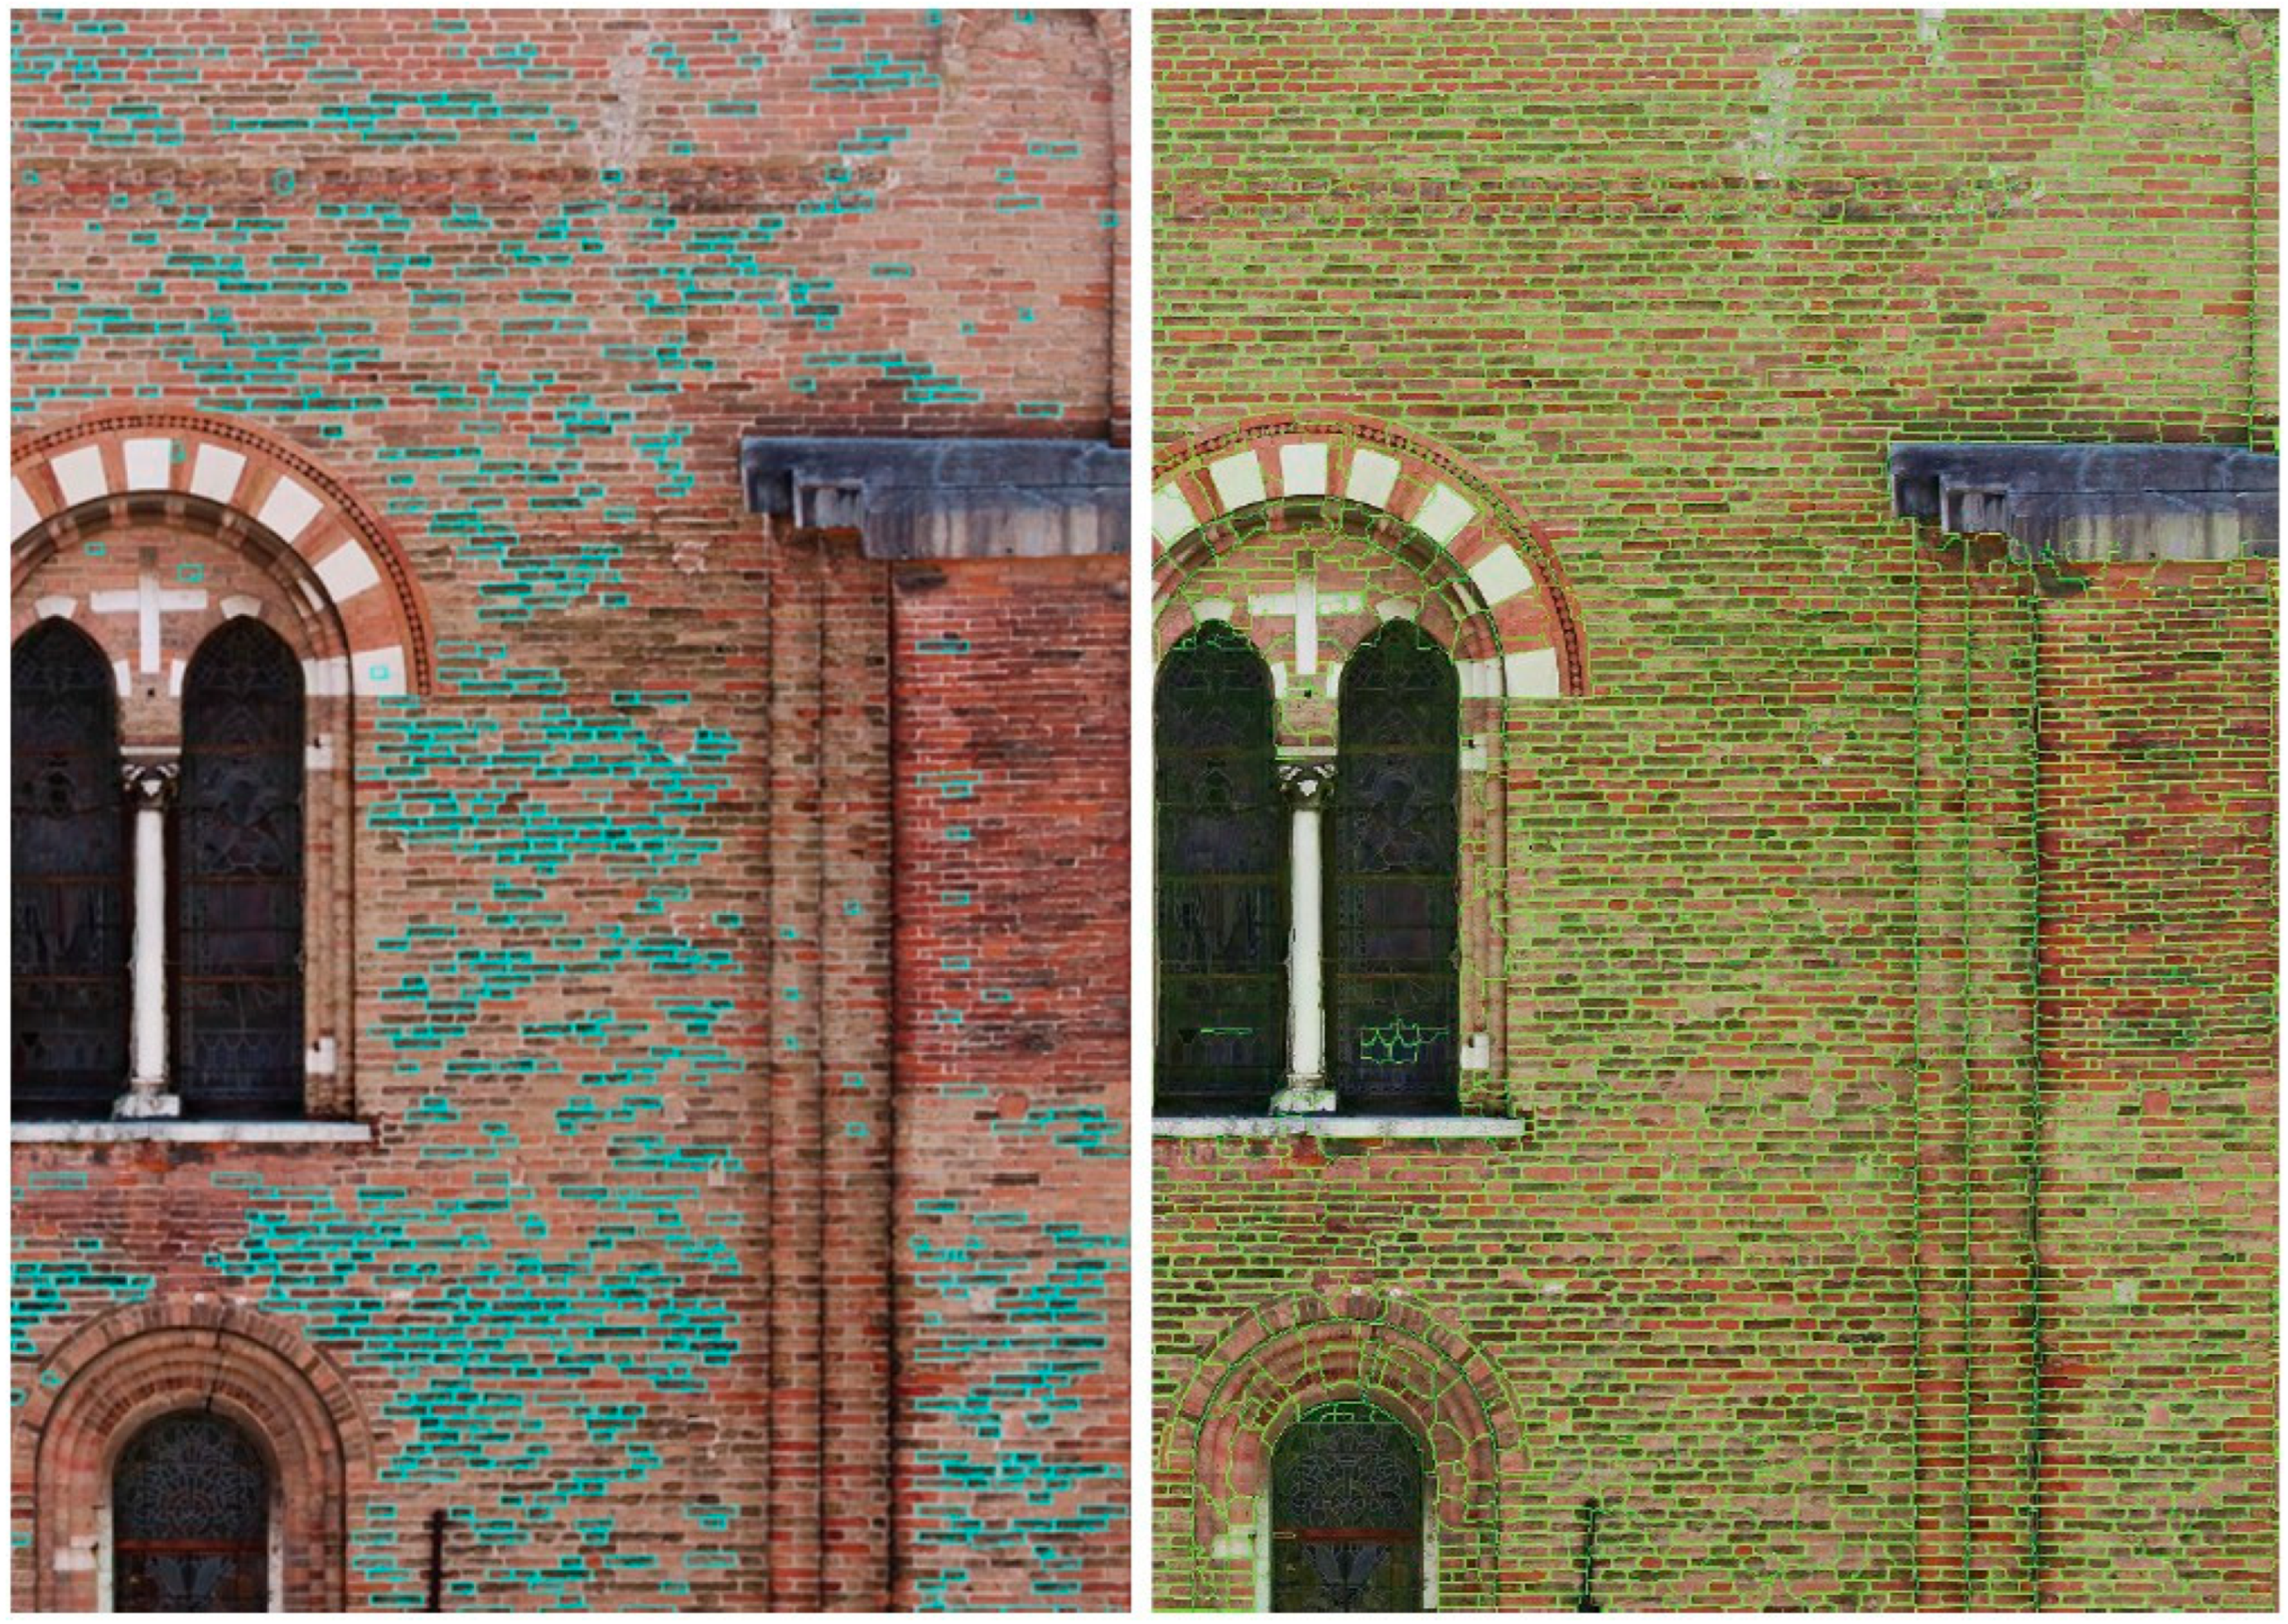
For the Basilica of St. Anthony of Padua, image-processing methods, based on colour thresholding, and machine learning models were compared. In the first case, due to both the deterioration of the surfaces and the size of the basilica, which did not allow the acquisition of images of the same quality during the drone survey operations, many bricks were not identified. In contrast, with the machine learning models, about 85% of the bricks over the entire basilica were correctly detected and segmented [
32] (see
Figure 4).
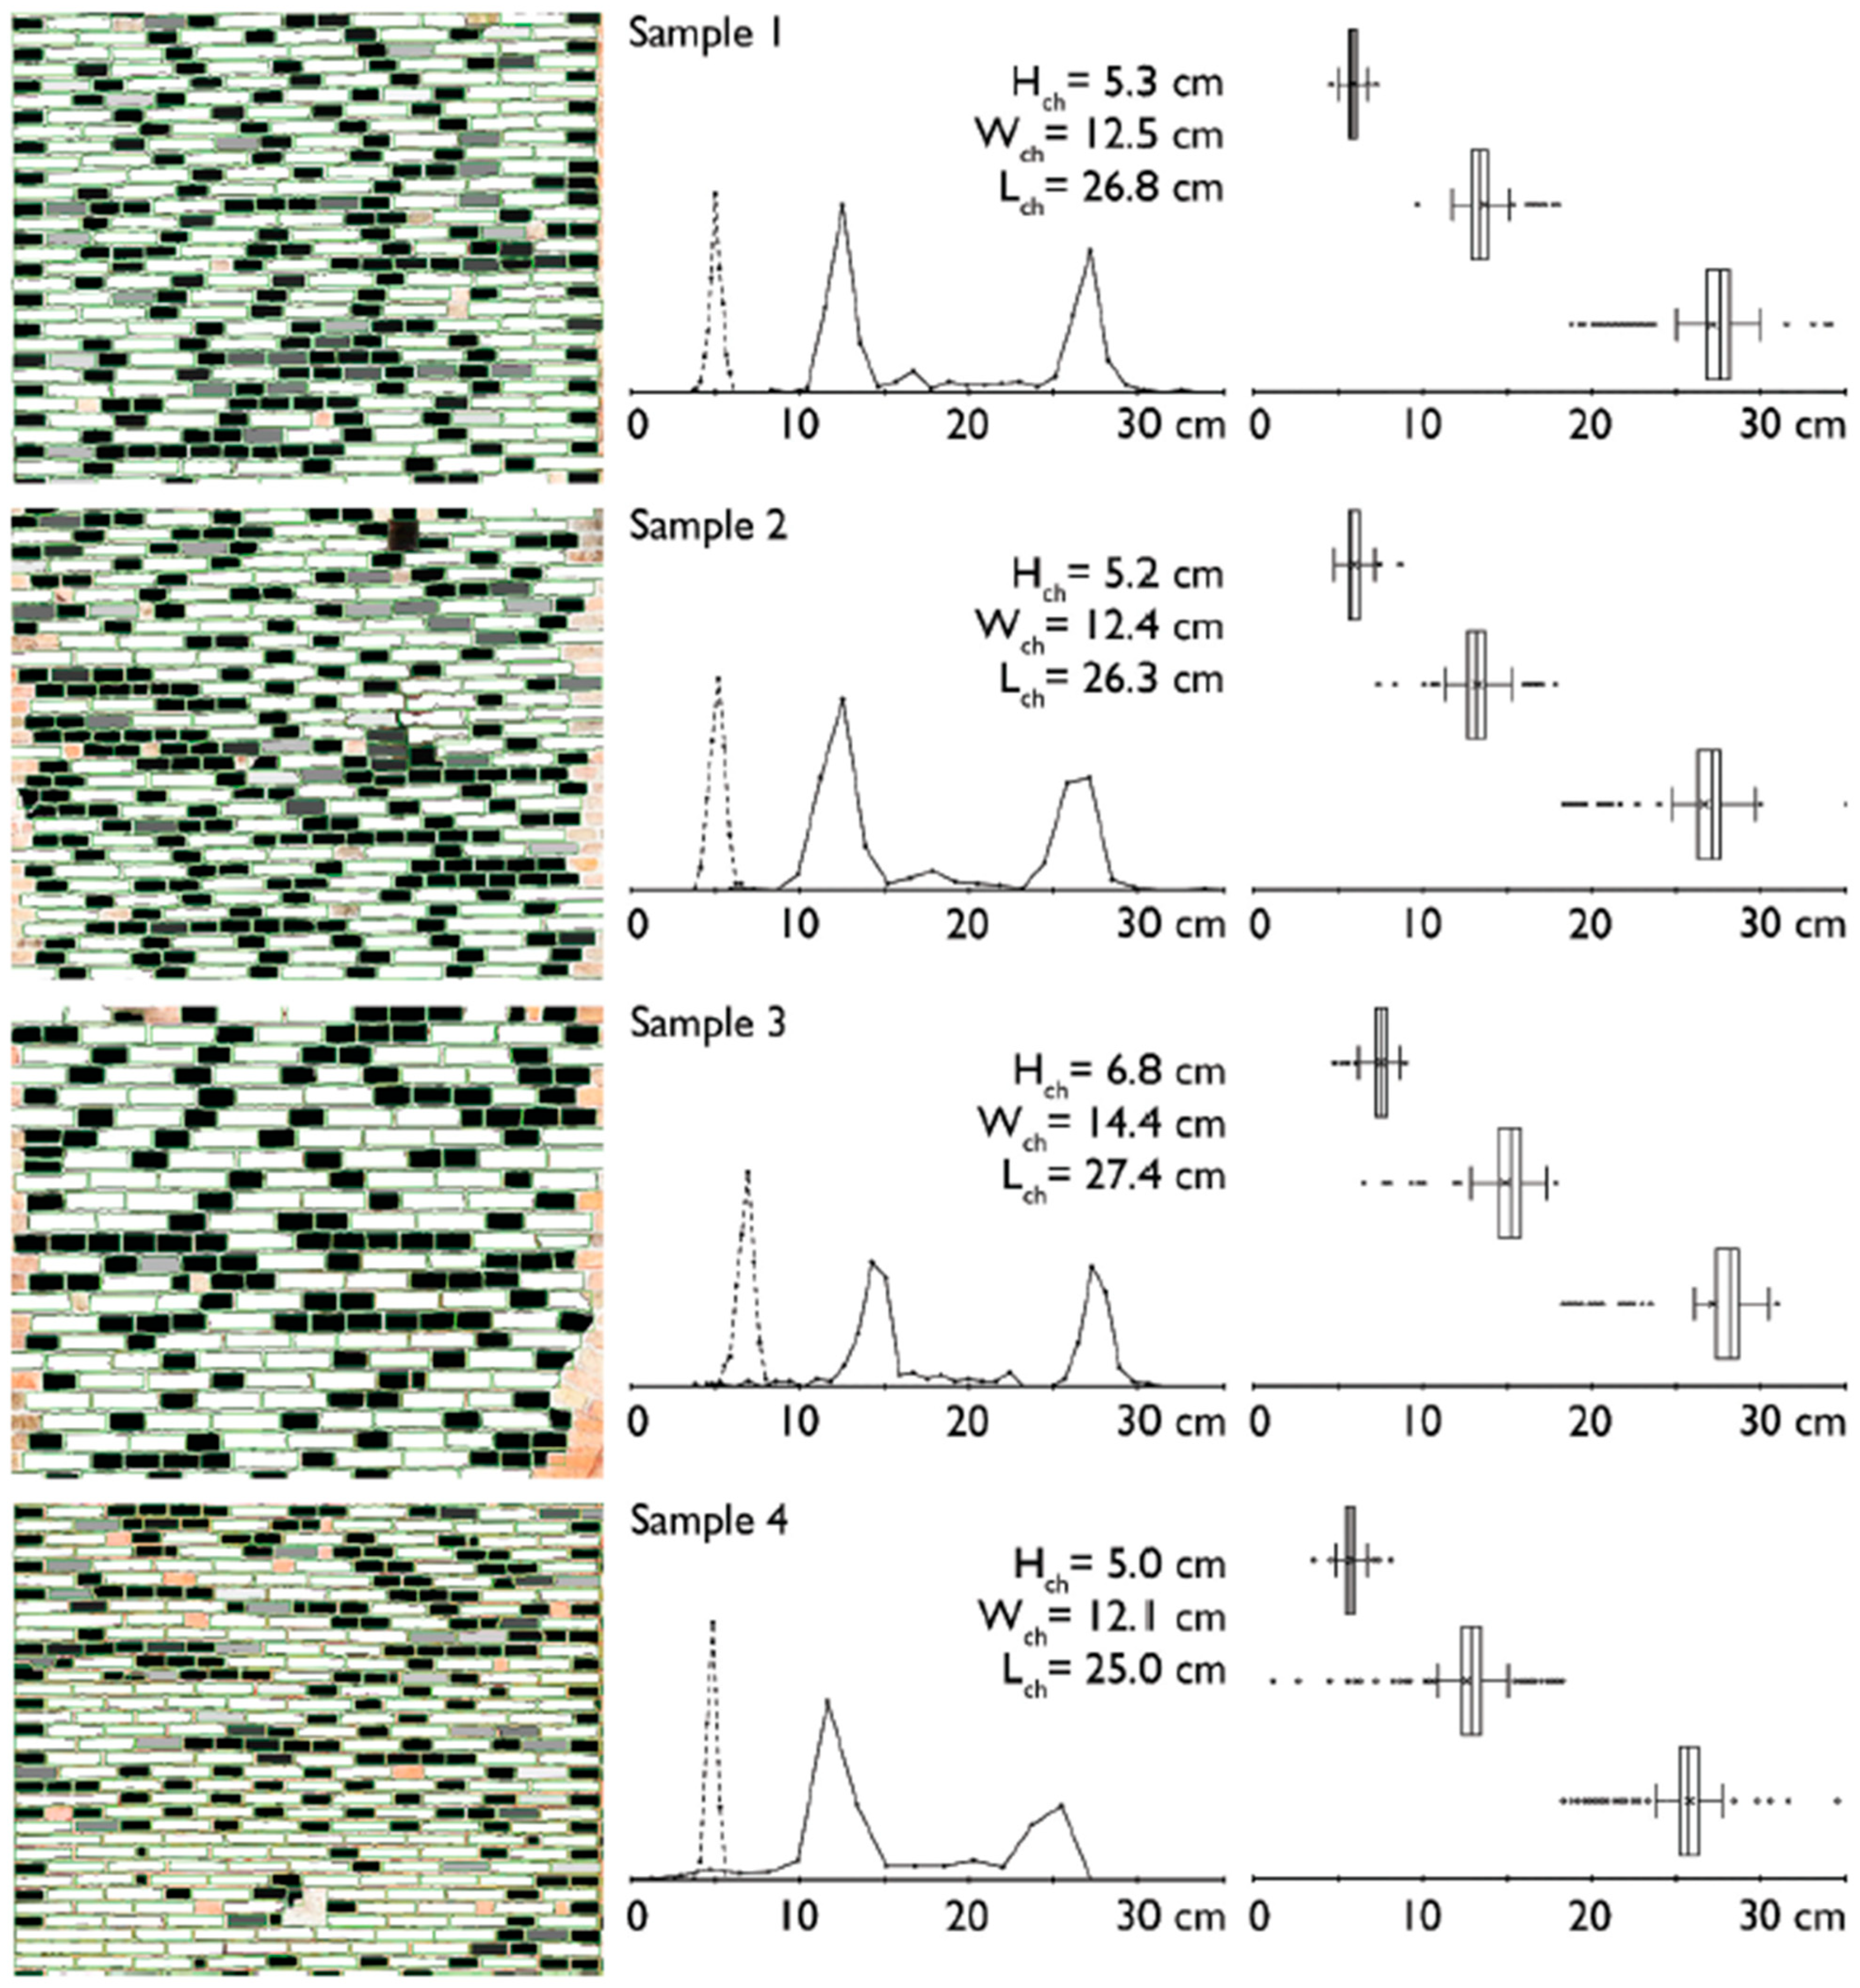
From the results obtained with machine learning models, four samples of 4 sqm were selected to be examined by a mensiochronological analysis using an automatic procedure whereby the polygon corresponding to each brick is approximated by the best-fitted rectangle from which the measurements of the sides are extracted [
32] (see
Figure 5).
The analysis revealed at least three building phases characterised by the use of different brick sizes: the building site in the 13th century, the insertion of the rose window in the 15th century, and finally the repair work in the 19th century.
The example of the Basilica of St. Anthony of Padua shows all the steps of a rigorous workflow on a large scale: from the photogrammetric survey by drone, to the use of machine learning models for brick segmentation, and finally a spatial analysis for the extraction of measurements.
The methodologies illustrated in the two examples, the first for image-processing models and the second for machine learning models, were both developed in the open-source domain, adding important value with regard to method reuse and scalability [
33,
34]. However, some doubts remain about the reliability of these approaches for a dimensional analysis at the scale of the single component. If, in fact, for the case of the Linlithgow Palace, it is the shape of the components, and not measurements, that provide the basis for later interpretations, for the Basilica of St. Anthony, as highlighted by the authors, the greatest difficulty was in the detection of the smallest components starting from a limited-resolution orthophoto. The analysis of the measurements raises some doubts due to the scale of acquisition of the survey which must be equated to a 1:1 scale. Finally, still regarding the second case, the extraction of measurements is carried out through a function of proprietary software that could place some limits on data interoperability.
With regard to the topics of open source, interoperability, and, last but not least, the development of user-friendly solutions that can more easily become part of archaeological practice, a special mention goes to TagLab
https://taglab.isti.cnr.it/ (accessed on 31 March 2025). The platform, developed by the Visual Computing Laboratory of the ISTI-CNR in Pisa, supports the semantic segmentation of orthophotos using artificial intelligence models and provides the results in interoperable formats for further analysis in a GIS environment [
35].
Initially designed for the study of marine environments, the TagLab platform proved to be highly adaptable to the context of historical architecture as well [
36]. The software integrates different levels of automation, allowing the user to operate it manually, with assisted tools or in fully automatic mode, while always maintaining direct control over the results. This human-centred approach is based on the idea of enhancing, rather than replacing, the work of the expert, speeding up the most repetitive steps and reducing analysis time without compromising quality.
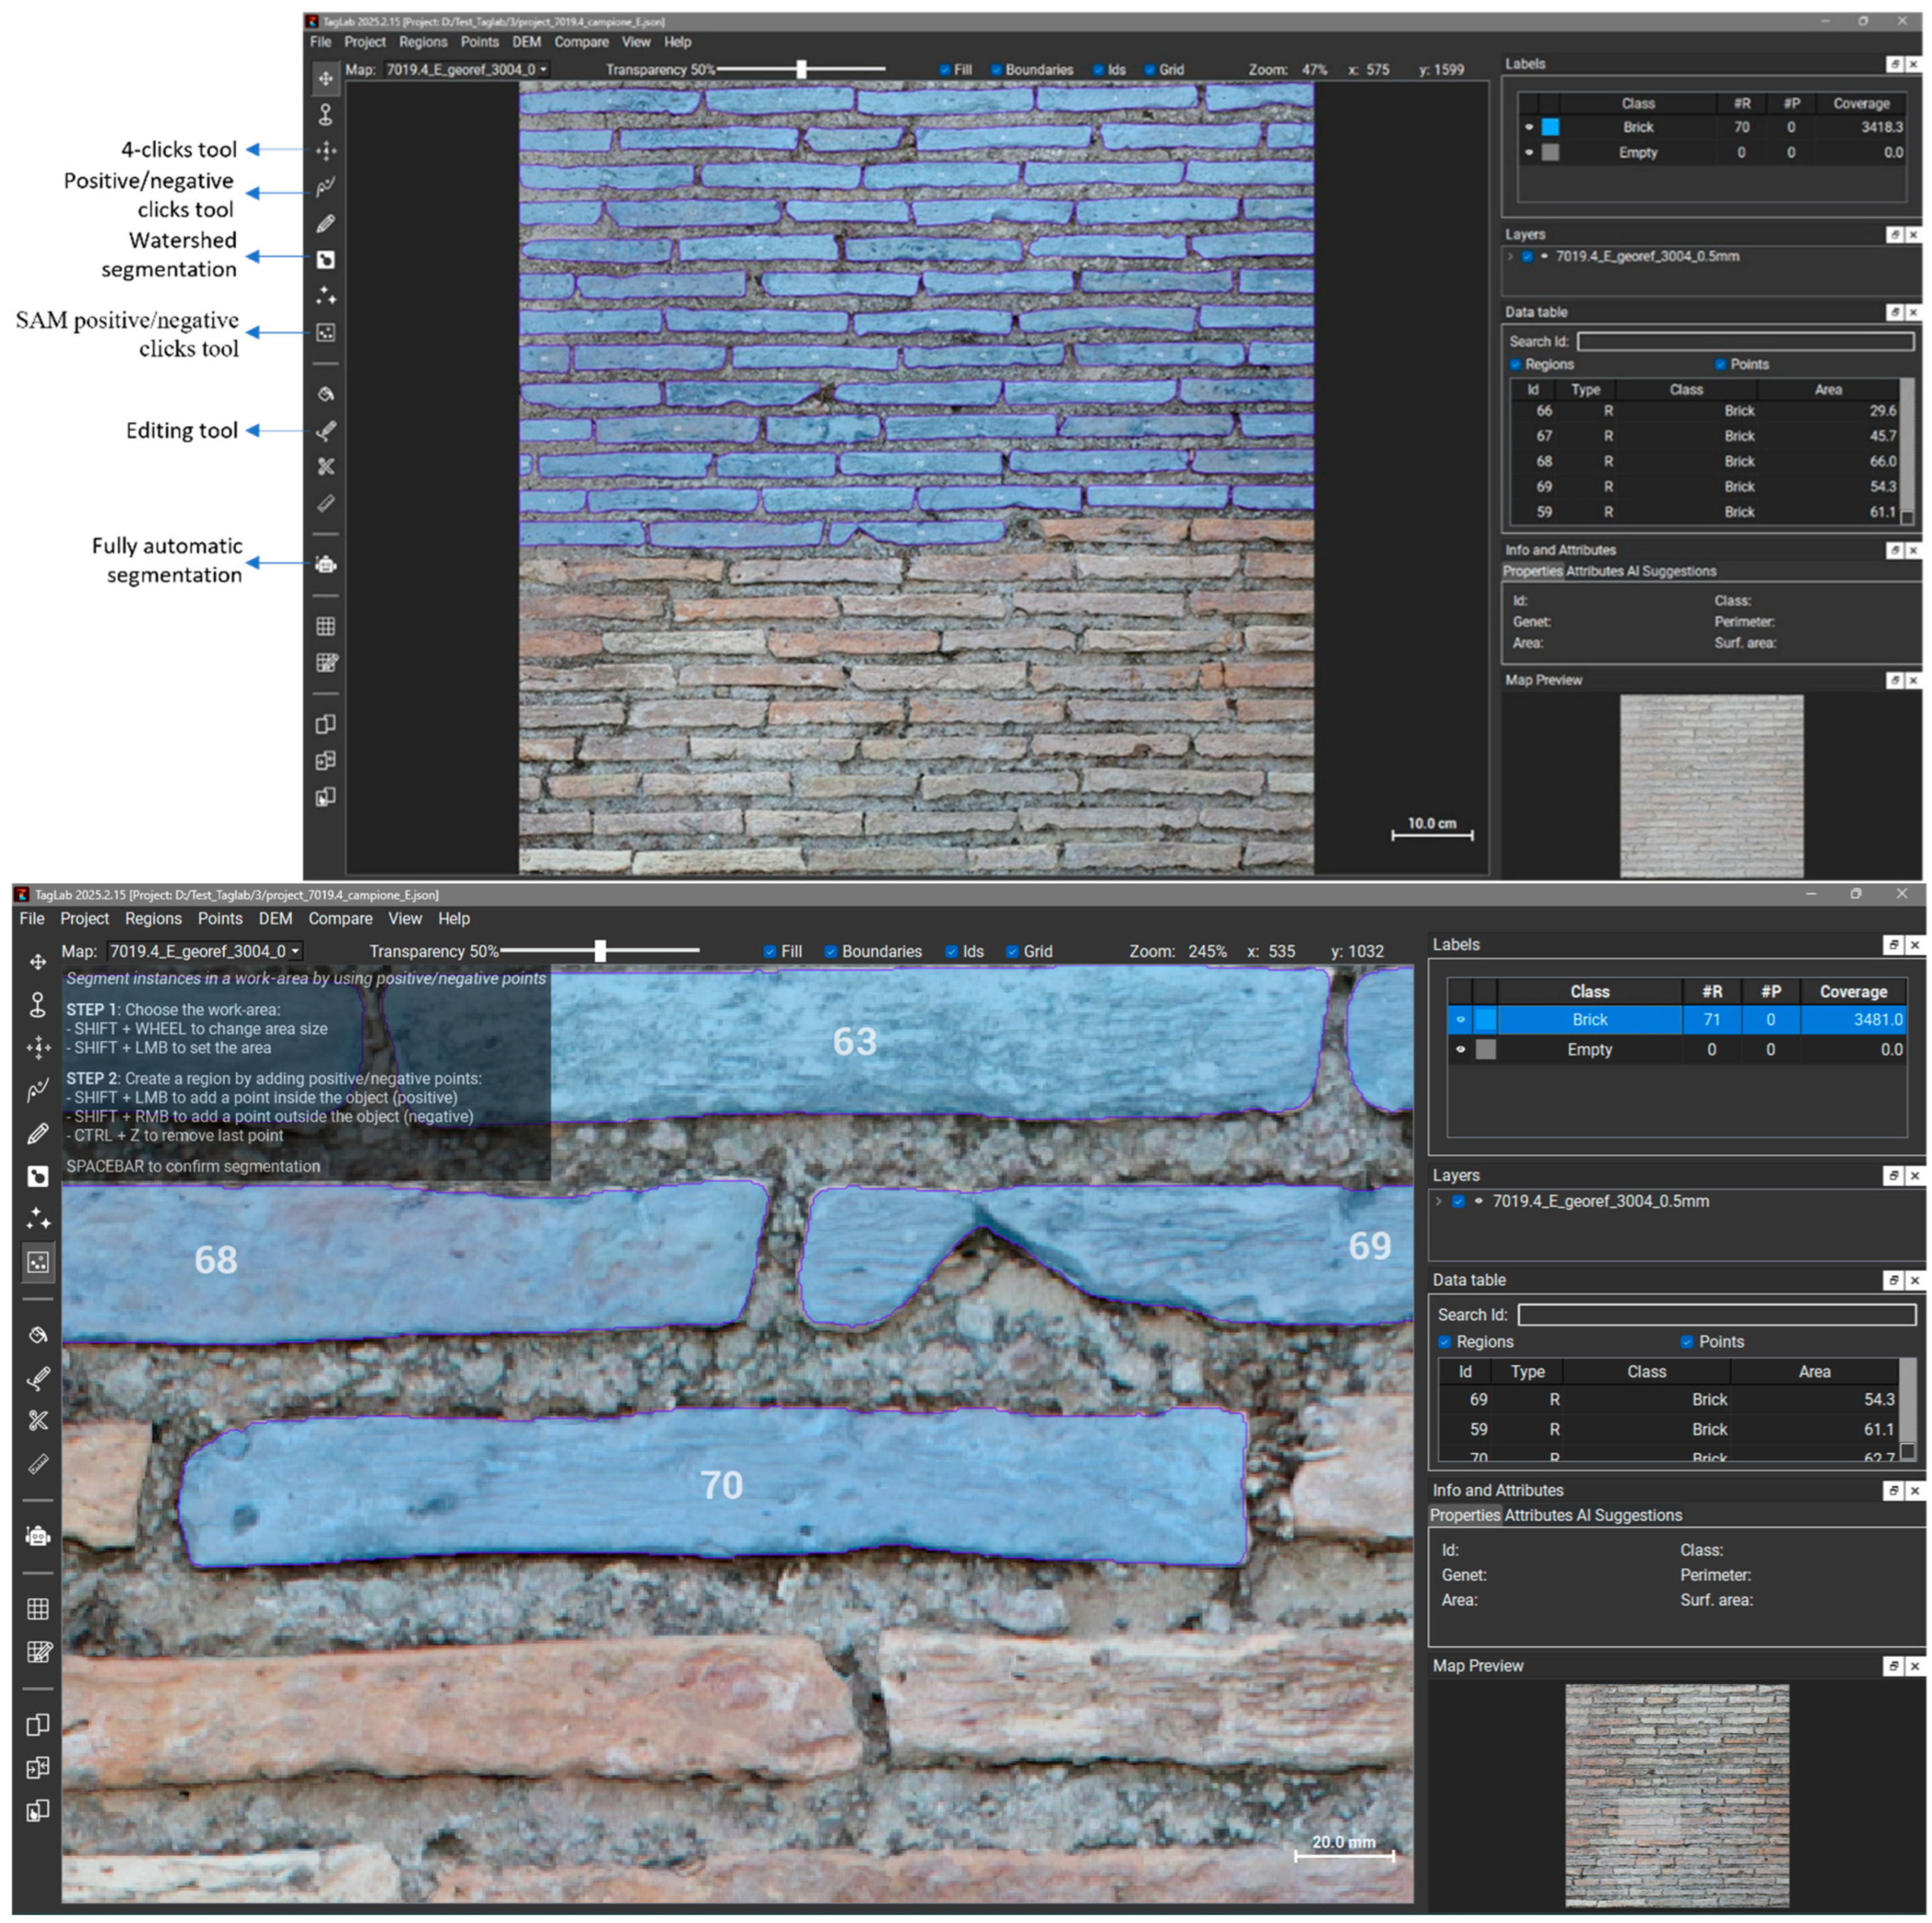
TagLab enables assisted segmentation with intelligent tools such as the “4-clicks tool” and the “positive/negative clicks tool”, which allows one to draw the contours of specific elements with just a few clicks of input. For larger and irregular surfaces, such as masonry stratigraphic units, there is also a tool based on the “Watershed” algorithm, which offers guided segmentation from the user’s sketches. These functions, whose accuracy is not high, find their appropriate application in the case of larger elements or where detail does not influence the interpretation of results.
Parallel to the functions therefore dedicated to architectural elements and/or stratigraphic units, the platform has a segmentation function at the level of individual building components through the detection of each stone or brick visible on the wall surface. To deal with the complexity of this operation on a large scale and increase the degree of accuracy compared to other functions, TagLab implements the Segment Anything Model (SAM) [
37].
In particular, the “SAM positive/negative clicks tool” follows the same interaction paradigm as the positive/negative clicks tool, with the difference that it requires the prior positioning of a work area that is used to segment all the instances completely contained within it (objects that cross the frame of the box will not be considered). Once the work area has been positioned, which may include the entire 1 sq. m. sample, the segmentation process consists of making a single click within each brick. This tool allows the semi-automatic segmentation of dozens and dozens of elements with surprising accuracy in a matter of minutes, compared to the hours required for manual tracking. Also, in this case, outputs can be easily corrected or refined by the user, with interactive local editing tools (see
Figure 6).
Afterwards, the results obtained can be used to train an automatic segmentation model based on a convolutional neural network (CNN) via the “Train-Your-Network” function. The training takes place directly within TagLab, which manages the entire process of partitioning the images into tiles, training, validating and testing the model. For this operation, the “DeepLab V3+” architecture is used [
38], a model introduced in 2018 that is still one of the best-performing semantic segmentation networks in terms of accuracy. Tests conducted on new images have shown a high accuracy of the results, with matching values even higher than 95% and a good ability to process heterogeneous datasets.
The results of tests carried out on the city walls of Pisa demonstrate that the adoption of assisted and automated tools such as those offered by TagLab improves the efficiency of the documentation process by enabling fast and precise segmentation, while maintaining quality control of each operation. Furthermore, the user-friendly interface, the interoperability of the modules, the possibility of managing images and georeferenced data and exporting them also in vector format (.shp) make TagLab an important step forward towards the “intelligent” digitalisation of the architectural heritage, offering a system in which artificial intelligence and human expertise coexist harmoniously to guarantee reliable, rapid and replicable results on a large scale.
5. Towards a Digital Methodology for the Mensiochronology of Roman Brick-Faced Masonry
The following section presents a workflow for the quantitative analysis of Roman brickwork developed by the author for the study of the building phases of the Baths of Elagabalus on the Palatine Hill (Rome) [
39,
40]. The study, as well as involving field documentation activities, defined data acquisition and analysis procedures using open-source tools and software designed to reduce time consumption and expand the possibilities of application following a rigorous and objective approach.
The first operation concerned the sampling of masonry, for which homogeneous surfaces of 1 sqm were selected that did not present elements of discontinuity and presented a good state of conservation. A total of 31 samples were collected, distributed not only on the structures belonging to the Severan building but also on masonry belonging to immediately prior and/or posterior chronological periods through which further comparisons could be based.
For the acquisition of the individual samples, close-range photogrammetric surveying was carried out by taking photographs at a very close distance and in optimal lighting conditions in order to obtain the best possible quality both in metric and chromatic terms. Photographs were taken using a 24-megapixel Canon EOS 2000D SLR camera (Tokyo, Japan) with a stabilised lens and 18 mm focal length while maintaining, as far as possible, a constant distance of approximately 2 m from the masonry. Each sample, framed by at least 5 control points measured with a total station, was processed independently in order to operate with high accuracy parameters. The final objective was to obtain very detailed orthophotos (with a resolution of 1 mm/pixel) from which each component, brick by brick, was digitalised in a GIS environment (see
Figure 7).
At the end of digitalisation, the total number was about 3800 bricks.
To verify the method, individual brick measurements derived from a direct approach (in contact with the wall) and an indirect approach (from orthophotos) were compared.
The verification covered 10 samples and showed homogeneous measurements with an average deviation of less than 2 mm. These small oscillations can be attributed to an instrumental factor since, in direct measurement, the orthogonality of the measurement cannot always be guaranteed with absolute precision, leading to more approximate readings.
Instead, in the indirect approach, each measurement is derived automatically using a spatial analysis algorithm in a GIS environment; therefore, if the survey is accurate, the measurements obtained are correct [
41].
For the measurement extraction and statistical analysis, the “Roman Brick Analysis” script in Python v. 3.11 language was developed by the author to be integrated within the processing tools of QGIS [
42]. The script, which uses QGIS’s native algorithms, was specifically designed to support the quantitative analysis of Roman brick-faced masonry using an automated approach for the dimensional and statistical analysis of bricks according to the method already proposed by Medri [
20].
In detail, the analysis procedure consists of
− Total number of whole bricks;
− Area of each whole brick;
− Length and thickness of each whole brick;
− Total area of the whole bricks;
- 2.
Estimation of the bricks partially included in the sampled area;
− Total number of partial bricks;
− Area of each partial brick;
− Total area of the partial bricks;
- 3.
Overall estimate per 1 sqm of masonry;
− Number of bricks reconstructed per 1 sqm (=area of partial bricks/average area of whole bricks);
− Total number of bricks used in 1 sqm (=number of whole bricks + number of reconstructed bricks);
− Area covered by bricks;
− Area covered by mortar;
− Coverage ratio between bricks and mortar;
− Range, mean and standard deviation of lengths and thicknesses of whole bricks.
In order for the script to function correctly, it is necessary to use two pre-prepared and downloadable layers:
“samples” layer: polygonal layer for recording the sampled areas (usually 1 sqm);
“survey” layer: polygonal layer for recording the geometry of each brick contained in the masonry sample: the “survey” layer is the only input file for the entire process.
The script also requires defining the path of four style files that will be assigned to the output data at the end of the analysis; all styles in QML format are available and downloadable.
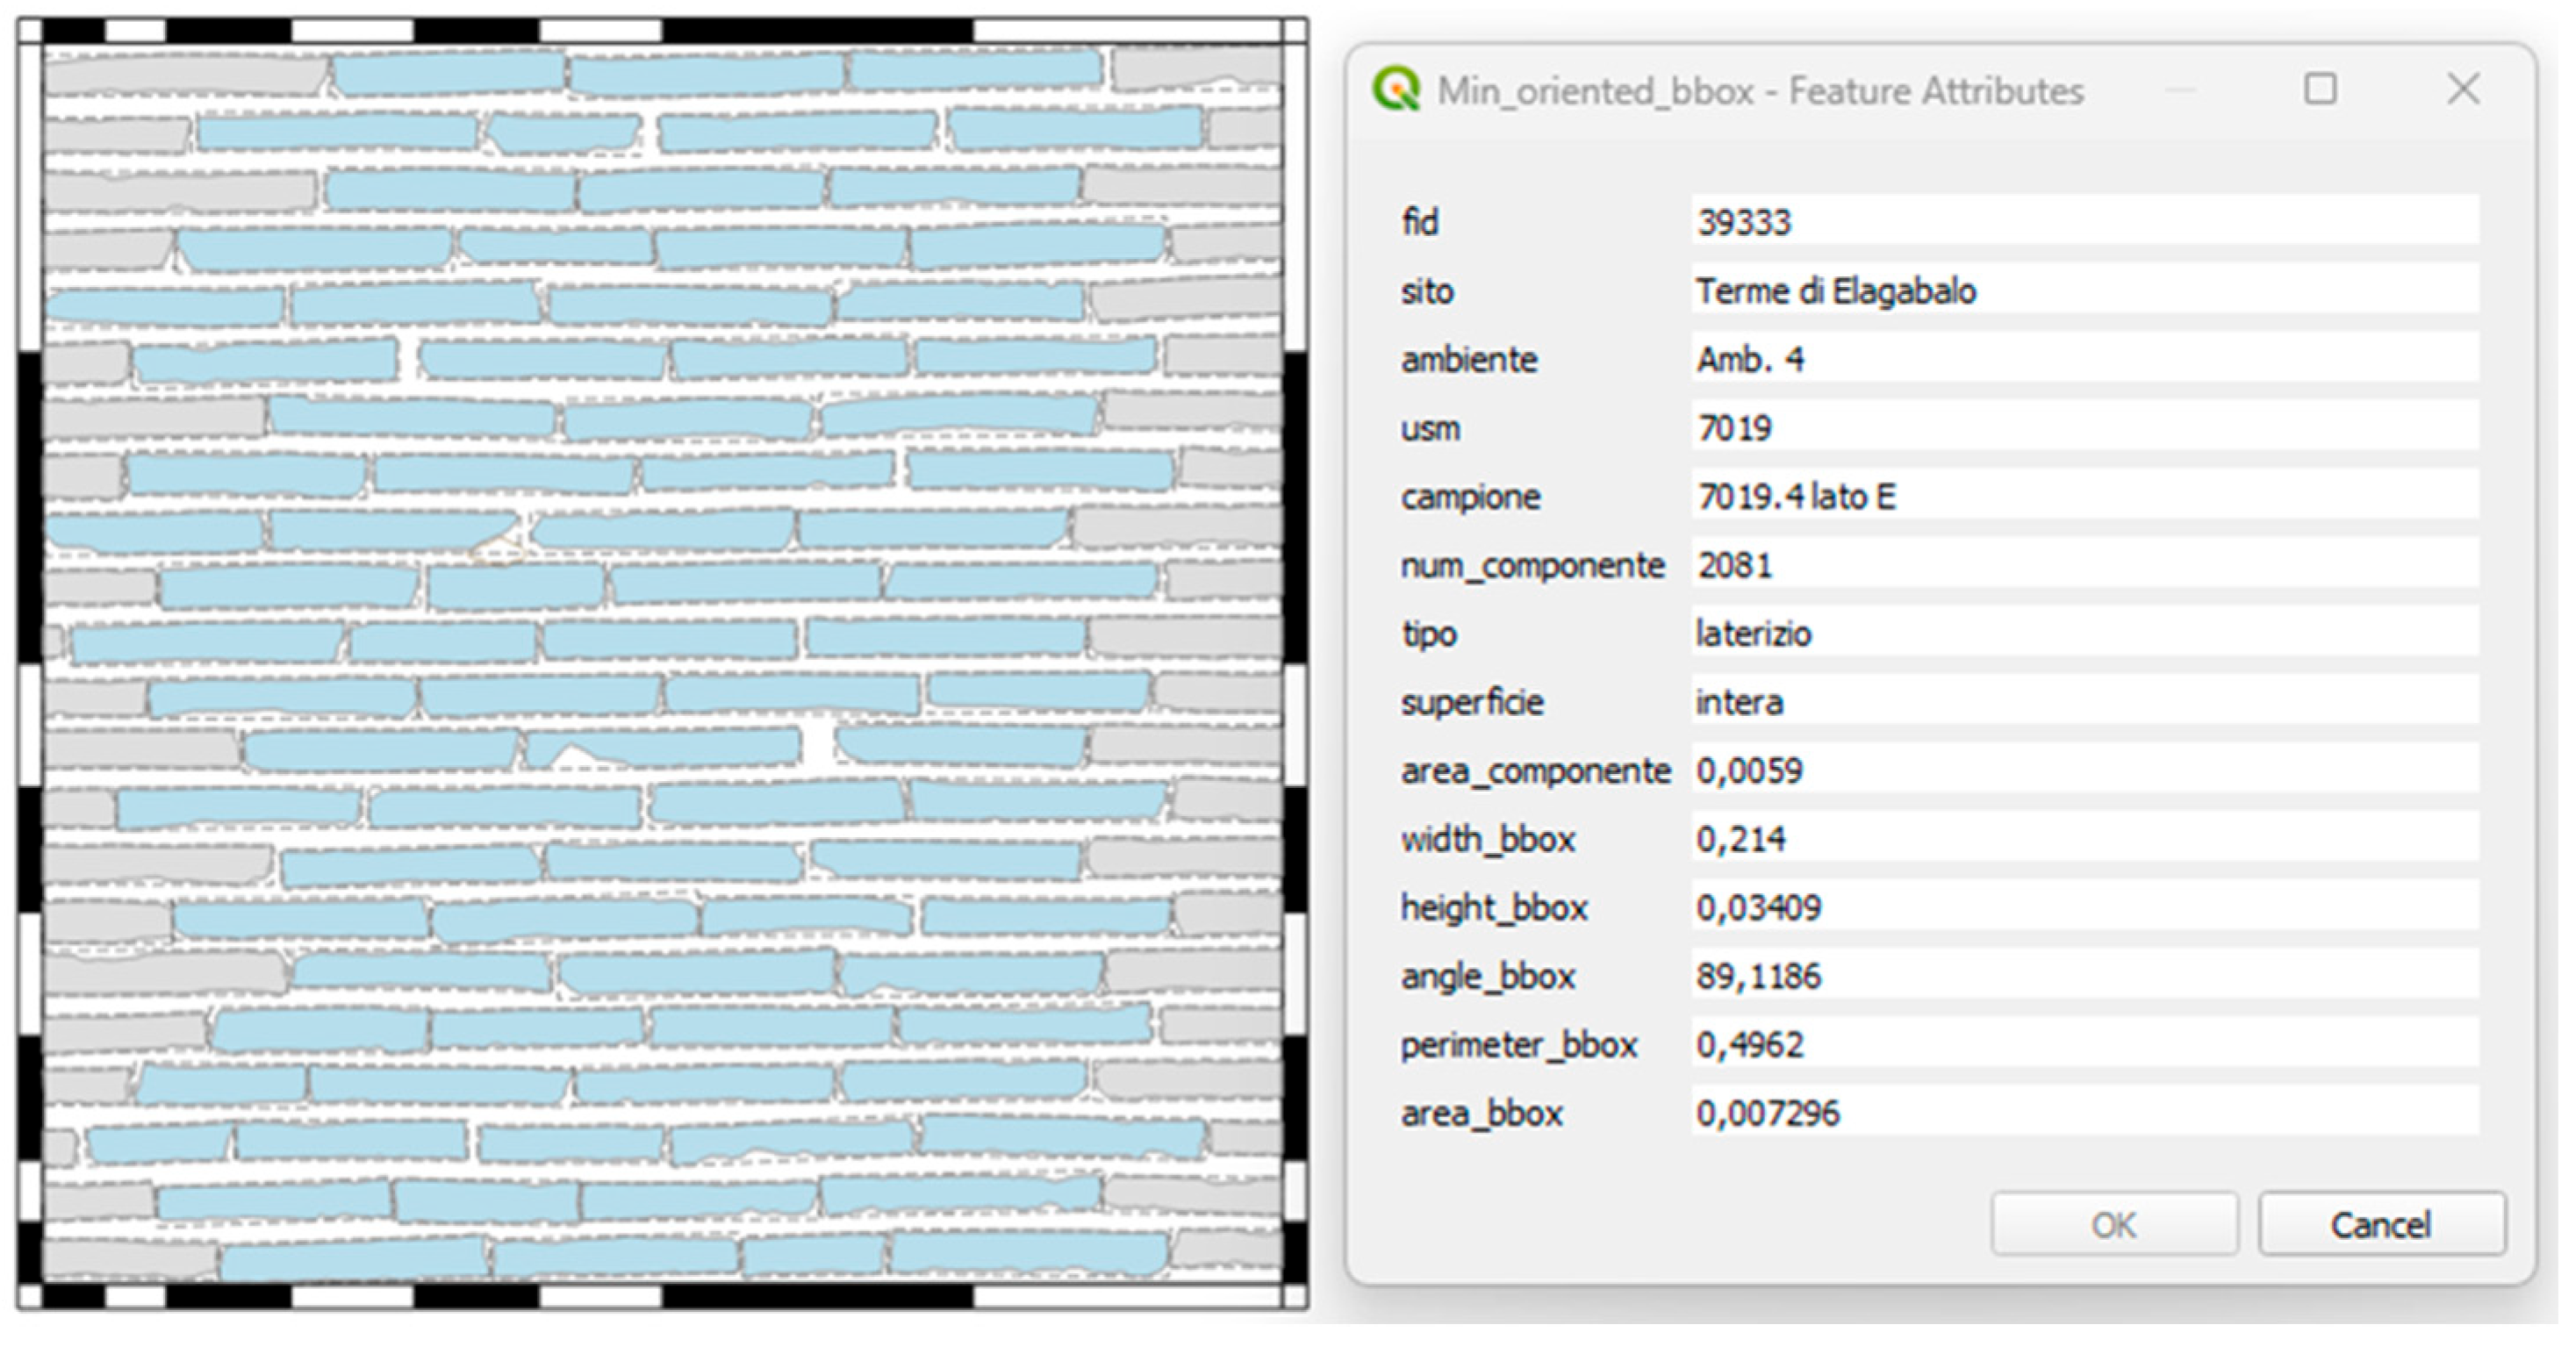
At the centre of the entire analysis is the calculation of the “oriented minimum bounding box” function [
43] by which, starting from the oriented minimum rectangle drawn around each brick, the measurements of the two sides, the length and the thickness, of the bricks are automatically obtained and immediately recorded in the dedicated data sheet (see
Figure 8).
At the end of the analysis, the script returns five different output files:
“Min_oriented_bbox”: polygonal layer containing the minimum oriented polygons for each element in order to graphically verify the analysis validity;
“Count_width_bbox_range” and “Count_height_bbox_range”: data table collecting the quantity of elements within a range of 2 mm for lengths and 1 mm for thicknesses;
“Survey_analysis”: polygonal layer that re-proposes the geometries already contained in the “survey” layer, updated in the attributes table with the calculated measures;
“Samples_analysis_table”: summary table that collects for each sample all the main statistics calculated about number, area, and dimensions of the bricks
“Samples_analysis”: polygonal layer collecting for each sample all main statistics calculated about number, area, and dimensions of the bricks.
The sequence of processes developed by the script can be summarised as follows:
Spatial Join: based on the geometric intersection, joins the basic information of each sample (site, stratigraphic unit, sample id, sample area, etc.) with more detailed information about the bricks (type, surface, brick area);
Calculation of the minimum oriented polygon: calculates and graphically returns the minimum oriented polygon to extract the dimensions (length and thickness) for each brick automatically;
Attribute merging: combines the measurements extracted from the minimum oriented polygon analysis with the starting information for each brick;
Extraction and filtering: filters data by type (default value is “brick”), surface (“whole” or “partial”) and other properties, allowing specific masonry elements to be isolated;
Basic statistics: performs statistical calculations (range, mean, standard deviation, etc.) for attributes such as area, length and thickness of bricks;
New attribute calculations: derives new fields such as “number of integer bricks calculated”, “total integer bricks calculated” and “brick/mortar ratio” useful for understanding masonry composition;
Reorganisation and formatting: change the names and structure of fields for more clarity and coherence in the results;
Layer styling: apply predefined styles to output layers using specially prepared QML style files for easier reading and verification of results.
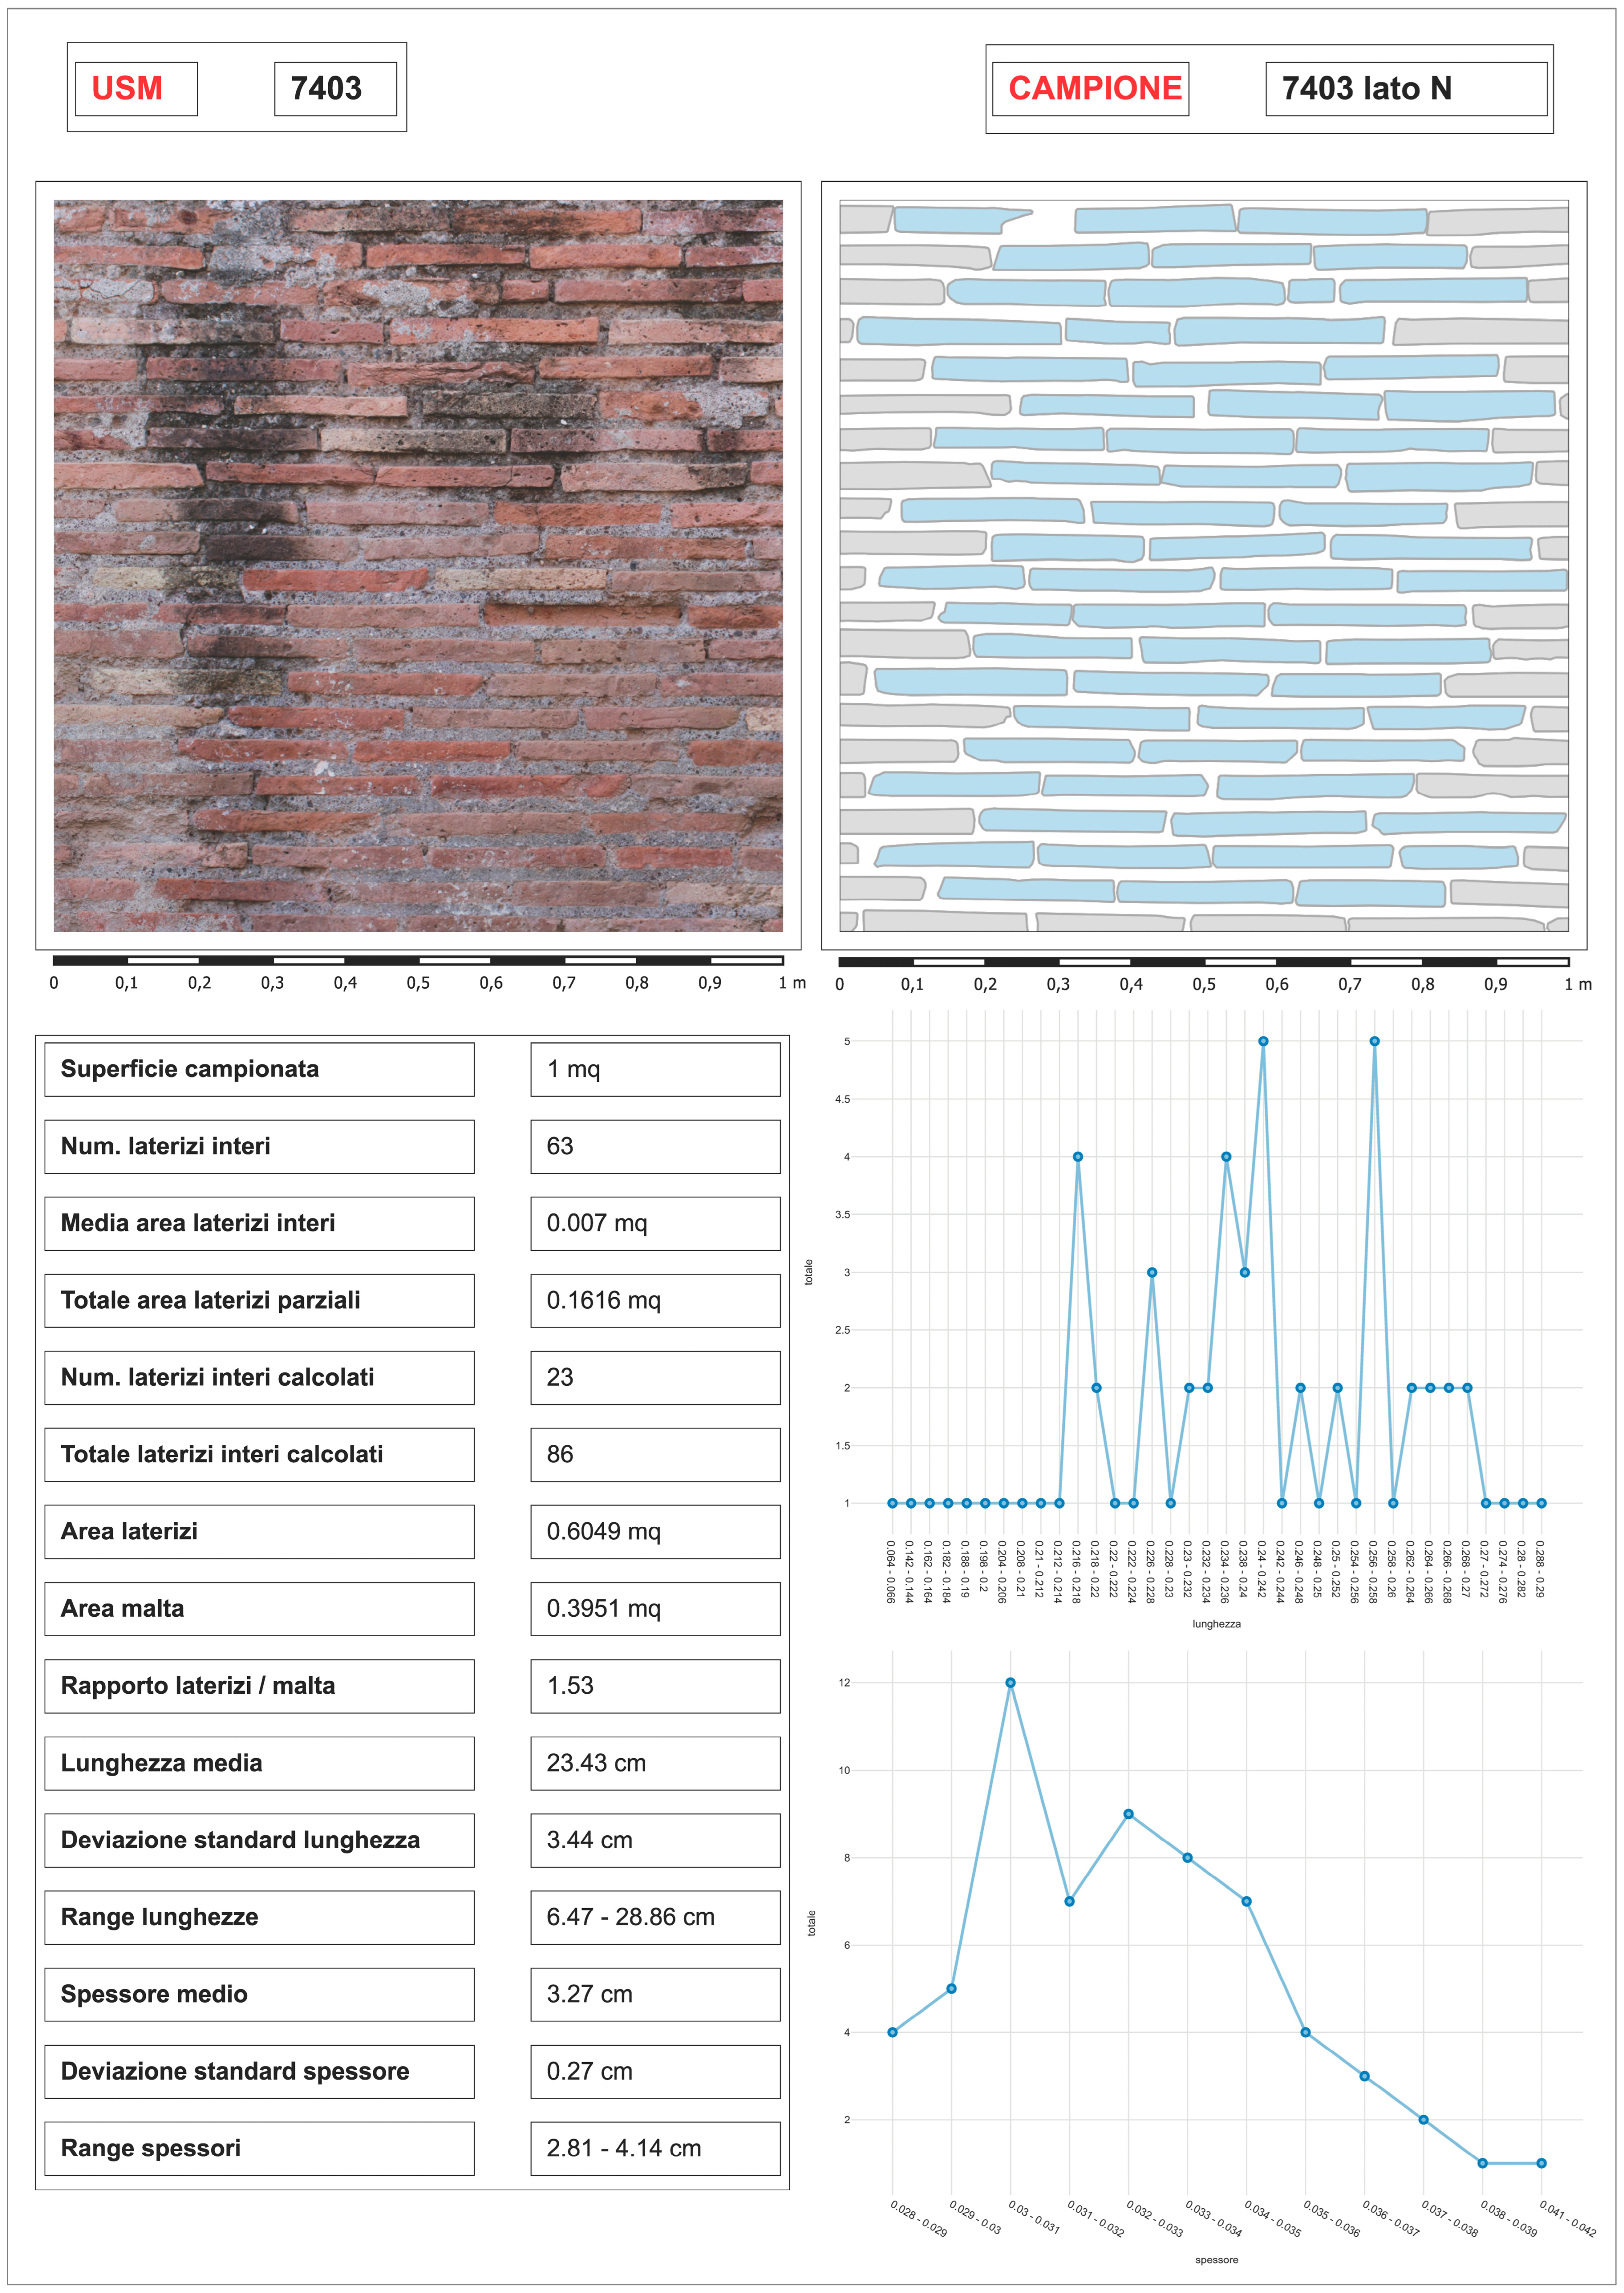
In conclusion, all the data are finally returned within a summary sheet for each sample in which the orthophotos, the vector restitution, the statistical indexes calculated and two linear graphs representing the distribution of the measurements (lengths and thicknesses) calculated for ranges of 2 mm for lengths and 1 mm for thicknesses (see
Figure 9).
6. Taglab’s Test and Comparison of Results
The analysis of the masonry of the Baths of Elagabalus began and ended shortly before the publication of the TagLab platform, for which, as we have seen, the digitalisation of the bricks was carried out by a traditional manual approach.
This operation, as repeatedly emphasised, consumed an enormous amount of time and energy but now offers the possibility of comparing the results obtained with those produced with the support of TagLab’s semi-assisted segmentation.
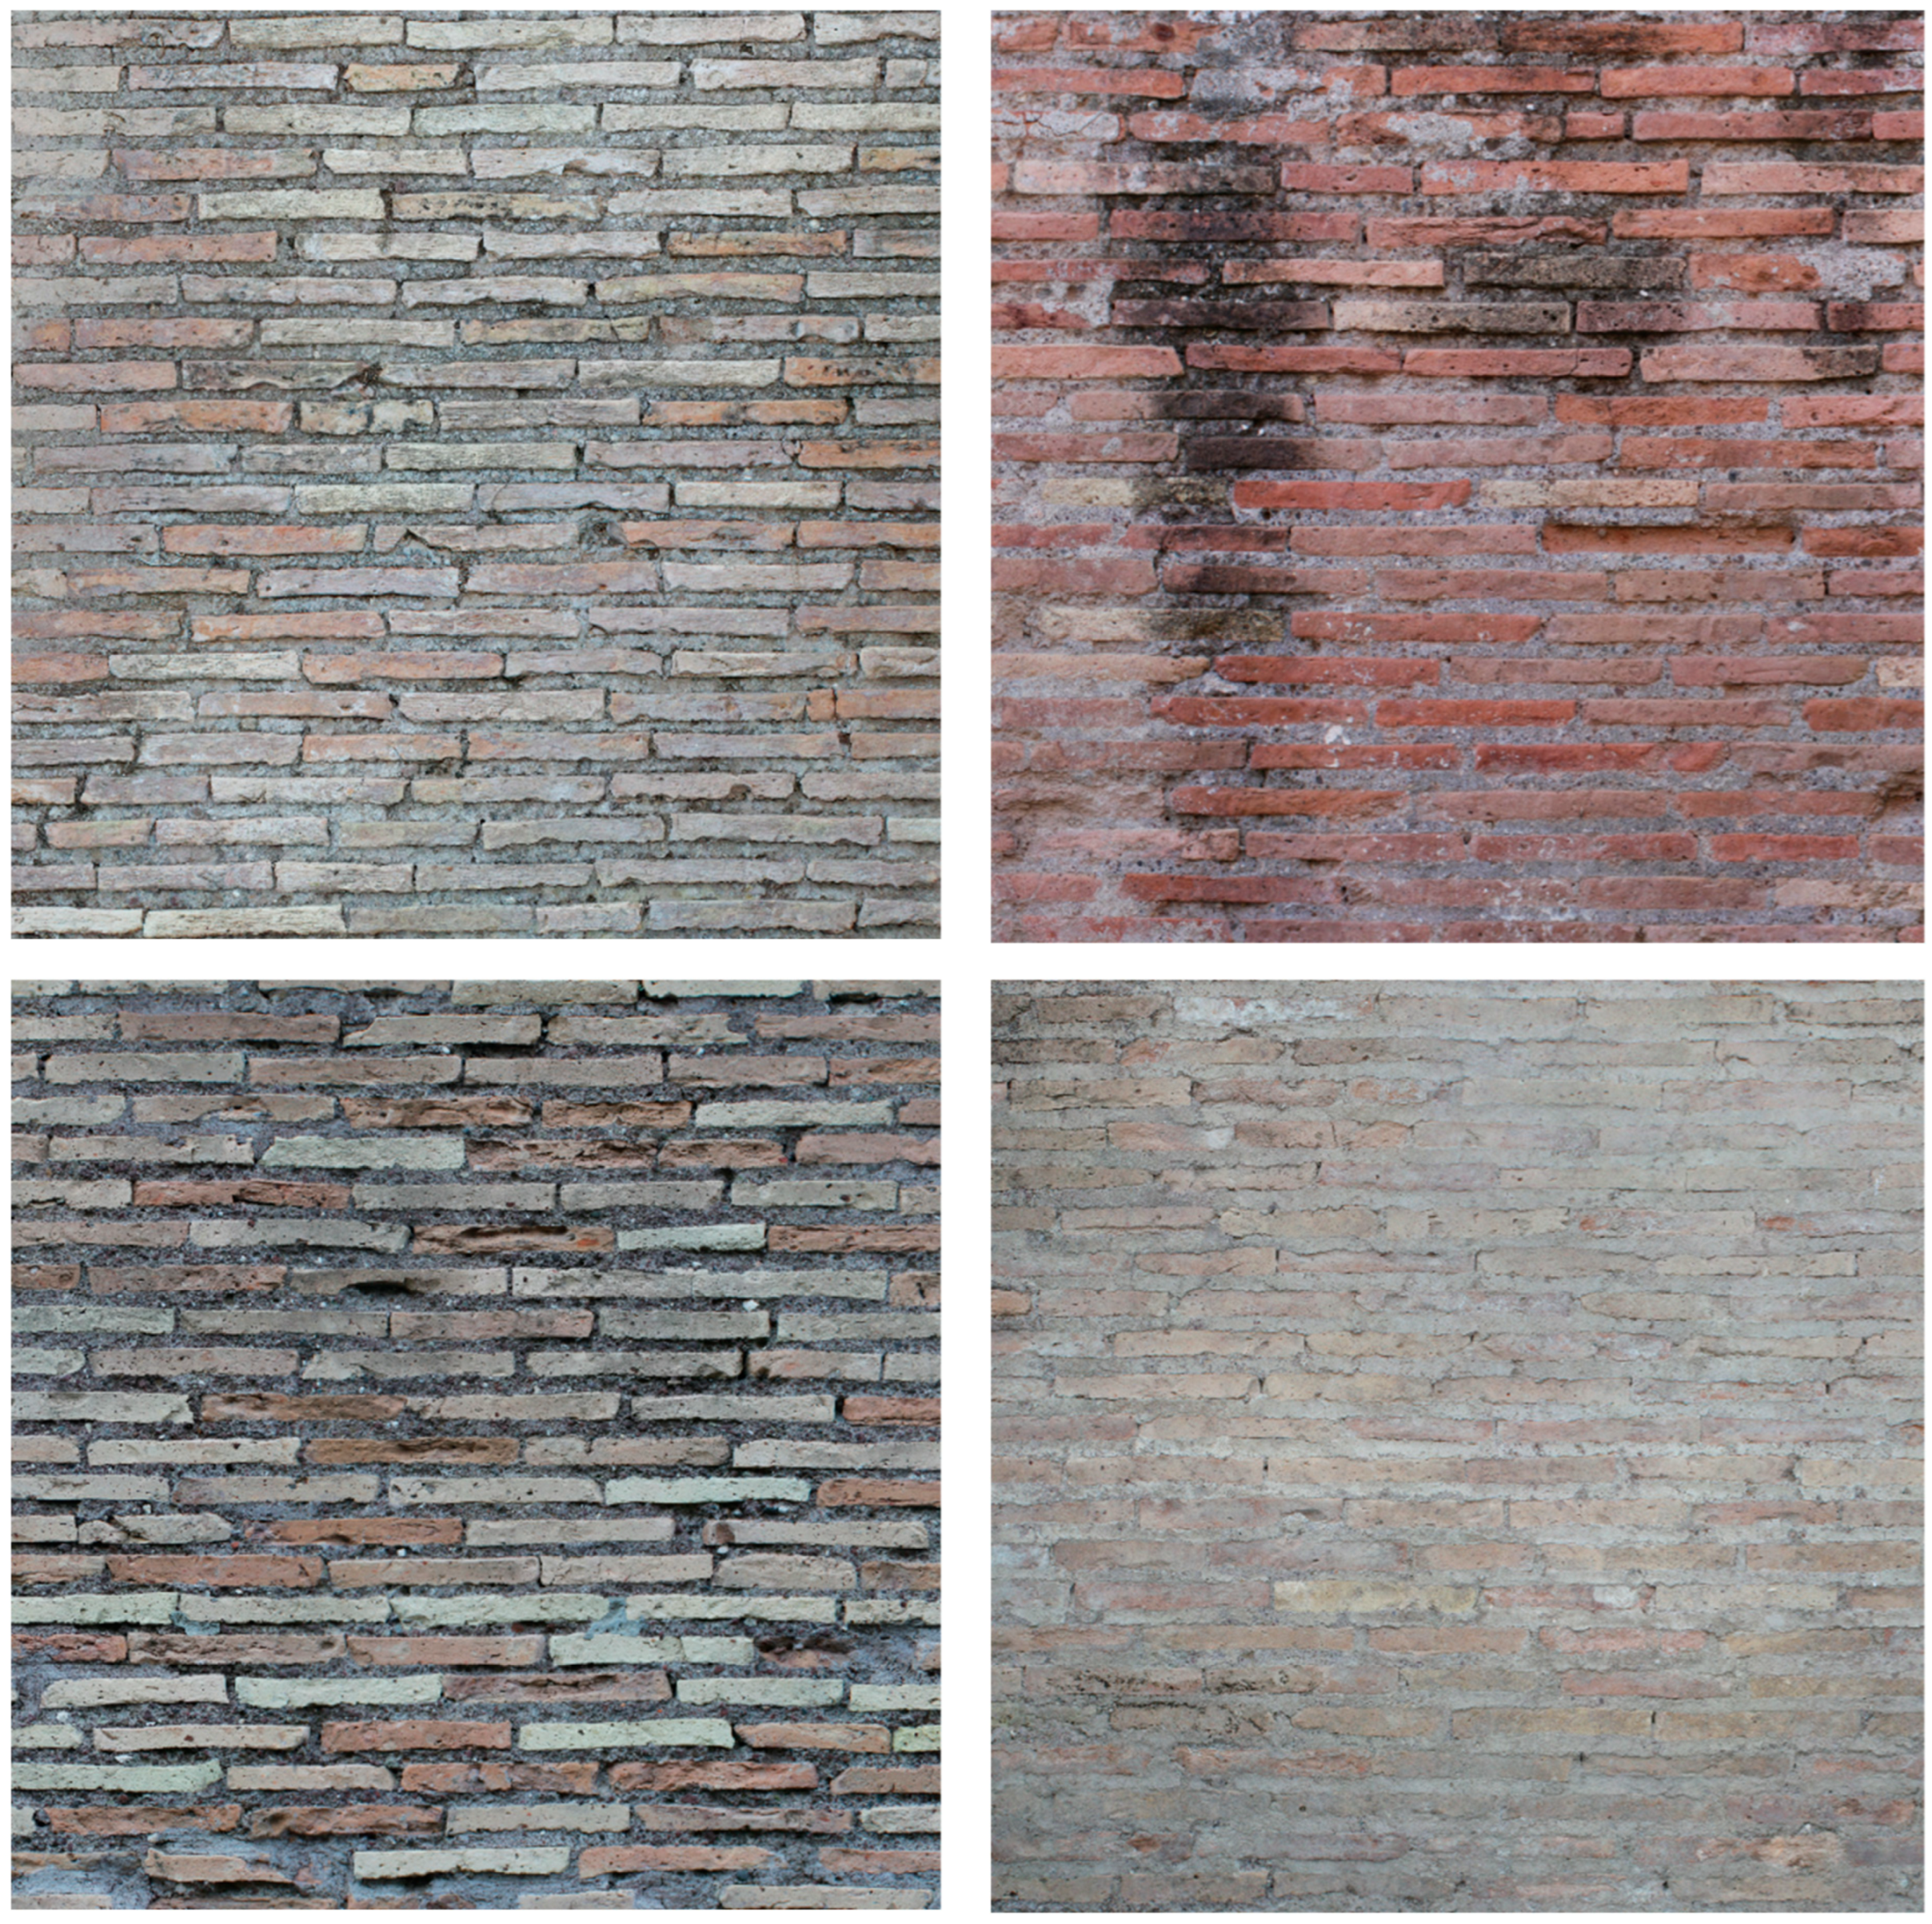
For this reason, four samples characterised by a heterogeneous masonry texture were selected for a total of 489 bricks (see
Figure 10).
Each of the orthophotos was processed using TagLab testing the different assisted segmentation modules in both time and accuracy. The tools that were most efficient were the “4-clicks tool” and the “SAM positive/negative clicks”. It is in fact through these tools that the best compromise between time and accuracy was achieved, where, for other methods, the continuous intervention between adjustments and corrections did not lead to any real time savings. In particular, it is the “SAM positive/negative clicks” tool that has proven to be surprisingly fast and accurate because, after setting the working area to include the entire 1 sqm sample, just one click per brick is sufficient to obtain an extremely well-fitting polygon without any further adjustments to improve or correct the result.
However, although at a preliminary check, the assisted segmentation had already shown visually surprising results, it was necessary to dig deeper and compare the data, also and above all, from a metric point of view.
The brick polygons were then exported in vector format (.shp) and processed in QGIS using the Roman Brick Analysis script; the results were then compared with those obtained from the traditional manual procedure.
The comparison took into account three main factors:
The global statistics calculated for each sample since, although there are small and inevitable variations in the measurements of the bricks returned with the two approaches, the fundamental aspect is to quantify how much these variations affect the overall assessment of the sample (see
Table 2);
The distribution of brick sizes for each sample by comparing box and whisker plots for both lengths and thicknesses (see
Figure 11);
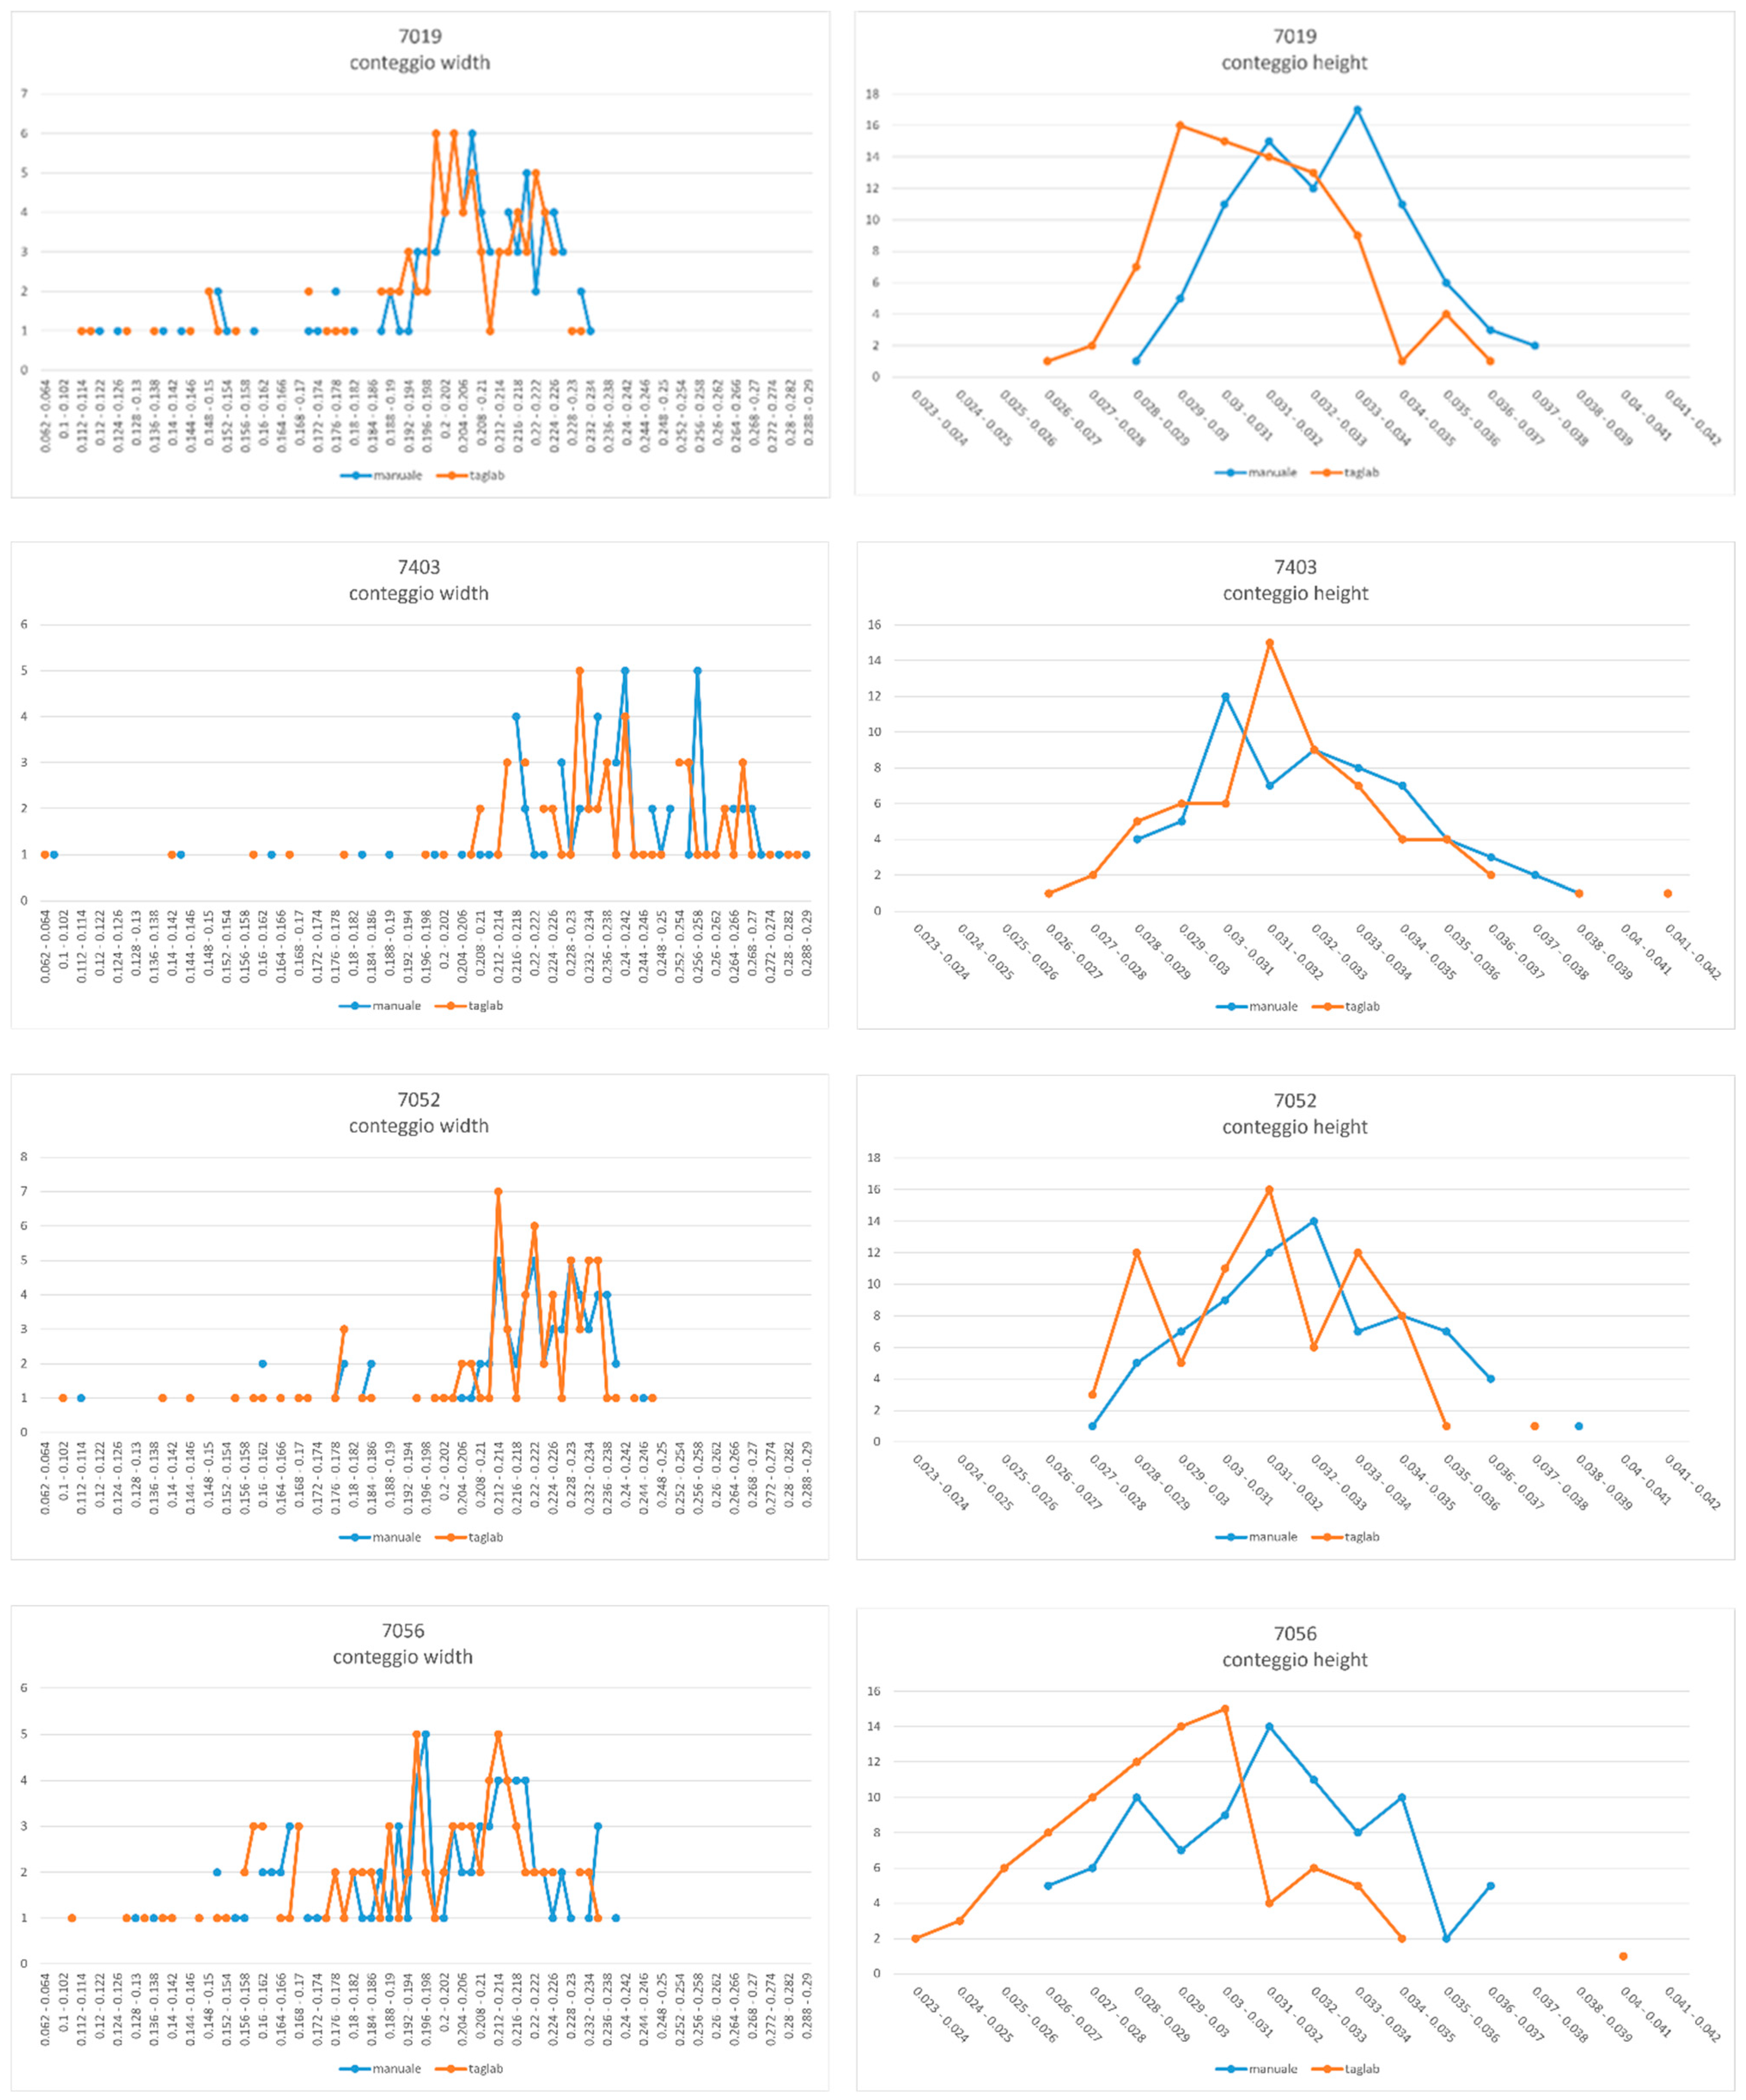
The distribution of brick sizes for each sample based on a range of 2 mm for lengths and 1 mm for thicknesses (see
Figure 12).
The comparison shows that the variations found in the measurements of individual bricks do not seem to have any influence on the overall assessment of the sample nor on the distribution of measurements. The situation is different, however, regarding the distribution of the quantities of bricks based on predetermined ranges. In particular, the graphs of the thicknesses show, for all the samples compared, a certain misalignment between the results with differences in the maximum, minimum and mean values. This phenomenon must be connected with measurement variations within ranges of 1 or 2 mm calculated from images and thus conditioned by the size of the pixels (the orthophotos used for comparison all have a resolution of 1 mm/pixel). Consequently, positive and/or negative deviations in measurements between the manual approach and TagLab’s semi-assisted segmentation must be evaluated with a tolerance index directly proportional to the resolution of the images themselves. In general, however, it appears that the “SAM positive/negative clicks” segmentation method tends to slightly underestimate the measurements, but, due to the same limitations just mentioned, it is possible to assume that a real trend is occurring.
In conclusion, from the comparison between the results of the two methods, the judgement regarding TagLab’s semi-assisted segmentation tools is extremely positive, especially if the evaluation includes the enormous time saving that the author experienced when processing the four samples presented.
7. Conclusions and Future Perspectives
The work presented demonstrates how the integration of digital methodologies represents a turning point in the study and documentation of ancient brick-faced masonry using tools that are not designed to replace the figure of the researcher but rather to support and enhance his skills. In particular, through the adoption of semi-automatic and automatic tools, such as the TagLab platform for segmentation and the “Roman Brick Analysis” script for the dimensional analysis, it is possible to overcome the main limitations of traditional quantitative and mensiochronological analysis: the high consumption of time, the subjectivity of measurements, and the poor comparability of results. The “Roman Brick Analysis” script represents the automated transposition of a rigorous methodology for the dimensional analysis of bricks according to objective criteria, while the comparison between the manual method and the TagLab-supported method showed an excellent correspondence in the results and a considerable saving of time in the digitalisation phases. Despite some deviations, undoubtedly linked to the resolution of the images, semi-assisted segmentation tools such as the “4-clicks tool” and the “SAM positive/negative clicks” proved to be effective both in terms of accuracy and practicality, confirming that the digital approach is sufficiently mature to integrate traditional methodologies, thus opening up promising perspectives towards systematic application on a large scale. The work presented demonstrates how the integration of traditional analysis methods and digital tools based on artificial intelligence represents a turning point in the study and documentation of ancient building, especially for Roman brick-faced masonry. The whole procedure is dedicated to archaeological analysis, but it is clear that the quantitative analysis of building materials can also be useful for restoration and conservation projects.
The use of open-source and interoperable solutions not only frees the analysis from constraints linked to proprietary software and formats but also offers the possibility of extracting new knowledge from the reuse of previous surveys provided that these satisfy the minimum conditions in terms of accuracy. The reuse and sharing of data is in fact an essential condition for expanding the knowledge framework and opening up new perspectives for understanding intra- and inter-site construction processes. However, regarding the issue of sharing, it must be noted that there is no “place” where the scientific community can share and browse research results and, above all, make the data talk to each other; in this direction, assistance could be provided by the portal of the “Atlas of Roman Building Techniques” (ACOR) [
44], which gathers together an analytical corpus on Roman masonry techniques, which can be consulted based both on geography and/or typology, as well as providing freely downloadable resources such as formats for field sheets and standardised glossaries.
To conclude, a final consideration concerns the possibility of applying the same methodology to building techniques using construction materials other than bricks. While the surveying and segmentation procedures do not seem to present any particular problems, some cautions must be raised regarding the correct running of the minimum-oriented rectangle algorithm, which in the case of particularly irregular elements may not recognise the orientation of the geometry and consequently return incorrect measurements. Precisely for this circumstance, the script provides as output a polygonal layer containing the geometries relative to the minimum oriented rectangles for each element in order to graphically verify the validity of the analysis.
In addition, it is necessary to consider that the statistical indexes calculated for bricks may not be equally representative for the study of masonry built with other materials, for which a new methodological reflection is necessary in order to create a real kit of analysis tools adapted to the specificities of each material.


