
Characterization of Red Sandstone and Black Crust to Analyze Air Pollution Impacts on a Cultural Heritage Building: Red Fort, Delhi, India

 ,
,  , ,
, ,  ,
, 
Abstract
1. Introduction
2. Materials and Methodology
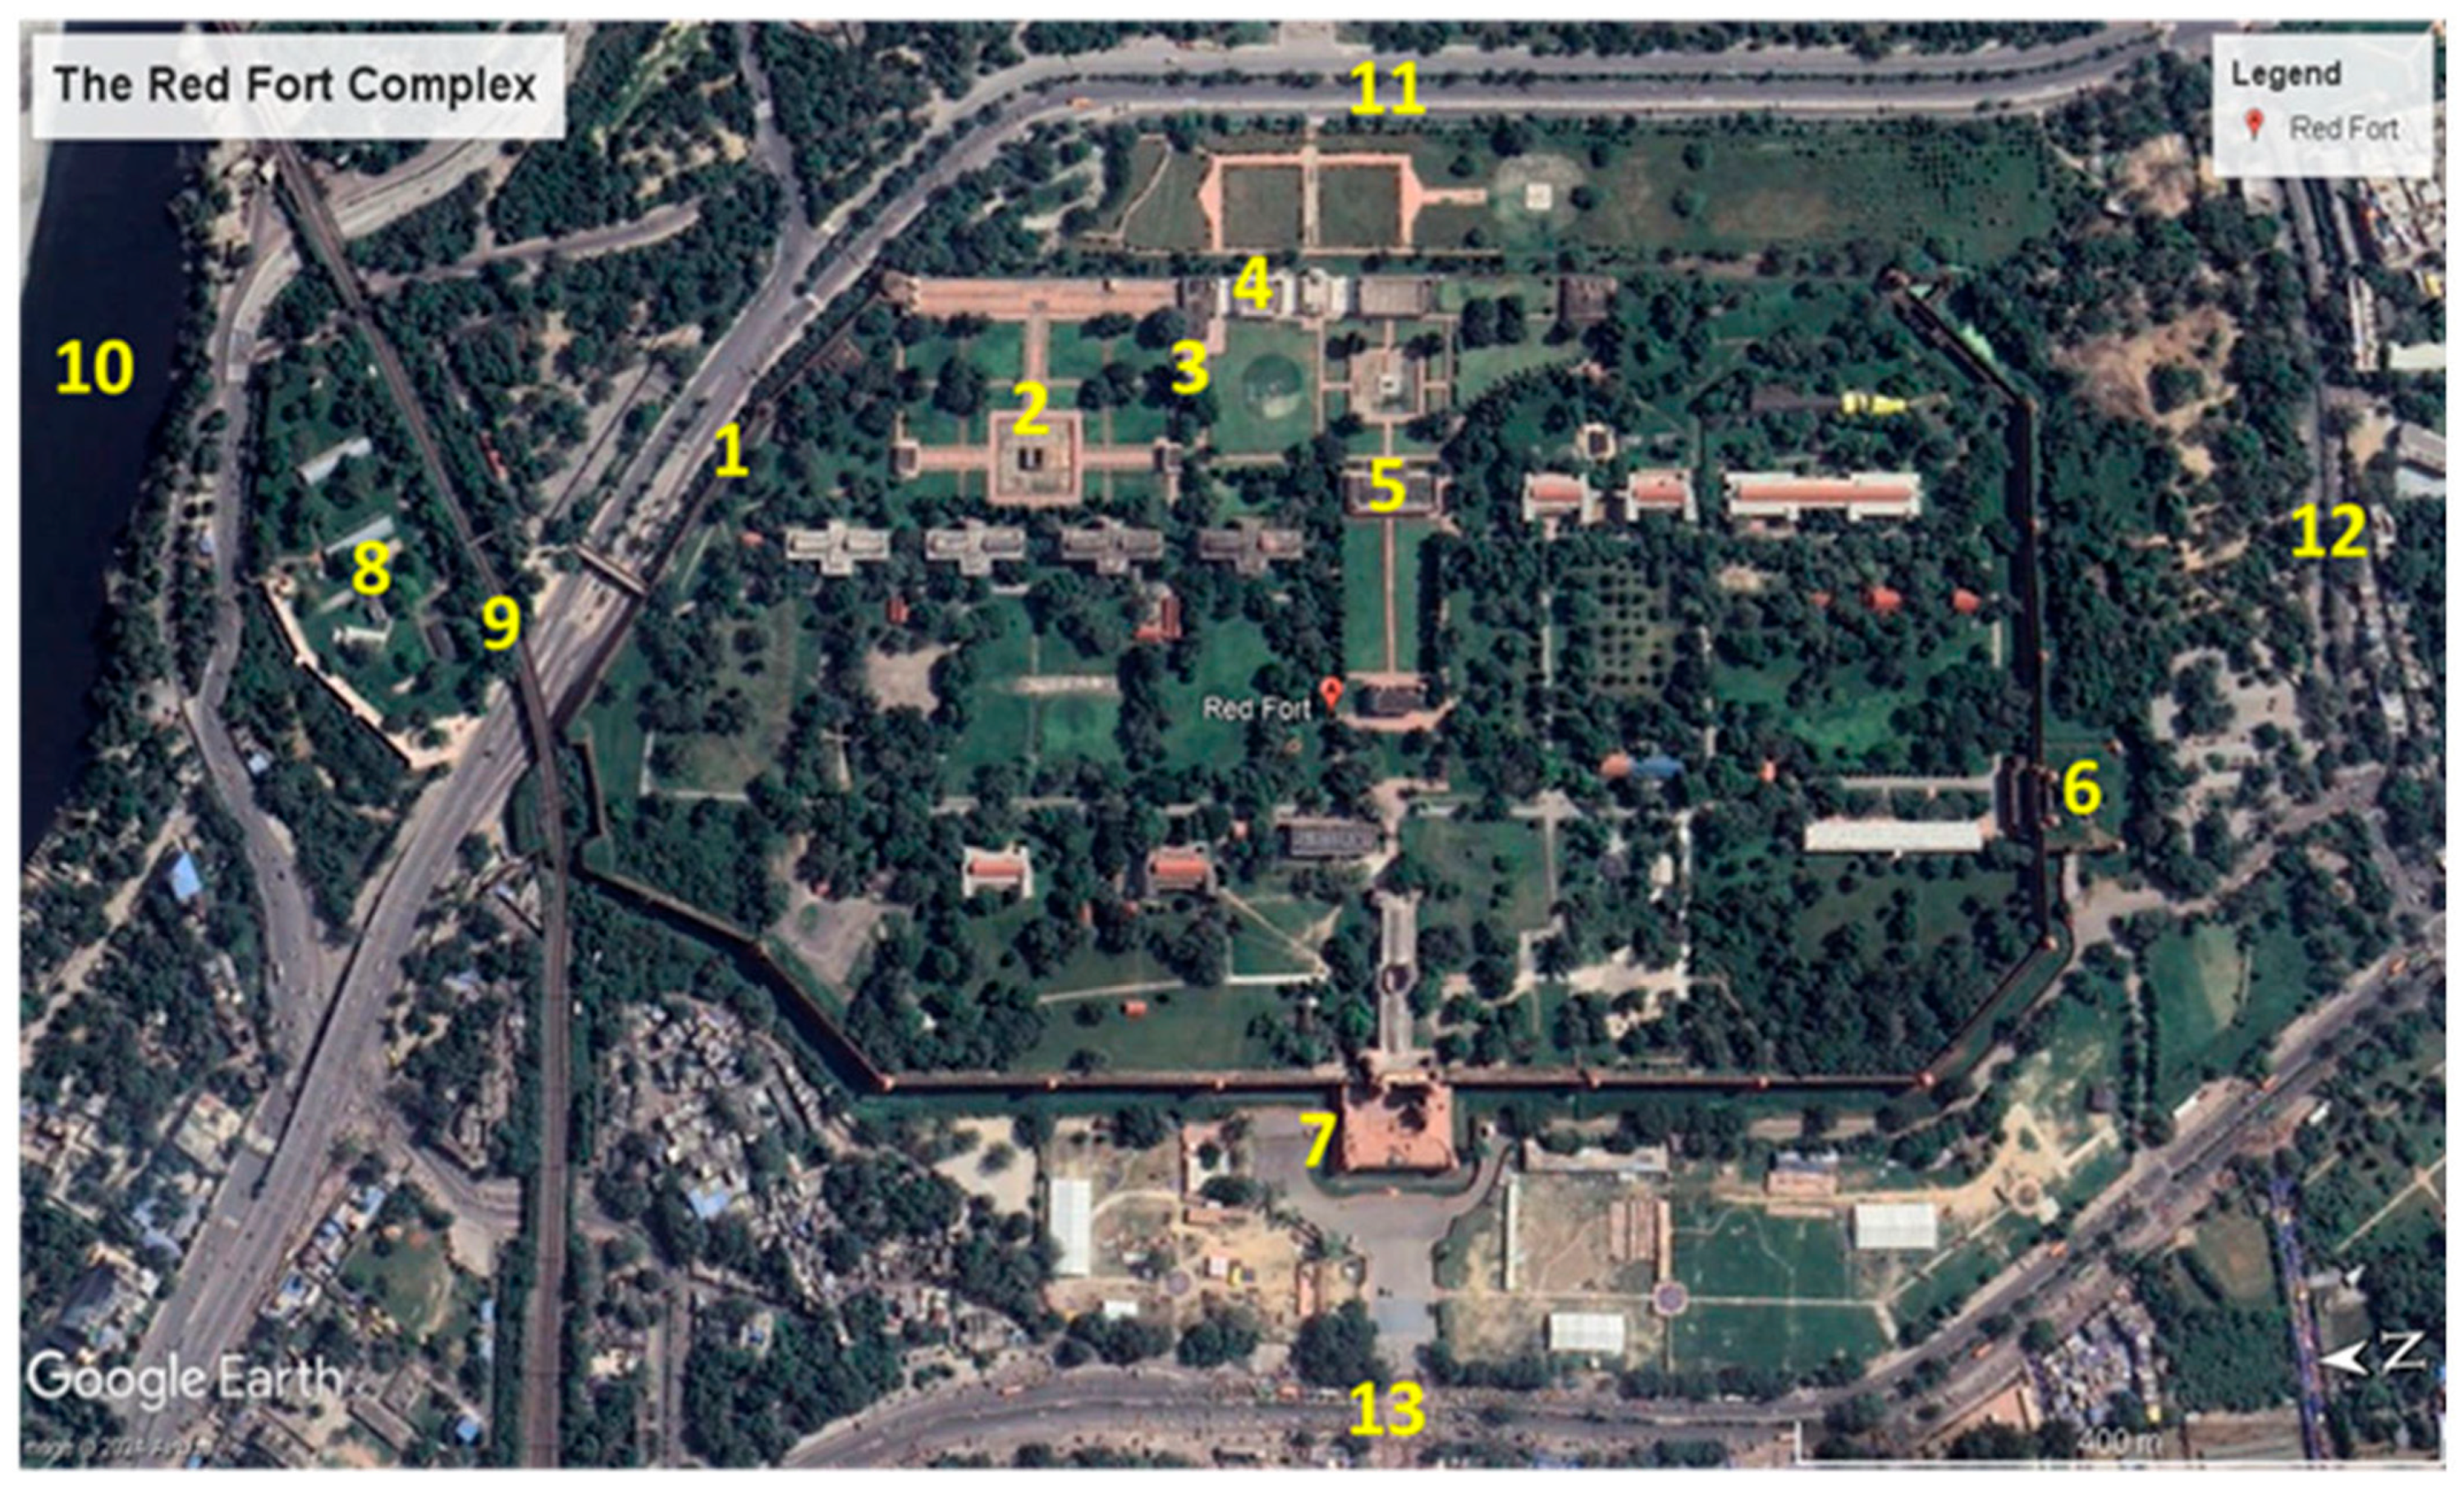
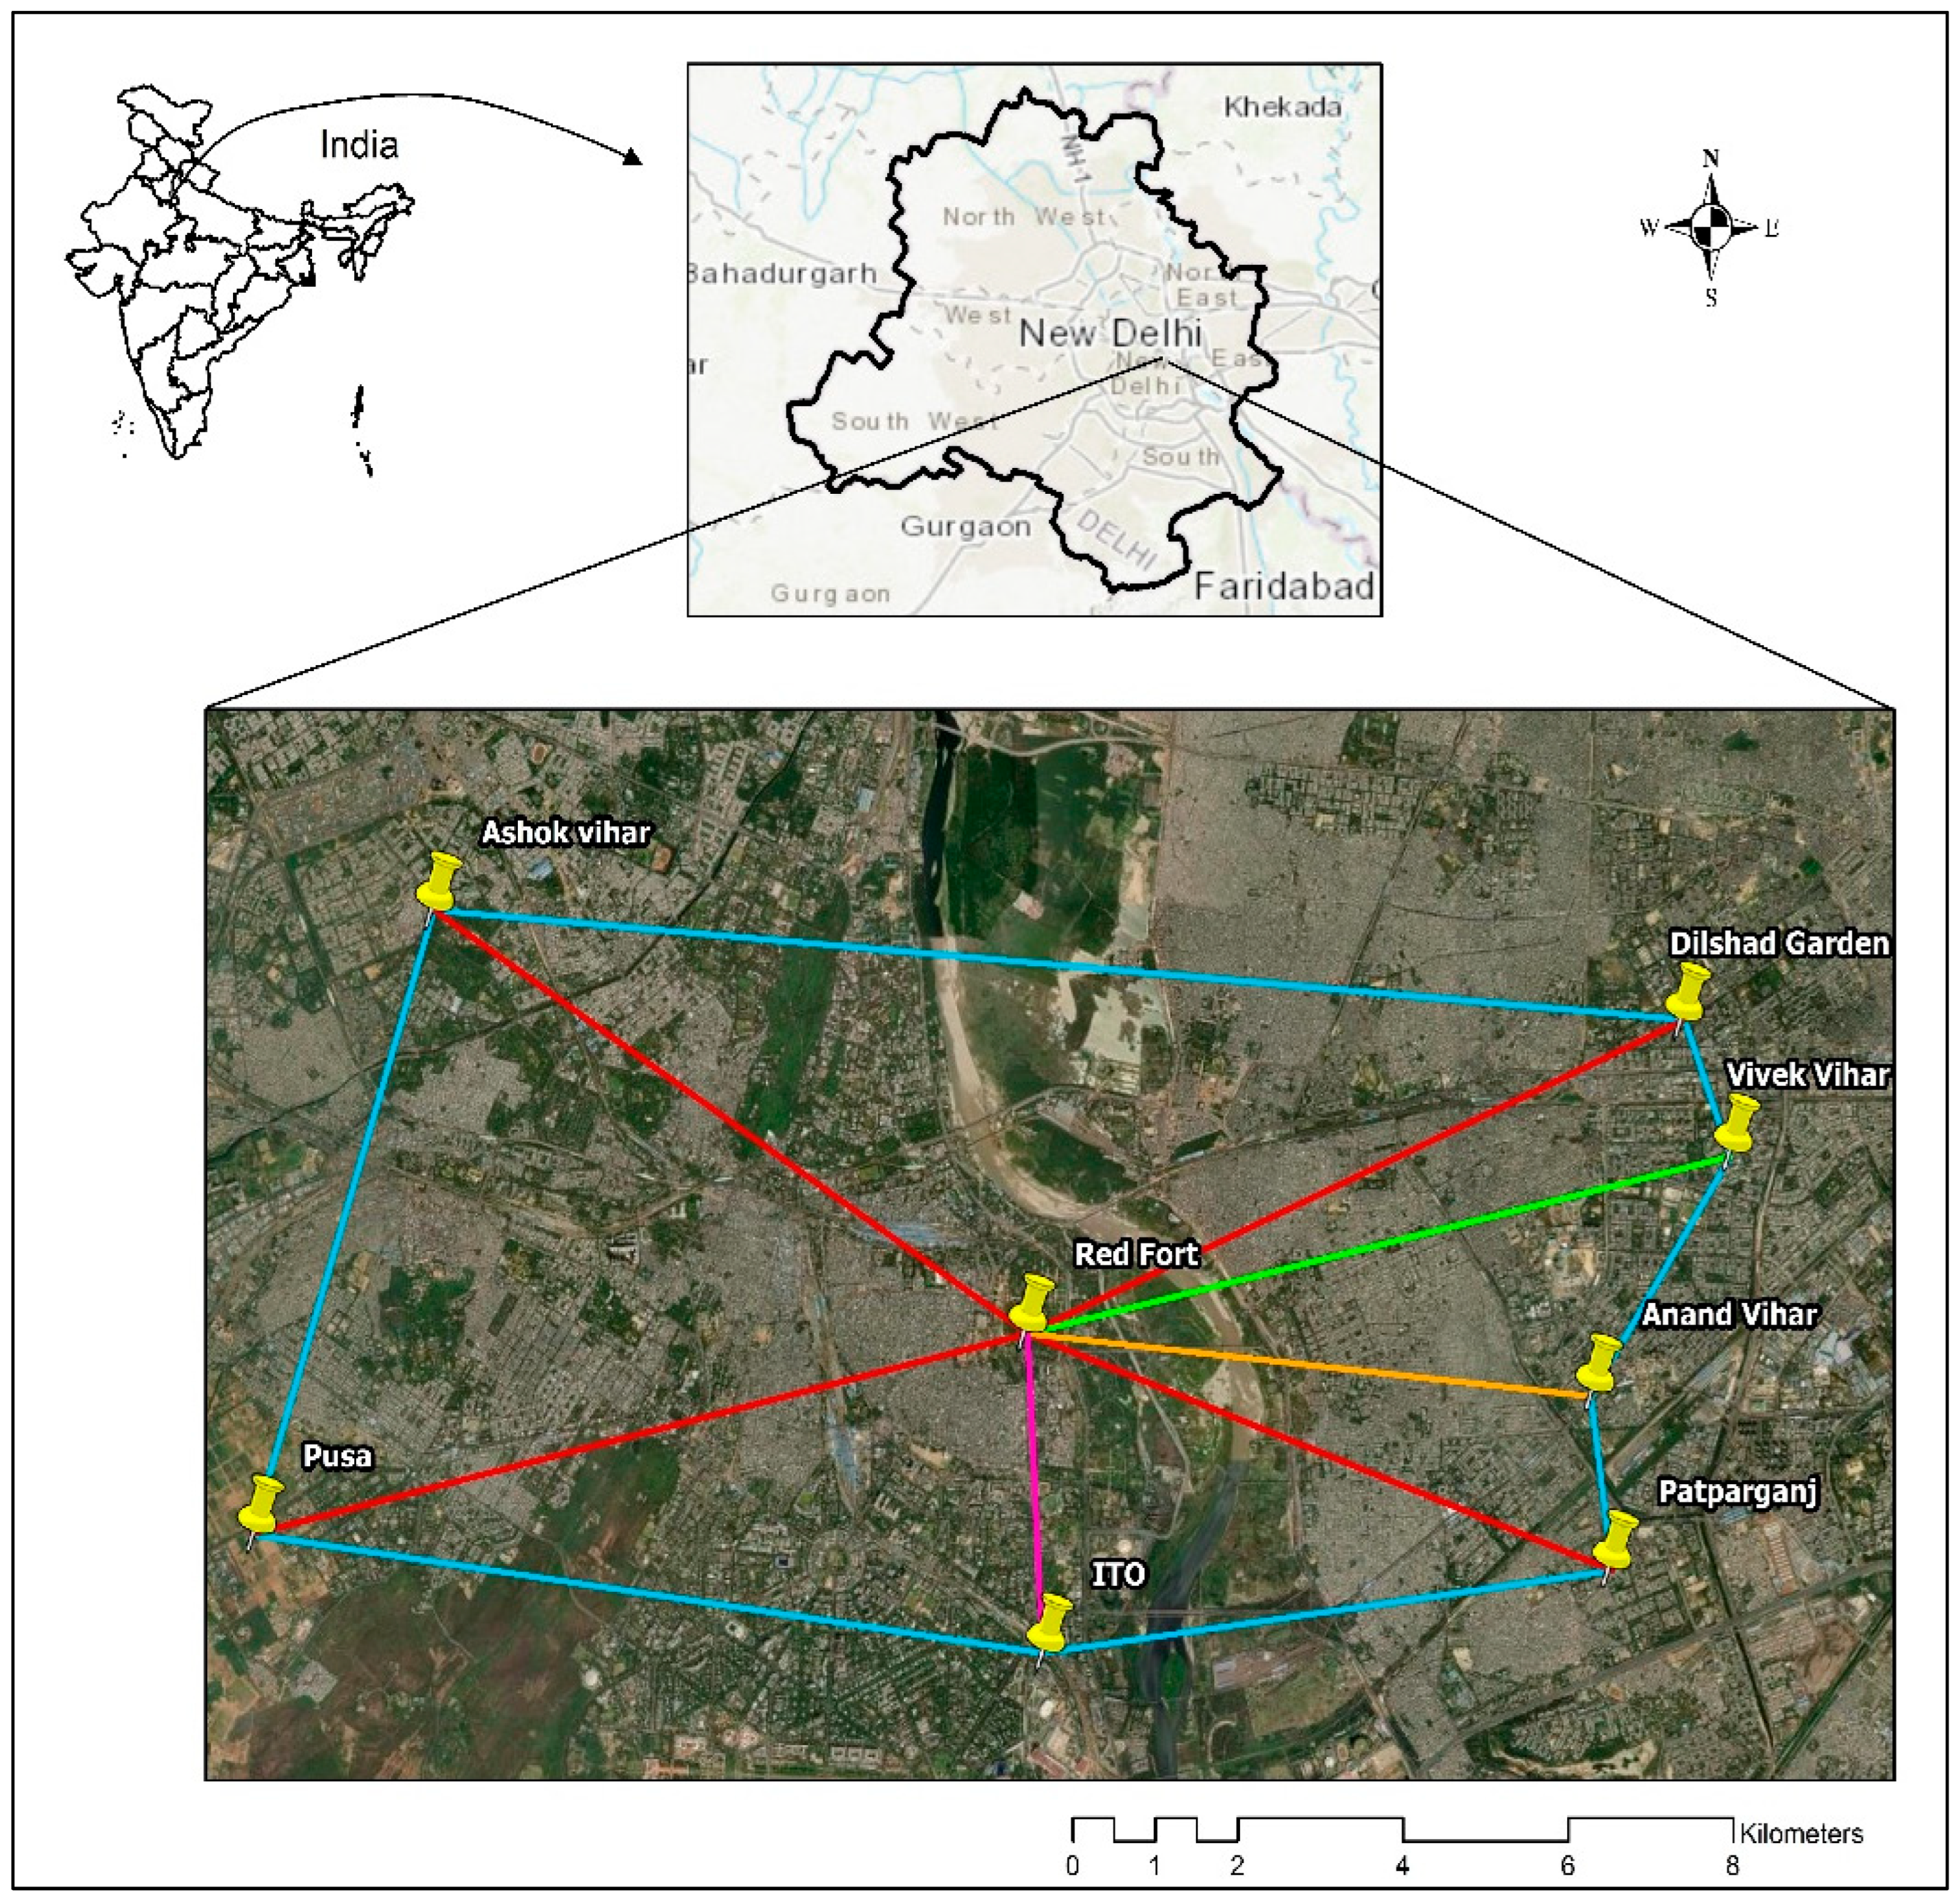
Sample Collection Sites/Points
3. Results and Discussion
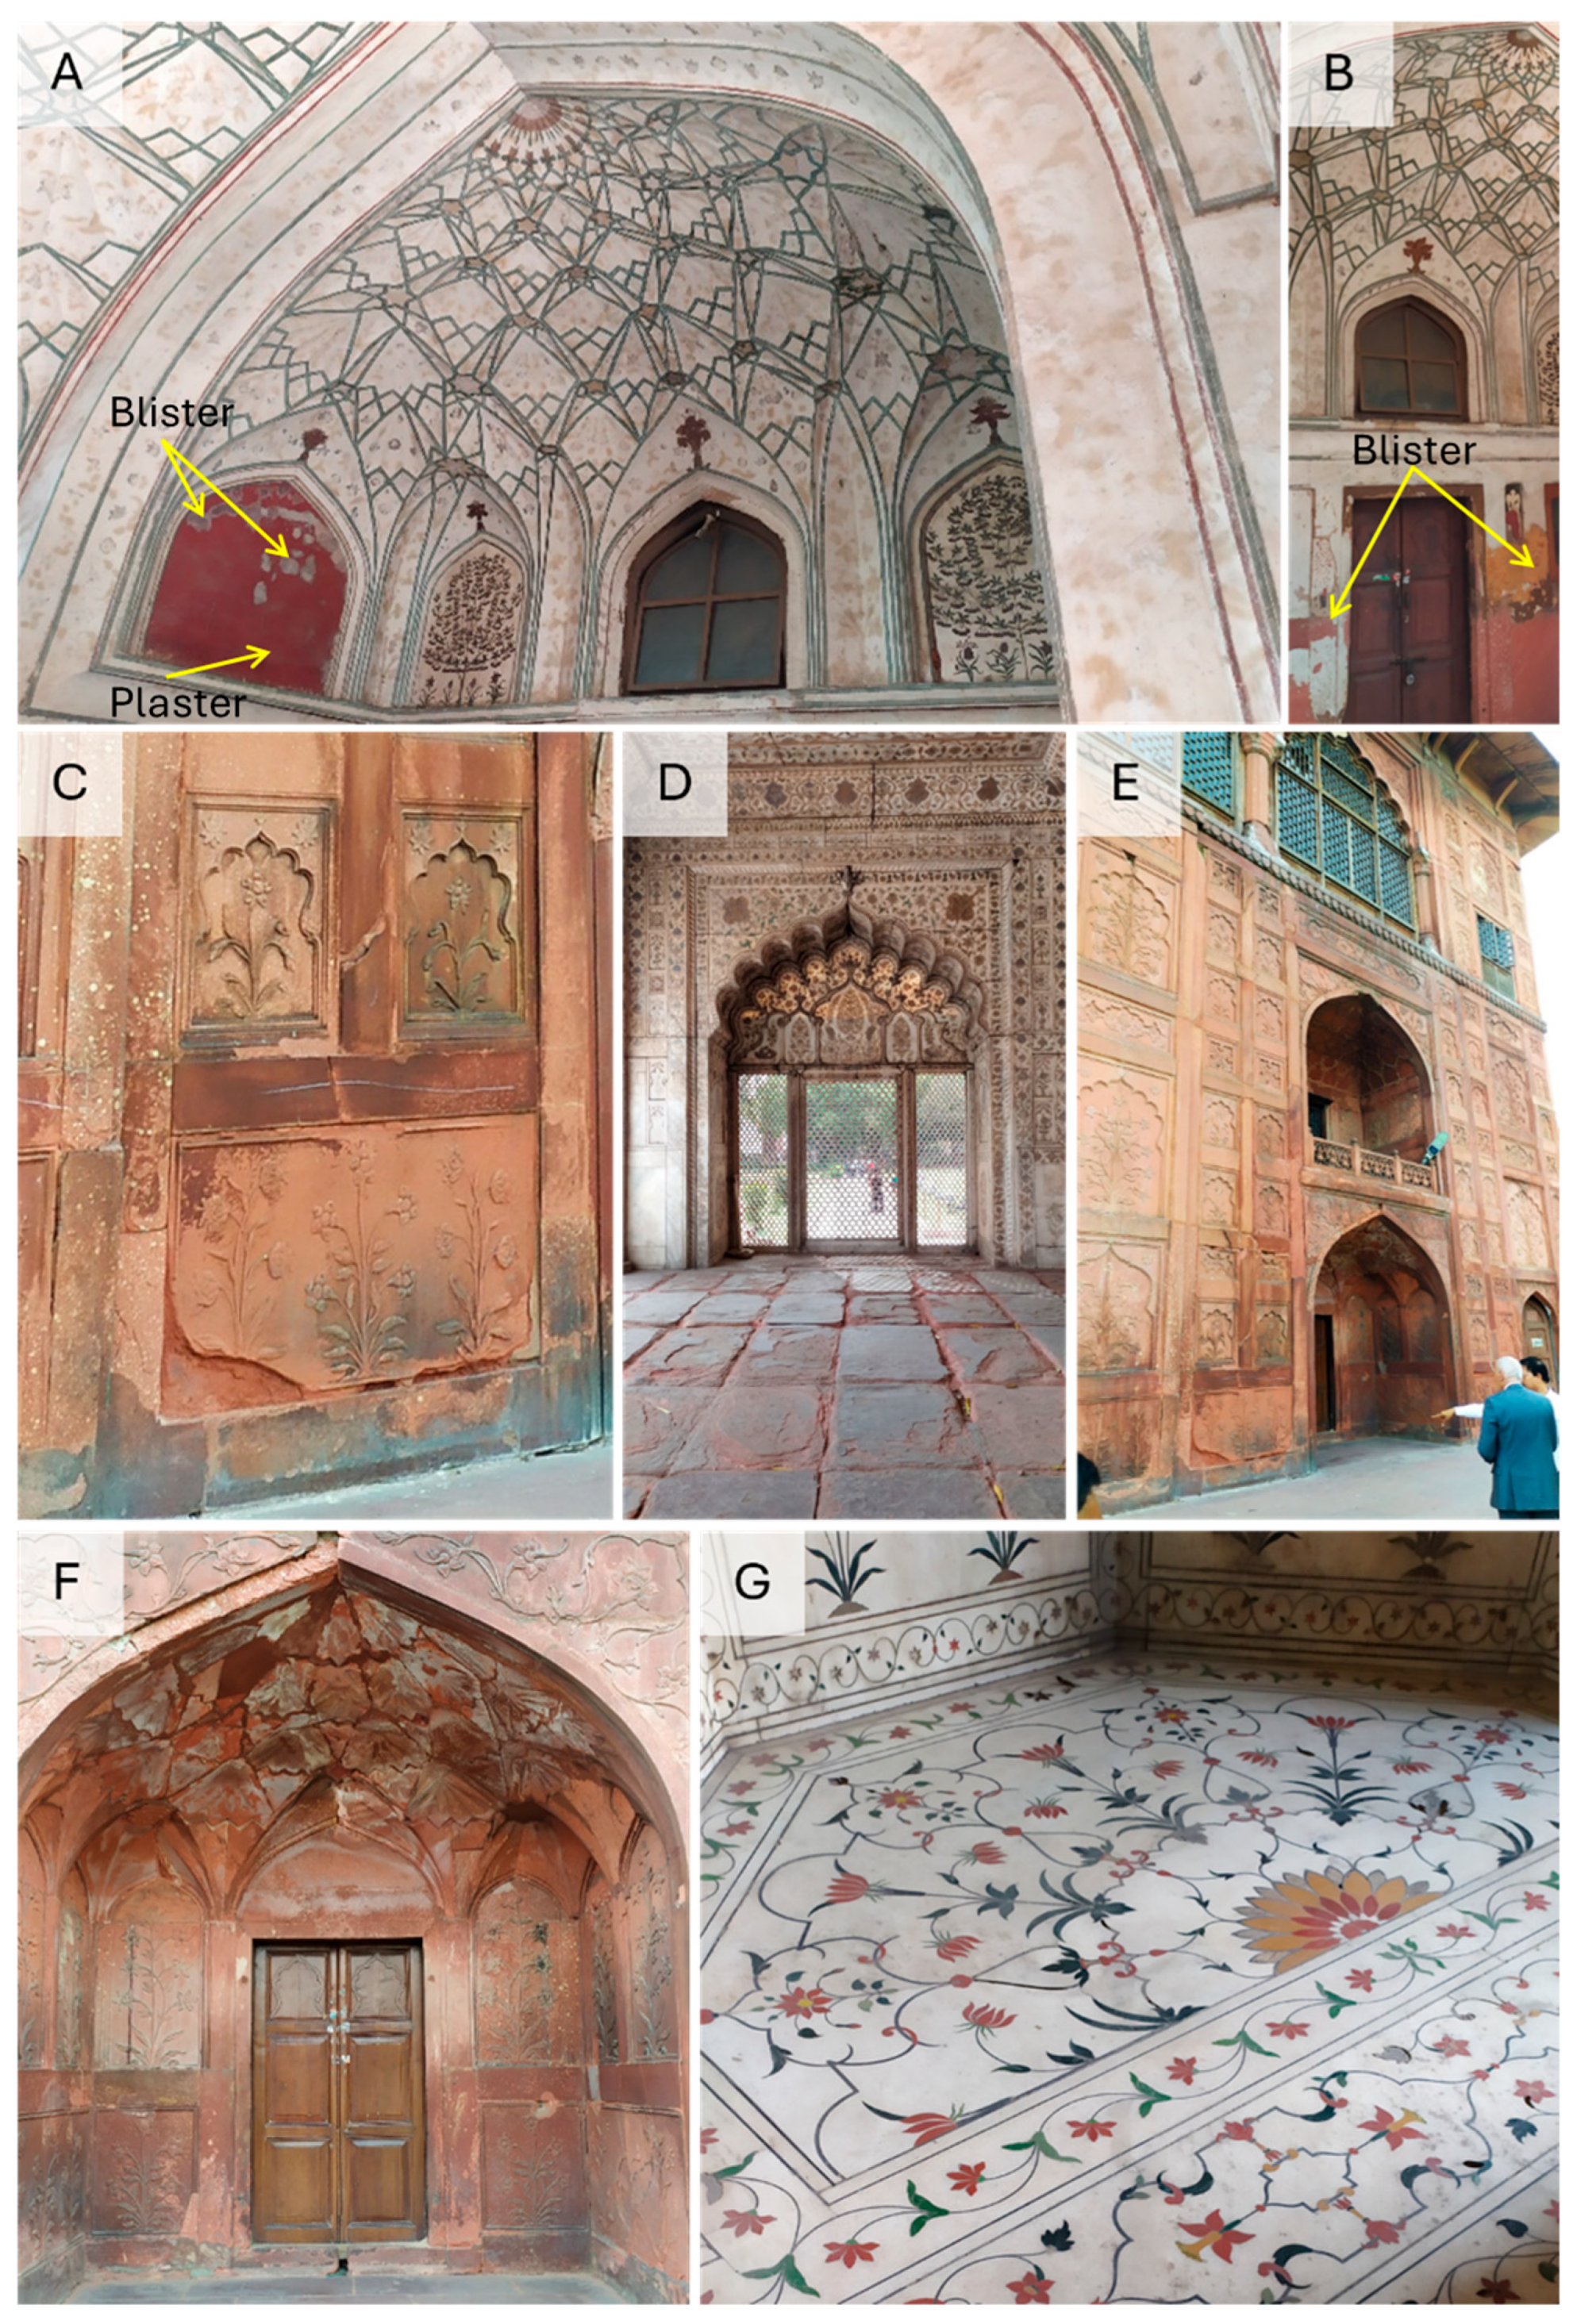
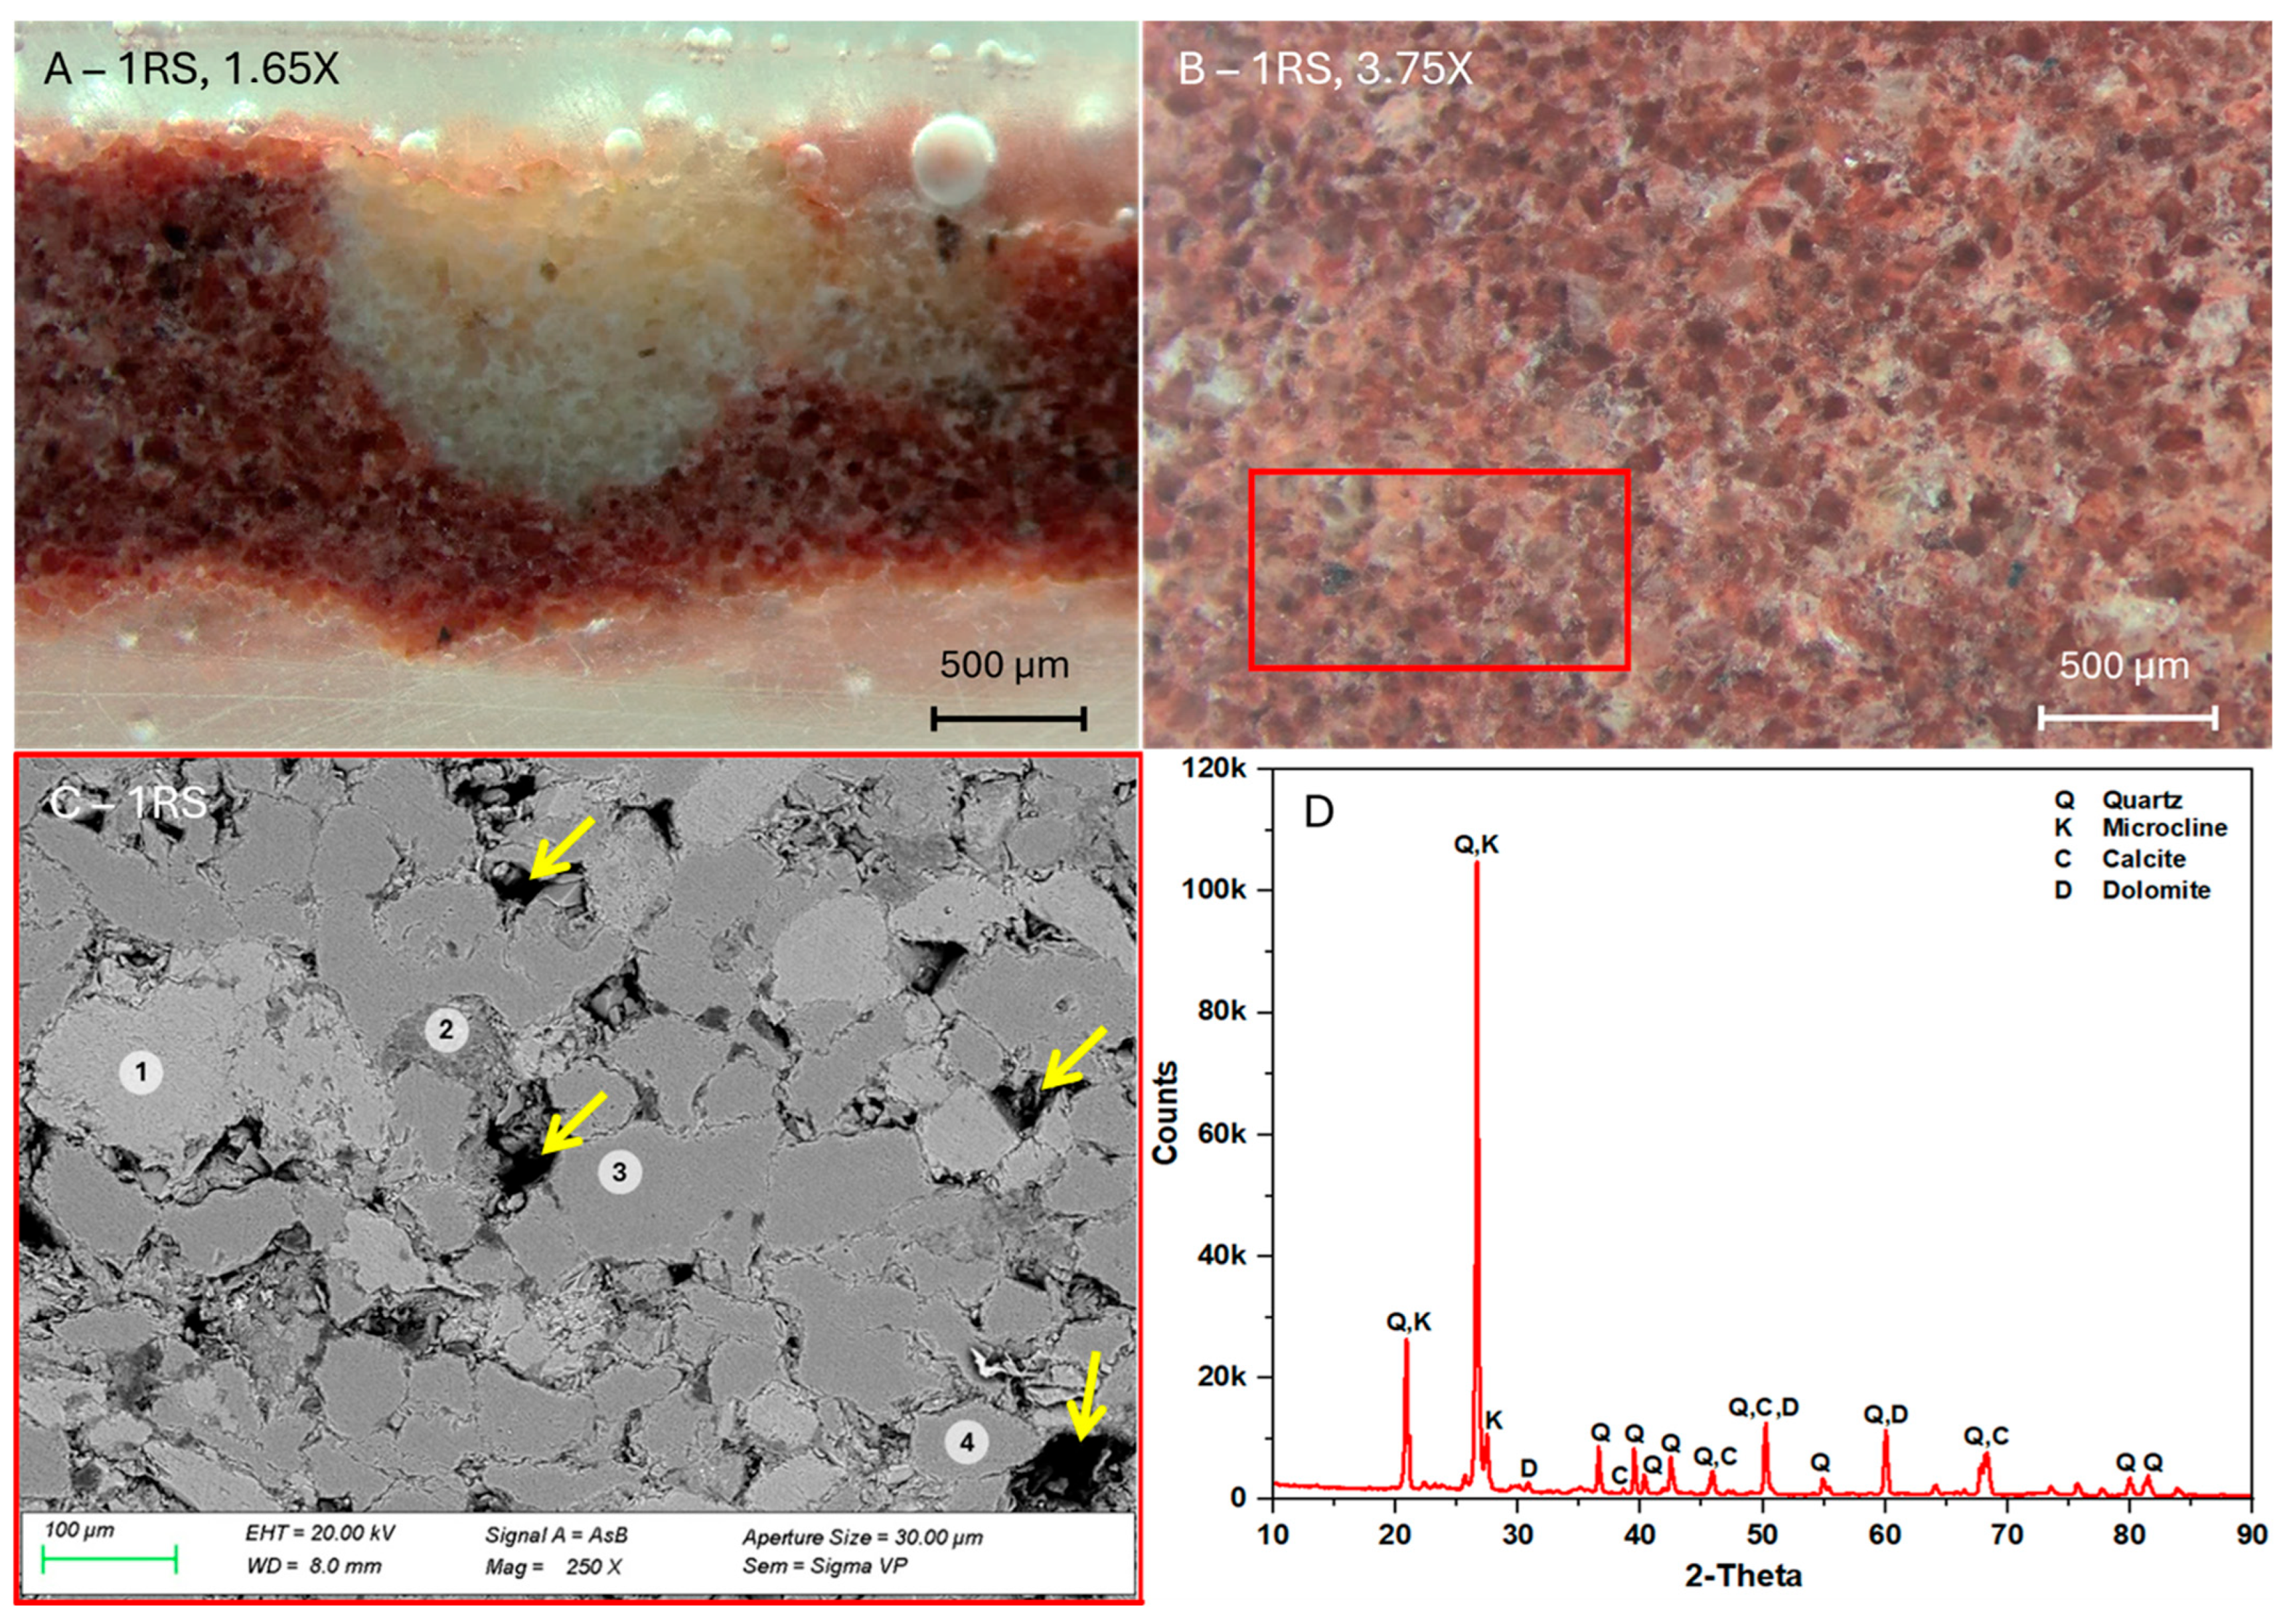
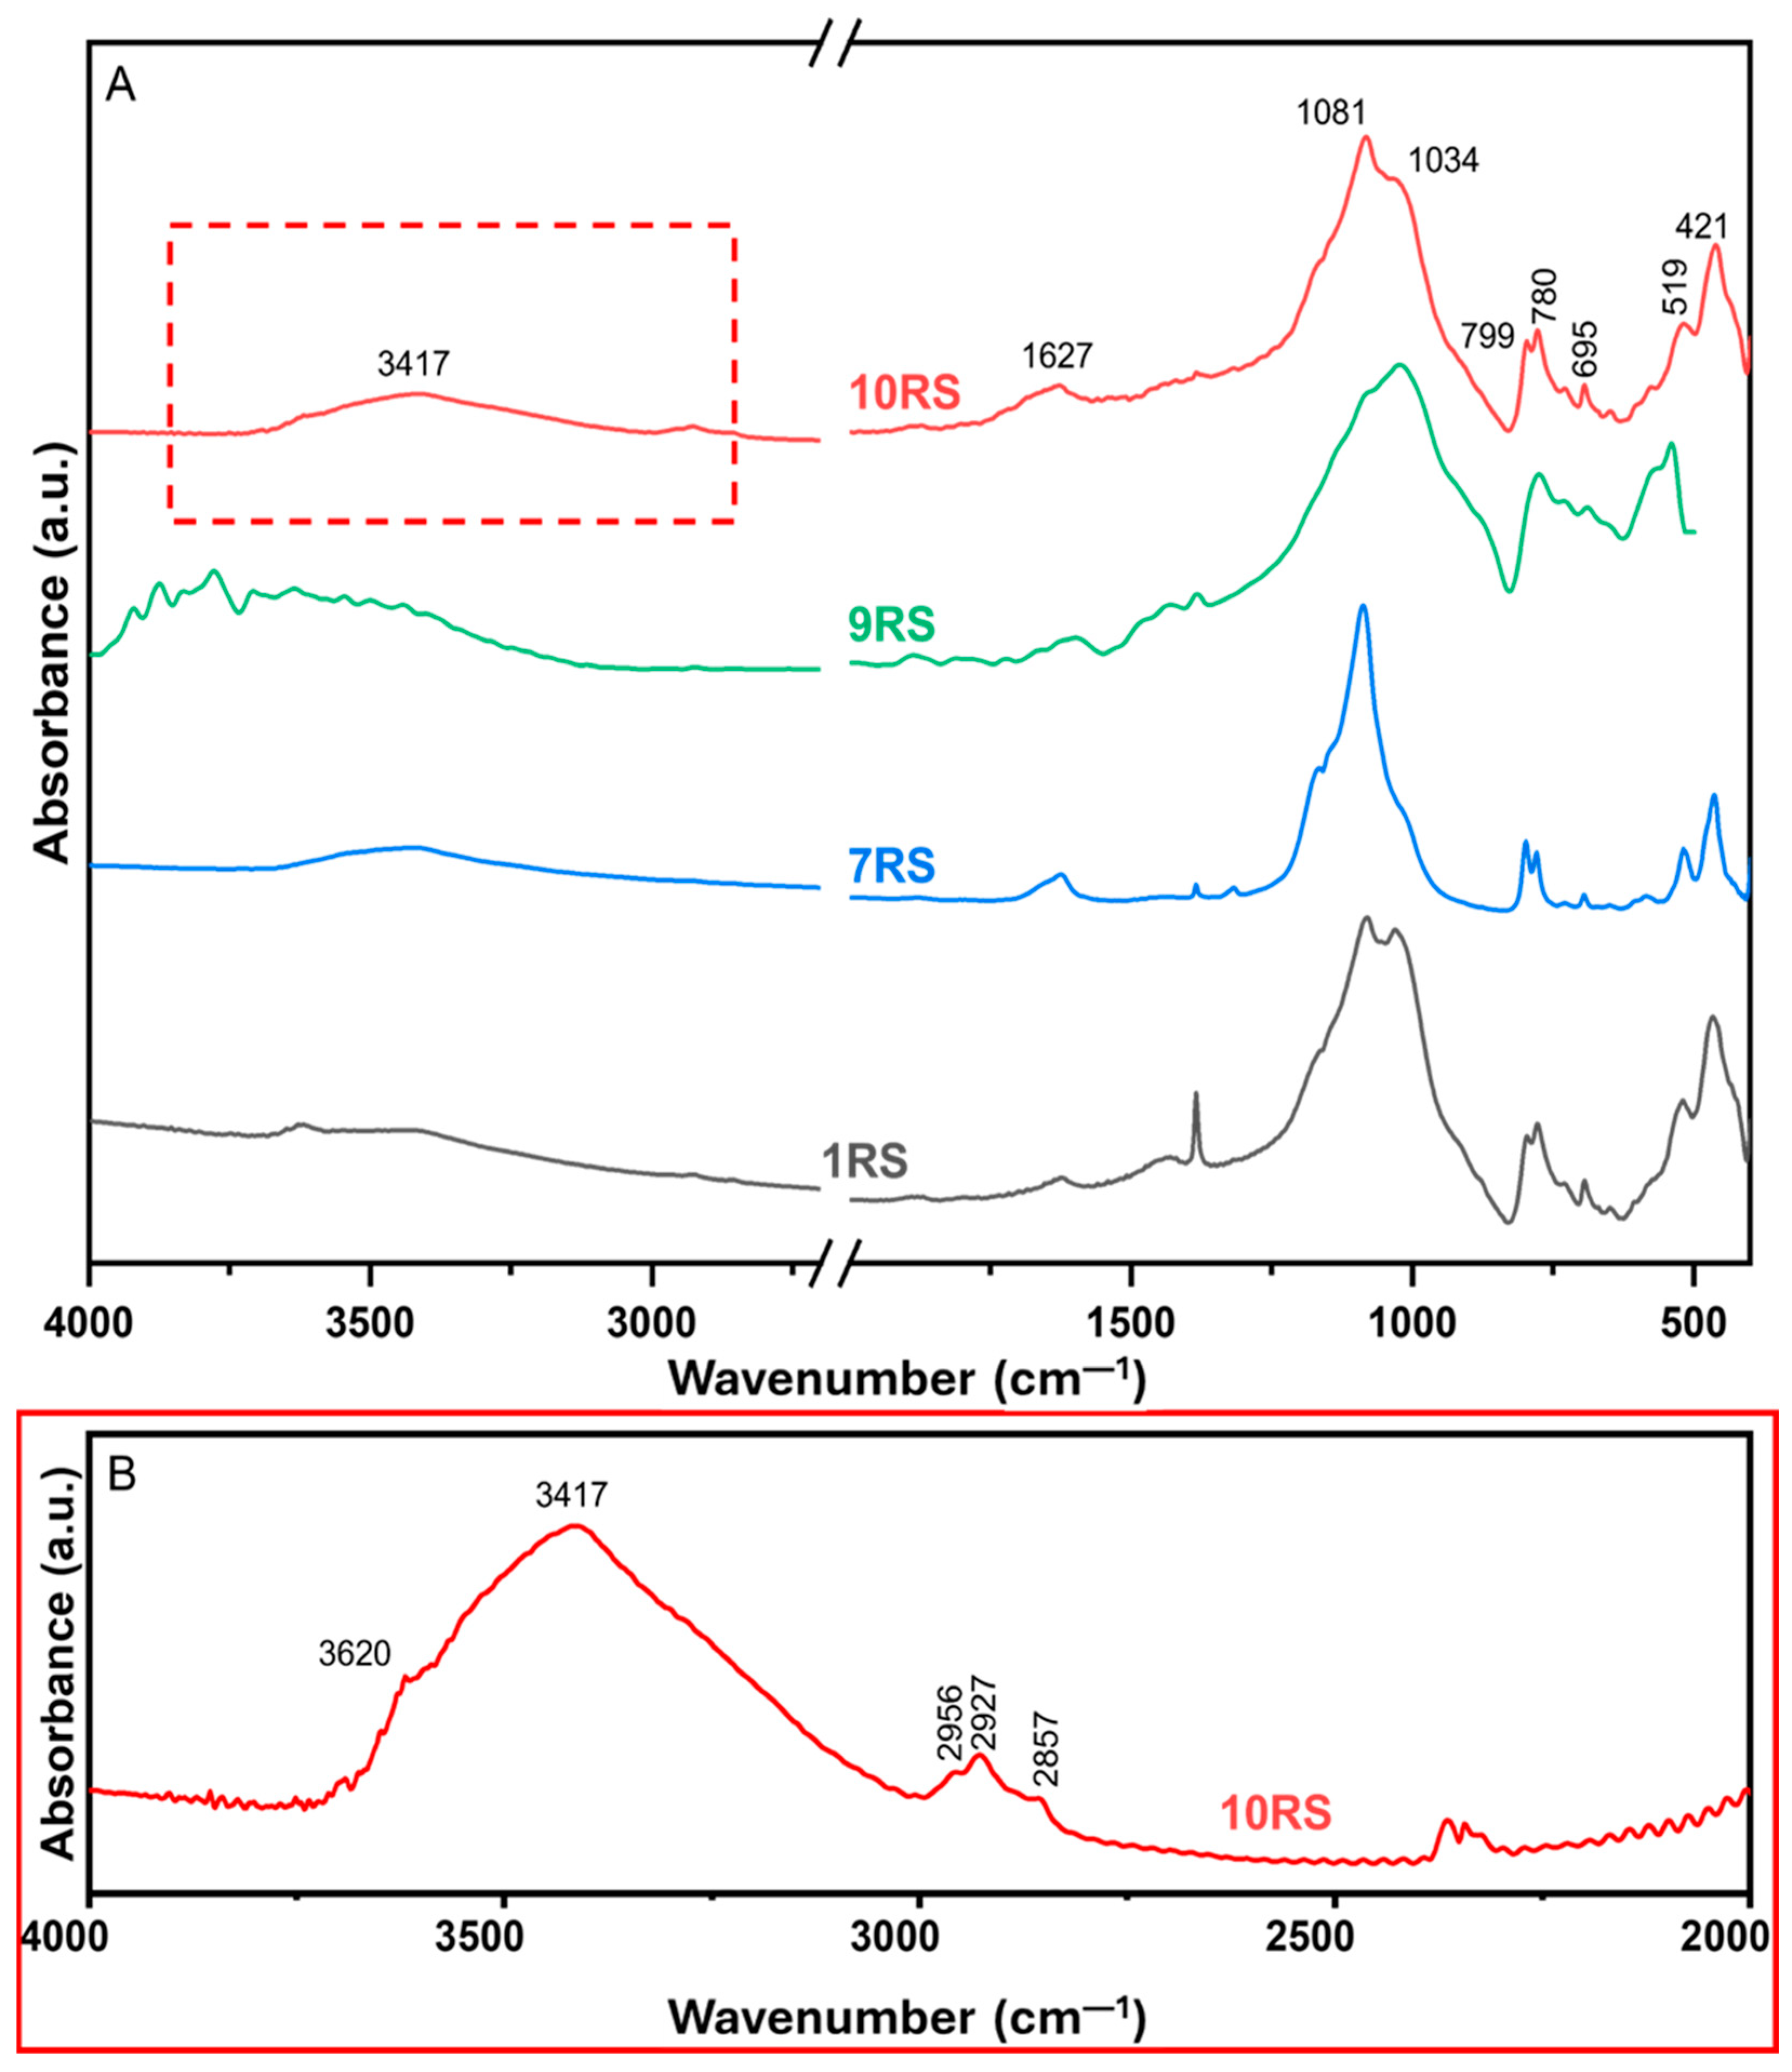
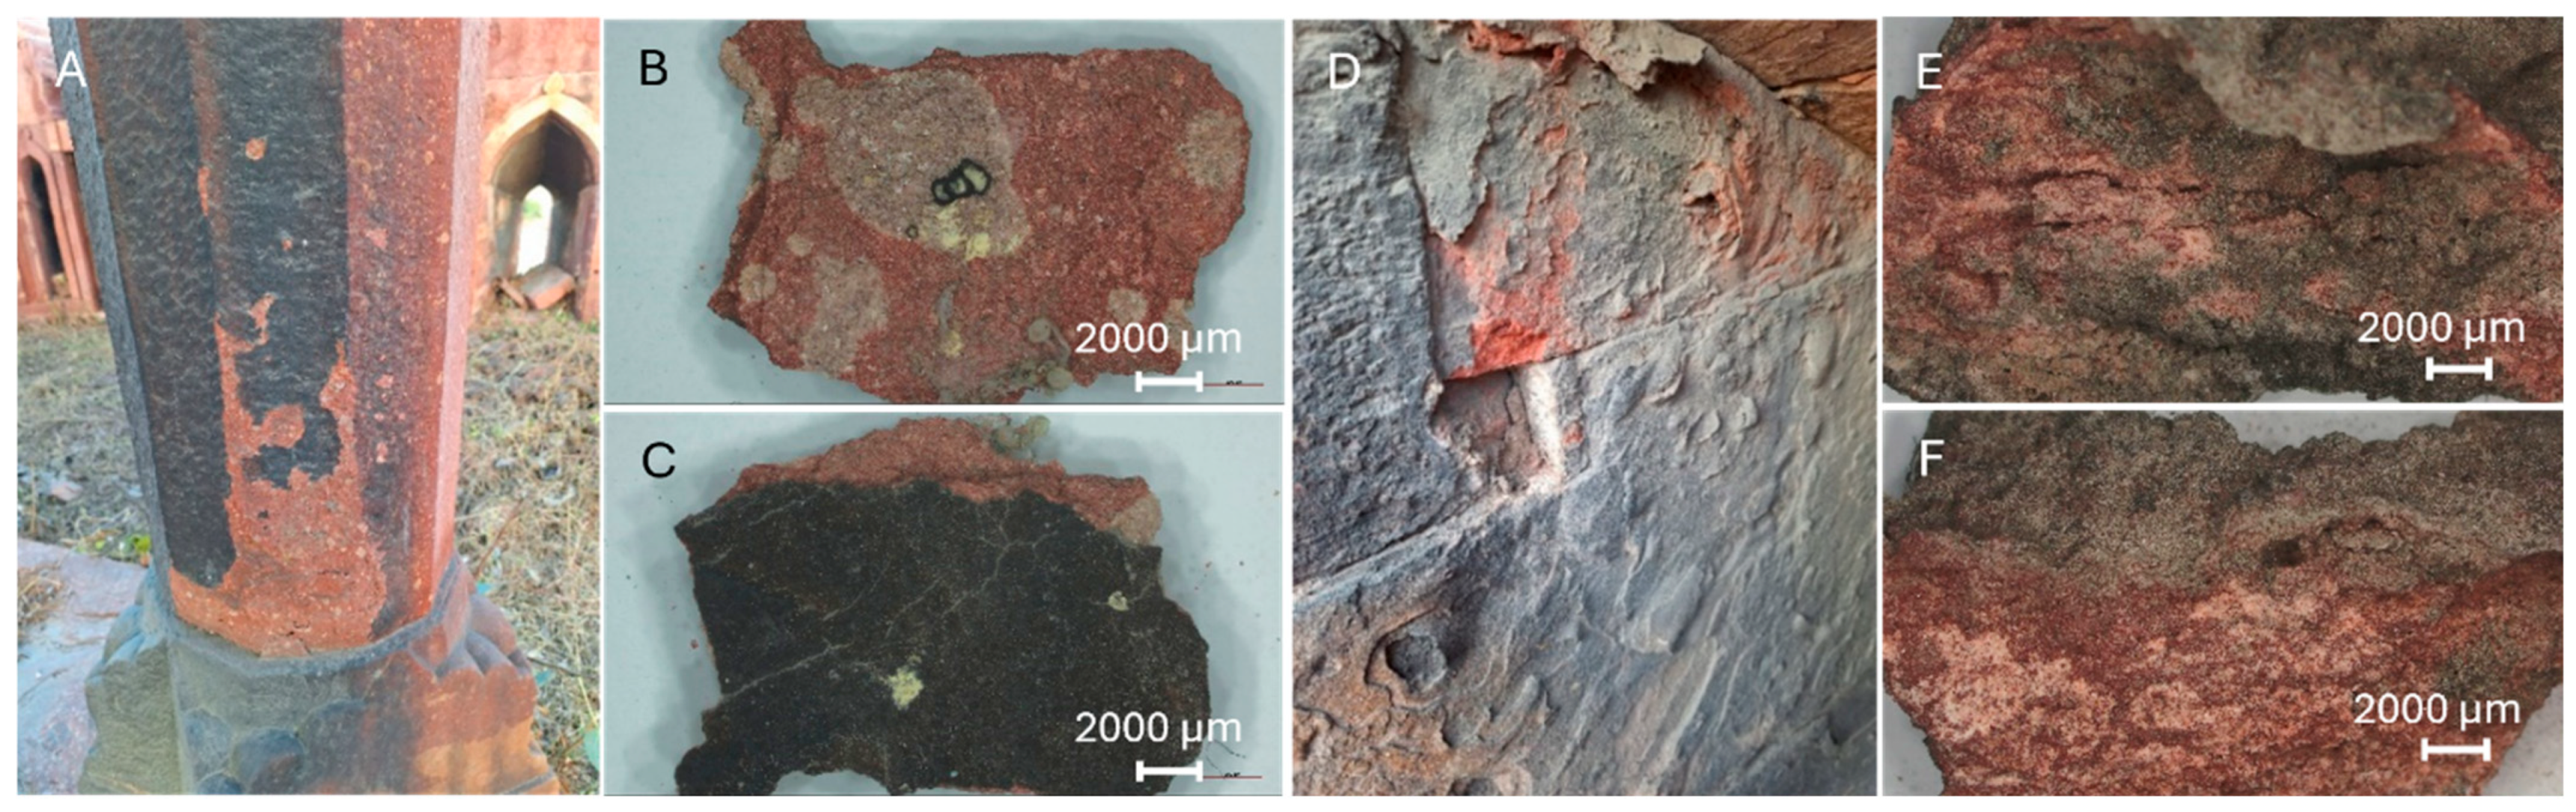
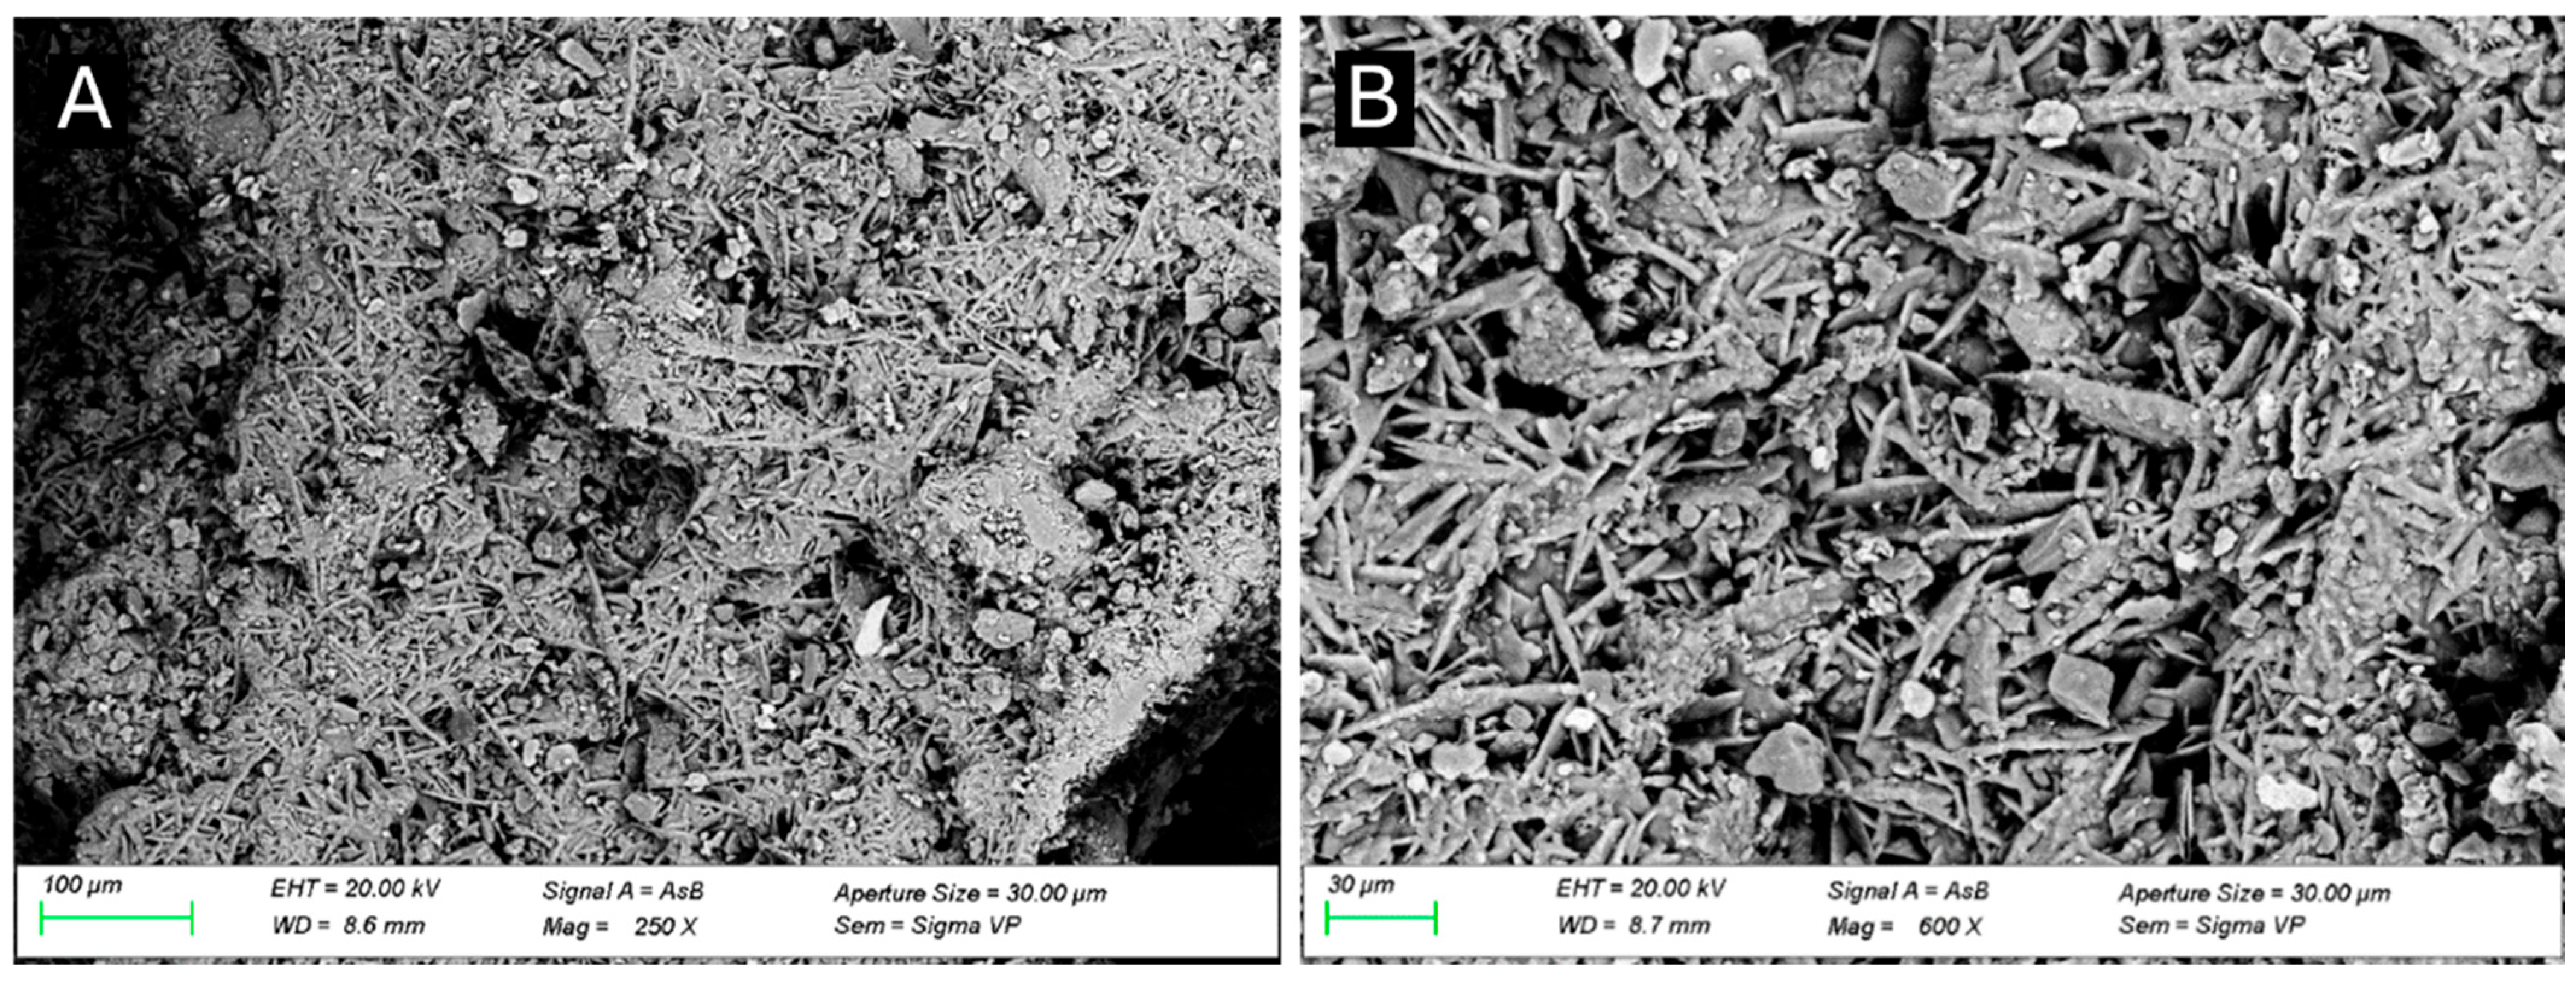
3.1. Red Fort’s Conservation State
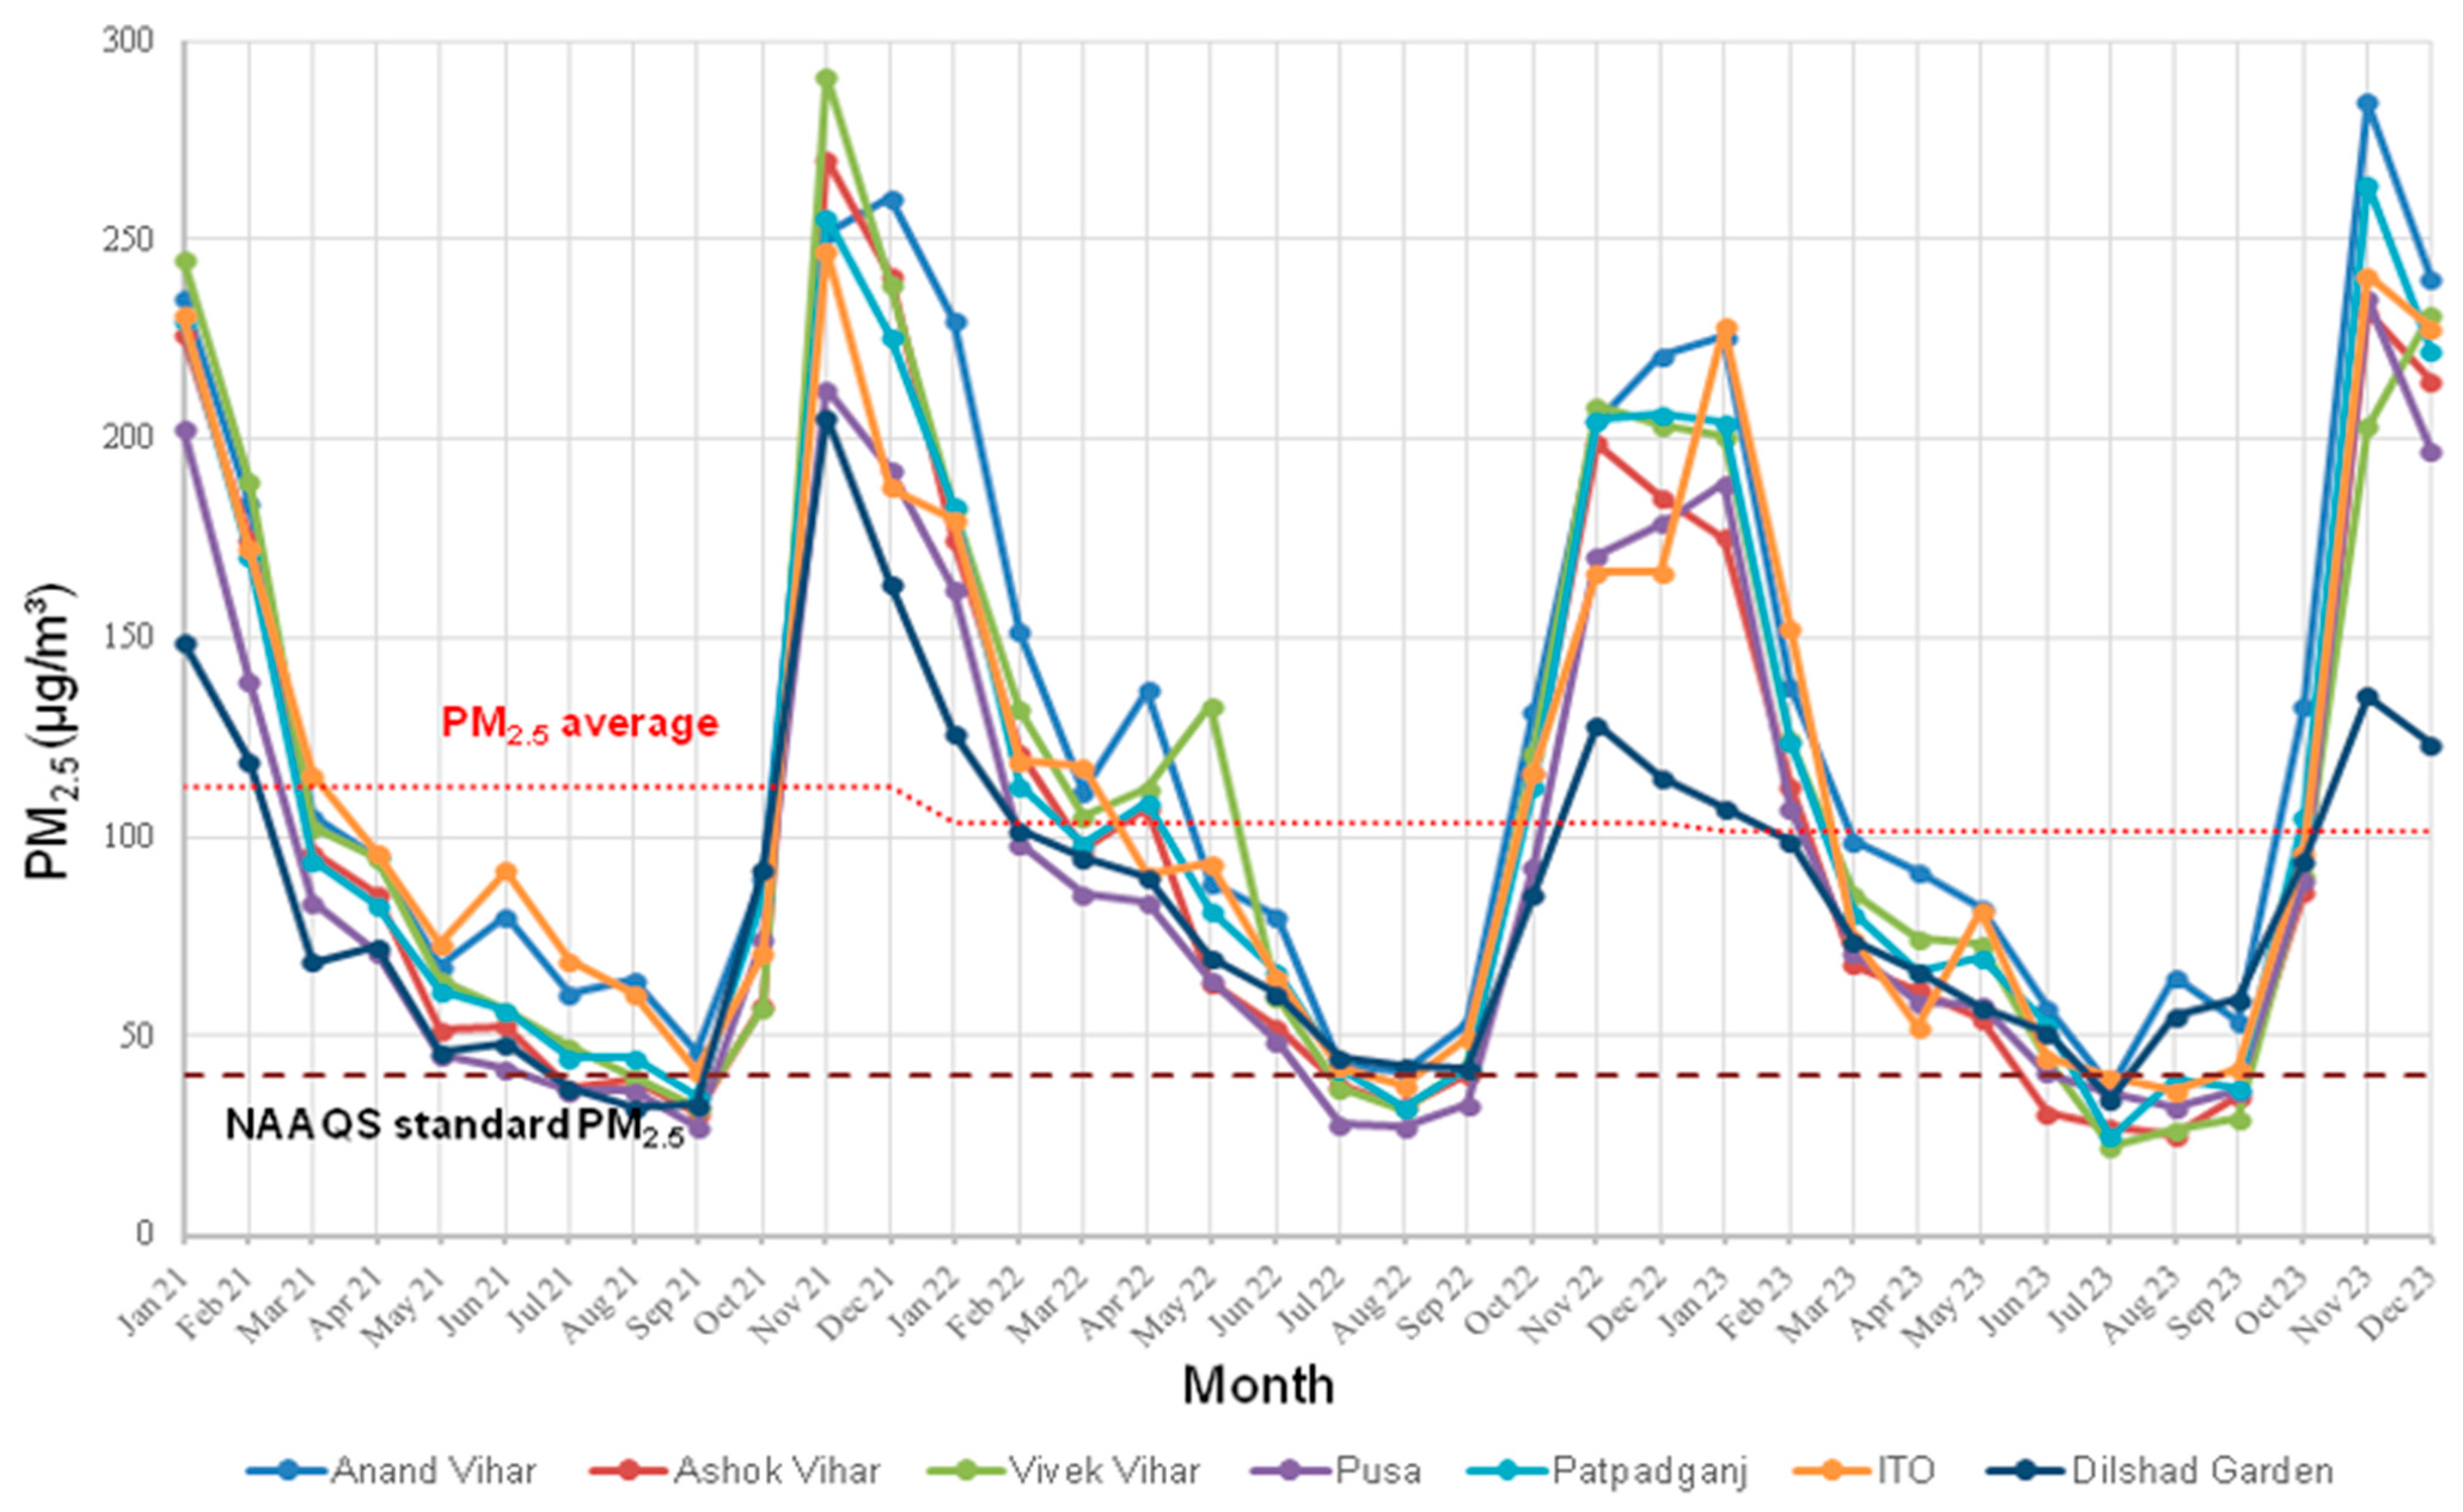
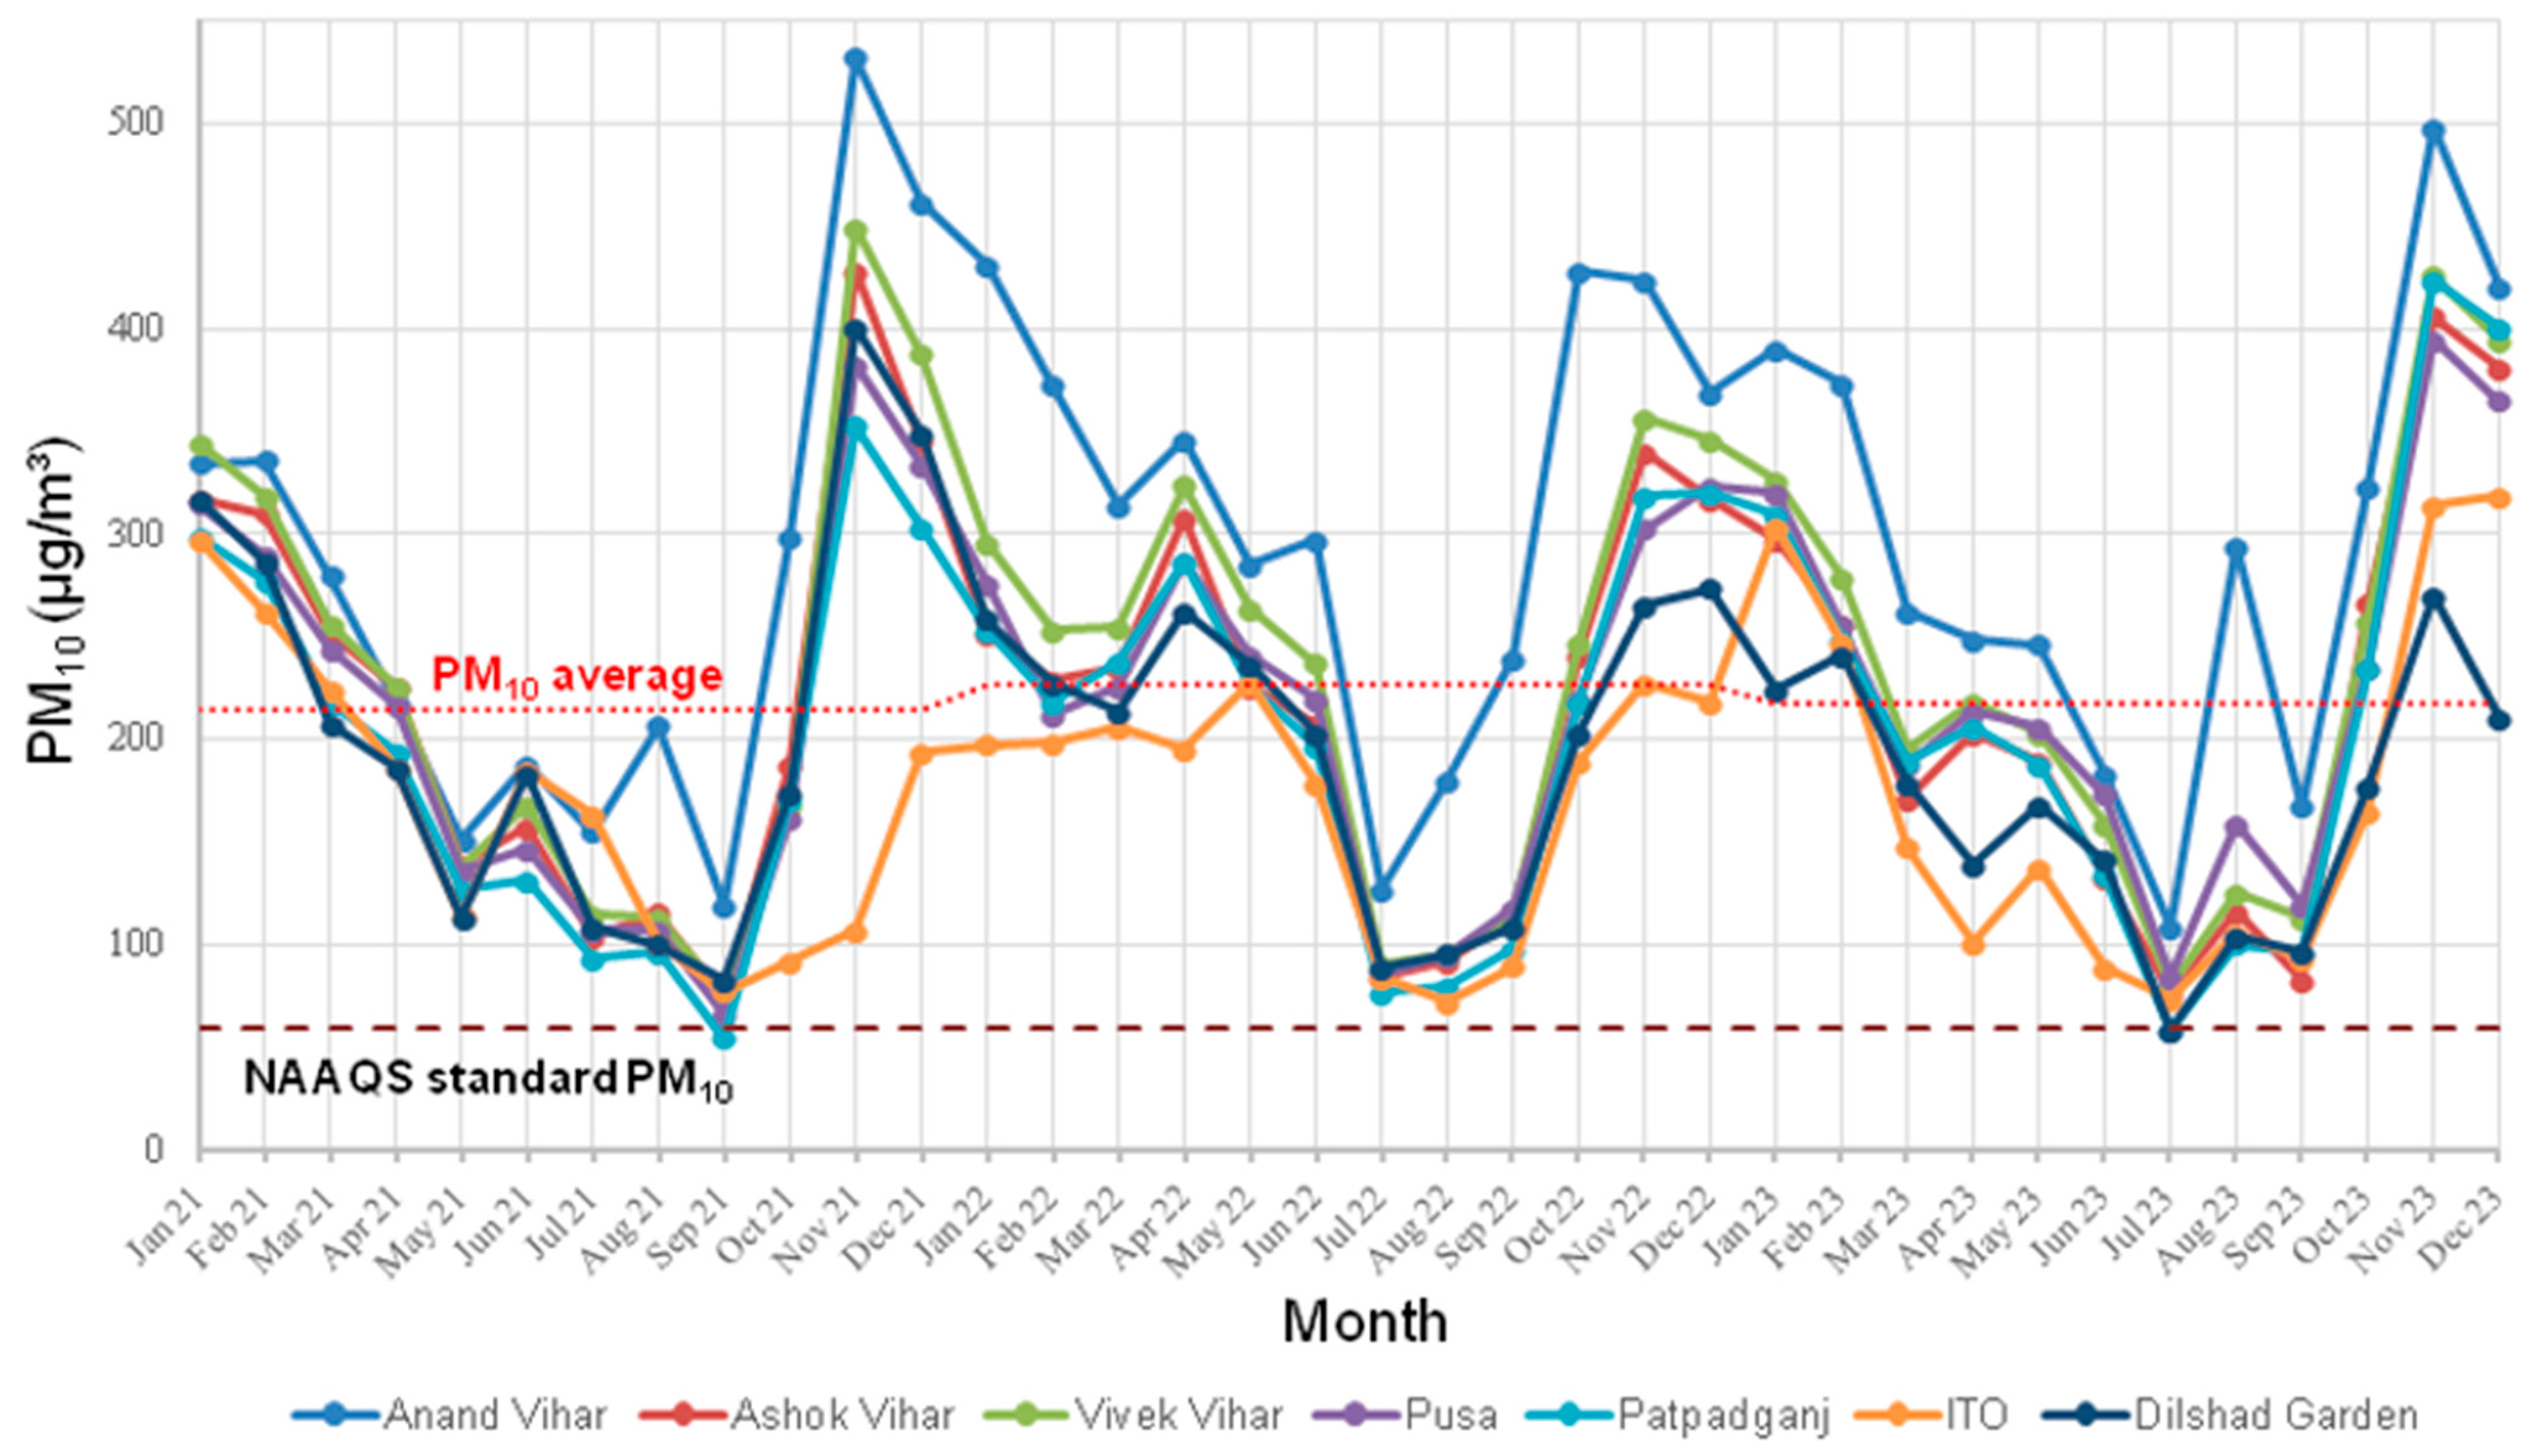
3.2. Air Quality at the Red Fort
4. Conclusions
Supplementary Materials
Author Contributions
Funding
Data Availability Statement
Acknowledgments
Conflicts of Interest
References
- Ram, M.; Gulagi, A.; Aghahosseini, A.; Bogdanov, D.; Breyer, C. Energy Transition in Megacities towards 100% Renewable Energy: A Case for Delhi. Renew. Energy 2022, 195, 578–589. [Google Scholar] [CrossRef]
- Bhandari, S.; Gani, S.; Patel, K.; Wang, D.S.; Soni, P.; Arub, Z.; Habib, G.; Apte, J.S.; Hildebrandt Ruiz, L. Sources and Atmospheric Dynamics of Organic Aerosol in New Delhi, India: Insights from Receptor Modeling. Atmos. Chem. Phys. 2020, 20, 735–752. [Google Scholar] [CrossRef]
- Gurjar, B.R.; Ravindra, K.; Nagpure, A.S. Air Pollution Trends over Indian Megacities and Their Local-to-Global Implications. Atmos. Environ. 2016, 142, 475–495. [Google Scholar] [CrossRef]
- Guttikunda, S.K.; Jawahar, P. Atmospheric Emissions and Pollution from the Coal-Fired Thermal Power Plants in India. Atmos. Environ. 2014, 92, 449–460. [Google Scholar] [CrossRef]
- Hama, S.; Kumar, P.; Alam, M.S.; Rooney, D.J.; Bloss, W.J.; Shi, Z.; Harrison, R.M.; Crilley, L.R.; Khare, M.; Gupta, S.K. Chemical Source Profiles of Fine Particles for Five Different Sources in Delhi. Chemosphere 2021, 274, 129913. [Google Scholar] [CrossRef]
- Jain, S.; Sharma, S.K.; Choudhary, N.; Masiwal, R.; Saxena, M.; Sharma, A.; Mandal, T.K.; Gupta, A.; Gupta, N.C.; Sharma, C. Chemical Characteristics and Source Apportionment of PM2.5 Using PCA/APCS, UNMIX, and PMF at an Urban Site of Delhi, India. Environ. Sci. Pollut. Res. 2017, 24, 14637–14656. [Google Scholar] [CrossRef] [PubMed]
- Rai, P.; Furger, M.; El Haddad, I.; Kumar, V.; Wang, L.; Singh, A.; Dixit, K.; Bhattu, D.; Petit, J.-E.; Ganguly, D.; et al. Real-Time Measurement and Source Apportionment of Elements in Delhi’s Atmosphere. Sci. Total Environ. 2020, 742, 140332. [Google Scholar] [CrossRef]
- Natarajan, N.; Vasudevan, M.; Dineshkumar, S.K.; Nandhini, S.S.; Balaganesh, P. Effects of Air Pollution on Monumental Buildings in India: An Overview. Environ. Sci. Pollut. Res. 2022, 29, 29399–29408. [Google Scholar] [CrossRef]
- Sharma, A.; Singh, M.R. Execution Technique and Pigment Characteristics of the Decorative Wall from Seventeenth-Century CE Chatta Chowk at Red Fort Complex, New Delhi, India. Period. Mineral. 2021, 90, 43–56. [Google Scholar] [CrossRef]
- Kaur, G.; Singh, S.; Ahuja, A.; Singh, N.D. Natural Stone and World Heritage: Delhi-Agra, India; CRC Press: Boca Raton, FL, USA, 2020; Volume 11, ISBN 9780429286391. [Google Scholar]
- UNESCO. The Red Fort Complex; UNESCO: New Delhi, India, 2007. [Google Scholar]
- Patil, S.M.; Kasthurba, A.K. Weathering of Stone Monuments: Damage Assessment of Basalt and Laterite. Mater. Today Proc. 2021, 43, 1647–1658. [Google Scholar] [CrossRef]
- Google Earth. Aerial View of the Red Fort Complex in Delhi. Google Earth Pro Version:7.3.6.10201. Available online: https://earth.google.com/web/@28.65470184,77.241131,239.25963838a,2312.76729565d,35y,5.61031677h,6.02848352t,-0r/data=CgRCAggBOgMKATBCAggASg0I____________ARAA (accessed on 10 November 2024).
- Pozo-Antonio, J.S.; Cardell, C.; Comite, V.; Fermo, P. Characterization of Black Crusts Developed on Historic Stones with Diverse Mineralogy under Different Air Quality Environments. Environ. Sci. Pollut. Res. 2022, 29, 29438–29454. [Google Scholar] [CrossRef] [PubMed]
- Comite, V.; Álvarez de Buergo, M.; Barca, D.; Belfiore, C.M.; Bonazza, A.; La Russa, M.F.; Pezzino, A.; Randazzo, L.; Ruffolo, S.A. Damage Monitoring on Carbonate Stones: Field Exposure Tests Contributing to Pollution Impact Evaluation in Two Italian Sites. Constr. Build. Mater. 2017, 152, 907–922. [Google Scholar] [CrossRef]
- Lamhasni, T.; El-Marjaoui, H.; El Bakkali, A.; Lyazidi, S.A.; Haddad, M.; Ben-Ncer, A.; Benyaich, F.; Bonazza, A.; Tahri, M. Air Pollution Impact on Architectural Heritage of Morocco: Combination of Synchronous Fluorescence and ATR-FTIR Spectroscopies for the Analyses of Black Crusts Deposits. Chemosphere 2019, 225, 517–523. [Google Scholar] [CrossRef]
- Rabl, A.; Spadaro, J.V.; Holland, M. Impacts of Air Pollution on Building Materials. In How Much Is Clean Air Worth? Cambridge University Press: Cambridge, UK, 2014; pp. 131–159. [Google Scholar] [CrossRef]
- Gibeaux, S.; Thomachot-Schneider, C.; Eyssautier-Chuine, S.; Marin, B.; Vazquez, P. Simulation of Acid Weathering on Natural and Artificial Building Stones According to the Current Atmospheric SO2/NOx Rate. Environ. Earth Sci. 2018, 77, 327. [Google Scholar] [CrossRef]
- Ruffolo, S.A.; Comite, V.; La Russa, M.F.; Belfiore, C.M.; Barca, D.; Bonazza, A.; Crisci, G.M.; Pezzino, A.; Sabbioni, C. An Analysis of the Black Crusts from the Seville Cathedral: A Challenge to Deepen the Understanding of the Relationships among Microstructure, Microchemical Features and Pollution Sources. Sci. Total Environ. 2015, 502, 157–166. [Google Scholar] [CrossRef]
- Jangirh, R.; Ahlawat, S.; Arya, R.; Mondal, A.; Yadav, L.; Kotnala, G.; Yadav, P.; Choudhary, N.; Rani, M.; Banoo, R.; et al. Gridded Distribution of Total Suspended Particulate Matter (TSP) and Their Chemical Characterization over Delhi during Winter. Environ. Sci. Pollut. Res. 2022, 29, 17892–17918. [Google Scholar] [CrossRef] [PubMed]
- Spezzano, P. Mapping the Susceptibility of UNESCO World Cultural Heritage Sites in Europe to Ambient (Outdoor) Air Pollution. Sci. Total Environ. 2021, 754, 142345. [Google Scholar] [CrossRef]
- La Russa, M.F.; Comite, V.; Aly, N.; Barca, D.; Fermo, P.; Rovella, N.; Antonelli, F.; Tesser, E.; Aquino, M.; Ruffolo, S.A. Black Crusts on Venetian Built Heritage, Investigation on the Impact of Pollution Sources on Their Composition. Eur. Phys. J. Plus 2018, 133, 370. [Google Scholar] [CrossRef]
- La Russa, M.F.; Fermo, P.; Comite, V.; Belfiore, C.M.; Barca, D.; Cerioni, A.; De Santis, M.; Barbagallo, L.F.; Ricca, M.; Ruffolo, S.A. The Oceanus Statue of the Fontana Di Trevi (Rome): The Analysis of Black Crust as a Tool to Investigate the Urban Air Pollution and Its Impact on the Stone Degradation. Sci. Total Environ. 2017, 593–594, 297–309. [Google Scholar] [CrossRef]
- Ruffolo, S.A.; La Russa, M.F.; Rovella, N.; Ricca, M. The Impact of Air Pollution on Stone Materials. Environments 2023, 10, 119. [Google Scholar] [CrossRef]
- Hseu, Z.Y. Evaluating Heavy Metal Contents in Nine Composts Using Four Digestion Methods. Bioresour. Technol. 2004, 95, 53–59. [Google Scholar] [CrossRef]
- Jones, J.B. Chapter 15 Sampling, Handling, and Analyzing Plant Tissue Samples. In Soil Testing and Plant Analysis; Soil Science Society of America: Madison, WI, USA, 1990. [Google Scholar]
- Bulska, E.; Wagner, B. Quantitative Aspects of Inductively Coupled Plasma Mass Spectrometry. Philos. Trans. R. Soc. A Math. Phys. Eng. Sci. 2016, 374, 20150369. [Google Scholar] [CrossRef] [PubMed]
- Garg, S.; Kaur, P.; Pandit, M.; Fareeduddin; Kaur, G.; Kamboj, A.; Thakur, S.N. Makrana Marble: A Popular Heritage Stone Resource from NW India. Geoheritage 2019, 11, 909–925. [Google Scholar] [CrossRef]
- Guttikunda, S.K.; Goel, R. Health Impacts of Particulate Pollution in a Megacity—Delhi, India. Environ. Dev. 2013, 6, 8–20. [Google Scholar] [CrossRef]
- CPCB Air Quality Monitoring Station’s Data, Delhi, India. Available online: https://airquality.cpcb.gov.in/ccr/#/caaqm-dashboard-all/caaqm-landing/caaqm-data-repository (accessed on 9 January 2025).
- Pandey, A.K.; Kumar, V. Impact of Environmental Pollution on Historical Monuments of India: Conservation Problems and Remedial Measures. J. Appl. Geochem. 2015, 17, 50–55. [Google Scholar]
- Rovella, N.; Aly, N.; Comite, V.; Randazzo, L.; Fermo, P.; Barca, D.; Alvarez de Buergo, M.; La Russa, M.F. The Environmental Impact of Air Pollution on the Built Heritage of Historic Cairo (Egypt). Sci. Total Environ. 2021, 764, 142905. [Google Scholar] [CrossRef]
- Yadav, A.; Behera, S.N.; Nagar, P.K.; Sharma, M. Spatio-Seasonal Concentrations, Source Apportionment and Assessment of Associated Human Health Risks of Pm2.5-Bound Polycyclic Aromatic Hydrocarbons in Delhi, India. Aerosol Air Qual. Res. 2020, 20, 2805–2825. [Google Scholar] [CrossRef]
- Nagar, P.K.; Sharma, M.; Das, D. A New Method for Trend Analyses in PM10 and Impact of Crop Residue Burning in Delhi, Kanpur and Jaipur, India. Urban. Clim. 2019, 27, 193–203. [Google Scholar] [CrossRef]
- Kaur, G.; Singh, S.; Kaur, P.; Garg, S.; Fareeduddin; Pandit, M.K.; Agrawal, P.; Acharya, K.; Ahuja, A. Vindhyan Sandstone: A Crowning Glory of Architectonic Heritage from India. Geoheritage 2019, 11, 1771–1783. [Google Scholar] [CrossRef]
- Astuti, T.R.P.; Aditiyo, R.; Oktavioni, A.; Supriyanto, S. SEM-EDX Study on Authigenic Clay Minerals in Sandstone of Jatiluhur Formation. IOP Conf. Ser. Earth Environ. Sci. 2020, 538, 012041. [Google Scholar] [CrossRef]
- Davarcioglu, B.; Ciftci, E. The Clay Minerals Observed in the Building Stones of Aksaray-Guzelyurt Area (Central Anatolia-Turkey) and Their Effects. Int. J. Phys. Sci. 2010, 5, 1734–1743. [Google Scholar]
- Nuevo, M.; Sandford, S.A.; Flynn, G.J.; Wirick, S. Mid-infrared Study of Stones from the Sutter’s Mill Meteorite. Meteorit. Planet. Sci. 2014, 49, 2017–2026. [Google Scholar] [CrossRef]
- Volpi, F.; Vagnini, M.; Vivani, R.; Malagodi, M.; Fiocco, G. Non-Invasive Identification of Red and Yellow Oxide and Sulfide Pigments in Wall-Paintings with Portable ER-FTIR Spectroscopy. J. Cult. Herit. 2023, 63, 158–168. [Google Scholar] [CrossRef]
- Friolo, K.H.; Stuart, B.; Ray, A. Characterisation of Weathering of Sydney Sandstones in Heritage Buildings. J. Cult. Herit. 2003, 4, 211–220. [Google Scholar] [CrossRef]
- El Omari, M.; El Amraoui, M.; Fikri, I.; Bejjit, L.; Haddad, M.; Ait Lyazdi, S.; El Amrani, A. Structural Characterization of Stone Flooring “Calçada Marble”, in Lisbon, Portugal. Mater. Res. Proc. 2024, 40, 294–302. [Google Scholar]
- Stewart, G.J.; Nelson, B.S.; Drysdale, W.S.; Acton, W.J.F.; Vaughan, A.R.; Hopkins, J.R.; Dunmore, R.E.; Hewitt, C.N.; Nemitz, E.; Mullinger, N.; et al. Sources of Non-Methane Hydrocarbons in Surface Air in Delhi, India. Faraday Discuss. 2021, 226, 409–431. [Google Scholar] [CrossRef]
- Derrick, M.R.; Stulik, D.; Landry, J.M. Infrared Spectroscopy in Conservation Science. In Handbook of Near-Infrared Analysis, 4th ed.; CRC Press: Boca Raton, FL, USA; Taylor and Francis: Abingdon, UK, 2021; pp. 45–67. ISBN 9798891132245. [Google Scholar]
- Invernizzi, C.; Rovetta, T.; Licchelli, M.; Malagodi, M. Mid and Near-Infrared Reflection Spectral Database of Natural Organic Materials in the Cultural Heritage Field. Int. J. Anal. Chem. 2018, 2018, 7823248. [Google Scholar] [CrossRef] [PubMed]
- Ambade, B.; Sankar, T.K.; Kumar, A.; Sethi, S.S. Characterization of PAHs and N-Alkanes in Atmospheric Aerosol of Jamshedpur City, India. J. Hazard. Toxic. Radioact. Waste 2020, 24, 04020003. [Google Scholar] [CrossRef]
- Salvadori, B.; Errico, V.; Mauro, M.; Melnik, E.; Dei, L. Evaluation of Gypsum and Calcium Oxalates in Deteriorated Mural Paintings by Quantitative FTIR Spectroscopy. Spectrosc. Lett. 2003, 36, 501–513. [Google Scholar] [CrossRef]
- Anbalagan, G.; Mukundakumari, S.; Murugesan, K.S.; Gunasekaran, S. Infrared, Optical Absorption, and EPR Spectroscopic Studies on Natural Gypsum. Vib. Spectrosc. 2009, 50, 226–230. [Google Scholar] [CrossRef]
- UNESCO World Heritage Centre. UNESCO World Heritage Centre—Document—Advisory Body Evaluation (ICOMOS). Available online: https://whc.unesco.org/en/documents/153016/ (accessed on 21 August 2024).
- Liu, J.-H.; Zhang, Y.-H.; Wang, L.-Y.; Wei, Z.-F. Drawing out the Structural Information of the First Layer of Hydrated Ions: ATR-FTIR Spectroscopic Studies on Aqueous NH4NO3, NaNO3, and Mg(NO3)2 Solutions. Spectrochim. Acta A Mol. Biomol. Spectrosc. 2005, 61, 893–899. [Google Scholar] [CrossRef] [PubMed]
- Pérez-Alonso, M.; Castro, K.; Álvarez, M.; Madariaga, J.M. Scientific Analysis versus Restorer’s Expertise for Diagnosis Prior to a Restoration Process: The Case of Santa Maria Church (Hermo, Asturias, North of Spain). Anal. Chim. Acta 2004, 524, 379–389. [Google Scholar] [CrossRef]
- Sotiropoulou, S.; Sciutto, G.; Tenorio, A.L.; Mazurek, J.; Bonaduce, I.; Prati, S.; Mazzeo, R.; Schilling, M.; Colombini, M.P. Advanced Analytical Investigation on Degradation Markers in Wall Paintings. Microchem. J. 2018, 139, 278–294. [Google Scholar] [CrossRef]
- Fatima, S.; Mishra, S.K.; Ahlawat, A.; Dimri, A.P. Physico-Chemical Properties and Deposition Potential of PM2.5 during Severe Smog Event in Delhi, India. Int. J. Environ. Res. Public Health 2022, 19, 15387. [Google Scholar] [CrossRef]
- Gurjar, B.R.; Butler, T.M.; Lawrence, M.G.; Lelieveld, J. Evaluation of Emissions and Air Quality in Megacities. Atmos. Environ. 2008, 42, 1593–1606. [Google Scholar] [CrossRef]
- Barca, D.; Belfiore, C.M.; Crisci, G.M.; La Russa, M.F.; Pezzino, A.; Ruffolo, S.A. A New Methodological Approach for the Chemical Characterization of Black Crusts on Building Stones: A Case Study from the Catania City Centre (Sicily, Italy). J. Anal. At. Spectrom. 2011, 26, 1000–1011. [Google Scholar] [CrossRef]
- El Khalloufi, M.; Drevelle, O.; Soucy, G. Titanium: An Overview of Resources and Production Methods. Minerals 2021, 11, 1425. [Google Scholar] [CrossRef]
- Bertolo, R.; Bourotte, C.; Hirata, R.; Marcolan, L.; Sracek, O. Geochemistry of Natural Chromium Occurrence in a Sandstone Aquifer in Bauru Basin, São Paulo State, Brazil. Appl. Geochem. 2011, 26, 1353–1363. [Google Scholar] [CrossRef]
- Pękala, A.; Koszelnik, P.; Musiał, M.; Galek, T. Trace Elements Anomalous Concentrations in Building Materials—The Impact of Secondary Mineralisation Processes. Materials 2024, 17, 3909. [Google Scholar] [CrossRef]
- Zhu, C.; Liao, S.; Wang, W.; Zhang, Y.; Yang, T.; Fan, H.; Wen, H. Variations in Zn and S Isotope Chemistry of Sedimentary Sphalerite, Wusihe Zn-Pb Deposit, Sichuan Province, China. Ore Geol. Rev. 2018, 95, 639–648. [Google Scholar] [CrossRef]
- Environmental Health Criteria 24. Titanium: Published under the joint sponsorship of UNEP, ILO and WHO. World Health Organization, Geneva, 1982. pp. 68. Sw.fr. 11.00 (available in the UK through HMSO). Food Chem. Toxicol. 1984, 22, 76. [CrossRef]
- La Maestra, S.; D’agostini, F.; Sanguineti, E.; González, A.Y.; Annis, S.; Militello, G.M.; Parisi, G.; Scuderi, A.; Gaggero, L. Dispersion of Natural Airborne TiO2 Fibres in Excavation Activity as a Potential Environmental and Human Health Risk. Int. J. Environ. Res. Public Health 2021, 18, 6587. [Google Scholar] [CrossRef] [PubMed]


| Sample ID | Sampling Point | Description |
|---|---|---|
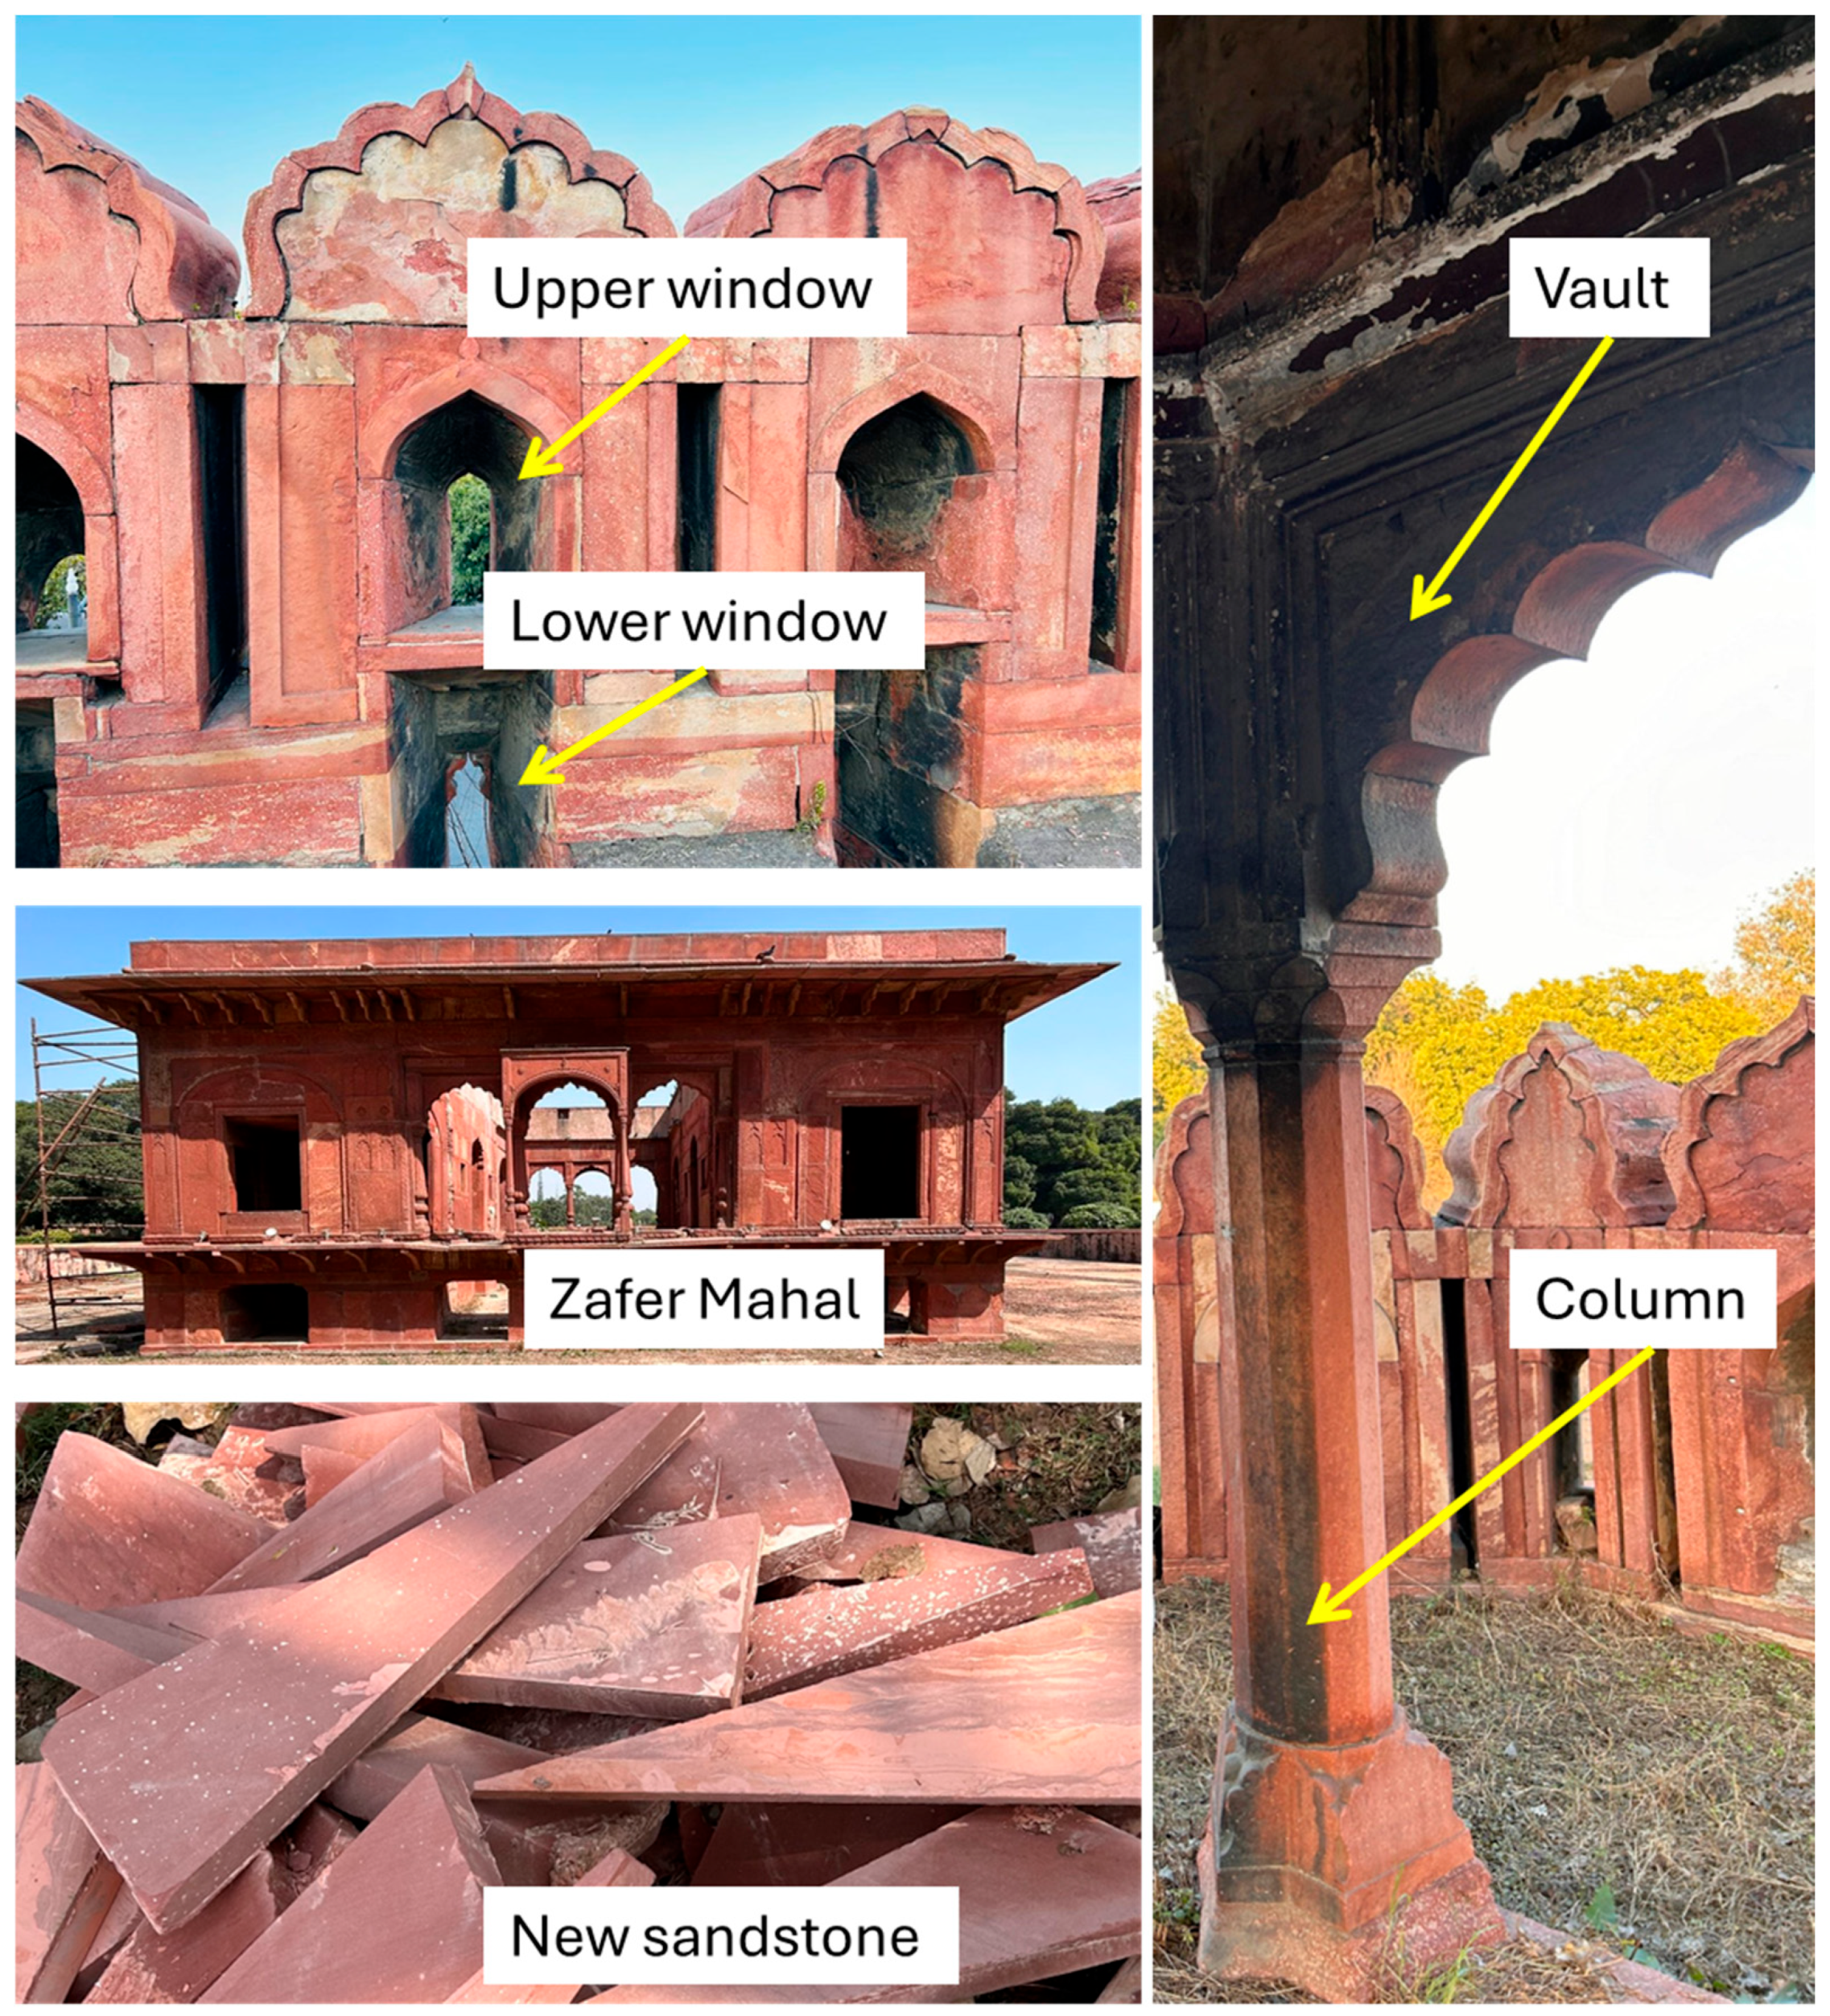
| 1RS | Upper window of the fortification wall | Red sandstone, no black crust |
| 2BC | Upper window of the fortification wall | Red sandstone with black crust |
| 3BC | Upper window of the fortification wall | Red sandstone with black crust |
| 4BC | Upper window of the fortification wall | Red sandstone with black crust |
| 5BC | Lower window of the fortification wall | Red sandstone with thin black crust |
| 6BC | Lower window of the fortification wall | Red sandstone with black crust |
| 7RS | Vault of the kiosk | Red sandstone; no black crust |
| 8BC | Column of the kiosk | Red sandstone thin black crust |
| 9RS | Zafar Mahal | Red sandstone; no black crust |
| 10RS | “New” stone used in restoration works | Red sandstone; no black crust |
| Location→ | Red Fort | NAAQS Standards | |||||
|---|---|---|---|---|---|---|---|
| Year→ | 2021 | 2022 | 2023 | ||||
| Pollutants (µg/m3) ↓ | Average | σ | Average | σ | Average | σ | |
| PM2.5 | 112 | 91 | 103 | 71 | 102 | 80 | 40 |
| PM10 | 214 | 126 | 226 | 111 | 218 | 121 | 60 |
| NO2 | 44 | 25 | 50 | 29 | 45 | 24 | 40 |
| NH3 | 46 | 26 | 52 | 28 | 46 | 24 | 100 |
| SO2 | 14 | 9 | 13 | 8 | 10 | 6 | 50 |
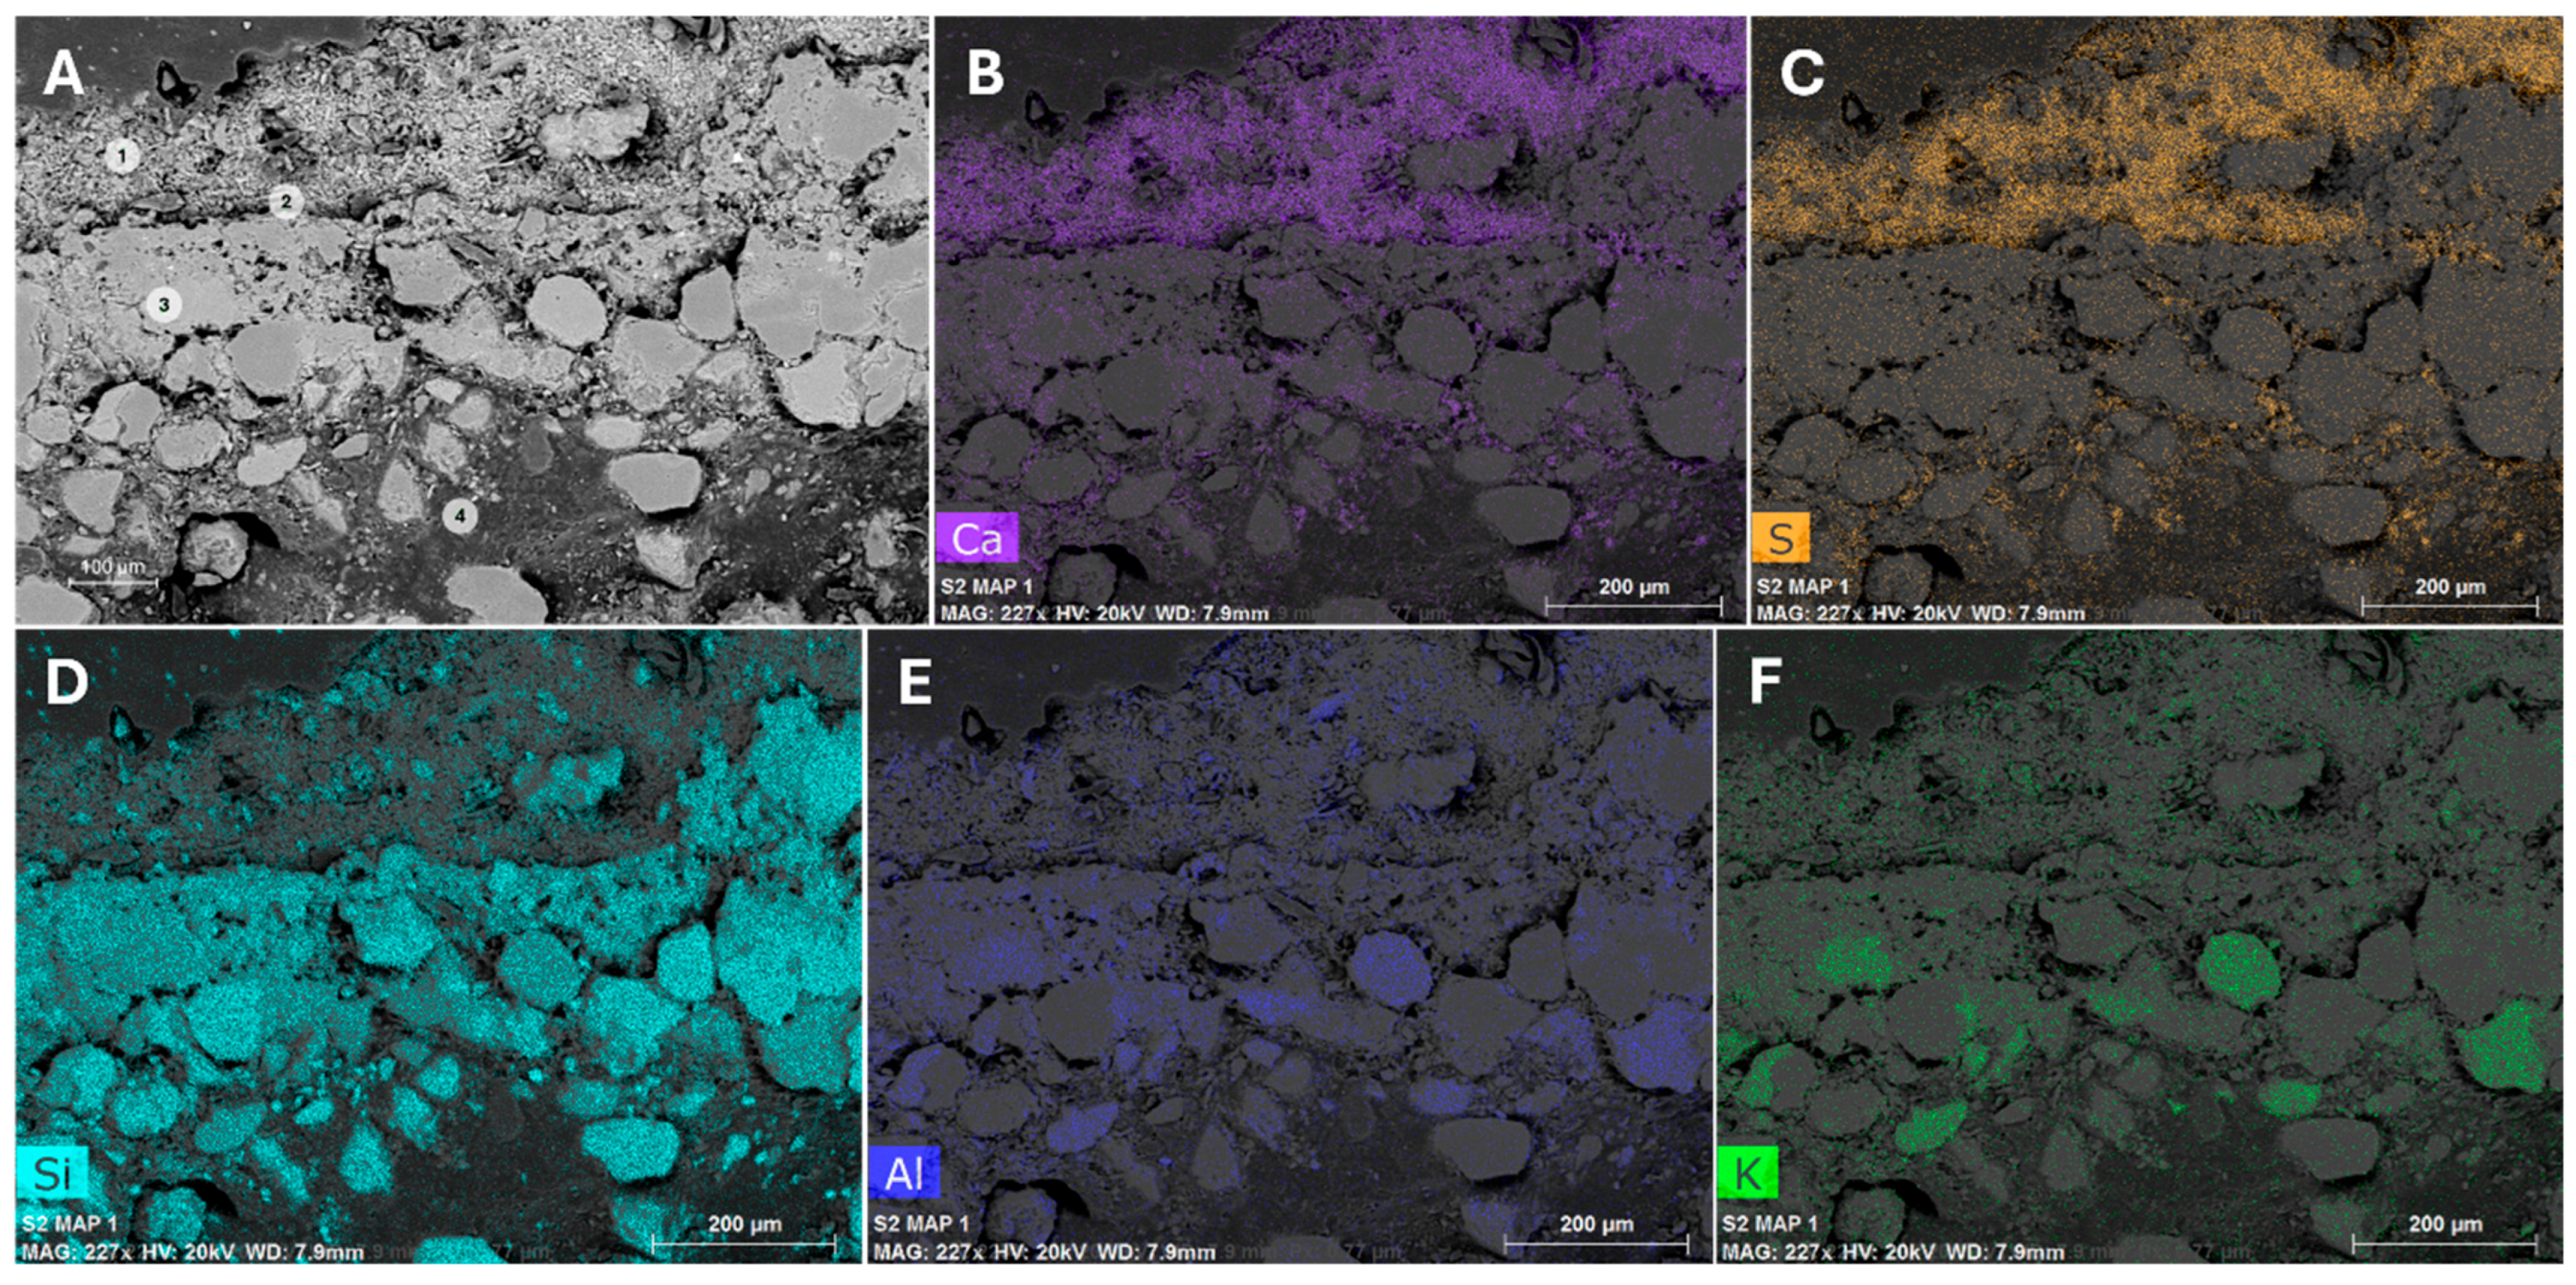
| Point | Elements | Comment |
|---|---|---|
| 1 | Si, O, Ca, S, Al, Mg, K, Fe | crust |
| 2 | Si, O, Al, Mg, K, Ca, Fe | interface crust/stone |
| 3 | Si, O | stone |
| 4 | Si, Ca, O, Al | cement |
| Trace Elements (mg/kg) | |||||||||
|---|---|---|---|---|---|---|---|---|---|
| Sample | Ti | V | Cr | Mn | Ni | Cu | Zn | Ba | Pb |
| 1RS | 34.21 | 1.03 | 15.46 | 16.43 | 1.80 | 1.30 | 21.66 | 3.40 | 0.36 |
| 2BC | 865.18 | 46.6 | 57.56 | 154.24 | 17.26 | 52.70 | 187.70 | 81.78 | 41.98 |
Disclaimer/Publisher’s Note: The statements, opinions and data contained in all publications are solely those of the individual author(s) and contributor(s) and not of MDPI and/or the editor(s). MDPI and/or the editor(s) disclaim responsibility for any injury to people or property resulting from any ideas, methods, instructions or products referred to in the content. |
© 2025 by the authors. Licensee MDPI, Basel, Switzerland. This article is an open access article distributed under the terms and conditions of the Creative Commons Attribution (CC BY) license (https://creativecommons.org/licenses/by/4.0/).
Share and Cite
Kumar, G.; Rusin, L.; Nagar, P.K.; Manjul, S.K.; Back, M.; Benedetti, A.; Gurjar, B.R.; Ojha, C.S.P.; Sharma, M.; Balliana, E. Characterization of Red Sandstone and Black Crust to Analyze Air Pollution Impacts on a Cultural Heritage Building: Red Fort, Delhi, India. Heritage 2025, 8, 236. https://doi.org/10.3390/heritage8060236
Kumar G, Rusin L, Nagar PK, Manjul SK, Back M, Benedetti A, Gurjar BR, Ojha CSP, Sharma M, Balliana E. Characterization of Red Sandstone and Black Crust to Analyze Air Pollution Impacts on a Cultural Heritage Building: Red Fort, Delhi, India. Heritage. 2025; 8(6):236. https://doi.org/10.3390/heritage8060236
Chicago/Turabian StyleKumar, Gaurav, Lucia Rusin, Pavan Kumar Nagar, Sanjay Kumar Manjul, Michele Back, Alvise Benedetti, Bhola Ram Gurjar, Chandra Shekhar Prasad Ojha, Mukesh Sharma, and Eleonora Balliana. 2025. "Characterization of Red Sandstone and Black Crust to Analyze Air Pollution Impacts on a Cultural Heritage Building: Red Fort, Delhi, India" Heritage 8, no. 6: 236. https://doi.org/10.3390/heritage8060236
APA StyleKumar, G., Rusin, L., Nagar, P. K., Manjul, S. K., Back, M., Benedetti, A., Gurjar, B. R., Ojha, C. S. P., Sharma, M., & Balliana, E. (2025). Characterization of Red Sandstone and Black Crust to Analyze Air Pollution Impacts on a Cultural Heritage Building: Red Fort, Delhi, India. Heritage, 8(6), 236. https://doi.org/10.3390/heritage8060236