


A Proactive GIS Geo-Database for Castles Damaged by the 2012 Emilia Earthquake


Abstract
1. Introduction
2. Castles of the Emilia Area
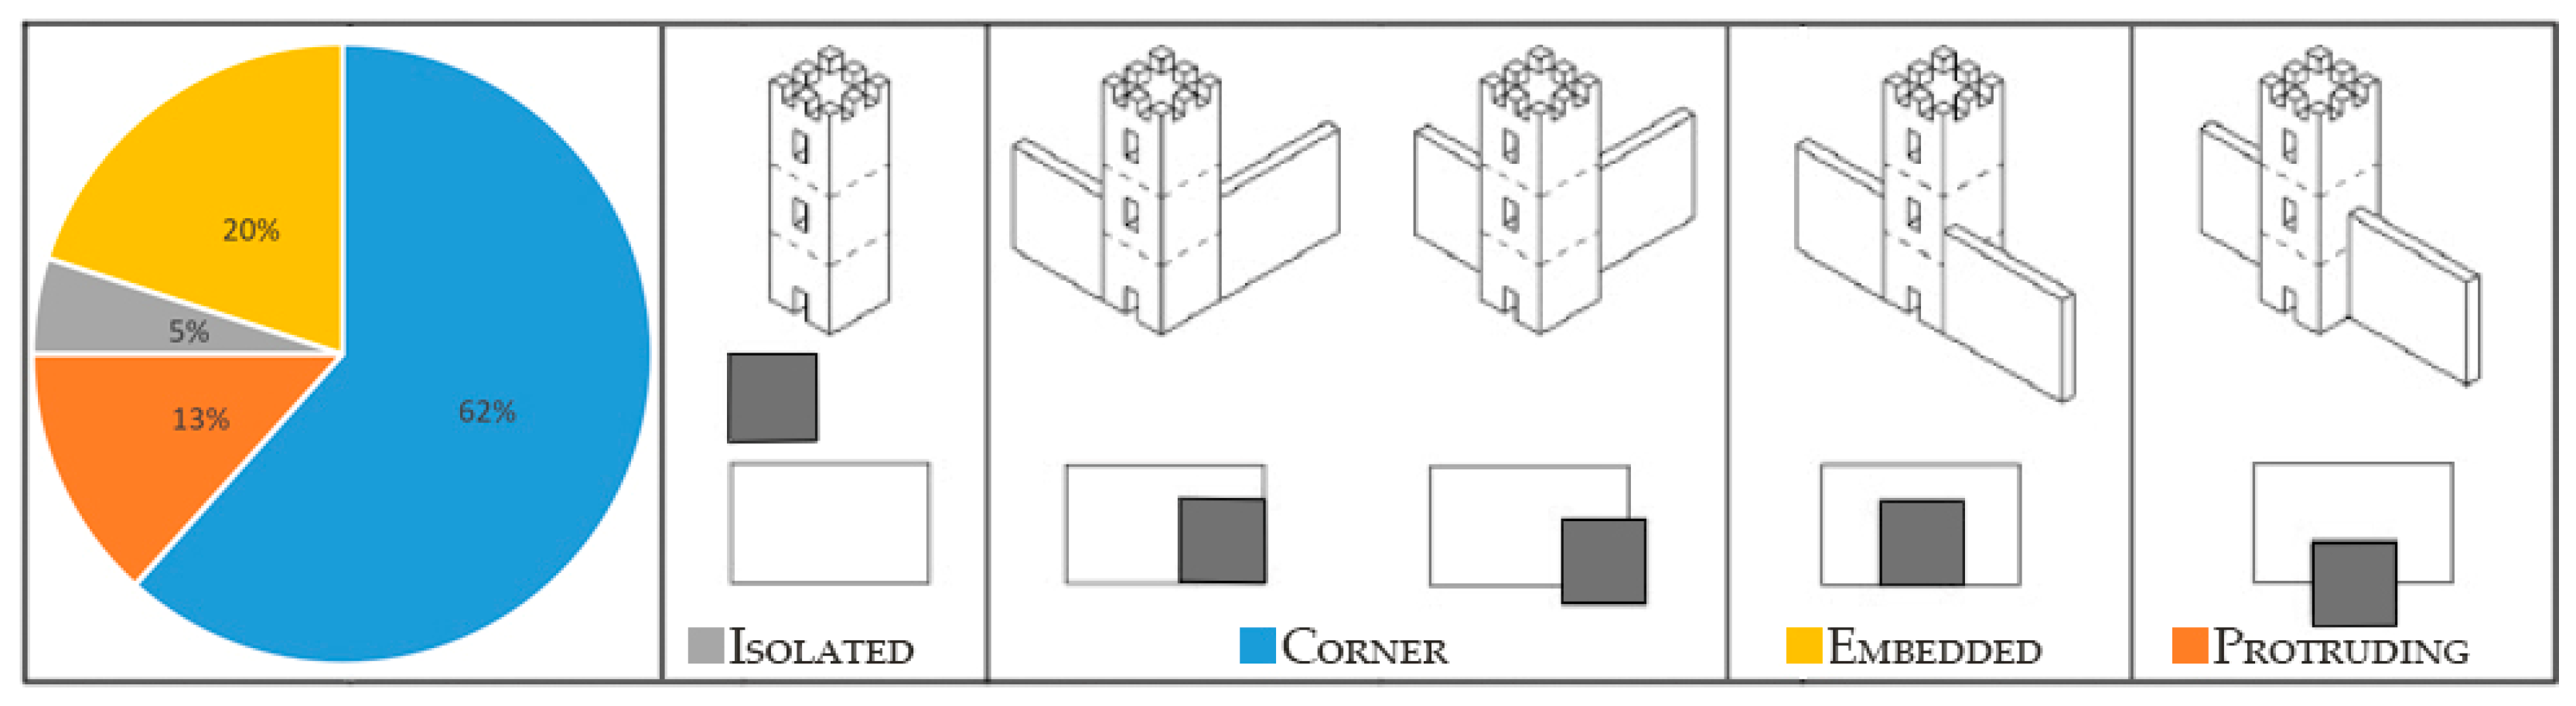
2.1. Definition of a Typology: From Constructive and Morphological Features to Vulnerabilities
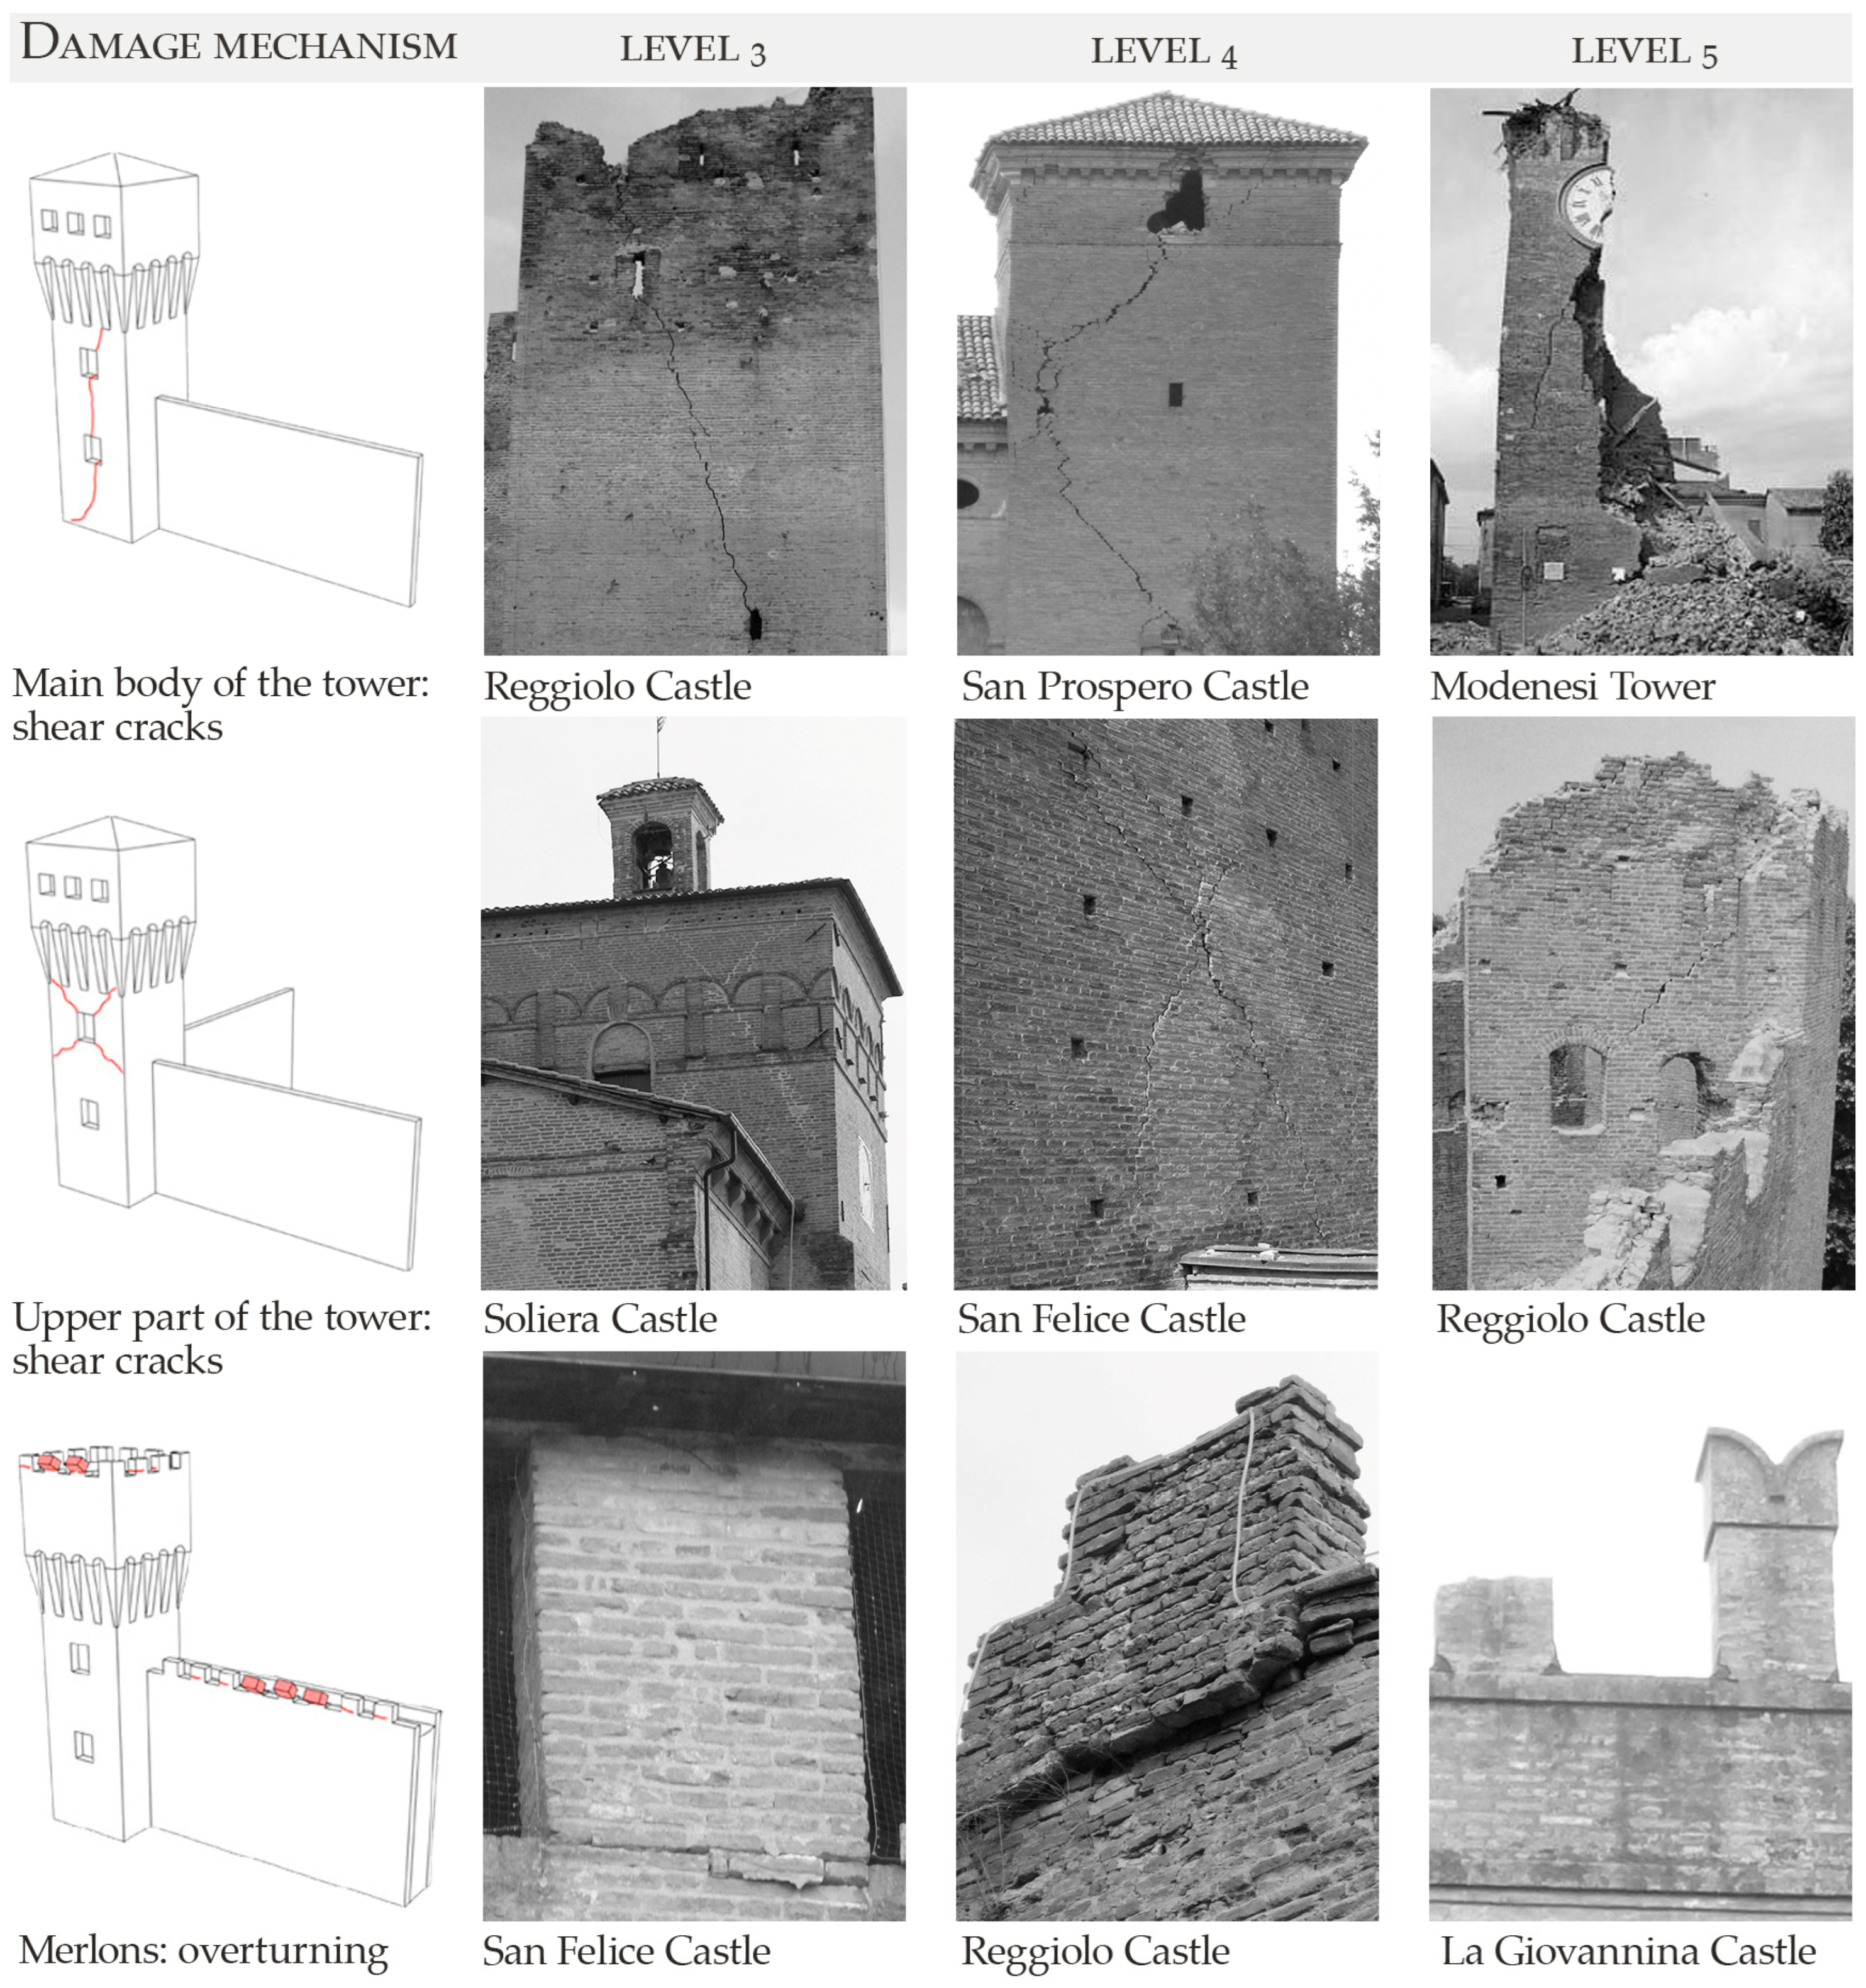
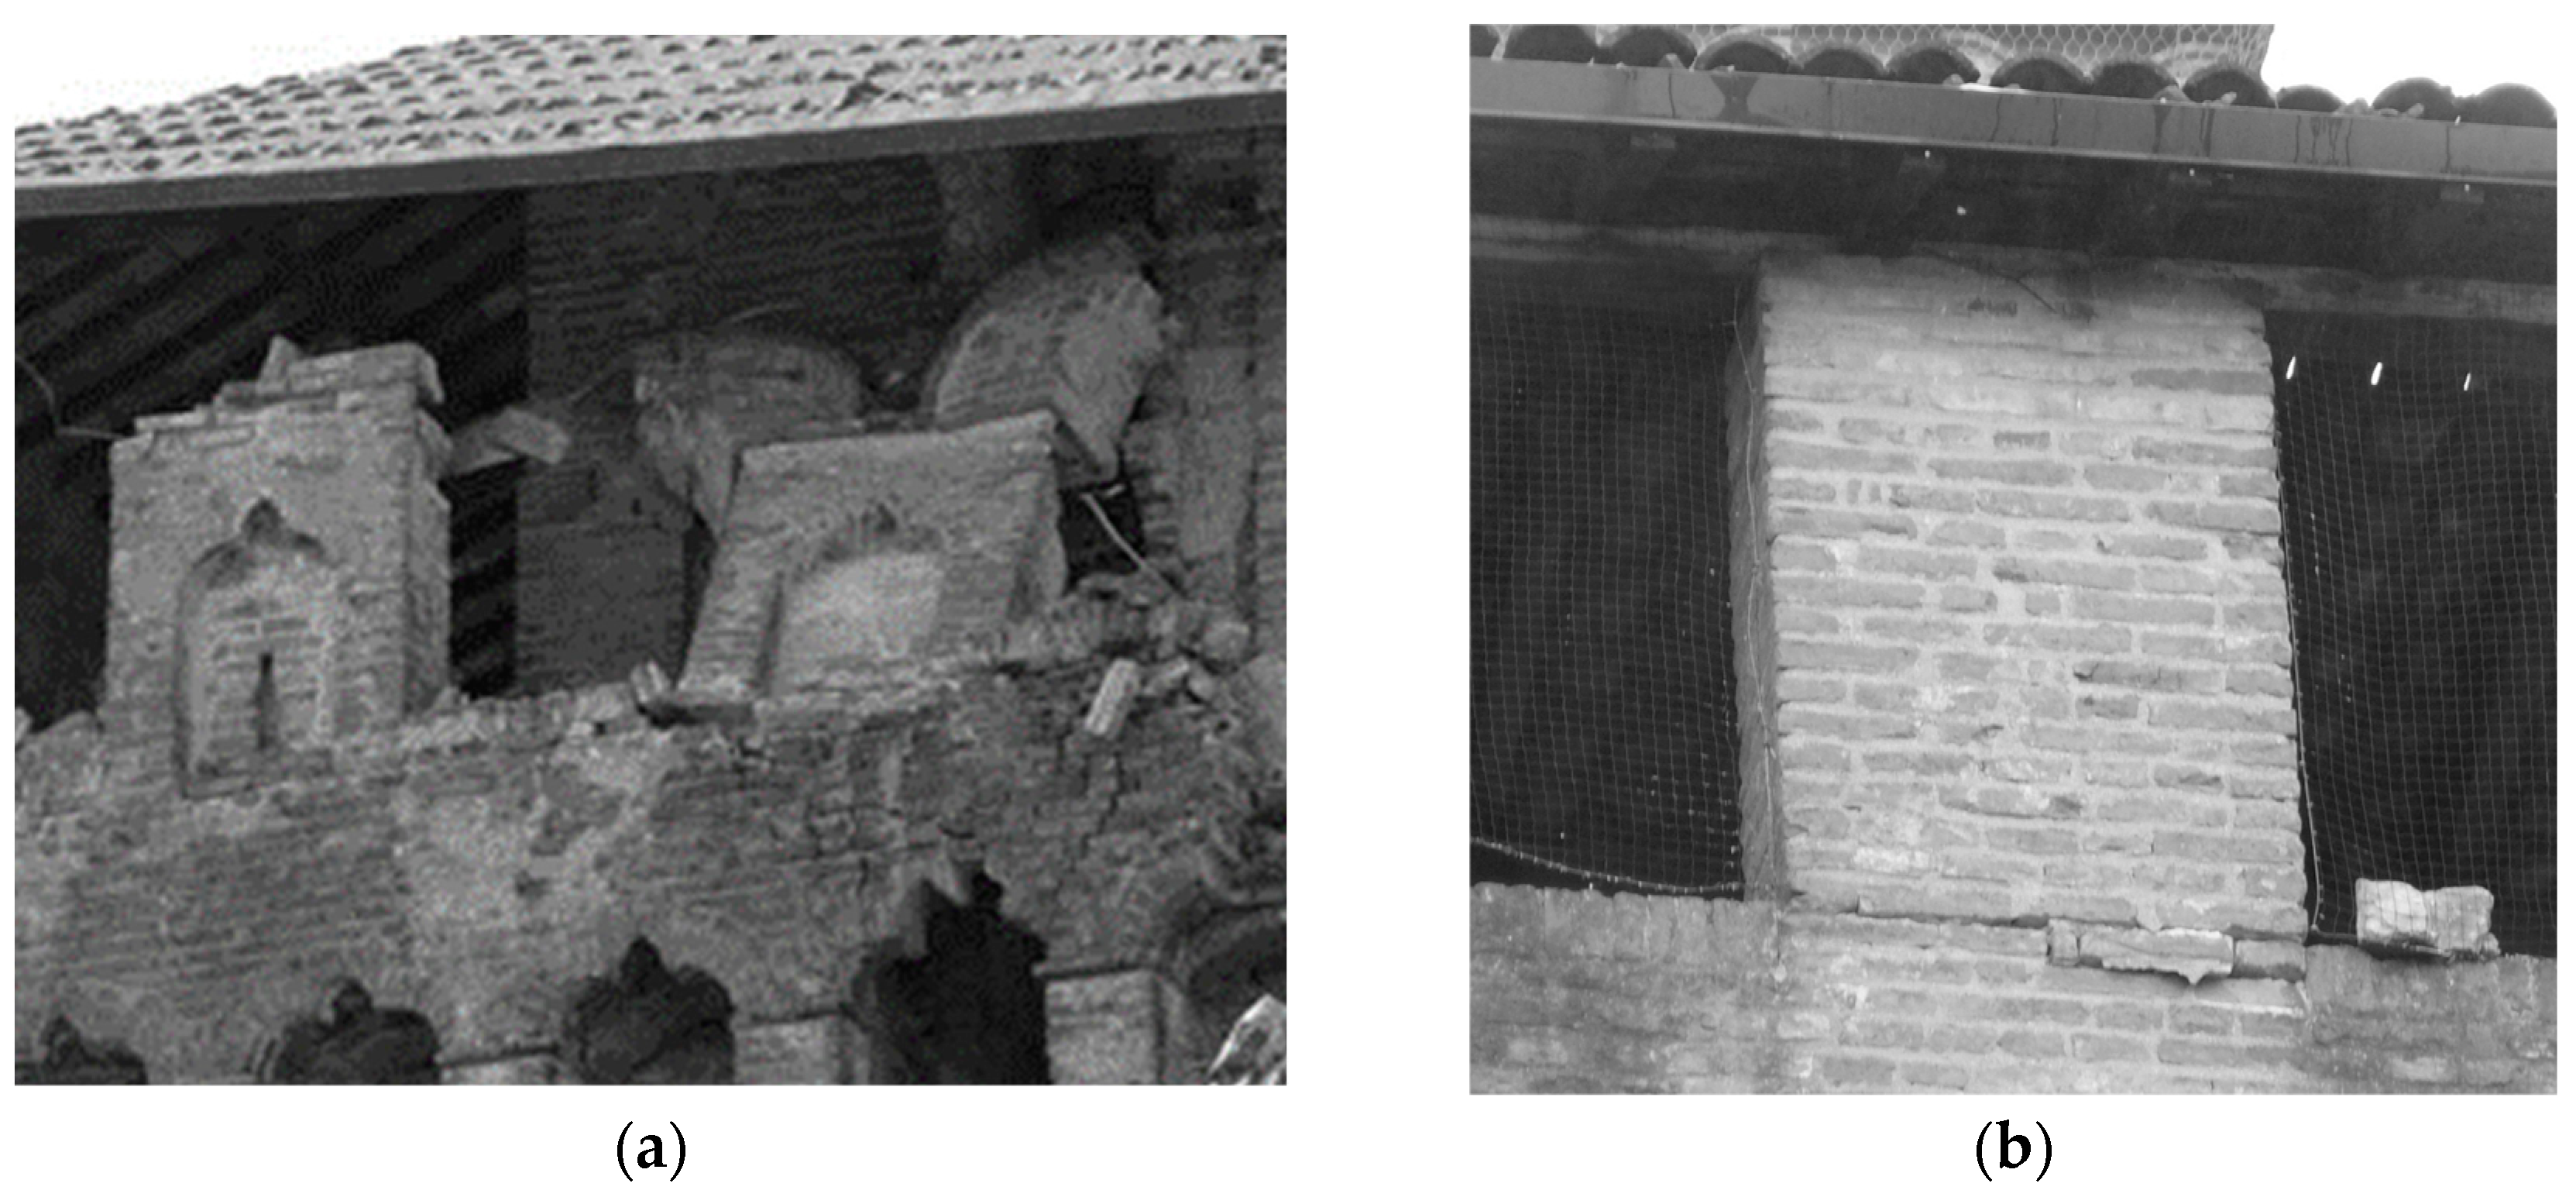
2.2. Three of the Most Recurring Damage Mechanisms
3. Materials and Methods for the Design of a Proactive GIS Geodatabase
3.1. Data Collection
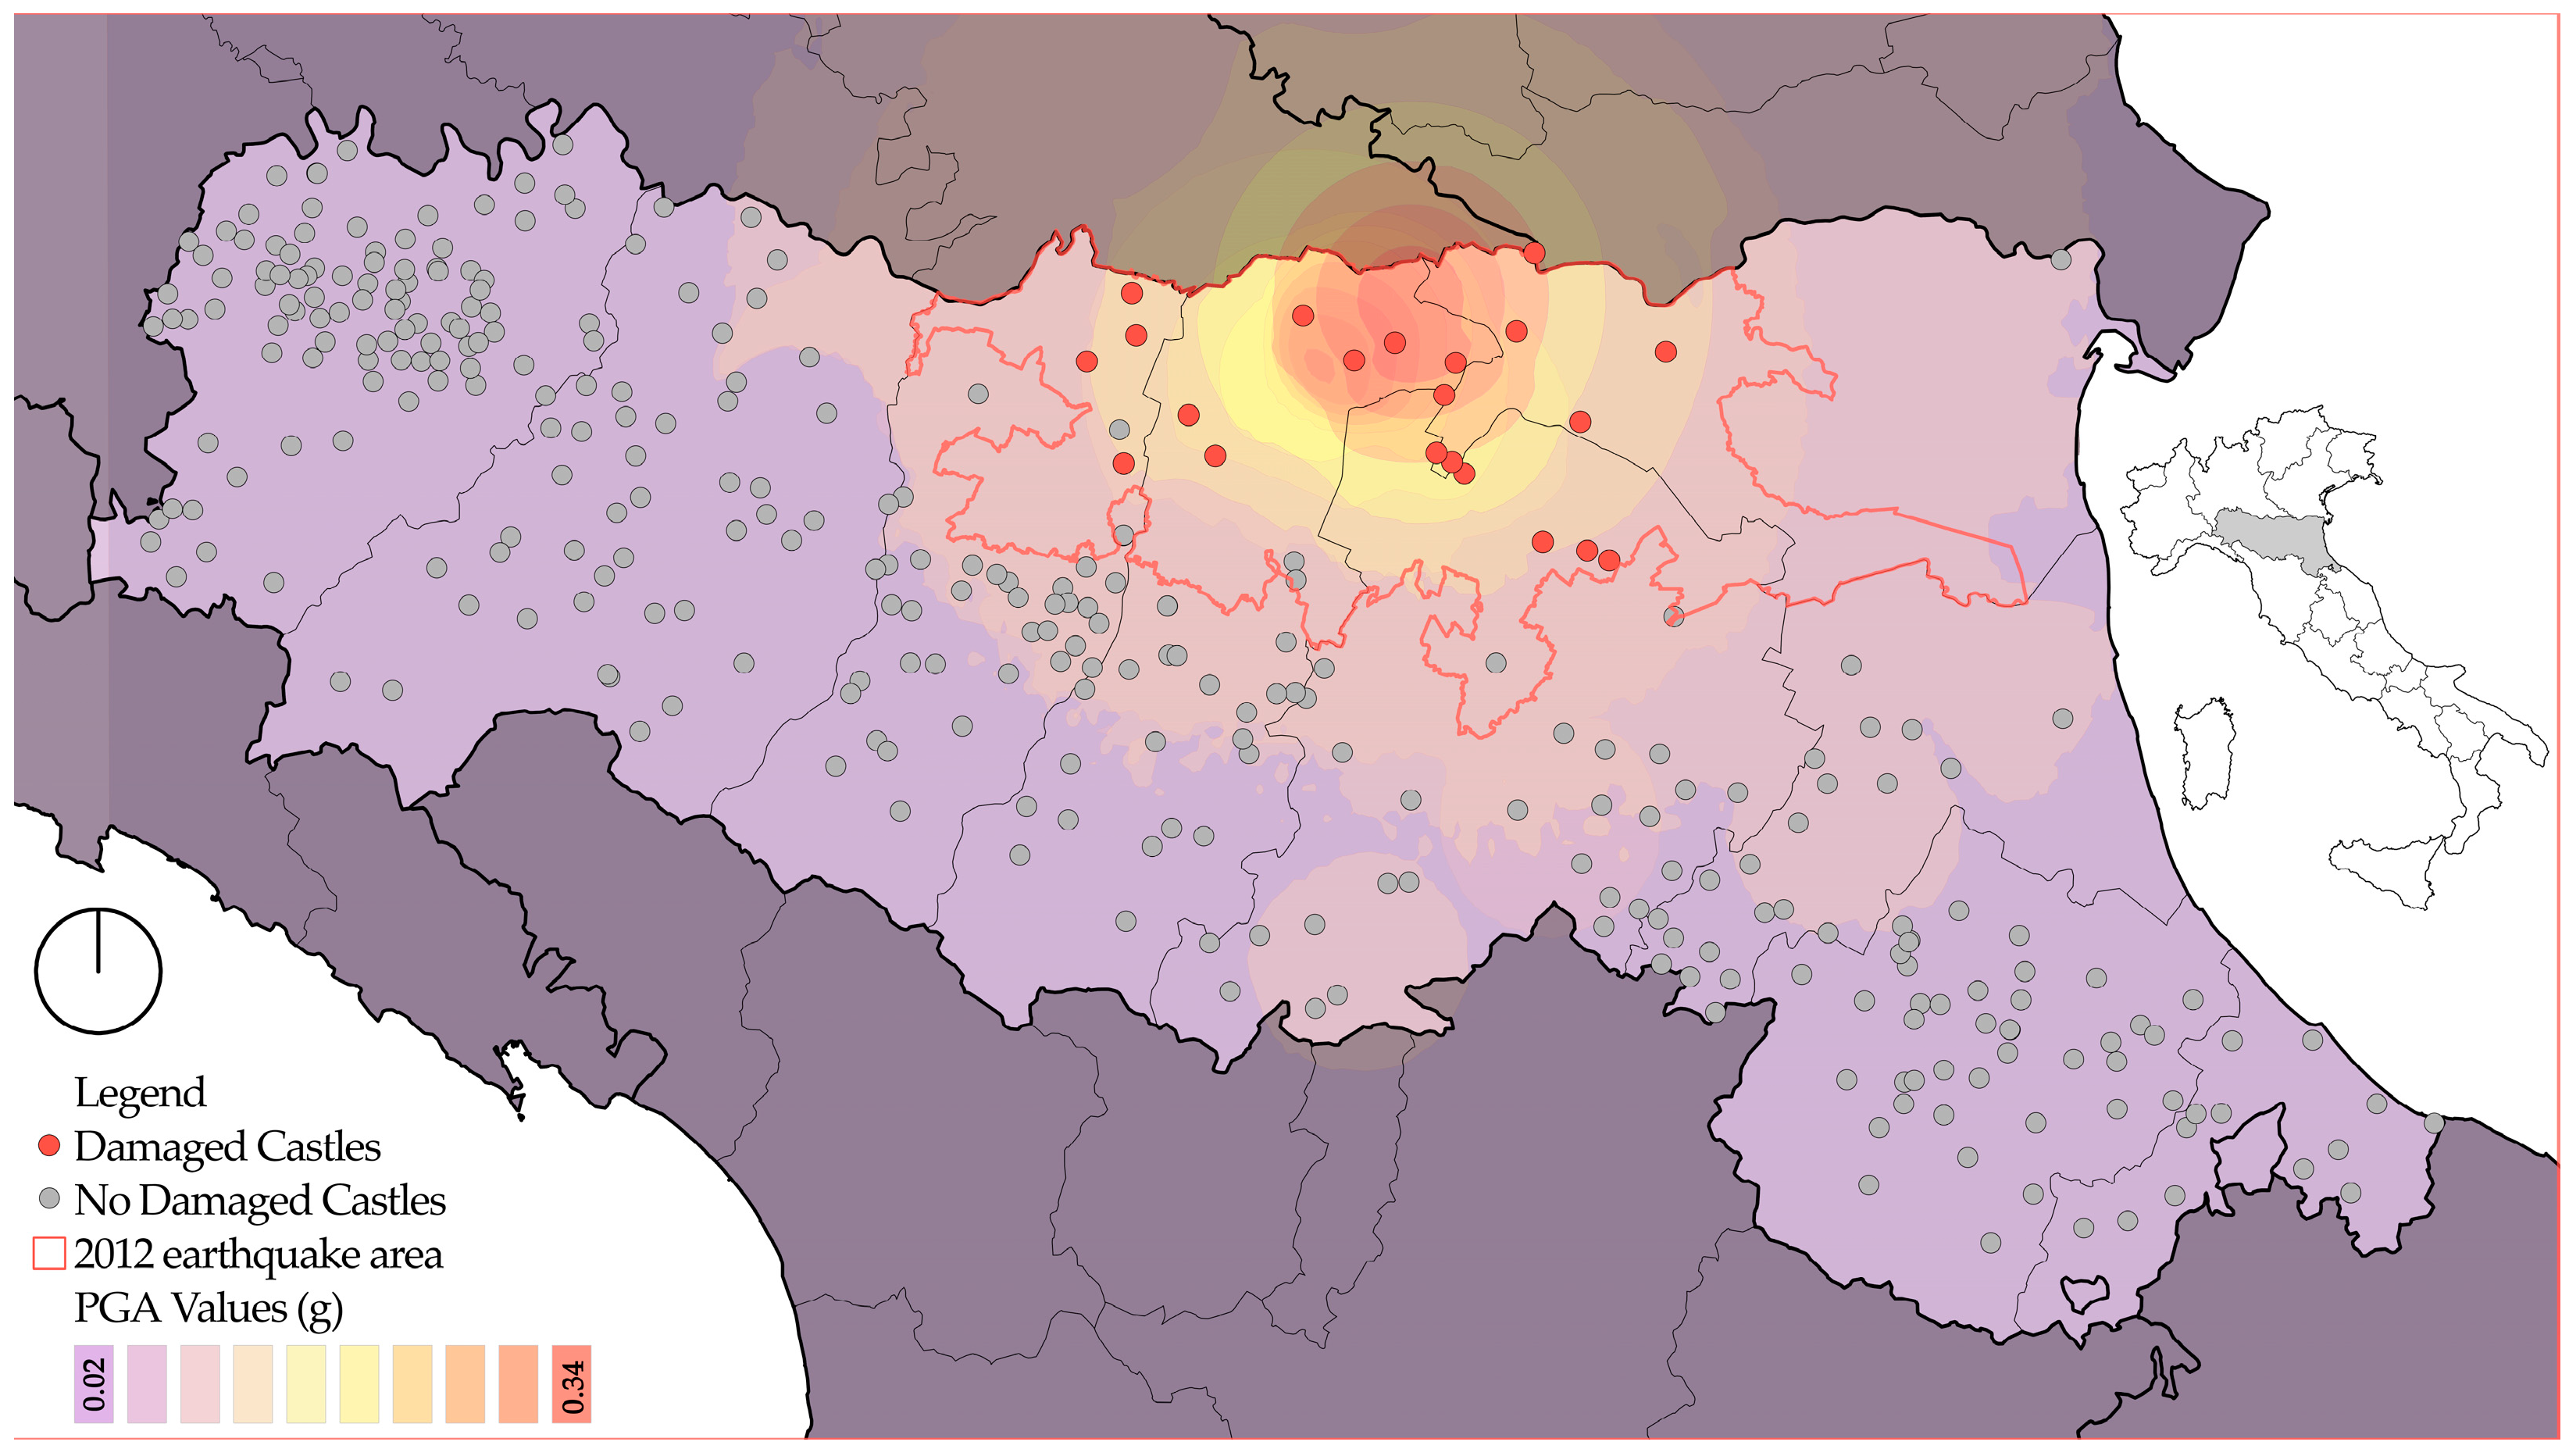
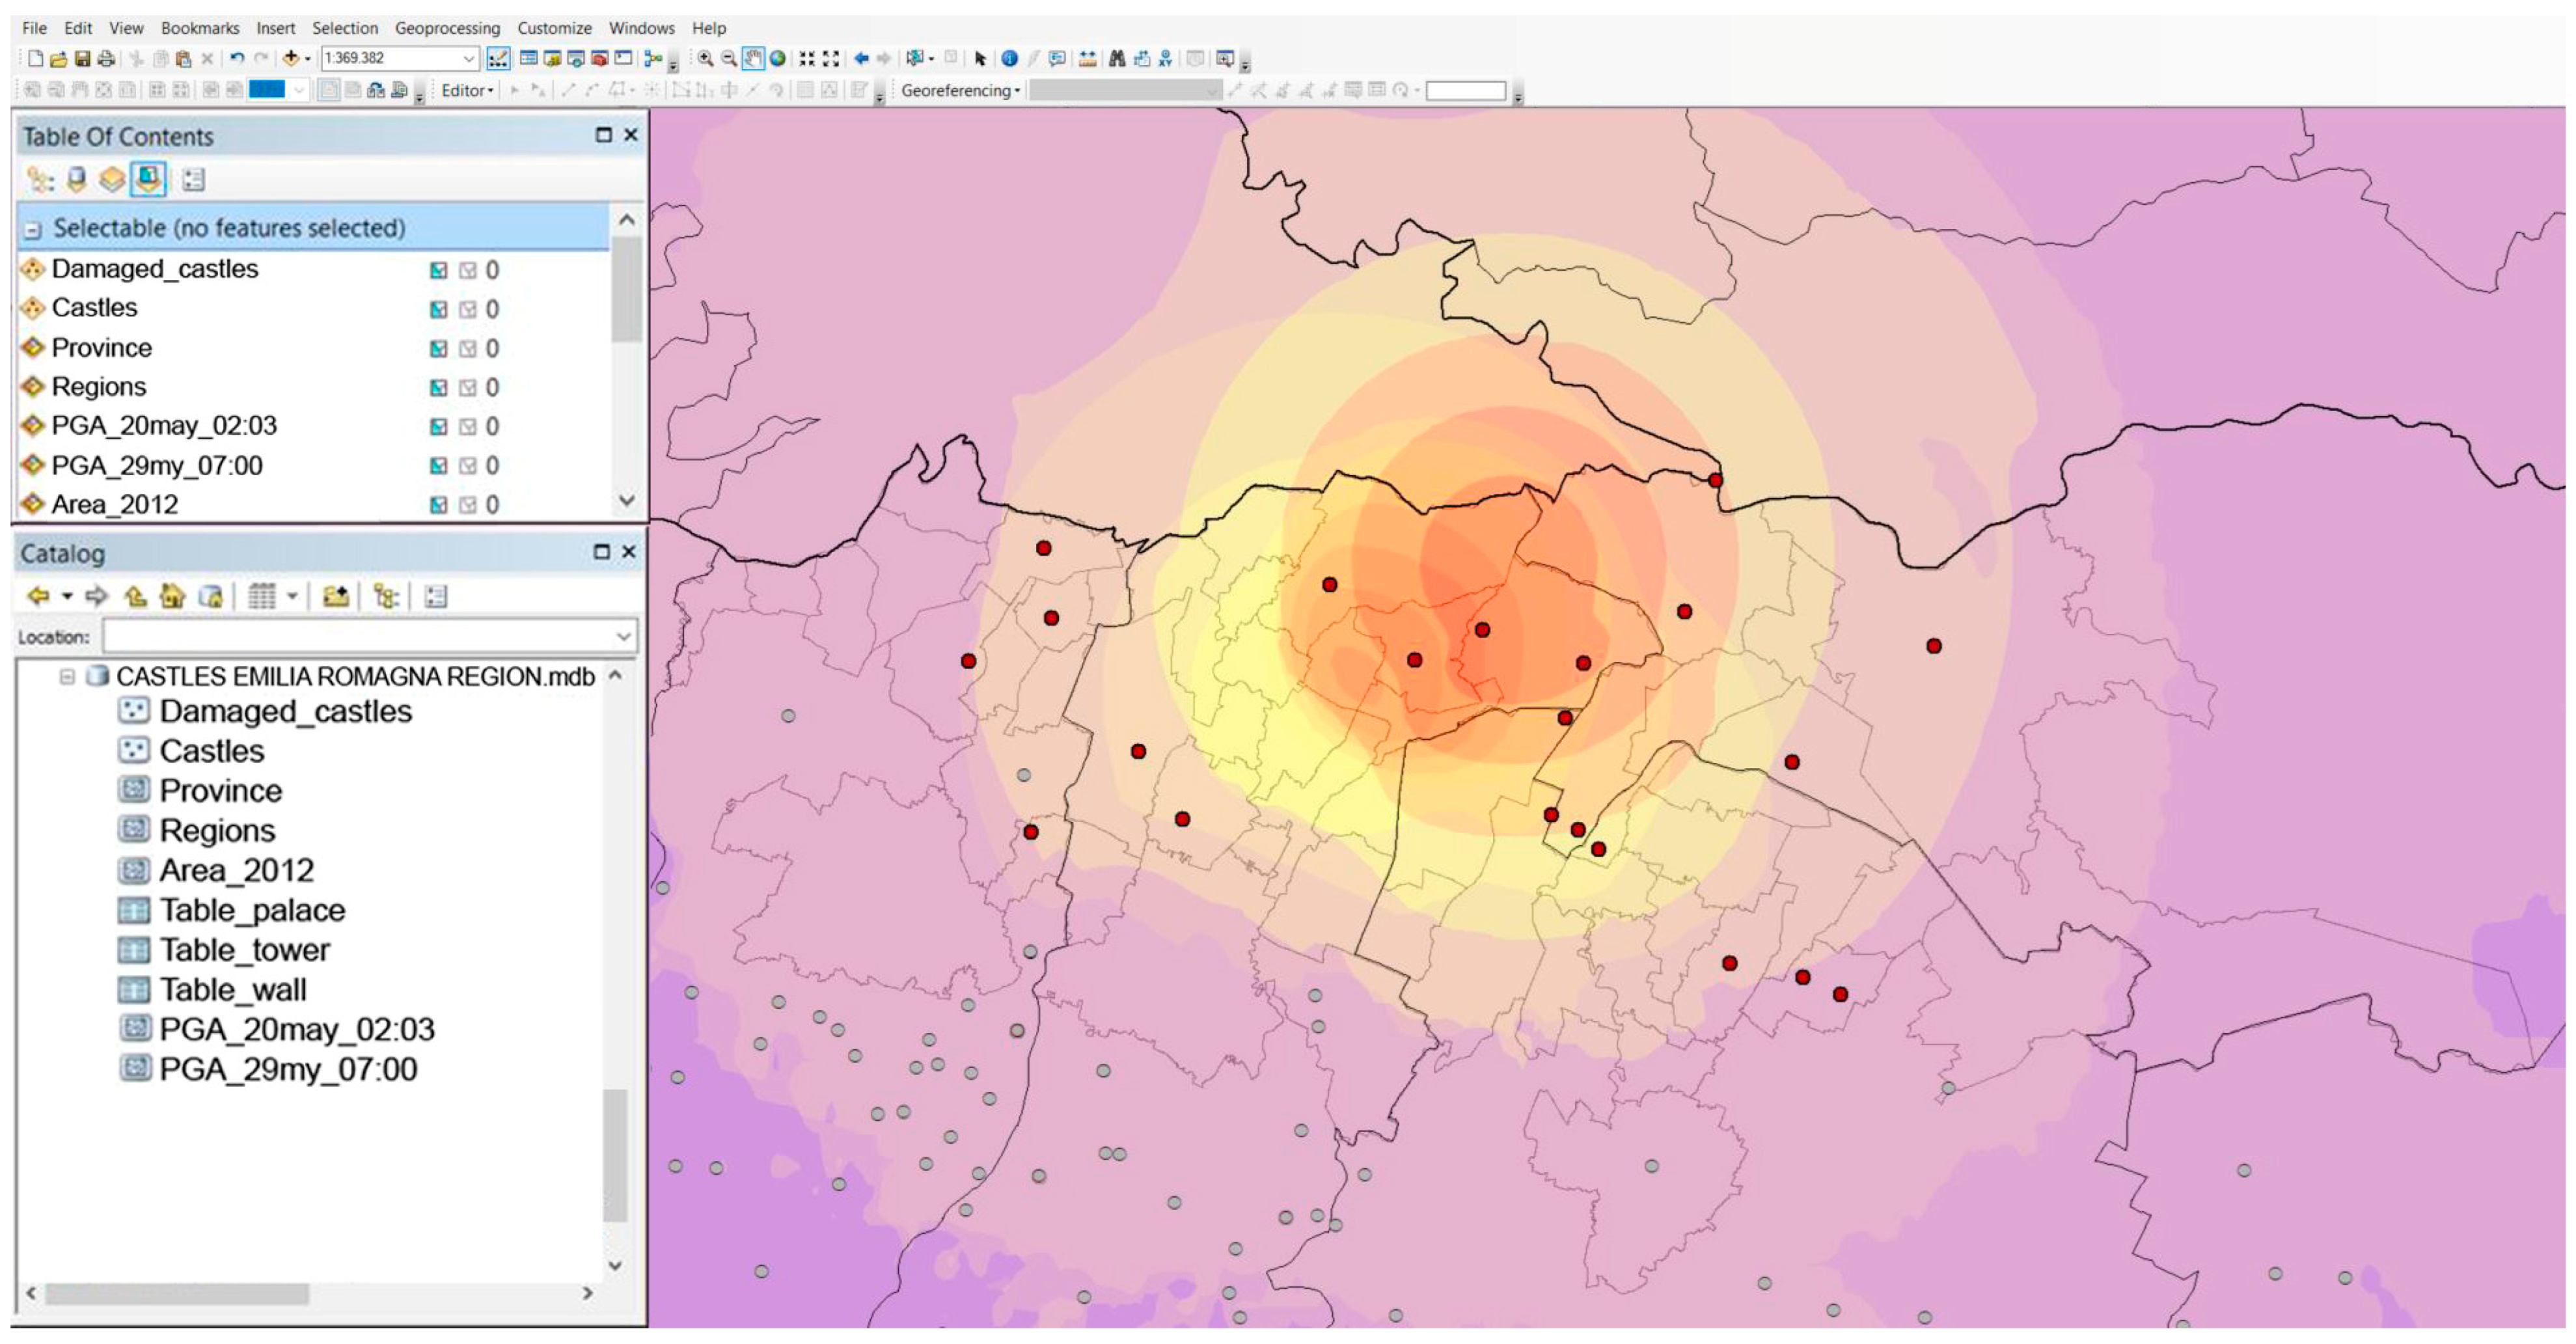
- From existing databases: open-source databases proved to be an important resource for this research. In particular, the following shapefiles were acquired: cartographic bases (maps of regional, provincial, and municipal boundaries represented by polygons), downloaded from the ISTAT website [45]; shakemaps, with polygon geometry type, from the INGV website [31], for events with a magnitude equal to or greater than 5 (Table 2), in terms of PGA. In addition, the Regional Secretariat provided the shapefile of the data about CH of the Region of Emilia-Romagna, used in the WebGIS [22] and represented by points. Then, the records of its attribute table were appropriately selected and simplified with only the fields related to castles typology to define the feature class Damaged_Castles.
- From archival research: A large amount of data was acquired through examination and study of architectural technical drawings, reports, and photographic material of all the 21 castles damaged by the seismic events of May–June 2012. These data were then included in the attribute tables of the three component assets (Palace, Tower, and Curtain walls). Specifically, data were collected on 31 palaces, 60 towers, and 15 curtain walls, associated with the 21 fortified complexes analyzed in the study.
3.2. Modeling
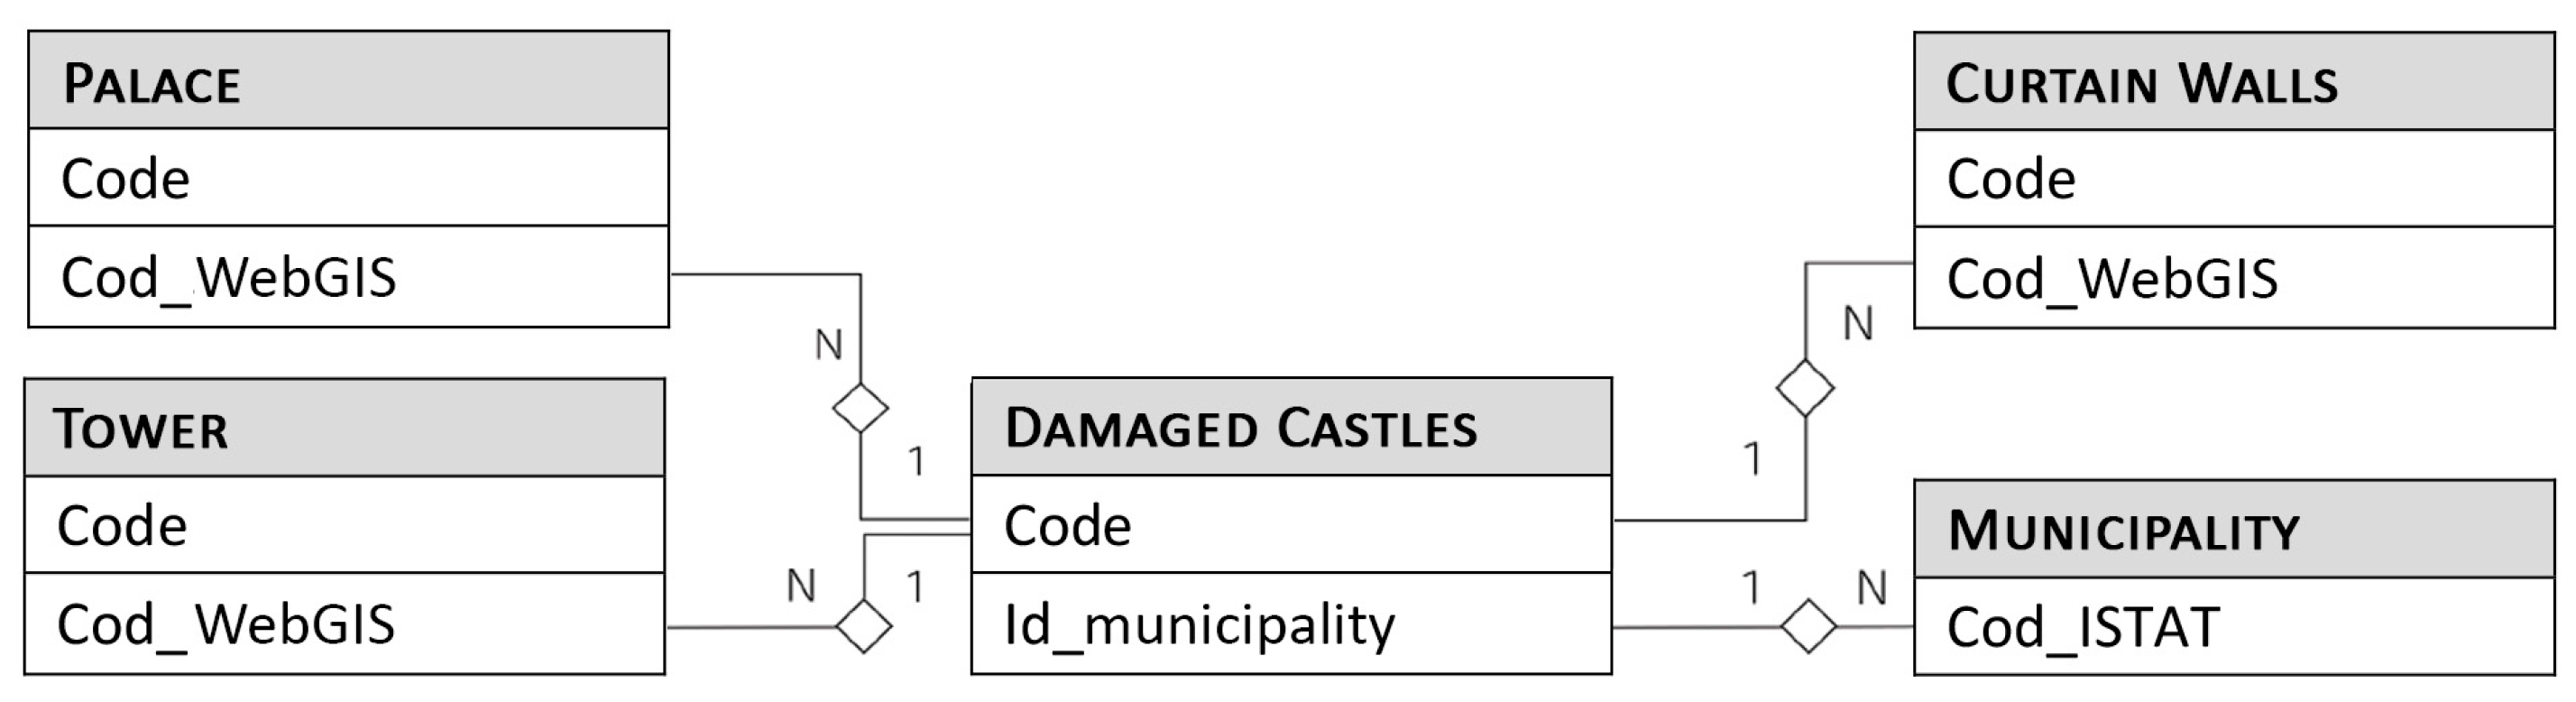
- Definition of the logical data model: In this geo-relational model (Figure 4), relationships between feature classes are established through a common field in the attribute table. Specifically, the Damaged_Castles feature class acts as the ‘parent’ feature class, to which other feature classes and attribute tables are linked, with a join relationship. More specifically, the tables Palace, Tower, and Curtain Wall are connected to the ‘parent’ feature class via the primary entity field associated with the Heritage Department code, thereby establishing one-to-many (1:M) relationships.
- Definition of the physical data models: this model describes the implemented fields for attribute tables. In particular, it was developed for the feature class Damaged_Castles (Table 3) and the attribute tables of the component assets (Palace, Tower, and Walls). The frame of reference used is the WGS84 UTM32.
3.3. Implementation and Management
- Component assets attribute table: the organization of the attribute tables of the aforementioned three component assets was carried out according to the physical model. An alphanumeric code was assigned to each component asset. In particular, for each macro-element, the possible damage mechanisms and the damage levels were associated.
- Data upload: the shapefiles and attribute tables, with the data about the component assets, were uploaded; the feature classes were linked together, according to the logical model.
- Statistical analysis and main results: cross-referencing the collected data through spatial and attributes queries and statistical analysis was performed to define new original information, which will be described more in detail in the next paragraph.
4. Results
4.1. Vulnerability: A Statistical Approach
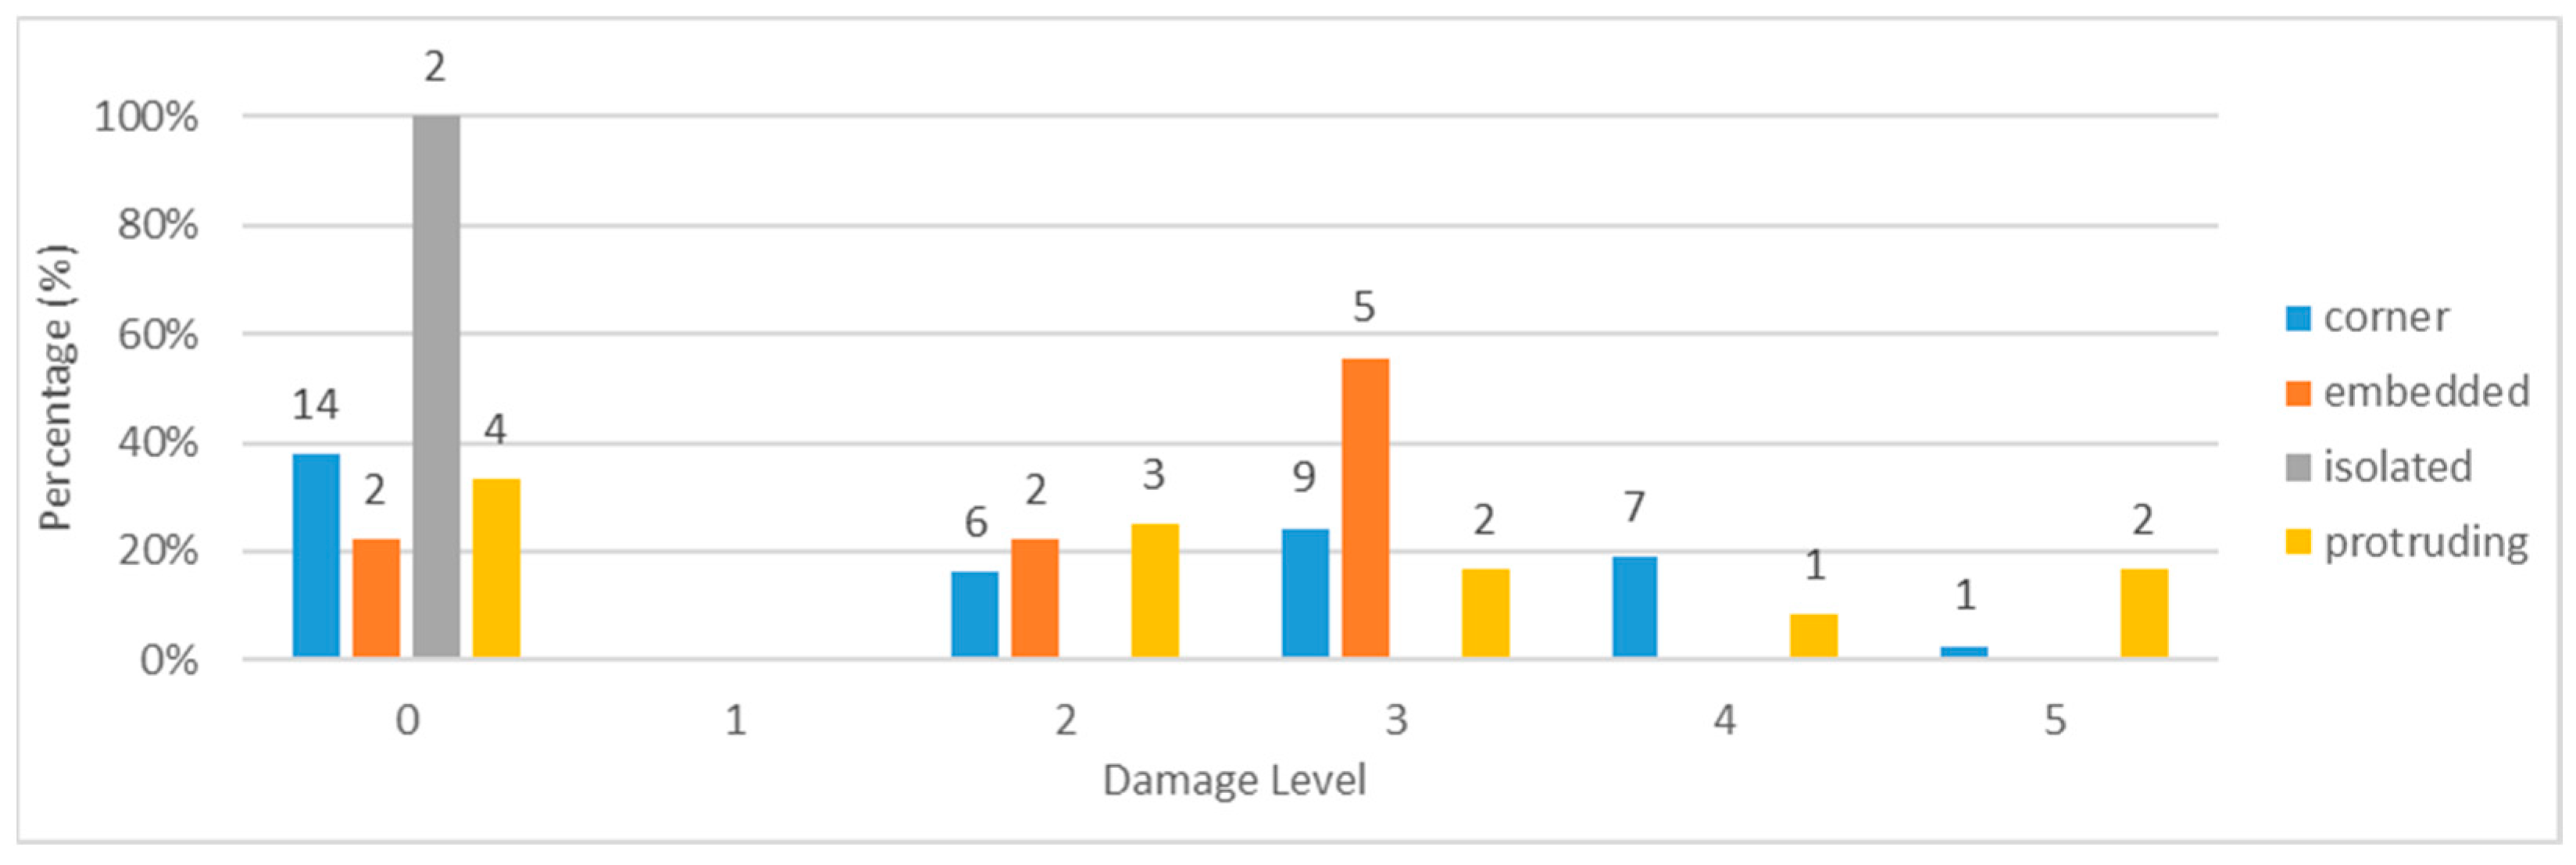
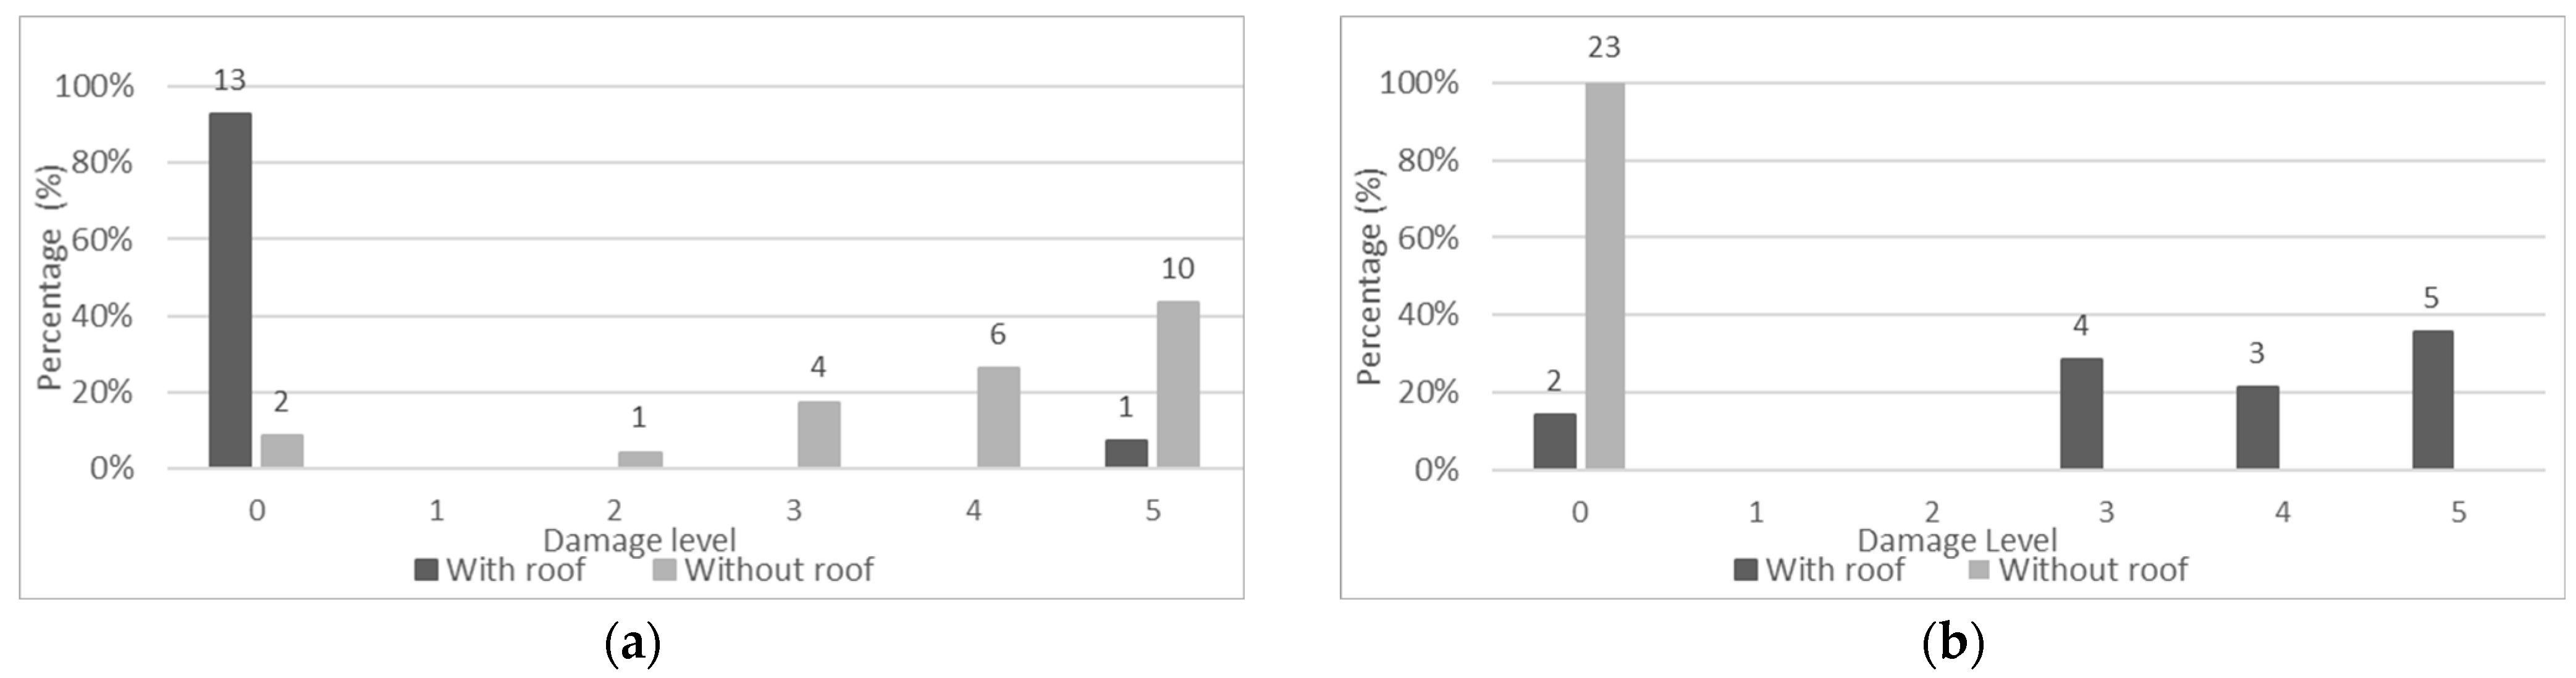
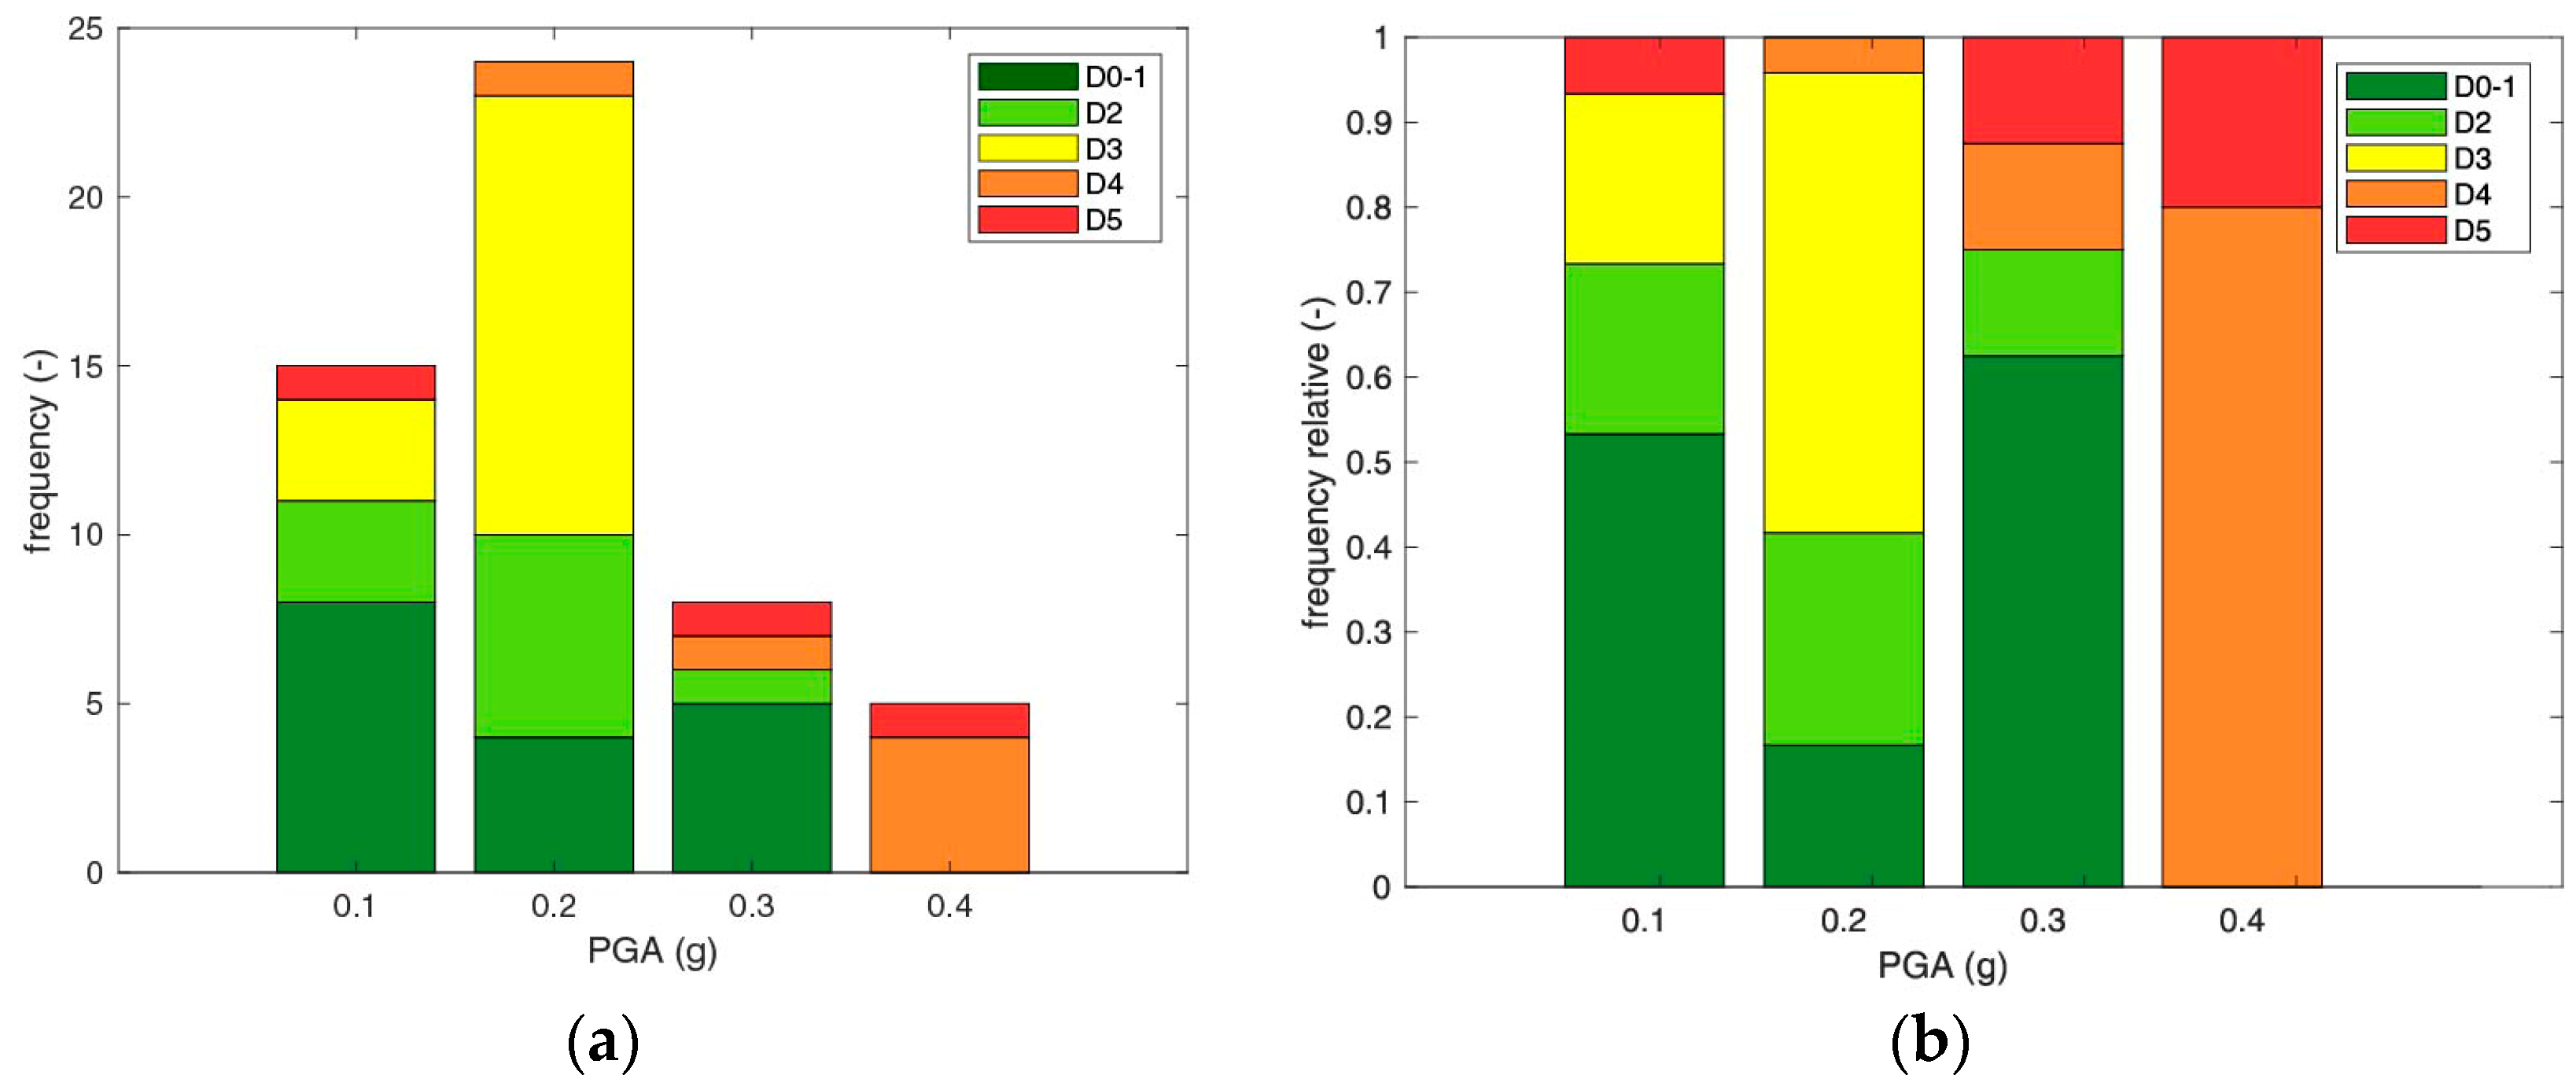
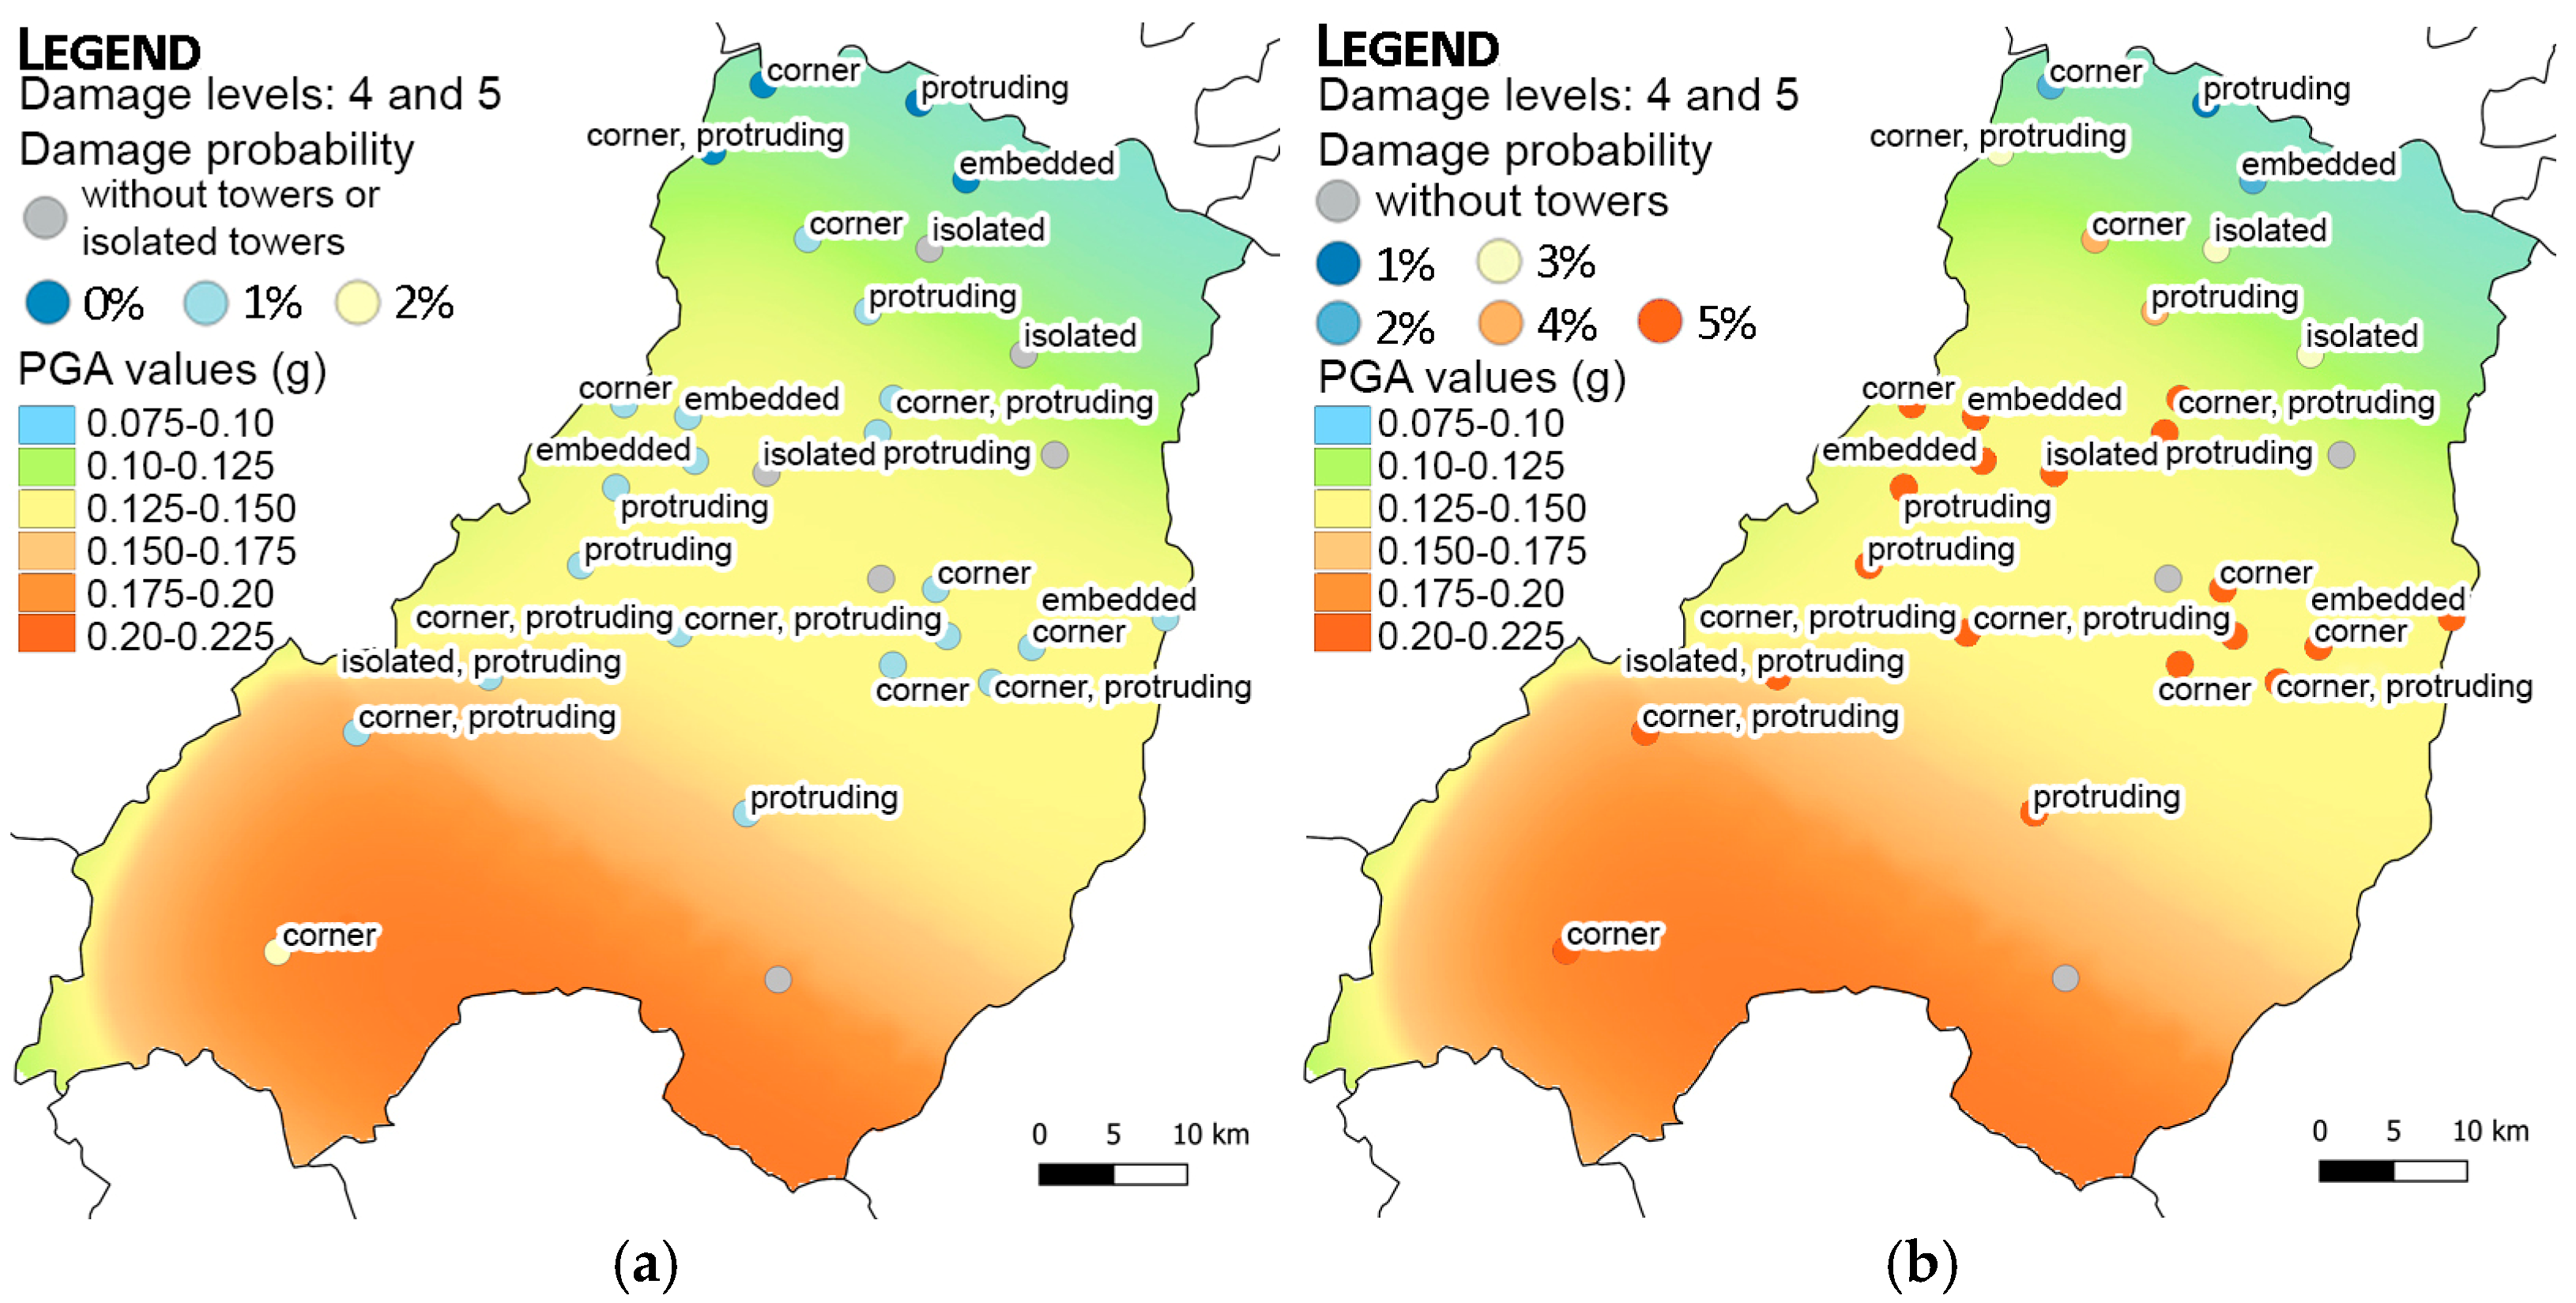
4.1.1. Towers
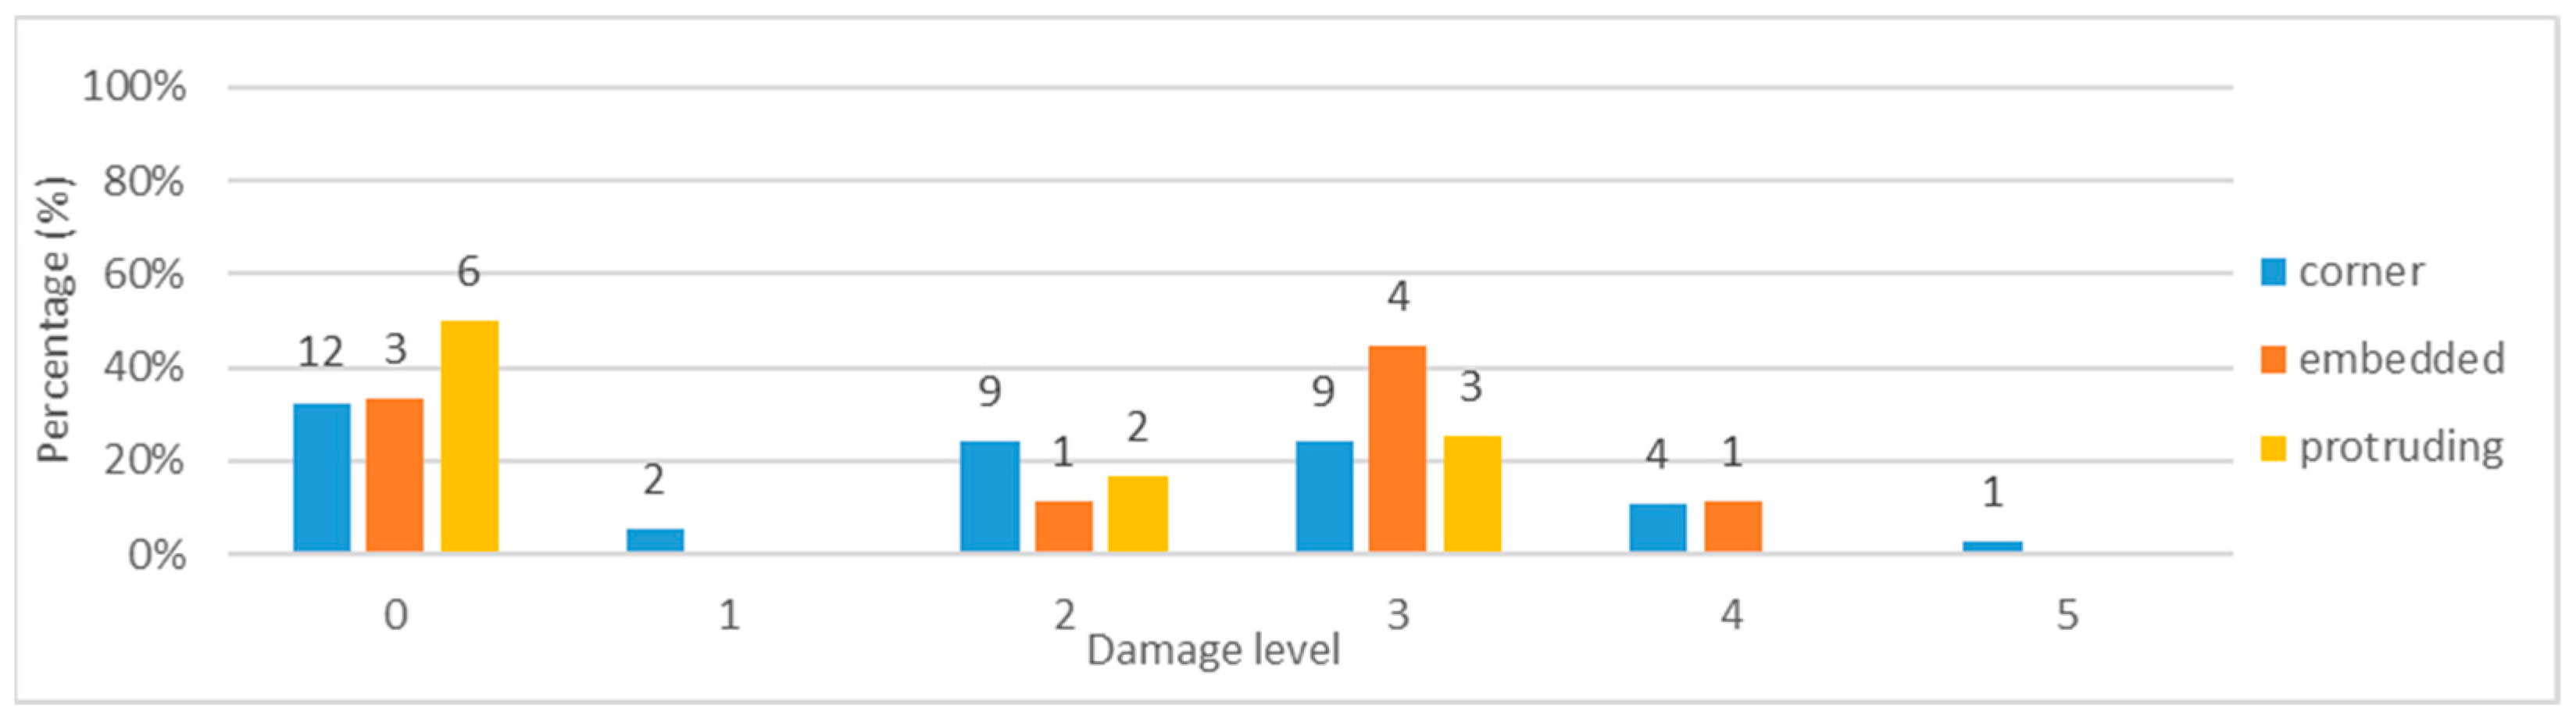
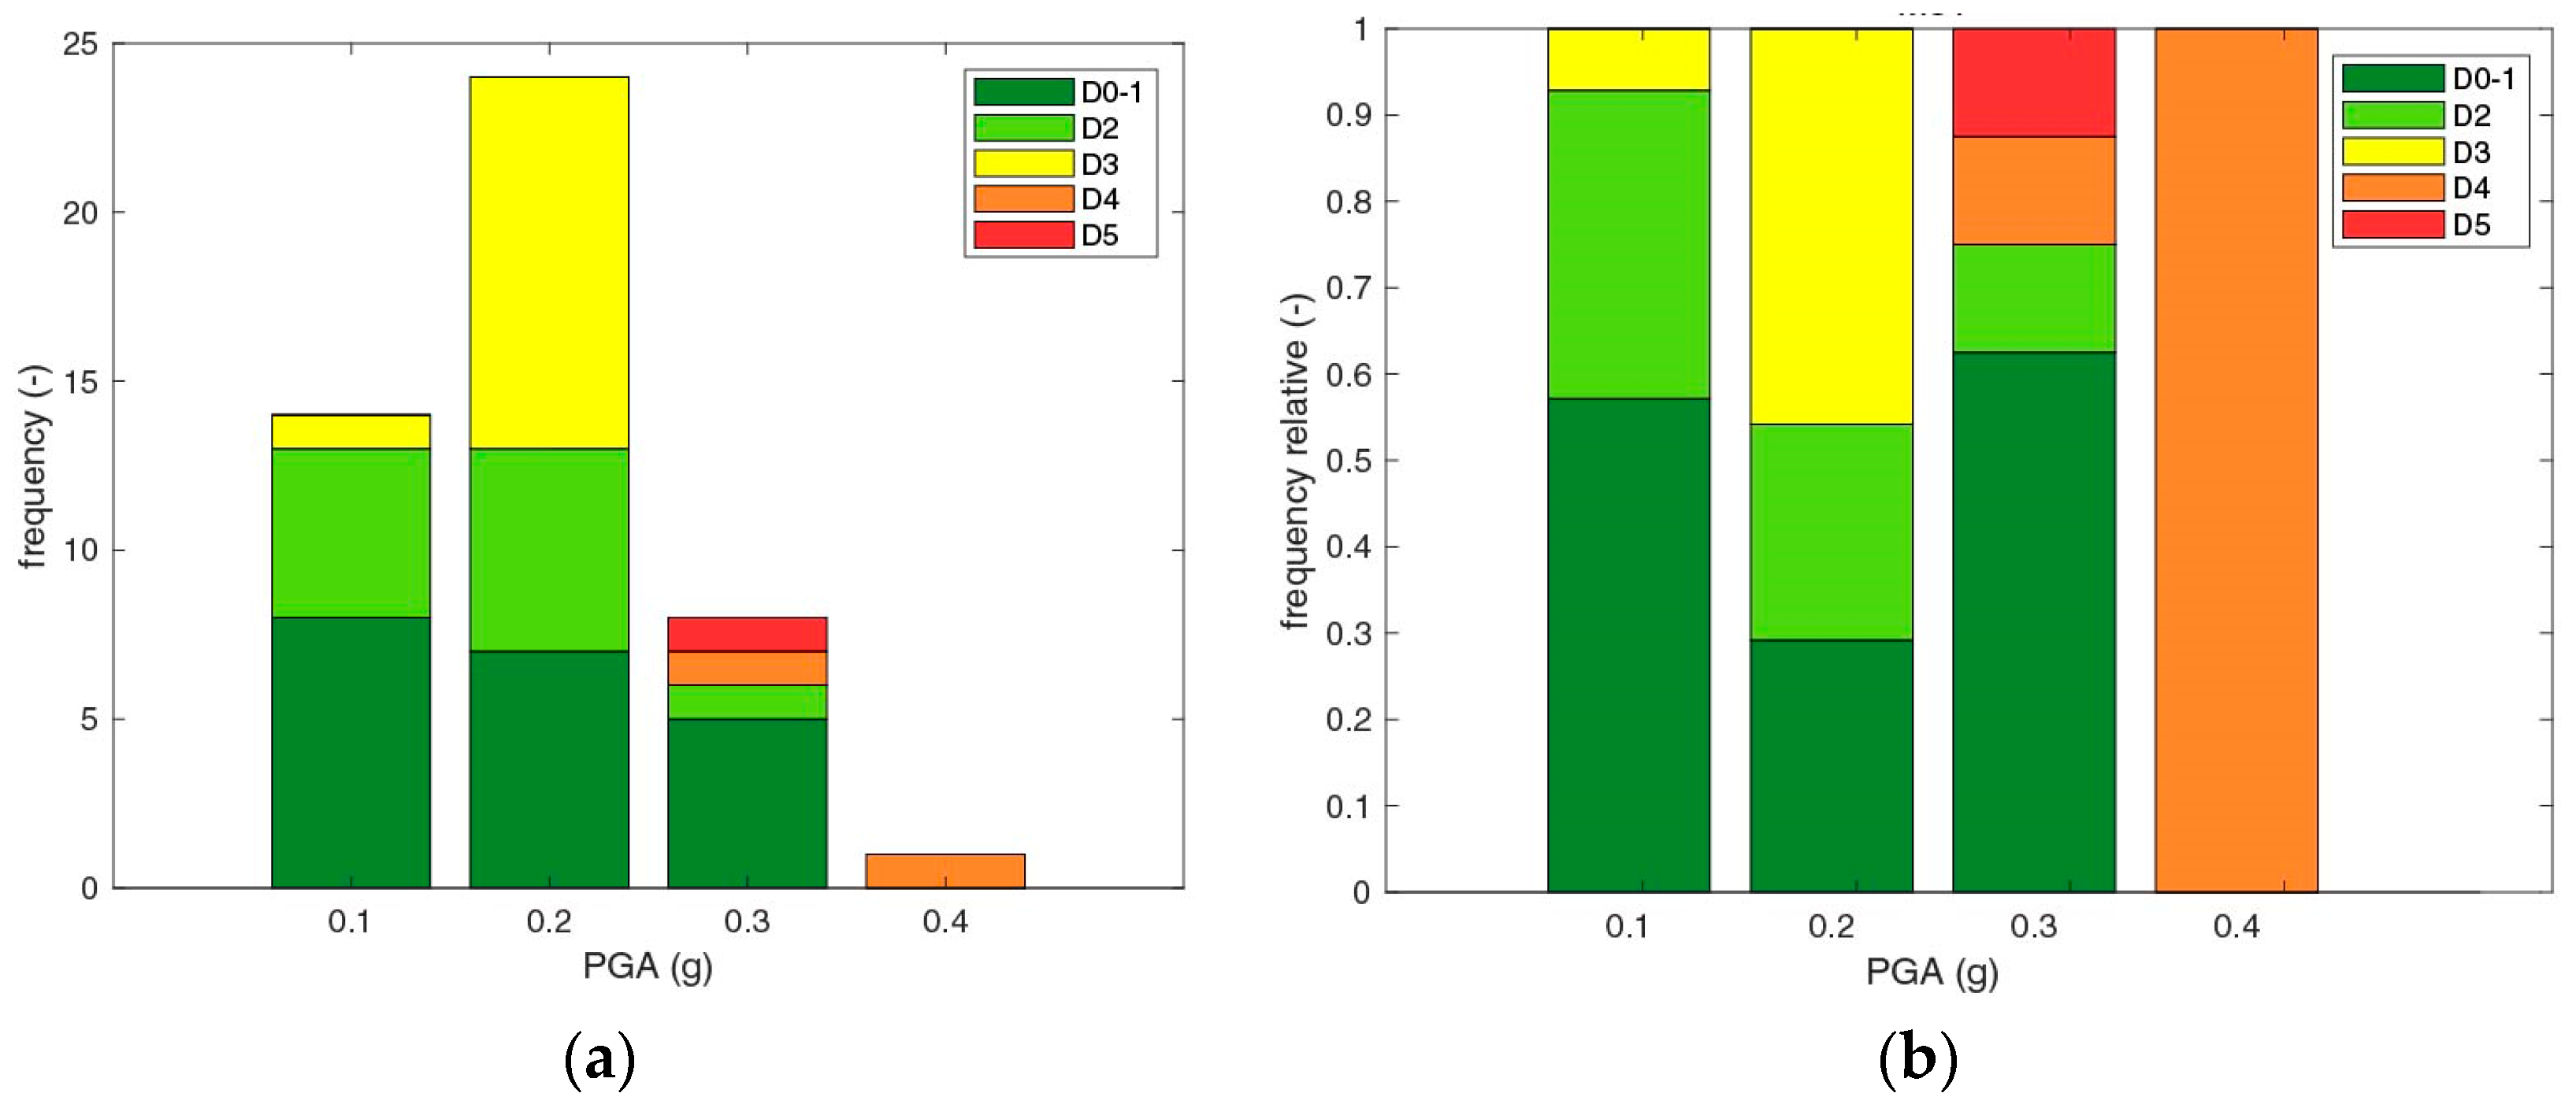
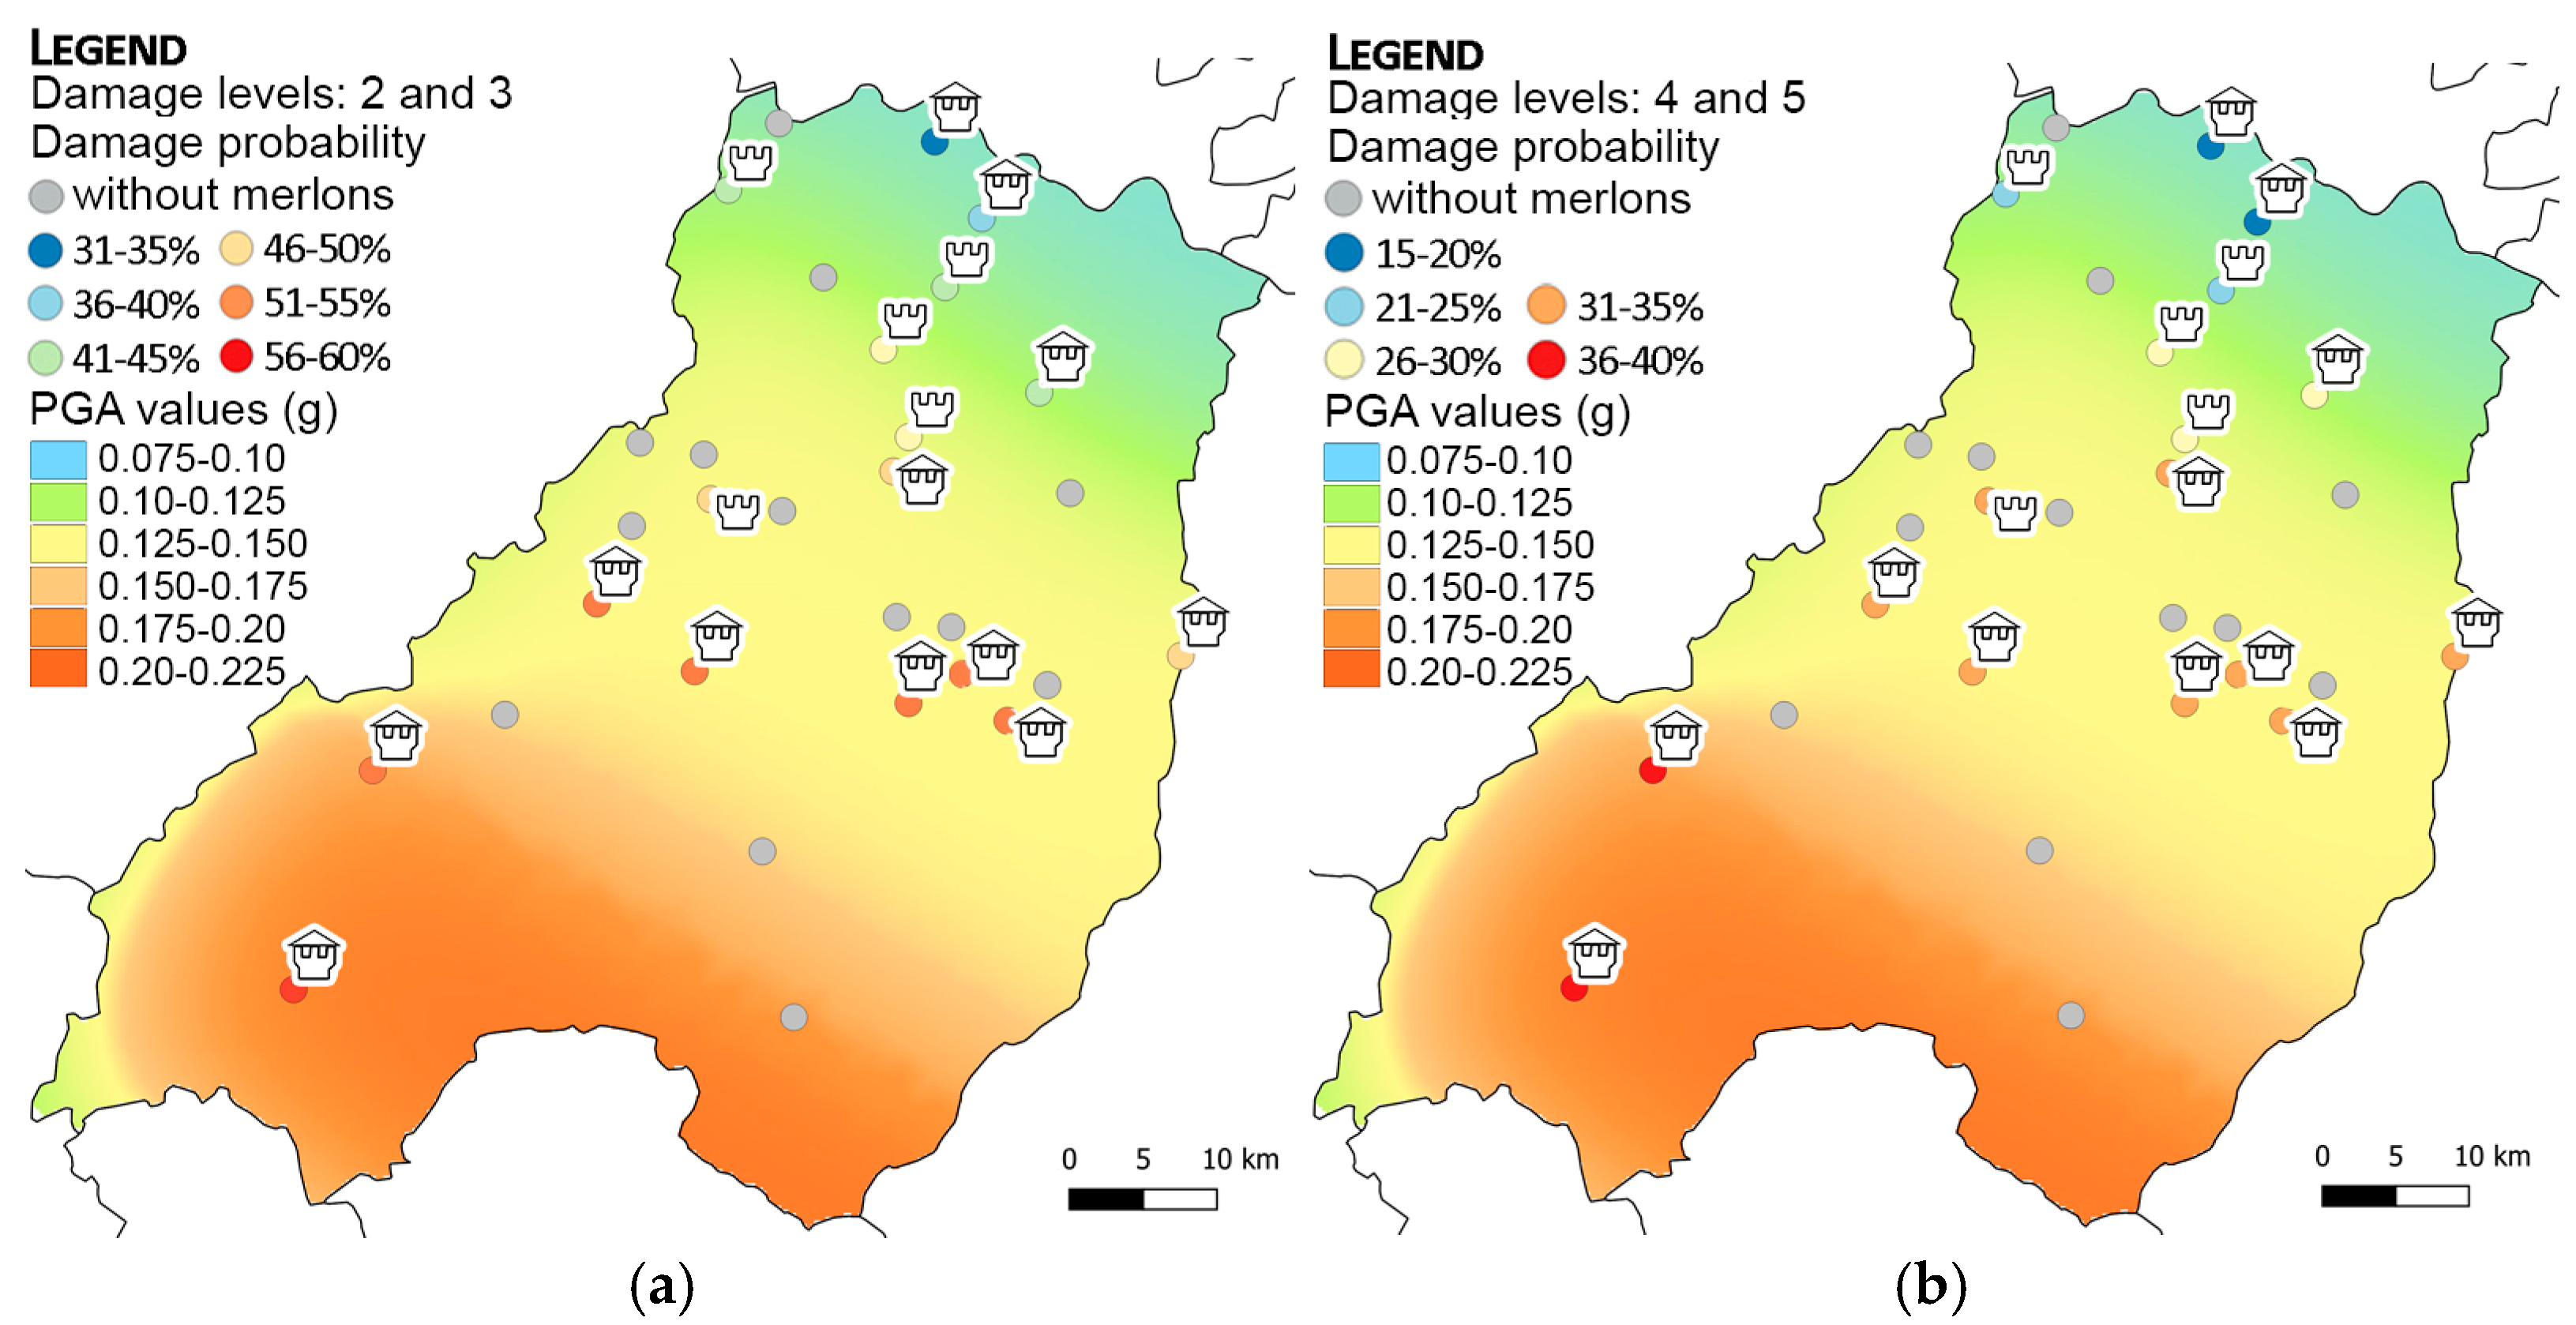
4.1.2. Merlons
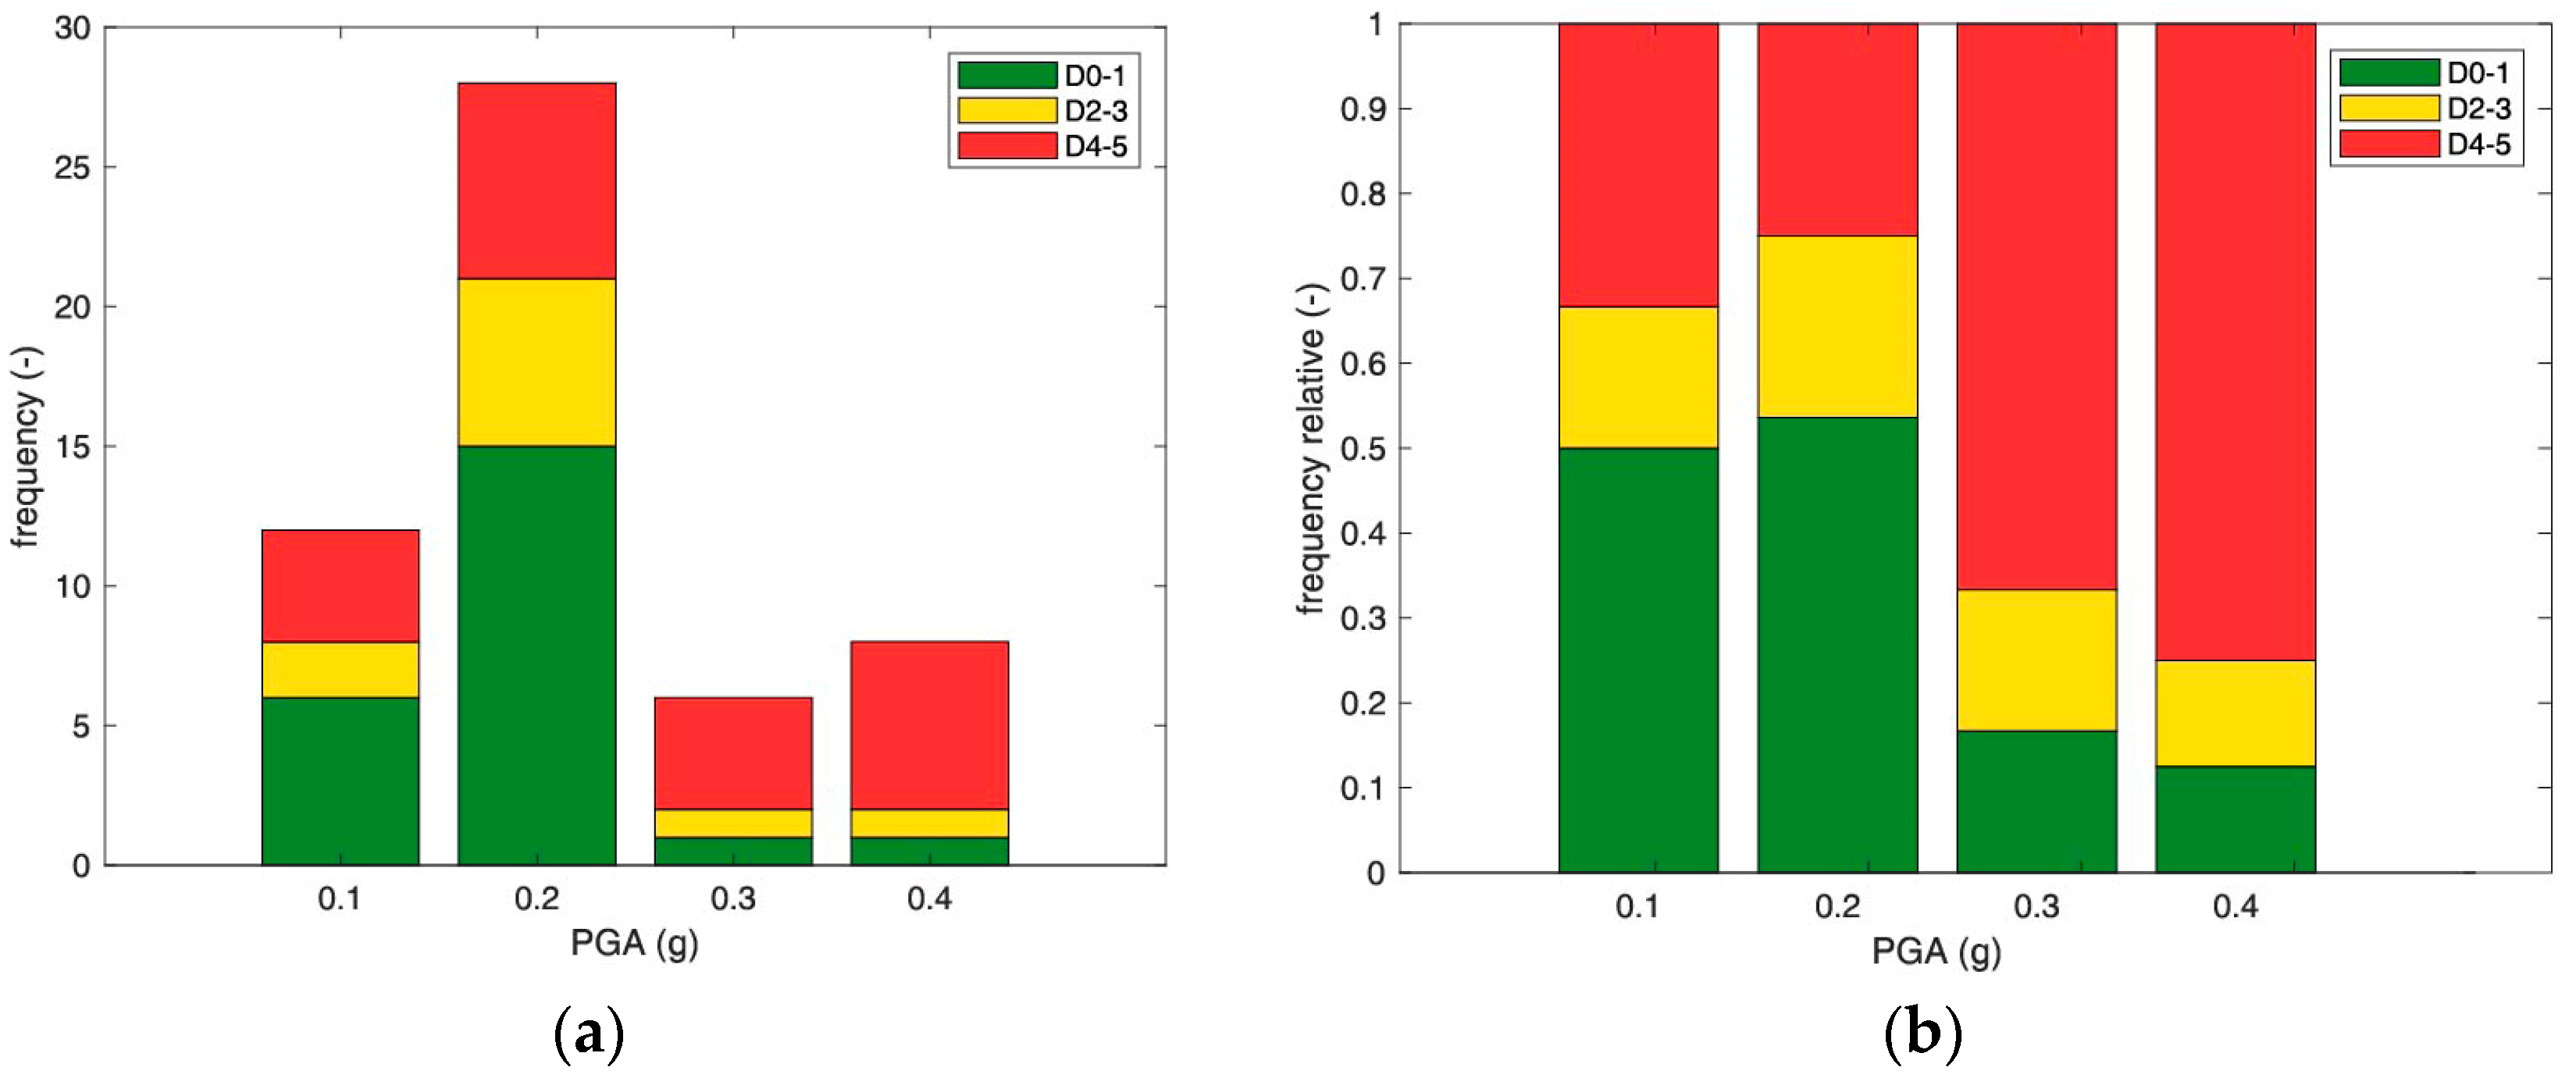
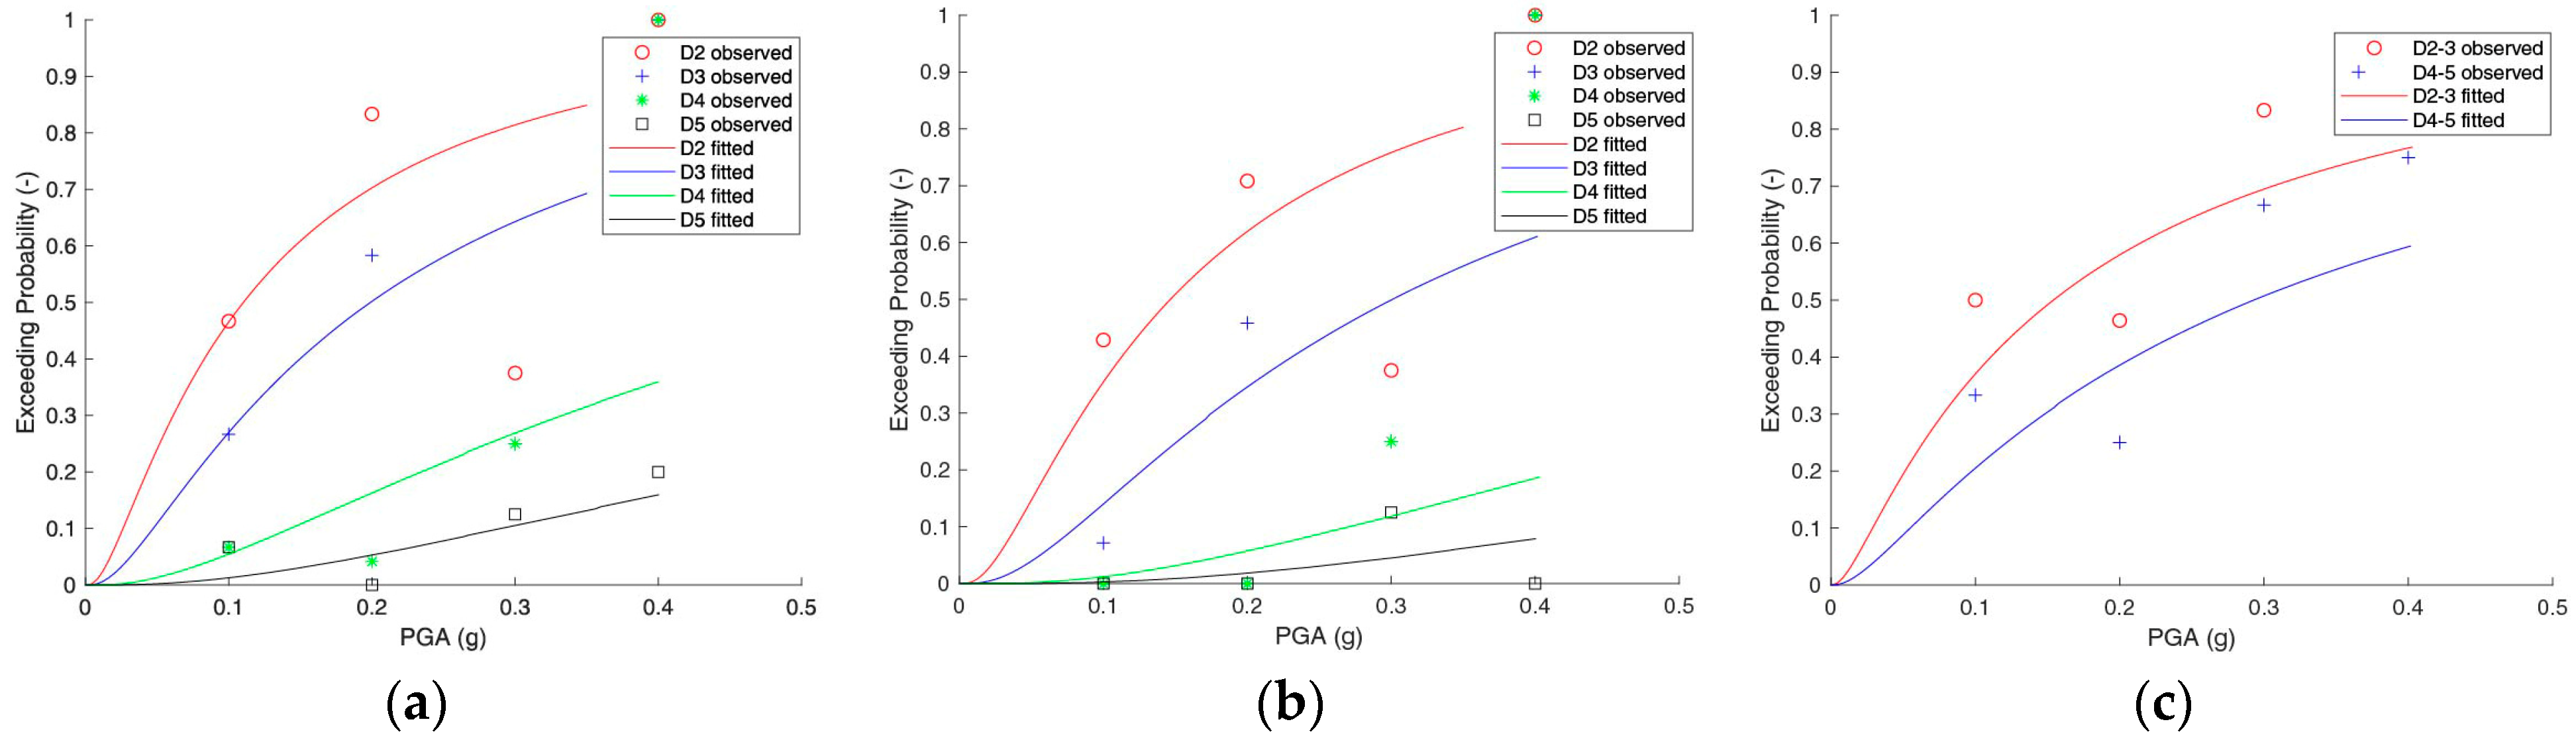
4.2. Fragility Curves
5. Discussion on the Proactive Application of the Results
6. Conclusions
Funding
Data Availability Statement
Acknowledgments
Conflicts of Interest
References
- Decreto-Legge. n. 74—06/06/2012. Interventi Urgenti in Favore Delle Popolazioni Colpite Dagli Eventi Sismici che Hanno Interessato il Territorio Delle Province di Bologna, Modena, Ferrara, Mantova, Reggio Emilia e Rovigo, il 20 e il 29 Maggio 2012; In Gazzetta Ufficiale n. 180—03/08/2012: Rome, Italy, 2012. Available online: https://www.gazzettaufficiale.it/atto/serie_generale/caricaDettaglioAtto/originario?atto.dataPubblicazioneGazzetta=2012-06-07&atto.codiceRedazionale=012G0096 (accessed on 26 April 2025).
- Coïsson, E.; Ferrari, L.; Ferretti, D.; Rozzi, M. Non-Smooth Dynamic Analysis of Local Seismic Damage Mechanisms of the San Felice Fortress in Northern Italy. Procedia Eng. 2016, 161, 451–457. [Google Scholar] [CrossRef]
- Tiberti, S.; Acito, M.; Milani, G. Comprehensive FE numerical insight into Finale Emilia Castle behavior under 2012 Emilia Romagna seismic sequence: Damage causes and seismic vulnerability mitigation hypothesis. Eng. Struct. 2016, 117, 397–421. [Google Scholar] [CrossRef]
- Degli Abbati, S.; D’Altri, A.M.; Ottonelli, D.; Castellazzi, G.; Cattari, S.; De Miranda, S.; Lagomarsino, S. Seismic assessment of complex assets through nonlinear static analyses: The fortress in San Felice sul Panaro hit by the 2012 earthquake in Italy. In Proceedings of the 6th International Conference on Computational Methods in Structural Dynamics and Earthquake Engineering, Rhodes Island, Greece, 15–17 June 2017; pp. 2290–2299. [Google Scholar] [CrossRef]
- D’Altri, A.M.; Castellazzi, G.; De Miranda, S. Collapse investigation of the Arquata del Tronto medieval fortress after the 2016 Central Italy seismic sequence. J. Build. Eng. 2018, 18, 245–251. [Google Scholar] [CrossRef]
- Valente, M.; Milani, G. Earthquake-Induced damage assessment and partial failure mechanisms of an Italian Medieval castle. Eng. Fail. Anal. 2019, 99, 292–309. [Google Scholar] [CrossRef]
- Milani, G.; Acito, M.; Chesi, C.; Di Francesco, C.; Martines, G. A multidisciplinary insight into the collapse causes of the masonry clock tower and castle in Finale Emilia. In Proceedings of the SAHC2014—9th International Conference on Structural Analysis of Historical Constructions, Mexico City, Mexico, 14–17 October 2014; pp. 14–17. [Google Scholar]
- Acito, M.; Bocciarelli, M.; Chesi, C.; Milani, G. Collapse of the clock tower in Finale Emilia after the May 2012 Emilia Romagna earthquake sequence: Numerical insight. Eng. Struct. 2014, 72, 70–91. [Google Scholar] [CrossRef]
- Zanotti Fragonara, L.; Boscato, G.; Ceravolo, R.; Russo, S.; Ientile, S.; Pecorelli, M.L.; Quattrone, A. Dynamic investigation on the Mirandola bell tower in post-earthquake scenarios. Bull. Earthq. Eng. 2017, 15, 313–337. [Google Scholar] [CrossRef]
- Castellazzi, G.; D’Altri, A.M.; De Miranda, S.; Chiozzi, A.; Tralli, A. Numerical insights on the seismic behavior of a nonisolated historical masonry tower. Bull. Earthq. Eng. 2018, 16, 933–961. [Google Scholar] [CrossRef]
- Torelli, G.; D’Ayala, D.; Betti, M.; Bartoli, G. Analytical and numerical seismic assessment of heritage masonry towers. Bull. Earthq. Eng. 2020, 18, 969–1008. [Google Scholar] [CrossRef]
- Cima, V.; Grande, E.; Lirer, S. Proposal for an expeditious seismic vulnerability evaluation of the Italian medieval defensive walls. Bull. Earthq. Eng. 2024, 22, 5147–5171. [Google Scholar] [CrossRef]
- Doglioni, F. Codice di Pratica (Linee Guida) per la Progettazione Degli Interventi di Riparazione, Miglioramento Sismco e Resaturo dei Beni Architettonici Danneggiati dal Terremto Umbro-Marchigiano del 1997; Regione Marche—Bollettino Ufficiale: Ancona, Italy, 2000. [Google Scholar]
- Doglioni, F.; Moretti, A.; Petrini, V. Le Chiese e il Terremoto; Lint Ed.: Trieste, Italy, 1994; ISBN 888-617-936-7. [Google Scholar]
- Lagomarsino, S. Damage assessment of churches after L’Aquila earthquake (2012). Bull. Earthq. Eng. 2012, 10, 73–92. [Google Scholar] [CrossRef]
- D’ Ayala, D.; Speranza, E. Definition of collapse mechanisms and seismic vulnerability of historic masonry buildings. Earthq. Spectra 2003, 19, 479–509. [Google Scholar] [CrossRef]
- Cattari, S.; Degli Abbati, S.; Ferretti, D.; Lagomarsino, S.; Ottonelli, D.; Tralli, A. Damage assessment of fortresses after the 2012 Emilia earthquake (Italy). Bull. Earthq. Eng. 2014, 12, 2333–2365. [Google Scholar] [CrossRef]
- Coïsson, E.; Ferretti, D.; Lenticchia, E. Analysis of damage mechanisms suffered by Italian fortified buildings hit by earthquakes in the last 40 years. Bull. Earthq. Eng. 2017, 15, 5139–5166. [Google Scholar] [CrossRef]
- Zanazzi, E. Fortezze Fragili: Dall’analisi del Dissesto a Strategie per la sua Prevenzione; Quasar: Rome, Italy, 2023; pp. 1–243. ISBN 978-88-5491-433-9. [Google Scholar]
- Della Torre, S. Italian perspective on the planned preventive conservation of architectural heritage. Front. Archit. Res. 2021, 10, 108–116. [Google Scholar] [CrossRef]
- Decreto-Legge. n. 42—22/01/2004. Codice dei Beni Culturali e del Paesaggio; In Gazzetta Ufficiale n.45—24/02/2004: Rome, Italy, 2004. Available online: https://www.gazzettaufficiale.it/atto/serie_generale/caricaDettaglioAtto/originario?atto.dataPubblicazioneGazzetta=2004-02-24&atto.codiceRedazionale=004G0066 (accessed on 26 April 2025).
- WebGIS del Patrimonio Culturale—Emilia Romagna. Available online: https://www.patrimonioculturale-er.it/webgis/ (accessed on 17 September 2024).
- Sigec Web. Available online: https://www.catalogo.beniculturali.it/ (accessed on 28 April 2025).
- Coïsson, E.; Ferretti, D.; Lenticchia, E.; Zanazzi, E. GIS Methodologies for the Management of Seismic Risk and the Damage Prevention on Masonry-Built Heritage. In Proceedings of the International Conference on Structural Analysis of Historical Constructions, Kyoto, Japan, 11–13 September 2023; pp. 1169–1180. [Google Scholar] [CrossRef]
- Leggieri, V.; Mastrodonato, G.; Uva, G. GIS Multisource Data for the Seismic Vulnerability Assessment of Buildings at the Urban Scale. Buildings 2022, 12, 523. [Google Scholar] [CrossRef]
- Cara, S.; Aprile, A.; Pelà, L.; Roca, P. Seismic Risk Assessment and Mitigation at Emergency Limit Condition of Historical Buildings along Strategic Urban Roadways. Application to the “Antiga Esquerra de L’Eixample” Neighborhood of Barcelona. Int. J. Archit. Herit. 2018, 12, 1055–1075. [Google Scholar] [CrossRef]
- Ferreira, T.M.; Vicente, R.; Mendes Da Silva, J.A.R.; Varum, H.; Costa, A. Seismic vulnerability assessment of historical urban centres: Case study of the old city centre in Seixal, Portugal. Bull. Earthq. Eng. 2013, 11, 1753–1773. [Google Scholar] [CrossRef]
- Lenticchia, E.; Coïsson, E. The use of GIS for the application of the phenomenological approach to the seismic risk analysis: The case of the Italian fortified architecture. ISPRS Arch. 2017, 42, 39–46. [Google Scholar] [CrossRef]
- Coïsson, E.; Ferretti, D.; Lenticchia, E. Italian castles and earthquakes: A GIS for knowledge and preservation. In Proceedings of the 10th International Conference on Structural Analysis of Historical Constructions SAHC, Leuven, Belgium, 13–15 September 2016; pp. 1489–1496, ISBN 978-131-561-699-5. [Google Scholar]
- MiC. Risk Map. Available online: http://www.cartadelrischio.beniculturali.it/ (accessed on 28 April 2025).
- ShakeMap Archive. Available online: https://shakemap.ingv.it/ (accessed on 17 September 2024).
- Lagomarsino, S. On the vulnerability assessment of monumental buildings. Bull. Earthq. Eng. 2006, 4, 445–463. [Google Scholar] [CrossRef]
- Lagomarsino, S.; Cattari, S.; Ottonelli, D. The heuristic vulnerability model: Fragility curves for masonry buildings. Bull. Earthq. Eng. 2021, 19, 3129–3163. [Google Scholar] [CrossRef]
- Marotta, A.; Liberatore, D.; Sorrentino, L. Development of parametric seismic fragility curves for historical churches. Bull. Earthq. Eng. 2021, 19, 5609–5641. [Google Scholar] [CrossRef]
- Del Gaudio, C.; De Martino, G.; Di Ludovico, M.; Manfredi, G.; Prota, A.; Ricci, P.; Verderame, G.M. Empirical fragility curves for masonry buildings after the 2009 L’Aquila, Italy, earthquake. Bull. Earthq. Eng. 2019, 17, 6301–6330. [Google Scholar] [CrossRef]
- INGV. Seismic Zone. Available online: http://zonesismiche.mi.ingv.it/ (accessed on 2 March 2025).
- Cassi Ramelli, A. Dalle Caverne ai Rifugi Blindati; Nuova Accademia Editrice: Milan, Italy, 1964; ISBN 978-888-082-232-5. [Google Scholar]
- Perogalli, C. Castelli e Rocche di Emilia e Romagna; Seregorlich: Milan, Italy, 1972; ISBN 978-884-025-659-7. [Google Scholar]
- Karataş, L.; Ateş, T.; Alptekin, A.; Dal M Yakar, M. A systematic method for post-earthquake damage assessment: Case study of the Antep Castle, Türkiye. Adv. Eng. Sci. 2023, 3, 62–71. [Google Scholar]
- Ferretti, D.; Coïsson, E.; Lenticchia, E. Seismic damage on merlons in masonry fortified buildings: A parametric analysis for overturning mechanism. Eng. Struct. 2018, 177, 117–132. [Google Scholar] [CrossRef]
- Grünthal, G. European Macroseismic Scale 1998: EMS-98. European Seismological Commission; Subcommission on Engineering Seismology: Luxembourg, 1998; p. 15. ISBN 2-87977-008-4. [Google Scholar]
- Baggio, C.; Bernardini, A.; Colozza, R.; Corazza, L.; Della Bella, M.; Di Pasquale, G. Field Manual for post-earthquake damage and safety assessment and short term countermeasures (AeDES). In JRC Sci Thechnical Reports; European Commission: Luxembourg, 2007. [Google Scholar]
- DPCM. 23/02/2006. In Approvazione dei Modelli per il Rilevamento dei Danni, a Seguito di Eventi Calamitosi, ai Beni Appartenenti al Patrimonio Culturale; In Gazzetta Ufficiale n.55—07/03/2006: Rome, Italy, 2006. Available online: https://www.gazzettaufficiale.it/eli/id/2006/03/07/06A02214/sg (accessed on 26 April 2025).
- OPCM, n. 3519—28/04/2006. Criteri Generali per L’individuazione Delle Zone Sismiche e per la Formazione e L’aggiornamento Degli Elenchi Delle Medesime Zone; In Gazzetta Ufficiale n.108—11/05/2006: Rome, Italy, 2006. Available online: https://www.gazzettaufficiale.it/eli/id/2006/05/11/06A04427/sg (accessed on 26 April 2025).
- ISTAT. Confini Delle Unità Amministrative a Fini Statistici al 1° Gennaio 2022. Available online: https://www.istat.it/it/archivio/222527 (accessed on 17 September 2024).
- Michelini, A.; Faenza, L.; Lauciani, V.; Malagnini, L. ShakeMap implementation in Italy. Seismol. Res. Lett. 2008, 79, 688–697. [Google Scholar] [CrossRef]
- Rosti, A.; Rota, M.; Magenes, G.; Penna, A. A procedure for seismic risk assessment of Italian masonry buildings. In Proceedings of the 7th International Conference on Computational Methods in Structural Dynamics and Earthquake Engineering, Crete, Greece, 24–26 June 2019; pp. 1653–1663. [Google Scholar] [CrossRef]
- Sisti, R.; Argiento, L.; Casapulla, C.; Ceroni, F.; Prota, A. Empirical fragility curves for macro-elements and single mechanisms of churches damaged during the 2016-2017 Central Italy seismic sequence. Procedia Struct. Integr. 2023, 44, 1380–1387. [Google Scholar] [CrossRef]
- Sisti, R.; Argiento, L.U.; Ceroni, F.; da Porto, F.; Prota, A.; Casapulla, C. Empirical fragility curves for masonry churches and their macro-elements using a large database: Proposal of a new likelihood function. Structures 2023, 57, 105164. [Google Scholar] [CrossRef]
- Baker, J.W. Efficient analytical fragility function fitting using dynamic structural analysis. Earthq Spectra 2015, 31, 579–599. [Google Scholar] [CrossRef]
- Porter, K. A Beginner’s Guide to Earthquake Fragility Vulnerability and Risk. Encycl. Earthq. Eng. 2015, 235–260. [Google Scholar] [CrossRef]
- Office of the United Nations Disaster Relief Coordinator. Natural Disasters Vulnerability and Analysis; Report of Experts Group Meeting; Office of the United Nations Disaster Relief Coordinator: Geneve, Swiss, 1980. [Google Scholar]
- Romeo, R.; Paciello, A.; Rinaldis, D. Seismic hazard maps of Italy including site effects. Soil Dyn. Earthq. Eng. 2000, 20, 85–92. [Google Scholar] [CrossRef]
- Crowley, H.; Colombi, M.; Borzi, B.; Faravelli, M.; Onida, M.; Lopez, M. A comparison of seismic risk maps for Italy. Bull. Earthq. Eng. 2009, 7, 149–180. [Google Scholar] [CrossRef]
- Falcone, G.; Mendicelli, A.; Mori, F.; Fabozzi, S.; Moscatelli, M.; Occhipinti, G.; Peronace, E. A simplified analysis of the total seismic hazard in Italy. Eng. Geol. 2020, 267, 105511. [Google Scholar] [CrossRef]
- Urbani, G. Intorno al Restauro, 2nd ed.; Skira: Milan, Italy, 2000; ISBN 978-888-118-512-2. [Google Scholar]
- Della Torre, S. A coevolutionary approach as the theoretical foundation of planned conservation of built cultural heritage. In Preventive Conservation-From Climate and Damage Monitoring to a Systemic and Integrated Approach; Vandesande, A., Verstrynge, E., van Balen, K., Eds.; CRC Press: London, UK, 2020; pp. 11–18. ISBN 978-100-300-404-2. [Google Scholar]

| Name | Municipality | Province |
|---|---|---|
| Castle of Bentivoglio | Bentivoglio | Bologna |
| Galeazza Pepoli Castle | Crevalcore | Bologna |
| Castle of Manzoli | Minerbio | Bologna |
| Fortress of Minerbio | Minerbio | Bologna |
| Fortress | Pieve di Cento | Bologna |
| La Giovannina Castle | San Giovanni in Persiceto | Bologna |
| Fortress | Bondeno | Ferrara |
| Castle in S. Bianca di Bondeno | Bondeno | Ferrara |
| Fortress | Cento | Ferrara |
| Este Castle | Ferrara | Ferrara |
| Lambertini Castle | Poggio Renatico | Ferrara |
| Castle of the Pio Family | Carpi | Modena |
| Carobbio Castle | Finale Emilia | Modena |
| Este Castle | Finale Emilia | Modena |
| Pico Castle | Mirandola | Modena |
| Este Castle | San Felice | Modena |
| Campori Castle | Soliera | Modena |
| Guidotti Castle | Fabbrico | Reggio Emilia |
| Gonzaga Fortress | Novellara | Reggio Emilia |
| Castle | Reggiolo | Reggio Emilia |
| Este Castle | San Martino in Rio | Reggio Emilia |
| Date | UTC Time | Local Time | Latitude | Longitude | Magnitude |
|---|---|---|---|---|---|
| 20 May 2012 | 02:03:52 | 04:03:52 | 44.889 | 11.228 | 5.9 |
| 20 May 2012 | 02:07:31 | 04:07:31 | 44.863 | 11.370 | 5.1 |
| 20 May 2012 | 03:02:47 | 05:02:47 | 44.86 | 11.15 | 5.0 |
| 20 May 2012 | 13:18:02 | 15.18:02 | 44.831 | 11.490 | 5.1 |
| 29 May 2012 | 07:00:03 | 09:00:03 | 44.851 | 11.086 | 5.8 |
| 29 May 2012 | 08:25:51 | 10:25:57 | 44.86 | 10.95 | 5.0 |
| 29 May 2012 | 10:55:57 | 12:55:57 | 44.888 | 11.008 | 5.3 |
| 29 May 2012 | 11:00:25 | 13:00:25 | 44.879 | 10.947 | 5.2 |
| 3 June 2012 | 19:20:43 | 21:20:42 | 44.899 | 10.943 | 5.1 |
| Name of the Field | Description | Type | Consistency |
|---|---|---|---|
| Code | The primary key is an alphanumeric code that uniquely identifies the listed asset. This code is made up of the ISTAT code of the municipality, an underscore and a whole number identifying the asset. | Text (10) | |
| Province | The province where the listed asset is located. | Text (12) | |
| ID municipality | ISTAT code of the municipality where the listed asset is located | Number | Whole number consisting of 6 digits. |
| Municipality | The municipality where the listed asset is located. | Text (22) | |
| Palace | Presence or absence of the Palace component asset within the complex asset. | Text (3) | Domain: -YES -NO |
| Tower | The number of towers within the complex asset. In case of absence, enter the number 0. | Number | |
| Curtain Wall | Presence or absence of the Curtain Wall component asset within the complex asset. | Text (2) | Domain: -YES -NO |
| μ D2 | μ D3 | μ D4 | μ D5 | β | |
|---|---|---|---|---|---|
| Shear cracks in the main body of the tower | −2.2129 | −1.6209 | −0.5140 | 0.1969 | 1.1211 |
| Shear cracks in the upper part of the tower | −1.9282 | −1.2045 | −0.0007 | 0.5249 | 1.0240 |
| Merlons overturning | −1.8788 | −1.2315 | 1.3078 | ||
Disclaimer/Publisher’s Note: The statements, opinions and data contained in all publications are solely those of the individual author(s) and contributor(s) and not of MDPI and/or the editor(s). MDPI and/or the editor(s) disclaim responsibility for any injury to people or property resulting from any ideas, methods, instructions or products referred to in the content. |
© 2025 by the author. Licensee MDPI, Basel, Switzerland. This article is an open access article distributed under the terms and conditions of the Creative Commons Attribution (CC BY) license (https://creativecommons.org/licenses/by/4.0/).
Share and Cite
Zanazzi, E. A Proactive GIS Geo-Database for Castles Damaged by the 2012 Emilia Earthquake. Heritage 2025, 8, 156. https://doi.org/10.3390/heritage8050156
Zanazzi E. A Proactive GIS Geo-Database for Castles Damaged by the 2012 Emilia Earthquake. Heritage. 2025; 8(5):156. https://doi.org/10.3390/heritage8050156
Chicago/Turabian StyleZanazzi, Elena. 2025. "A Proactive GIS Geo-Database for Castles Damaged by the 2012 Emilia Earthquake" Heritage 8, no. 5: 156. https://doi.org/10.3390/heritage8050156
APA StyleZanazzi, E. (2025). A Proactive GIS Geo-Database for Castles Damaged by the 2012 Emilia Earthquake. Heritage, 8(5), 156. https://doi.org/10.3390/heritage8050156