
Determining Gold Thickness in Multilayer Samples by Measuring the Intensity Ratio of the Au-Lα/Fe-Kα X-Ray


 ,
, 
Abstract
1. Introduction
2. Materials and Methods
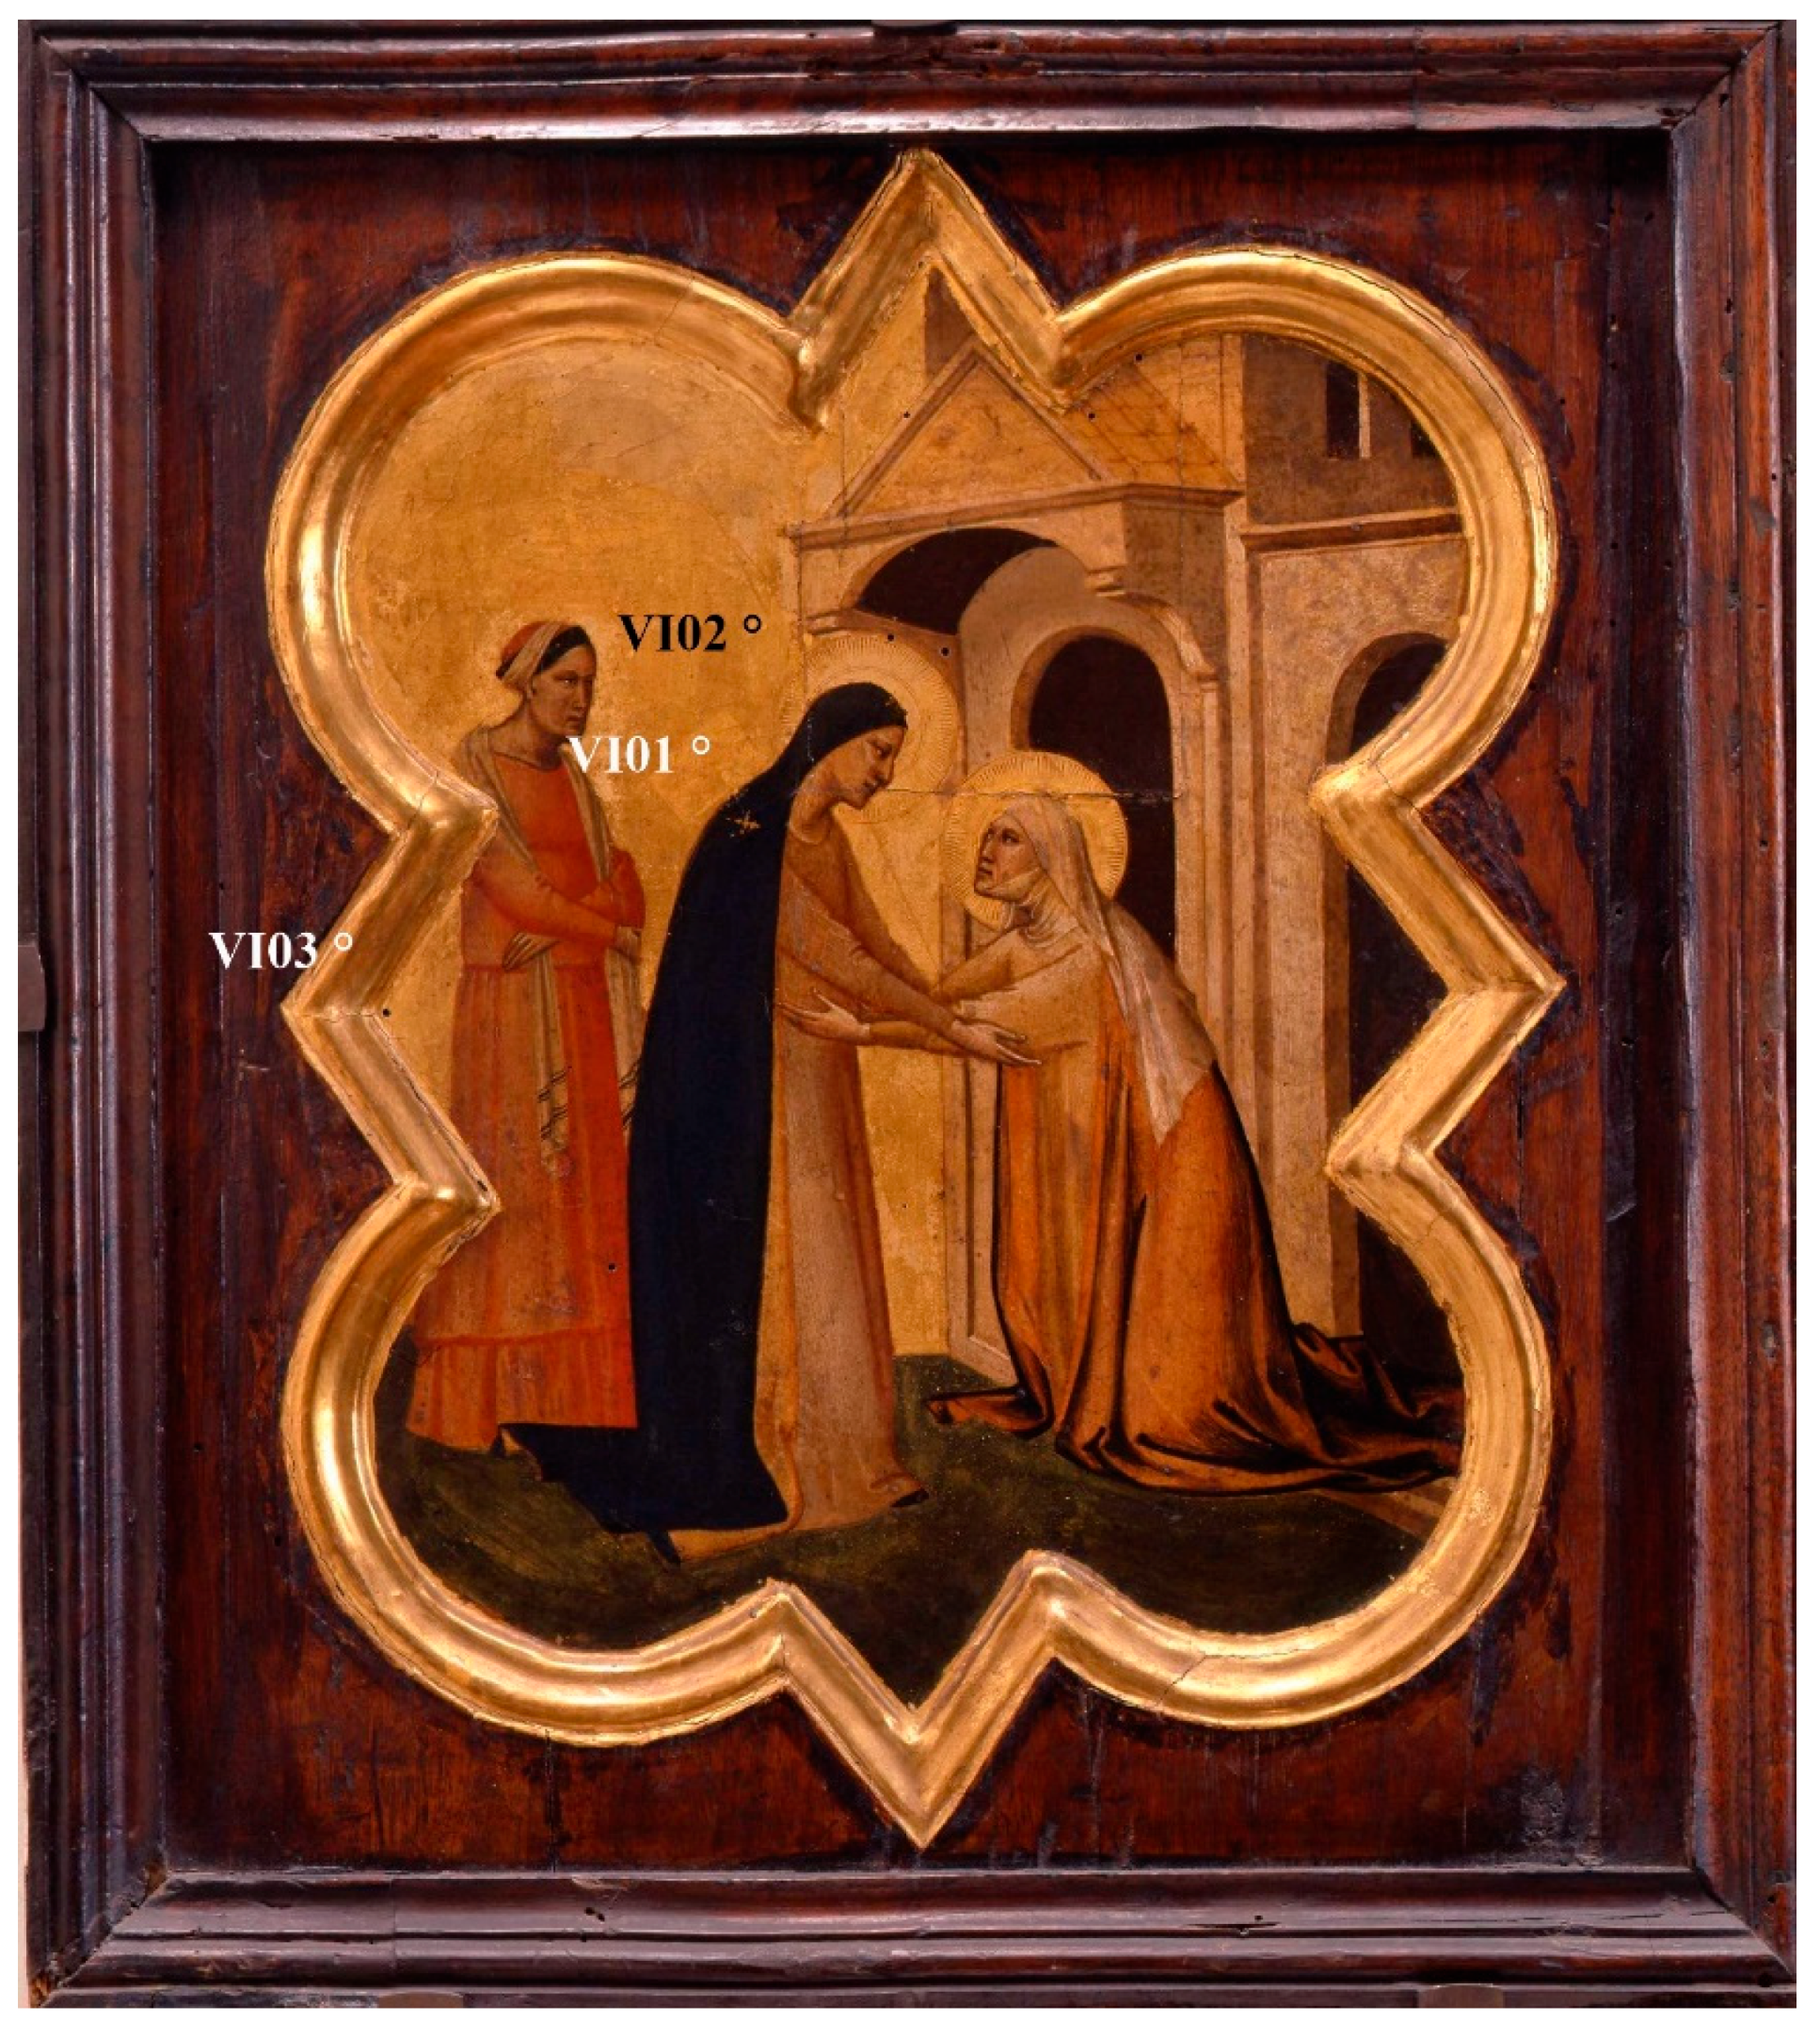
2.1. The “Formelle Dell’armadio Della Sacrestia di Santa Croce”
2.2. Instrument
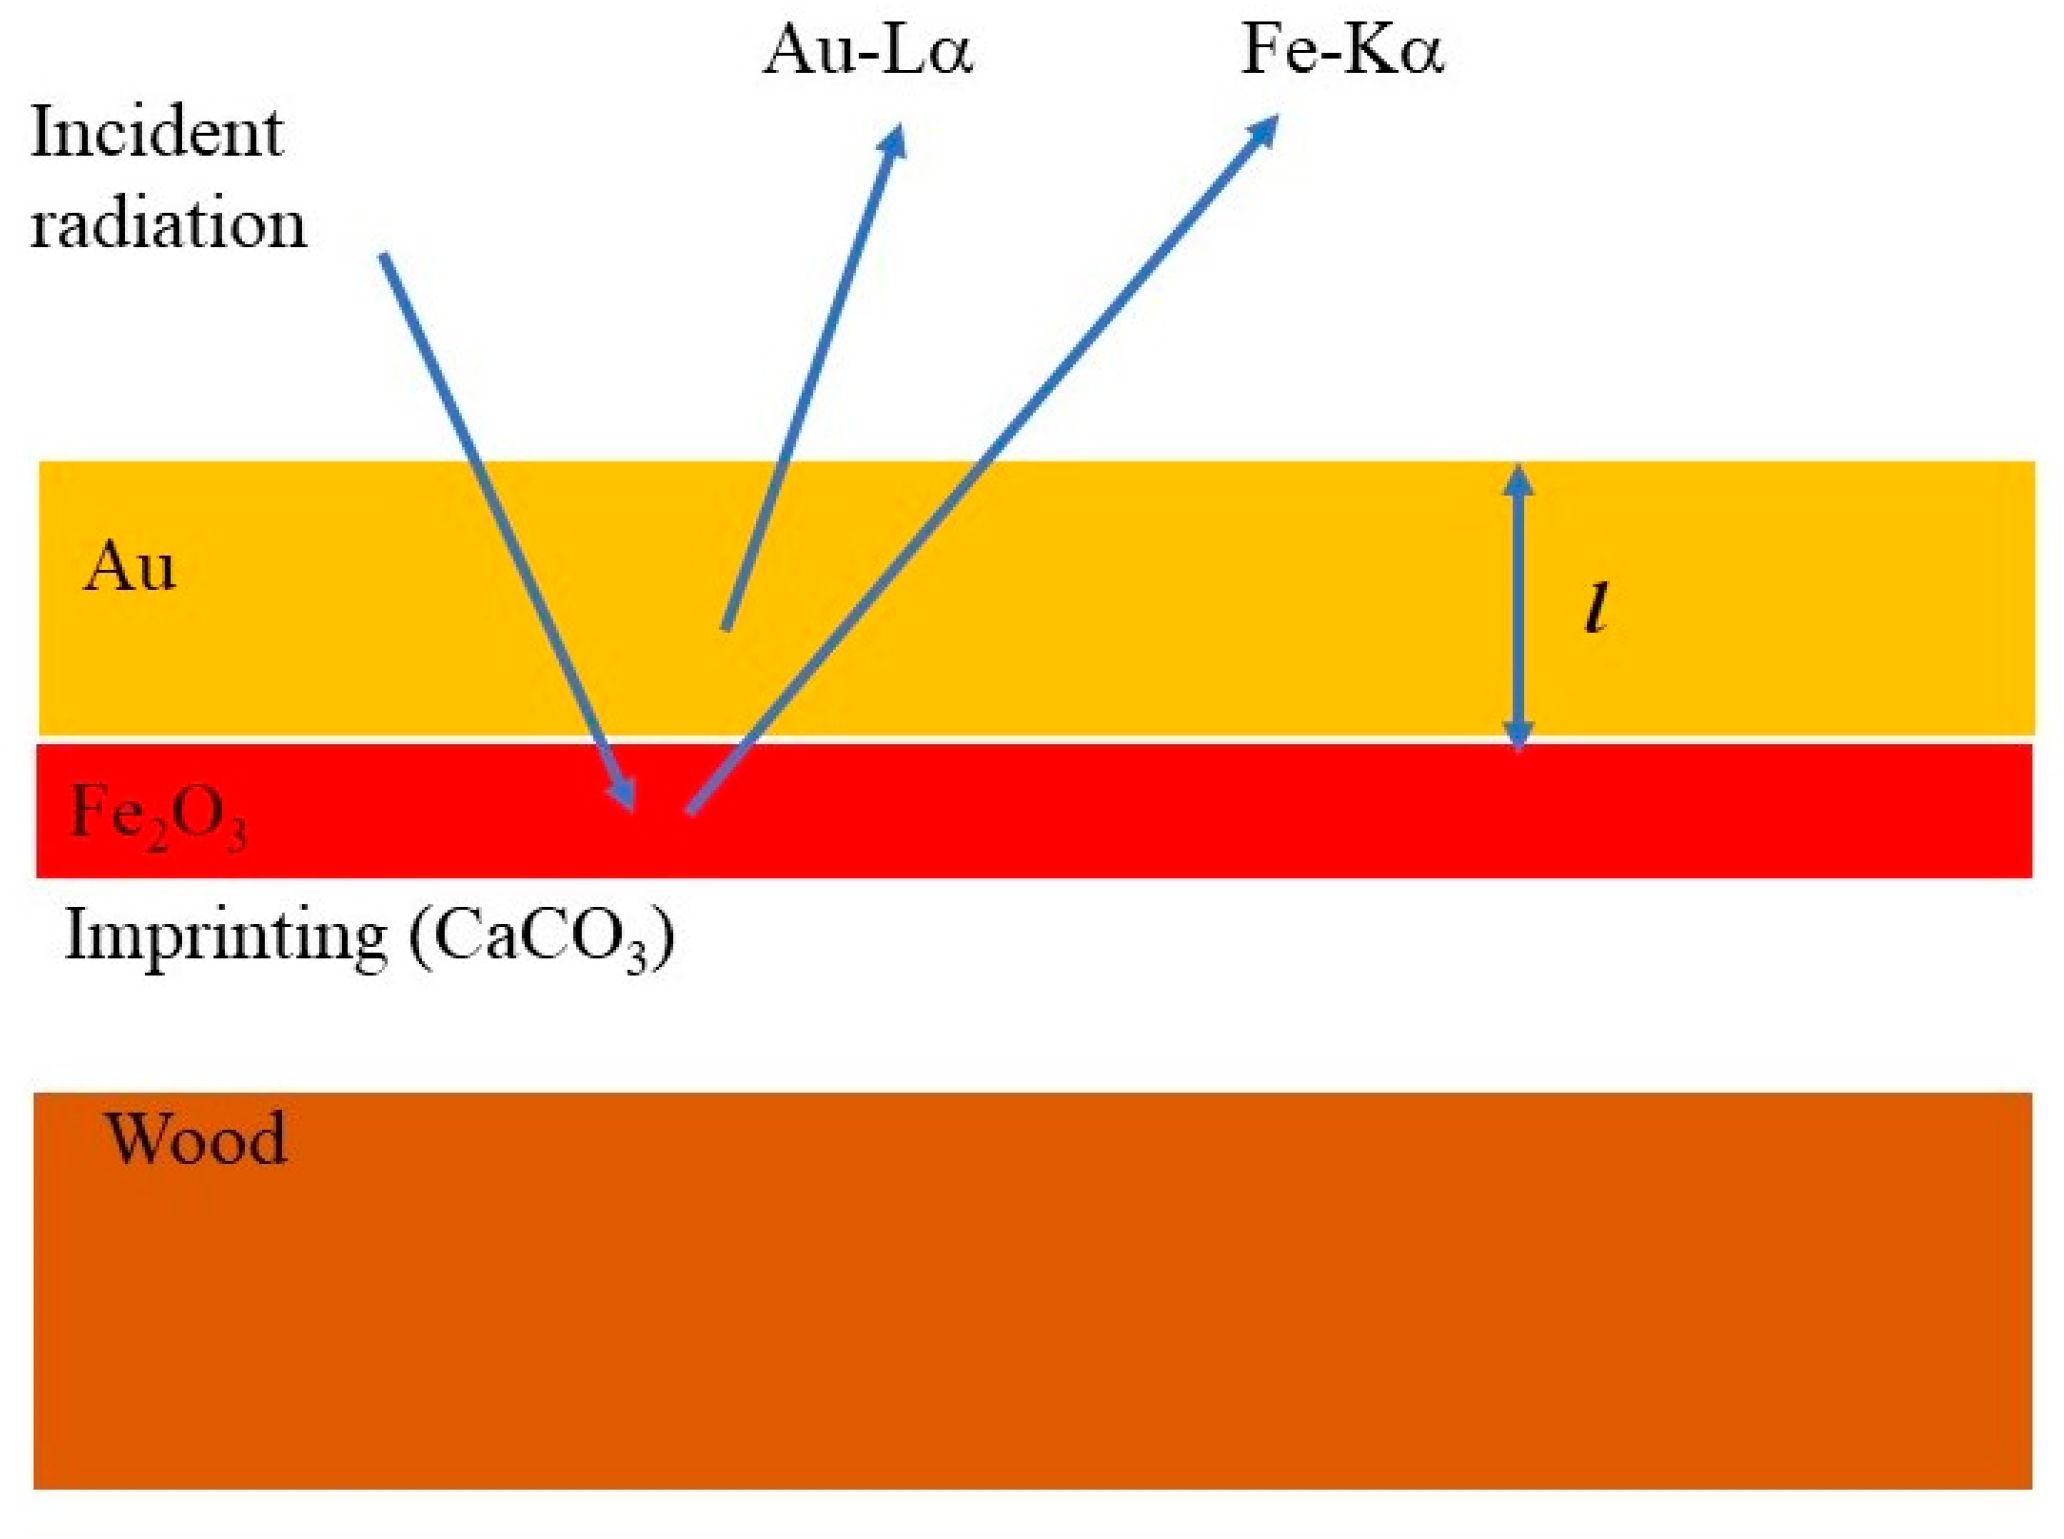
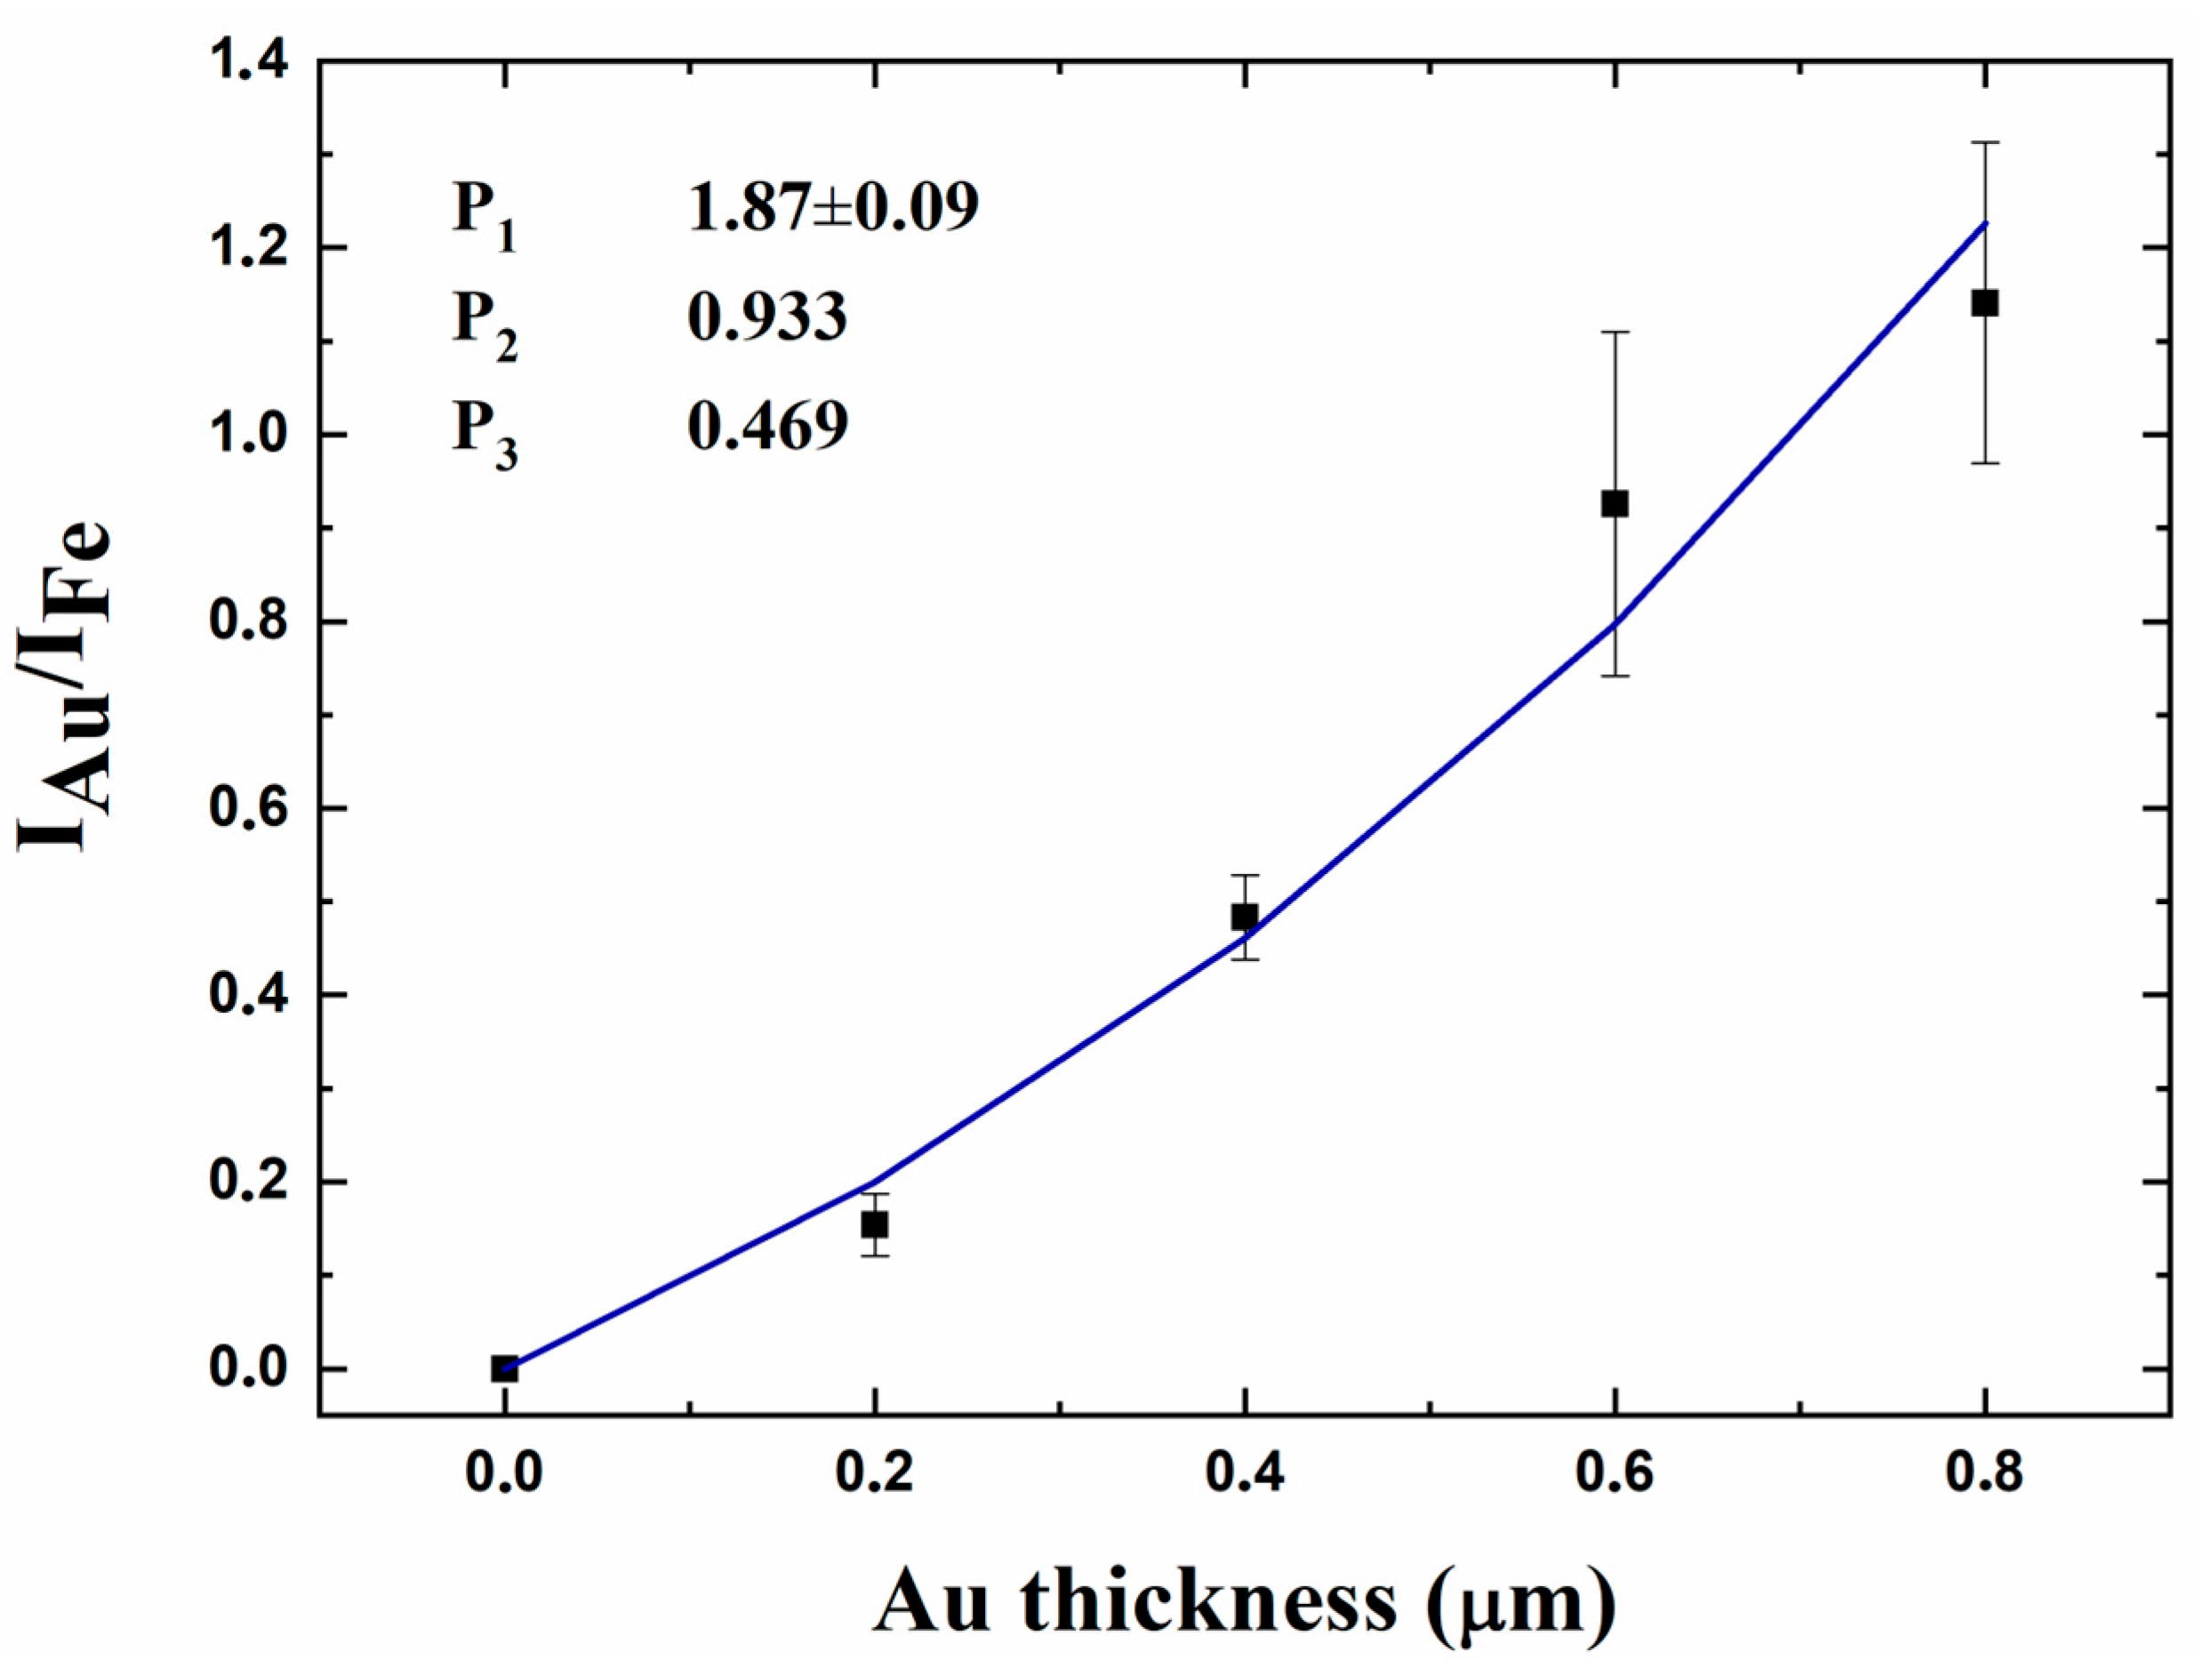
2.3. Determining the Thickness of the Gold
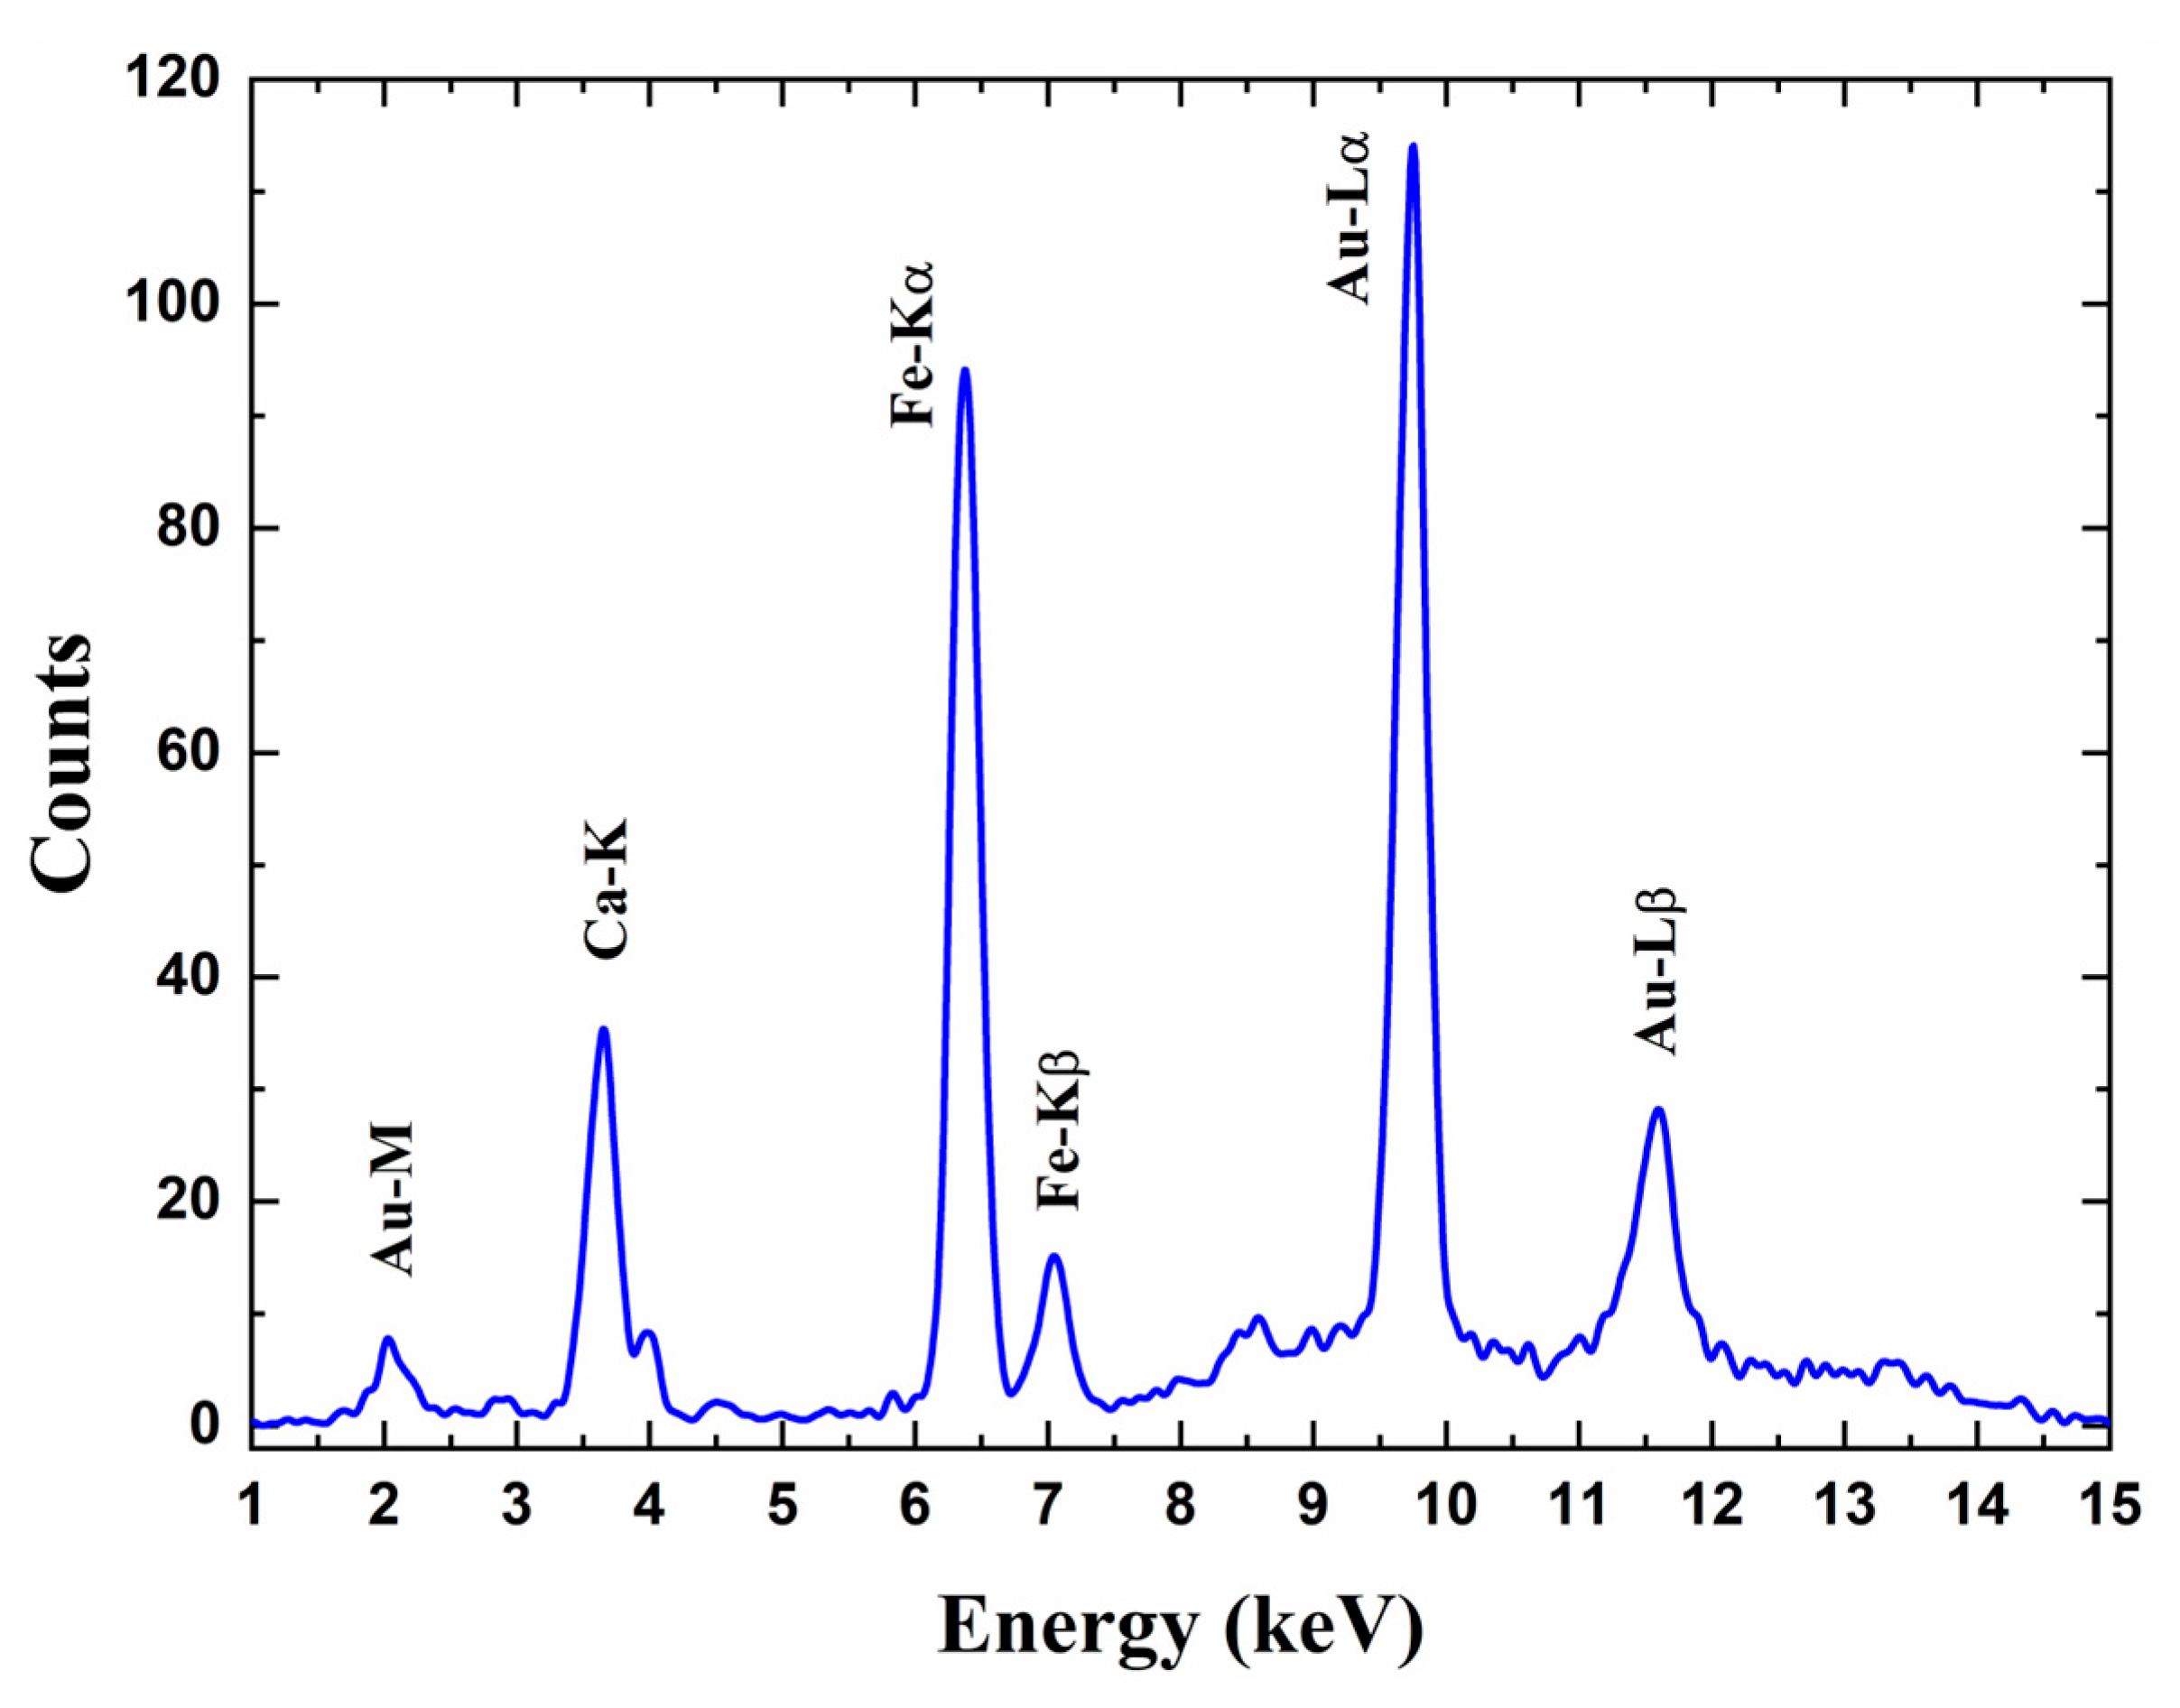
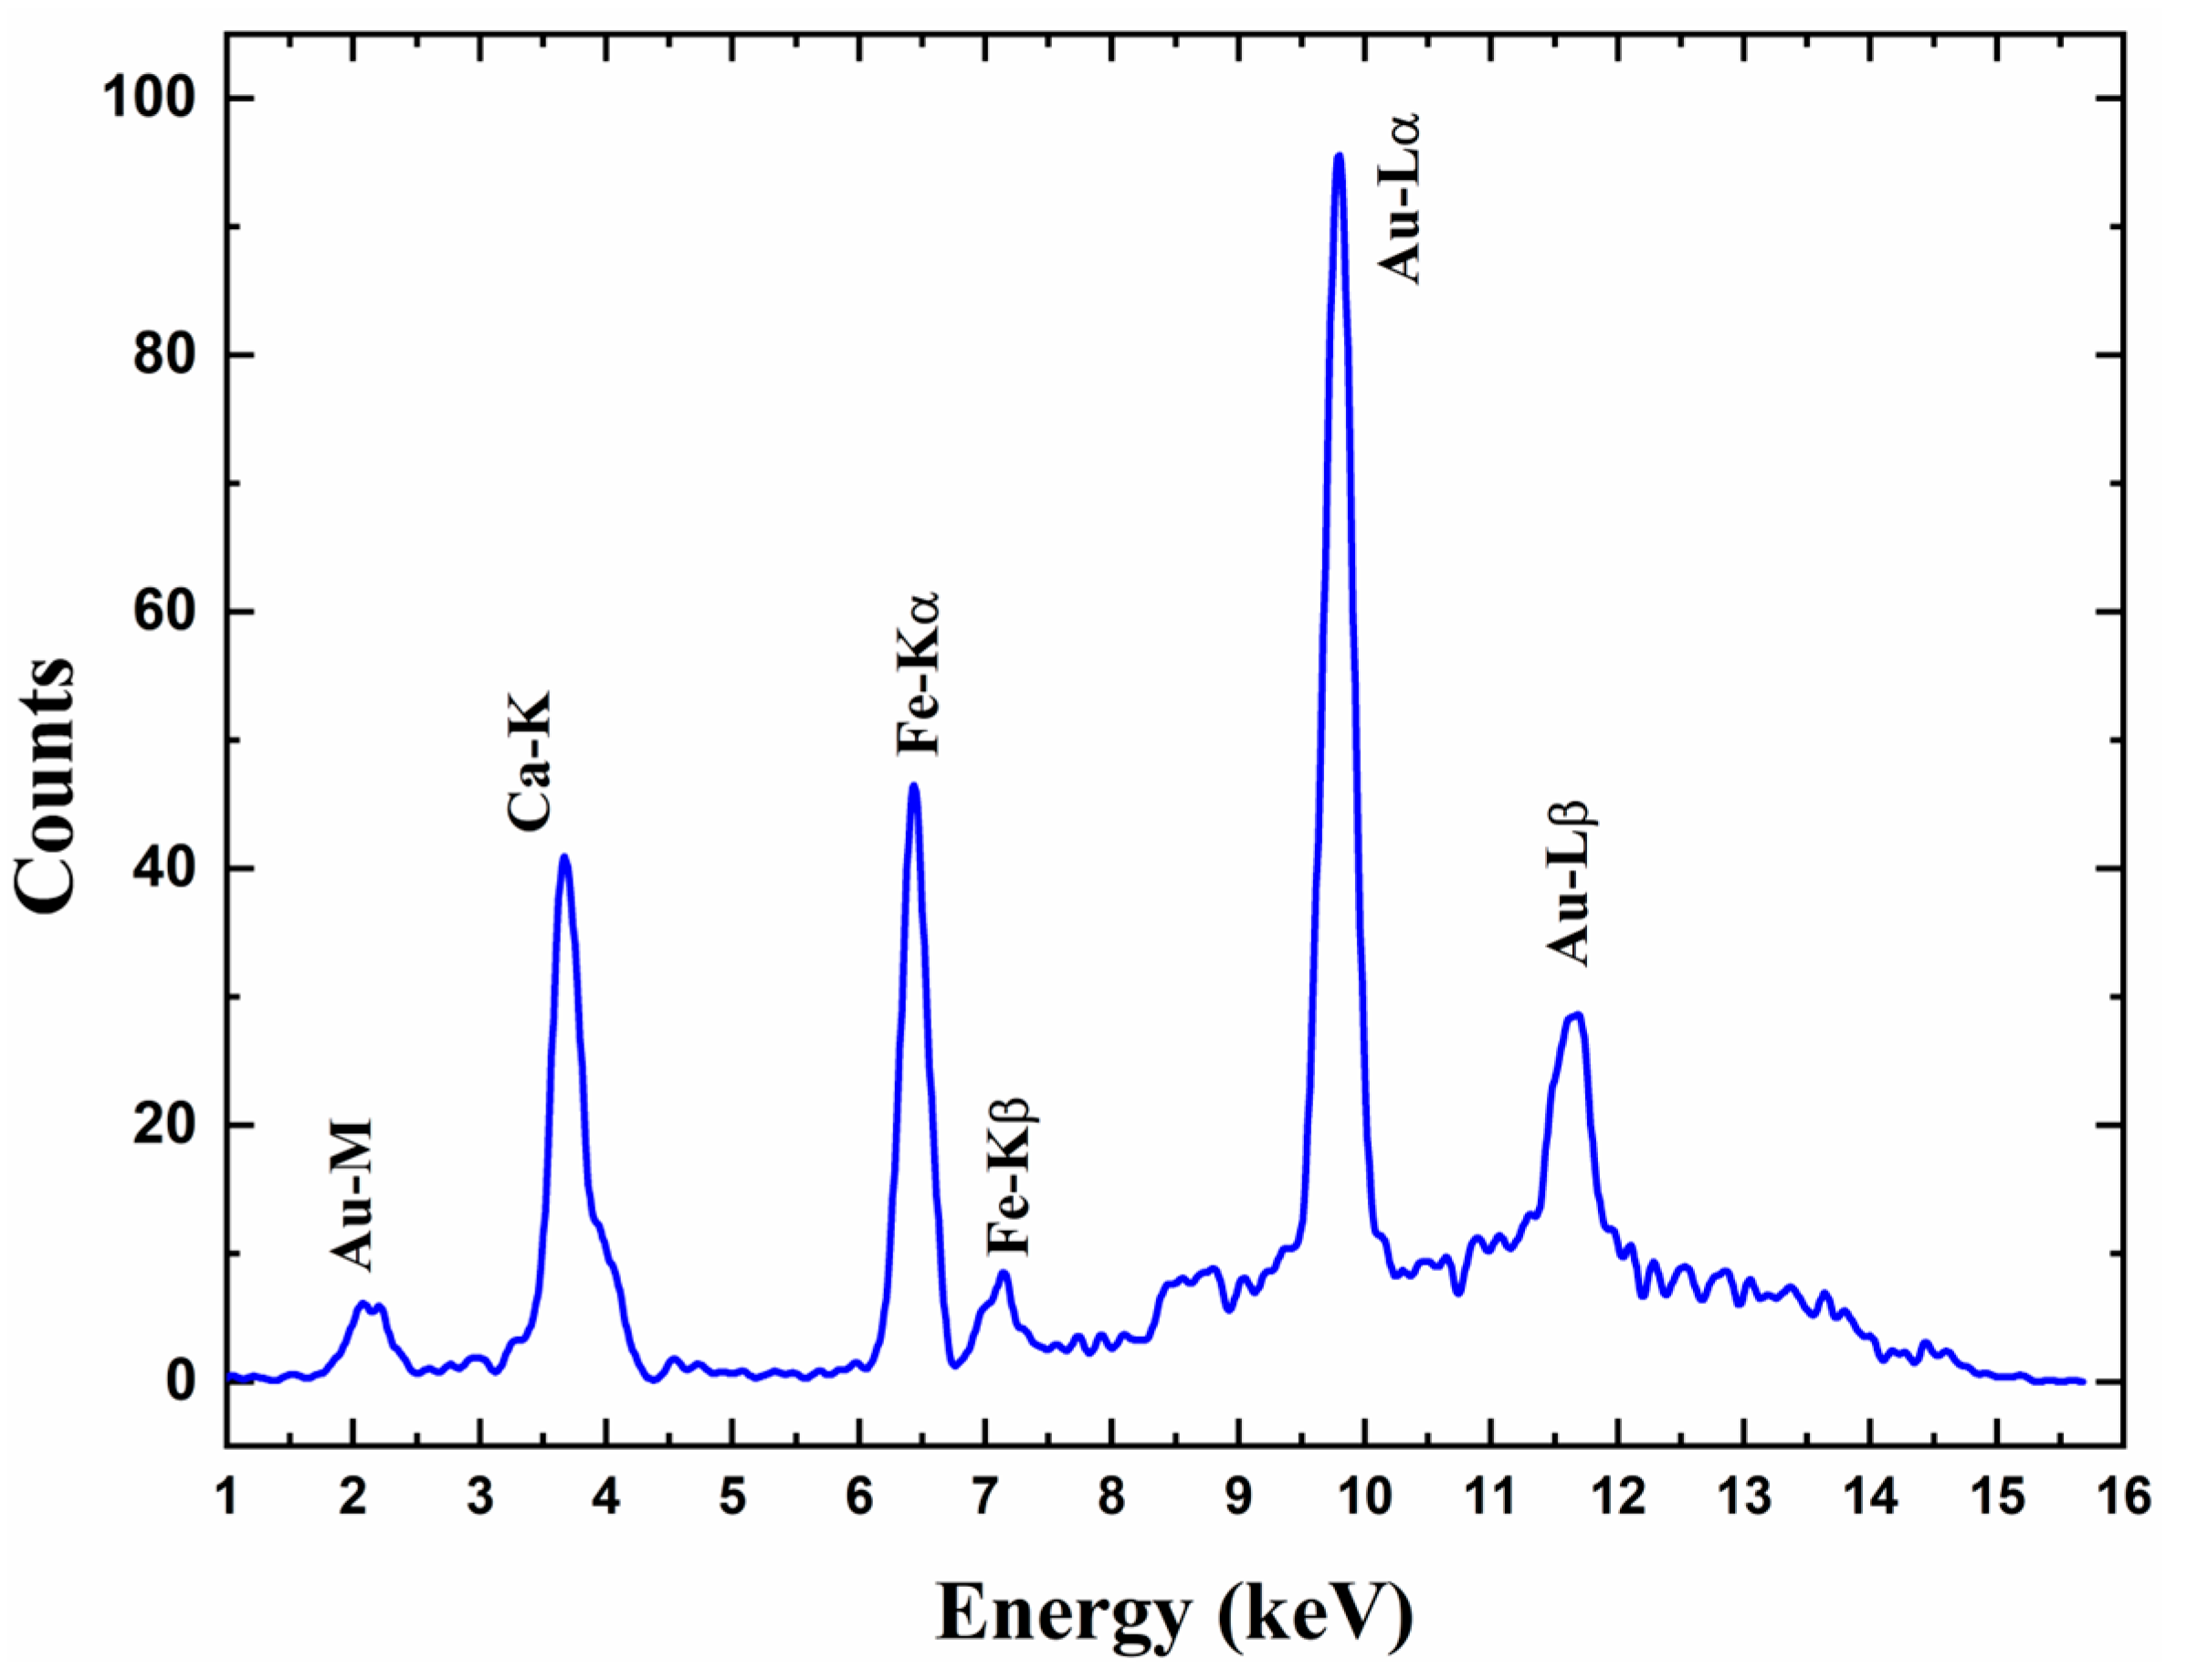
3. Results and Discussion
4. Conclusions
Author Contributions
Funding
Data Availability Statement
Acknowledgments
Conflicts of Interest
References
- Nazir, A.; Gokcekaya, O.; Md Masum Billah, K.; Ertugrul, O.; Jiang, J.; Sun, J.; Hussain, S. Multi-Material Additive Manufacturing: A Systematic Review of Design, Properties, Applications, Challenges, and 3D Printing of Materials and Cellular Metamaterials. Mater. Des. 2023, 226, 111661. [Google Scholar] [CrossRef]
- Dhez, P.; Weisbuch, C. Physics, Fabrication, and Applications of Multilayered Structures; Springer: Boston, MA, USA, 1988; p. 337. ISBN 978-1-4757-0093-0. [Google Scholar]
- Brocchieri, J.; Sabbarese, C. Coating Thickness of Plated Objects Using XRF Technique Concentrations. Il Nuovo Cimento C 2021, 43, 1–9. [Google Scholar] [CrossRef]
- Scott, D.A.; Dodd, L.S. Examination, Conservation and Analysis of a Gilded Egyptian Bronze Osiris. J. Cult. Herit. 2002, 3, 333–345. [Google Scholar] [CrossRef]
- Manfredda, N.; Buscaglia, P.; Gallo, P.; Borla, M.; Aicardi, S.; Poggi, G.; Baglioni, P.; Nervo, M.; Scalarone, D.; Borghi, A.; et al. An Ancient Egyptian Multilayered Polychrome Wooden Sculpture Belonging to the Museo Egizio of Torino: Characterization of Painting Materials and Design of Cleaning Processes by Means of Highly Retentive Hydrogels. Coatings 2021, 11, 1335. [Google Scholar] [CrossRef]
- Duran, A.; Perez-Rodríguez, J.L.; Jimenez De Haro, M.C.; Herrera, L.K.; Justo, A. Degradation of Gold and False Golds Used as Gildings in the Cultural Heritage of Andalusia, Spain. J. Cult. Herit. 2008, 9, 184–188. [Google Scholar] [CrossRef]
- Manca, R.; Chiarantini, L.; Tartaglia, E.; Soldovieri, F.; Miliani, C.; Catapano, I. Non-Invasive Characterization of Maiolica Layer Structure by Terahertz Time-Domain Imaging. Coatings 2023, 13, 1268. [Google Scholar] [CrossRef]
- Ricci, C.; Buscaglia, P.; Angelici, D.; Piccirillo, A.; Matteucci, E.; Demonte, D.; Tasso, V.; Sanna, N.; Zenucchini, F.; Croci, S.; et al. A Technical Study of Chinese Buddhist Sculptures: First Insights into a Complex History of Transformation through Analysis of the Polychrome Decoration. Coatings 2024, 14, 344. [Google Scholar] [CrossRef]
- Guerra, M.F.; Calligaro, T. Gold Cultural Heritage Objects: A Review of Studies of Provenance and Manufacturing Technologies. Meas. Sci. Technol. 2003, 14, 1527–1537. [Google Scholar] [CrossRef]
- Darque-Ceretti, E.; Felder, E.; Aucouturier, M. Gilding of Cultural Heritage Artefacts: An Elaborated Technology. Surf. Eng. 2013, 29, 146–152. [Google Scholar] [CrossRef]
- Tissot, I.; Troalen, L.G.; Manso, M.; Ponting, M.; Radtke, M.; Reinholz, U.; Barreiros, M.A.; Shaw, I.; Carvalho, M.L.; Guerra, M.F. A Multi-Analytical Approach to Gold in Ancient Egypt: Studies on Provenance and Corrosion. Spectrochim. Acta Part B At. Spectrosc. 2015, 108, 75–82. [Google Scholar] [CrossRef]
- Cennini, C.; Serchi, M. Il Libro dell’Arte, 1st ed.; F. Le Monnier: Firenze, Italy, 1991; 194p, ISBN 978-88-00-85999-8. [Google Scholar]
- Herringham, C.J.P. The Book of the Art of Cennino Cennini: A Contemporary Practical Treatise on Quattrocento Painting; George Allen & Unwin: London, UK, 1922; p. 334. [Google Scholar]
- Brocchieri, J.; Sabbarese, C. Thickness Determination of the Gilding on Brass Materials by XRF Technique. Nucl. Instrum. Methods Phys. Res. Sect. B Beam Interact. Mater. At. 2021, 496, 29–36. [Google Scholar] [CrossRef]
- Scialla, E.; Brocchieri, J.; Sabbarese, C. Comparison of Different Methodologies for Estimating Gold Thickness in Multilayer Samples Using XRF Spectra. Appl. Radiat. Isot. 2023, 191, 110517. [Google Scholar] [CrossRef] [PubMed]
- Pessanha, S.; Queralt, I.; Carvalho, M.L.; Sampaio, J.M. Determination of Gold Leaf Thickness Using X-Ray Fluorescence Spectrometry: Accuracy Comparison Using Analytical Methodology and Monte Carlo Simulations. Appl. Radiat. Isot. 2019, 152, 6–10. [Google Scholar] [CrossRef] [PubMed]
- Gójska, A.M.; Miśta-Jakubowska, E.A.; Kozioł, K.; Wasilewski, A.; Diduszko, R. The K-X-Ray Intensity Ratios as a Tool of Examination and Thickness Measurements of Coating Layers. Measurement 2024, 224, 113871. [Google Scholar] [CrossRef]
- Porcaro, M.; Cesareo, R.; Bustamante, A.; Brunetti, A. Characterization of an Ancient Bimetallic Alloy from Moche Civilization (Peru). Materials 2023, 16, 7211. [Google Scholar] [CrossRef]
- Lopes, F.; Melquiades, F.L.; Appoloni, C.R.; Cesareo, R.; Rizzutto, M.; Silva, T.F. Thickness Determination of Gold Layer on pre-Columbian Objects and a Gilding Frame, Combining pXRF and PLS Regression. X-Ray Spectrom. 2016, 45, 344–351. [Google Scholar] [CrossRef]
- Trojek, T.; Prokeš, R.; Šefců, R.; Bilavčíková, H.; Čechák, T. Confocal X-Ray Fluorescence Spectrometer for in-Situ Analyses of Paintings. Radiat. Phys. Chem. 2017, 137, 238–242. [Google Scholar] [CrossRef]
- Mori, K.; Hourai, T.; Matsuyama, T.; Zhuo, S.; Tsuji, K. Confocal Micro-X-Ray Fluorescence Analysis for Difference Identification of Ceramic Samples. Anal. Sci. 2024, 40, 367–373. [Google Scholar] [CrossRef]
- Fiorini, C.; Gianoncelli, A.; Longoni, A.; Zaraga, F. Determination of the Thickness of Coatings by Means of a New XRF Spectrometer. X-Ray Spectrom. 2002, 31, 92–99. [Google Scholar] [CrossRef]
- Orsilli, J.; Migliori, A.; Padilla-Alvarez, R.; Martini, M.; Galli, A. AR-XRF Measurements and Data Treatment for the Evaluation of Gilding Samples of Cultural Heritage. J. Anal. At. Spectrom. 2023, 38, 174–185. [Google Scholar] [CrossRef]
- Cesareo, R.; Rizzutto, M.A.; Brunetti, A.; Rao, D.V. Metal Location and Thickness in a Multilayered Sheet by Measuring Kα/Kβ, Lα/Lβ and Lα/Lγ X-Ray Ratios. Nucl. Instrum. Methods Phys. Res. Sect. B Beam Interact. Mater. At. 2009, 267, 2890–2896. [Google Scholar] [CrossRef]
- Ciarlo, L.; Chiari, M.; Galassi, M.C.; Ferretti, M.; Sideras-Haddad, E.; Zucchiatti, A.; Castagnotto, E. Practices and Rules of 16th Century Genoese Gilding: Exploring Gold Leaf Thickness and Caratage through X-Ray and Ion Beam Techniques. Heritage 2024, 7, 3630–3642. [Google Scholar] [CrossRef]
- Klic, L.; Nelson, J.K.; Pattuelli, M.C.; Provo, A. Florentine Renaissance Drawings: A Linked Catalog for the Semantic Web. Art Doc. J. Art Libr. Soc. N. Am. 2018, 37, 33–43. [Google Scholar] [CrossRef]
- Micheluzzi, G.M. Der Schlagschatten im Trecento am Beispiel von Taddeo Gaddis Verkündigung an die Hirten. Z. Lit. Linguist. 2015, 45, 98–120. [Google Scholar] [CrossRef]
- Buccolieri, A.; Castellano, A.; Degl’Innocenti, E.; Cesareo, R.; Casciaro, R.; Buccolieri, G. EDXRF Analysis of Gold Jewelry from the Archaeological Museum of Taranto, Italy. X-Ray Spectrom. 2017, 46, 421–426. [Google Scholar] [CrossRef]
- Cesareo, R.; De Assis, J.T.; Roldán, C.; Bustamante, A.D.; Brunetti, A.; Schiavon, N. Multilayered Samples Reconstructed by Measuring Kα/Kβ or Lα/Lβ X-Ray Intensity Ratios by EDXRF. Nucl. Instrum. Methods Phys. Res. Sect. B Beam Interact. Mater. At. 2013, 312, 15–22. [Google Scholar] [CrossRef]
- Cesareo, R.; Buccolieri, G.; Castellano, A.; Lopes, R.T.; De Assis, J.T.; Ridolfi, S.; Brunetti, A.; Bustamante, A. The Structure of Two-layered Objects Reconstructed Using EDXRF-analysis and Internal X-ray Ratios. X-Ray Spectrom. 2015, 44, 233–238. [Google Scholar] [CrossRef]
- Beckhoff, B.; Kanngießer, B.; Langhoff, N.; Wedell, R.; Wolff, H. Handbook of Practical X-Ray Fluorescence Analysis; Springer: Berlin/Heidelberg, Germany, 2006; p. 863. ISBN 978-3-540-28603-5. [Google Scholar]
- Seltzer, S. Tables of X-Ray Mass Attenuation Coefficients and Mass Energy-Absorption Coefficients, NIST Standard Reference Database 126 1995. Available online: http://physics.nist.gov/PhysRefData/XrayMassCoef/cover.html (accessed on 8 December 2024).


| Sample | Description | Gold Thickness (µm) |
|---|---|---|
| LNS_01 | Gold background. Upper part (original) | 0.47 ± 0.04 |
| LNS_02 | Gold background. Upper part (rectangular integration region) | 0.65 ± 0.06 |
| LNS_03 | Frame. Vertical side | 0.43 ± 0.04 |
| LNS_04 | Gold background. Under Christ’s feet. Probable overlay of gold | 1.00 ± 0.10 |
| LNS_04bis | Repeated measurement of the previous point | 1.00 ± 0.10 |
| LNS_05 | Gold background. To the right of LNS_04 (single leaf) | 0.56 ± 0.05 |
| LNS_06 | Gold background. To the left of LNS_04 (single leaf) | 0.69 ± 0.07 |
| LNS_07 | Gold background. In the upper right corner | 0.29 ± 0.03 |
| LND_01 | Gold background. Top area (overlapping of two leaves) | 0.75 ± 0.07 |
| LND_01bis | Repeated measurement of the previous point | 0.72 ± 0.07 |
| LND_02 | Gold background. Top part, left of the point LND_01 | 0.59 ± 0.06 |
| LND_03 | Gold background. Top part, right of the point LND_01 | 0.46 ± 0.04 |
| LND_04 | Gold background. Under the hand of the angel on the left | 0.46 ± 0.04 |
| LND_05 | Gold background. Above wings of the Archangel Gabriel (overlapping) | 0.84 ± 0.08 |
| LND_06 | Frame. Vertical side | 0.56 ± 0.05 |
| AM_01 | Gold background. Top left area. Height of the mountain (original) | 0.50 ± 0.05 |
| AM_02 | Gold background. On integration over the rift (restoration) | 0.75 ± 0.07 |
| AM_03 | Gold on frame. Top left area. Outermost edge | 0.38 ± 0.04 |
| AM_04 | Gold on frame. Top right area. Outermost edge | 0.33 ± 0.03 |
| AM_05 | Gold background. Child and Madonna’s hand (original) | 0.41 ± 0.04 |
| AD_01 | Gold background. Next to the Madonna (original) | 0.37 ± 0.04 |
| AD_02 | Gold background. On grouting under the roof of the hut | 0.39 ± 0.04 |
| AD_03 | Gold background. Top left area | 0.40 ± 0.04 |
| AD_04 | Frame. On left side cusp | 0.39 ± 0.04 |
| AA_01 | Gold background. Above the cusp (original) | 0.49 ± 0.05 |
| AA_02 | Gold background. Upper right area (original) | 0.45 ± 0.04 |
| AA_03 | Frame. Left area, bottom part | 0.46 ± 0.04 |
| AP_01 | Gold background. Right area (original) | 0.68 ± 0.06 |
| AP_02 | Gold background. Kneeling characters (restoration) | 0.72 ± 0.07 |
| AP_03 | Frame. Top left area. Lower area | 0.49 ± 0.05 |
| AP_04 | Gold background. Left area (original) | 0.59 ± 0.06 |
| AR_01 | Gold background. Left side area (original) | 0.60 ± 0.06 |
| AR_02 | Gold leaf. Square on the upper left side of the roof (restoration) | 0.73 ± 0.07 |
| AR_03 | Gold background. Right area (original) | 0.41 ± 0.04 |
| AR_04 | Frame. Upper right area | 0.45 ± 0.04 |
| AR_05 | Gold Leaf. Bottom square, left roof area (two leaves) | 0.94 ± 0.09 |
| BG_01 | Gold background. Right area (original) | 0.46 ± 0.04 |
| BG_02 | Gold background. Sideways to the dove (restoration) | 0.54 ± 0.05 |
| BG_03 | Gold background. Above ground (restoration) | 0.64 ± 0.06 |
| BG_04 | Gold background. Between Jesus and Saint John (original) | 0.47 ± 0.04 |
| BG_05 | Frame. Top left area | 0.38 ± 0.04 |
| CR_01 | Gold background. Top left area, next to the arm of the cross (original) | 0.50 ± 0.05 |
| CR_02 | Gold background. To the right of the cartouche (restoration) | 0.83 ± 0.08 |
| CR_03 | Frame. Top left area | 0.56 ± 0.05 |
| DD_01 | Gold background. Right side, right area (original) | 0.42 ± 0.04 |
| DD_02 | Gold background. Right side, left area (restoration) | 0.65 ± 0.06 |
| DD_03 | Gold halo. Madonna/Saint Joseph | 0.39 ± 0.04 |
| DD_04 | Frame. Top left area | 0.31 ± 0.03 |
| FG_01 | Gold background. Left area (original) | 0.43 ± 0.04 |
| FG_02 | Gold background. On the right near a woodworm hole (restoration) | 0.50 ± 0.05 |
| FG_03 | Gold background. Below angel at left near a woodworm (restoration) | 0.55 ± 0.05 |
| FG_03_bis | Repeated measurement of the previous point | 0.60 ± 0.06 |
| FG_04 | Frame. Cusp at the top | 0.71 ± 0.07 |
| FG_05 | Halo of Saint Francis among the angels near woodworm (restoration) | 0.72 ± 0.07 |
| MF_01 | Gold background. Central area under the hand (perhaps original) | 0.44 ± 0.04 |
| MF_02 | Frame. Top left area | 0.48 ± 0.05 |
| MF_03 | Gold background. Left area above the tower | 0.34 ± 0.03 |
| MF_04 | Gold background. At the top near an integrated square (restoration) | 0.66 ± 0.06 |
| MF_05 | Gold background. Very shiny lower central area | 0.44 ± 0.04 |
| PR_01 | Halo of the priest. Near the forehead (original) | 0.56 ± 0.05 |
| PR_02 | Halo of the priest. Woodworm hole integration sheet (restoration) | 0.61 ± 0.06 |
| PR_03 | Gold background. Top left area (original) | 0.46 ± 0.04 |
| PR_04 | Frame. On left side cusp | 0.54 ± 0.05 |
| IT_01 | Gold background. Right area (original) | 0.46 ± 0.04 |
| IT_02 | Halo. Figure behind Jesus. Woodworm hole (two leaves) | 0.87 ± 0.08 |
| IT_03 | Gold background. Top left area, shinier area (more leaves) | 1.22 ± 0.12 |
| IT_03bis | Repeated measurement of the previous point | 1.13 ± 0.11 |
| IT_04 | Gold background. Top left area, less shiny area (original) | 0.50 ± 0.05 |
| IT_05 | Frame. Top right area | 0.44 ± 0.04 |
| IT_06 | Gold background. Below the measuring area IT_03. Similar to IT_04 | 0.50 ± 0.05 |
| PO_01 | Gold background. Right area. Next to the woodworm hole | 0.50 ± 0.05 |
| PO_02 | Halo of Saint Francis | 0.55 ± 0.05 |
| PO_03 | Frame. Towards the centre, top right area | 0.48 ± 0.05 |
| PG_01 | Gold background. Left side (original) | 0.31 ± 0.03 |
| PG_02 | Gold background. Base of the plate on the left | 0.44 ± 0.04 |
| PG_03 | Gold background. Central cusp, perhaps area of the frame (two leaves) | 0.95 ± 0.09 |
| PG_04 | Frame. Top left area | 0.45 ± 0.04 |
| PG_05 | Gold background. On the right area, near a drip | 0.53 ± 0.05 |
| PG_06 | Gold background. Between the two spires at the top right (original) | 0.37 ± 0.04 |
| RC_01 | Gold background. To the right of the tree trunk | 0.55 ± 0.05 |
| RC_02 | Gold background. To the left of the lateral cusp | 0.57 ± 0.05 |
| RC_03 | Gold background. Left area near the mountain (two leaves) | 0.95 ± 0.09 |
| RC_04 | Frame. Right area | 0.46 ± 0.04 |
| FS_01 | Gold background. Central part above the trees (restoration) | 0.40 ± 0.04 |
| FS_02 | Gold background. Behind the Angel (original) | 0.45 ± 0.04 |
| FS_03 | Gold background. Right area (restoration) | 0.54 ± 0.05 |
| FS_04 | Frame | 0.48 ± 0.05 |
| FT_01 | Gold background. Central area under arm of Saint Francis (restoration) | 0.74 ± 0.07 |
| FT_02 | Gold background. Upper part (restoration) | 0.75 ± 0.07 |
| FT_03 | Frame. Top left area | 0.47 ± 0.04 |
| FF_01 | Gold background. High area, right side (original) | 0.33 ± 0.03 |
| FF_02 | Halo of Saint Francis. Restoration area (two leaves) | 0.86 ± 0.08 |
| FF_03 | Halo of Saint Francis. Original side | 0.41 ± 0.04 |
| FF_04 | Frame. Top left area | 0.39 ± 0.04 |
| TR_01 | Gold background. Top right area (original) | 0.45 ± 0.04 |
| TR_02 | Gold background. Top left area (perhaps restoration) | 0.52 ± 0.05 |
| TR_03 | Gold background. Upper left area, near the cusp (original) | 0.46 ± 0.04 |
| TR_04 | Halo of the character at the feet of Christ (original) | 0.51 ± 0.05 |
| TR_05 | Frame. Left side of the cusp | 0.44 ± 0.04 |
| UC_01 | Gold background. Top left area. Left area abraded (original) | 0.53 ± 0.05 |
| UC_02 | Gold background. Top left area. Right area less abraded (original) | 0.65 ± 0.06 |
| UC_03 | Gold background. Top right area (two leaves) | 0.96 ± 0.09 |
| UC_04 | Frame. Top right area | 0.36 ± 0.03 |
| VI_01 | Gold background. Above central character (two leaves) | 1.00 ± 0.10 |
| VI_02 | Gold background. Near the little temple (two leaves) | 0.89 ± 0.08 |
| VI_03 | Frame. Lower left area | 0.36 ± 0.03 |
| Determined Average Gold Thickness (µm) | Gold Thickness Referred to the Single Leaf (µm) | |
|---|---|---|
| Single leaf | 0.34 ± 0.03 | 0.34 ± 0.03 |
| Double leaf | 0.75 ± 0.05 | 0.38 ± 0.03 |
| Triple leaf | 1.17 ± 0.08 | 0.39 ± 0.03 |
Disclaimer/Publisher’s Note: The statements, opinions and data contained in all publications are solely those of the individual author(s) and contributor(s) and not of MDPI and/or the editor(s). MDPI and/or the editor(s) disclaim responsibility for any injury to people or property resulting from any ideas, methods, instructions or products referred to in the content. |
© 2025 by the authors. Licensee MDPI, Basel, Switzerland. This article is an open access article distributed under the terms and conditions of the Creative Commons Attribution (CC BY) license (https://creativecommons.org/licenses/by/4.0/).
Share and Cite
Buccolieri, G.; Cesareo, R.; Castellano, A.; Serra, A.; Paladini, F.; Buccolieri, A. Determining Gold Thickness in Multilayer Samples by Measuring the Intensity Ratio of the Au-Lα/Fe-Kα X-Ray. Heritage 2025, 8, 72. https://doi.org/10.3390/heritage8020072
Buccolieri G, Cesareo R, Castellano A, Serra A, Paladini F, Buccolieri A. Determining Gold Thickness in Multilayer Samples by Measuring the Intensity Ratio of the Au-Lα/Fe-Kα X-Ray. Heritage. 2025; 8(2):72. https://doi.org/10.3390/heritage8020072
Chicago/Turabian StyleBuccolieri, Giovanni, Roberto Cesareo, Alfredo Castellano, Antonio Serra, Fabio Paladini, and Alessandro Buccolieri. 2025. "Determining Gold Thickness in Multilayer Samples by Measuring the Intensity Ratio of the Au-Lα/Fe-Kα X-Ray" Heritage 8, no. 2: 72. https://doi.org/10.3390/heritage8020072
APA StyleBuccolieri, G., Cesareo, R., Castellano, A., Serra, A., Paladini, F., & Buccolieri, A. (2025). Determining Gold Thickness in Multilayer Samples by Measuring the Intensity Ratio of the Au-Lα/Fe-Kα X-Ray. Heritage, 8(2), 72. https://doi.org/10.3390/heritage8020072