Article

The Characterization of the Lower Town of the UNESCO Archaeological Site of Arslantepe (Malatya, Türkiye) Using the Geophysical E-PERTI Method (Extended Data-Adaptive Probability-Based Electrical Resistivity Tomography Inversion Method)

by
Francesca Balossi Restelli
1,
Marilena Cozzolino
2,
Federico Manuelli
3 and
Paolo Mauriello
2,*
1
Department of Ancient World Studies, Sapienza University of Rome, 00185 Roma, Italy
2
Department of Agricultural, Environmental and Food Sciences, University of Molise, 86100 Campobasso, Italy
3
Italian National Research Council, Institute of Heritage Science (ISPC), 80134 Napoli, Italy
*
Author to whom correspondence should be addressed.
Heritage 2025, 8(2), 37; https://doi.org/10.3390/heritage8020037
Submission received: 26 November 2024 / Revised: 17 January 2025 / Accepted: 20 January 2025 / Published: 22 January 2025

Abstract

:
The UNESCO site of Arslantepe is located in Eastern Anatolia in the Malatya Plain (Türkiye) about 10 km from the Euphrates River. Here for about a century archaeological excavations have been carried out, reconstructing a long sequence of human frequentation starting from 5000 years BC up to the Middle Ages. The settlement, one of the most important and largest in the region, has undergone numerous changes over time, resulting in a complex superposition of structures, palaces, temples, and burials concentrated on the hill. With the aim of extending the knowledge of the site, in 2022, geophysical surveys were carried out through the application of electrical resistivity tomography, covering a surface of approximately 4300 m2 in an unexplored area at the foot of the hill. In this paper, the Extended data-adaptive Probability-based Electrical Resistivity Tomography Inversion approach (E-PERTI), recently published as a development of the probability tomography imaging approach, has been applied to a large apparent resistivity field dataset, providing the best estimate of the most probable estimate of the resistivity distribution through an intrinsic linear regression model implementing standard least squares routines. The results seem to prove the effectiveness of the E-PERTI approach in noise dejection, enhancing associated resistivity highs that can be ascribable to the trace of a potential fortification. The obtained information represents new, unexpected data that open new frontiers of archaeological research, adding value to the knowledge of the site.

1. Introduction

Electrical resistivity tomography (ERT) is a noninvasive geophysical method used for the characterization of the subsoil in terms of electrical resistivity distribution with the aim of obtaining information about the location and geometry of targets buried in the subsoil through measurements carried out mainly from the surface. Over the years, different authors have shown the potentiality of the method in archaeological applications [1,2,3,4,5,6,7,8,9,10]. An apparent resistivity dataset (measured in Ohm*m, Ωm) is collected along a profile using a device consisting of two energizing electrodes that inject the current (measured in Ampere, A) into the soil and two potentiometric electrodes that measure the potential difference (measured in Volt, V) generated by the current input. Commonly, different parallel profiles are acquired in a grid in order to test the extent and dimensions of any buried target. Therefore, a three-dimensional dataset of the volume under the surveyed surface is gained, allowing the extraction of horizontal sections at various points after proper systematic processing. Additionally, through the solution of the inversion problem, the intrinsic resistivity values are estimated from the observed and collected apparent resistivity data.
The problem of resistivity inversion is a nonlinear, ill-posed, and underdetermined problem [11,12,13,14,15]. To develop a numerical model that fits the observed data, the finite difference [16,17] or finite element methods [18] are frequently employed. Due to their applicability and robustness, the Gauss–Newton least-squared inversion [19] and the Occam’s inversion [20,21] are among the most often applied methods. Iterative linear approaches to the nonlinear problem have been also proposed for 2D and 3D data processing [22,23,24,25,26] such as the smoothness-constrained least-squares inversion [23]. Other mathematical solutions have been defined for resistivity inversion by a number of authors using various methodologies [27,28,29,30,31,32].
To treat data acquired for archaeological purposes, the Extended data-adaptive Probability-based Electrical Resistivity Tomography Inversion (E-PERTI) [33] has been proposed in this study. It is an extension of the PERTI routine [34] that was developed from the resistivity probability tomography approach [35]. Here, it is applied to a large dataset acquired at the archaeological site of Arslantepe (Malatya, Türkiye). The focal goal of this study was the creation of a novel comprehensive plot of hidden archaeological structures in an unmapped and unexplored area located in the northern part of the site.
Arslantepe is a multi-stratified mound located in south-eastern Anatolia a few kilometers west of the Euphrates River and close to the modern city of Malatya (Figure 1).
The site lies 912 m above sea level at the southeastern edge of the Malatya Plain, a very fertile region rich in water sources and surrounded by the Taurus mountains. In the regional geological context, the investigated site, Arslantepe, is located in a fault-bounded extensional basin occupied by Neogenic alluvial and lacustrine deposits [36,37]. The superficial sediments (Pleistocene or Holocene) around the mound have been recently analyzed [38], documenting fluvial activity during the late glacial periods and frequently after the Roman period. Slope and soil erosion occurred in the early and mid–late Holocene and during the last 1000 years. The early Holocene erosion phases predate the start of settlement at the tell so far.
Since 1961, the site has been investigated with continuity by the Italian Archaeological Expedition in Eastern Anatolia (MAIAO) from Sapienza University of Rome, following the excavations by two French teams that took place in the 1930s and 1940s, respectively [39]. The mound has an oval shape and has an extent of about 4.5 ha with a 30 m thick archaeological deposit. The uninterrupted excavation activities allowed the reconstruction of a very detailed and continuous sequence that, supported by numerous sets of C14 dates, stretched from the late 5th millennium BCE to the Medieval period, even though the continuous and most substantial occupation was the one up to 712 BCE, when the site was destroyed by the Neo-Assyrian army. After this moment, the occupation in the plain moved nearer to the Euphrates River, where a roman military camp with the name of Melitene was established [40,41,42]. Besides being the most important excavated site in the region, Arslantepe is also commonly considered one of the most valuable sites for the comprehension of the processes of development that have affected the ancient civilizations of southwestern Asia. Indeed, discoveries of incomparable importance for the understanding of the formation of the first centralized states and societies have been made since the beginning of the 1970s, including the astonishing and unique remains of the renowned Late Chalcolithic palace that recently led to the site’s inclusion in the UNESCO World Heritage List [43,44].
However, only a few preliminary activities have so far been undertaken in the off-mound and catchment areas, in order to reconstruct a more comprehensive view of the site and its surrounding territory. The Archaeological Survey Project in the Malatya Plain, which was conducted from 2003 to 2007 in the territory immediately south of the Euphrates, also included an intensive field activity carried out in the 500 m surrounding the site that has shown a significant scarcity of surface material [45]. However, the low visibility due to both recent alluvial deposits and intensive and long-lasting modern horticulture should be taken into account.
In this perspective, geoarchaeological investigations, conducted between 2009 and 2011, have allowed the collection of coring soil samples from wells dug in the alluvial sediments northwest of Arslantepe that provided layers with pottery fragments and charcoals that mostly date to the Iron Age and Roman periods; these are at a varying depth well below today’s surface, confirming the presence of thick alluvium, which could have covered the ancient remains surrounding the mound [45,46].
A project investigating primarily cultural and natural heritage around Arslantepe to evaluate accurately the use, protection, conservation, and valorization of the site with its surroundings has been also carried out in the years 2017–2020 [46,47]. In the framework of that project and with the intent of creating the “Arslantepe Archaeological Park”, the existence of different degrees of protection to contain the increasing rate of urbanization around the mound has been ratified. This brought to realization, between 2019 and 2020, a first round of large-scale magnetic prospections and widely spaced electrical resistivity profiles, which revealed the presence of high magnetic anomalies all around the mound and particularly at the bottom of its northern slopes.

2. Methodology

Following the premises, during the 2022 and 2023 excavation seasons, a wider geophysical prospection was conducted at the bottom of the mound, where the prospections of 2019 and 2020 revealed the highest resistive anomalies, with the intention to set up a clearer picture of some of the potential buried remains.
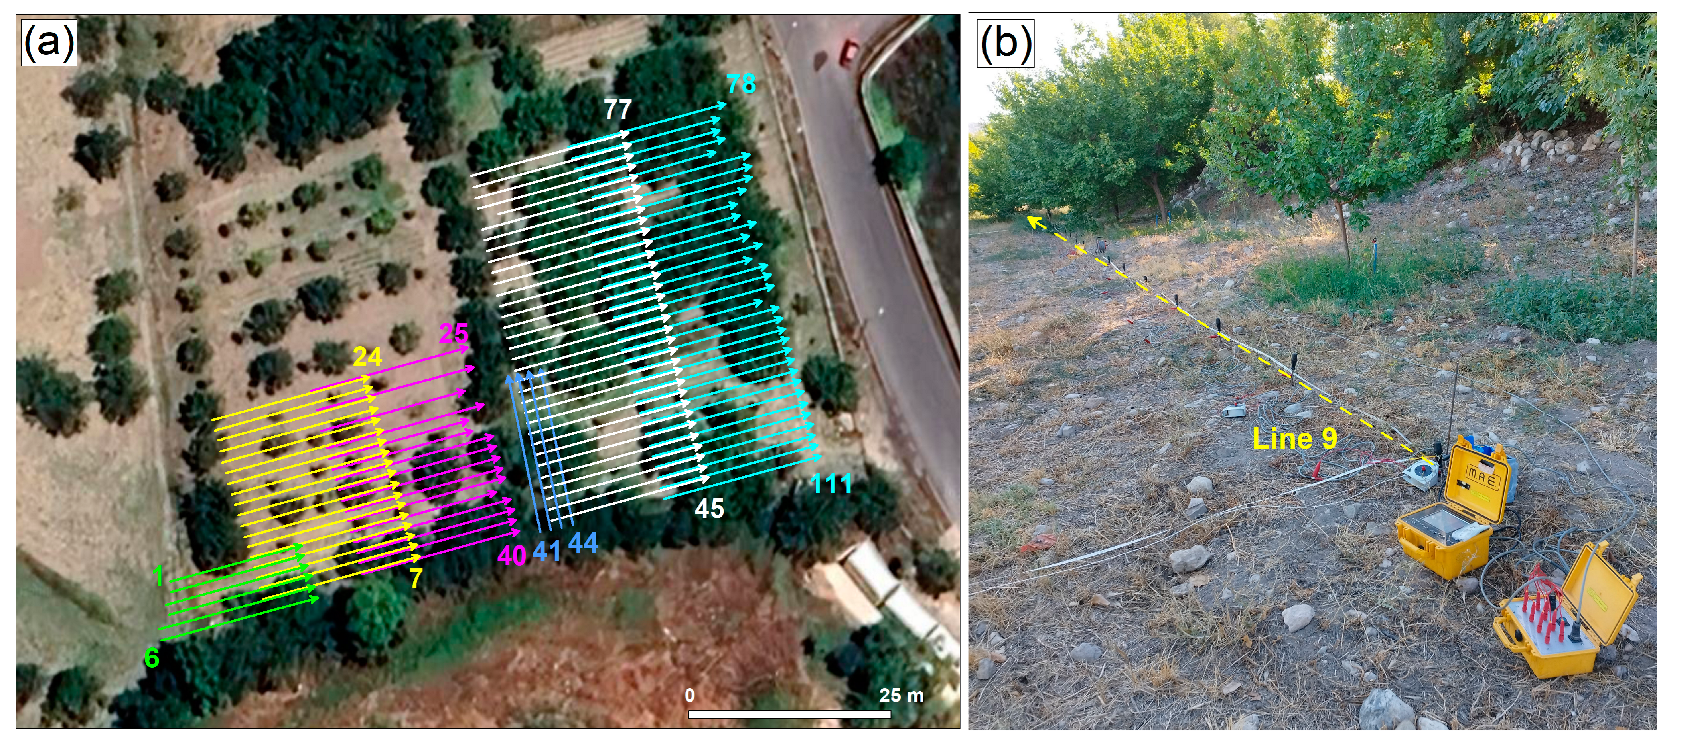
Geophysical surveys were performed on an area extending from the bottom of the northern slopes of the hill to cover a surface of approximately 4.300 m2 (Figure 1), and 111 profiles were arranged as in Figure 2a. The grid was georeferenced using a total station connected to absolute fiducial points. Since the surface was flat, the elevation changes were minimal and were ignored in the processing, although the algorithm is able to perform topography correction in the case of rough surfaces.
The ERT survey was carried out using a dipole–dipole (DD) electrode configuration as this is more sensitive to surface inhomogeneities and capable of obtaining the lateral localization of anomaly sources [48]. In each set of parallel profiles (Lines 1–6, Lines 7–24, Lines 25–40, Lines 41–44, Lines 45–77, Lines 78–11), contiguous lines were placed at a mutual distance of 1.5 m on which 16 electrodes were fixed with a dipolar spread of 1.5 m, giving a total length of 22.5 m. In a few cases, a lower number of electrodes was adopted for logistical reasons. Furthermore, each set overlapped the next one of 7.5 m in order to have a good coverage of measurement in depth.
Data acquisition was performed through the multi-electrode MAE A3000TM resistivity meter (www.mae-srl.it (accessed on 19 January 2025), M.A.E. s.r.l, Frosolone (IS), Italy) (Figure 2b). Implementing the dipole–dipole array, for increasing values of n, the signal strength and the signal-to-noise ratio decrease [49]. In order to solve this matter, three solutions can be adopted [50]: increasing the intensity of the injected current, using the stacking process of the voltage at the receiving dipole, increasing the sensitivity of the array with depth-enlarging dipole lengths [49]. Considering the features of the adopted instrument, all of the three approaches were adopted. In this way, the data were acquired following the plan shown in Figure 2a. In particular, the measurements were performed along 111 lines arranged on overlapping sub-areas indicated by different colors for greater clarity and easy reading of the sketch.
The data processing involved the use of E-PERTI [33], the main mathematical process of which is reported in Appendix A. The method is not a typical deterministic inversion routine following a probability tomography approach in resistivity methods. The initial algorithm was formulated for the self-potential method and subsequently adjusted to process resistivity data [35,36,37,38,39,40,41,42,43,44,45,46,47,48,49,50,51]. Without calculating the intrinsic resistivities, the procedure provided the probability of a high- or low-resistivity anomaly taking in account as a reference model, the average apparent resistivity value of the entire dataset. The method was successfully applied in order to describe the geometry of potential sources in volcanic areas, to map buried archaeological structures, and to detect faults.
Subsequently, in order to estimate the true resistivities, the algorithm [35] was modified, and the data-adaptive probability-based ERT inversion method (PERTI) [34] was defined. From a probabilistic point of view, the procedure identifies within the set of possible solutions the most probable one that is compatible with the dataset acquisition scheme. In this regard, the approach can be considered as a linearization of the problem. In the literature, numerous applications of the PERTI approach can be found in near-surface prospection to solve archaeological research questions.
Finally, the E-PERTI method was developed to improve robustness to noise concerning the original PERTI and to obtain the maximum possible result from the apparent resistivity dataset. The process involves extracting subsets of data from the observed resistivity data randomly by selecting horizontal or vertical windows of the datum space [33]. The result is the best estimate of the most probable resistivity through an intrinsic linear regression model implementing standard least squares routines. The first application of the E-PERTI scheme was related to the characterization of a buried ancient ditch.

3. Results

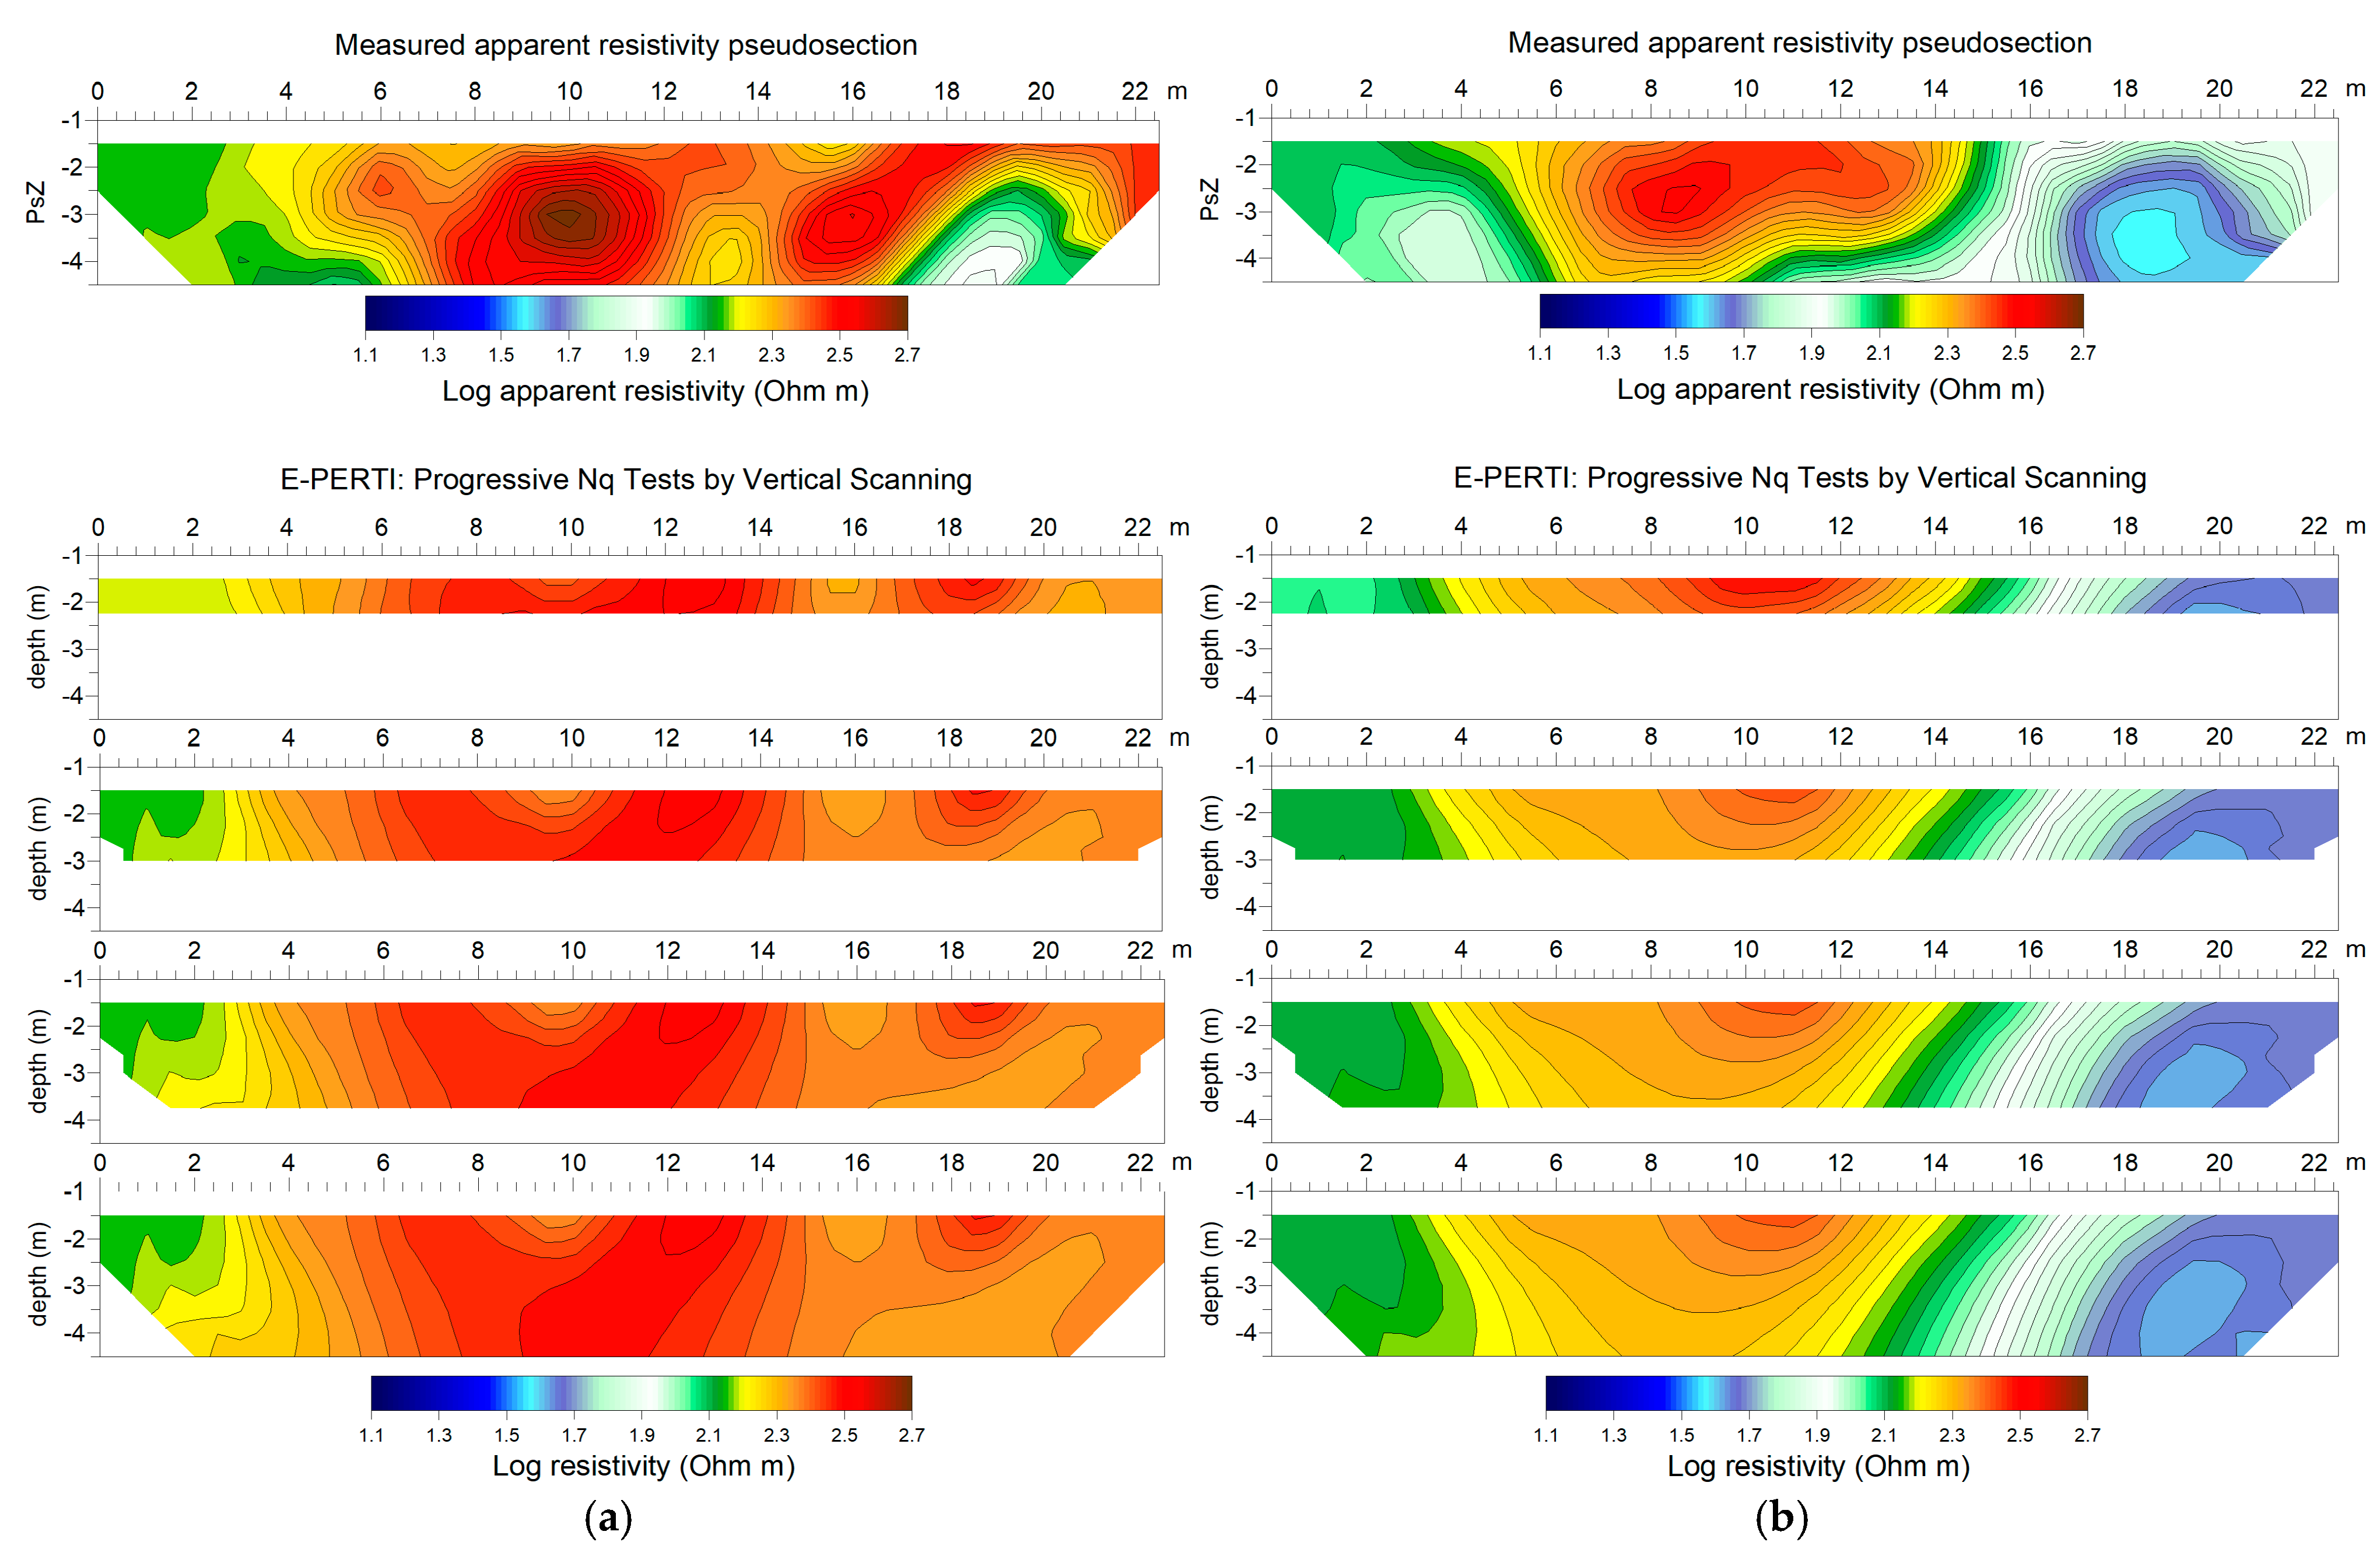
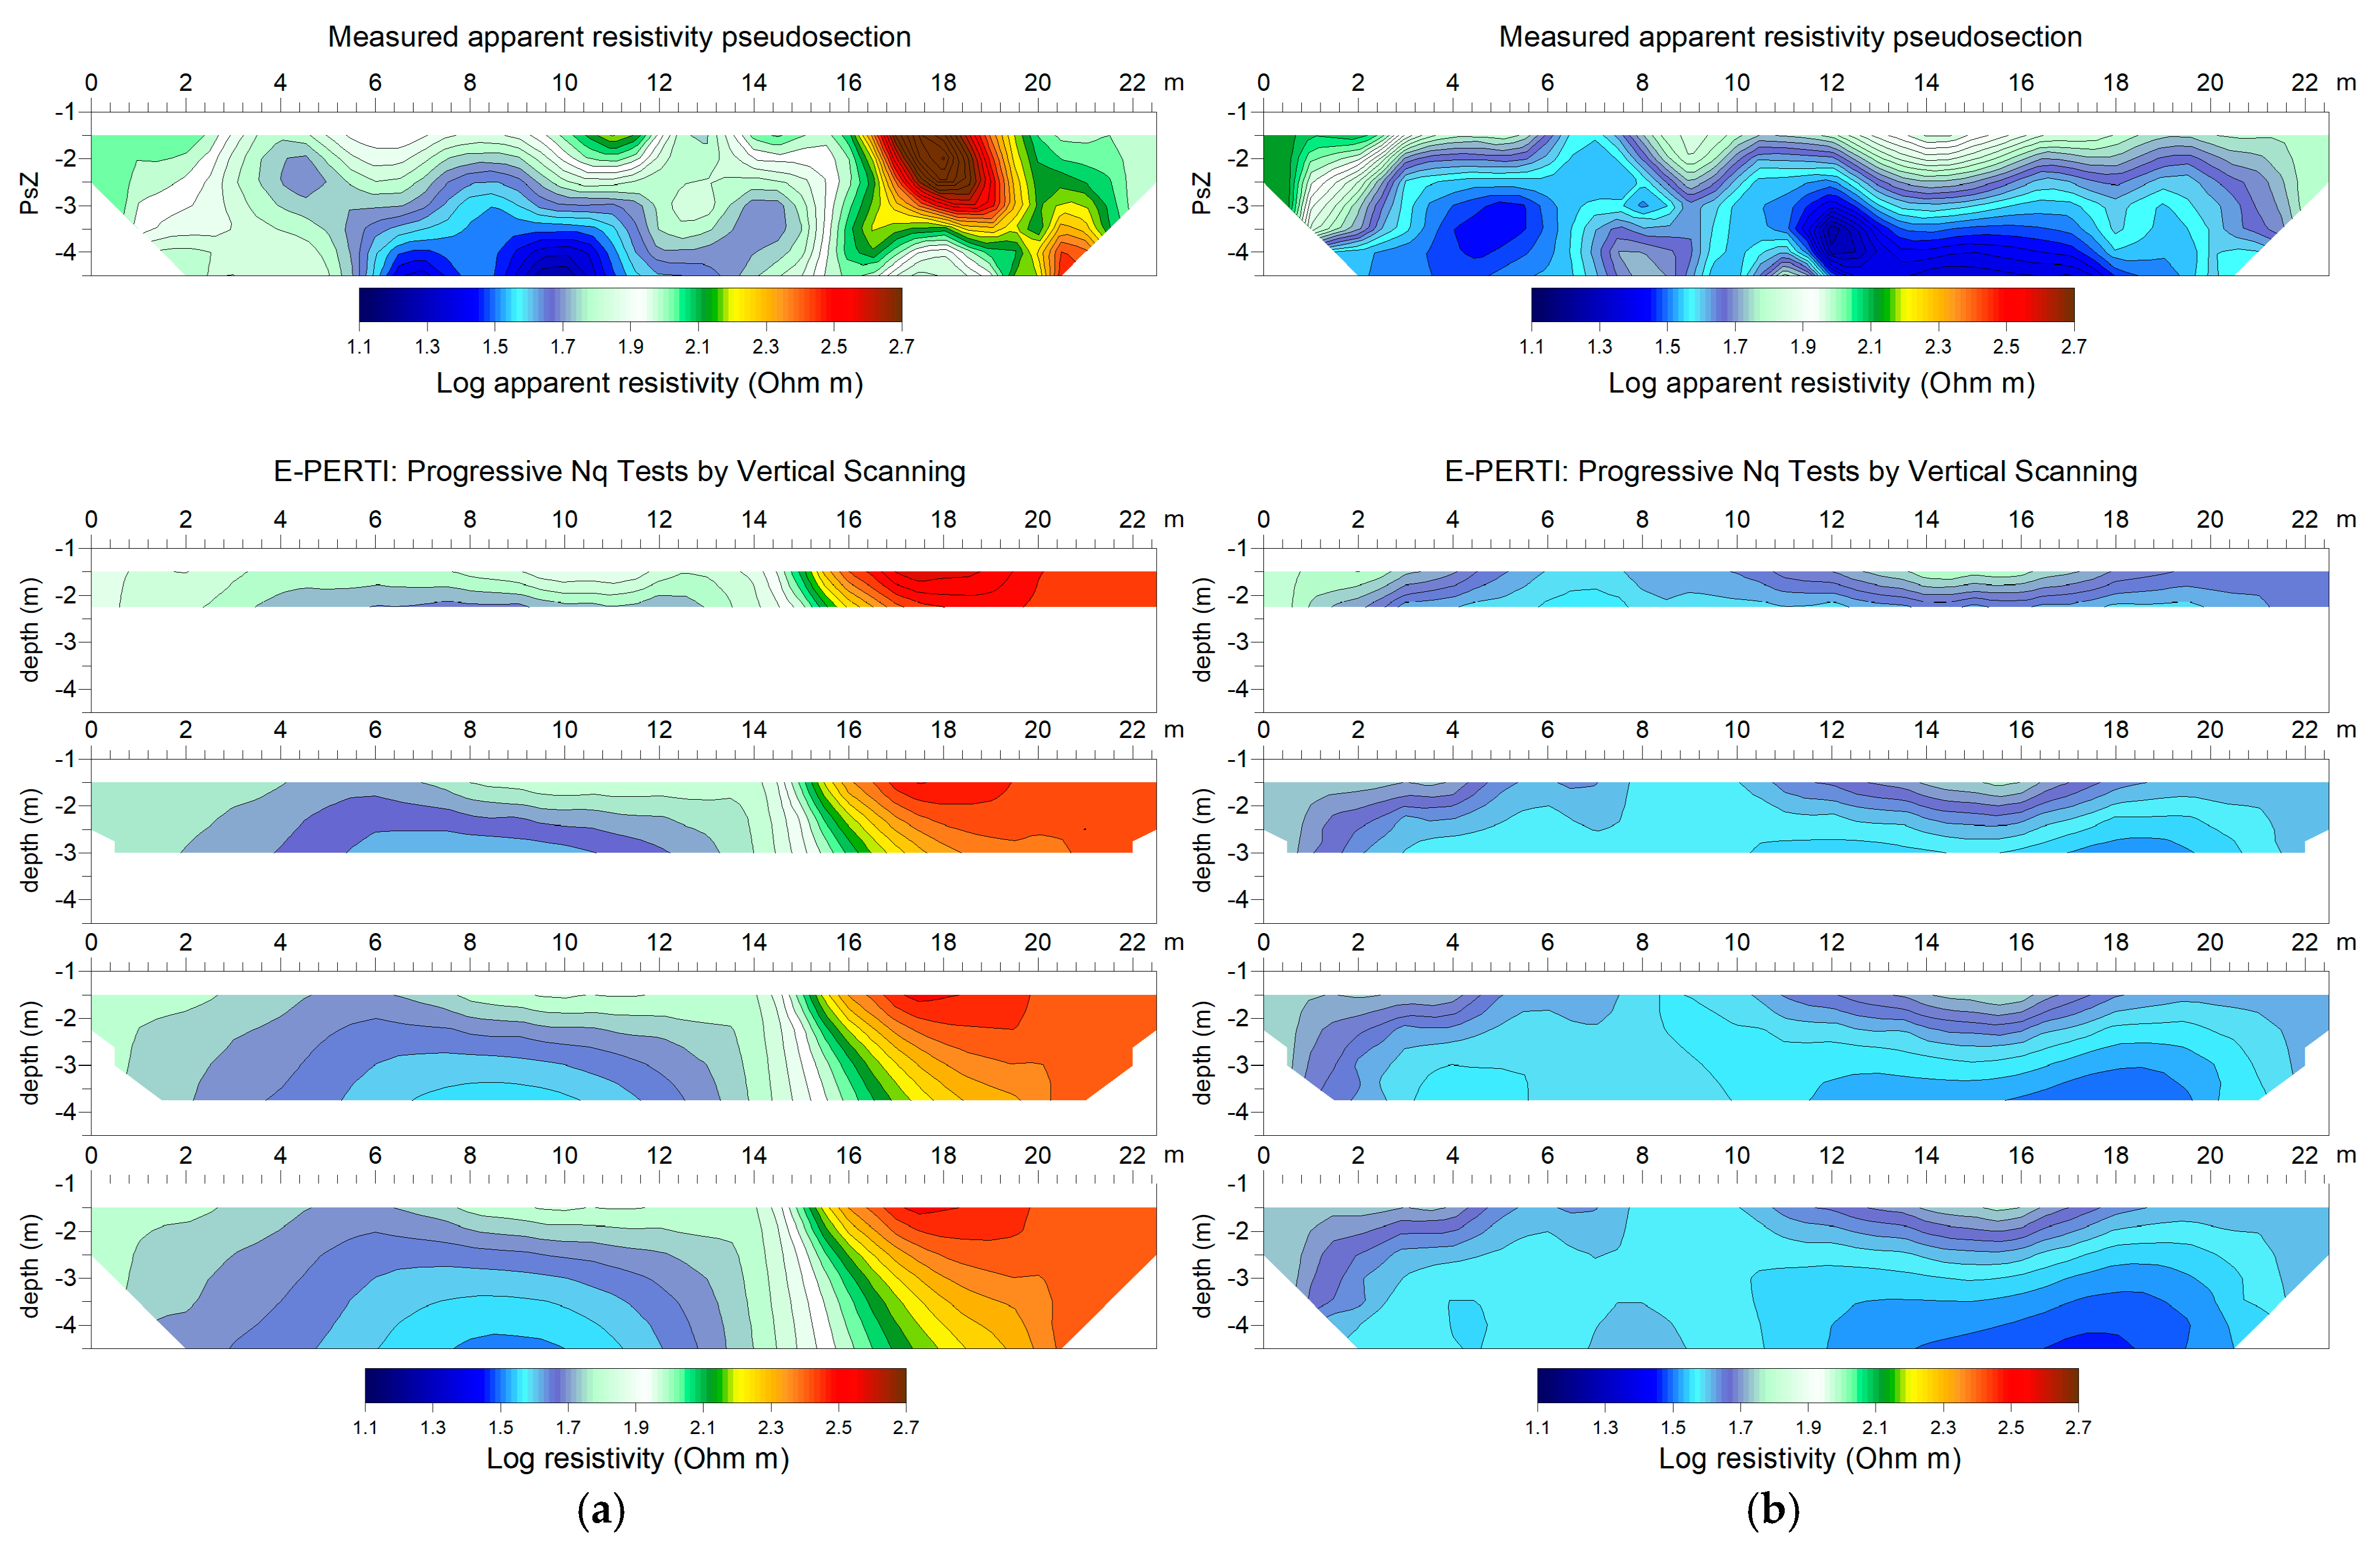
As demonstrated in [33], in order to obtain resistivity values that are not influenced by geometrically distant points, we can investigate the possibility of a dynamic geoelectric tomography, which is a dialogue with the dataset to enhance potentially interesting contributions from sequential data subsets. As a further demonstration, we report here the extractions of the Nq subsets on the criterion linked to the depth, i.e., we consider the possibility of a vertical scanning of the pseudosection by selecting subsets with gradually increasing pseudodepths (see Annex A). For the sake of brevity, we report here the processing of profiles L10, L20, L31, and L42 chosen on the basis of the presence of high surface resistivity values along the whole section (L10, Figure 3a), in the central part (L31, Figure 3b), and in the right portion (L42, Figure 4a). Section L20 (Figure 4b) is quite uniform and denotes low resistivity values.
Apparent resistivity and modeled real resistivity maps were expressed in logarithmic scale and a uniform color sequence within the same [ ρ a , m i n , ρ a , m a x ] interval was used for each section. In Figure 3, Figure 4, Figure 5 and Figure 6, for the selected sections, the apparent resistivity pseudosection and the extraction of the Nq tests in depth are reported (from top to bottom k = 2, k = 3, k = 4, k = 5, where k is the sampling integer denoting the increasing distance). The last section is the estimation of ρ m (m = 1,2, …, M) with a linear best-fit procedure. The biggest difference you might notice as you proceed with the vertical scanning to greater depths is a reduced focus on the shallowest area.
Considering the whole dataset, the measured apparent resistivity values were included in a wide range between 10 Ωm and 500 Ωm. In the Supplementary Materials (Figures S1–S11), the pseudosection and the final E-PERTI section resulting from the estimation of ρ m with a linear best-fit procedure applied point by point to the resistivity values belonging to the PERTI sections obtained by vertical scanning are shown for each profile. In this case, it is not useful to calculate the RMS error between the measured and modeled apparent resistivity values as the method does not require a priori information and iterative processes. Therefore, one way to evaluate the modeling ability of E-PERTI is to make a comparison of the results with those of other deterministic inversion algorithms as shown in [36]. Here, as an example, in Figure 5, the E-PERTI result for L10 and L42 is compared with the inversion carried out using the software ZondRes2D (Demo version, http://zond-geo.com/, accessed on 19 January 2025). The two procedures provide an analogous calculus of the intrinsic resistivity contrast.
The E-PERTI sections demonstrate the ability to reconstruct a satisfactory subsurface model by eliminating the dragging effects resulting from the array used. In detail, the E-PERTI sections allow the enhancement of the presence of well-bounded resistive bodies with resistivities that vary from 130 Ωm to 500 Ωm. This is clear in numerous profiles: L1–L15 (Figures S1 and S2), L28–L37 (Figure S3 and S4), L41–L44 (Figure S5), L53–L58 (Figure S6), and L103–L111 (Figure S11). In the figures, the A and B letters are used to highlight the location of the high-resistivity bodies. Elsewhere, the stratigraphy appears quite homogenous and, considering the typology of sediments exposed at the surface, it can be assumed to be composed by alluvial deposits [38]. Furthermore, the correlation between the newly acquired geophysical data and the magnetic data collected between 2019 and 2020 is not fruitful since the latter were sampled according to a very sparse grid with station points spaced 25–50 m and, therefore, had insufficient detail.
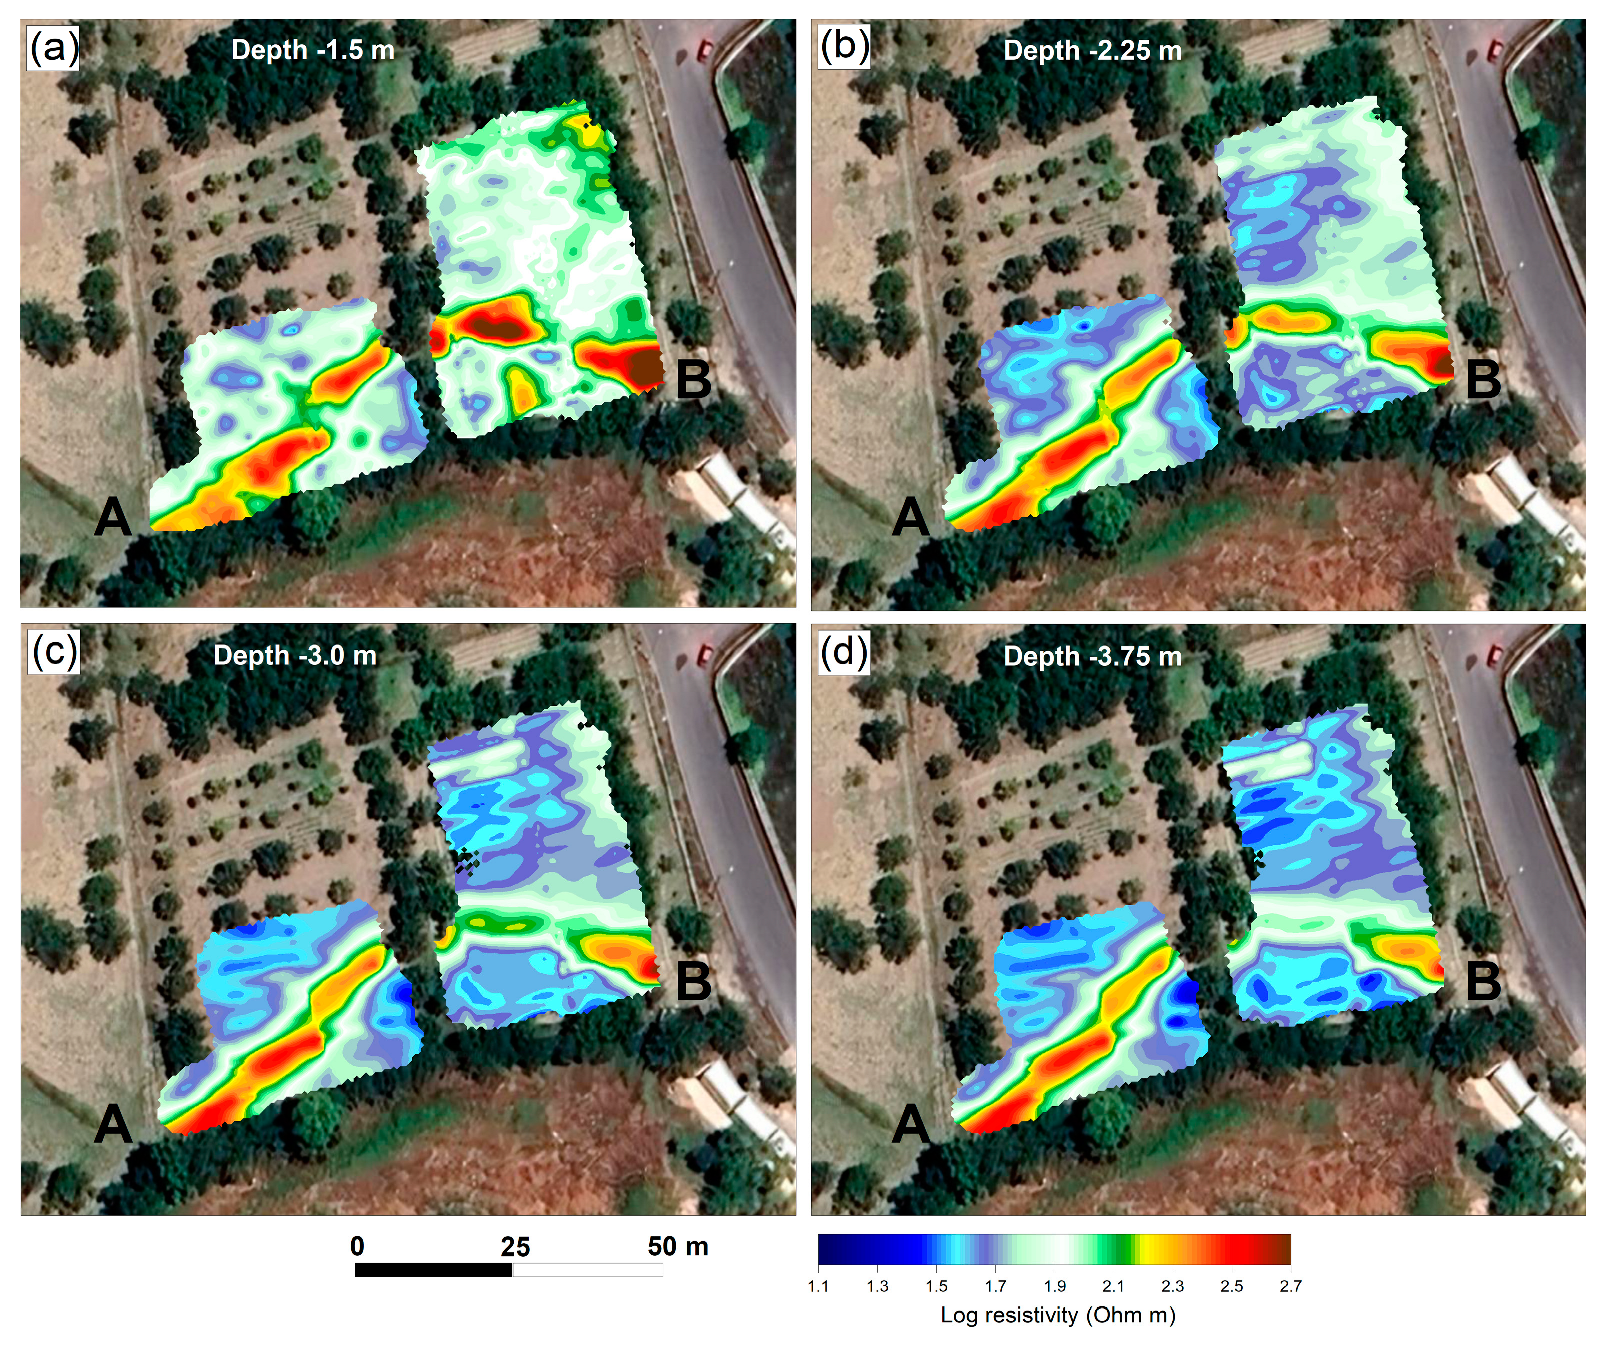
Finally, by assembling all the E-PERTI profiles, a 3D model was obtained. In Figure 6, as series of horizontal slices at growing depth from 1.5 m down to 3.75 m under the surface was located on a satellite image. The high-resistivity volumes (A to the west, B to the east) were about 5 m large and 50 m long. They were distributed along a regular route that circled the hill. In Figure 7, the 3D ERT model is depicted in the full compact form (Figure 7a,b) showing also some vertical (Figure 7c,d) and horizontal slices (Figure 7e,f). In Figure 7b, in order to better highlight the resistivity highs, the color scale was adapted by constricting the right-hand half of the logarithmic scale below the value 2.1 and setting up the left-hand half colorless.

4. Discussion

This analysis has shown very promising outcomes that need to be combined with the well-established data coming from the excavations and to be compared to other known contexts to build some broader reconstructions and hypotheses that can be especially useful in a framework of future perspectives.
The important challenge is to first establish the typology of any buried architectural structure and its potential chronology in the broad spectrum of occupation of the archaeological site. This analysis has highlighted the existence of coherent evidence that, archaeologically, immediately brings to mind a massive fortification, or retaining wall, with its continuous foundations on the lower level and elevation on the upper level with the potential existence of one or even two passages. In order to give more value to this interpretation, the data are integrated into the wider picture of the Arslantepe’s settlement pattern. Other fortifications are present at the site, all located on the mound itself [41]. Of course, the fact that, in several phases of the history of Arslantepe, there is evidence to highlight that the mound was enclosed by different sorts of defensive systems does not necessarily imply the presence of fortifications in the off-mound area. However, this is also a hint that cannot be neglected, considering that the reasons to protect some parts of the settlement could have also affected the foot of the hill.
The phases on which to focus particular attention are those belonging to the later part of the sequence, which approximately runs from the mid-2nd to the mid-1st millennium BCE. Indeed, it is known that the northern part of the mound, that is the portion of the hill in the proximity of the surveyed area, was mostly occupied during this timespan. It is also important to note that the mound, or part of it, was systematically fortified throughout these thousand years.
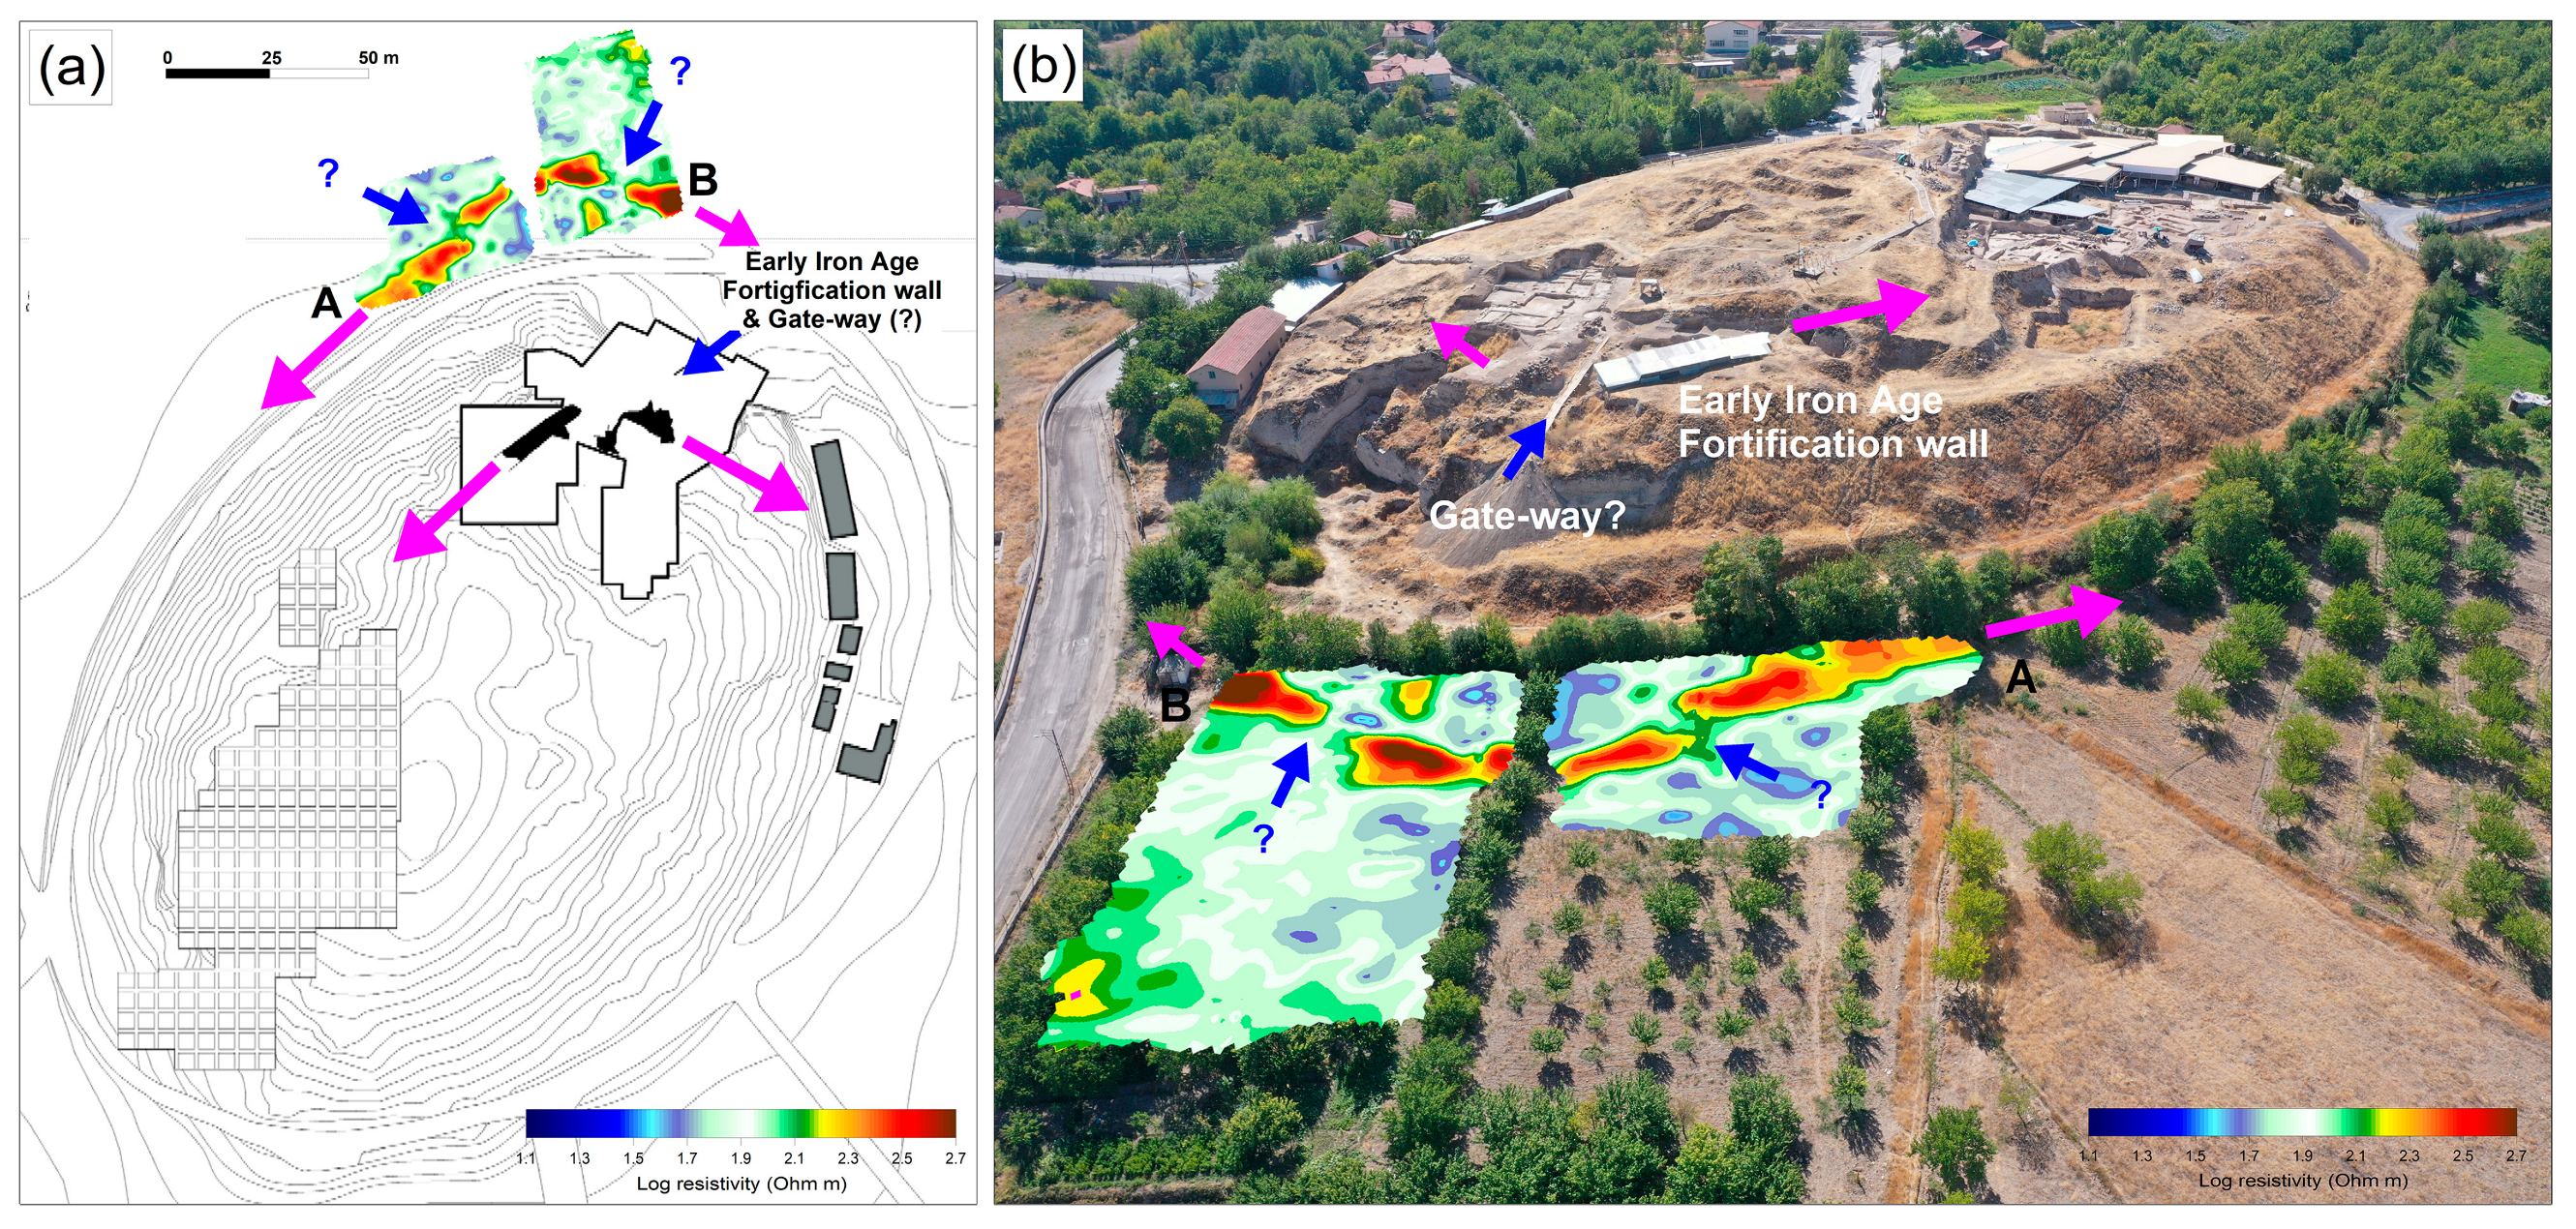
In this framework, special emphasis needs to be placed on the construction of the fortification wall and possibly associated monumental gate that were built to surround the northern portion of the mound during the Early Iron Age (ca. 1250-850 BCE) [52]. Noteworthily, the defensive system shows the same size, position, and orientation as our off-mound geophysical evidence, with a difference in elevation of slightly less than 15 m and a distance around 60 m.
It is also possible that a ramp brought to light in the 1960 excavations linked the abovementioned inner wall with our findings at the foot of the hill [53]. This consisted of the alternation of rows of stones and wooden beams, recognizable by the empty spaces left after decomposition. Even though no direct association between the fortification and the ramp has been evidenced, its position and orientation allow us to assume that the latter provided access from the lower town to the Iron Age citadel.
A few more insights concerning the Iron Age occupation at the site can be useful to set the analysis in a more detailed and comprehensive historical and archaeological context. The significant political and cultural role of Arslantepe during the Iron Age is well known, considering that the site was the capital of the Syro-Anatolian kingdom of Malizi/Melid, as renowned by many local inscriptions distributed over its territory [52].
It is also important to shortly consider the abovementioned observations within the broader studies on the settlement patterns of the main Iron Age Syro-Anatolian cities. Indeed, during the last decades, these have developed increasing interest and underlined the existence of a shared idea of urban planning that shows the presence of a hierarchical and composite concept of the settlement layout [54,55].
The main cities or capitals of the Iron Age Syro-Anatolian region were characterized not only by the existence of fortified citadels but also by the presence of a bi-partite, or sometimes even tri-partite, organization of these. The different parts were separated from each other not only using fortifications but also in terms of height, with a significant dissimilarity in elevation between them. The peripheral location of the citadels, meaning that these were not necessarily centered compared to the whole fortified settlement, is also a characteristic feature and not only for those cases of cities whose layout was forced by the vicinity of a river.

5. Conclusions

In this paper, for the first time, the E-PERTI method was applied to process and interpret a large dataset relating to an archaeological case study. The objective was to obtain information in an unexplored portion of territory around the site of Arslantepe, a masterpiece of ancient culture included in the UNESCO World Heritage List.
As in previous methodological studies [33,34,35], the method proved to be a robust approach in noise detection and was as effective in modeling buried archaeological structures as any standard interactive inversion process. In detail, the results showed the presence of high-resistivity volumes distributed along a regular route that circles the hill. They form an angle slightly wider than 90 degrees with regular dimensions (5 m large and 50 m long).
This analysis has highlighted the existence of coherent evidence that might be interpreted archaeologically as a massive fortification dated to the Iron Age (Figure 8 and Figure 9). This would not be surprising, considering what is already known about the important political role covered by Arslantepe during this period and its related archaeological evidence within the framework of the urban layout of the Syro-Anatolian city-states.
Pushing any interpretation about the layout of the wall elevation and especially the potential presence of a passage would be completely speculative. Indeed, it is impossible in the current state to confirm whether some of those elements visible in the horizontal section could really fit in the coherent layout of a gate. However, it is also useful to remark that comparisons with the main Iron Age Syro-Anatolian urban centers show us that the citadels, because of their ideological and symbolic relevance, commanded prominent visibility, both from outside the city and along the path that led to them. The fact that, at Arslantepe, the gate to the Iron Age citadel was positioned right on top of the potential access located at the foot of the hill—which means that the lower and upper gates were literarily facing each other—seems to fit again very well with this pattern.
With the full awareness that the results presented here are totally preliminary and also based on a restricted part of the settlement, we would like to conclude stressing again the importance of this research in finally bringing results on the existence of off-mound evidence at Arslantepe and developing new food for thought for further future perspective of work. It is advisable to plan targeted excavations, surveys, and trench sampling to understand the sequence of habitation and land use or activity in the area, combining standard field archaeology approaches with chemical and grain size characterization to reveal patterns associated with environmental or anthropogenic events [56].

Supplementary Materials

The following supporting information can be downloaded at: https://www.mdpi.com/article/10.3390/heritage8020037/s1, Figure S1: Lines 1–10: Measured apparent resistivity pseudosection (left) and E-PERTI section resulting from the estimation of rm with a linear best-fit procedure (right); Figure S2: Lines 11–20: Measured apparent resistivity pseudosection (left) and E-PERTI section resulting from the estimation of rm with a linear best-fit procedure (right); Figure S3: Lines 21–30: Measured apparent resistivity pseudosection (left) and E-PERTI section resulting from the estimation of rm with a linear best-fit procedure (right); Figure S4: Lines 31–40: Measured apparent resistivity pseudosection (left) and E-PERTI section resulting from the estimation of rm with a linear best-fit procedure (right); Figure S5: Lines 41–50: Measured apparent resistivity pseudosection (left) and E-PERTI section resulting from the estimation of rm with a linear best-fit procedure (right); Figure S6: Lines 51–60: Measured apparent resistivity pseudosection (left) and E-PERTI section resulting from the estimation of rm with a linear best-fit procedure (right); Figure S7: Lines 61–70: Measured apparent resistivity pseudosection (left) and E-PERTI section resulting from the estimation of rm with a linear best-fit procedure (right); Figure S8: Lines 71–80: Measured apparent resistivity pseudosection (left) and E-PERTI section resulting from the estimation of rm with a linear best-fit procedure (right); Figure S9: Lines 81–90: Measured apparent resistivity pseudosection (left) and E-PERTI section resulting from the estimation of rm with a linear best-fit procedure (right); Figure S10: Lines 91–100: Measured apparent resistivity pseudosection (left) and E-PERTI section resulting from the estimation of rm with a linear best-fit procedure (right); Figure S11: Lines 101–111: Measured apparent resistivity pseudosection (left) and E-PERTI section resulting from the estimation of rm with a linear best-fit procedure (right).

Author Contributions

Conceptualization, F.B.R., M.C., F.M. and P.M.; methodology, M.C. and P.M.; software, M.C. and P.M.; investigation, M.C. and F.M.; data curation, M.C. and P.M.; writing—original draft preparation, M.C., F.M. and P.M.; writing—review and editing F.B.R., M.C., F.M. and P.M.; project administration, F.B.R. and P.M.; funding acquisition, F.B.R. and F.M. All authors have read and agreed to the published version of the manuscript.

Funding

This research was funded by Grandi Scavi Sapienza (2022-project SA1221816785461C; 2023-project SA1231888CB098D3), Ministero degli Affari Esteri e della Cooperazione Internazionale (MAECI 2022-Arc-1145; 2023-Arc-2548), Fondo Ordinario Enti di Ricerca (Consiglio Nazionale delle Ricerche, Project Code B68D19001970001).

Data Availability Statement

Data can be requested from the authors.

Acknowledgments

We are grateful to the Kazılar ve Arastırmalar Daire Baskanlıgı of the Kültür Varlıkları ve Müzeler Genel Müdürlügü (General Directorate of Cultural Heritage and Museums) of the Republic of Türkiye for the fruitful collaboration and for permitting us to carry out the fieldwork. We thank landowners Recai Daǧdelen and Battal Çelik, who permitted us to perform the remote sensing on their land. We are very grateful to Aysun Tuna for having shared with us the results of preliminary work around the site of Arslantepe that helped choose the investigation area.

Conflicts of Interest

The authors declare no conflicts of interest.

Appendix A

The initial basic form of the probability resistivity inversion method [35] involved calculating the resistivity anomaly occurrence probability function η m , which may be seen as a dataset likelihood. The area beneath the surface was divided into M nearby cubic cells with the same volume ΔV. These cells were centered in a point center ( x m , y m , z m ) (m = 1, 2, …, M) and had intrinsic resistivity ρ m . Furthermore, a running index n (n = 1, 2, …, N) that represented the electrode array’s location on the surface was expected to identify each of the N apparent resistivity measurements, ρ a , n , that were supposed to make up the dataset. The subsequent PERTI method [34] assumes that the reference uniform resistivity is the unknown value ρ m . It follows that, if at a point ( x m , y m , z m ) η m = 0 , then it becomes obvious that the probability of having a variation in the cell placed at x m , y m , z m in relation to ρ m is zero. Stated otherwise, the intrinsic resistivity is the same as ρ m . By changing the coordinates ( x m , y m , z m ), point by point, the resistivity pattern within V is determined [34].
Afterward, the Bernoulli distributions in probability [57] were taken into consideration when formulating the extension of the PERTI (E-PERTI) [33]. Thus, the occurrence of a specific set of conditions that originates as an elementary event of a space U of elementary events, the test space, is what makes each geoelectrical measurement a “test”. A new test space, UN, made of arbitrary points of U, is obtained by taking into account N tests of a resistivity dataset. Additionally, the N-given tests can be regarded as independent since each nth geoelectric measurement can be assessed as a separate process. Consequently, any Q tests that are arbitrarily taken from the N-given test are hence likewise independent [57]. A set of Nq data (tests) is extracted from the N accessible data assuming NqN for q = 1, 2, …, Q and Q are arbitrarily big. For every Nq set, η m , q is as follows:
η m , q = C m , q k = 1 N q ρ a , k ρ m , q ρ a , k r e f / ρ m , q ,
where
C m , q = k = 1 N q ρ a , k 2 n = 1 N q ρ a , k r e f / ρ m , q 2 1 / 2 .
In the equation, ρ a , k is the difference between ρ a , k and the reference apparent resistivity ρ a , k r e f , computed at the same node as for ρ a , k using a reference model. Therefore, setting up
η m , q = 0   for   each   q = 1 ,   2 ,   ,   Q ,
Q estimates of ρ m are obtained as follows:
ρ m , q = k = 1 N q ρ a , k ρ a , k r e f / ρ m , q / k = 1 N q ρ a , k r e f / ρ m , q .
This allows the best estimator of ρ m to be obtained, for instance, by applying the conventional least squares method to determine the slope of a linear equation of the type
y = ρ m , q x
where
x = k = 1 N q ρ a , k r e f / ρ m , q
y = k = 1 N q ρ a , k ρ a , k r e f / ρ m , q .

References

  1. Griffiths, D.H.; Barker, R.D. Electrical imaging in archaeology. J. Archaeol. Sci. 1994, 21, 153–158. [Google Scholar] [CrossRef]
  2. Kampke, A. Focused imaging of electrical resistivity data in archaeological prospecting. J. Appl. Geophys. 1999, 41, 215–227. [Google Scholar] [CrossRef]
  3. Similox-Tohon, D.; Vanneste, K.; Sintubin, M.; Muchez, P.; Waelkens, M. Two-dimensional resistivity imaging: A tool in archaeoseismology. An example from ancient Sagalassos (Southwest Turkey). Archaeol. Prospect. 2004, 11, 1–18. [Google Scholar] [CrossRef]
  4. Ullrich, B.; Günther, T.; Rücker, C. Electrical resistivity tomography methods for archaeological prospection. In Proceedings of the 35th International Conference on Computer Applications and Quantitative Methods in Archaeology (CAA), Berlin, Germany, 2–6 April 2007. [Google Scholar]
  5. Papadopoulos, N.; Sarris, A.; Yi, M.J.; Kim, J.H. Urban archaeological investigations using surface 3D ground penetrating radar and electrical resistivity tomography methods. Explor. Geophys. 2009, 40, 56–68. [Google Scholar] [CrossRef]
  6. Simyrdanis, K.; Papadopoulos, N.; Kim, J.H.; Tsourlos, P.; Moffat, I. Archaeological investigations in the shallow seawater environment with electrical resistivity tomography. Near Surf. Geophys. 2015, 13, 601–611. [Google Scholar] [CrossRef]
  7. El Aguizy, O.M.; Gobashy, M.M.; Metwally, A.; Soliman, K.S.; Nader, E.L. The discovery of the tomb of the great army General Iwrhya: A quasi 3D electrical resistivity tomography (ERT), Saqqara, Giza, Egypt. Contrib. Geophys. Geod. 2020, 50, 425–446. [Google Scholar] [CrossRef]
  8. Xin, Z.; Liu, L.; Han, J.; Liang, H. Application of electrical resistivity tomography (ERT) in archaeological investigation of Chengsijiazi Ancient City ruins. IOP Conf. Ser. Earth Environ. Sci. 2021, 660, 012118. [Google Scholar] [CrossRef]
  9. Klanica, R.; Křivánek, R.; Grison, H.; Tábořík, P.; Šteffl, J. Capabilities and limitations of electrical resistivity tomography for mapping and surveying hillfort fortifications. Archaeol. Prospect. 2022, 29, 401–416. [Google Scholar] [CrossRef]
  10. Karamitrou, A.; Kylafi, M.; Stampolidis, A.; Militsi, E.; Kazolias, A.; Tsokas, G.; Panagiotidis, V.; Zacharias, N. The Pylos geoarchaeological program: Fusion of images towards understanding ancient landscape. Sci. Cult. 2024, 10, 35–48. [Google Scholar] [CrossRef]
  11. Sasaki, Y. 3-D resistivity inversion using a subspace method. Geophys. Explor. 2006, 59, 425–430. [Google Scholar]
  12. Ha, T.; Pyun, S.; Shin, C. Efficient electric resistivity inversion using adjoint state of mixed finite-element method for Poisson’s equation. J. Comput. Phys. 2006, 214, 171–186. [Google Scholar] [CrossRef]
  13. Pidlisecky, A.; Haber, E.; Knight, R. RESINVM3D: A 3D resistivity inversion package. Geophysics 2007, 72, H1–H10. [Google Scholar] [CrossRef]
  14. Marescot, L.; Lopes, S.P.; Rigobert, S.; Green, A.G. Nonlinear inversion of geoelectric data acquired across 3D objects using a finite-element approach. Geophysics 2008, 73, F121–F133. [Google Scholar] [CrossRef]
  15. McGillivray, P.; Oldenburg, D. Methods for calculating Frechet derivatives and sensitivities for the nonlinear inverse problem: A comparative study. Geophys. Prospect. 1990, 38, 499–524. [Google Scholar] [CrossRef]
  16. Dey, A.; Morrison, H.F. Resistivity modelling for arbitrarily shaped two-dimensional structures. Geophys. Prospect. 1979, 27, 106–136. [Google Scholar] [CrossRef]
  17. Dey, A.; Morrison, H.F. Resistivity modeling for arbitrarily shaped three-dimensional structures. Geophysics 1979, 36, 753–780. [Google Scholar] [CrossRef]
  18. Silvester, P.P.; Ferrari, R.L. Finite Elements for Electrical Engineers, 2nd ed.; Cambridge University Press: Cambridge, UK, 1990. [Google Scholar]
  19. Lines, L.R.; Treitel, S. Tutorial: A review of least-squares inversion and its application to geophysical. Geophys. Prospect. 1984, 32, 159–186. [Google Scholar] [CrossRef]
  20. Constable, S.C.; Parker, R.L.; Constable, C.G. Occam’s Inversion: A practical algorithm for generating smooth models from EM sounding data. Geophysics 1987, 52, 289–300. [Google Scholar] [CrossRef]
  21. deGroot-Hedlin, C.; Constable, S. Occam’s inversion to generate smooth, two-dimensional models form magnetotelluric data. Geophysics 1990, 55, 1613–1624. [Google Scholar] [CrossRef]
  22. Barker, R. A simple algorithm for electrical imaging of the subsurface. First Break 1992, 10, 53–62. [Google Scholar] [CrossRef]
  23. Loke, M.H.; Barker, R.D. Rapid least-squares inversion of apparent resistivity pseudosections by a quasi-Newton method. Geophys. Prospect. 1996, 44, 131–152. [Google Scholar] [CrossRef]
  24. Tsourlos, P. Inversion of electrical resistivity tomography data deriving from 3D structures. Bull. Geol. Soc. Greece 2004, 36, 1289–1297. [Google Scholar] [CrossRef]
  25. Narayan, S.; Dusseault, M.B.; Nobes, D.C. Inversion techniques applied to resistivity inverse problems. Inverse Probl. 1994, 10, 669–686. [Google Scholar] [CrossRef]
  26. Chunduru, R.K.; Sen, M.K.; Stoffa, P.L. 2-D resistivity inversion using spline arameterization and simulated annealing. Geophysics 1996, 61, 151–161. [Google Scholar] [CrossRef]
  27. Smith, N.C.; Vozoff, K. Two-dimentional dc resistivity inversion for dipole-dipole data. IEEE Trans. Geosci. Remote Sens. 1984, 22, 21–28. [Google Scholar] [CrossRef]
  28. Li, Y.G.; Oldenburg, D.W. Inversion of 3-D dc resistivity data using an approximate inverse mapping. Geophys. J. Int. 1994, 116, 527–537. [Google Scholar] [CrossRef]
  29. Dabas, M.; Tabbagh, A.; Tabbagh, J. 3-D inversion in subsurface electrical surveying—I. Theory. Geophys. J. Int. 1994, 119, 975–990. [Google Scholar] [CrossRef]
  30. Ellis, R.G.; Oldenburg, D.W. The pole-pole 3-D DC resistivity inverse problem: A conjugate-gradient approach. Geophys. J. Internat. 1994, 119, 187–194. [Google Scholar] [CrossRef]
  31. Tsourlos, P. Modelling, Interpretation and Inversion of Multielectrode Resistivity Survey Data. Ph.D. Thesis, University of York, York, UK, 1995. [Google Scholar]
  32. Zhang, J.; Manckie, R.L.; Madden, T.R. 3_D resistivity forward modelling and inversion using conjugate gradients. Geophysics 1995, 60, 1313–1325. [Google Scholar] [CrossRef]
  33. Cozzolino, M.; Mauriello, P.; Patella, D. An Extension of the Data-Adaptive Probability-Based Electrical Resistivity Tomography Inversion Method (E-PERTI). Geosciences 2020, 10, 380. [Google Scholar] [CrossRef]
  34. Mauriello, P.; Patella, D. A data-adaptive probability-based fast ERT inversion method. Prog. Electromagn. Res. 2009, 97, 275–290. [Google Scholar] [CrossRef]
  35. Mauriello, P.; Patella, D. Resistivity anomaly imaging by probability tomography. Geophys. Prospect. 1999, 47, 411–429. [Google Scholar] [CrossRef]
  36. Turkmen, I.; Aksoy, E.; Taşgin, C.K. Alluvial and lacustrine facies in an extensional basin: The Miocene of Malatya basin, eastern Turkey. J. Asian Earth Sci. 2007, 30, 181–198. [Google Scholar] [CrossRef]
  37. Palmieri, A.M. Studio sedimentologico dell’area nordorientale di Arslantepe. Quad. Ric. Sci. 1978, 100, 353–364. [Google Scholar]
  38. Dreibrodt, S.; Lubos, C.; Lomax, J.; Sipos, G.; Schroedter, T.; Nelle, O. Holocene landscape dynamics at the tell Arslantepe, Malatya, Turkey—Soil erosion, buried soils and settlement layers, slope and river activity in a middle Euphrates catchment. Holocene 2014, 24, 1351–1368. [Google Scholar] [CrossRef]
  39. Frangipane, M. Arslantepe. The Rise and Development of a Political Centre: From Temple to Palace to a Fortified Citadel. In Proceedings of the 1st International Arslantepe Archaeology Symposium, Rome, Italy, 4–6 October 2018; Durak, N., Frangipane, M., Eds.; Inönü Universitesi Matbaası: Malatya, Türkiye, 2019; pp. 71–104. [Google Scholar]
  40. Balossi Restelli, F. Arslantepe II—Period VII. The Development of a Ceremonial/Political Centre in the First Half of the Fourth Millennium BCE (Late Chalcolithic 3–4); Sapienza Universitá di Roma: Rome, Italy, 2019. [Google Scholar]
  41. Vignola, C.; Marzaioli, F.; Balossi Restelli, F.; Di Nocera, G.M.; Frangipane, M.; Masi, A.; Passariello, I.; Sadori, L.; Terrasi, F. Changes in the Near Eastern Chronology between the 5th and the 3rd Millennium BC: New AMS 14C dates from Arslantepe (Turkey). Nucl. Instrum. Methods Phys. Res. B Beam Interact. Mater. At. 2019, 456, 276–282. [Google Scholar] [CrossRef]
  42. Manuelli, F.; Vignola, C.; Marzaioli, F.; Passariello, I.; Terrasi, F. The Beginning of the Iron Age at Arslantepe: A 14C Perspective. Radiocarbon 2021, 63, 885990. [Google Scholar] [CrossRef]
  43. Frangipane, M. Different Trajectories in State Formation in Greater Mesopotamia: A View from Arslantepe (Turkey). J. Archaeol. Res. 2018, 26, 3–63. [Google Scholar] [CrossRef]
  44. Frangipane, M. Archaeological Evidence of the Political Economy in Pre-State and Early State Societies in the Near East. Mesopotamia and Anatolia, Some Remarks and Comparisons. In Ancient Economies in Comparative Perspective: Material Life, Institutions and Economic Thought; Frangipane, M., Poettinger, M., Schefold, B., Eds.; Springer: Cham, Switzerland, 2022; pp. 91–110. [Google Scholar]
  45. Di Nocera, G.M. Settlement Patterns in the Malatya Plain and Metallurgical Developments at Arslantepe: The Role of Surrounding Communities. In Proceedings of the 1st International Arslantepe Archaeology Symposium, Rome, Italy, 4–6 October 2018; Inönü Universitesi Matbaası: Malatya, Türkiye, 2019; pp. 269–284. [Google Scholar]
  46. Tuna, A. Future Projections from Today’s Perspective on Protection Practices in Arslantepe. In Proceedings of the 1st International Arslantepe Archaeology Symposium, Rome, Italy, 4–6 October 2018; Inönü Universitesi Matbaası: Malatya, Türkiye, 2018; pp. 61–69. [Google Scholar]
  47. Ay, B.H.; Tuna, A. Exploring The Perceived Landscape with The Local People: The Experience of Community Mapping in Orduzu District (Malatya/Turkey). Int. J. Archit. Plan. 2021, 9, 506–536. [Google Scholar] [CrossRef]
  48. Ward, S.H. Resistivity and induced polarization methods. In Geotechnical and Environmental Geophysics, Volume I, Review and Tutorials; Ward, S.H., Ed.; Investigations in Geophysics No. 5; Society of Exploration Geophysicists: Tulsa, OK, USA, 1990; pp. 147–189. [Google Scholar]
  49. Loke, M.H. Tutorial: 2-D and 3-D Electrical Imaging Surveys, 2012, 1–161, Geotomo Softwares, Penang, Malaysia. Available online: www.geotomosoft.com (accessed on 30 October 2024).
  50. Edwards, L.S. A modified pseudosection for resistivity and induced-polarization. Geophysics 1977, 42, 1020–1036. [Google Scholar] [CrossRef]
  51. Alaia, R.; Patella, D.; Mauriello, P. Imaging multipole self-potential sources by 3D probability tomography. Prog. Electromagn. Res. B 2009, 14, 311–339. [Google Scholar] [CrossRef]
  52. Manuelli, F.; Mori, L. The King at the Gate. Monumental Fortifications and the Rise of Local Elites at Arslantepe at the End of the 2nd Millennium BCE. Origini 2016, 39, 209–241. [Google Scholar]
  53. Pecorella, P.E. Malatya—III: Rapporto preliminare delle campagne 1963–1968. In Il Livello Eteo Imperiale e Quelli Neoetei; Centro per le Antichità e la Storia dell’Arte del Vicino Oriente: Rome, Italy, 1975. [Google Scholar]
  54. Novák, M. Elites behind Walls. Citadels and the Segregation of Elites in Anatolia, the Levant and Mesopotamia. In Anatolian Metal VIII. Eliten–Handwerk–Prestigegüter; Verlag Marie Leidorf: Rahden/Westf, German, 2018; pp. 255–268. [Google Scholar]
  55. Osborne, J. The Syro-Anatolian City-States; Oxford University Press: New York, NY, USA, 2021. [Google Scholar]
  56. Panagiotidis, V.; Palamara, E.; Tsampa, K.; Papagiannis, S.; Maggidis, C.; Karantzali, E.; Zacharias, N. Tracing environmental patterns and human activities via the chemical synthesis of soil stratigraphy: The mycenaean spercheios-valley archaeological project (Lamia, Greece). Sci. Cult. 2024, 10, 21–38. [Google Scholar] [CrossRef]
  57. Gnedenko, B.V. Kurs Teorii Verojatnostej, Mir, Moscow; Published in Italian as Teoria della Probabilità; Editori Riuniti: Rome, Italy, 1979. [Google Scholar]
Figure 1. Position of Arslantepe on a physical map of Türkiye and the eastern Mediterranean basin and location of the survey area on an aerial view of the hill.
Heritage 08 00037 g001
Figure 2. The ERT survey planning at the northern foot of the hill of Arslantepe (a), and data acquisition with MAE A3000TM resistivity meter along Line 9 (b).
Heritage 08 00037 g002
Figure 3. L10 (a) and L31 (b) profiles: apparent resistivity pseudosection and the extraction of the Nq tests in depth are reported (from top to bottom k = 2, k = 3, k = 4, k = 5).
Heritage 08 00037 g003
Figure 4. L42 (a) and L20 (b) profiles: apparent resistivity pseudosection and the extraction of the Nq tests in depth are reported (from top to bottom k = 2, k = 3, k = 4, k = 5).
Heritage 08 00037 g004
Figure 5. L10 (a) and L40 (b) profiles: comparison between E-PERTI and ZondRes2D inversion.
Heritage 08 00037 g005
Figure 6. Sequence of horizontal slices at increasing depth of 1.5 m (a), 2.25 m (b), 3.0 m (c), and 3.75 m (d) beneath the ground level overlapped to a satellite image. A and B mark the two high-resistivity volumes.
Heritage 08 00037 g006
Figure 7. Three-dimensional ERT model obtained by the assemblage of the E-PERTI sections (a,b) showing also some vertical (c,d) and horizontal slices (e,f). The A and B letters are used to highlight the location of the high-resistivity bodies.
Heritage 08 00037 g007
Figure 8. Overlapping of geophysical results on the archaeological map relative to the Early Iron Age (a) and on an aerial picture (b). The fortification is marked with magenta arrows and the gates with blue arrows, both those known and those hypothesized (signed with “?"). The A and B letters are used to highlight the location of the high-resistivity bodies (compare with Figure 6 and Figure 7).
Heritage 08 00037 g008
Figure 9. Interpretive sketch of the discovered resistivity structure.
Heritage 08 00037 g009
Disclaimer/Publisher’s Note: The statements, opinions and data contained in all publications are solely those of the individual author(s) and contributor(s) and not of MDPI and/or the editor(s). MDPI and/or the editor(s) disclaim responsibility for any injury to people or property resulting from any ideas, methods, instructions or products referred to in the content.