Article

Sustainability of Managing Archaeological Iron Collections

1
English Heritage Trust, Rangers House, Chesterfield Walk, London SE108QX, UK
2
Haute École Arc Conservation-Restauration, University of Applied Sciences and Arts Western Switzerland HES-SO, Espace de l’Europe 11, 2000 Neuchâtel, Switzerland
*
Author to whom correspondence should be addressed.
Heritage 2025, 8(12), 502; https://doi.org/10.3390/heritage8120502
Submission received: 30 September 2025 / Revised: 3 November 2025 / Accepted: 19 November 2025 / Published: 26 November 2025

Abstract

The sustainability of managing archaeological iron collections presents both environmental and economic challenges for heritage institutions. Energy-intensive climate control and rising operational costs necessitate evaluation of conservation treatments and preventive storage strategies. This study examines the environmental impacts of treatments commonly used for archaeological iron, including sodium hydroxide and sodium disulfite desalination, as well as emerging microbially derived “greener” approaches. Life cycle assessment (LCA) analyses quantify the global warming potential, toxicity, and energy requirements of these treatments. Preventive conservation strategies, including relative humidity (RH) control in storage and display, are assessed for energy efficiency and sustainability. Air exchange rates, dehumidifier performance, and silica gel replacement schedules were measured and modelled to estimate energy consumption and associated environmental impacts. Results highlight that chemical treatments contribute minimally to overall environmental burden, whereas operational energy demands for storage and display are significant. The findings provide evidence-based guidance for implementing more sustainable conservation practices for archaeological iron, balancing material preservation, resource efficiency, and environmental responsibility.

1. Introduction

Archaeological iron is a valuable resource that serves as a tangible connection to our past, revealing insights into ancient culture. As one of the most abundant metals found at archaeological sites, iron objects provide invaluable information about the manufacturing technologies and decorative techniques used for the production of tools, weapons and ritual objects [1]. Nevertheless, without the appropriate care and stabilisation treatment, these objects remain vulnerable to corrosion processes that can lead to degradation and the loss of historical and scientific information [2,3]. Therefore, stabilisation is an important step in conservation practice, ensuring the long-term preservation of the structure of archaeological objects by effectively inhibiting further corrosion.
Heritage institutions face challenges with sustainability. There are pressing twin issues of climate control’s energy use increasing global warming (leading to the current and increasing climate emergency) and economic sustainability due to recent energy price increases. There is a focus on global warming potential as this is driving climate change and the present climate emergency. When attempting to understand the environmental impacts of particular processes, allocation of impacts can be challenging. This work considers the sustainability aspects of several interventive conservation treatments and preventive conservation for archaeological iron using a lifecycle assessment, LCA, a standardised method for evaluating the environmental impacts associated with all stages of a product’s life—from the extraction of raw materials (cradle), through manufacture and use, to end-of-life disposal (grave) or recycling.
This work focuses on generating a corpus of data, concentrated on continuing archaeological iron treatment, for both interventive and preventive conservation. It is hoped that this will facilitate consideration of these aspects within the field, as such data has so far not been made available.
Treatment of archaeological iron generally aims to remove chloride and chloride-containing species (particularly akaganeite) from the object. Several approaches have been suggested including heating [4]; plasma treatment [5,6,7]; subcritical fluids [8,9]; alkaline sulfite [10,11,12]; sodium hydroxide [13] and ethylene diamine with sodium hydroxide [14]. Treatments remain in use in Germany, Switzerland and France [15]. A 2009 survey of German conservators showed that 40% undertook treatments, and although alkaline sulfite and sodium hydroxide were most frequently used, washing and plasma were also used [16]. A recent (unpublished) survey of practitioners found alkaline disulfite (sodium hydroxide with sodium disulfite to remove oxygen) to be the most widely used treatment. The treatment needs analysis to determine the end point, and this is usually when the chloride content of the solution either reaches equilibrium or rises slowly. Four methods are available to determine the end point: ion chromatography, specific ion electrodes, coulometric titration or colorimetric tests. Whilst each has an impact, the amounts of chemicals used are small when compared to the treatment itself. While the equipment does have embedded carbon, when spread across a very large number of tests, the values per sample are small. The average lifetime of ion chromatography equipment would allow tens of thousands of tests to be undertaken. The effectiveness of sodium hydroxide and alkaline disulfite treatments has been investigated [17]. The residual chloride was definitely lower in the alkaline disulfite treated objects, although concerns about the differential conditions and reactivity of the two groups of objects examined have been expressed [17] (p. 95).
Sodium hydroxide was the next most used treatment. The environmental impact of both treatments was assessed with LCA. Gilberg and Seeley expressed some reservations about sodium hydroxide used alone, postulating that it would take time for the hydroxide ions to penetrate the corrosion layers [18]. Most objects have an inner dense product layer [19], and corrosion could continue until this had been achieved. The corrosion potential of iron nails in 0.5 M sodium hydroxide was observed to not reduce for several weeks [20]. Experiments have been undertaken examining this aspect of sodium hydroxide treatments. There is some disagreement in the literature as to whether sodium hydroxide treatments can reduce akaganeite to halt the reactivity of treated objects. Some authors have reported complete conversion of akaganeite to goethite in twelve months at ambient temperatures in laboratory tests [21]. Other researchers found much more limited conversion after 20 months [17]. This complete conversion has not been observed on objects during treatment, except with electrolytic reduction [22] or at high temperature or pressures [8,9]. The RH reactivity of akaganeite has been found to vary greatly depending on what RH they formed at [23]. The analytical techniques FTIR, Raman and XRD did not show any differences in spectra for these akaganeite that behaved differently. Differential Scanning Calorimetry, DSC, and thermogravimetric analysis, TGA, did show differences, with transitions occurring at higher temperatures in the akaganeite that formed in higher RH environments, indicating increasing chemical stability [24]. Samples of akaganeite formed in different RH environments were exposed to sodium hydroxide treatments and the conversion to goethite was measured.
In the GoGreen project, new greener treatments are being developed through investigation of the physicochemical properties of the extremophilic yeast Meyerozyma guillermondii HEK2. This biological approach uses water immersion with dead biomass of the yeast to provide a dual action; biosorption of chloride and iron ions onto the cell wall, and ion exchange between the dead biomass and corroded iron surfaces [25]. These interactions promote the transformation of active corrosion compounds into more thermodynamically stable phases such as magnetite, and lead to improvements in the long-term stability of archaeological iron [26]. Production of the deactivated biomass, although not scaled up, is thought to have a low environmental impact. The autoclaving to deactivate the biomass is the most energy-intensive part of the process. Once produced, the dead biomass is stable under storage in ambient conditions.
Recent research into the sustainability of easel-painting conservation indicated materials account for less than 2% of the global warming potential [27]. Differences in workshop arrangements, workflows and conditioning can have dramatic effects. As these vary from institution to institution, materials were mainly considered in this work.
The behaviour of archaeological iron from a terrestrial context has been elucidated to a great extent from recent research [24,28,29,30]. Four behaviours have been discovered.
  • Material is apparently stable up to 80% RH.
  • Approximately 85% of the unstable material begins to react slightly at 16%, reacts more rapidly above 30% and then dramatically increases in reaction rate somewhere between 48 and 60% depending on the temperature. A small, but as yet not fully elucidated portion of this material (possibly due to storage at high RH values after excavation), can begin to react from 11%.
  • Some material is more reactive at lower RH values, with significant reaction just above 20%.
  • The final group of material shows no reactivity up to 55 or 65%, but then begins to react after this point.
Oxygen depletion testing can assign individual objects to particular groups. Within English Heritage, in the absence of testing, archaeological iron is displayed at below 30% RH and stored below 16% RH. The higher value for display recognises the extensive resources that would be required to keep showcases below 16% RH. Whilst a system with dried silica gel in polypropylene (Stewart) boxes in rooms dehumidified to 50% has been found to be efficient enough to use in practice.
For display, most objects are placed in showcases. There are two main approaches to controlling showcase RH to the low values needed for unstable archaeological iron: dry silica gel or dehumidifiers. Whilst several small mechanical conditioning units are available, most cannot reliably keep the RH below 30%. They are usually designed to operate around 50% RH, which they do well.
Only manufacturers can provide accurate cradle to gate sustainability data for LCAs. Unfortunately, this is, at present, not available. Embedded carbon has already been reported for showcases and Munters MG50 dehumidifiers. Digital plans for showcases can be used to calculate the mass of each constituent. Redundant MG50s have been disassembled, and the components weighed and identified. Embedded carbon was estimated from tables of average values for materials. Data for filters is also available. Data for average lifetime has also been published. A similar process was undertaken with an MG90 dehumidifier.
Embedded carbon data for silica gel has been reported [31,32] along with operational carbon for the reconditioning (heating) procedure [31]. The lifespan between gel replacement can be calculated for both showcases and storage boxes from the room RH, the target RH, the starting gel RH after reconditioning, the volume and the air exchange rate based on the concept of hygrometric half-life [31,32,33].
There are two common methods to measure air exchange rates: tracer gas and constant pressurisation. Tracer gas decay gives a direct measure of the air exchange rate, but only for the period of measurement (usually one to three days). The value will change due to atmospheric conditions (particularly solar gain), wind velocity and pressure changes. The constant pressurisation method, normally expressed as m3/m2/h at 50 Pa, requires application of an actual pressure difference to achieve an actual air exchange rate. The pressure difference between the room and the external environment will vary hourly and throughout the year.
A method to predict dehumidifier performance and energy usage for showcases has been developed and extensively tested [31]. The amount of water vapour needed to be removed from the showcase per time period is calculated from the room temperature and RH (measured at a time period, e.g., 30 min or 60 min), the controlled showcase RH, its volume and the air exchange rate. The run time of the dehumidifier in the time period is estimated from capacity data from the manufacturer (using room temperature and RH). Some, but not all, manufacturers provide capacity versus temperature data at different RH values. This fraction is multiplied by the power of the dehumidifier to estimate energy usage. The air from the room surrounds all the joints of the showcases, so it is reasonable to use it as the external conditions. Four sets of measurements underneath showcases have not shown significant differences in climate from the room conditions. Most showcase designs are well-sealed underneath.
The showcase dehumidifier method was modified to generate an estimate for rooms used for storage. This situation is more complex, with uncertainty as to where the air exchanged with the internal room environment originates. For a room within a room design, the external room temperature and RH can be used. This approach is probably also valid for rooms with external walls, provided there are no entrances or windows and a vapour barrier is incorporated in the external wall. For rooms with external windows or permeable external walls, floor or ceilings, the relative amounts of ingress from outside or adjacent rooms is unknown. These volumes will have significantly different temperatures and RHs. An approach to estimate these conditions from uncontrolled T/RH data was investigated. Temperature RH data monitored over a year without any control in the room were used along with the target control RH (generally 50%), the room volume and the air exchange rate. This approach also compensates for water ingress through the fabric of the room, which is common in historic buildings.
The aim of this study is to evaluate the environmental impacts and relative effectiveness of interventive and preventive conservation approaches for archaeological iron, with the goal of supporting more sustainable conservation decision-making. The work applies life cycle assessment (LCA) to sodium hydroxide and alkaline sulfite desalination treatments and examines corrosion behaviour and phase transformations during sodium hydroxide treatment. Preventive approaches, including dehumidified storage, showcases with silica gel, and polypropylene box storage, are also assessed. Together, these analyses are used to compare different conservation scenarios and to identify strategies that balance preservation effectiveness with environmental sustainability. For this paper, only the main treatments and preventive approaches have been considered, due to the resources needed to develop this information. In LCA terms, the boundaries of the assessment are cradle to grave (cradle to gate via material type and average tables). The study considers only sodium hydroxide and alkaline disulfite treatments, showcases with silica gel, or storage in polypropylene boxes with dried silica gel. Other common post excavation treatments—radiography, air abrasive cleaning and the several other conservation treatments such as coatings, corrosion inhibitors, vapour phase inhibitors and anoxic storage—were not considered within the scope of this initial work.

2. Materials and Methods

2.1. LCA for Conventional Desalination Treatments

Data for amounts of sodium hydroxide and sodium disulfite per kg object (the functional unit used in this work) and number of retreatments were taken from Rimmer [17]. Assuming small objects (<25 g) in 100 mL 0.1 M sodium hydroxide or 0.05 M sodium disulfite in 125 mL screw top HDPE flask at 20 °C. Sustainability data for the chemicals and water was taken from the Ecoinvent databases [34]. A partial LCA was completed for the use, reuse and disposal phases. Only manufacturers can give accurate LCA data for raw materials, processing and transport phases. It is often not possible to obtain this information from chemical or materials suppliers. Hence, averaged data was used. Data was also taken from the EcoInvent European entries. As data was collected from several sources, a reduced set of environmental impact factors is reported. The data have been reported to 4 decimal places, as they vary widely. Different sources use different sets of environmental impacts.
The additional impacts due to conservation studio conditioning, staff travel and additional resources (HR, finance, IT provision) required to run a conservation studio will vary enormously. The European Union sets overheads at 40%, whilst United Kingdom Research and Innovation applies a much higher number for research. These figures could be used to approximate additional resources. An example for a combined metals and ceramics conservation studio energy use is included. The studio was in the basement of an Edwardian terrace house, which contained four offices, a meeting room and two storerooms. The conditioning was provided through comfort heating using a central gas-fired boiler and radiators. The studio contained two fume cupboards and a large, extracted area used for cyanide plating. The gas and electricity were separately metered to the building. Based on room area, it was assumed 30% of the heating and 60% of the electricity was used in the basement. Fume cupboards and extraction systems are energy intensive [35]. According to the UK BEIS calculator data [36] for 2024, this would correspond to annual carbon footprints of 1393 kg CO2eq and 3205 kg CO2eq, respectively. Note that these data were based on considerably older underlying energy measurements.

2.2. Investigation into Sodium Hydroxide Treatments

A series of disposed iron nails and other objects from the Stonea excavation were studied to assess sodium hydroxide treatment. Nails were first impregnated with cyclododecane, then cut vertically into 4–7 sections, with 3 mm lateral samples drilled from each section. The drilled samples were analysed with a thermomagnetometer TGA7, (PerkinElmer, Shelton, CT, USA) in 60 mL/min nitrogen, to quantify corrosion phases [37,38]. Baseline oxygen depletion measurements were conducted at 50% RH in 250 mL closed vessels (Bernardin Mason jars [28]) and at 14% RH in small heat-sealed Escal bags, using conditioned silica gel to maintain RH in both cases, with Sp-PSt3-NAU-D7-YOP oxygen sensors and a Fibrox 4 oxygen metre (Presens, Regensburg, Germany). Only segments showing oxygen depletion within 10% of each other were selected for treatment. Two whole objects, possibly a hook and a flat plate, were analysed similarly, with sensor spots attached inside vessels using white tack. Selected segments and objects were immersed in 0.1 M sodium hydroxide solution (50 mL borosilicate conical flasks for small pieces, 250 mL borosilicate vessels for larger objects) at 20 °C, with solution oxygen measured continuously. The same oxygen sensors were used, but with a different calibration for solutions. Acoustic emission during treatment was monitored to determine conversion to aakaganeite, which gives a distinctive signal [39]. A MicroSHM 4-channel system (Physical Acoustics, Mistras DataSolutions, West Windsor Township, NJ, USA) with preamplifiers and WD sensors was used. The sensors were calibrated with a Physical Acoustics Calibrator unit and were attached with cyclododecane and checked weekly with a Pocket AE system (Physical Acoustics, Mistras DataSolutions, West Windsor Township, NJ, USA) generating a 50 KHz signal. After desalination, nail segments and objects were dried above dry silica gel, and oxygen depletion was re-measured at both 14 and 50% RH.
Akaganeite was prepared from iron and iron (II) chloride mixtures at 60, 70 and 80% RH and its purity confirmed [21]. These powders were exposed to sodium hydroxide solutions (0.1 M) for 20 months, after which they were filtered and dried above silica gel. The treated powders were then analysed by FTIR using a Nicolet Avatar 360 spectrometer (ThermoFisher Scientific, Waltham, MA, USA) in transmission, with 30 mg of powder pressed into 300 mg potassium bromide pellets. The 852 cm−1 to 798 cm−1 peak height ratio was used to calculate the akaganeite to goethite ratio, following a previously developed calibration [22].

2.3. LCA for Preventive Conservation

The air exchange rate of a number of rooms used as stores for archaeological iron (and copper alloy objects) was measured using carbon dioxide tracer gas to ISO12569 and HMP200 probes and HM360 loggers (Vaisala, Vantaa, Finland) [40]. Two recently built rooms in large stores, one refurbishment of an existing historic building, the second purpose-built, were also tested using constant pressurisation with blower doors [41]. The dimensions of the rooms were measured by hand.
Internal and external temperature and RH were measured using Rotronic hygroclip II probes on a continuous radio telemetry system. Data for the previous year was used with the volume and air exchange rate (tracer gas) to calculate the mass of water vapour needed to be removed from the room per 30 min (the data interval). The RH and temperature was used to calculate the water vapour removal capacity of a MG50, MG90 and MCS dehumidifiers from manufacturer (Munters, Stockholm, Sweden) published data [42,43]. For each 30 min interval the capacity was compared to the mass of water vapour that needed to be removed. The ratio mass water vapour to be removed/capacity was used to estimate the percentage run time of the dehumidifier in that 30 min interval. This was multiplied by the power rating to estimate how much electricity would be needed. The relevant dehumidifier was installed in each space and run for a year, with the electricity metered using a Mecheer metre. Performance below 50% RH was checked from the RH/T monitoring.
The sustainability data for polypropylene Stewart boxes was estimated from similar data for polypropylene [34]. The average lifetime was estimated as 20 years from experience. The silica gel replacement needed was calculated as per showcase. The system requires humidity indicator cards (loggers/sensors are too expensive due to the large number of boxes used). Research has indicated these indicator cards start to read too low after 6 years of use and are replaced [39]. Indicative situations for a 3 m by 3 m by 8 m store with AER of 2.4/day, with 1000 30 by 30 by 8 cm Stewart boxes with 2 kg silica gel loading, changing at 15% RH, were calculated.

2.4. Overall LCA

A partial LCA has been undertaken using the data gathered for an imagined collection of archaeological iron. This was considered to consist of 1000 small objects with a total of 200 kg in mass. Three scenarios were considered: full sodium hydroxide desalination, full alkaline disulfite desalination and targeted sodium hydroxide desalination, all with oxygen depletion measurements after each treatment. Then, 80 objects were displayed at Porchester castle, in 8 showcases, with 4 requiring control to 30% RH. Those 4 controlled cases had an AER of 0.4 and were 100 cm by 60 cm by 30 cm glass; 30 kg steel and a 20 kg MDF plinth. The controlled cases contained 11 kg silica gel each. An annual 340 km roundtrip was required to replace the silica gel, which was required to control to 30% RH (and four others requiring no RH control). The remainder of them were stored at Temple Cloud (an English Heritage store facility) in 200 polypropylene boxes (1 kg, AER 0.35/day, 2 kg dry silica gel replaced at 16%, indicating card, no travel to recondition silica gel). The process was considered for a 20-year period.

3. Results

3.1. LCA for Conventional Desalination Treatments

The LCA outputs for the materials used in desalinating 1 kg of archaeological iron are shown in Table 1.
No reliable figures exist for disposing of sodium hydroxide or alkaline disulfite solutions. Some practitioners reactivate sodium hydroxide solution by removing chloride ions with ion exchange resins. Some lifecycle assessments of similar resins have been published [44]. Assuming a resin could be reused 10 times, the GWP was 0.27 kg CO2eq per 1000 L of water treated. In the UK, diluted sodium hydroxide solutions can be disposed of through the drainage system. Depending on local regulations, circa four to one dilution would be required and the UK BEIS calculator figure for wastewater treatment has been used [37]. Note this only includes GWP and no other LCA parameters. This data has been generated for treating objects individually. Bulk treatments would use the same ratio of solution-to-object, so the results for this section would be unaffected. Bulk treatments may alter conservator time and hence apportionment of the energy used to condition a studio (reported in Section 3.5).

3.2. Investigation into Sodium Hydroxide Treatments

The fragment oxygen depletion and thermomagnetometry results are shown in Table 2.
The nail fragment results are variable, even for the pieces from the same nail. None of the pieces depleted oxygen at 14% RH. Most had some depletion at 50% RH. The nails selected for cutting and testing mainly showed ongoing corrosion. Two (F and G) did not appear to be corroding. The results are ordered by decreasing oxygen depletion rate. The three nail pieces with the highest corrosion rates were selected to assess the sodium hydroxide method. The thermomagnetometry of those samples with akaganeite indicated that it was of the type produced at middling RH, with derivative peaks around 280 °C. Thermomagnetometry is thermogravimetric analysis, showing all transitions with some additional mass losses due to thermal transitions of magnetic materials to non-magnetic products [39].
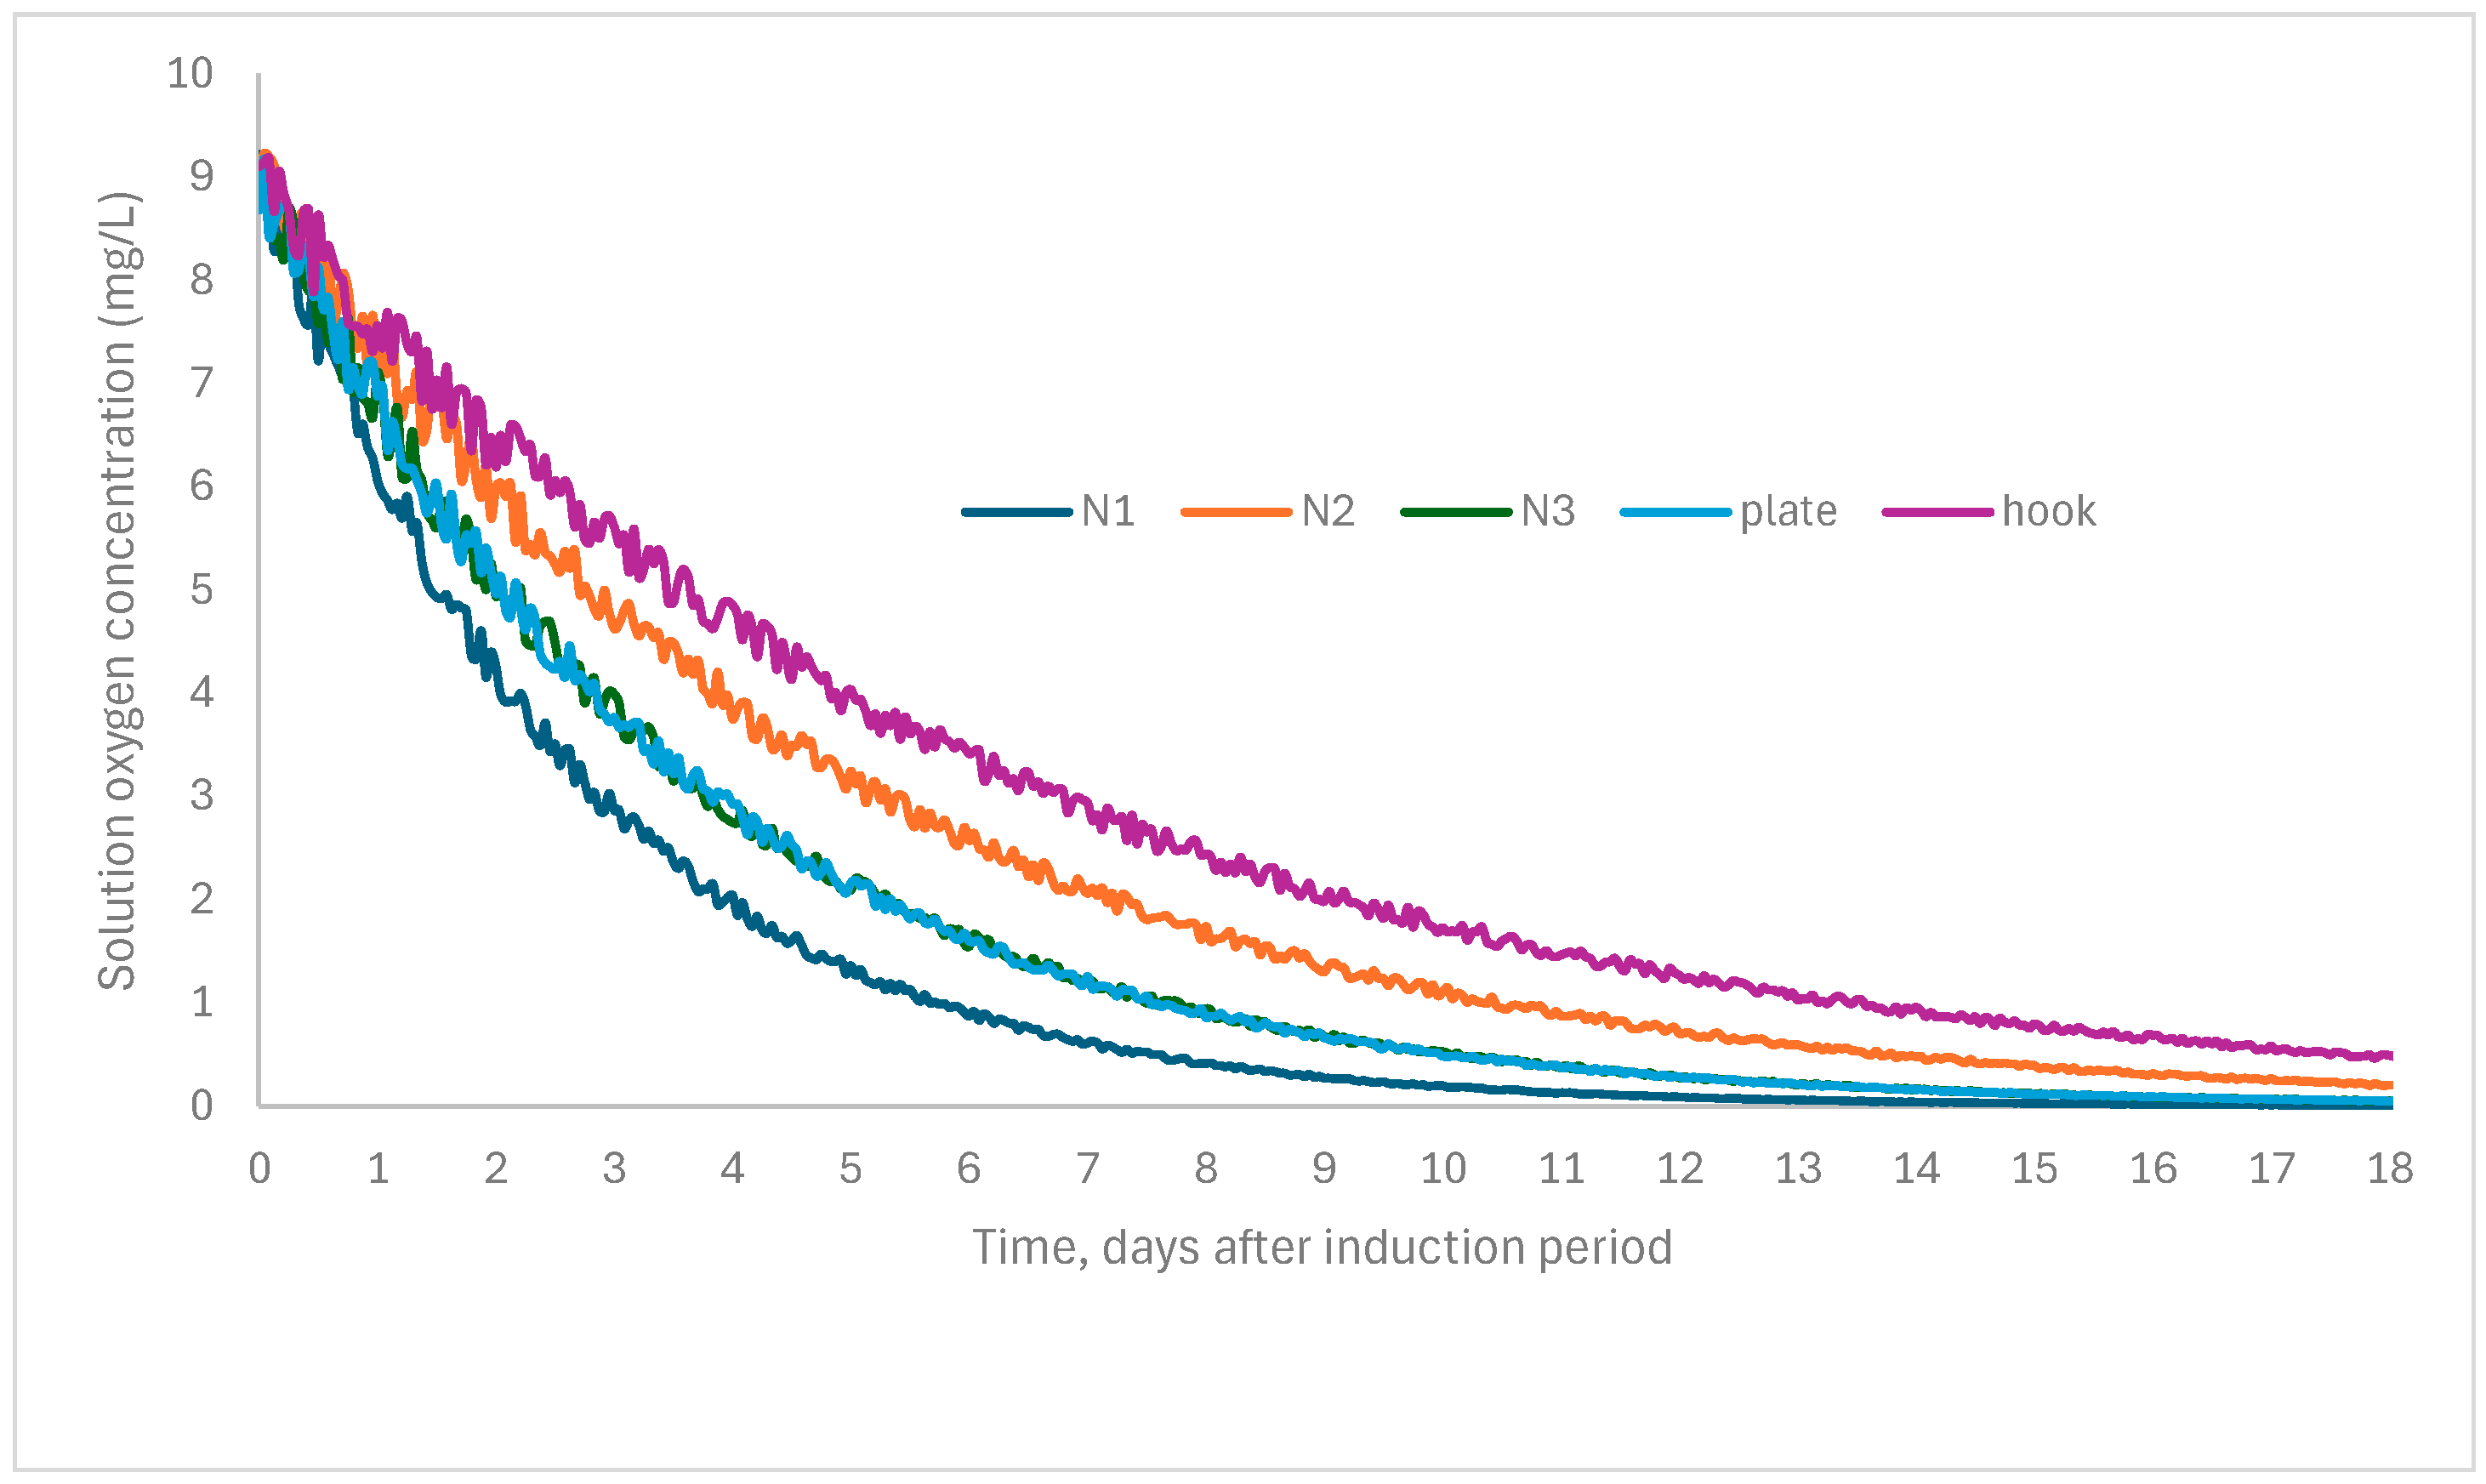
The oxygen concentrations of the desalination solutions are shown in Figure 1.
There was a variable period when the solution oxygen content remained near the room value of 20.8%. The hook had the shortest of these periods at 0.76 days, and Nail 2 the longest at 1.48 days. This induction period may well be related to the time the solution takes to penetrate the piece sufficiently to meet uncorroded iron. Once this is reached, the akaganeite reaction that then occurs depletes oxygen. After this period, the oxygen concentration fell off exponentially, but with quite different rates. The graphs have been recalculated to set time at zero at the end of the induction period—Figure 2.
Nail 3 lost oxygen from the solution most rapidly. Nail 1 and the plate were very similar. Nail 2 lost oxygen the slowest of the nail pieces, and the thicker hook retained oxygen in the solution for the longest period. The differences in behaviour are likely due to a combination of material thickness to penetrate, and the different pore size distributions of the corrosion product layers on the surfaces.
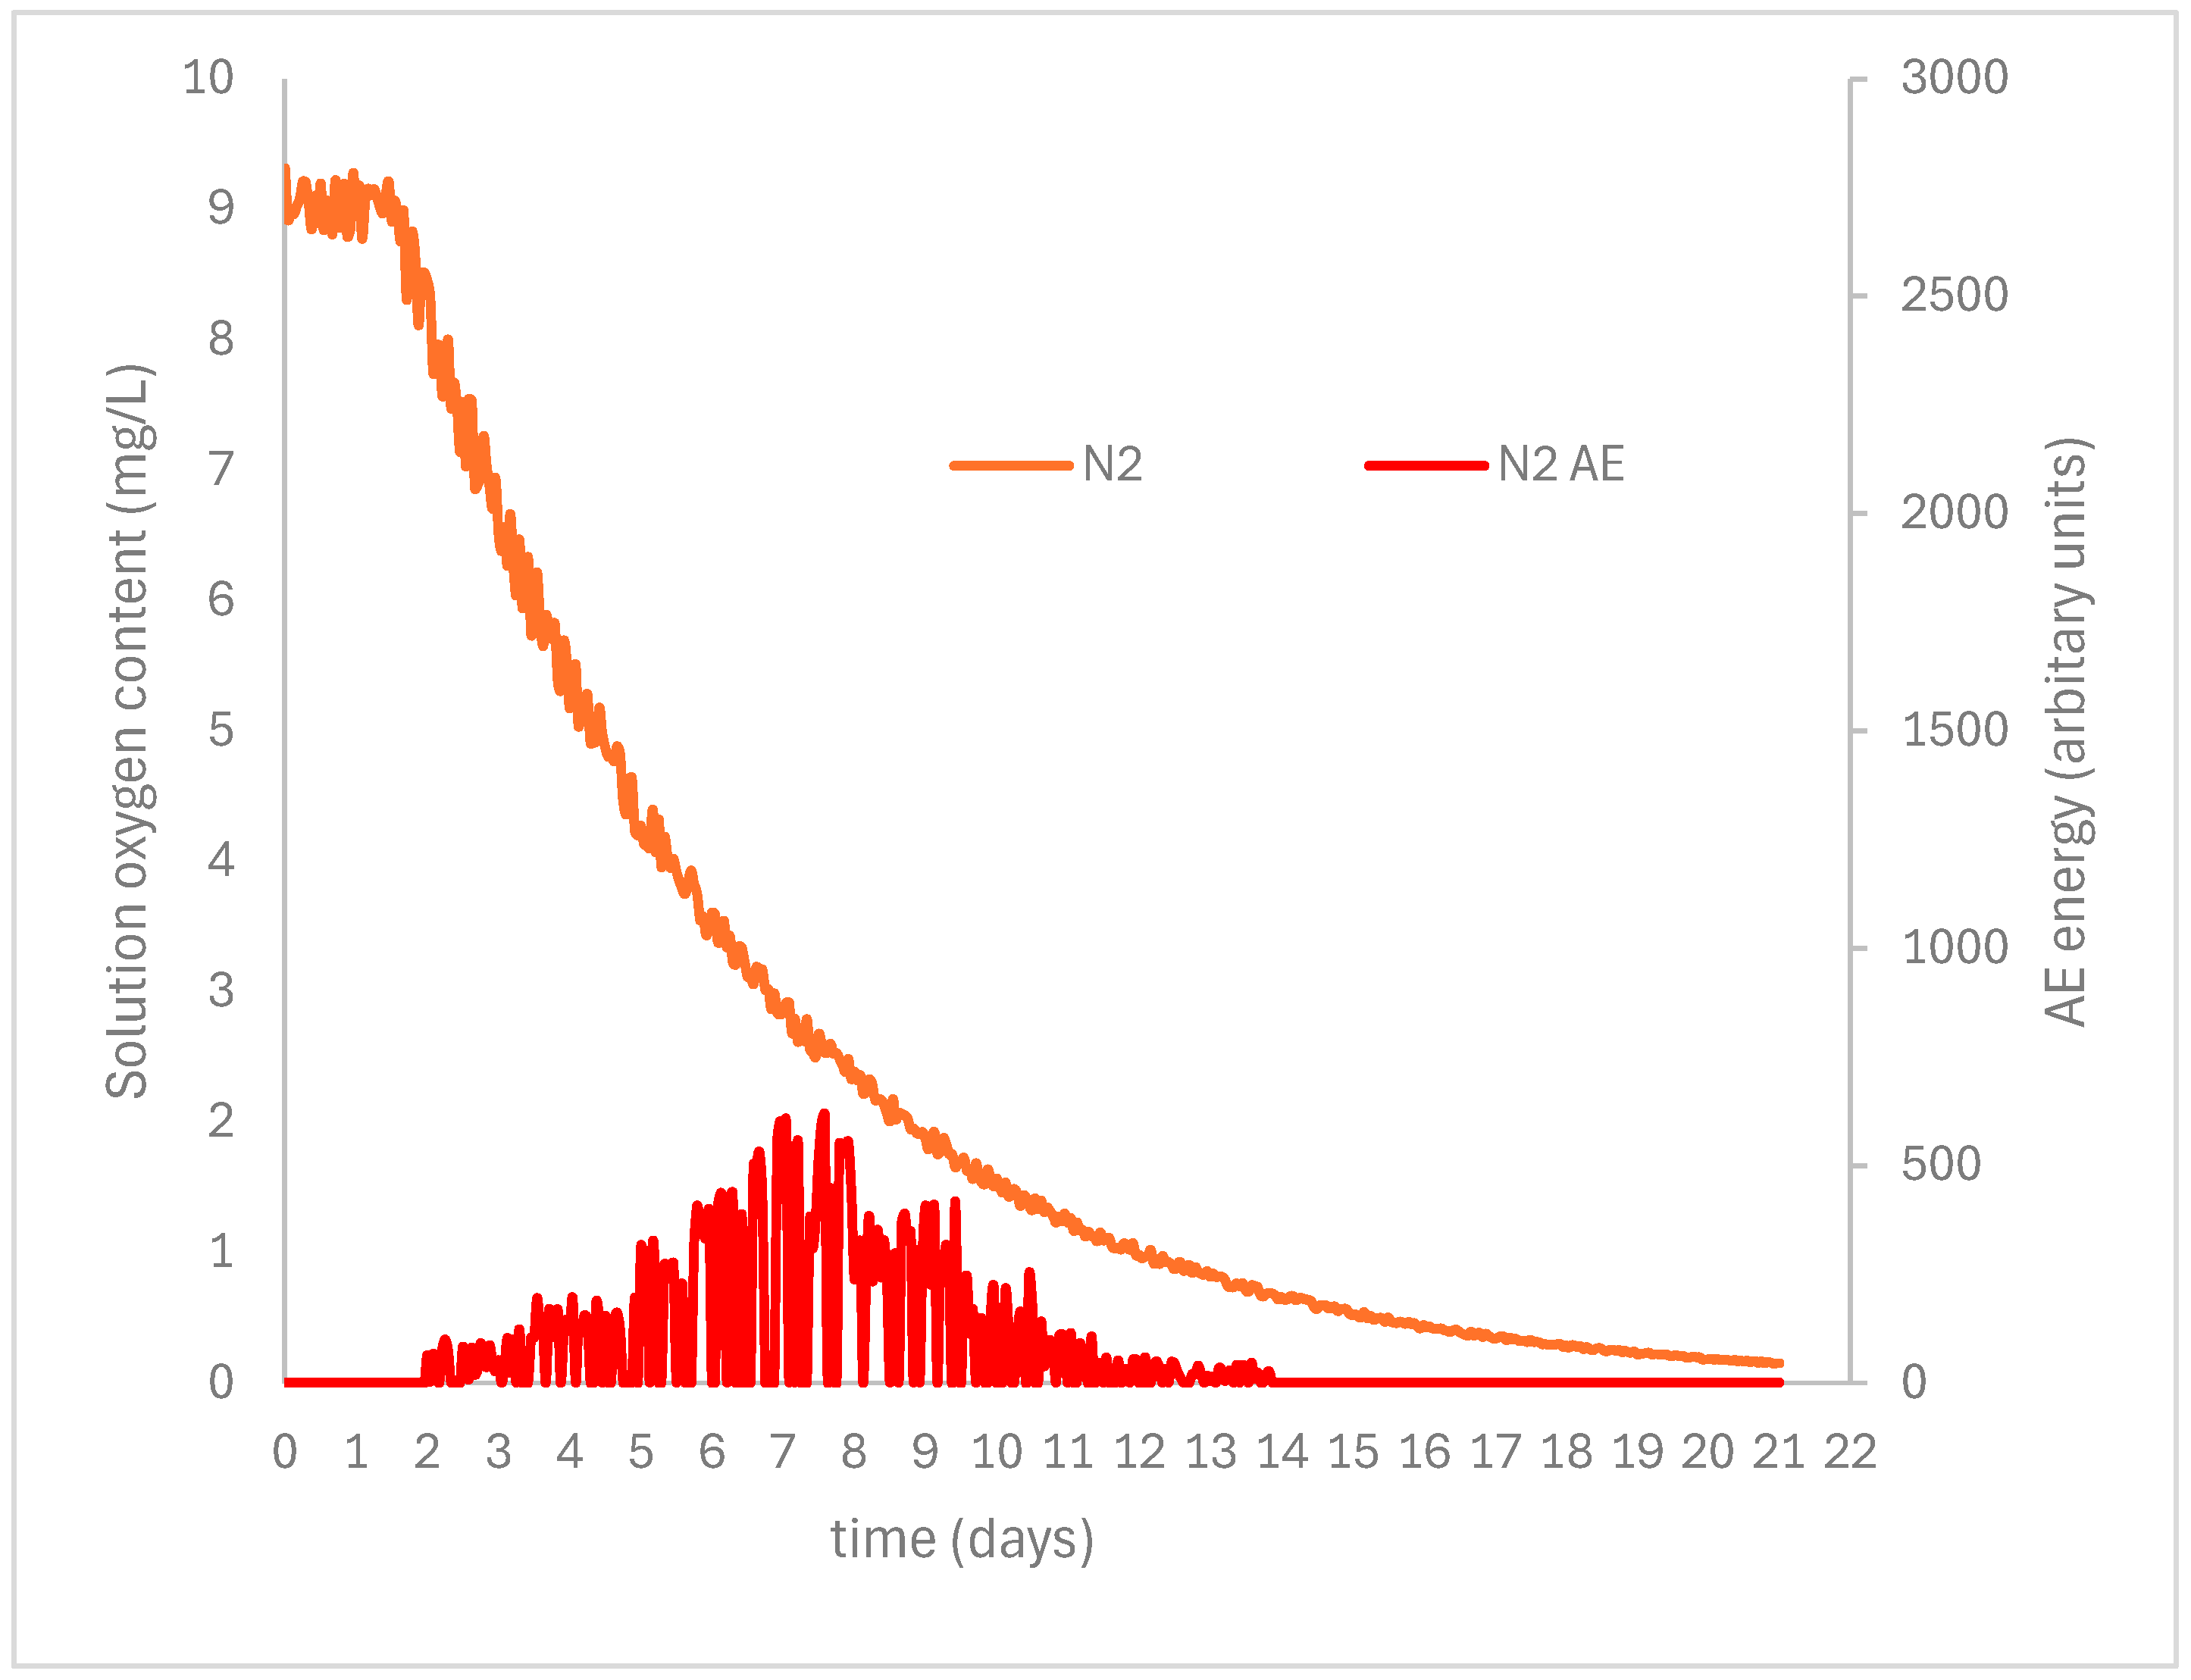
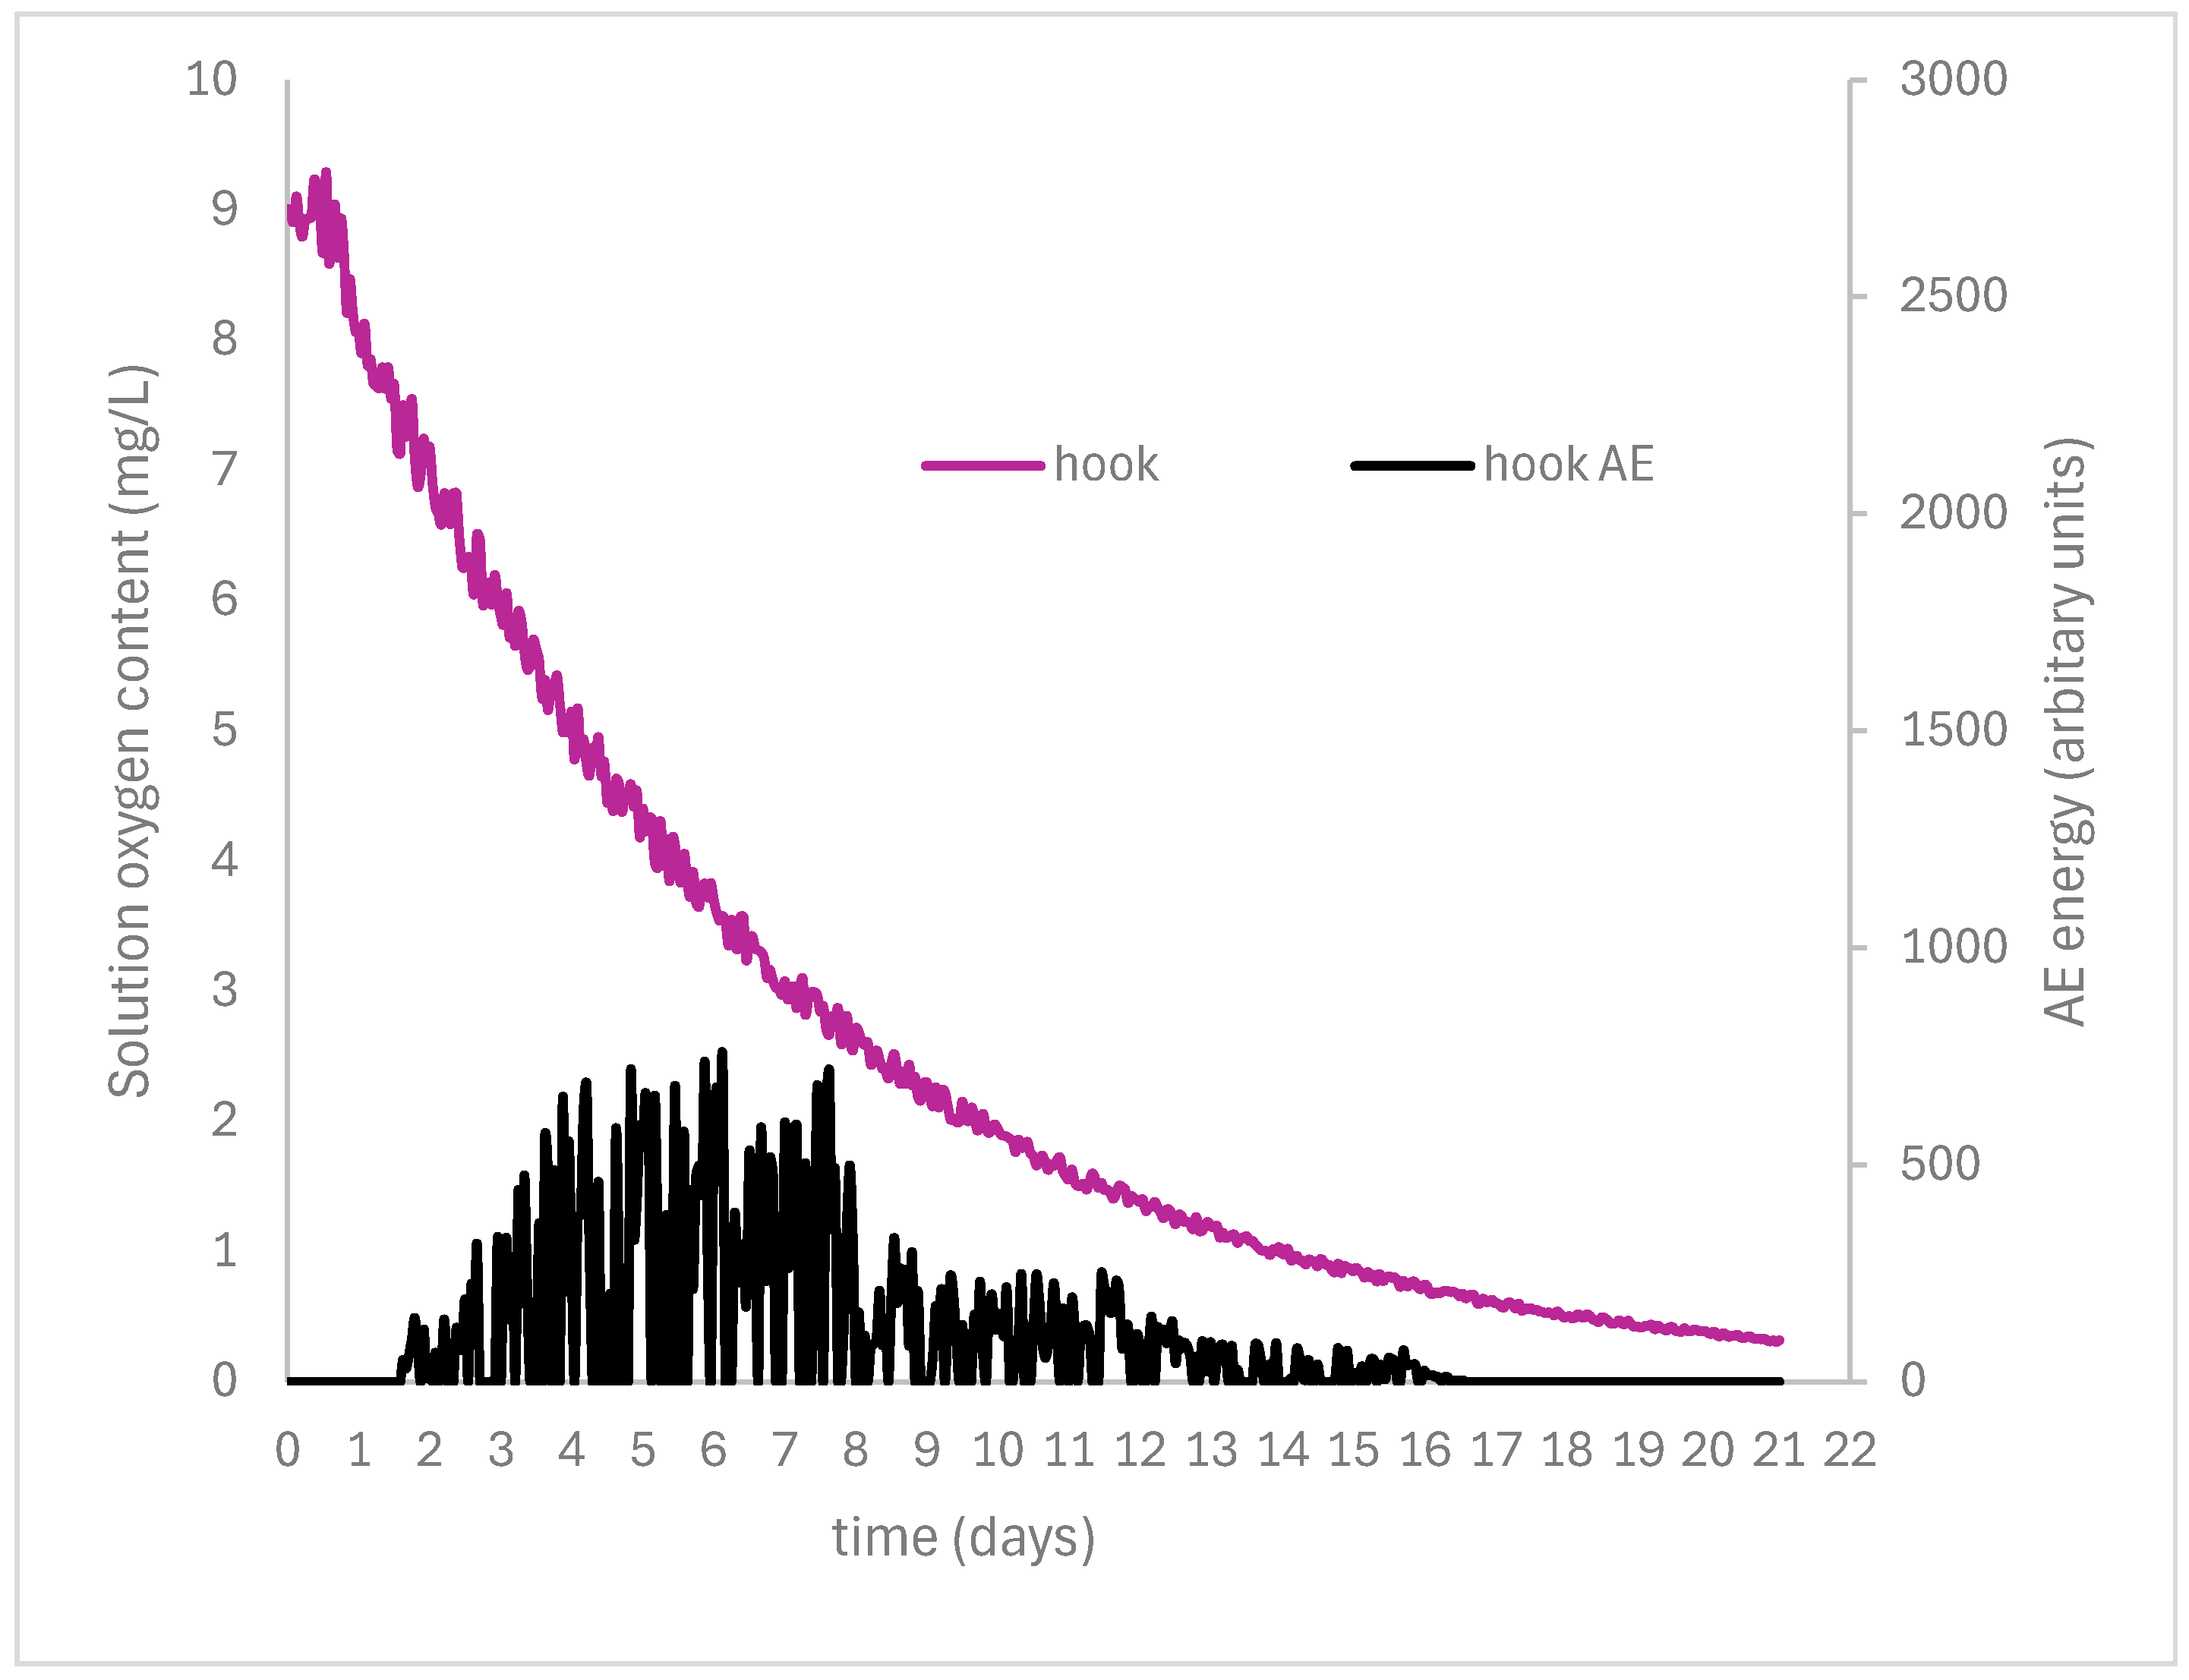
Only two pieces recorded acoustic emission: nail 2 and the hook. Results with the solution oxygen concentrations are shown in Figure 3 and Figure 4.
The acoustic emission increases after 2 days in the solution, and then slowly decreases. The last event was recorded when the oxygen concentration had dropped to 0.64 mg/L.
For the hook, the acoustic emission started earlier (after 1.4 days) and stopped when the oxygen concentration in the solution dropped to 0.67 mg/L.
After treatment and drying, the hook depleted oxygen at 14% RH and at 50%. Nail piece 2 depleted oxygen at 50%, but no depletion was measurable at 14%. All other pieces did not deplete oxygen at either RH value. The total energy of acoustic emission from the hook was 52,260, compared to 40,187 from Nail 2. It is possible that not enough akaganeite was formed at high RH in the nail to record oxygen depletion above the detection limit in the 14% RH test.
The akaganeite and goethite ratios of the sodium hydroxide exposed akaganeite samples are shown in Table 3.
The higher the RH at which akaganeite was formed, the lower the amount transformed to stable goethite by sodium hydroxide immersion. These results are comparable to the 90% formed akaganeite reported by Rimmer [17] and do not agree with Al-Zahrani’s work [21].

3.3. LCA for Preventive Conservation

The room details and the estimated and predicted energy uses of dehumidifiers are shown in Table 4.
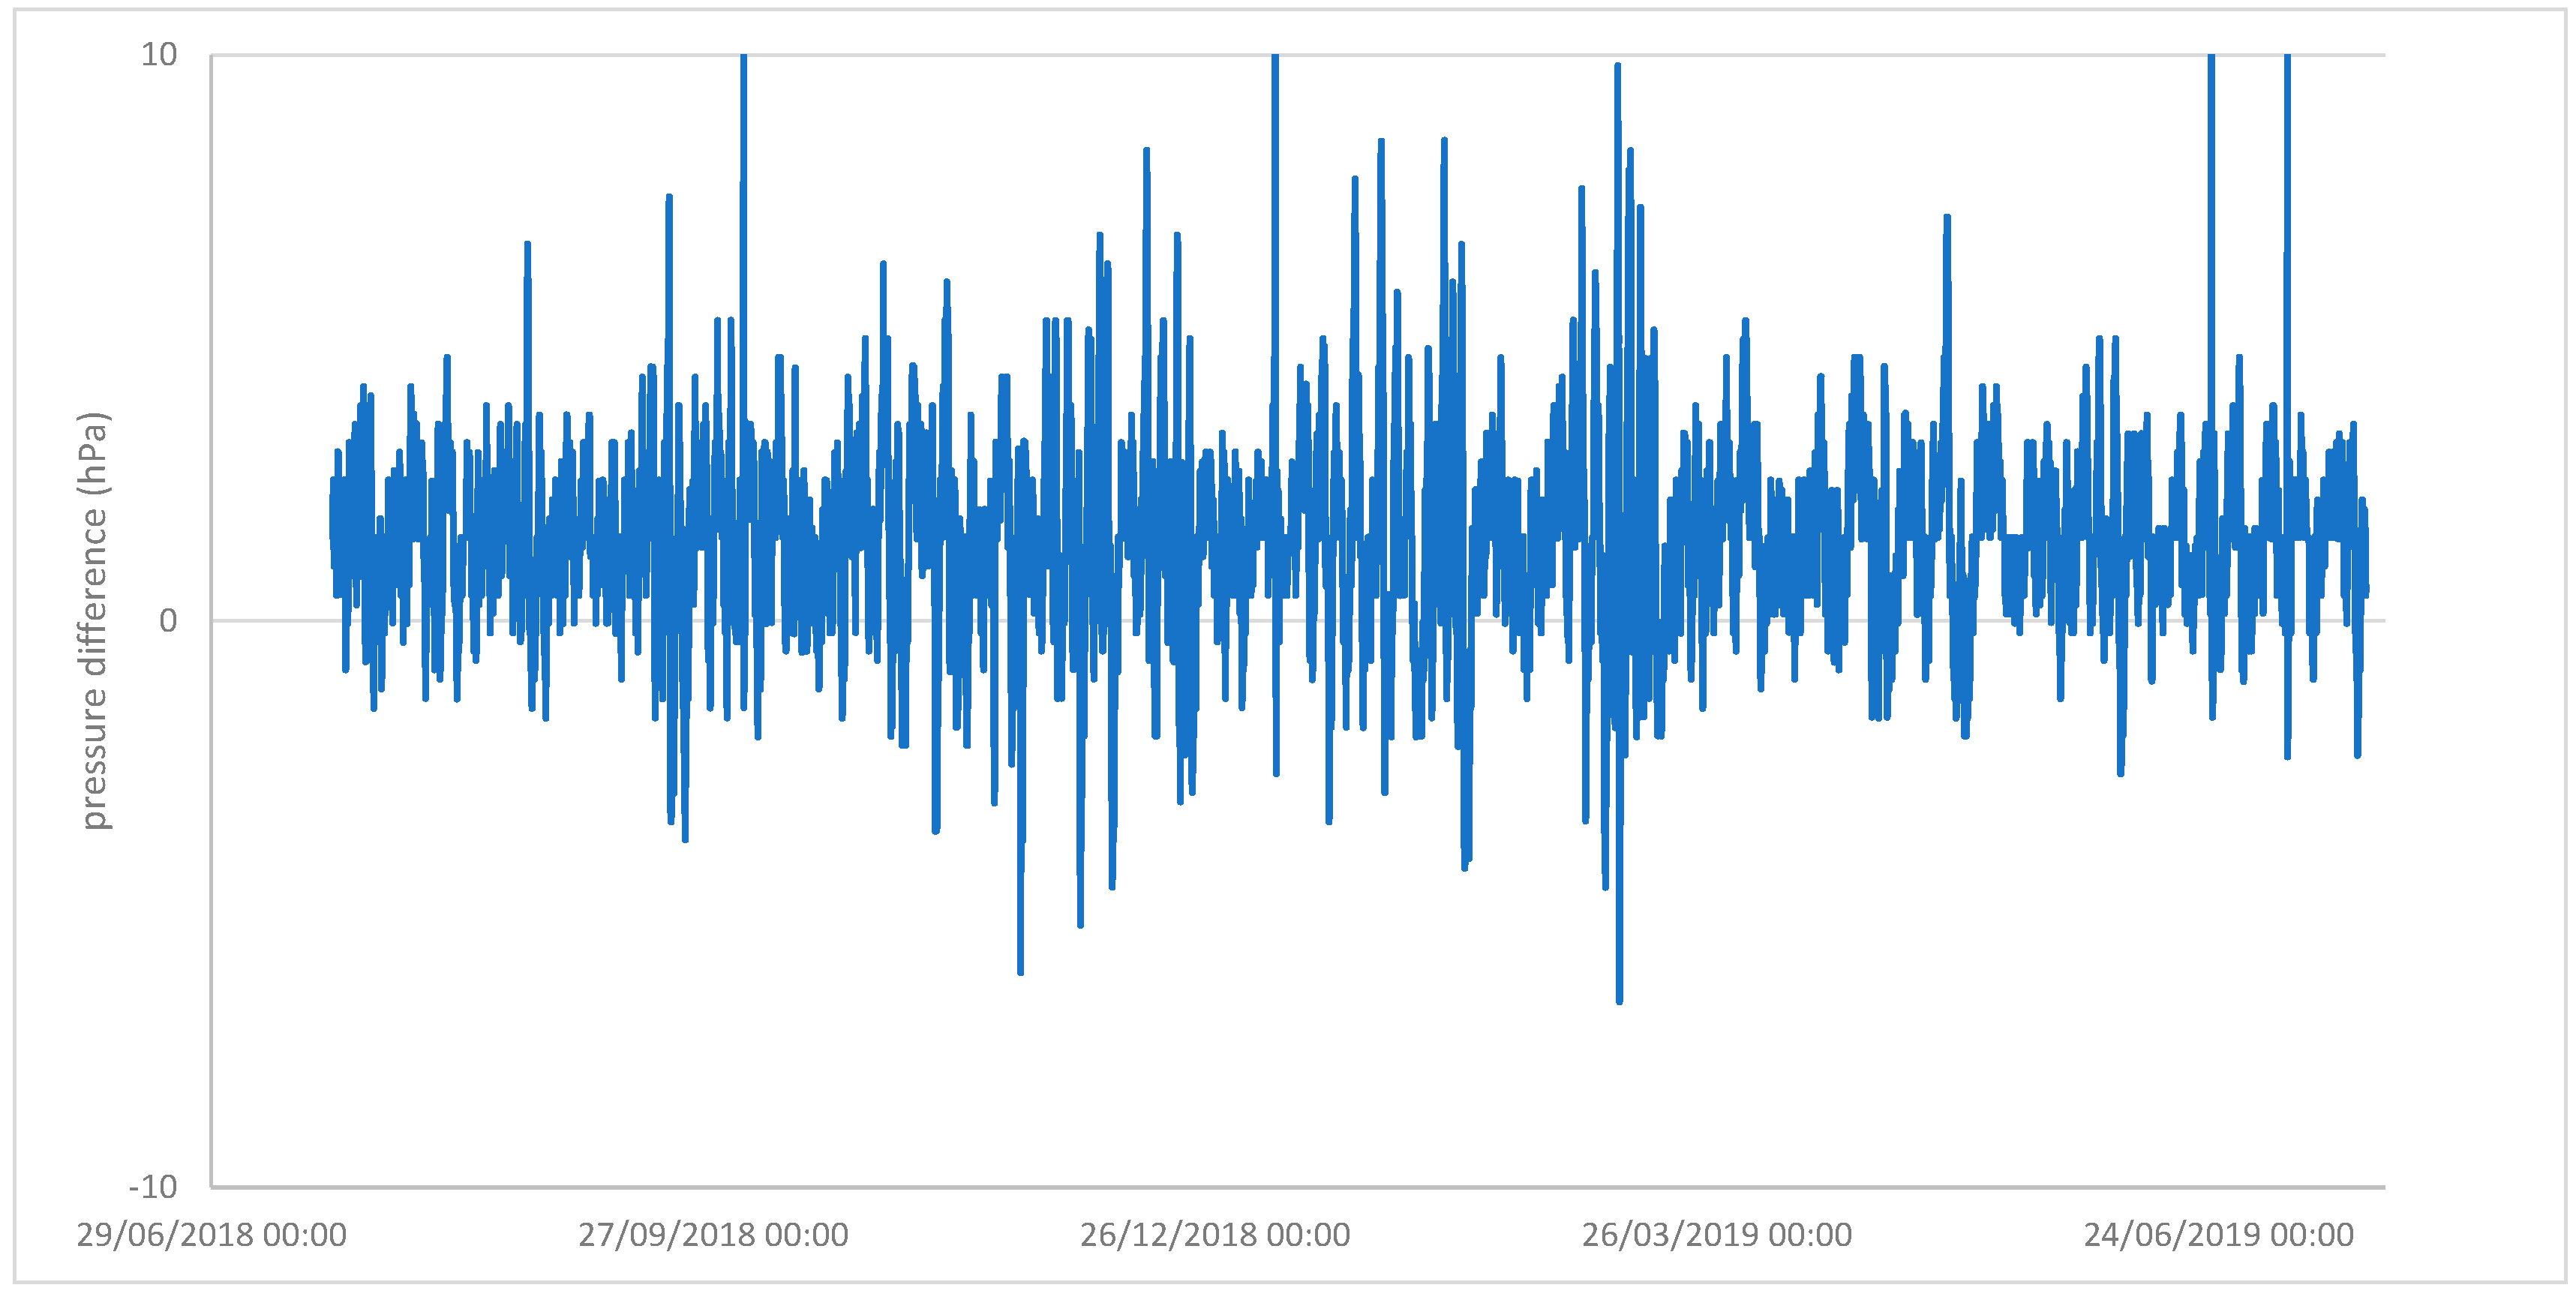
The estimates for energy use from the spreadsheet approach have reasonable accuracy. For traditional brick, wood and plaster construction, the windows had by far the greatest contribution to air exchange. This is unsurprising, as they connect to the external air. Leakage through the floor was greater than though the ceiling. Pressurisation always gives a higher air exchange rate than carbon dioxide decay. Figure 5 shows the pressure differences between inside the main store at Wrest and externally.
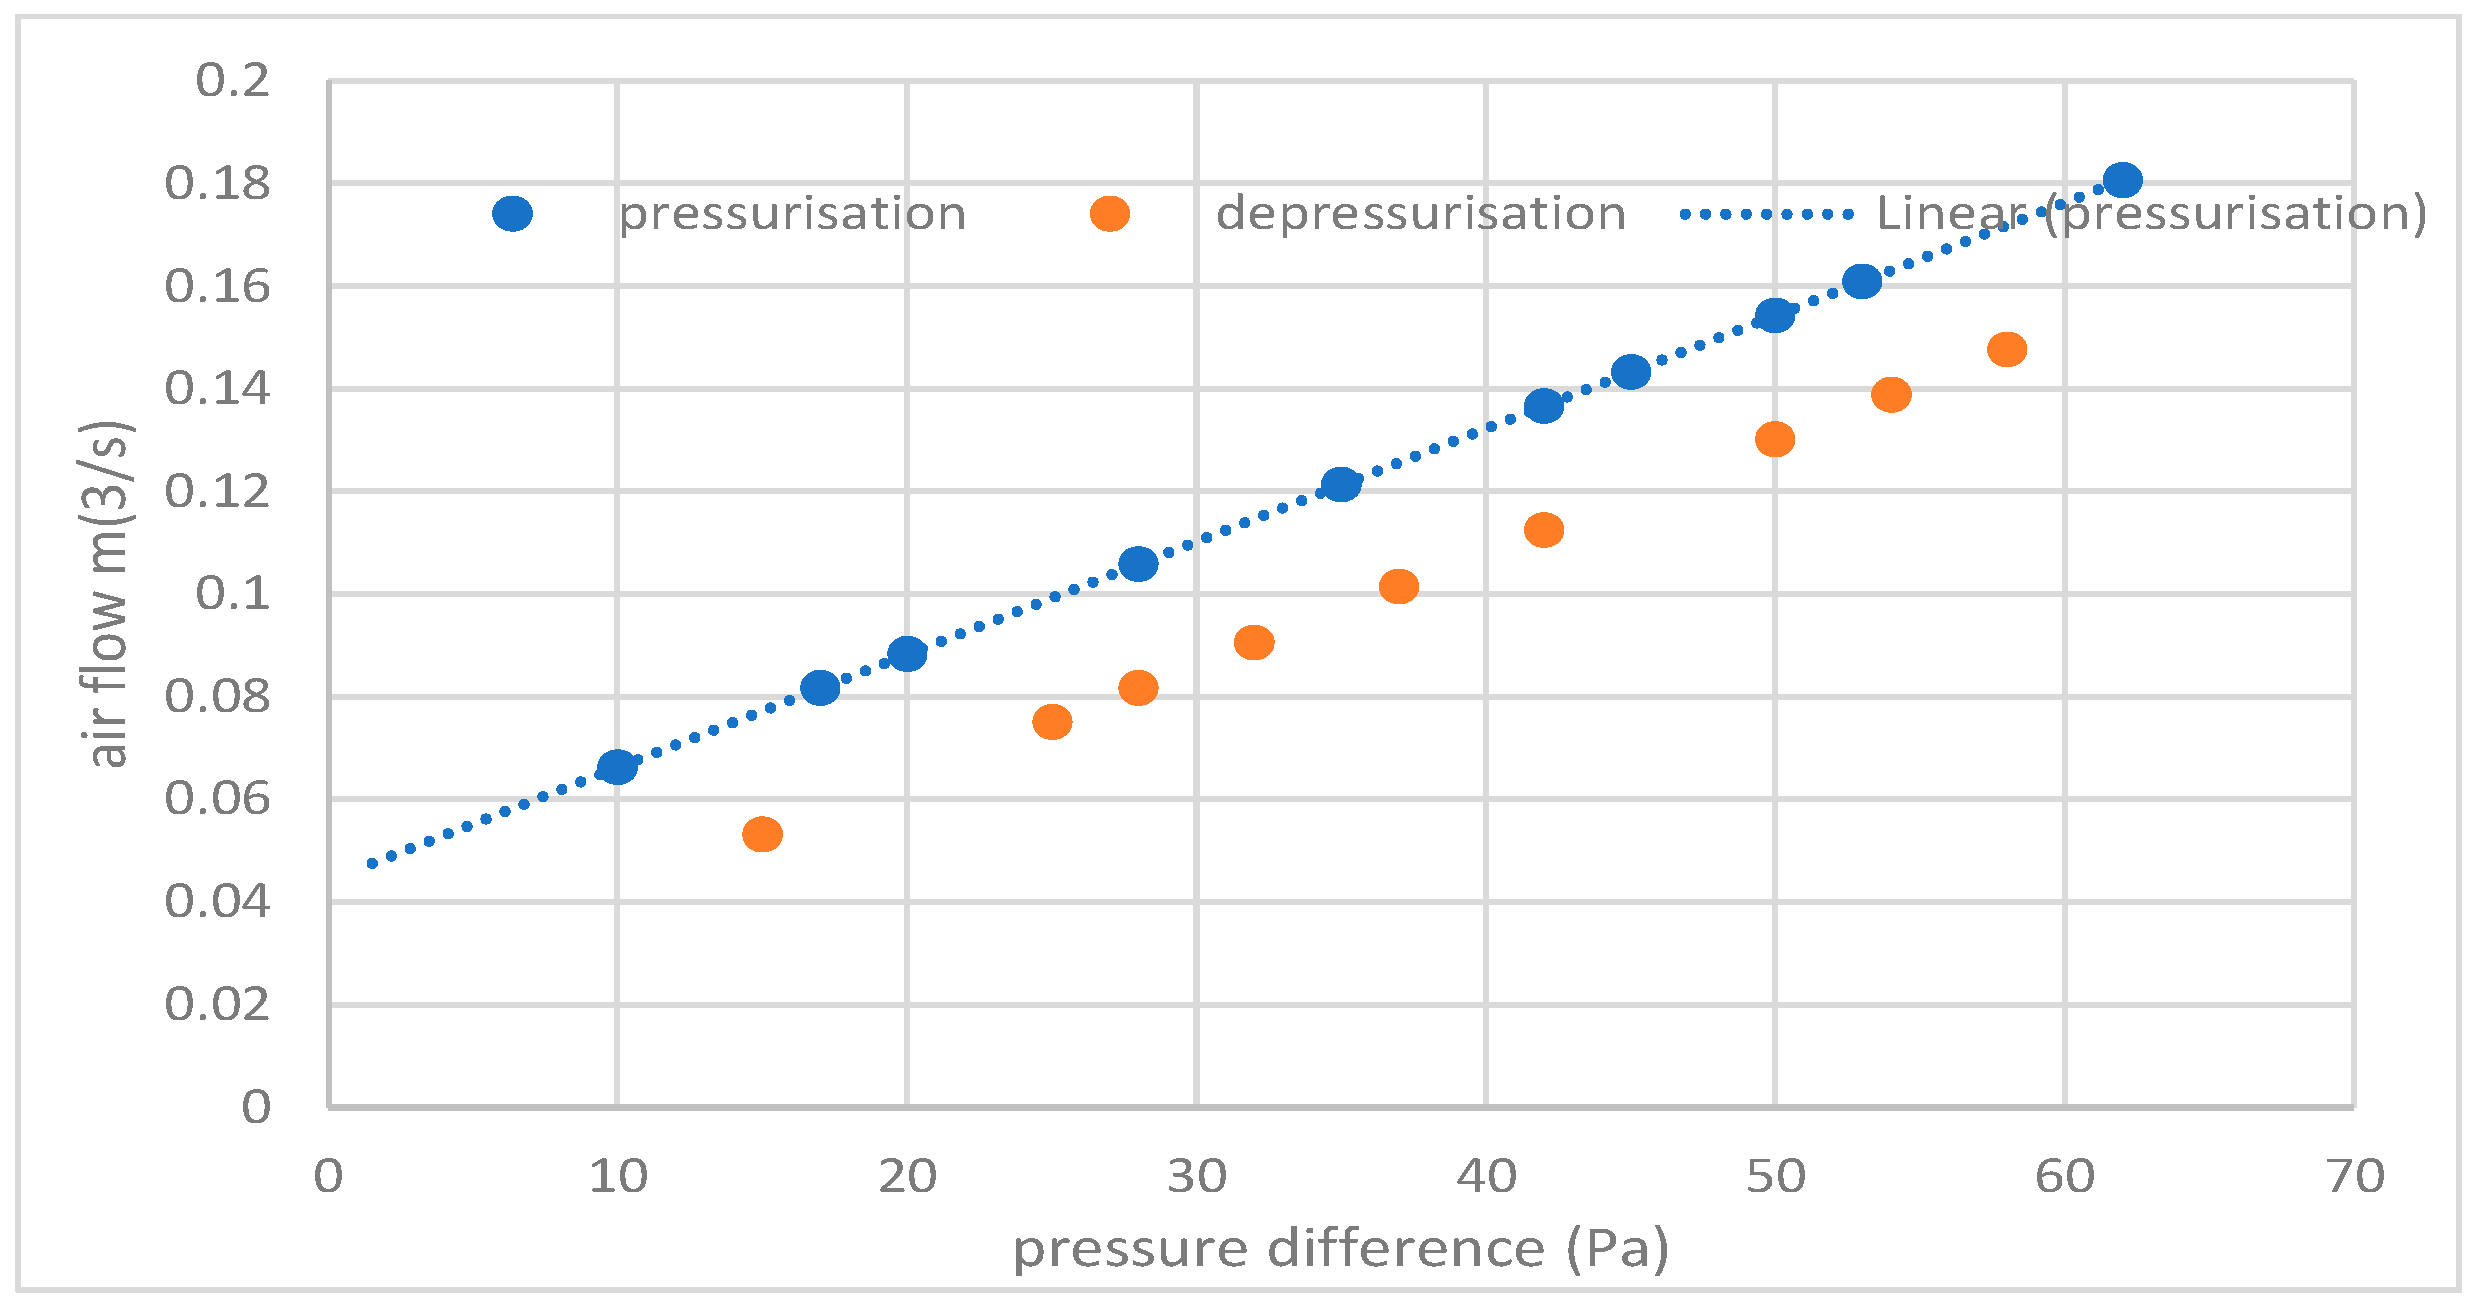
Examination of the pressure differences indicated an average difference of 1.47 hPa. The air movement versus pressure difference graph generated by the blower door test is shown in Figure 6.
Combining this with the average pressure difference would give an air movement of 0.0475 m3/s, generating a lower average air exchange rate of 1.06/day and in closer agreement with the carbon dioxide decay test. It should be noted that all the previous testing of the spreadsheet for showcases used carbon dioxide decay test air exchange rates.
The impacts of dehumidifiers and dry storage in polypropylene boxes are shown in Table 5.

3.4. LCA Display

The major additional impact for display is the embedded carbon in showcases. An estimation approach has been previously detailed [31]. As English Heritage manages 120 sites with collections spread across England, the travel to change the silica gel has a major carbon impact. Ovens are located at five sites and dry silica gel has to be transported to the 31 sites with dried showcases [45]. Careful design and testing of showcases has extended the period between changing silica gels to over 18 months, even in some of the very high RH environments present. The gel is changed on an annual basis when the minimum site check occurs. For most institutions on a single site this is not an issue.
The environmental impacts of showcases can be estimated from the masses (kg) of their constituent materials. The values are shown in Table 6.
So far, no manufacturer has published an LCA for their showcases. Within the UK, no showcase manufacturers are large enough to be required to publish under the Streamlined Energy and Carbon Reporting requirements.

3.5. Overall LCA

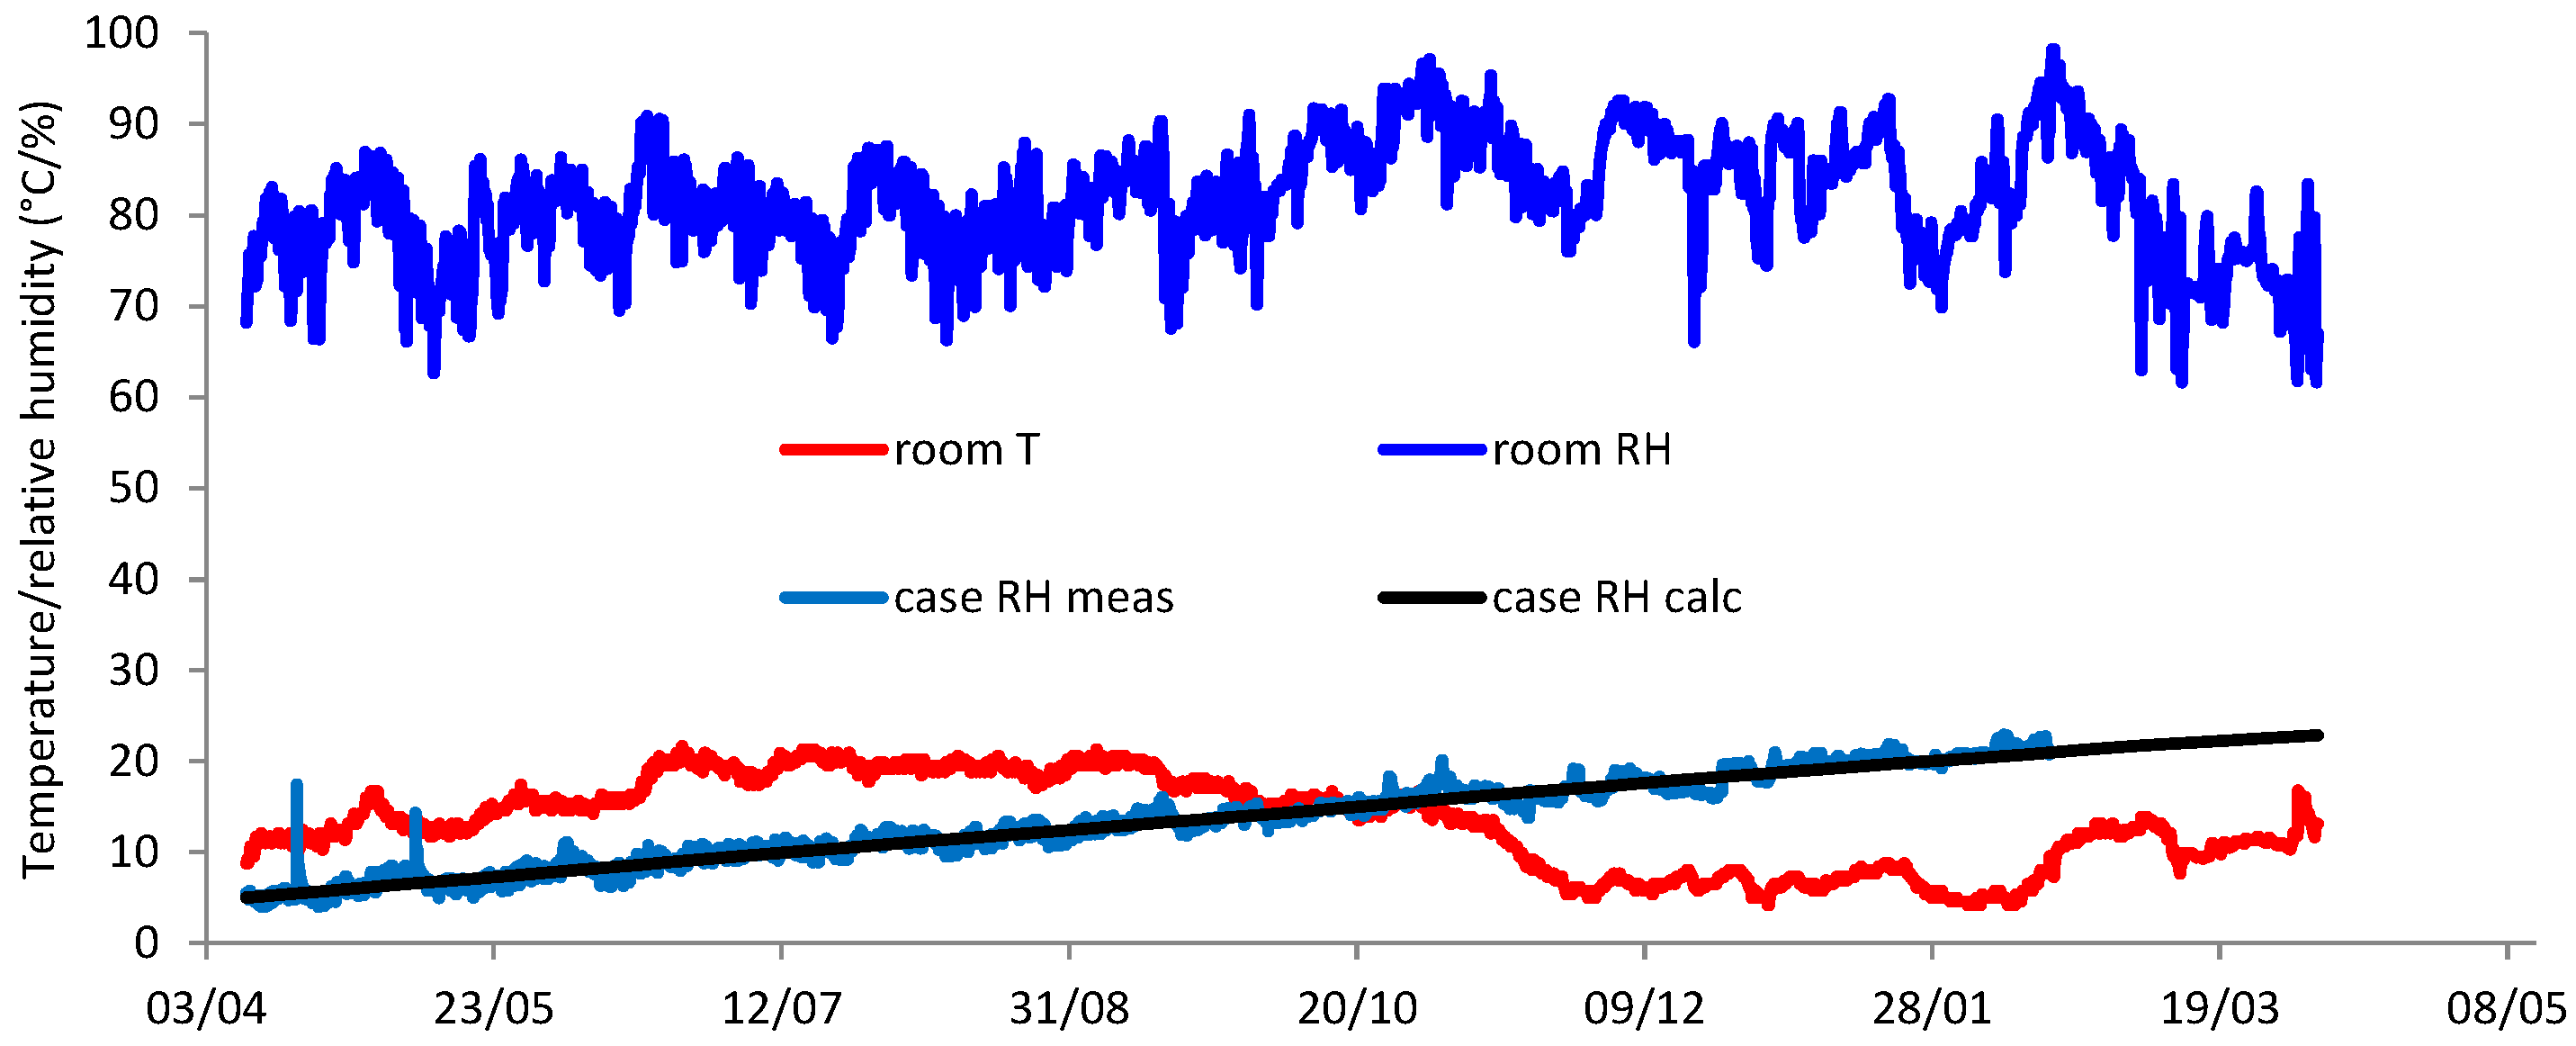
Under the first scenario with no treatment, approximately 40% of the objects could be expected to be unstable and require low RH conditions. If all objects were oxygen-depletion tested to identify those that were unstable, the showcases needing conditioning could be identified. This equates on average to four showcases requiring RH control for the 80 objects, and four cases not requiring control. The predicted and measured internal RH for the showcase volumes, AER and amount of dry (5% RH) silica gel is shown in Figure 7.
The calculations indicated the internal RH would take 17 months to increase to the 30% limit. Hence, replacing the silica gel every 12 months (the minimum period without conservation inspection of the site) will keep the conditions required. The silica gel was changed after 12 months. There is an excellent agreement of the predicted (modelled) and measured RH data in the 12-month period. In practice, air exchange rates for showcases vary greatly, and the RH increase inside them will also vary. Showcases are specified with a maximum AER of 0.40/day in this instance, and manufacturers are required to meet this (tested internally) for full payment of the contract. This 12-month period means 20 trips would be required to replace the silica gel. For Pevensey, which is 340 km from the nearest store with an oven to regenerate silica gel and using UK BEIS conversion factors for a lower medium petrol car (0.1639 kg CO2eq/km), each trip generates 10 kg CO2eq. The extended performance time allows for unexpected delays in changing silica gel, and was immensely useful during the COVID pandemic, when operations were severely disrupted. It could be debated whether the embedded carbon from just the four controlled showcases or all eight showcases should be included. Only the four controlled showcases have been included in this example. With 50 kg glass, 20 kg steel and 15 kg MDF, they each contribute 349 kg CO2eq. For display, the total over 20 years is 1751 kg CO2eq.
The remainder of the objects would be stored at Temple Cloud in 80 polypropylene boxes. The whole room contains 350 polypropylene boxes. The annual energy consumption of the Munters MG50 dehumidifier is 401 kWh. This equates to 1764 kg CO2eq over twenty years. The annual filter replacements give another 7 kg CO2eq. The average lifetime of that unit would require it to be replaced once in the 20-year period, contributing another 93 kg CO2eq. For the whole storeroom, this is 1864 kg CO2eq. For this part of the boxes present, this equates to 424 kg CO2eq.
Under the full sodium hydroxide treatment scenario, 83% of the objects (830), would be stable at the end of the treatment. The treatment would have a carbon footprint of 1393 kg CO2eq. This is composed of the materials, the heating and electricity emissions, proportioned by the percentage of objects in the studios over the year, and the staff travel. The number of objects is available from the studio registers, and in this example 1000 objects would be 27% of the annual total. Staff travel for the desalinations only would be 100 person days, with a distance of 26 km, on public transport (bus). The UK BEIS conversion factor is 0.075 kg CO2eq/km. Only one showcase would now need to be controlled to low RH. However, the operational carbon is from the travel, which does not change.
The likely mixed nature of the collection and curatorial practice means it is unlikely that any box would only contain stable objects, so all would still need to be controlled below 16% RH. This would equate to the same carbon footprint as the previous example.
With full alkaline disulfite treatment, the outcome is likely to be very similar based on Rimmers’ work. Only the materials embedded carbon changes and increases. The total would be 1362 kg CO2eq
For targeted treatment, only those objects that consume oxygen were treated, this was estimated at 40% or 400 objects. The sodium hydroxide treatment would have a carbon footprint of 720 kg CO2eq. This would leave 52 unstable objects. The display and storage values remain the same.
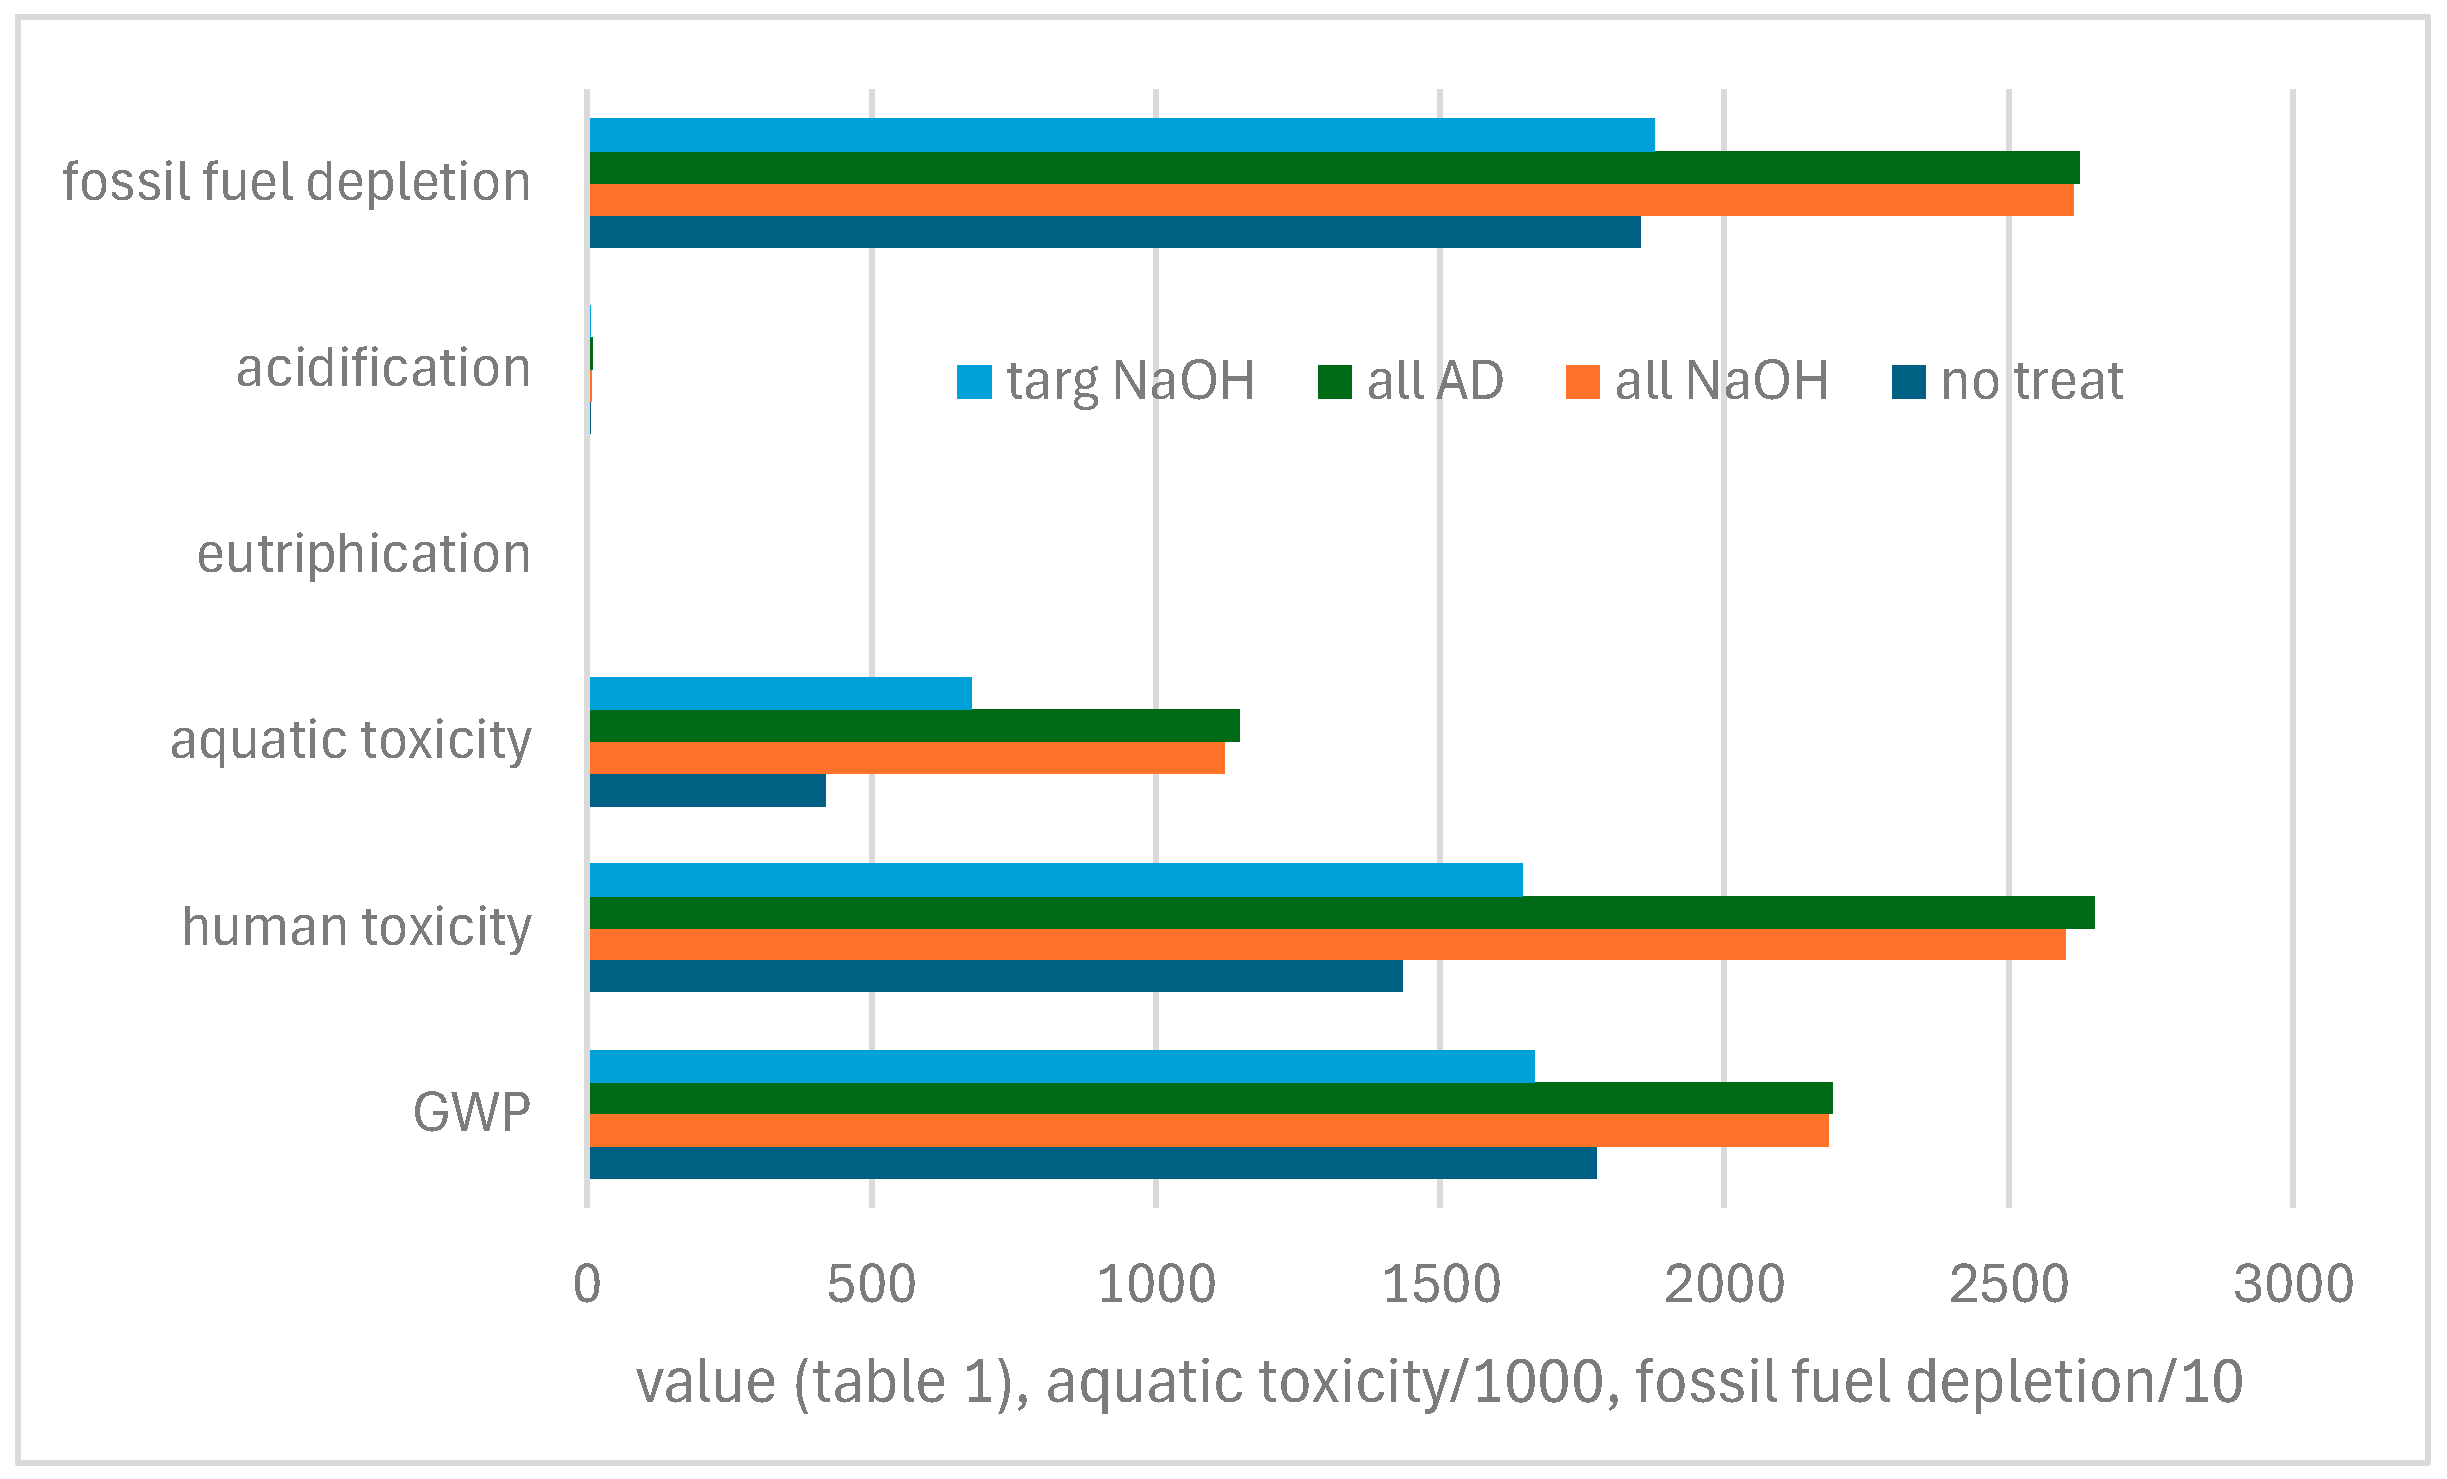
Comparative results are shown in Figure 8.
The x-axis has the values given in Table 1. Aquatic toxicity and fossil fuel depletion are much larger and have been scaled to make a readable graph. No treatment has a lower environmental impact, but no treatment at all will lead to loss of archaeological information. The RH set points have been selected on acceptable loss of value and will not produce zero change to the objects. While this is technically feasible (display and storage at 11%), it is well beyond the resources available to English Heritage). There is little difference between sodium hydroxide and alkaline disulfite treatments in terms of environmental impact. The targeted sodium hydroxide treatment (using oxygen depletion tests) is similar overall to no treatment (due to the lower number of controlled showcases needed). It is better for some impacts and worse for others. Balancing the relative value of different environmental impacts is very challenging. Some industries have developed schemes and an approach for conservation has been elucidated [43].
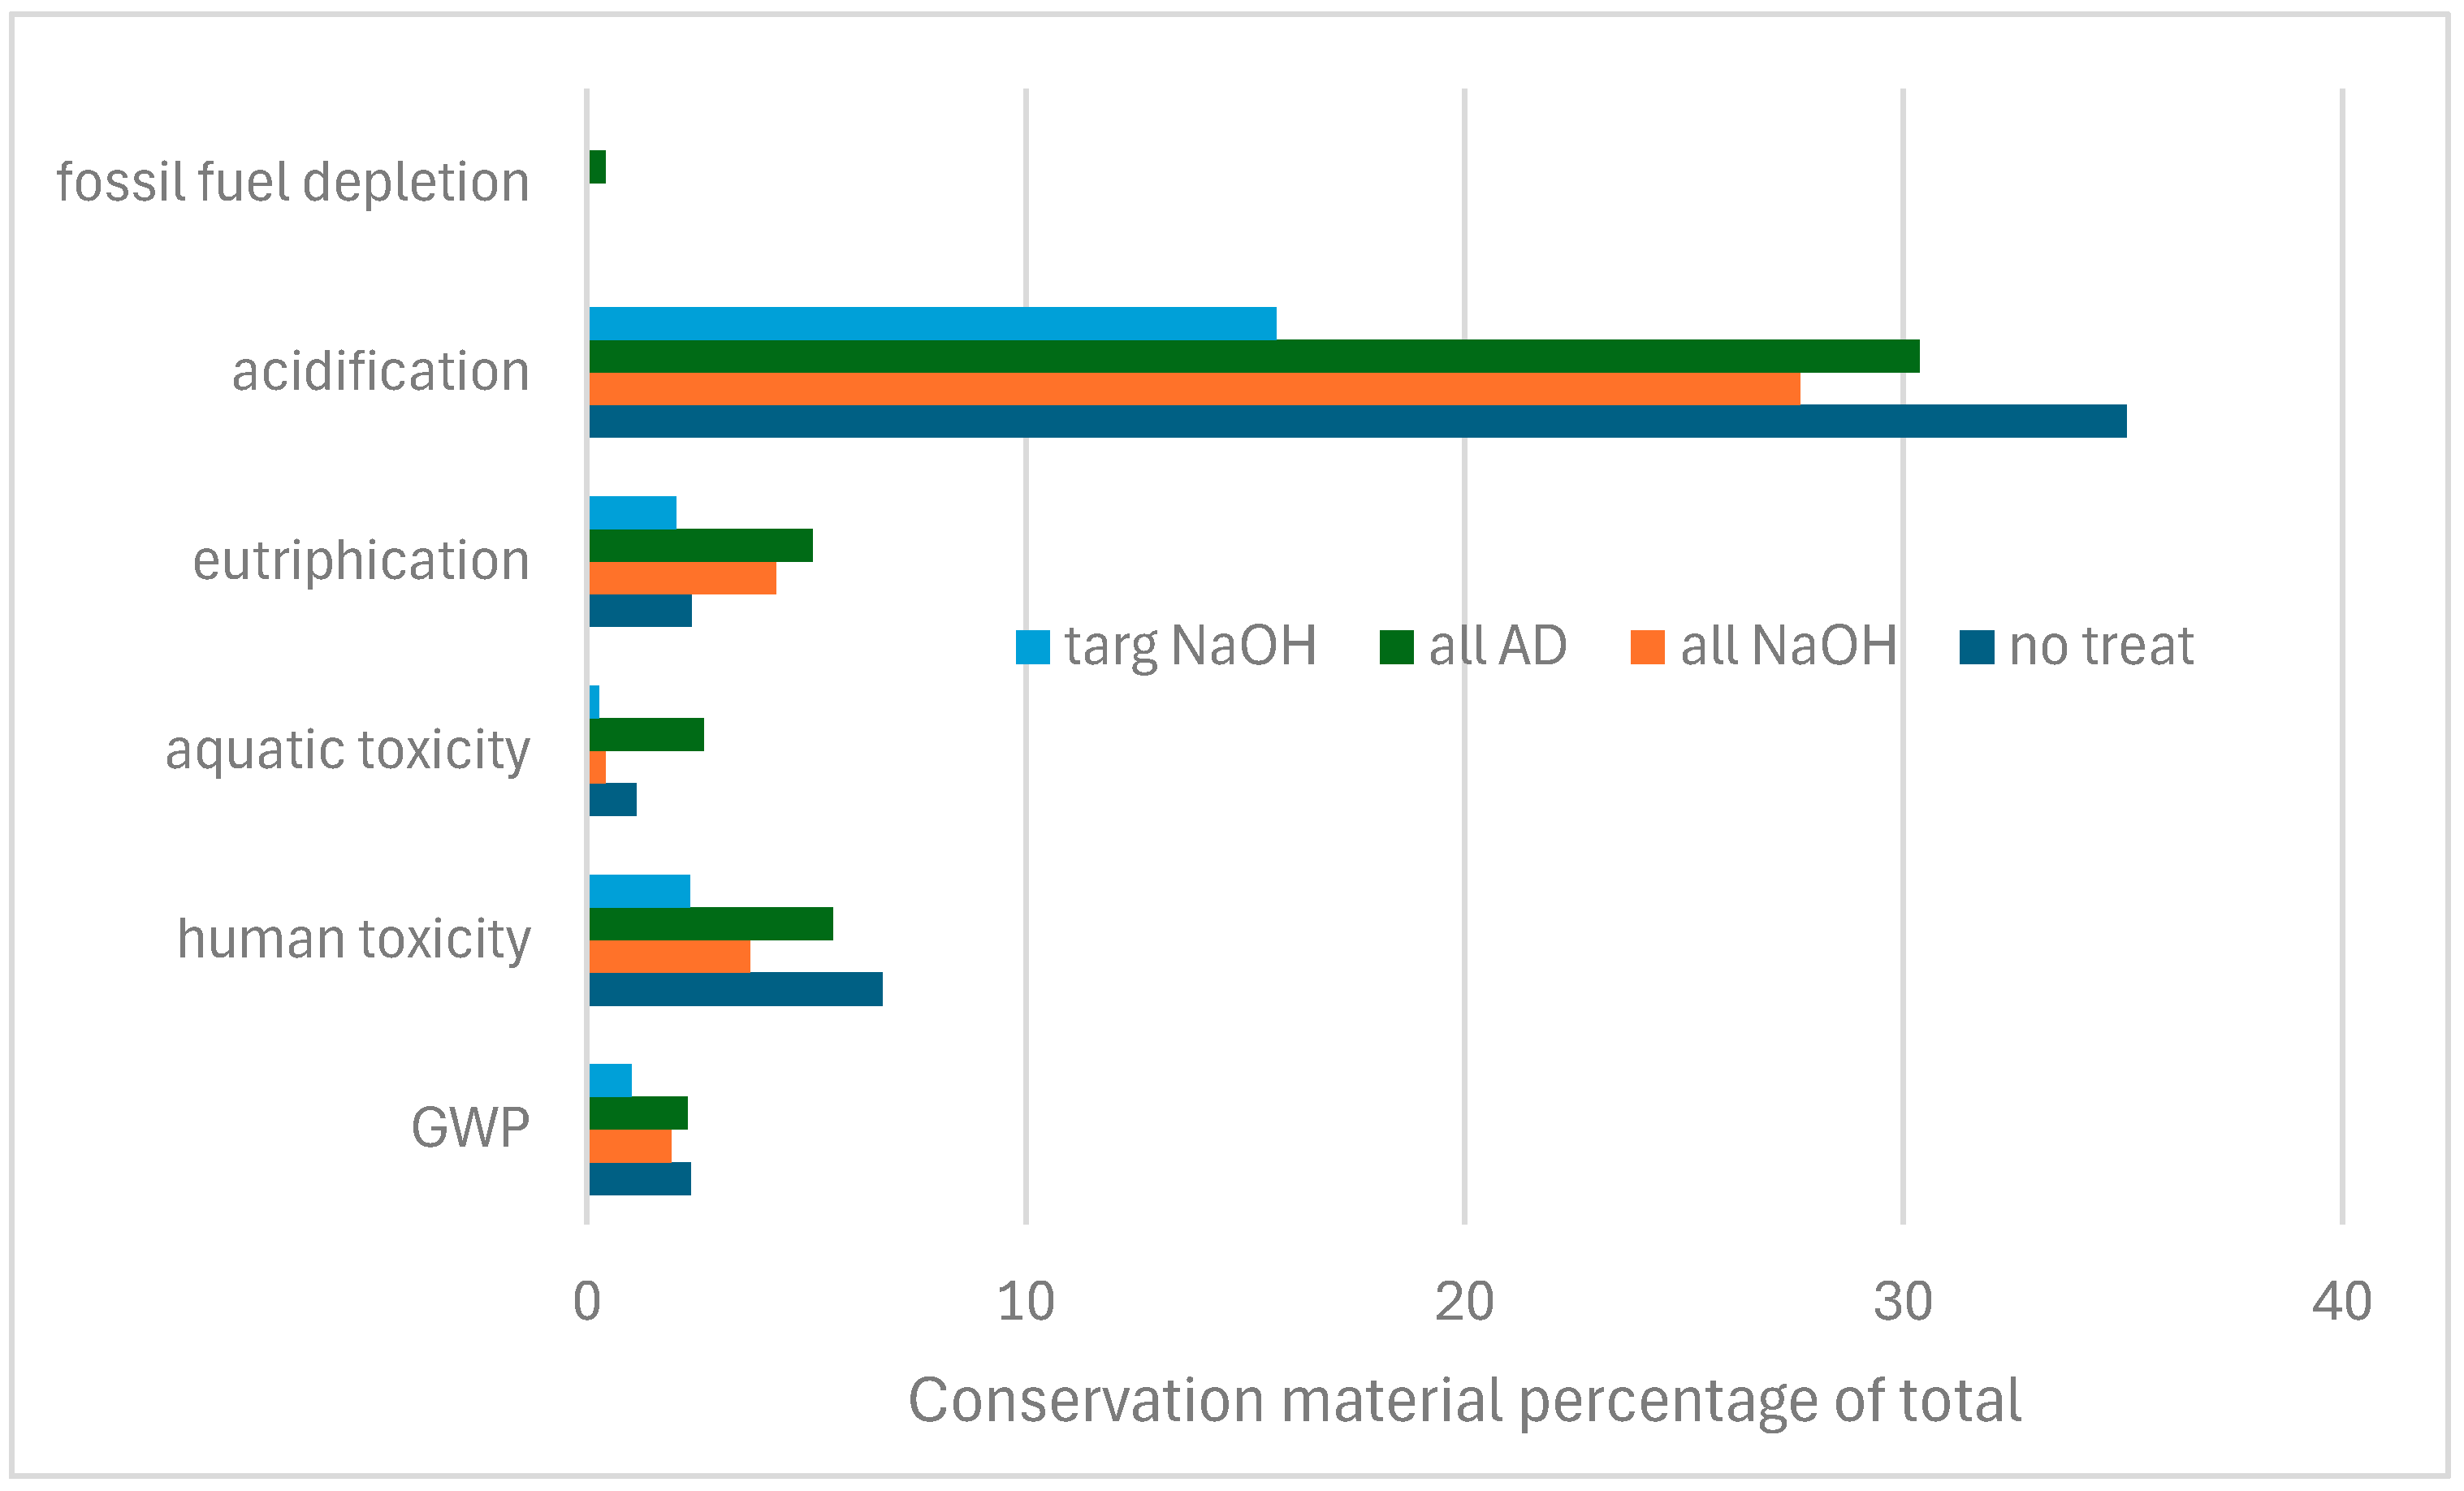
The percentage contribution of the conservation materials to the overall impact assessment is shown in Figure 9.
For global warming potential, the contribution from conservation materials is very small, less than (2.5%), whilst it is much more important for acidification. Considering the very pressing nature of the climate emergency, perhaps the global warming potential should be weighted more strongly for the upcoming years.

4. Discussion

Life cycle assessments have been developed for the main interventive and preventive conservation stages in caring for an existing archaeological iron collection. In the absence of manufacturers’ LCA data, values have been taken from average materials tables and publications. Whilst not ideal, until such data becomes available, this is the only viable approach. The use of several publications has limited the category of impacts for which data has been found.
Operational energy has been measured and an approach to estimating it for dehumidified rooms has been developed and tested, giving reasonable agreement with measured data. Attribution has been undertaken to assign proportions of the environmental impact to operations involving archaeological iron, though several methods are possible. The assignment of operational energy in a conservation workshop is challenging, even with sub-metering, which is often unavailable.
It should be noted that commonly used processes such as X-radiography, air abrasive cleaning, and coating of objects were not included in this assessment. These activities are frequently employed in archaeological iron conservation but were excluded as they fall outside the specific remit of this study, which focuses on main interventive and preventive treatments for stabilisation and environmental impact. Their omission reflects scope limitations rather than a lack of importance.
Overall, unsurprisingly, no treatment has the lowest environmental impacts, with the exception of GWP, due to the larger number of controlled showcases required under this scenario. Actual display details and which objects are unstable will determine impacts and may differ from the estimates used. The value of oxygen depletion testing to determine stability and requirements for treatment is clearly demonstrated. Targeted sodium hydroxide treatment is slightly worse than no treatment and significantly better in terms of environmental impact than full treatment with either method. Oxygen depletion also provides an ideal method to group similarly stable iron objects for comparative treatment studies. This research has been hampered by the very variable nature of archaeological iron response to the environment and the large sample numbers required to compensate. For GWP, conservation materials account for less than 3% of the total in any scenario, slightly higher but comparable to the one similar study published [27]. Almost no studies in conservation have considered the different aspects of environmental impact for preventive conservation. Whilst several publications have addressed energy use for HVAC systems, very few have investigated the relative contributions from other conservation practices.
Emerging low-impact methods, such as the GoGreen project using dead Meyerozyma guillermondii biomass to remove chlorides and stabilise corrosion, highlight the potential for greener interventions alongside conventional preventive and interventive conservation [25,26,46].

Author Contributions

Conceptualization, D.T. and E.J.; methodology, D.T.; validation, D.T.; data curation, D.T.; writing—original draft preparation, D.T.; writing—review and editing, D.T., E.J. and P.P. All authors have read and agreed to the published version of the manuscript.

Funding

English Heritage and HES-SO are associated partners in the framework of the GoGreen Strategies to Conserve the Past and Preserve the Future of Cultural Heritage) Horizon-RIA project 2022–2026, grant number 101060768. Their participation is funded by UKRI funding service and The Swiss State Secretary for Education, Research and Innovation (SERI). The oxygen measurement equipment was funded from a United Kingdon Research Institution World Class labs Grant, CAPCO. The acoustic emission equipment was funded from a UK Arts and Humanities Research Council Research Infrastructure for Conservation and heritage science facilities grant.

Data Availability Statement

All data is available from the corresponding author.

Acknowledgments

The authors would like to express their thanks for access to the thermomagnetometry through Marianne Odlyha, Birkbeck College, University of London.

Conflicts of Interest

The authors declare no conflicts of interest.

Abbreviations

The following abbreviations are used in this manuscript:
LCALife cycle assessment
GWPGlobal warming potential

References

  1. Pinasco, M.R.; Ienco, M.G.; Piccardo, P.; Pellati, G.; Stagno, E. Metallographic Approach to the Investigation of Metallic Archaeological Objects. Ann. Chim. 2007, 97, 553–574. [Google Scholar] [CrossRef]
  2. Kutlu, E.; Ali, M.A. A review on conservational methodologies of tangible cultural artifacts from environmental corrosion. Int. J. Environ. Geoinform. (IJEGEO) 2024, 11, 024–029. [Google Scholar] [CrossRef]
  3. Zouarhi, M. Bibliographical Synthesis on the Corrosion and Protection of Archaeological Iron by Green Inhibitors. Electrochem 2023, 4, 103–122. [Google Scholar] [CrossRef]
  4. Rosenberg, G.A. Antiquites en Fer et en Bronze, leur Transformation.et leur Conservation; Gyldendalske Boghandels Sortiment: Copenhagen, Denmark, 1917. [Google Scholar]
  5. De Graaf, M.J.; Severens, R.J.; van IJzendoorn, L.J.; Munnik, F.; Meijers, H.J.M.; Kars, H.; van de Sanden, H.C.M.; Schram, D.C. Cleaning of iron archaeological artefacts by cascaded arc plasma treatment. Surf. Coat. Technol. 1995, 74–75, 351–354. [Google Scholar] [CrossRef]
  6. Dussere, F. Peut-on Concevoir le Plasma comme un Traitement de Masse? In Metal 95, Proceedings of the International Conference on Metals Conservation, Semur en Auxois, France, 25–28 September 1995; James and James (Science Publishers) Ltd.: London, UK, 1997; pp. 138–146. [Google Scholar]
  7. Schmidt-Ott, K. Plasma-Reduction: Its Potential for Use in the Conservation of Metals. In Metal 04, Proceedings of the International Conference on Metals Conservation, Canberra, Australia, 4–8 October 2004; Ashton, J., Hallam, D., Eds.; National Museum of Australia: Canberra, Australia, 2004; pp. 235–246. [Google Scholar]
  8. Drews, M.J.; Gonzalez, N.; de Vivies, P.; Nestor, G.; Mardikian. A study of the analysis and removal of chloride in samples from the Hunley. In Metal 04, Proceedings of the International Conference on Metals Conservation, Canberra, Australia, 4–8 October 2004; Ashton, J., Hallam, D., Eds.; Canberra, National Museum of Australia: Canberra, Australia, 2004; pp. 247–260. [Google Scholar]
  9. de Vivies, P.; Cook, D.; Drews, M.J.; Gonzalez, N.; Mardikian, P.; Memet, J.B. Transformation of akaganeite in archaeological iron artefacts using subcritical treatment. In Metal 07, Proceedings of the Interim Meeting of the ICOM-CC Metal Working Group; Volume 5: Protection of Metal Artefacts. Amsterdam, The Netherlands, 17–21 September 2007; Degrigny, C., van Langh, R., Joosten, I., Ankersmit, B., Eds.; Rijksmuseum: Amsterdam, The Netherlands, 2007; pp. 26–30. [Google Scholar]
  10. North, N.A.; Pearson, C. Alkaline sulfite reduction treatment of marine iron. In Proceedings of the ICOM Committee for Conservation 4th Triennial Meeting, Venice, Italy, 13–18 October 1975; International Council of Museums: Paris, France, 1975; Volume 13, pp. 1–14. [Google Scholar]
  11. North, N.A.; Pearson, C. Washing methods for chloride removal from marine iron artifacts. Stud. Conserv. 1978, 23, 174–186. [Google Scholar] [CrossRef]
  12. Skinner, T. The treatment of archaeological iron by the alkaline sulphite method. In Conservation of Iron; Bryce, T., Tate, J., Eds.; National Museum of Antiquities of Scotland: Edinburgh, UK, 1982. [Google Scholar]
  13. Keene, S.; Orton, C. Stability of treated archaeological iron: An assessment. Stud. Conserv. 1985, 30, 136–142. [Google Scholar] [CrossRef]
  14. Selwyn, L.S.; Argyropoulos, V. Removal of chloride and iron ions from archaeological wrought iron with sodium hydroxide and ethylenediamine solutions. Stud. Conserv. 2005, 50, 81–100. [Google Scholar] [CrossRef]
  15. Scott, D.; Eggert, G. Iron and Steel in Art Corrosion, Colorants, Conservation; Archeotype: London, UK, 2009. [Google Scholar]
  16. Eggert, G.; Schmutzler, B. Lasst sich die Konservierung von Eisenfunden ‘auf Standard’ bringen? In kulturGUTerhalten: Standards in der Restaurierungswissenschaft und Denkmalpflege; Staatliche Museen zu Berlin: Berlin, Germany, 2009; pp. 91–95. [Google Scholar]
  17. Rimmer, M.B. Investigating the Treatment of Chloride-Infested Archaeological Iron Objects. Ph.D. Thesis, University of Cardiff, Cardiff, UK, 2011. [Google Scholar]
  18. Gilberg, M.R.; Seeley, N.J. The Alkaline Sodium Sulphite Reduction Process for Archaeological Iron: A Closer Look. Stud. Conserv. 1984, 27, 180–184. [Google Scholar] [CrossRef]
  19. Neff, D.; Dillmann, P.; Bellot-Gurlet, L.; Beranger, G. Corrosion of iron archaeological artefacts in soil: Characterisation of the corrosion system. Corros. Sci. 2005, 47, 515–535. [Google Scholar] [CrossRef]
  20. Hjelm-Hansen, N.; van Lanschot, J.; Szalkay, C.D.; Turgoose, S. Electrochemical monitoring of archaeological iron artefact during treatment. In Proceedings of the Non Destructive Testing, Microanalytical Methods and Environment Evaluation for Study and Conservation of Works of Art, 3nd International Conference, Viterbo, Italy, 4–8 October 1992; pp. 361–373. [Google Scholar]
  21. Al-Zahrani, A.A. Chloride Ion Removal from Archaeological Iron and Beta-FeOOH. Ph.D. Thesis, University of Wales, Cardiff, UK, 1999. [Google Scholar]
  22. Gil, M.L.A.; Santos, A.; Bethencourt, M.; Garcia, T.; Fernandez-Bastero, S.; Velo, A.; Gago-Duport, L. Use of X-ray and other techniques to analyse the phase transformation induced in archaeological cast iron after its stabilisation by the electrolytic method. Anal. Chim. Acta 2003, 494, 245–254. [Google Scholar] [CrossRef]
  23. Thickett, D. The Formation and Transformation of Akaganéite. In Proceedings of the Metal 2013: Interim Meeting of the ICOM-CC Metal Working Group, Edinburgh, UK, 16–20 September 2013; pp. 103–110. [Google Scholar]
  24. Thickett, D. Post Excavation Changes and Preventive Conservation of Archaeological Iron. Ph.D. Thesis, University of London, London, UK, 2012. Available online: https://www.english-heritage.org.uk/siteassets/home/learn/conservation/collections-advice--guidance/thickettthesisfinalversion.pdf (accessed on 6 August 2021).
  25. Petrasz, P.; Zhioua, S.; James, S.; Bindschedler, S.; Junier, P.; Joseph, E. Green alternatives for archaeological iron stabilization. Stud. Conserv. 2024, 69 (Suppl. 1), 270–280. [Google Scholar] [CrossRef]
  26. Petrasz, P.; Junier, P.; Joseph, E. Utilization of dead biomass from an extremophilic yeast Meyerozyma sp. as a novel stabilization treatment for archaeological iron artifacts. In Proceedings of the ICOMCC-Metal 2025, Cardiff, UK, 1–5 September 2025. [Google Scholar]
  27. Tate Harte, A.; Thickett, D. Calculating the Carbon Footprint of Interventive and Preventive Conservation at English Heritage, UK. Stud. Conserv. 2024, 69 (Suppl. 1), 323–332. [Google Scholar] [CrossRef]
  28. Thickett, D. Oxygen Depletion Testing of Metals. Heritage 2021, 4, 2377–2389. [Google Scholar] [CrossRef]
  29. Watkinson, D.; Emmerson, N.; Seifert, J. Matching Display Relative Humidity to Corrosion Rate: Quantitative Evidence for Marine Cast Iron Cannon Balls. In Proceedings of the Metal 2016: Interim Meeting of the ICOM-CC Metals Working Group, New Delhi, India, 26–30 September 2016; pp. 195–202. [Google Scholar]
  30. Rimmer, M.B.; Emmerson, N.J. The Influence of Relative Humidity and Intrinsic Chloride on Post-excavation Corrosion Rates of Archaeological Wrought Iron. Stud. Conserv. 2019, 64, 456–471. [Google Scholar] [CrossRef]
  31. Thickett, D. Better Use of Showcases for Preservation and Sustainability. Stud. Conserv. 2022, 67 (Suppl. 1), 267–276. [Google Scholar] [CrossRef]
  32. Errington, E.; Guo, M.; Heng, J.Y.Y. Synthetic amorphous silica: Environmental impacts of current industry and the benefit of biomass-derived silica. Green Chem. 2023, 25, 4244. [Google Scholar] [CrossRef]
  33. Thomson, G. Stabilisation of RH in Exhibition Case: Hygrometric Half Time. Stud. Conserv. 1977, 22, 85–102. [Google Scholar] [CrossRef]
  34. EcoInvent Version 3.11. Available online: https://ecoquery.ecoinvent.org/3.11/cutoff (accessed on 29 September 2025).
  35. UCL LEAF—Laboratory Efficiency Assessment Framework. Available online: https://www.ucl.ac.uk/sustainable/take-action/staff-action/leaf-laboratory-efficiency-assessment-framework (accessed on 29 September 2025).
  36. BEIS UK Government GHG Conversion Factors, V1.1. 10 June 2025. Available online: https://www.gov.uk/government/publications/greenhouse-gas-reporting-conversion-factors-2024 (accessed on 29 September 2025).
  37. Thickett, D.; Odlyha, M. Assessment of dry storage microenvironments for archaeological iron. In Proceedings of the Post Prints of the Conservation of Archaeological Materials: Current Trends and Future Directions, Williamsburg, VA, USA, 13–17 November 2005; pp. 187–199. [Google Scholar]
  38. Thickett, D.; Odlyha, M. Application of Thermo-magnetometry to Corrosion Studies of Archaeological Iron. J. Therm. Anal. Calorim. 2005, 80, 565–571. [Google Scholar] [CrossRef]
  39. Thickett, D. In situ analysis of metal corrosion. In Metal 2025, Proceedings of International Conference on Metals Conservation, Cardiff, UK, 1–5 September 2025; Emmerson, N., Thunberg, J., Watkinson, D., Eds.; University of Cardiff: Cardiff, UK, 2025; pp. 212–233. [Google Scholar]
  40. EN ISO 12569:2017; Thermal Performance of Buildings and Materials—Determination of Specific Airflow Rate in Buildings—Tracer Gas Dilution Method. International Organization for Standardization: Geneva, Switzerland, 2017.
  41. EN ISO 9972:2015; Thermal Performance of Buildings—Determination of Air Permeability of Buildings—Fan Pressurization Method. International Organization for Standardization: Geneva, Switzerland, 2015.
  42. Munters, MG Dehumidiers. Available online: https://www.munters.com/en-gb/products-cms/dehumidifiers/mg/ (accessed on 29 September 2025).
  43. Munters, MCS Dehumidiers. Available online: https://www.munters.com/en-gb/products-cms/dehumidifiers/mcs/ (accessed on 29 September 2025).
  44. Song, X.; Montelius, M.; Carlsson, C. Life Cycle Assessment of Per- and Polyfluoroalkyl Substances (PFAS) Remediation Technologies: A Literature Review. Environments 2024, 11, 203. [Google Scholar] [CrossRef]
  45. Thickett, D. Sustainable Collections Environments. Estud. Coserv. Rest. 2019, 11, 93–103. [Google Scholar]
  46. GoGreen. Available online: https://gogreenconservation.eu/ (accessed on 29 September 2025).
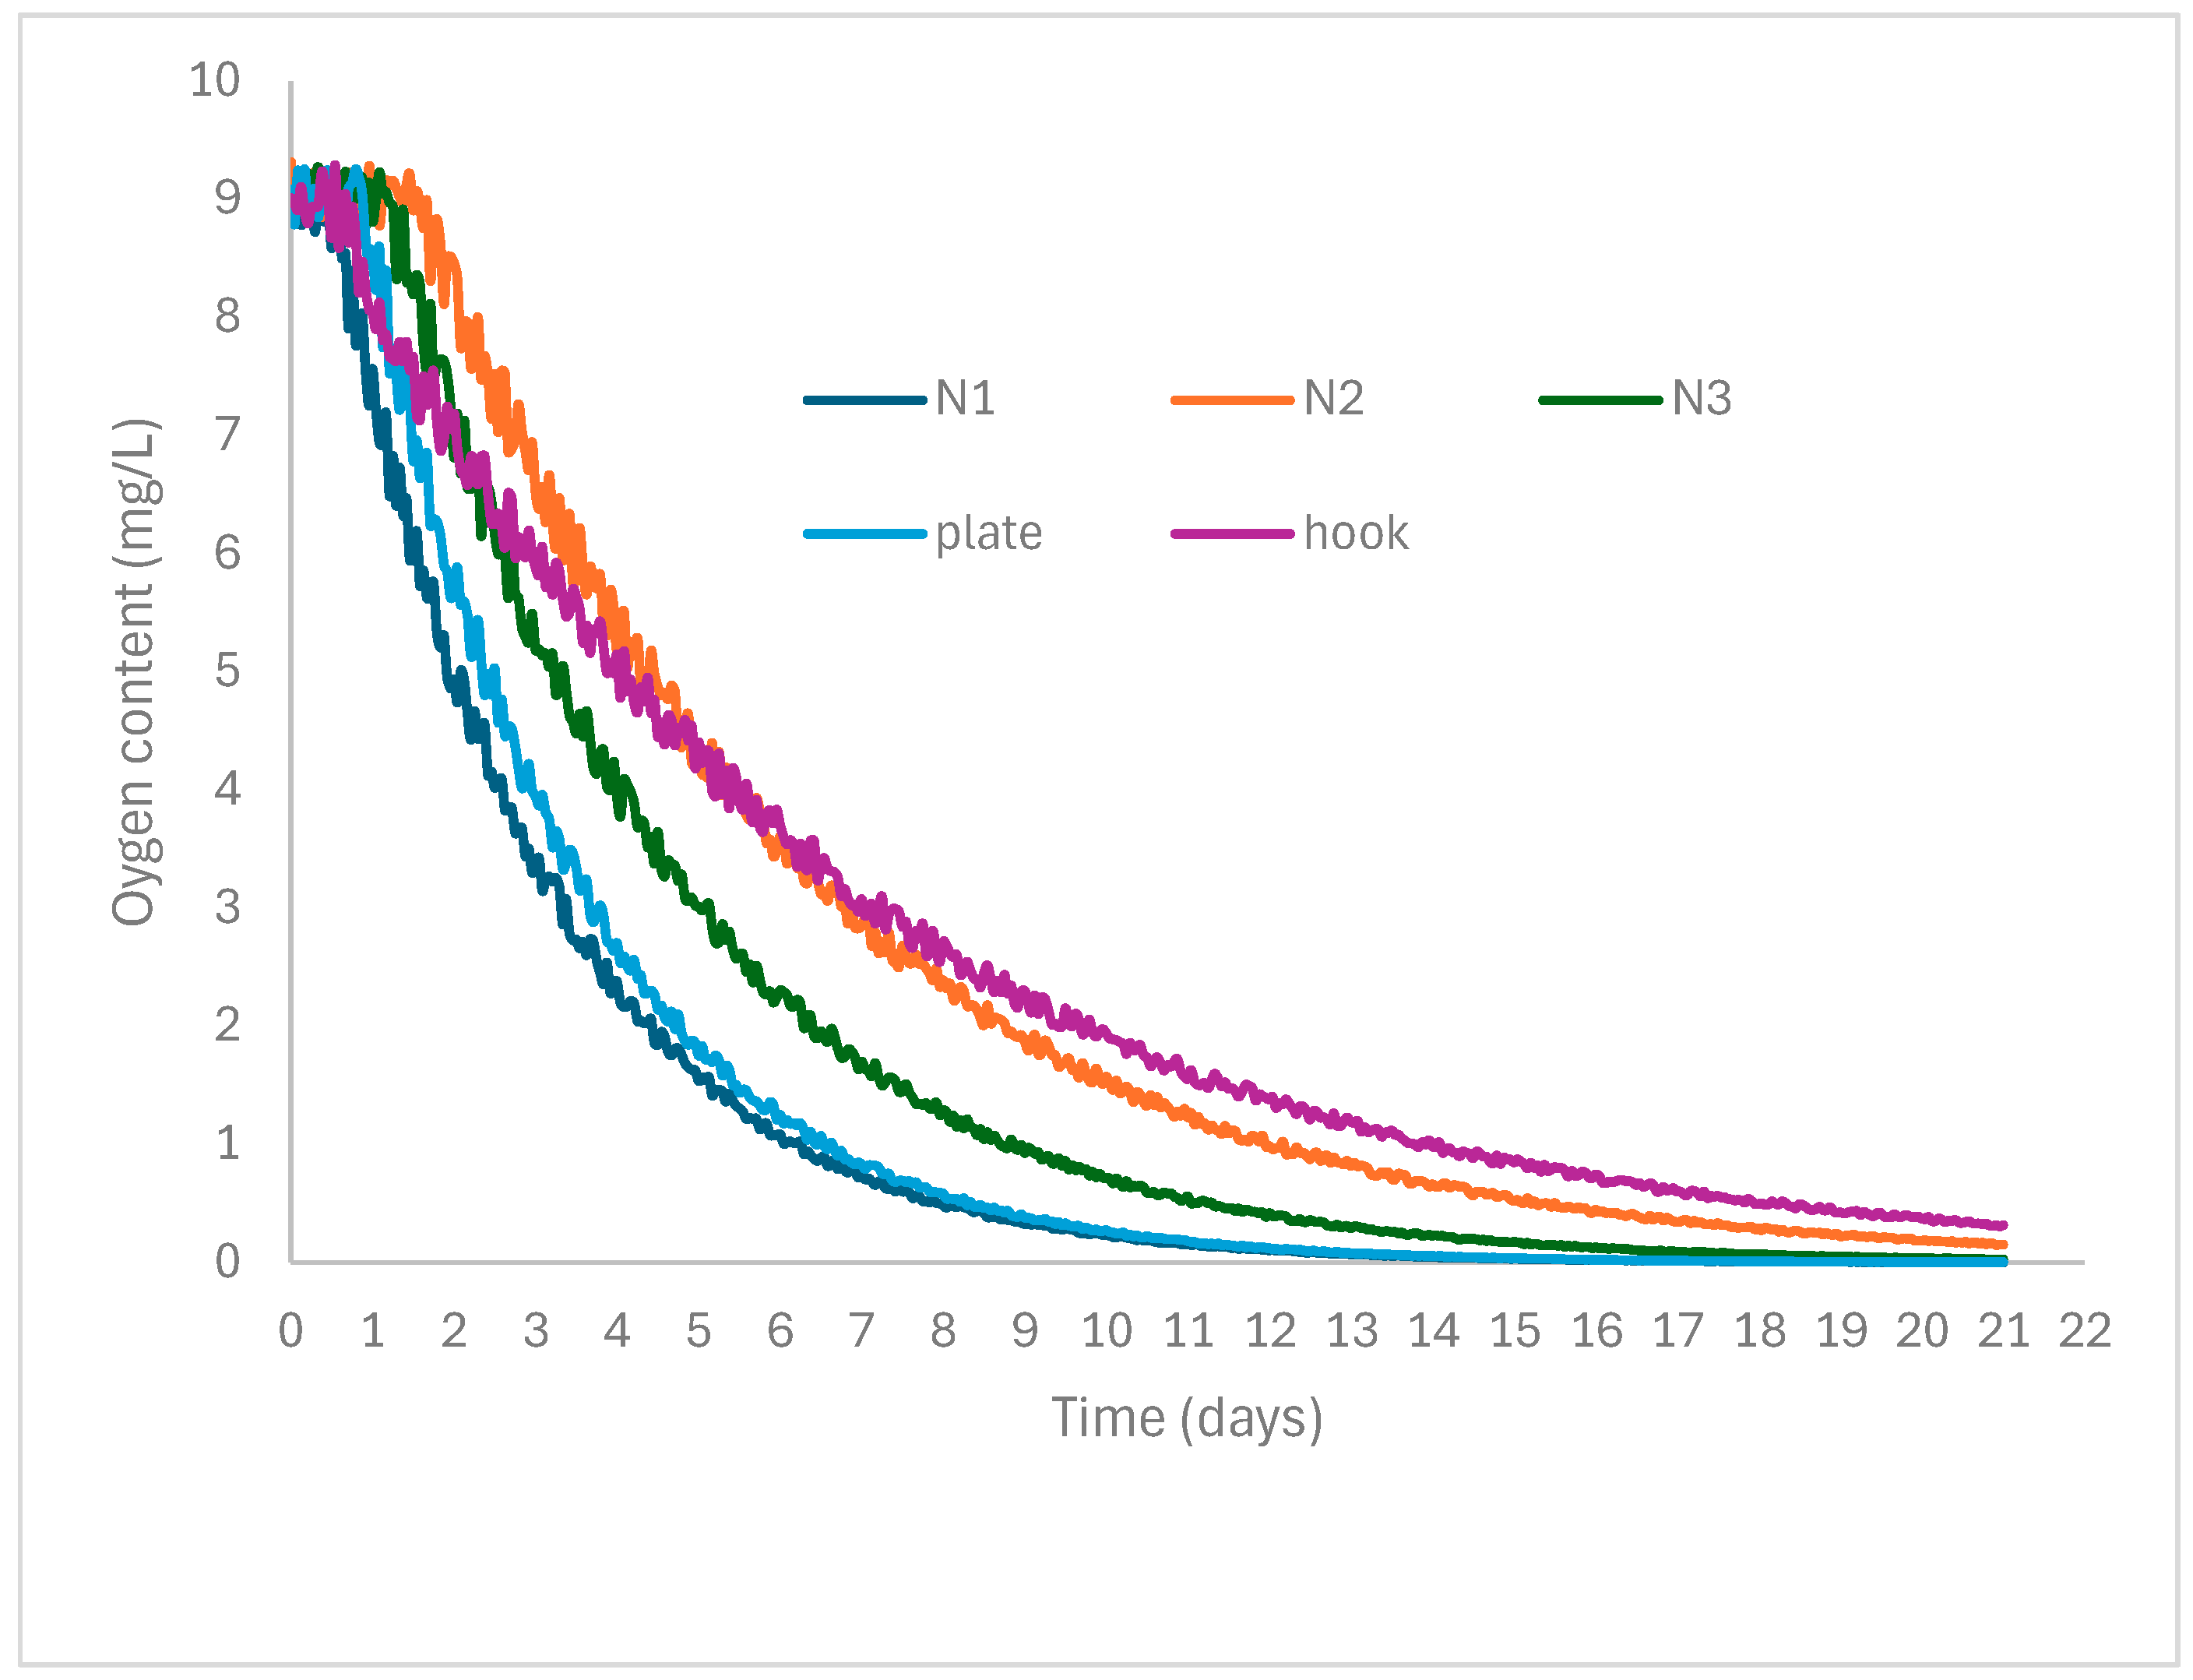
Figure 1. Solution oxygen concentration in sodium hydroxide solutions during desalination.
Heritage 08 00502 g001
Figure 2. Shifted solution oxygen concentration in sodium hydroxide solutions during desalination.
Heritage 08 00502 g002
Figure 3. Solution oxygen concentration in sodium hydroxide and acoustic emission during desalination of nail piece 2.
Heritage 08 00502 g003
Figure 4. Solution oxygen concentration in sodium hydroxide and acoustic emission during desalination of “hook”.
Heritage 08 00502 g004
Figure 5. Pressure difference between store and external.
Heritage 08 00502 g005
Figure 6. Pressurisation and depressurisation lines from blower door measurements of Wrest main store.
Heritage 08 00502 g006
Figure 7. Internal RH inside the controlled showcases.
Heritage 08 00502 g007
Figure 8. Comparative results of LCAs for four scenarios.
Heritage 08 00502 g008
Figure 9. Relative impact of conservation materials to overall environmental impacts.
Heritage 08 00502 g009
Table 1. Environmental impacts of alkaline desalination treatments for iron.
1 kg
NaOH
1 kg
Na2SO3
1 L
Water
Disposal
5 L Water
0.1 MNaOH/
0.05 MNa2SO3 per kg Iron
0.1 M NaOH
per kg/Iron
Global warming potential GWP (kg CO2eq)0.6331.086-0.010.025340.03566
Human toxicity potential (g)0.4936.8270.019-0.019740.08461
Aquatic ecotoxity (g)1.2983404.30.95-0.04047203.4
Eutrophication potential
(PO4 equivalent, g)
0.0350.003--0.022380.5640
Acidification potential
(SOx equivalent, g)
0.7060.042--0.024960.02422
Fossil Energy Resource consumption (MJ)3.513.20.00400.013800.2779
Table 2. Analysis of corrosion rate and composition of nail pieces and two objects.
NumberObjectOxygen Depletion
(%) at 50% RH
Thermomagnetometry (Mass %)
ironmagnetitegoethiteakaganeite
1A6.1916.0630.1453.810.00
2C5.9916.8614.9766.661.51
3B5.8513.8818.7865.911.43
4A5.2617.420.5760.761.27
5E5.1415.6014.6869.720.00
6D4.659.4429.2160.410.94
7B4.1214.4651.7433.270.54
8D46.1116.5676.480.84
9B3.8927.6938.5233.280.51
10C3.4410.6810.4377.910.98
11E3.3223.6138.8936.840.66
12D3.1819.9023.5355.411.16
13C3.0819.0545.2334.880.83
14C2.9711.6249.0439.310.03
15E2.723.1427.6968.141.04
16D2.1929.0838.5331.870.51
17A1.918.9135.9154.290.89
18A1.522.5512.6764.40.39
19B1.240.5650.6148.630.21
20A1.172.3216.8380.750.1
21E0.893.1651.5745.250.03
22D0.788.2845.0846.640
23E0.4318.2151.4930.30
24C0.1417.6229.9551.111.32
25D020.7340.0439.160.07
26E01.4810.3188.030.18
27F018.5319.2661.990.22
28F010.4426.5262.600.44
29F07.6246.0245.950.42
30F028.6747.7822.141.40
31G024.9350.1623.621.29
32G026.3426.7145.781.16
33G014.5232.8451.131.51
34G027.0436.1635.761.04
Plate01.8725.8336.8335.222.12
hook05.3229.4321.7544.853.97
Table 3. Akaganeite transformation in sodium hydroxide solutions.
RH Akaganeite Sample Formed at (%)Akaganeite (%)Goethite (%)
60946
708911
808614
908515
Table 4. Details of storerooms and calculated and measured energy usage to dehumidify to 50% RH.
External Wall, Percentage Area of WindowsFloorCeilingVolume m3AER (Tracer Gas)AER (Pressurisation)Dehumidifier TypeCalculated Energy Use (kWh)Measured Energy Use (kWh)
Wrest Park Small Finds StoreNcon 2260.720.95MCS280339
Wrest Park Main StoreYcon 60601.031.20noneNdNd
Temple cloud StoreY metal cladconcon1570.811.10MCS431401
DoverY, 25woodPlast45.62.87NdMG50437402
DoverY, 22WoodPlast37.82.45NdMG50278245
DoverY, 18WoodPlast33.61.63NdMG50167131
RangersY, 25WoodPlast27.13.28NdMG50204212
Rangers
windows sealed
Y, 25 (0)WoodPlast27.10.59NdnoneNdNd
Rangers
floor sealed
Y, 25Al foilPlast27.12.89NdnoneNdNd
Rangers
ceiling sealed
Y, 25WoodAl foil27.13.12NdnoneNdNd
Rangers
door sealed
Y,25WoodPlast27.12.98NdnoneNdNd
Atcham
container
NsteelSteel27.60.34NdMG505250
Atcham
container
NsteelSteel27.60.21NdMG504647
Table 5. Environmental impacts of dehumidifiers, silica gel and polypropylene boxes.
EnergyEmbedded
UK per kWEcoinvent
(Europe) per kWh
Drying Silica Gel per kgDehumidifierFilter
Replacement
BoxesSilica Gel per kg
Global warming potential (kg)0.220.45140.66930.352.202.18
Human toxicity potential (g)-0.8251-0.44540.25931.63-
Aquatic ecotoxicity (g)-408.1-538.30.14060.8840.230
Eutrophication potential (PO4 equivalent, g)-0.000293-1.0680.00049470.003110.00023
Acidification potential (SOx equivalent, g)-0.00098-0.85620.00080970.005090.0106
Fossil Energy Resource (MJ)-6.785-105111.34371.3-
Table 6. Environmental impact of showcase materials.
Glass (m2 = 13 kg)Steel (kg)MDF (kg)
Global warming potential (kg CO2eq)1.8151.730.7707
Human toxicity potential (g)2.554 0.9213
Aquatic ecotoxicity (g)272.34.970.5173
Eutrophication potential (PO4 equivalent, g)0.0038460.003580.04347
Acidification potential (SOx equivalent, g)0.012310.004770.003733
Fossil Energy Resource (MJ)20.6916.912.49
UK recycling (%)74.29625 of fibres
(estimated by 2030)
Disposal incineration
(kg CO2eq)
000.0641
Disposal land fill (kg CO2eq)00.001230.925
Disclaimer/Publisher’s Note: The statements, opinions and data contained in all publications are solely those of the individual author(s) and contributor(s) and not of MDPI and/or the editor(s). MDPI and/or the editor(s) disclaim responsibility for any injury to people or property resulting from any ideas, methods, instructions or products referred to in the content.