Article

On the Identification of the a fresco or a secco Preparative Technique of Wall Paintings

1
Department Chemical Sciences, University of Napoli Federico II, Via Cintia, 80126 Napoli, Italy
2
Department Earth Sciences, Environment and Resources, University of Napoli Federico II, Via Cintia, 80126 Napoli, Italy
3
Department Classics, University La Sapienza, P.le Aldo Moro, 00185 Roma, Italy
4
Soprintendenza Archeologia Belle Arti e Paesaggio per le Province di Caserta e Benevento, Reggia di Caserta, 81100 Caserta, Italy
5
Task Force “Metodologie Analitiche per la Salvaguardia dei Beni Culturali”, University of Napoli Federico II, Via Cintia, 80126 Napoli, Italy
*
Authors to whom correspondence should be addressed.
These authors contributed equally to this work.
Heritage 2024, 7(8), 3902-3918; https://doi.org/10.3390/heritage7080184
Submission received: 1 July 2024 / Revised: 17 July 2024 / Accepted: 22 July 2024 / Published: 25 July 2024

Abstract

:
The study applies both a minimal and an extended approach for a comprehensive picture of chemical components in wall paintings, including evidence of degradation. Pigments and ligands were characterized via a multi-methodological investigation, including optical microscopy, scanning electron microscopy, Raman micro-spectroscopy, GC-MS, and LC-MS/MS. Particularly, the procedure was tested on wall paintings recently excavated from a Roman domus in Santa Maria Capua Vetere. The hypothesis of a very wealthy owner is supported by the evidence of a multi-layer preparation, a rich variety of pigments, and organic ligands (both terpenic resins and animal glue). The absence of calcite in the pictorial layer (via optical and Raman microscopy) and the presence of organic binders (via GC-MS and LC-MS/MS) clearly indicates the a secco technique.

1. Introduction

Roman art of paintings is mostly found on wall plaster, though wood, ivory, and other support materials were also used. The pictorial layer of wall paintings is typically composed of pigments mixed with a first mortar and/or with organic binders. Consequently, multiple preparative techniques of wall paintings were classified, which were first described in Vitruvius’s manual De Architettura and in Pliny’s Naturalis Historia and then reviewed elsewhere [1].
The a fresco painting technique produces paintings executed on wet plaster. Most of the chemical studies focus on pigments and first mortars (not searching for organic binders) and a fresco is often considered the most widespread technique in the Roman age [2] Alternatively to the a fresco technique or subsequently, other colors were often added a secco (on dry plaster), using organic binders (mostly wheat paste, egg, resins, animal glue, and emulsified beeswax). Moreover, an a secco variant where the binder is beeswax [3], soap [4], and animal glue [5] produces encaustic paint. Encaustic paint combines powdered pigments with wax melted and Greek pitch, in order to incorporate the color to the surface obtaining a result that is as resistant as possible [6]. The Romans used two different methods: hot painting with colors dissolved in wax or heating the already-painted surface after covering it with a layer of wax.
Experimental methodologies for pigments are typically based mostly on elementary analysis, such as scanning electron microscopy (SEM-EDS) and X-ray fluorescence (XRF), and on molecular Raman micro-spectroscopy, Infrared spectroscopy, FORS, and X-ray powder diffraction [7]. XRF and Raman micro-spectroscopy have the relevant advantage of being used in a non-invasive way, whereas SEM-EDS and XRD are destructive. Despite the fact that FORS can be used in a non-invasive way, Raman and infrared spectroscopies have the advantage of giving information on molecular vibrations, thus allowing the identification of the unique chemical structure of that compound. Moreover, Raman microspectroscopy allows us to obtain spectra of a punctual micrometric area of the sample; it is efficient in the characterization of mineral inorganic pigments. Depth investigations in the pictorial layer are also possible via thin section analysis or via techniques with some penetration ability as micro-SORS [8] XAS [9]. The pigment analysis is also useful for discussing the commercial routes and the specific Roman style (I, II, and III) and standard of living.
While the characterization of the pigments is quite an established procedure, the detection and identification of organic components, which can be used to discriminate between the painting techniques, are still hardly provided by spectroscopic techniques alone, though vibrational spectroscopy can efficiently work in a prescreening phase [10]. Nevertheless, typically, detailed organic component characterization requires invasive analyses such as gas chromatography (GC-MS) and liquid chromatography (LC-MS/MS) coupled to mass spectrometric analyses [11,12]. The difficulty of extracting the paint medium and the influence of biological contamination is not rare and is a critical issue in the identification of organic components [1]. Fortunately, the scale of sampling needed for mass spectrometric analyses is continuously decreasing, defining this approach as microinvasive [13,14]. Moreover, the integration of detailed chemical information from different analyses allows us to obtain valuable information on the binder origin (artificial, vegetal, or animal source).
Herein, we apply a minimal and an extended chemical approach (Figure 1) that allows us to clearly distinguish among the different preparative techniques, either a fresco or a secco, based on a clever combination of spectroscopic and mass spectrometric techniques used to investigate the pictorial layer, also with a view to the state of conservation.

2. The Archaeological Site

The analytical procedure has been assessed on a specific case study: a collection of wall painting samples from Santa Maria Capua Vetere.
The city of Santa Maria Capua Vetere grows on the ruins of ancient Capua, a city of Roman origin in Southern Italy [15]. During Roman times, Capua lived in a prosperous era, wherein to be rich was to be called Campania felix. In 841, after the domination of the Osci and Etruscans, the city was almost destroyed by Saracen incursions. Due to its Roman history, Capua can currently count on different archeological monuments such as the Campano amphitheater, the Arch of Hadrian, and the domus (in Via degli Orti). Moreover, many archaeological artifacts are still buried.
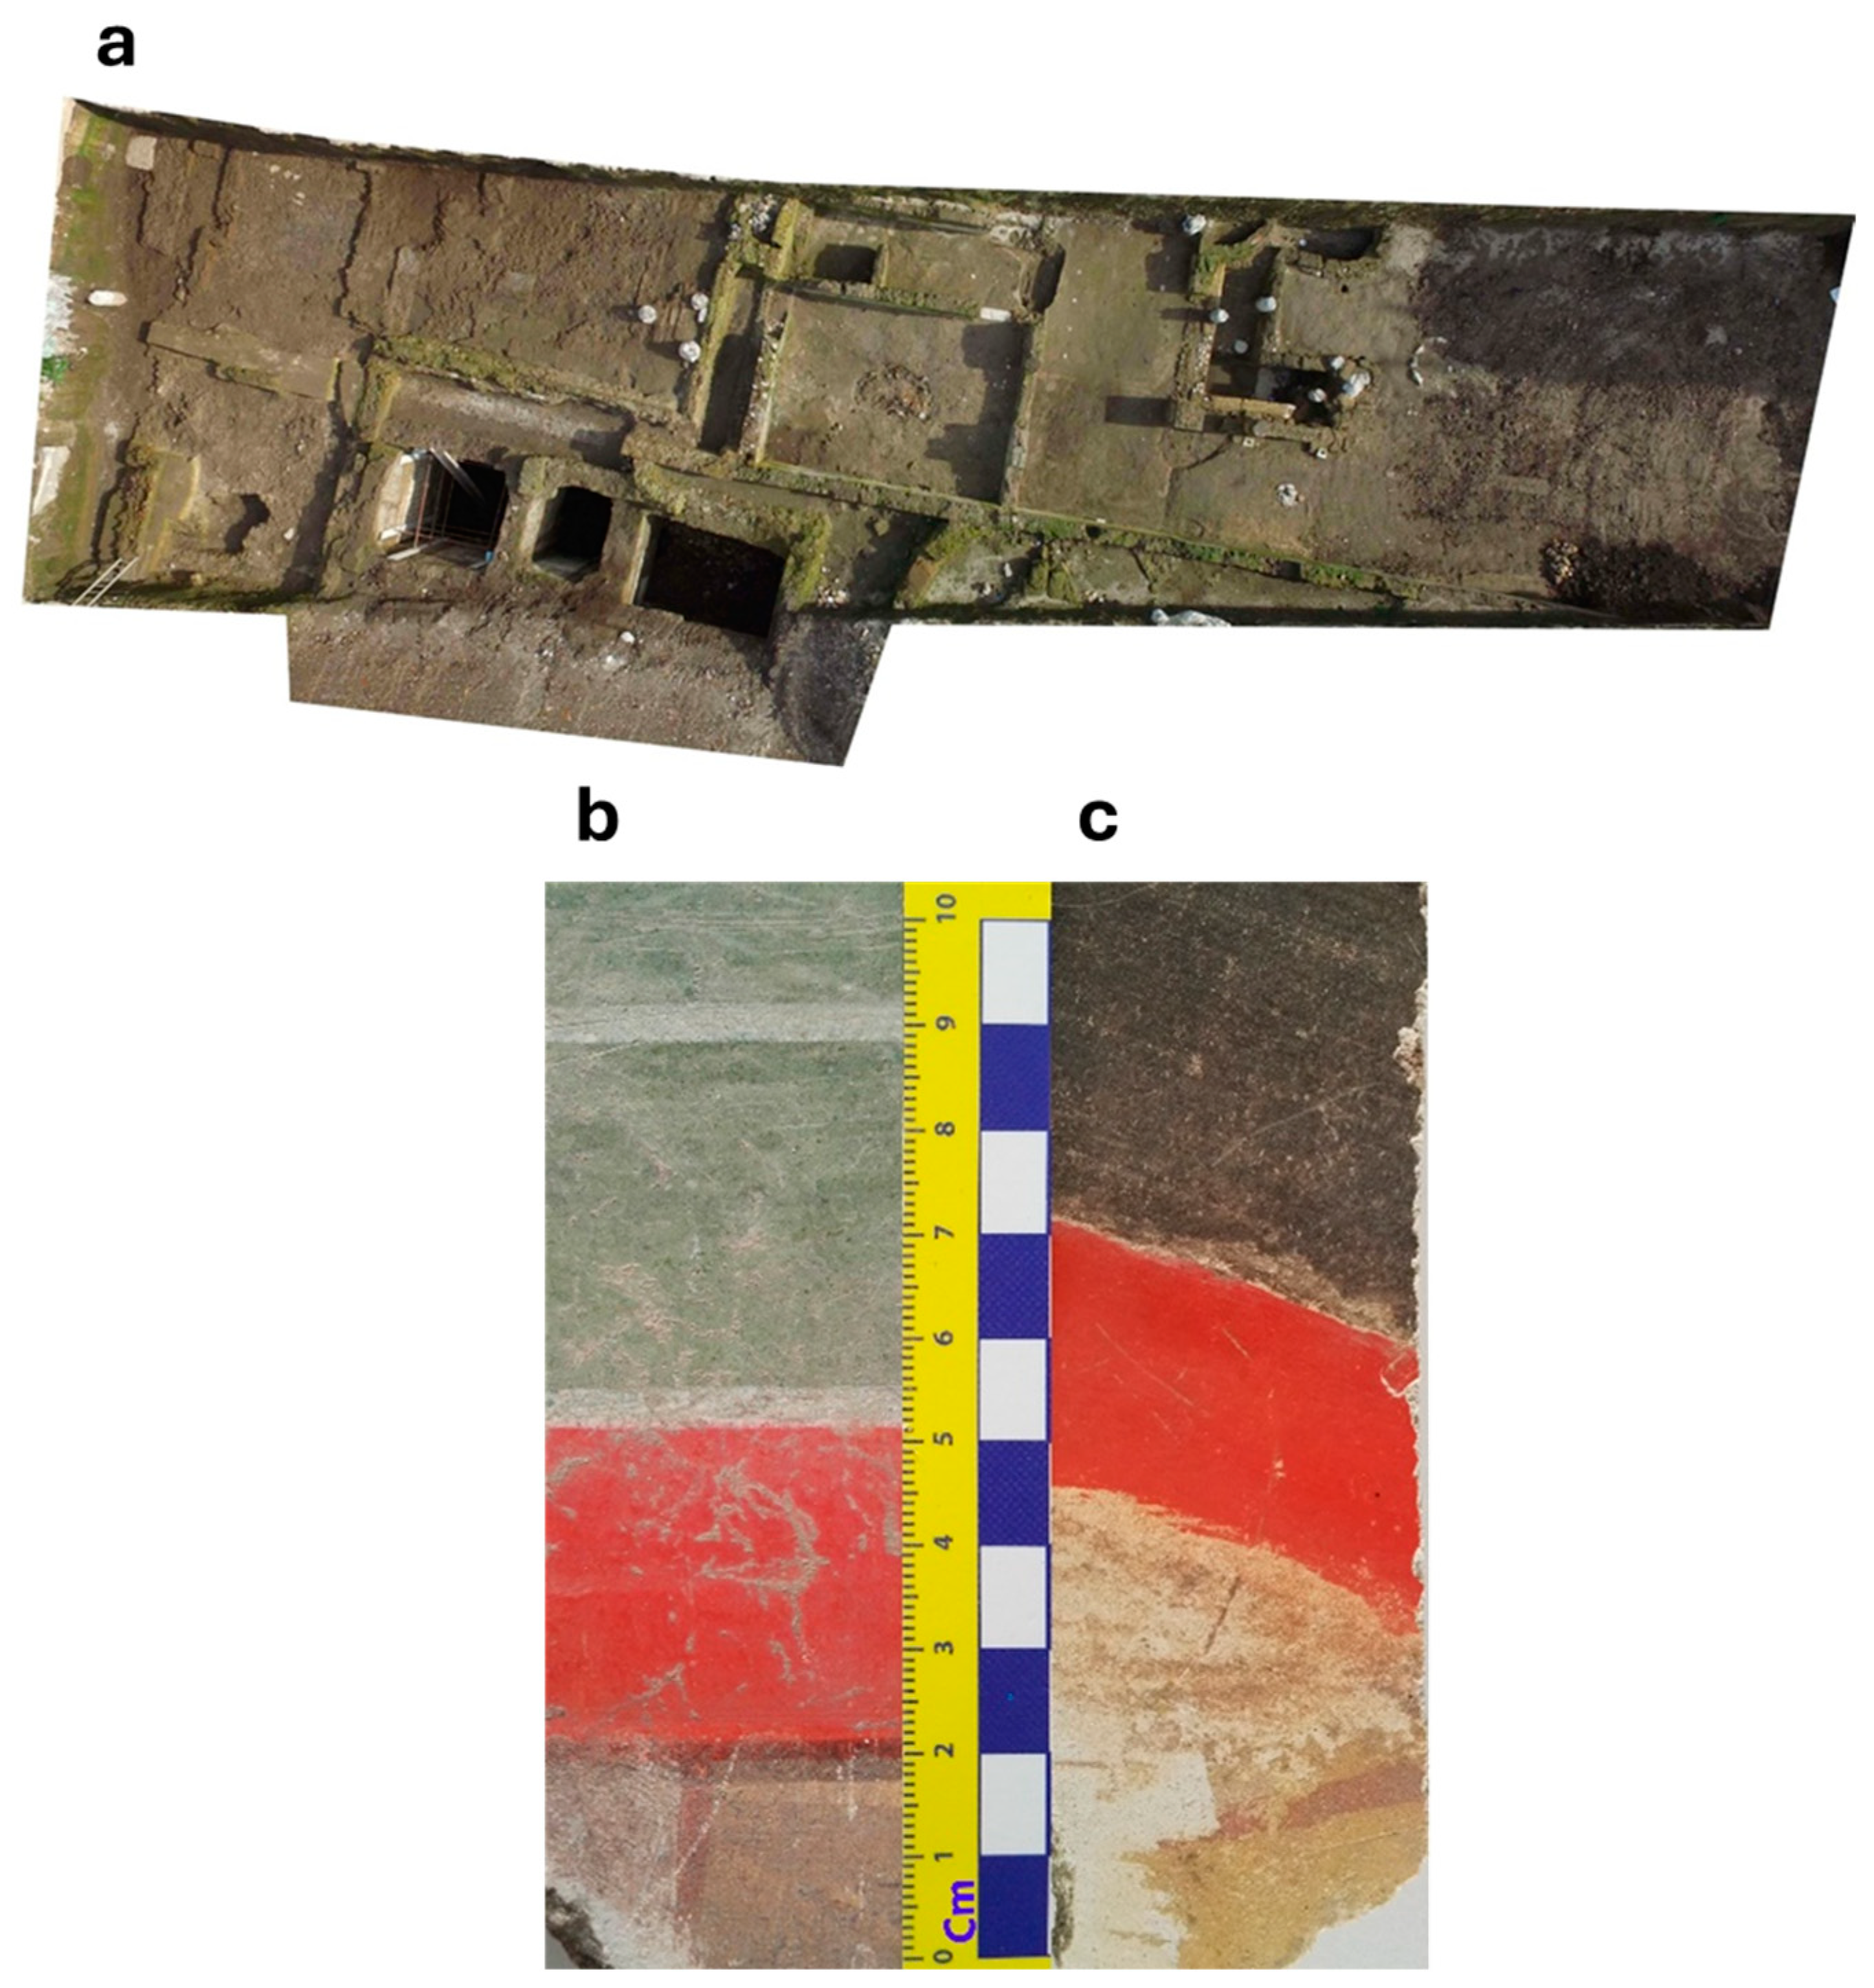
In 2018 excavations, in an area located south of the ancient Appian way, a multi-level site consisting of three hypogeal nymphaeums was unearthed, two of which had walls completely prepared with a type of painting attributable to the so-called IV Pompeian style. The domus has a continuity of life from the late republican age to the late antiquity. In the plan, there are several rooms, a peristylium with two ornamental basins, and a large area intended for a garden (Figure 2a).
The plan that can now be read is the result of a progressive increase in terms of other domus of ancient Capua. Between the late Republican and early Imperial periods, the first large-scale layout of the domus can be placed, as documented by the construction of three rooms that develop over a large garden area with a peristyle. In the first half of the third century, an extension was carried out involving the addition of three nymphaeums and a large rectangular room with a portico. The three nymphaeums of the domus present a complexity and a decorative commitment that indicates their exceptional character and is not much compared to other contexts relating to urban residences. During the fourth century, several interventions were carried out, including the construction of a porticoed area. Around the middle of the fifth century, probably coinciding with the devastation brought by the Vandals of Genseric in 456 A.D., we witnessed the plunder, devastation, and definitive abandonment of the domus.
In this work, several areas of the Roman villa were sampled, including wall paintings (Figure 2b). The molecular characterization of the murals in terms of colors and/or organic binders can reveal important aspects of their preparation technique and conservation state [1,4,16]. Vibrational spectroscopies, optical and electronic microscopies, and mass spectrometric techniques were used herein to give a chemical picture of the wall paintings, composed of multiple layers, revealing both a variety of pigments and binders [17,18]. The archaeometric data presented herein provide information on the chemical constituents of the wall paintings, identifying the preparation technique as well as their conservation state. Specifically, four fragments of wall paintings were selected on site and are presented herein (as representative of the shades of color present).

3. Materials and Methods

The approach adopted to identify the preparative technique of a Roman wall painting involves non-destructive techniques, namely optical microscopy and Raman micro-spectroscopy of the superficial pictorial layer (Figure 1, Block 1). Then, micro-destructive techniques such as GC-MS and LC-MS/MS (Figure 1, Block 2) and finally macro-destructive ones such as petrographic microscopy and SEM-EDS (Figure 1, Block 3) were employed. The amount of samples needed for various detections is also detailed in Figure 1.
Sampling. Nine erratic fragments (63, 139, 146, 172, 187, 151A, 151B, and 151C) fallen from collapsed walls were collected by the archaeologist Dr Tomeo during the excavation and were classified in terms of stratigraphic units. Among these fragments, we selected the investigated samples with a threefold criterion: (a) to cover all the colors with different shades used for the paintings; (b) to cover different mortar preparations (with both three and four layers); and (c) to detect traces of deterioration.
Raman microspectroscopy. Raman microspectroscopy was carried out on the pictorial layer of all the samples. The Raman spectra were collected at room temperature using a confocal micro-Raman spectrometer (Jasco, NRS-3100), working with the 514 nm excitation line from an Ar+ laser (3 mW at the sample), with an experimental setup elsewhere reported [19], providing an average spectral resolution of up to 4 cm−1. The spectra acquisition times varied from 20 to 60 s and spectra were triplicated for scope of reproducibility. The assignment of Raman bands was performed by comparing data with the literature and available web databases (e.g., RRUFF library).
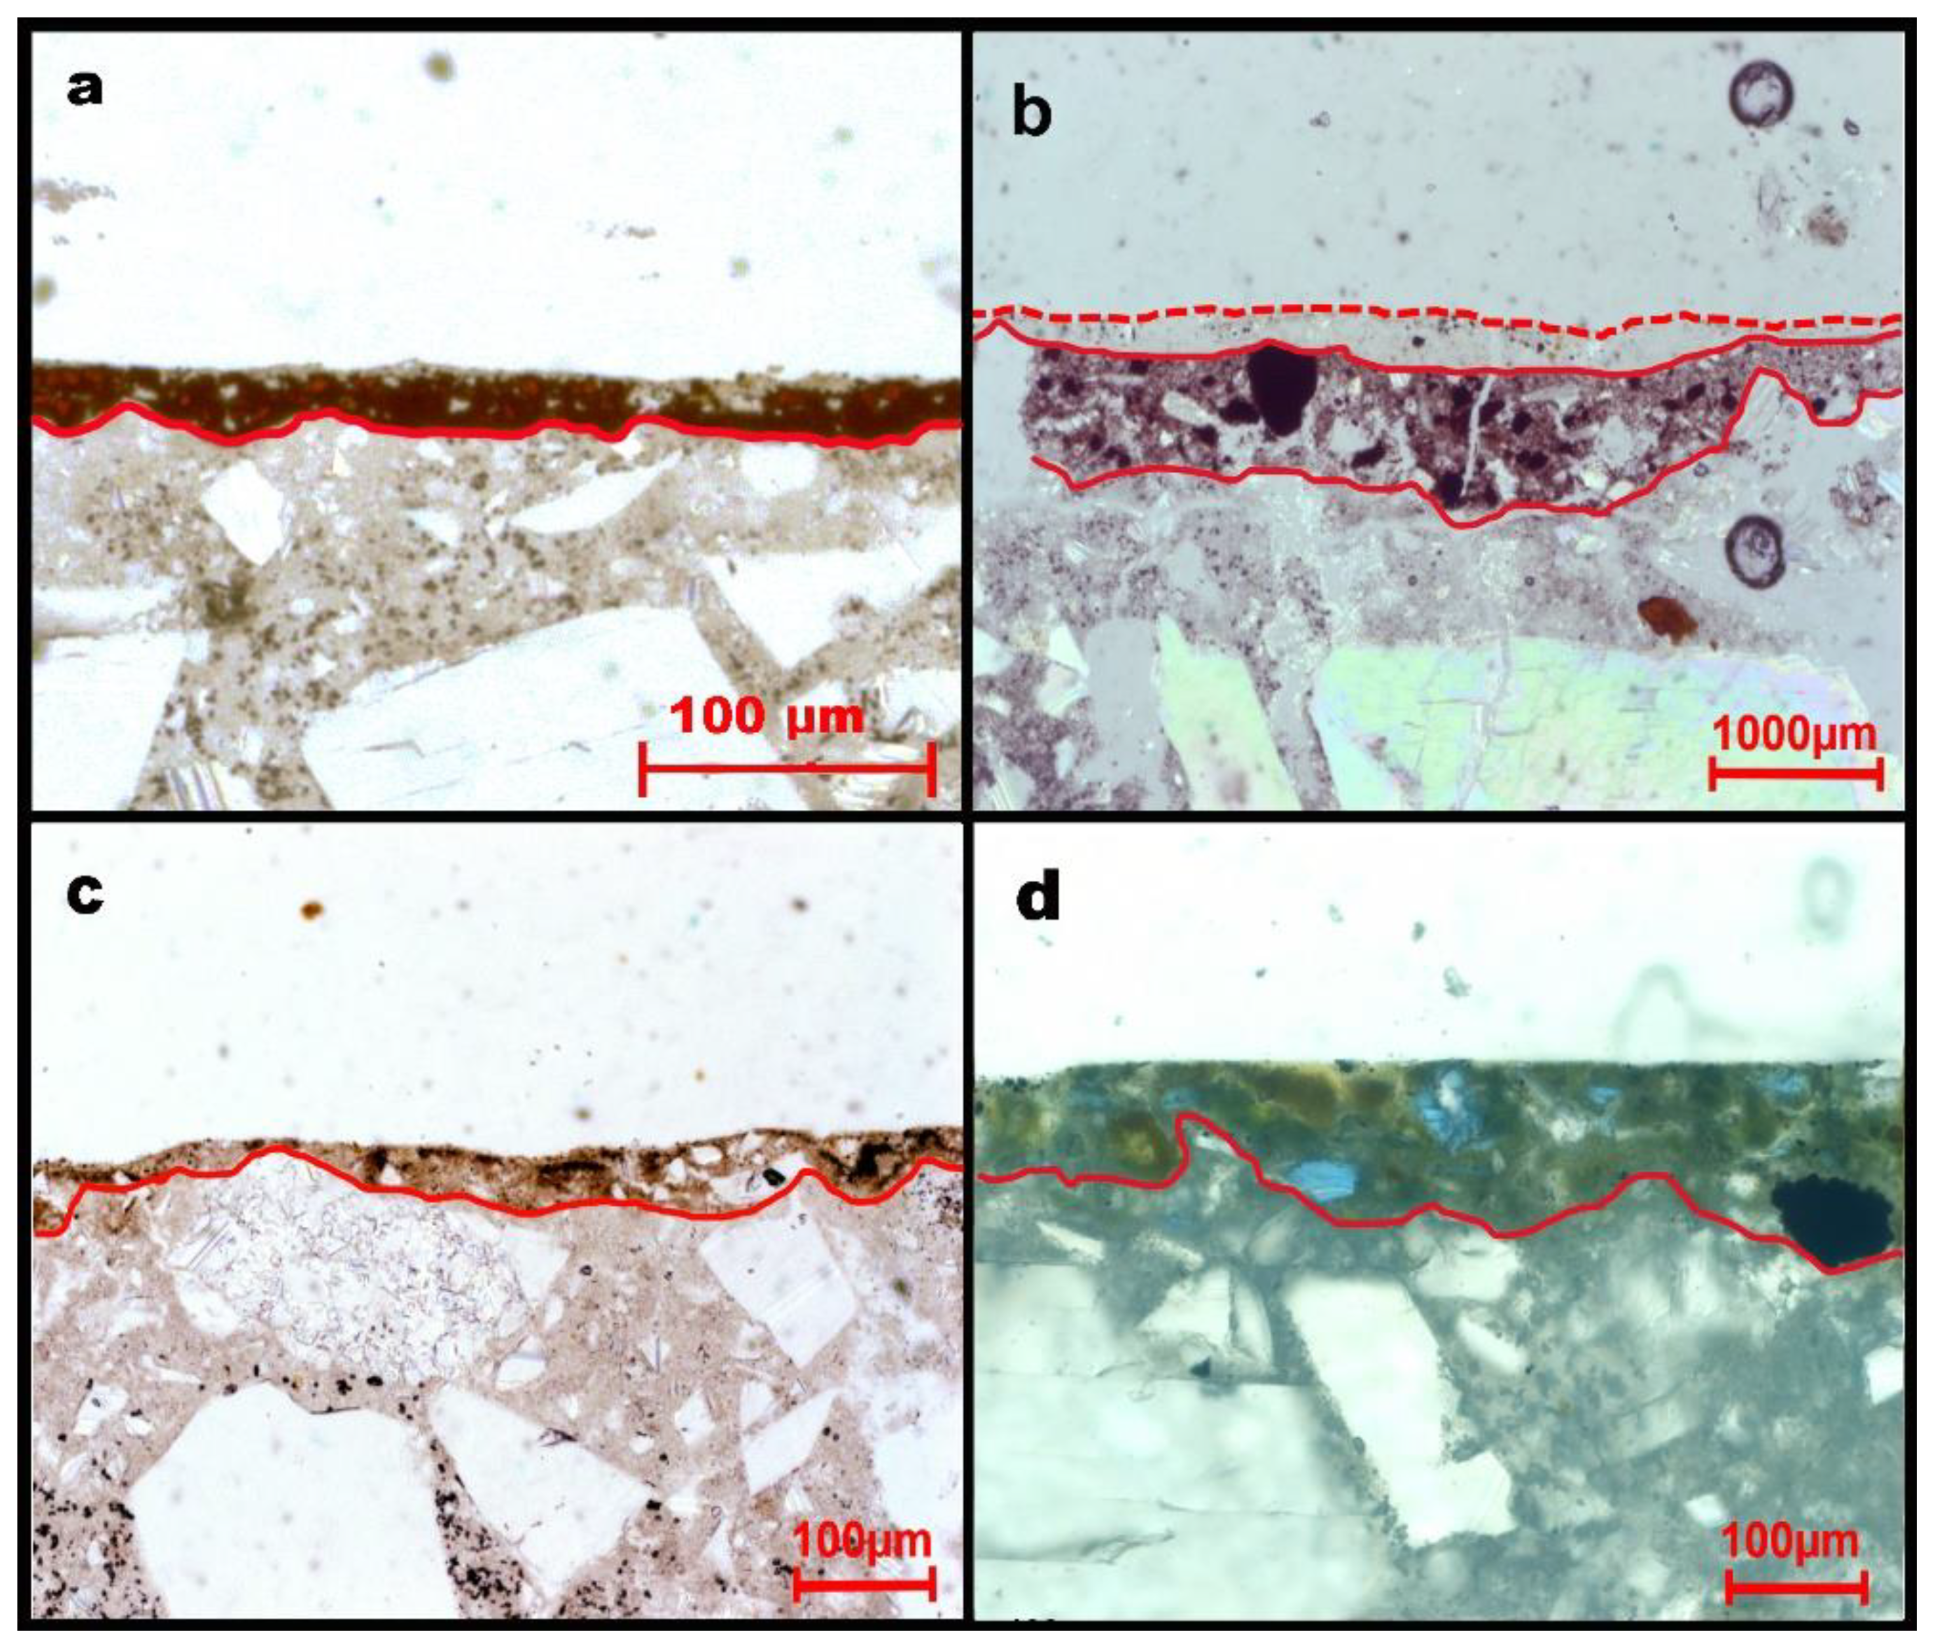
Optical microscopy. All samples were first analyzed via a macroscopic observation on 3D materials with a stereomicroscope (SM, Figure 3) and subsequently via a petrographic observation (PM, Figure 4) on thin sections with the petrographic microscope, followed by backscattered images (BSE) and quantitative chemical analyses (EDS, Table 1). All samples are made up of wall fragments inclusive of the pictorial layer.
The stereo and petrographic microscopes used are the AXIO ZOOM V16 and AXIO IMAGER A1m by Zeiss powered by the Museum Center of Natural and Physical Sciences of University Federico II. The lighting takes place from a CL 9000 LED CAN cold source for the stereomicroscope. The light reflected in the bright field was used for the work carried out. The AxioCam ICc5 camera was used for image acquisition. The software used for image acquisitions is Axiovision SE64 Ref 4.9.1 with Z-Stack, Extended Focus, and Panorama modules.
SEM.-EDS. Electron probe microanalysis was used to determine the quantitative chemical composition of the minerals present in the paint layers on thin sections [20,21]. A quantitative elemental analysis was performed using a scanning electron microscope (SEM) JEOL-JSM 5310, coupled with energy-dispersive X-ray spectroscopy (EDS). Specifically, energy software with an XPP matrix correction scheme and Pulse Pile-up correction [22] was used to manage an INCA X-act detector. Data were processed with INCA software version 4.08 (Oxford Instruments. INCA, the microanalysis suite issue 17a+SP1, Version 4.08. Oxford Instr. Anal. Ltd., Oxfordshire, UK; 2006). Minerals and pure elements were used as standards for the analyses of thin sections. For quantitative chemical analyses, the thin section samples were coated with graphite. For each mineral in the pictorial layers of thin sections, 25 analytical points were collected. The quantitative chemical data were compared with mineralogical databases for the recognition of the different mineral phases present [21,23].
Organic molecules analyses (GC-MS). Selected samples of wall paintings were treated by fractionation, derivatization, and successive analysis as elsewhere reported [24]. Briefly, 400 μL of 2.5 M NH3 were added to solid samples (about 10 mg) and vortexed and extraction was carried out in an ultrasonic bath at room temperature for 30 min and then for 120 min at room temperature. The procedure was repeated twice and supernatants were combined. Samples were dried under vacuum and then suspended in 400 μL of tri-fluoro-acetic acid (TFA) 1.0 and extracted with 500 μL of diethyl ether (three times). The non-polar phase was dried under vacuum and subjected to transesterification by adding 150 μL of sulphuric acid and 850 μL methanol to 1.0 mL of chloroform at 95 °C for 16 h. Subsequently, the pH was corrected to neutrality by the addition of 2.0 mL of a 100 mg/mL ammonium bicarbonate solution. The chloroform phase was recovered and the excess of salts was removed by water and dried under nitrogen flow. Then, it was suspended in 100 μL of n-hexane and 1.0 µL was analyzed by GC-MS. The polar saccharides containing fractions were eventually dried under vacuum and submitted to methanolysis by adding 500 μL of methanolic HCl (1:20 acetyl chloride:anhydrous methanol) at 90 °C for 16 h. The sample was dried under vacuum and Re-N-acetylation of the monosaccharides mixture was performed by adding 500 μL of methanol, 10 μL of pyridine, and 50 μL of acetic anhydride at room temperature for 15 min. Samples were dried under vacuum and then trimethylsilylated in 200 μL of N,O-bis-(trimethylsilyl)-acetamide (TMS) at 70 °C for 15 min. Each sample was dried down under nitrogen flow, dissolved in 50 μL of hexane, and centrifuged to remove the excess of solid reagents; after, 1.0 μL was used for the GC-MS analysis.
GC-MS analyses were performed on an ISQ-QD quadrupole mass spectrometer (Thermo Fisher Scientific, Waltham, MA, USA) equipped with a TRACE™ 1300 Gas Chromatograph using a Zebron ZB-5HT Inferno (5%-Phenyl-95%-Dimethylpolysiloxane)-fused silica capillary column (Column 30 × 0.32 × 0.10 μm) from Phenomenex, Torrance, CA, USA. The injection temperature was 250 °C; the oven temperature was held at 70 °C for 2 min and then increased to 230 °C at 20 °C/min, increasing to 240 °C at 20 °C/min and finally to 270 °C at 20 °C/min before being held for 3 min. Electron ionization mass spectra were recorded by continuous quadrupole scanning at 70 eV ionization energy, in the mass range of m/z 30–800. Mass spectra assignment was generally based on the direct match with the spectra of the NIST library; if the correlation match index was higher than 95%, the identification was considered reliable.
Protein analysis in the heterogeneous phase. Since samples are characterized by a significant number of metals and carbonates (as detected by elemental and Raman-based techniques), a pre-treatment step of demineralization was necessary. About 300 µL of a solution of 0.5 M EDTA pH~8 was added to wall fragments for 10 days at room temperature, refreshing the solution every 2 days. The centrifugate (2 min at 10,000 rpm) was collected and the supernatant was rejected. After 10 days, to favor the protein digestion in the heterogeneous phase, the pellet was incubated with 6 M urea to promote the loosening of the three-dimensional structure. In total, 10 µL of a solution of 6 M urea was added to micro-samples and incubated at room temperature for 10 min and finally sonicated for 20 min. Urea was then 6-fold diluted with 10 mM ammonium bicarbonate to allow enzyme digestion with trypsin that was added up to a final concentration of 0.1 μg/μL. After incubation at 37 °C for 16 h, the supernatants were recovered (centrifugation at 10,000 rpm) and the peptide mixture was filtered (0.22 µm PVDF Millipore membrane), concentrated, and purified using a reverse-phase C18 Zip Tip pipette tip (Millipore, Burlington, MA, USA). Peptides were then eluted using 20 μL of a solution made of 50% Acetonitrile and 50% Formic acid 0.1% in Milli-Q water and finally analyzed by LC-MS/MS.
LC-MS/MS analyses. Selected samples were analyzed according to Vinciguerra et al. [13]. In details, LC-MS/MS analyses were carried out on a 6520 Accurate-Mass Q-Tof LC/MS System (Agilent Technologies, Palo Alto, CA, USA) equipped with a 1200 HPLC System and a chip cube (Agilent Technologies). After loading, the peptide mixture was first concentrated and washed on a 40 nL enrichment column (Agilent Technologies chip), with 0.1% formic acid in 2% acetonitrile as eluent. The sample was then fractionated on a C18 reverse-phase capillary column (Agilent Technologies chip) at a flow rate of 400 nL/min, with a linear gradient of eluent B (0.1% formic acid in 95% acetonitrile) in A (0.1% formic acid in 2% acetonitrile) from 3% to 80% in 50 min. Peptide analysis was performed using data-dependent acquisition of one MS scan (mass range from 300 to 2000 m/z) followed by MS/MS scans of the three most abundant ions in each MS scan. MS/MS spectra were acquired automatically when the MS signal surpassed the threshold of 50,000 counts. Double- and triple-charged ions were preferably isolated and fragmented.
MS/MS spectra were used to query the SwissProt database (2015_02 (547,599 sequences; 195,014,757 residues)) with Chordata as a taxonomy restriction. A licensed version of Mascot software (www.matrixscience.com) version 2.4.0. was used with trypsin as enzyme 3, as it allows a number of missed cleavage sites; 10 ppm MS tolerance and 0.6 Da MS/MS tolerance; peptide charge from +2 to +3. No fixed chemical modification was inserted but possible oxidation of methionine and deamidation of asparagine and glutamine were considered as variables. When collagen was detected, the sample was reanalyzed by searching a homemade database, “COLLE” (60 sequences; 88,859 residues), with sequences of collagen type I and III (for all the common domesticates typically used for animal glues) that have been deposited to Mendeley Data (https://data.mendeley.com/datasets/hbmc8yhf7y/2, accessed on 11 July 2022) with the same search parameters as above; plus, hydroxylation (K) and hydroxylation (P) were set as additional variable modifications to consider, as a specific post-translational modification of collagen. Only the identification of proteins with at least two peptides with individual ion scores above the significance threshold (>20) was considered as significative.

4. Results and Discussion

Two regions of the wall paintings, namely the 151 and 187 pieces, were selected on the site for the analyses of pigments but also of organic/proteic binders. Sample 151 is characterized by a color complexity; therefore, it was split into three distinct sections and sampled in three different points (called 151A, 151B, and 151C). The four sample analysis consisted of a multi-methodological approach, including optical microscopies, SEM-EDS, Raman microspectroscopy, GC-MS, and LC-MS/MS techniques.

4.1. Optical, Electron Microscopy, and Quantitative Chemical Analysis

Based on SM and PM observations, the outermost layer is composed of pigments of various nature and colors, which form the pictorial layer, followed by two layers of mortar. The mortars of samples 187, 172, 151A, 151B, and 151C were previously examined using OM, PM, and SEM-EDS [25]. Briefly, the first layer of mortar consists of a carbonatic matrix containing clasts, including large ones, of calcite and dolomite. The second layer of mortar is composed of a silico-carbonatic matrix with silicate clasts, including altered pumices, feldspars, pyroxenes, micas, oxides, hydroxides, and, sporadically, anatase [25,26].
Herein, we focus just on the composition of the pictorial layer, on the preparative technique, and on evidence of deterioration. The pictorial layer is characterized by different, sometimes overlapping, colors (Figure 1b,c) and a variable thickness, between 200 μm and 11 μm. The most frequent color is red (in various shades) but several greens, a yellow, a black, a very light pink, and a white (slightly yellowed) were also observed (Figure 3). Many samples exhibit different co-existing colors (Figure 2b,c and Figure 3b,d). Some local portions of the painted walls show incrustations of different materials (e.g., soil and patinas alteration of the pictorial layer) and/or profound incisions, sometimes parallel to each other. In some cases, even holes of different depths and extensions were observed, with a layer of paint completely removed (Figure 3a). Randomly dispersed small opaque fragments of black color were observed in the reddish pigments. The combined PM and EDS analyses revealed that all the pictorial layers (defined as the first superficial layer containing the pigment) host cryptocrystalline and microcrystalline minerals, sometimes associated with a minor amount of lime binder. Those pictorial layers characterized by a reddish color, tending also to reddish/brown or yellow (Figure 4c), appear to be composed of cryptocrystalline goethite (α- Fe3+O(OH)) associated with hematite (Fe2O3) microcrystals and of cryptocrystalline Fe and Pb oxides and hydroxides. The layers of bright red color are mainly composed of cryptocrystalline and microcrystalline cinnabar (HgS) and hematite (Figure 4a). The quantitative chemical analyses (EDS) not only allowed us to recognize the minerals present in the first layer but, with the support of PM analyses, we were able to derive a recipe for the various colors (Table 1) [20,21,23]. From a statistical analysis of the abundance of different minerals, the reddish/brown pictorial levels appear to be composed of 80–90% goethite and 20–10% hematite (Table 1); the yellow pictorial level is composed of Fe and Pb hydroxides with a variable amount of PbO between 33.6 wt% and 1.19 wt% (Table 1); and, finally, bright red levels are composed of 90% cinnabar and 10% hematite (Table 1).
In the green pictorial area, the pigments show different mineralogical features (Figure 4d). There are green and blue crystals with different sizes as major components but there are also white and small black fragments. Green pigments are mostly composed of a strongly pleochroic mineral, with colors ranging from light to darker green. The green color is typical of glauconite (K,Na)(Mg,Fe2+,Fe3+)(Fe3+,Al)(Si,Al)4O10(OH)2) and/or chlorite and/or clinochlore [27,28]. Blue fragments are weakly pleochroic with turquoise colors of variable intensity, associated with turquoise crystals with strong birefringence and high interference colors, suggesting copper-rich silicate minerals [21]. EDS-based quantitative elemental analysis confirmed the presence of glauconite, whereas in turquoise crystals, cuprorivaite (CaCuSi4O10) was identified [20,21,23]. The chemical analysis in green layers shows the presence also of calcite, hematite, and goethite (EDS data). The analyses in PM and SEM-EDS show the following amounts: glauconite 47%, cuprorivaite 35%, calcite 9%, and hematite + goethite + ulvospinel 9% (Table 1).
Also, in the whitish pictorial layer, the pigments show different mineralogical features, generally consisting of calcite in a very fine mass (PM and EDS data).
Moreover, sample 151C (Figure 4b) shows some features given by the presence of a more external layer consisting mainly of very compact but strongly altered calcium phosphate as detected by SEM-EDS, covering an internal level consisting of carbonate matrix and iron oxides. This macroscopical layer has a brown reddish color, with the composition shown in Table 1.
The thin sections of the black pictorial layers show pale-yellow micro crystals (visible even in polarized transmitted light, Figure 3), while crossed Nicols (+) keep extinct, suggesting that they can be of organic matter. In whitish color, the chemical analyses confirm the presence of calcite in a very fine mass.

4.2. Raman Micro-Spectroscopy

Herein, samples 63, 139, 146, 151A, 151B, 151C, and 187, (Figure 2b,c) provided useful Raman spectra, aiming to identify inorganic pigments and potential deterioration of the pictorial layers. As observed via OM analysis, samples exhibit several shades of colors from red, yellow, blue, green, and white.
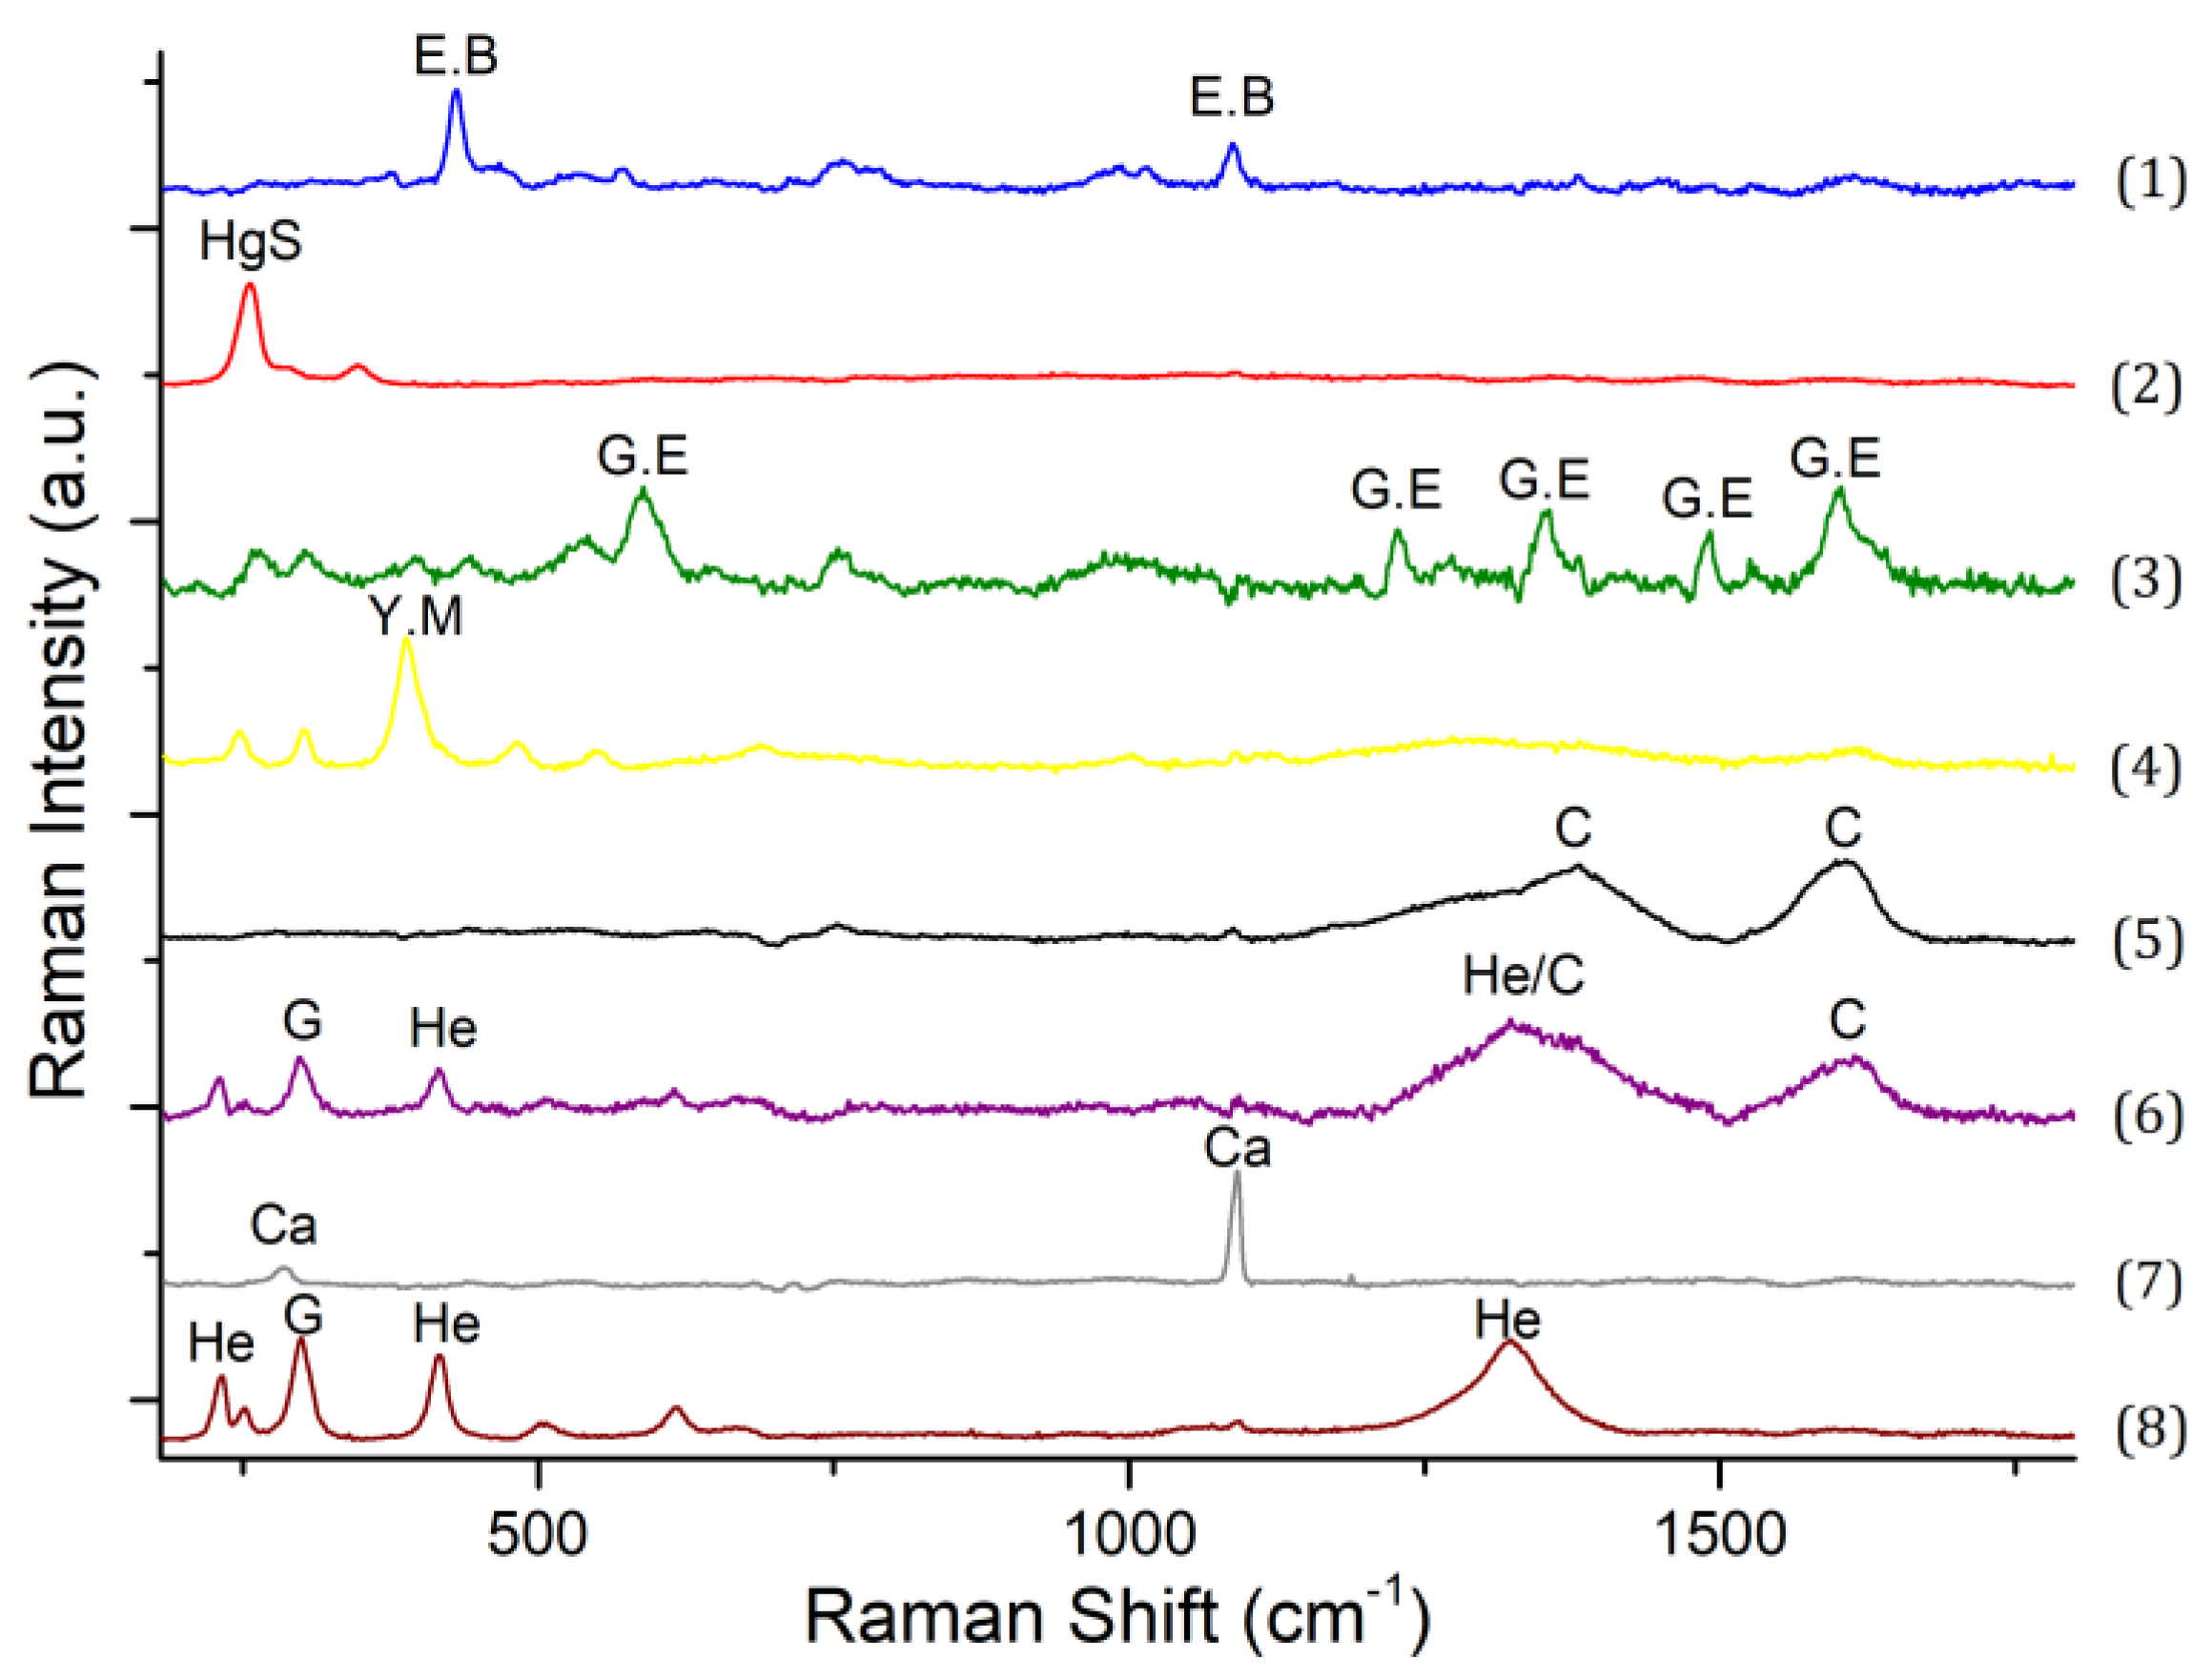
Raman spectra indicated that white regions with intense bands at 1089 cm−1 can be easily assigned to calcite (Figure 5, trace 7) [29]. Other white spots of the 151A sample (Figure 3c) exhibit Raman peaks at 285 and 1091 cm−1 as well assigned to calcite. However, in these white areas, calcite could also be a component from the second layer, corresponding to the first mortar, visible due to the scratching on the surface.
The blue color found on the surface of samples 146 and 151A that exhibit Raman peaks at 430, 467, 572, 757, 989, 1015, and 1087 cm−1 that are assigned to cuprorivaite (CuSi4O10) is known as Egyptian blue (Figure 5, trace 1) [30].
Raman bands of the green pigment in sample 151A show the presence of “Green earths”, attributable to glauconite (Figure 5, trace 3), as also confirmed by FTIR spectra (Figure S1). The chemical composition of glauconite is approximately (K, Na)(Fe3+,Al,Mg)2(Si,Al)4O10(OH)2, similar to celadonite but with a large content of Al.
Different shades of red were observed in samples 139, 151A, 151B, and 151C via optical microscopy. The bright red pictorial layer from sample 151A exhibits very strong Raman bands at 254, 287, and 344 cm−1, assigned to cinnabar, HgS (Figure 5, trace 2) [31,32], whereas both the red surface of 139, 151B, and 151C present a darker shade resulted from a mixture of iron oxides, such as hematite and goethite (Figure 5, trace 8) [33,34]. Moreover, the sample 151B also exhibits a third chemical component of lower intensity (mixed with the red color) with Raman bands at 1296 cm−1 and 1611 cm−1 assigned to amorphous carbon (Figure 5, trace 6) [35], possibly added for an even darker shade of red. The overlap of the hematite-related broad magneton band with the D-carbon band around 1300 cm−1 justifies the apparent inversion in relative intensity between the D and G bands of amorphous carbon reported in trace 5 of Figure 5. A partial goethite-to-hematite conversion, possibly due to the laser exposure [34,36,37], cannot be excluded from our Raman investigation. Nevertheless, it is worth noting that, most likely, goethite itself is a product of weather-induced conversion of an initial hematite [38], so the laser-induced Raman spectra might even correspond to the actual starting pigment.
The yellow color of sample 151A shows Raman bands typical of Fe(OH)3 (Figure 5, trace 4) [39], whose synthetic counterpart (typical of the 19th century) is known as Mars yellow. In this case, Raman analysis probably reveals only one minor component of the pigment used because the EDS-based elemental analysis of the yellow shows high heterogeneity, most likely corresponding to limonite (mixture of hydroxide/oxides of iron, zinc, and titan). Out of the samples analyzed, 63 and 187 show signs of degradation on the surface. Indeed, the Raman spectra of these samples do not show bands of any pigment; they are characterized only by a trace of carotenoid species [40], probably indicating some biodeterioration in the pictorial layer. Finally, no Raman bands associated with sulfate or nitrate efflorescence were observed from the collected samples, ruling out significant effects of acidic gases from urban pollution, consistently with the recent excavation.

4.3. GC-MS: Analysis of Organic Binders

Four samples out of the initial nine, which were better conserved and characterized, were chosen for chromatographic investigation (151A, 151B, 151C, and 187). The polar and nonpolar fractions of all the samples were separated via a multistep protocol. The polar fraction included sugars and compounds of medium polarity, whereas the nonpolar fraction was composed mainly of lipids. The polar fraction was subjected to sugar analysis and chemical derivatization with TMS. The nonpolar fraction was subjected to transesterification and GC-MS analysis (data summarized in Table 2a). No sugars were detected in any sample, whereas flavonoids, steroids, and compounds with abietanic skeletons were identified. In all of the samples, 10,18- bisnorabieta-8,11,13-triene was detected. This is a degradation product of abietic acid; thus, it is considered a marker of pinaceous resin, commonly used in the past to impermeabilize [41,42]. Moreover, samples 151A and 151B show a similar chemical profile, with the presence of steroid compounds of animal origin (cholest-5-en-19-al,3ß- hydroxy-,cyclic ethylene mercaptal, acetate, and hexastrol) [43]. On the other hand, stephaboline in sample 151C and the semi-long fatty acids that were detected in sample 187 are chemical compounds of vegetable origin [44,45]. In the nonpolar fractions, several fatty acids were detected in the form of methyl ester derivatives (FAMEs) (Table 2b). Palmitic and stearic acid were detected in all samples, being two of the most common compounds found in many matrices, both of animal and vegetable origin. The ratio C16:0/C18 in samples 151A and 151B (Table 2b) is compatible with the presence of animal fat [46], although this relative ratio can also be affected by aging. Finally, the same ratio in samples 151C and 187 cannot unambiguously provide any information on the origin (animal or vegetable fat).

4.4. LC-MS/MS: Analysis of Proteinaceous Binders

The presence of a proteinaceous binder was investigated by using a proteomic approach with trypsin digestion in a heterogeneous phase, following a literature protocol [12]. The chains of collagen type I from Bos taurus were detected in samples 151A and 151B, as reported in detail in Table 3a,b, in agreement with the identifications of lipids of animal origin reported above. No significant proteins were detected in the samples 151C and 187.

4.5. Distinguishing Different Preparative Techniques of Wall Paintings

The approach adopted to identify the preparative technique of a Roman wall painting is sketched in Figure 1, reporting also the amounts of sample currently sacrificed for the corresponding analysis. A box structure constitutes the graphical representation of the adopted analytical procedure, involving non-destructive (Figure 1, Block 1), micro-destructive (Figure 1, Block 2), and, finally, macro-destructive techniques (Figure 1, Block 3). It is worth noting that, in our sketch, we report only those techniques able to distinguish between a fresco, a secco, and other preparations. Therefore, techniques that do not detect carbonate anion and/or any binder are not included in Figure 1.
We can already obtain a preliminary indication of the presence or absence of the calcite in the pictorial layer via Raman spectroscopy (Figure 1, Block 1). Nevertheless, a definitive assignment as a secco preparation requires the identification of a binder (as in Figure 1, Block 2), which is either organic (via GC-MS) or proteinaceous (via HPLC-MS/MS). Therefore, the minimal approach (Figure 1, Block 1 + Block 2) allows the identification of the preparative techniques using exclusively non- or micro-destructive techniques. The inclusion of Block 3 provides an extended approach that can contribute to the knowledge on the preparation of the wall painting, such as the optical microscopy investigation of the thin section that allows us to check whether the first layer contains only pigment dispersed in a binder or in a microcrystalline carbonate material.
In case we identify both calcite in the pictorial layer and binders, we can suggest a mixed a fresco secco preparation in which an a secco painting was added over an a fresco preparation [47]. The results obtained by using the approach described to distinguish between the preparative techniques of wall paintings are summarized in Table 4.

5. Conclusions

Regarding the specific case study, Raman spectroscopy and SEM-EDS analysis allowed us to characterize the inorganic components of the pictorial layer from the wall paintings of the Domus in S.M. Capua Vetere. Moreover, our Raman study rules out the detectable current effect of urban pollution (no sulfates/nitrate efflorescence), whereas it indicates some initial biodeterioration on some pictorial layers. Regarding the paint palette, the blue shade was identified as “Egyptian Blue”; the green color as a glauconite-based pigment, known as “Green Earth”; the yellow pigments as the mineral limonite; and the red shade as cinnabar in the “151A” sample. Whereas, in “151B” and “151C”, a co-presence of goethite and hematite was observed. For paintings produced by mixing more pigments, the quantitative SEM-EDS analysis allowed us to extract an accurate quantitative recipe of the pigment relative amount. The observation of the organic components as a binder (resins and animal glue), along with the absence of significant calcite in the pictorial layer, allows us to classify a secco painting, where the color was applied directly on dry mortar.
Ultimately, an analytical chemical protocol was adopted to distinguish the a fresco technique from the a secco technique. A minimal version (based on non-invasive or microinvasive methodologies) and an extended version of the protocol (integrating destructive methodologies) were presented, providing an updated state of the art of the amount required during sampling.

Supplementary Materials

The following supporting information can be downloaded at https://www.mdpi.com/article/10.3390/heritage7080184/s1. Figure S1: Representative FTIR absorbance spectra of six pigmented areas (along with part of first mortar, contributing with calcite bands). Green trace supports the glauconite presence.

Author Contributions

Conceptualization, A.V., L.B. and A.T.; methodology, G.N., M.R. and M.A., software, G.N. and M.R.; validation, G.N. and M.R.; formal analysis, A.V., L.B., A.T., G.N. and M.R.; resources, A.V. and L.B.; data curation, G.N., M.R. and M.A.; writing—original draft preparation, A.V., L.B., M.R. and A.T.; writing—review and editing, A.V., M.A. and M.R.; visualization, M.R. and M.A.; supervision, A.V. and L.B.; project administration, A.V.; funding acquisition, A.V. and L.B. All authors have read and agreed to the published version of the manuscript.

Funding

This research was funded by PNRR PE5 CHANGES (PE00000020).

Data Availability Statement

Data are contained within the article.

Acknowledgments

We thank Nunzia De Riso for assistance in the preliminary Raman spectroscopy acquisition.

Conflicts of Interest

The authors declare no conflicts of interest.

References

  1. Cuní, J. What do we know of Roman wall painting technique? Potential confounding factors in ancient paint media analysis. Herit. Sci. 2016, 4, 44. [Google Scholar] [CrossRef]
  2. Angelini, I.; Asscher, Y.; Secco, M.; Parisatto, M.; Artioli, G. The pigments of the frigidarium in the Sarno Baths, Pompeii: Identification, stratigraphy and weathering. J. Cult. Herit. 2019, 40, 309–316. [Google Scholar] [CrossRef]
  3. Bergamonti, L.; Cirlini, M.; Graiff, C.; Lottici, P.P.; Palla, G.; Casoli, A. Characterization of Waxes in the Roman Wall Paintings of the Herculaneum Site (Italy). Appl. Sci. 2022, 12, 11264. [Google Scholar] [CrossRef]
  4. Cuní, J.; Cuní, P.; Eisen, B.; Savizky, R.; Bové, J. Characterization of the binding medium used in Roman encaustic paintings on wall and wood. Anal. Methods 2012, 4, 659. [Google Scholar] [CrossRef]
  5. Omarini, S. (Ed.) Encausto: Storia, Tecniche e Ricerche = Encaustic: History, Technique and Research; Nardini: Firenze, Italy, 2012; ISBN 978-88-404-4216-7. [Google Scholar]
  6. Dilaria, S.; Sbrolli, C.; Mosimann, F.S.; Favero, A.; Secco, M.; Santello, L.; Salvadori, M. Production technique and multi-analytical characterization of a paint-plastered ceiling from the Late Antique villa of Negrar (Verona, Italy). Archaeol. Anthr. Sci. 2024, 16, 74. [Google Scholar] [CrossRef]
  7. Brecoulaki, H.; Verri, G.; Kalaitzi, M.; Maniatis, Y.; Lilimpaki-Akamati, M. Investigating Colors and Techniques on the Wall Paintings of the ‘Tomb of the Philosophers’, an Early Hellenistic Macedonian Monumental Cist Tomb in Pella (Macedonia, Greece). Heritage 2023, 6, 5619–5647. [Google Scholar] [CrossRef]
  8. Conti, C.; Botteon, A.; Colombo, C.; Pinna, D.; Realini, M.; Matousek, P. Advances in Raman spectroscopy for the non-destructive subsurface analysis of artworks: Micro-SORS. J. Cult. Herit. 2020, 43, 319–328. [Google Scholar] [CrossRef]
  9. Carlomagno, I.; Drnec, J.; Scaparro, A.M.; Cicia, S.; Vlaic, S.; Felici, R.; Meneghini, C. Co-Ir interface alloying induced by thermal annealing. J. Appl. Phys. 2016, 120, 195302. [Google Scholar] [CrossRef]
  10. Mateos, L.D.; Esquivel, D.; Cosano, D.; Jiménez-Sanchidrián, C.; Ruiz, J.R. Micro-Raman analysis of mortars and wallpaintings in the Roman villa of Fuente Alamo (Puente Genil, Spain) and identification of the application technique. Sens. Actuators A Phys. 2018, 281, 15–23. [Google Scholar] [CrossRef]
  11. Casoli, A. Research on the Organic Binders in Archaeological Wall Paintings. Appl. Sci. 2021, 11, 9179. [Google Scholar] [CrossRef]
  12. Smoluch, M.; Sobczyk, J.; Szewczyk, I.; Karaszkiewicz, P.; Silberring, J. Mass spectrometry in art conservation—With focus on paintings. Mass. Spectrom. Rev. 2023, 42, 1625–1646. [Google Scholar] [CrossRef]
  13. Vinciguerra, R.; De Chiaro, A.; Pucci, P.; Marino, G.; Birolo, L. Proteomic strategies for cultural heritage: From bones to paintings. Microchem. J. 2016, 126, 341–348. [Google Scholar] [CrossRef]
  14. Andreotti, A.; Bonaduce, I.; Colombini, M.P.; Gautier, G.; Modugno, F.; Ribechini, E. Combined GC/MS Analytical Procedure for the Characterization of Glycerolipid, Waxy, Resinous, and Proteinaceous Materials in a Unique Paint Microsample. Anal. Chem. 2006, 78, 4490–4500. [Google Scholar] [CrossRef] [PubMed]
  15. Pagano, M.; Tomeo, A. Capua—La Seconda Roma: Nuovi Studi e Ricerche; Soprintendenza ABAP Caserta/Benevento: Caserta, Italy, 2021; ISBN 978-88-943027-9-0. [Google Scholar]
  16. Gelzo, M.; Grimaldi, M.; Vergara, A.; Severino, V.; Chambery, A.; Dello Russo, A.; Piccioli, C.; Corso, G.; Arcari, P. Comparison of binder compositions in Pompeian wall painting styles from Insula Occidentalis. Chem. Cent. J. 2014, 8, 65. [Google Scholar] [CrossRef] [PubMed]
  17. Corso, A.D.; Pignataro, L.; Belvisi, L.; Gennari, C. Innovative Linker Strategies for Tumor-Targeted Drug Conjugates. Chem.—A Eur. J. 2019, 25, 14740–14757. [Google Scholar] [CrossRef] [PubMed]
  18. Prisco, G. Su Alcune Particolarità Tecniche delle Officine Addette alla Decorazione della Domus Vettiorum. In Nuove Ricerche Archeologiche a Pompei ed Ercolano; Atti del Convegno Internazionale: Roma, Italy, 2002; pp. 355–366. [Google Scholar]
  19. Vergara, A.; Vitagliano, L.; Merlino, A.; Sica, F.; Marino, K.; Verde, C.; di Prisco, G.; Mazzarella, L. An Order-Disorder Transition Plays a Role in Switching Off the Root Effect in Fish Hemoglobins. J. Biol. Chem. 2010, 285, 32568–32575. [Google Scholar] [CrossRef]
  20. Nesse, W.D. Introduction to Mineralogy, 2nd ed.; Oxford University Press: New York, NY, USA, 2012; ISBN 978-0-19-982738-1. [Google Scholar]
  21. Dana, J.D. Manual of Mineralogy: After James D. Dana, 20th ed.; Klein, C., Hurlbut, C.S., Eds.; Wiley: New York, NY, USA, 1985; ISBN 978-0-471-80580-9. [Google Scholar]
  22. Pouchou, J.-L.; Pichoir, F. Quantitative Analysis of Homogeneous or Stratified Microvolumes Applying the Model “PAP.” In Electron Probe Quantitation; Heinrich, K.F.J., Newbury, D.E., Eds.; Springer: Boston, MA, USA, 1991; pp. 31–75. ISBN 978-1-4899-2619-7. [Google Scholar] [CrossRef]
  23. Anthony, J.W. (Ed.) Handbook of Mineralogy; Mineral Data Pub: Tucson, AZ, USA, 1990; ISBN 978-0-9622097-0-3. [Google Scholar]
  24. Melchiorre, C.; Dello Ioio, L.; Ntasi, G.; Birolo, L.; Trojsi, G.; Cennamo, P.; Barone Lumaga, M.R.; Fatigati, G.; Amoresano, A.; Carpentieri, A. A multi disciplinary assessment to investigate a XXII dynasty wooden coffin. Int. J. Conserv. Sci. 2020, 11, 25–38. [Google Scholar]
  25. Boccalon, E.; Rosi, F.; Vagnini, M.; Romani, A. Multitechnique approach for unveiling the technological evolution in building materials during the Roman Imperial Age: The Atrium Vestae in Rome. Eur. Phys. J. Plus 2019, 134, 528. [Google Scholar] [CrossRef]
  26. Birolo, L.; Rossi, M.; Alberico, M.; De Riso, N.; Ntasi, G.; Tomeo, A.; Vergara, A. Inorganic, organic and biochemical characterization of wall paintings from a Roman domus. In Proceedings of the 2022 IMEKO TC4 International Conference on Metrology for Archaeology and Cultural Heritage, Calabria, Italy, 19–21 October 2022; IMEKO: Rome, Italy, 2023; pp. 55–59. [Google Scholar]
  27. Zezza, U. La Petrografia Micoscopica; La Goliardica Pavese: Pavia, Italy, 1976; ISBN 978-88-7830-088-0. [Google Scholar]
  28. Peccerillo, A.; Perugini, D. Introduzione alla Petrografia Ottica; Morlacchi: Perugia, Italy, 2003; ISBN 978-88-88778-27-3. [Google Scholar]
  29. Gunasekaran, S.; Anbalagan, G.; Pandi, S. Raman and infrared spectra of carbonates of calcite structure. J. Raman Spectrosc. 2006, 37, 892–899. [Google Scholar] [CrossRef]
  30. Mahmoud, H.H.M. Investigations by Raman microscopy, ESEM and FTIR-ATR of wall paintings from Qasr el-Ghuieta temple, Kharga Oasis, Egypt. Herit. Sci. 2014, 2, 18. [Google Scholar] [CrossRef]
  31. Baraldi, P.; Baraldi, C.; Curina, R.; Tassi, L.; Zannini, P. A micro-Raman archaeometric approach to Roman wall paintings. Vib. Spectrosc. 2007, 43, 420–426. [Google Scholar] [CrossRef]
  32. Clark, R.J.; Gibbs, P.J. Non-Destructive In Situ Study of Ancient Egyptian Faience by Microscopy. J. Raman. Spectr. 1997, 28, 99–103. [Google Scholar] [CrossRef]
  33. Smith, D.K. Opal, cristobalite, and tridymite: Noncrystallinity versus crystallinity, nomenclature of the silica minerals and bibliography. Powder Diffr. 1998, 13, 2–19. [Google Scholar] [CrossRef]
  34. de Faria, D.L.A.; Venâncio Silva, S.; de Oliveira, M.T. Raman microspectroscopy of some iron oxides and oxyhydroxides. J. Raman Spectrosc. 1997, 28, 873–878. [Google Scholar] [CrossRef]
  35. Tomasini, E.P.; Halac, E.B.; Reinoso, M.; Di Liscia, E.J.; Maier, M.S. Micro-Raman spectroscopy of carbon-based black pigments. J. Raman Spectrosc. 2012, 43, 1671–1675. [Google Scholar] [CrossRef]
  36. Lalla, E.A.; Lopez-Reyes, G.; Sansano, A.; Sanz-Arranz, A.; Martínez-Frías, J.; Medina, J.; Rull-Pérez, F. Raman-IR vibrational and XRD characterization of ancient and modern mineralogy from volcanic eruption in Tenerife Island: Implication for Mars. Geosci. Front. 2016, 7, 673–681. [Google Scholar] [CrossRef]
  37. Das, S.; Hendry, M.J. Application of Raman spectroscopy to identify iron minerals commonly found in mine wastes. Chem. Geol. 2011, 290, 101–108. [Google Scholar] [CrossRef]
  38. Bedarida, F.; Flamini, F.; Pedamonte, G.M. Hematite to goethite surface weathering. Scanning Electron Microsc. 1971, 58, 7–8. [Google Scholar]
  39. Bell, I.M.; Clark, R.J.H.; Gibbs, P.J. Raman spectroscopic library of natural and synthetic pigments (pre- ≈ 1850 AD). Spectrochim. Acta Part. A Mol. Biomol. Spectrosc. 1997, 53, 2159–2179. [Google Scholar] [CrossRef]
  40. Jehlička, J.; Edwards, H.G.M.; Osterrothová, K.; Novotná, J.; Nedbalová, L.; Kopecký, J.; Němec, I.; Oren, A. Potential and limits of Raman spectroscopy for carotenoid detection in microorganisms: Implications for astrobiology. Phil. Trans. R. Soc. A. 2014, 372, 20140199. [Google Scholar] [CrossRef]
  41. Azemard, C.; Menager, M.; Vieillescazes, C. Analysis of diterpenic compounds by GC-MS/MS: Contribution to the identification of main conifer resins. Anal. Bioanal. Chem. 2016, 408, 6599–6612. [Google Scholar] [CrossRef] [PubMed]
  42. Beltran, V.; Salvadó, N.; Butí, S.; Pradell, T. Ageing of resin from Pinus species assessed by infrared spectroscopy. Anal. Bioanal. Chem. 2016, 408, 4073–4082. [Google Scholar] [CrossRef] [PubMed]
  43. Kaklamanos, G.; Theodoridis, G.; Dabalis, T. Determination of anabolic steroids in bovine urine by liquid chromatography–tandem mass spectrometry. J. Chromatogr. B 2009, 877, 2330–2336. [Google Scholar] [CrossRef] [PubMed]
  44. Zhang, H.; Yue, J.-M. Hasubanan Type Alkaloids from Stephania longa. J. Nat. Prod. 2005, 68, 1201–1207. [Google Scholar] [CrossRef] [PubMed]
  45. Ranchana, P.; Ganga, M. Investigation of Volatile Compounds from the Concrete of Jasminum auriculatum Flowers. Int. J. Curr. Microbiol. App. Sci. 2017, 6, 1525–1531. [Google Scholar] [CrossRef]
  46. Blaško, J.; Kubinec, R.; Husová, B.; Přikryl, P.; Pacáková, V.; Štulík, K.; Hradilová, J. Gas chromatography/mass spectrometry of oils and oil binders in paintings. J. Sep. Sci. 2008, 31, 1067–1073. [Google Scholar] [CrossRef]
  47. Piovesan, R.; Siddall, R.; Mazzoli, C.; Nodari, L. The Temple of Venus (Pompeii): A study of the pigments and painting techniques. J. Archaeol. Sci. 2011, 38, 2633–2643. [Google Scholar] [CrossRef]
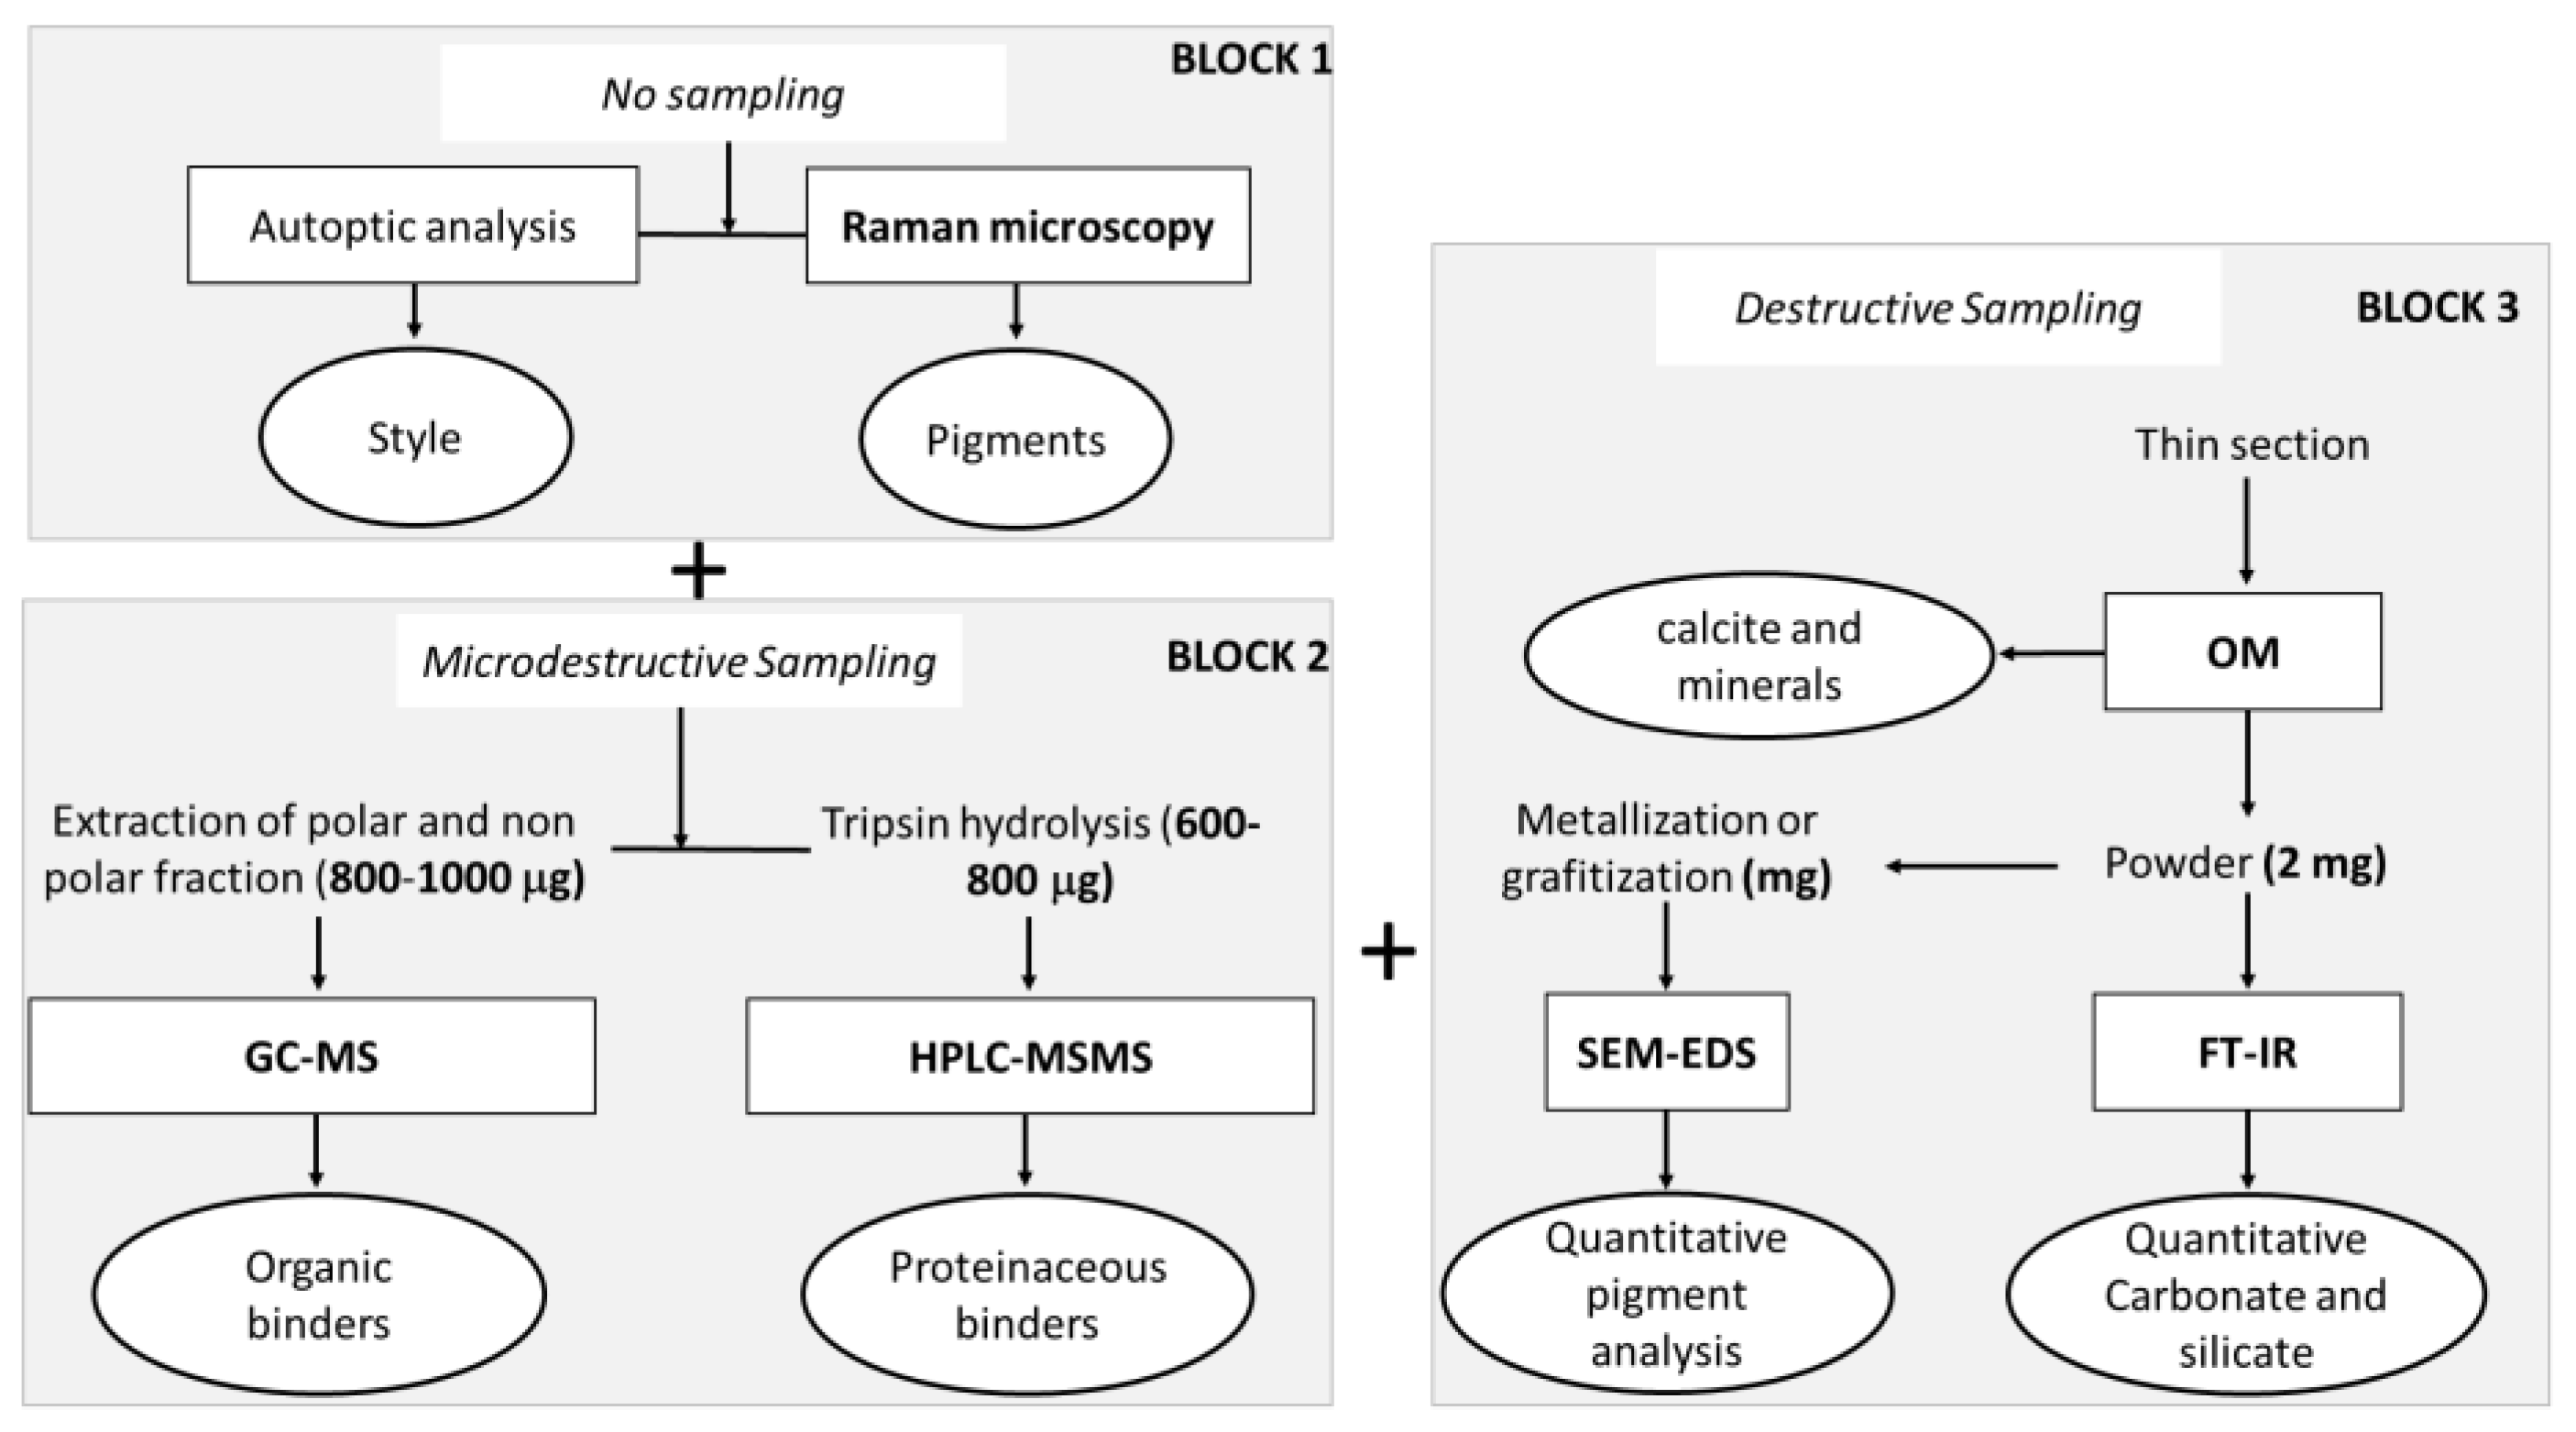
Figure 1. Sketch of the procedure adopted to distinguish the a fresco preparative technique from the a secco preparative technique: a minimal approach including non-destructive techniques (Block 1) and micro-destructive techniques (Block 2) and an extended approach also including destructive techniques (Block 3).
Heritage 07 00184 g001
Figure 2. Drone photo of the domus (a); Different colors that compose the first layer of the samples 151A (b) and 151C (c).
Heritage 07 00184 g002
Figure 3. Stereomicroscope (SM) images of selected samples. (a) Bright red color in sample 151; (b) reddish/brown and yellow color in sample 151C; (c) green–blue crystals in the 151A sample (green pictorial layer); (d) white and black color in the 151C sample.
Heritage 07 00184 g003
Figure 4. Petrographic microscope (PM) images of thin sections in transmitted polarized light (//) of the selected samples. The colored pictorial layer is bordered downward by a red line. (a) The bright red color in sample 151B is composed of cinnabar crystals; (b) thin section of pictorial whitish and reddish level in 151C; altered calcium phosphate layer (between red dashed and solid lines) covers a level with iron oxides and small carbonate fragments (delimited by the red line); (c) brown/yellow pictorial layer composed of Fe and Pb hydroxide microcrystals in the 151C sample; (d) green pictorial layer in the 151A sample, with glauconite (green), cuprorivaite (turquoise), and oxides (black) crystals.
Heritage 07 00184 g004
Figure 5. Set of representative Raman spectra of pigments identified in samples from the Roman domus. C (carbon); Ca (calcite); E.B (Egyptian blue); G (goethite); G.E (green earths); He (hematite); HgS (cinnabar); Y.M. (Fe(OH)3 present in limonene). Laser line 514 nm and laser power at the sample 2 mW.
Heritage 07 00184 g005
Table 1. Chemical composition and mineralogical amounts of the red and green pictorial layer, as derived from EDS and PM data.
Pictorial Layer ColorsSampleMineral AmountsMineral Composition
TiO2Fe2O3PbOMnOHgSH2OTot
Bright Red15190% Cin----86.40 (65)12.62 (70)-99.02
10% Hem0.49 (32)97.93 (78)-0.27 (51)---98.69
151C90% Cin----84.19 (52)14.09 (88)-98.28
10% Hem1.08 (74)98.56 (29)-0.25 (62)---99.89
Ochre yellow1515% Pb rich-Gth-58.48 (56)33.66 (62)---7.94100.00
95% Pb-Gth-87.19 (2.1)3.41 (2.5)---9.40100.00
151C100% Pb-Gth-86.35 (55)3.38 (12)0.23 (10)--10.03100.00
Reddish/brown15120% Hem1.12 (10)96.93 (46)-0.80 (12)-- 98.85
80% Gth0.29 (6)88.97 (24)-0.15 (12)--10.59100.00
151C10% Hem0.81 (10)98.33 (56)-0.52 (16)-- 99.66
90% Gth0.38 (22)89.91 (70)- --9.72100.00
151B10% Hem0.51 (21)97.83 (77)0.45 (10)--- 98.79
90% Gth2.78 (10)86.94 (86)1.46 (30)---8.82100.00
Pictorial Layer ColorSampleMineral AmountsMineral Composition
SiO2TiO2Al2O3Fe2O3FeOMnOMgOCaOCuOK2OH2OTot
Green151Glt 47%46.94 (92) 5.87 (21) 23.48 (30) 3.45 (16)0.63 (32) 6.90 (20)12.54100.00
Cuv 35%63.67 (70) 15.04 (35)21.30 (21) 100.01
Gth 3% 0.73 (45) 87.67 (50) 0.34 (35) 1.10 (12) 10.16100.00
Hem 4% 100.24 (15) 100.24
Uspl 2% 19.82 (25)2.75 (90)9.56 (51)65.44 (81)0.97 (12) 1.14 (54) 99.70
Key: Glt = glauconite; Cuv = cuprorivaite; Gth = goethite; Hem = hematite; Uspl = ulvospinel; Cin = cinabar.
Table 2. (a) Chemical profile of the polar fraction by GC-MS analysis after sugar analysis and chemical derivatization with TMS. Identification was performed by comparison of the retention time and mass spectra to those of standards in the instrument manufacture database NIST MS Search 2.0. (b) FAMEs profile obtained by GC-MS analysis of the lipidic fractions. Identification was performed by comparison of the retention time and mass spectra to those of standards in the instrument manufacture database NIST MS Search 2.0.
(a)
SampleRT (min)Name
151A6132Cholest-5-en-19-al,3ß-hydroxy-,cyclic ethylene mercaptal, acetate
17.7710,18-bisnorabieta-8,11,13-triene
22.12Diglycidyl bisphenol A
23,225Hexestrol, di-TMS
151B6383Cholest-5-en-19-al,3ß-hydroxy-,cyclic ethylene mercaptal, acetate
10,434Dianhydro-2-deoxy-ß-d-ribo-hexopyranose
13,5632-Methyl-7-hydroxy-8-allyl-isoflavone
14,0973-Heptadecenal
21,473Oxalic acid, hexadecyl isohexylester
17.7710,18-bisnorabieta-8,11,13-triene
22.12Diglycidyl bisphenol A
151C17.04Stephaboline
17.7710,18-bisnorabieta-8,11,13-triene
22.12Diglycidyl bisphenol A
18717.7710,18-bisnorabieta-8,11,13-triene
22.12Diglycidyl bisphenol A
21,2841-Dodecanol, 3,7,11-trimethyl-
21,3567-Hexadecenal, (Z)-
21,452Octadecane, 1-(ethenyloxy)-
21,5551-Dodecanol, 3,7,11-trimethyl-
21,8087-Hexadecenal, (Z)-
22,2531-Dodecanol, 3,7,11-trimethyl-
(b)
RT (min)NameC:N *151A151B151C187
12.88Myristic acidC14:01.60%1.93% 9.25%
14.71Pentadecanoic acidC15:0 3.44% 3.45%
16.25Palmitic acidC16:035.73%28.17%26.25%45.52%
17.52Margaric acidC17:04.57%4.63%
18.3616-octadecenoic acidC18:143.30%49.80%10.90%
18.63Stearic acidC18:014.80%12.03%62.85%41.78%
Palmitic/StearicC16:0/C18:02.412.340.421.09
* (C:N) indicates the number of carbon atoms (C) and double bonds (N) in the fatty acid side chains.
Table 3. (a) Identification of collagen in the sample 151A, MS/MS raw data were searched by Mascot MS/MS Ion search software using the COLLE database and considering deamidation on Gln and Asn, oxidation on Met, and the hydroxylation of proline and lysine as variable modifications. Only the identification of proteins with at least two peptides with individual ion scores above the significance threshold (>20) was considered as significative. (b) Identification of collagen in the sample 151B, MS/MS raw data were searched by Mascot MS/MS Ion search software using the COLLE database and considering deamidation on Gln and Asn, oxidation on Met, and hydroxylation of proline and lysine as variable modifications. Only the identification of proteins with at least two peptides with individual ion scores above the significance threshold (>20) was considered as significative.
(a)
Protein Name
(Uniprot Entry)
Sequence Coverage %m/zPeptide
Collagen alpha-1(I) chain (P02453)7314,677R,GLPGER,G
322,673R,GLPGER,G + Hydroxylation (P)
392,223R,GAAGLPGPK,G + Hydroxylation (P)
426,218R,GFSGLDGAK,G
449,756R,GVVGLPGQR,G + Hydroxylation (P)
450,251R,GVVGLPGQR,G + Deamidated (NQ); Hydroxylation (P)
553,286R,GVQGPPGPAGPR,G + Hydroxylation (P)
553,779R,GVQGPPGPAGPR,G + Deamidated (NQ); Hydroxylation (P)
589,776R,GQAGVMGFPGPK,G + Oxidation (M); Deamidated (NQ); Hydroxylation (K)
781,888K,DGLNGLPGPIGPPGPR,G + Deamidated (NQ); 3 Hydroxylation (P)
941,451K,GDTGAKGEPGPAGVQGPPGPAGEEGKRGAR,G + Deamidated (NQ); 4 Hydroxylation (P)
Collagen alpha-2(I) chain (P02465)5%314,677R,GLPGER,G
322,673R,GLPGER,G + Hydroxylation (P)
379,696R,GLPGADGR,A + Hydroxylation (P)
393,220R,GATGPAGVR,G
420,739R,GVVGPQGAR,G
421,234R,GVVGPQGAR,G + Deamidated (NQ)
434,735R,VGAPGPAGAR,G + Hydroxylation (P)
459,726R,AGVMGPAGSR,G + Oxidation (M)
596,838R,IGQPGAVGPAGIR,G
634,339R,GIPGPVGAAGATGAR,G + Hydroxylation (P)
(b)
Protein Name
(Uniprot Entry)
Sequence Coverage %m/zPeptide
Collagen alpha-1(I) chain (P02453)7%449,760R,GVVGLPGQR,G + Hydroxylation (P)
450,254R,GVVGLPGQR,G + Deamidated (NQ); Hydroxylation (P)
544,777R,GFPGADGVAGPK,G + Hydroxylation (P)
553,788R,GVQGPPGPAGPR,G + Deamidated (NQ); Hydroxylation (P)
589,783R,GQAGVMGFPGPK,G + Oxidation (M); Deamidated (NQ); Hydroxylation (K)
629,800K,GLTGSPGSPGPDGK,T + 2 Hydroxylation (P)
730,351R,GSAGPPGATGFPGAAGR,V + 2 Hydroxylation (P)
781,900K,DGLNGLPGPIGPPGPR,G + Deamidated (NQ); 3 Hydroxylation (P)
793,884K,GANGAPGIAGAPGFPGAR,G + Deamidated (NQ); 3 Hydroxylation (P)
Collagen alpha-2(I) chain (P02465)4%367,185K,GPSGDPGKAGEK,G
596,845R,IGQPGAVGPAGIR,G
597,334R,IGQPGAVGPAGIR,G + Deamidated (NQ)
601,296R,GEPGNIGFPGPK,G + Hydroxylation (P); Hydroxylation (K)
604,844R,IGQPGAVGPAGIR,G + Hydroxylation (P)
634,342R,GIPGPVGAAGATGAR,G + Hydroxylation (P)
714,369R,GIPGEFGLPGPAGAR,G + 2 Hydroxylation (P)
Table 4. Results obtained by applying the adopted approach sketched in Figure 1 reporting the non-invasive technique (Raman micro-spectroscopy), micro-destructive techniques (GC-MS and LC-MS), and destructive technique (SEM-EDS).
SampleColorRaman Micro-SpectroscopySEM-EDSGC-MSLC-MS
151AWhiteCalciteCalcite//
YellowIron HydroxideLimonite
BlueEgyptian BlueCuprorivaitePinaceous resin +
Animal fat
Collagen
GreenGreen EarthsGlauconite
RedCinnabarCinnabar
151BRedHemtite + Goethite + CarbonHematite + GoethitePinaceous resin +
Animal fat
Collagen
151CRedHemtite + GoethiteHematite + GoethitePinaceous resin + Vegetable fatty acids/
187BlueTraces of carotenoids/Pinaceous resin + Vegetable fatty acids/
Green
63BlueTraces of carotenoids///
Green
139RedHemtite + Goethite //
146BlueEgyptian Blue///
Disclaimer/Publisher’s Note: The statements, opinions and data contained in all publications are solely those of the individual author(s) and contributor(s) and not of MDPI and/or the editor(s). MDPI and/or the editor(s) disclaim responsibility for any injury to people or property resulting from any ideas, methods, instructions or products referred to in the content.