Abstract
The degradation of cadmium yellow in paintings is influenced by various factors, primarily environmental conditions and light exposure. Applying a thin protective layer of linseed oil on the surface could help mitigate these processes. Linseed oil, being a natural material, acts as a barrier against harmful atmospheric agents like moisture and oxygen, which contribute to the degradation of pigments including cadmium yellow. Additionally, linseed oil reduces direct light exposure, thereby lowering the risk of fading and color alteration. In this study, we explored the degradation of cadmium pigments mixed with oil and applied on canvas. We elucidated how the use of a binder prevents the direct oxidation of the pigment, inducing artificial degradation by irradiating samples with UVA (365 nm) and UVC (250 nm) sources. By employing various spectroscopic techniques such as three-dimensional fluorescence mapping (PLE) and Raman, along with colorimetric analysis, we gained a comprehensive understanding of the degradation process, particularly when linseed oil serves as a protective layer.
1. Introduction
The degradation of an artistic work, particularly in the case of a painting, involves each of its elements in a distinct yet significant manner. A common objective within the realm of cultural heritage conservation is to ascertain the most suitable method to decelerate the degradation process.
Cadmium yellow pigment is typically a synthetic cadmium sulfide [1,2], with its synthesis dating back to the 19th century. Gay-Lussac outlined its synthesis in 1818 [3], although the commercialization of the pigments did not occur until the mid-1840s. Cadmium sulfide (CdS) exhibits a golden yellow hue. In nature, it can be found in the mineral greenockite [4,5], which manifests as impurities in zinc ores [6]. To economically produce different shades of this color during the 20th century, its synthesis began to incorporate zinc to lighten the color and selenium (cadmium sulfoselenide [7]) to intensify the red hue, enabling a spectrum of colors ranging from pale yellow to red, collectively known as cadmium pigments. In 1920, a new recipe was developed, also involving the use of barium sulfate (BaSO4) to achieve a lighter shade.
Cadmium yellow is renowned for its extensive use by Impressionist artists such as Van Gogh, Matisse, Munch, and Ensor. Despite being synthetic and possessing good coverage properties, cadmium yellow undergoes a rapid degradation process over time which has been extensively documented in the literature, encompassing surface alterations such as chalking, lightening, flaking, and spalling [2,8,9,10,11].
The degradation of cadmium yellow pigment can be instigated by various factors, including exposure to light, moisture, and atmospheric pollution. Its sensitivity to sunlight can lead to color loss and the surface deterioration of the painting over time. Additionally, internal chemical reactions may occur between the pigment itself and the components of the painting’s binder, hastening the degradation process. Moisture and atmospheric pollution can also contribute to the formation of corrosive substances that damage the pigment over time [12,13,14].
It is well known that UV components and blue light from artificial museum white LED lighting is itself a degrading agent for paintings, especially when their paint film consists of photosensitive pigments, as in the case of cadmium yellow [15,16,17,18].
An additional UV exposure with high energy could derive from biofilm removal procedures, used recently in wall paintings made by organic binders, which inevitably subjected the organic components to color changes [19,20].
Special precautions are necessary for the conservation of artworks containing cadmium yellow pigment. These may involve monitoring environmental conditions such as temperature, humidity, and lighting levels to minimize deterioration. Furthermore, restoration techniques and conservation treatments may be employed to protect the painting and preserve its beauty over time. Ongoing research in the field of cultural heritage conservation is essential for developing increasingly effective methods to safeguard valuable artworks for future generations.
The degradation process primarily involves the formation of whitish compounds, as documented in [9], where the degraded crust of the paints reveals the presence of cadmium carbonate, sulfate, and oxalate. Van der Snickt et al. [2] elucidated the formation of cadmium sulfate on the paint surface upon exposure to environmental conditions through the oxidation of CdS pigment.
In the study by Van Der Snickt et al. [10], the authors proposed cadmium carbonate as the ultimate photo-degradation product of CdS.
Various accelerated degradation studies on CdS pigment [1,21,22], along with computational simulations [23,24,25], have been conducted previously to gain insights into the intricacies of its degradation process.
Our research group previously studied the degradation of pure cadmium yellow pigment both due to temperature effects and UV radiation.
This phenomenon occurs when pigments undergo chemical or physical changes resulting in a loss of color intensity. Temperature can accelerate this process by increasing the rate of chemical reactions within the pigment molecules, leading to structural alterations or breakdown. UV irradiation, on the other hand, can cause photochemical reactions in the pigment molecules, resulting in degradation or discoloration. Understanding these mechanisms is crucial for preserving the color stability and longevity of pigmented materials, particularly in applications exposed to environmental factors such as sunlight or heat [14].
After exposure, NIR–Raman spectra show the formation of a new strong peak at 990 cm−1 related to sulfate compounds, which is confirmed also by the presence of two additional weak bands at around 1060 and 1120 cm−1 [26]. Additionally, the reflectance revealed a color change induced in the pigments compatible with the formation of sulfate patinas, as already demonstrated in literature [2,9].
Following the previous work, the objective of this study is to investigate and comprehend the degradation process when the pigment is enveloped with a layer of linseed oil. Through the utilization of optical and analytical techniques, we aim to examine the formation of potential degradation compounds or physicochemical alterations on the surface of the paint.
In this investigation, our focus will be on two variants of cadmium powder pigments, specifically those exhibiting yellow and orange hues, for which we have conducted a comprehensive characterization in a preliminary study. These variants are chosen as they serve as representative samples of cadmium pigments [14].
This study employs a multi-technique approach, encompassing 3D photoluminescence excitation–emission (PLE), Raman spectroscopy, and reflectance spectroscopy. These methods are complemented by colorimetric analyses [27,28,29,30,31].
By combining the results obtained from these methodologies, our objective is to gain a comprehensive understanding of the role played by each component and to delineate the distinct stages of degradation after UV light exposure (250 nm and 365 nm). Subsequently, these insights will be applied to canvas paintings to simulate the degradation process observed in authentic artworks and to discriminate which elements create the “fading/chalking” phenomena, which further degrades with whitish compounds or dark crusts.
2. Materials and Methods
2.1. Mock-Ups Samples
2.1.1. Pigments
Cd pigments used for accelerated degradation studies were bought from Kremer pigments. We used the pigment numbers 21040 (white yellow) and 21080 (orange). The artificially aged samples are labelled with the initial C or S to indicate yellow or orange followed by 250 nm and 365 nm to indicate the wavelength used for the degradation and the time of exposure in hours.
2.1.2. Sole Binder and Mixture Binder with Pigment
The degradation process of the binder (linseed oil acquired by Zecchi Company, Florence, Italy) involved the deposition of oil on a glass surface and exposure to UV radiation (250 nm and 365 nm) The sample was named with the initial “O” followed by 250 nm and 365 nm to indicate the wavelength used for the degradation and the time of exposure in hours.
The pigment–linseed oil mix in a mass ratio of 0.5:1 was deposited onto a glass surface exposed to the same degradation process as the pure binder. The samples were named C-O and S-O followed by 250 nm and 365 nm to indicate the wavelength used for the degradation and the time of exposure in hours.
2.1.3. Oil on Canvas Samples
We also realized mock-ups of oil on canvas. The canvas samples were of two typologies: painted only with oil and a composition of pigment plus oil in a 0.5:1 mass ratio.
The degradation process was realized via UV light exposure (250 nm and 365 nm), and reflectance spectra were collected at different intervals of time, while Raman spectra were collected at the start- and endpoint of each degradation process. These samples are labelled O-canvas, C-canvas, and S-canvas followed also in this case by the time of exposure.
2.1.4. Reflectance Measurements
Reflectance measurements were performed by means of a laser-driven Xenon lamp (EQ-99X) with wide emission spectrum from 200 to 2000 nm and an average optical power of 1 mW/nm. The source was coupled with an optical fiber, an integrating sphere, and an Advantes Sensiline Avaspec-ULS-TEC Spectrometer (spectral range 250–900 nm). The measurements were taken in 10° reflection mode (including the specular component) using a BaSO4 plate as a reference. Each measurement for every sample and time interval was conducted three times. The results were related to the D65 illuminant and the CIELab standard colorimetric observer. The CIE coordinates were obtained by using the ColorConvert v7.77 software. The color change was characterized according to the change in brightness ∆L, red–green difference ∆a, yellow–blue difference ∆b, and total calculation of color difference ∆E using the following formula: .
2.1.5. Raman Measurements
Near-infrared micro-Raman scattering measurements were carried out in back-scattering geometry with the 1064 nm line of a Nd–YAG laser. Measurements were performed with a compact spectrometer B&WTEK (Newark, NJ, USA) i-Raman Ex integrated system with a spectral resolution of 8 cm−1. For each experimental setup, all the spectra were collected with an acquisition time of about 60 s (five replicas) and a power excitation between 5 and 10 mW concentrated in a spot of 0.3 mm2 on the surface through a Raman Video MicroSampling System (Nikon Eclipse for high-resolution and BAC151B in the other case) equipped with a 20× Olympus objective to select the area on the samples. Each measurement area represents a sampling surface of about 1 cm2.
2.1.6. Three-Dimensional Fluorescence Mapping
The three-dimensional fluorescence mapping of samples was performed using a spectrofluorometer, a Jasco FP-8050, with a 450 W Xenon lamp as the excitation source. The maps were collected with an excitation range of 200–600 nm and an emission range of 250–850 nm with a 5 nm spectral bandwidth for excitation and emission.
2.1.7. Steady-State Absorption Measurements
Absorption measurements were obtained by using a double beam a UV-Vis-NIR Agilent Technologies Cary 5000 Spectrometer. The samples were deposited on a slide and the measurements were performed in the UV-VisVIS region (250–500 nm) by using deuterium and tungsten lamps and a reference beam in air. Spectral resolution was set to 2 nm. For differential absorption, a pristine slide was used as a reference to highlight the differences.
3. Results and Discussion
Carefully prepared mock-ups were created to represent three distinct sample sets, each consisting of oil and a mixture of oil and pigments. These mock-ups underwent an accelerated degradation process induced by exposure to UV lamp irradiation (250 and 365 nm). In the following sections, we present a comprehensive analysis of the results obtained for each sample type, elucidating the effects of UV-induced degradation on their composition and characteristics.
3.1. Pigment Characterization
The pure pigments utilized in creating the mock-ups underwent comprehensive characterization through X-ray diffraction (XRD), Raman spectroscopy, and reflectivity analysis.
XRD analyses of the yellow pigment (C) revealed the presence of the hexagonal phase of Cd1−xZnxS (with x = 0.19), alongside approximately 7% barium sulfate (Figure 1a). In contrast, the orange pigment (S) consisted of hexagonal CdS1−xSex and CdS phases (Figure 1b) [14].
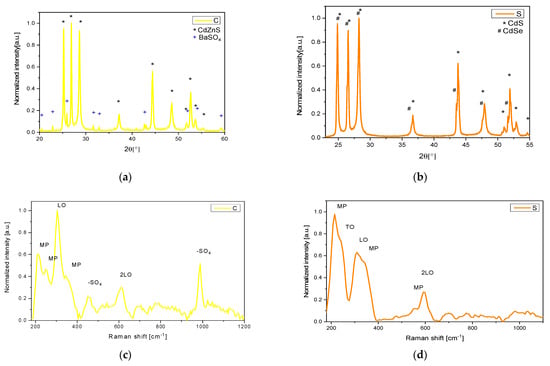
Figure 1.
XRD patterns of C (a) and S (b) samples. NIR Raman spectra of C (c) and S (d) samples.
The respective Raman spectra obtained for both samples with a 1064 nm excitation wavelength are depicted in Figure 1c,d. These spectra are characterized by typical peaks around 310 and 600 cm−1, associated with the LO and 2LO phonon modes, respectively, as well as a peak at 230 cm−1 attributable to the TO mode. Additionally, peaks at 215, 250, 350, and 560 cm−1 correspond to multi-phonon (MP) modes [32,33,34].
Furthermore, in the pigment C, two additional peaks are observed at 455 cm−1 (doubly degenerate ν2-symmetric bending of the -SO42− group) and at 990 cm−1 (ν1-symmetric stretching of the SO42− group) [35,36]. These peaks are associated with barium sulfate, which is utilized as an additive compound according to the composition provided by the producer (Kremer Pigments).
3.2. Binder Degradation
To study how linseed oil acts as protective layer for the pigment, the degradation of the oil by itself was studied and the steps of the process were investigated via PLE and Raman spectroscopy complemented by reflectance measurements.
As previously documented in the literature, exposure to light induces changes in the Raman spectrum of linseed oil. Specifically, within the range of 700–1800 cm−1, there is a recognized reduction in the intensities of the 1264 (CH=CH rocking), 1022, 971 (CH=CH wagging), and 912 cm−1 bands, alongside the disappearance of the 940 cm−1 peak associated with ω (CH) in CH=CH wagging [37]. We conducted a comprehensive examination of this phenomenon by subjecting the oil to aging under UV light exposure at wavelengths of 250 and 365 nm. The outcomes are depicted in Figure 2a,b. In the aged linseed oil, the Raman spectrum exhibited a broadening of the 866 cm−1 band, along with a significant decrease in the intensities of the 940, 1264, and 1655 (C=C isolated cis) bands. Conversely, there was an increase in the intensities of the 1081, 1022, 1302, and 1439 (δCH2) bands, as well as the 1655 cm−1 band.
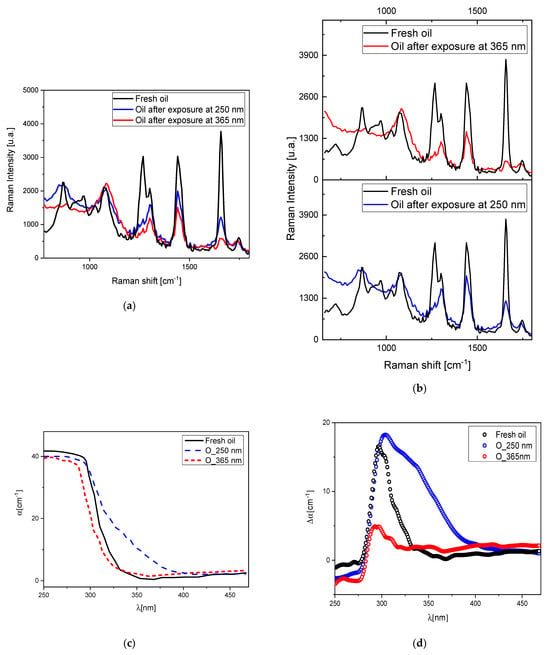
Figure 2.
(a) Raman spectra of fresh oil and irradiated oil samples after exposure to 250 and 365 nm wavelengths; (b) Raman spectra of fresh oil and irradiated oil after 365 nm light exposure and Raman spectra of fresh oil and irradiated oil after 250 nm light exposure; (c) absorption spectra of the different degradation process of linseed oil; (d) the differential absorbance .
The 1743 cm−1 (C=O) band showed a soft increase in its intensity and a slight shift toward lower cm−1. An evident inversion of intensity between the 1264 and 1302 cm−1 bands is observed.
After 365 nm light exposure the absorption spectrum appears similar to the one of the fresh oil except for a slight blue shift (Figure 2c), while the exposure at 250 nm irradiation wavelength showed the formation of a shoulder around 340 nm in the absorption spectrum, with the formation of a very broad band leading to a yellowish color (Figure 2c,d).
Since 250 nm light exposure produced irradiation effects (yellowing) on the oil whilst 365 nm did not cause any change in color, to understand the total process degradation, we investigated the process by performing three-dimensional fluorescence mapping (Figure 3a).
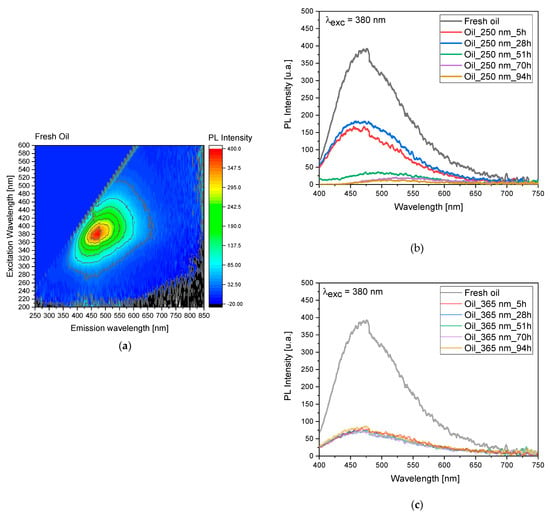
Figure 3.
(a) Three-dimensional fluorescence mapping of pure linseed oil obtained using an excitation range of 200–600 nm and an emission range of 250–850 nm (see also Figure S2). The color gradient within the map corresponds to the intensity of the emitted fluorescence. (b) Fluorescence as a function of the irradiation time at 250 nm. (c) Fluorescence as a function of the irradiation time at 365 nm.
Following exposure to 250 nm light, we observed a significant decrease in fluorescence intensity and a slight blue shift within the initial 28 h of irradiation (see Supplementary Information Figure S2). Subsequently, there was a pronounced decrease in intensity along with a red shift observed at 51, 70, and 94 h of irradiation, as depicted in Figure 3b. Another significant observation arose from these measurements when comparing the emission intensities at 5 and 28 h of irradiation. Interestingly, the intensity at 28 h was slightly higher, suggesting that the degradation process takes place in distinct layers within the linseed oil sample.
For the 365 nm irradiation (Figure 3c and Figure S2), we noted a distinct behavior in the degradation process. Specifically, the process was characterized by a sudden decrease in emission intensity and a blue shift, without any observed red shift even after prolonged exposure. Additionally, similar to the observations with 250 nm irradiation, we found evidence suggesting the involvement of multiple layers in the degradation process, highlighted by small variations in signal intensity over the studied time interval and further indicating the complexity of the degradation mechanism within the linseed oil sample.
After studying the degradation of pigments and oil individually, we now turn our attention to investigating the interaction between these two materials. This combined study allows us to understand how the degradation processes of both pigments and oil may influence each other when they are present together. By examining their joint behavior, we can gain insights into potential synergistic effects, as well as any differences or modifications in degradation pathways compared to when the materials are studied in isolation. This holistic approach provides a comprehensive understanding of the overall stability and durability of pigmented materials, which is crucial for various applications ranging from art conservation to industrial coatings.
3.3. Degradation of Pigments Mixed with Linseed Oil
After individually studying the effects of exposure to ultraviolet light on pigments [14] and linseed oil, we proceed to investigate the combination of these two substances to highlight the role of linseed oil as a protective layer for the pigment. In this case, we conducted a study using a multi-technical approach focused on PLE, Raman spectroscopy, and reflectance measurements.
The purpose of this study is to understand how the presence of linseed oil affects the interaction between pigments and ultraviolet light. By employing multiple techniques, we aim to gain a comprehensive understanding of the chemical and physical changes occurring at the interface of these materials.
Based on the study, variations related to C-O and S-O samples were monitored through 3D fluorescence maps before and after irradiation at 250 and 365 nm (Figure 4a,c,e,g, Figures S1 and S2) and studied at 380 nm over time (Figure 4b,d,f,h).
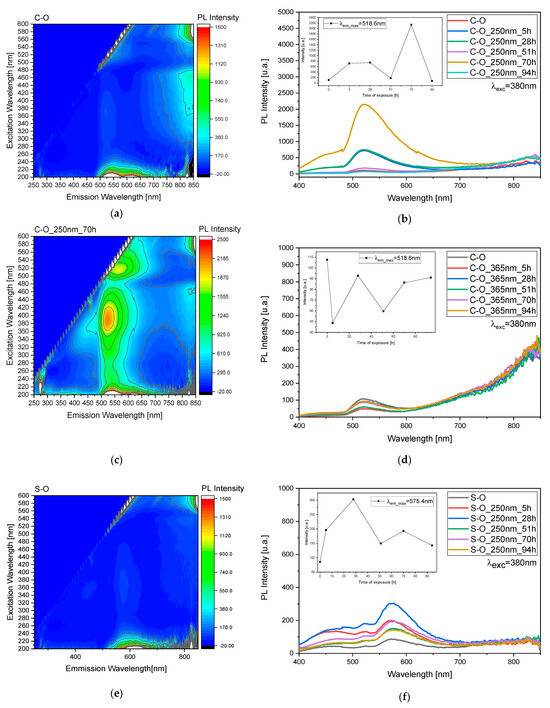
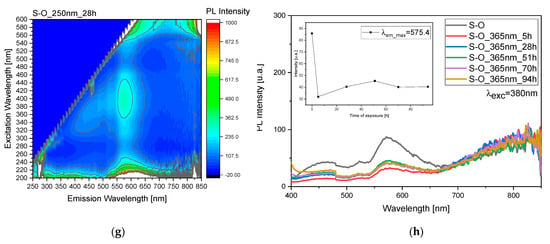
Figure 4.
(a,c,e,g) Three-dimensional fluorescence mapping of mixed pigment and oil before and during the irradiation process (Figure S2), obtained using an excitation range of 200–600 nm and an emission range of 250–850 nm. The color gradient within the map corresponds to the intensity of the emitted fluorescence. (b,d,f,h) Fluorescence as a function of the irradiation time to study behavior under both 250 and 365 nm light exposure (Figure S2).
Selecting an excitation wavelength of 380 nm for fluorescence monitoring is based on its suitability to effectively excite the oil molecules. By utilizing this wavelength, we aim to discern the influence of the oil layer on the behavior of the pigment. This choice enables us to investigate the protective mechanisms that the oil may exhibit toward the pigment under study. Furthermore, by observing the fluorescence response at this specific wavelength, we can closely examine the alterations in pigment behavior when the superficial oil layer undergoes degradation processes. Thus, this approach allows for a comprehensive analysis of the interplay between the oil and the pigment, shedding light on their dynamic interactions and potential protective effects.
Both during exposure to 250 nm (Figure 4b) and 365 nm (Figure 4d), a pattern of peaks and troughs is observed, representing the emergence of the pigment and the degradation of the oil, respectively, indicating the involvement of multiple layers in the process. Specifically, for the exposure to 250 nm (Figure 4b), there is an absolute maximum at 70 h of exposure, while for the exposure to 365 nm (Figure 4d), we observe a maximum at 28 h and then at 70 and 94 h. These trends are highlighted by the scatter plot inset in graphs depicted in Figure 4b,d. The same reasoning was applied to the S sample, but in this case, the observed variations are more evident after treatment at 250 nm rather than at 365 nm (Figure 4f,h). In this case, for the exposure to 250 nm, there is a maximum at 28 h, while for the irradiation at 365 nm we observed a maximum at 51 h.
The observable difference in degradation between sample C and sample S can be attributed to the varying capacities of these samples to absorb UV light. Sample S, characterized by its lower UV light absorption, is less effective in shielding against the detrimental effects of UV radiation. Consequently, the pigment in sample C is more susceptible to degradation when exposed to UV light, leading to comparatively lesser degradation in sample S. This disparity underscores the importance of UV absorption capacity in determining the degree of protection afforded by the oil layer against pigment degradation. Furthermore, this observation highlights the significance of understanding the inherent properties of the samples under study in elucidating their responses to environmental factors such as UV radiation.
Upon scrutinizing the 3D fluorescence maps, an intriguing observation emerges: there is a notable rise in intensity within the spectral band centered around 800 nm when the excitation wavelength hovers around 510 nm. This phenomenon is indicative of significant changes occurring within the sample. Specifically, it is linked to the partial degradation of the pigment as well as the formation of cadmium vacancies within the CdS crystal lattice [14].
The escalation in intensity at this specific wavelength range serves as a spectral signature of the ongoing processes within the sample. The partial degradation of the pigment signifies alterations in its molecular structure or composition, likely due to environmental factors or chemical interactions.
This multifaceted insight gained from the fluorescence maps not only sheds light on the evolving nature of the sample under investigation but also underscores the versatility and sensitivity of fluorescence spectroscopy as a powerful analytical tool for probing molecular and nanoscale phenomena.
To confirm the observed results and validate the 3D fluorescence technique for monitoring pigment degradation, Raman measurements were conducted on the samples at the same time intervals (Figure 5a,c,e,g). Since Raman spectroscopy is a point analysis technique, small variations in the local environment of the measured points can result in significant differences in the observed spectra. For each time interval, a set of three measurements was taken at different points, and the average was calculated. The observed dissimilarities in the variation in the most representative peaks in the Raman spectrum related to the oil, pigment, and sulfates were analyzed after normalization to the peak at 1442 cm−1. This peak corresponds to the δCH2 bands of the oil and is typically the most intense peak that is stable and less prone to fluctuations in the oil’s Raman spectrum. Furthermore, the δCH2 bands are characteristic of the organic constituents present in the oil, reflecting its molecular structure and composition. Normalizing to this peak allows us to focus on changes in other spectral features, such as those related to pigment (2LO at 605 cm−1) or sulfate formations (988 cm−1).
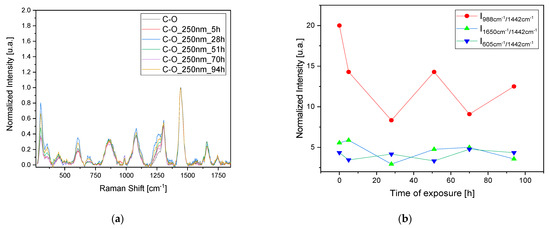
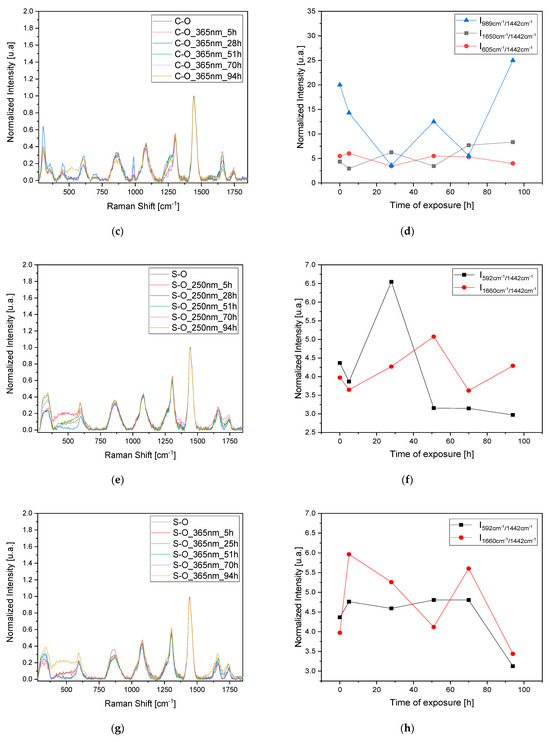
Figure 5.
Raman study of the degradation of the mixed pigment and oil over time with UV (250 and 365 nm) irradiation. (a,c) refers to the C-O sample and (e,g) refers to S-O sample. Degradation has been studied by normalizing the data to the peak at 1442 cm−1 and following the variation in the most representative peaks in the Raman spectra related to the oil, the pigment, and the formation of sulfates (b,d,f,h).
Regarding the C-O sample, the trends in the bands at 988 cm−1 related to sulfate formation and at 605 cm−1 related to the pigment’s 2LO were studied. Again, we observe a pattern consisting of peaks and troughs indicating a stratigraphic degradation. When the oil layer is degraded (trough 1650 cm−1 band), there is also an increase in the band related to sulfate formation, indicating the degradation of the pigment itself (Figure 5b,d). Using this technique for the S-O sample also highlights the degradation of an oil layer after irradiation at 250 nm after 28 h, with minor effects on the sample irradiated at 365 nm. In this case, no sulfite formation is observed, probably due to the need for prolonged exposure to initiate the degradation of both the pigment layer and the oil layer (Figure 5f,h).
3.4. Degradation of Pigments Spread on a Canvas
To simulate a real application, we prepared and analyzed the complex mock-ups made of only linseed oil spread on a canvas as well as both pigments with linseed oil spread on the same canvas. With the intention of determining the real effect of color change, a detailed colorimetric analysis was performed, and from the reflectance spectra, the related CIE Lab coordinates were calculated.
The large chromatic changes induced in the first mock-up sample are reported in Table 1, whilst a summary for all the mock-ups is proposed in Figure 5a where a CIE diagram shows the significative color variation.

Table 1.
Chromatic coordinates of oil on canvas exposed to different UVC time exposure.
It is worth noting how the L parameter, representing lightness, tends to fluctuate, suggesting the involvement of a multilayer degradation process [38]. Additionally, the value of the total color variation (ΔE) keeps increasing with exposure time; in fact, after 5–7 days of 250 nm irradiation, the oil deposited on the canvas showed a visible yellowish hue, with the degradation increasing by increasing the days of exposure. The trend is confirmed by the naked-eye inspection of the sample (Figure 6b) and by reflectance spectra (Figure 6c).
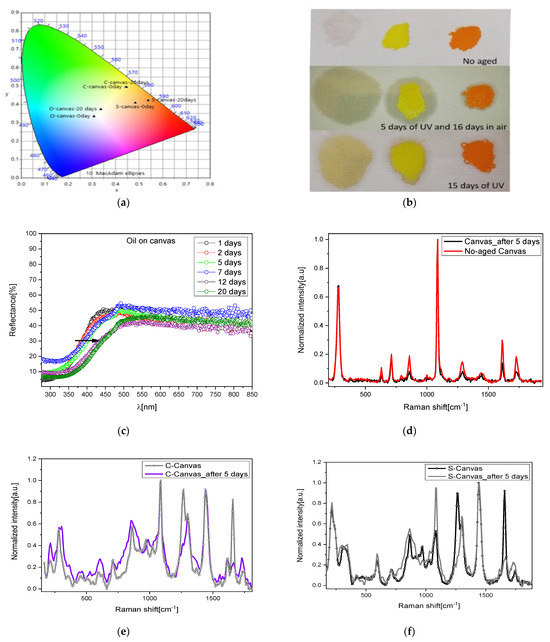
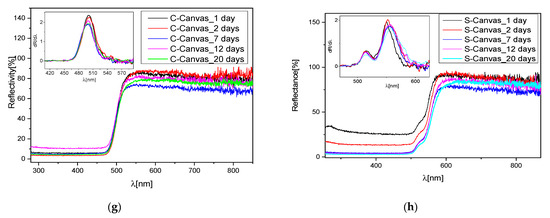
Figure 6.
(a) CIE coordinates of the mock-ups before and after UV exposure; (b) pictures of these mock-ups; (c) reflectance spectra of the oil at different days of UV exposure; (d) Raman spectra of raw and irradiated canvas; (e) Raman spectra of yellow pigment spread on the canvas at 0 and 5 days of exposure; (f) Raman spectra of orange pigment spread on the canvas at 0 and 5 days of exposure; (g) reflectance spectra of irradiated C sample on canvas and relative first derivative; (h) reflectance spectra of irradiated S sample on canvas and relative first derivative.
NIR–Raman spectra of these mock-ups were collected after 5 days of UV lamp exposure in order to identify structural modification caused by the exposure. The degradation of the mock-ups is visible in Figure 6d: the canvas and the oil (as described before) showed alteration in the intensity of some bands, but no additive compound was detected.
In addition, after a further 16 days of air exposure, Raman spectra on the same mock-ups did not evidence any degradation related to the formation of sulfates in both pigments (Figure 6e,f). We then performed a longer UV irradiation (15 days) and collected the Raman spectra (not reported for sake of clarity). Even in these samples, no additive sulfate compounds were detected. The reported results seem to suggest that the oil acts as a protective film avoiding the direct contact of the pigment with the atmosphere and with the light, generating a slowdown in the degradation of the pigment. Indeed, for up to 5 days of irradiation of the binder, no degradation is observed, and only for larger exposure did the binder itself turn into pale yellow, showing differences in the vibrational spectrum as compared to the raw binder, as discussed before. UV light also affected the canvas; in fact, its Raman spectrum presented variations in peaks’ intensities as compared to the non-degraded sample. However, in this short period, no compositional change in the inorganic pigments spread on the canvas were detected, although the reflectance spectra registered a small blue-shift trend in the C samples (Figure 6g) and a small red shift in the S samples (Figure 6h), better evidenced by the corresponding first derivative spectra reported in the insets.
To summarize the overall color variation caused by UV exposure in each step, we compared all the variation in the CIE coordinates and the total difference ΔE in Table 2. The weight of oil canvas degradation is predominant, since the total variation ΔE assumes a value of 15.9. Single pigments present a maximum variation ΔE for sample C, which takes on the value of 6.2 after only 56 h of UV exposure. In this regard, the results allow us to confirm the provisional protective role of oil for sample C, which reacts with the environment in a reduced way, concluding with a total variation ΔE of only 3.5 after 20 days. We can assume that, after this primary protective action, a progressive degradation of the oil leads to its vulnerability to the environment, as suggested by the literature.

Table 2.
Color differences between the aged and non-aged samples.
However, the same feature cannot be confirmed in sample S, where the mixture of oil with pigments brings about the opposite effect: a variation of 27.2 with respect to 2.4 of the sole S pigment, mainly due to oil yellowing.
4. Conclusions
In this work, we tried to understand in detail the process of the degradation of Cd yellow in painting, whose phenomena of surface alteration are well known.
The utilization of 3D fluorescence mapping allowed for the visualization of the variations in the samples before and after UV irradiation. This technique provided valuable insights into the behavior of both the pigment and the oil binder when exposed to UV radiation. The appearance of high and low points in fluorescence intensity showed how the samples changed over time. High points meant new pigments appeared, while low points indicated oil breakdown. The variations in the fluorescence intensity over time suggested a complex degradation process involving multiple stages and mechanisms.
Raman spectroscopy provided chemical specificity and allowed for the identification of specific degradation products within the samples. By monitoring the intensity of bands corresponding to sulfate formation and pigment-related vibrations, changes in the chemical composition of the samples could be tracked over time. The observed increase in sulfate formation bands during periods of oil degradation suggested a concomitant degradation of the pigment, highlighting the interconnected nature of the degradation processes.
The observed variations in fluorescence intensity and Raman band intensities suggested a stratigraphic degradation process, wherein different layers within the samples were sequentially affected by UV irradiation. The degradation of the oil binder appeared to precede or coincide with the degradation of the pigment, indicating a hierarchical degradation sequence within the samples.
The differential response of the samples to UV irradiation at 250 nm and 365 nm further underscored the complexity of the degradation process. While both wavelengths induced degradation, the observed variations in the timing and extent of degradation suggested wavelength-specific effects on the degradation mechanisms and kinetics. This finding has implications for understanding and predicting the degradation behavior of cultural heritage materials under different environmental conditions.
We simulated the action of time with the use of UV light exposure, and with different analytical and optical techniques, we studied the degradation process of mock-ups of oil and pigments on canvas paintings. The investigation is also supplied with the study of the interaction between UV light and the binder or canvas support, taken singularly or combined with the pigments. The color variation was even revealed in linseed oil and canvas with no pigments exposed to UV light, while the formation of sulfate phase in the combined systems is not observed. This condition suggests a complex color change due to the single variation in canvas, oil, and pigments.
In conclusion, our comprehensive investigation sheds light on the intricate degradation processes of Cd yellow in paintings, revealing the sequential impact of UV irradiation on both pigment and binder layers. The observed complexities in degradation mechanisms and wavelength-specific effects highlight the multifaceted nature of cultural heritage preservation and underscore the importance of customized conservation strategies.
Supplementary Materials
The following supporting information can be downloaded at https://www.mdpi.com/article/10.3390/heritage7050115/s1. Figure S1: PL of pure C and S pigments; Figure S2: PLE of fresh oil, C-O, and S-O samples. Degradation vs. irradiation time at 250 and 365 nm.
Author Contributions
Conceptualization, D.C., S.P. and F.A.P.; methodology, D.C. and S.P.; validation, D.C., P.C.R. and C.M.C.; formal analysis, F.A.P. and S.P.; investigation, F.A.P. and S.P.; data curation, F.A.P. and D.C.; writing—original draft preparation, S.P. and F.A.P.; writing—review and editing, D.C. and C.M.C.; supervision, D.C. All authors have read and agreed to the published version of the manuscript.
Funding
This research was funded by Fondazione di Sardegna, project FDS2022 “New diagnostic techniques for ancient books restauration and conservation” CUP F73C23001560007.
Data Availability Statement
The original contributions presented in this study are included in the article/Supplementary Material, and further inquiries can be directed to the corresponding author(s).
Acknowledgments
All the authors thank the CeSAR (Centro Servizi Ricerca d’Ateneo) core facility of the University of Cagliari and M. Marceddu for assistance with the generation of transient absorption data.
Conflicts of Interest
The authors declare no conflicts of interest.
References
- Leone, B.; Burnstock, A.; Jones, C.; Hallebeek, P.; Boon, J.J.; Keune, K. The deterioration of cadmium sulphide yellow artists’ pigments. In Proceedings of the 14th Triennial Meeting, Hague, The Netherlands, 12–16 September 2005; ICOM Committee for Conservation: Preprints. Volume 20, pp. 803–813. [Google Scholar]
- Van Der Snickt, G.; Dik, J.; Cotte, M.; Janssens, K.; Jaroszewicz, J.; De Nolf, W.; Groenewegen, J.; Van Der Loeff, L. Characterization of a degraded cadmium yellow (CdS) pigment in an oil painting by means of synchrotron radiation based X-ray techniques. Anal. Chem. 2009, 81, 2600–2610. [Google Scholar] [CrossRef]
- Cited, L.; October, A. Cadmium Pigments. Nature 1939, 143, 891. [Google Scholar] [CrossRef]
- Traill, R.J.; Boyle, R.W. Hawleyite, isometric cadmium sulphide, a New Mineral. Am. Mineral. 1955, 40, 555–559. [Google Scholar]
- Stoffel, N.G. Experimental band structure of cadmium sulfide. Phys. Rev. B. 1983, 28, 3306–3319. [Google Scholar] [CrossRef]
- FitzHugh, E.W.; Harley, R.D. Artists’ Pigments; National Gallery of Art in Association with Archetype Publications Ltd.: London, UK, 2002; Volume 41, ISBN 9781904982746. [Google Scholar]
- Kulkarni, V.G.; Garn, P.D. Study of the formation of cadmium sulfoselenide. Thermochim. Acta 1986, 99, 33–36. [Google Scholar] [CrossRef]
- Mass, J.; Sedlmair, J.; Patterson, C.S.; Carson, D.; Buckley, B.; Hirschmugl, C. SR-FTIR imaging of the altered cadmium sulfide yellow paints in Henri Matisse’s le Bonheur de vivre (1905-6)-examination of visually distinct degradation regions. Analyst 2013, 138, 6032–6043. [Google Scholar] [CrossRef] [PubMed]
- Pouyet, E.; Cotte, M.; Fayard, B.; Salomé, M.; Meirer, F.; Mehta, A.; Uffelman, E.S.; Hull, A.; Vanmeert, F.; Kieffer, J.; et al. 2D X-ray and FTIR micro-analysis of the degradation of cadmium yellow pigment in paintings of Henri Matisse. Appl. Phys. A Mater. Sci. Process. 2015, 121, 967–980. [Google Scholar] [CrossRef]
- Van der Snickt, G.; Janssens, K.; Dik, J.; De Nolf, W.; Vanmeert, F.; Jaroszewicz, J.; Cotte, M.; Falkenberg, G.; Van der Loeff, L. Combined use of Synchrotron Radiation Based Micro-X-ray Fluorescence, Micro-X-ray Diffraction, Micro-X-ray Absorption Near-Edge, and Micro-Fourier Transform Infrared Spectroscopies for Revealing an Alternative Degradation Pathway of the Pigment Cadmium Yellow in a Painting by Van Gogh. Anal. Chem. 2012, 84, 10221–10228. [Google Scholar]
- Comelli, D.; Maclennan, D.; Ghirardello, M.; Phenix, A.; Schmidt Patterson, C.; Khanjian, H.; Gross, M.; Valentini, G.; Trentelman, K.; Nevin, A. Degradation of Cadmium Yellow Paint: New Evidence from Photoluminescence Studies of Trap States in Picasso’s Femme (époque des “demoiselles d’Avignon”). Anal. Chem. 2019, 91, 3421–3428. [Google Scholar] [CrossRef]
- Anaf, W.; Schalm, O.; Janssens, K.; De Wael, K. Understanding the (in)stability of semiconductor pigments by a thermodynamic approach. Dyes Pigments 2015, 113, 409–415. [Google Scholar] [CrossRef]
- Anaf, W.; Trashin, S.; Schalm, O.; Van Dorp, D.; Janssens, K.; De Wael, K. Electrochemical photodegradation study of semiconductor pigments: Influence of environmental parameters. Anal. Chem. 2014, 86, 9742–9748. [Google Scholar] [CrossRef]
- Pisu, F.A.; Ricci, P.C.; Porcu, S.; Carbonaro, C.M.; Chiriu, D. Degradation of CdS Yellow and Orange Pigments: A Preventive Characterization of the Process through Pump–Probe, Reflectance, X-ray Diffraction, and Raman Spectroscopy. Materials 2022, 15, 5533. [Google Scholar] [CrossRef] [PubMed]
- Mayorga Pinilla, S.; Vázquez Moliní, D.; Álvarez Fernández-Balbuena, A.; Hernández Raboso, G.; Herráez, J.A.; Azcutia, M.; García Botella, Á. Advanced daylighting evaluation applied to cultural heritage buildings and museums: Application to the cloister of Santa Maria El Paular. Renew. Energy 2016, 85, 1362–1370. [Google Scholar] [CrossRef]
- Mayorga Pinilla, S.; Vázquez, D.; Álvarez Fernández-Balbuena, A.; Muro, C.; Muñoz, J. Spectral damage model for lighted museum paintings: Oil, acrylic and gouache. J. Cult. Herit. 2016, 22, 931–939. [Google Scholar] [CrossRef]
- Illumination, I.C. On the Deterioration of Exhibited Museum Objects by Optical Radiation; CIE Technical Report; CIE: Hsinchu, Taiwan, 1991; ISBN 9783901906275. [Google Scholar]
- Piccablotto, G.; Aghemo, C.; Pellegrino, A.; Iacomussi, P.; Radis, M. Study on conservation aspects using LED technology for museum lighting. Energy Procedia 2015, 78, 1347–1352. [Google Scholar] [CrossRef]
- Pfendler, S.; Einhorn, O.; Bousta, F.; Khatyr, A. UV-C as a means to combat biofilm proliferation on prehistoric paintings: Evidence from laboratory experiments. Environ. Sci. Pollut. Res. 2017, 21601–21609. [Google Scholar] [CrossRef] [PubMed]
- Borderie, F.; Laurence, A.S.; Naoufal, R.; Faisl, B.; Geneviève, O.; Dominique, R.; Badr, A.S. UV-C irradiation as a tool to eradicate algae in caves. Int. Biodeterior. Biodegrad. 2011, 65, 579–584. [Google Scholar] [CrossRef]
- Paulus, J.; Knuutinen, U. Cadmium colours: Composition and properties. Appl. Phys. A Mater. Sci. Process. 2004, 79, 397–400. [Google Scholar] [CrossRef]
- Monico, L.; Chieli, A.; De Meyer, S.; Cotte, M.; de Nolf, W.; Falkenberg, G.; Janssens, K.; Romani, A.; Miliani, C. Role of the Relative Humidity and the Cd/Zn Stoichiometry in the Photooxidation Process of Cadmium Yellows (CdS/Cd1−xZnxS) in Oil Paintings. Chem. Eur. J. 2018, 24, 11584–11593. [Google Scholar] [CrossRef]
- Giacopetti, L.; Nevin, A.; Comelli, D.; Valentini, G.; Nardelli, M.B.; Satta, A. First principles study of the optical emission of cadmium yellow: Role of cadmium vacancies. AIP Adv. 2018, 8, 065202. [Google Scholar] [CrossRef]
- Giacopetti, L.; Satta, A. Degradation of Cd-yellow paints: Ab initio study of native defects in {10.0} surface CdS. Microchem. J. 2016, 126, 214–219. [Google Scholar] [CrossRef]
- Giacopetti, L.; Satta, A. Reactivity of Cd-yellow pigments: Role of surface defects. Microchem. J. 2018, 137, 502–508. [Google Scholar] [CrossRef]
- Falgayrac, G.; Sobanska, S.; Brémard, C. Heterogeneous microchemistry between CdSO4 and CaCO3 particles under humidity and liquid water. J. Hazard. Mater. 2013, 248–249, 415–423. [Google Scholar] [CrossRef] [PubMed]
- Chiriu, D.; Desogus, G.; Pisu, F.A.; Fiorino, D.R.; Grillo, S.M.; Ricci, P.C.; Carbonaro, C.M. Beyond the surface: Raman micro-SORS for in depth non-destructive analysis of fresco layers. Microchem. J. 2020, 153, 104404. [Google Scholar] [CrossRef]
- Chiriu, D.; Pisu, F.A.; Ricci, P.C.; Carbonaro, C.M. Application of raman spectroscopy to ancient materials: Models and results from archaeometric analyses. Materials 2020, 13, 2456. [Google Scholar] [CrossRef] [PubMed]
- Chiriu, D.; Ricci, P.C.; Carbonaro, C.M.; Nadali, D.; Polcaro, A.; Collins, P. Raman identification of cuneiform tablet pigments: Emphasis and colour technology in ancient Mesopotamian mid-third millennium. Heliyon 2017, 3, e00272. [Google Scholar] [CrossRef][Green Version]
- Pisu, F.A.; Carbonaro, C.M.; Corpino, R.; Ricci, P.C.; Chiriu, D. Fresco paintings: Development of an aging model from 1064 nm excited raman spectra. Crystals 2021, 11, 257. [Google Scholar] [CrossRef]
- Chiriu, D.; Pala, M.; Pisu, F.A.; Cappellini, G.; Ricci, P.C.; Carbonaro, C.M. Time through colors: A kinetic model of red vermilion darkening from Raman spectra. Dyes Pigments 2021, 184, 108866. [Google Scholar] [CrossRef]
- Chi, T.T.K.; Gouadec, G.; Colomban, P.; Wang, G.; Mazerolles, L.; Liem, N.Q. Off-resonance Raman analysis of wurtzite CdS ground to the nanoscale: Structural and size-related effects. J. Raman Spectrosc. 2011, 42, 1007–1015. [Google Scholar] [CrossRef]
- Briggs, R.J.; Ramdas, A.K. Piezospectroscopic study of the raman spectrum of cadmium sulfide. Phys. Rev. B 1976, 13, 5518–5529. [Google Scholar] [CrossRef]
- Rosi, F.; Grazia, C.; Gabrieli, F.; Romani, A.; Paolantoni, M.; Vivani, R.; Brunetti, B.G.; Colomban, P.; Miliani, C. UV–Vis-NIR and micro Raman spectroscopies for the non destructive identification of Cd1—xZnxS solid solutions in cadmium yellow pigments. Microchem. J. 2016, 124, 856–867. [Google Scholar] [CrossRef]
- Zhou, L.; Mernagh, T.P.; Mo, B.; Wang, L.; Zhang, S.; Wang, C. Raman study of barite and celestine at various temperatures. Minerals 2020, 10, 260. [Google Scholar] [CrossRef]
- Buzgar, N.; Buzatu, A.; Sanislav, I.V. The Raman study on certain sulfates. An. Stiint. Univ. Al. I-Mat. 2009, 55, 5–23. [Google Scholar]
- Schönemann, A.; Edwards, H.G.M. Raman and FTIR microspectroscopic study of the alteration of Chinese tung oil and related drying oils during ageing. Anal. Bioanal. Chem. 2011, 400, 1173–1180. [Google Scholar] [CrossRef]
- Gueli, A.M.; Gallo, S.; Pasquale, S. Optical and colorimetric characterization on binary mixtures prepared with coloured and white historical pigments. Dyes Pigments 2018, 157, 342–350. [Google Scholar] [CrossRef]
Disclaimer/Publisher’s Note: The statements, opinions and data contained in all publications are solely those of the individual author(s) and contributor(s) and not of MDPI and/or the editor(s). MDPI and/or the editor(s) disclaim responsibility for any injury to people or property resulting from any ideas, methods, instructions or products referred to in the content. |
© 2024 by the authors. Licensee MDPI, Basel, Switzerland. This article is an open access article distributed under the terms and conditions of the Creative Commons Attribution (CC BY) license (https://creativecommons.org/licenses/by/4.0/).


