1. Introduction
The primary purpose of museums is to collect, preserve, interpret, and exhibit objects and materials of cultural, historical, and scientific significance to educate and inspire visitors [
1,
2]. Historical buildings and museum antiquities serve as cultural evidence from the past that must be properly preserved for future generations. However, the indoor microclimate of buildings plays a crucial role in preserving cultural heritage. Due to the delicate nature of the exhibits, the indoor environment of a museum should meet specific hygrothermal and air quality requirements [
3]. Environmental factors that can affect cultural heritage include temperature, relative humidity, air quality, light, and vibration [
4,
5]. Changes in these factors can lead to mechanical, chemical, and biological decay of the interiors of the objects and collections they contain [
6,
7]. Camuffo and Bernardi [
8] indicated that fluctuations in temperature and relative humidity can cause stress to the materials, leading to cumulative and irreversible changes in their physical and chemical properties, accelerating the deterioration process and eventual failure of the materials.
Therefore, understanding the factors that influence indoor climate and regularly monitoring climate fluctuations is important [
6,
9]. According to the literature, the indoor climate of a building is influenced by various factors, including the outdoor climate, the dimensions and structure of the building, the materials used for its construction, and the hydrogeology of the underlying soil [
10]. These factors can impact the temperature and humidity levels within the building, which, in turn, affect the microclimate and preservation of objects and collections. A building constructed with materials of high thermal mass can reduce heat flow fluctuations and thus maintain more stable climatic conditions [
11]. In addition, the natural ventilation, the presence of people, and the heating system induce fluctuations in indoor environments which may put the heritage conservation at risk [
12,
13,
14]. For example, the presence of visitors can cause an increase in air temperature (due to sensible heat gains, primarily emitted by convection), leading to an increase in relative humidity as well [
15]. In the past, many studies have tried to determine the best conservation and protection strategy for artworks housed in museums, churches, etc. [
16,
17,
18]. Overall, these studies highlight the importance of monitoring and regulating the indoor microclimate of museums to ensure the long-term preservation of cultural heritage objects.
To assess the indoor climate of museums, many studies employ monitoring strategies to gather data that identify trends, patterns, and anomalies in the museum microclimate [
6,
19,
20,
21]. The data collected from these methods can provide insights for the effectiveness of the museums’ climate control systems and help identify areas where improvements may be necessary to ensure the preservation of cultural heritage objects. For example, Schito et al. [
22] applied microclimate indices during a four-month monitoring campaign at the Palazzo Blu Museum in Pisa in 2016, revealing a generally acceptable instantaneous microclimate. They emphasized that the improvement of the HVAC (heating, ventilation, and air conditioning) system is essential to avoid high thermal-hygrometric daily durations. Later, Sciurpi et al. [
23] conducted one year of microclimatic monitoring in a museum in Florence and found that the temperature and relative humidity conditions were not reasonably acceptable for the preservation of the exhibited objects, suggesting possible solutions. Similarly, after microclimate monitoring in the indoor environment of a museum in Romania, Camelia et al. [
21] stressed the need for better preservation of exhibits, as well as a healthier environment for workers, restorers, and visitors.
In addition, recent research has also focused on monitoring the microclimate of churches which often differ significantly from modern museums in terms of their structure. The unique microclimates created by massive walls, high ceilings, and limited windows can have both positive and negative impacts on the preservation of cultural heritage objects [
24,
25]. By carefully monitoring and controlling the indoor environment, it is possible to reduce the rate of deterioration and prolong the lifespan of these important cultural treasures. Other studies have indicated that uncontrolled installation and the use of heating systems can lead to the deterioration of building interiors and adversely affect their historic climates [
12,
26]. This underlines the importance of regulating the indoor climate to mitigate the harmful effects of artificial heating and other environmental factors on cultural heritage. However, as mentioned, maintaining a comfortable indoor environment for occupants can sometimes conflict with the requirements for preserving cultural property. Thus, a reasonable compromise between the needs of occupants and the requirements for cultural property conservation is important [
4,
6].
As previously mentioned, the outdoor environment can have a significant impact on the indoor climate of museums and historical buildings, posing new adaptation challenges for museum directors and boards. Changes in outdoor climate, such as temperature fluctuations and increased humidity levels, can impact the indoor environment of museums. The Intergovernmental Panel on Climate Change (IPCC) has warned that climate change is likely to increase the risk of mold and insect infestations in museums and other cultural institutions. This is because warmer temperatures and higher humidity levels create favorable conditions for mold and insect growth [
27]. Several studies and reports have explored this issue in depth [
27,
28], noting the potential impacts of future climate change on the preservation of museum collections and emphasizing the need for adaptation measures to mitigate these impacts.
The Greek area in which this work focuses is a country with a rich cultural heritage spanning thousands of years and a profound influence on Western art, literature, philosophy, and politics. According to the Hellenic Ministry of Culture and Sports, Greece has over 150 archaeological museums, each with its own unique collection of artifacts and exhibits. However, Greece is expected to face new threats from climate change, which will pose new challenges to museum managers, directors, and the government. According to the IPCC, Europe, including Greece, is expected to experience a significant temperature rise, with estimates ranging from 2.2 °C to 5.1 °C by the end of the century [
29]. Recent projections suggest a 3.6 °C temperature increase by the end of the 21st century [
30]. Generally, Georgoulias et al. [
31] have shown that the average temperature in Greece is expected to increase in the future, and precipitation to decrease, leading to a warmer and drier climate. Similarly, Kostopoulou and Giannakopoulos [
32] also found in their recent work on extreme wet and dry conditions in Greece that the annual precipitation is estimated to decrease by 15–40% and the number of consecutive dry days by 40–80% during 2071–2100 under the RCP8.5 scenario. These environmental changes could potentially impact public health, thermal comfort, tourism, and agriculture [
33,
34,
35,
36]. To address these challenges, museums must collaborate with experts to develop strategies for adapting to changing climate and minimizing the impact on their collections. UNESCO [
37] recognizes the potential impact of climate change on cultural heritage sites and calls for increased awareness and action to protect these sites from climate change effects. In our previous work [
38], we focused on the impacts of climate change on cultural heritage in outdoor environments for both the present and the future in two Greek areas with high cultural value: Thessaloniki and Delphi. The results indicated that increasing temperature would result in a riskier climate for the monuments with a higher risk of damage. On the other hand, the results regarding relative humidity varied according to the season.
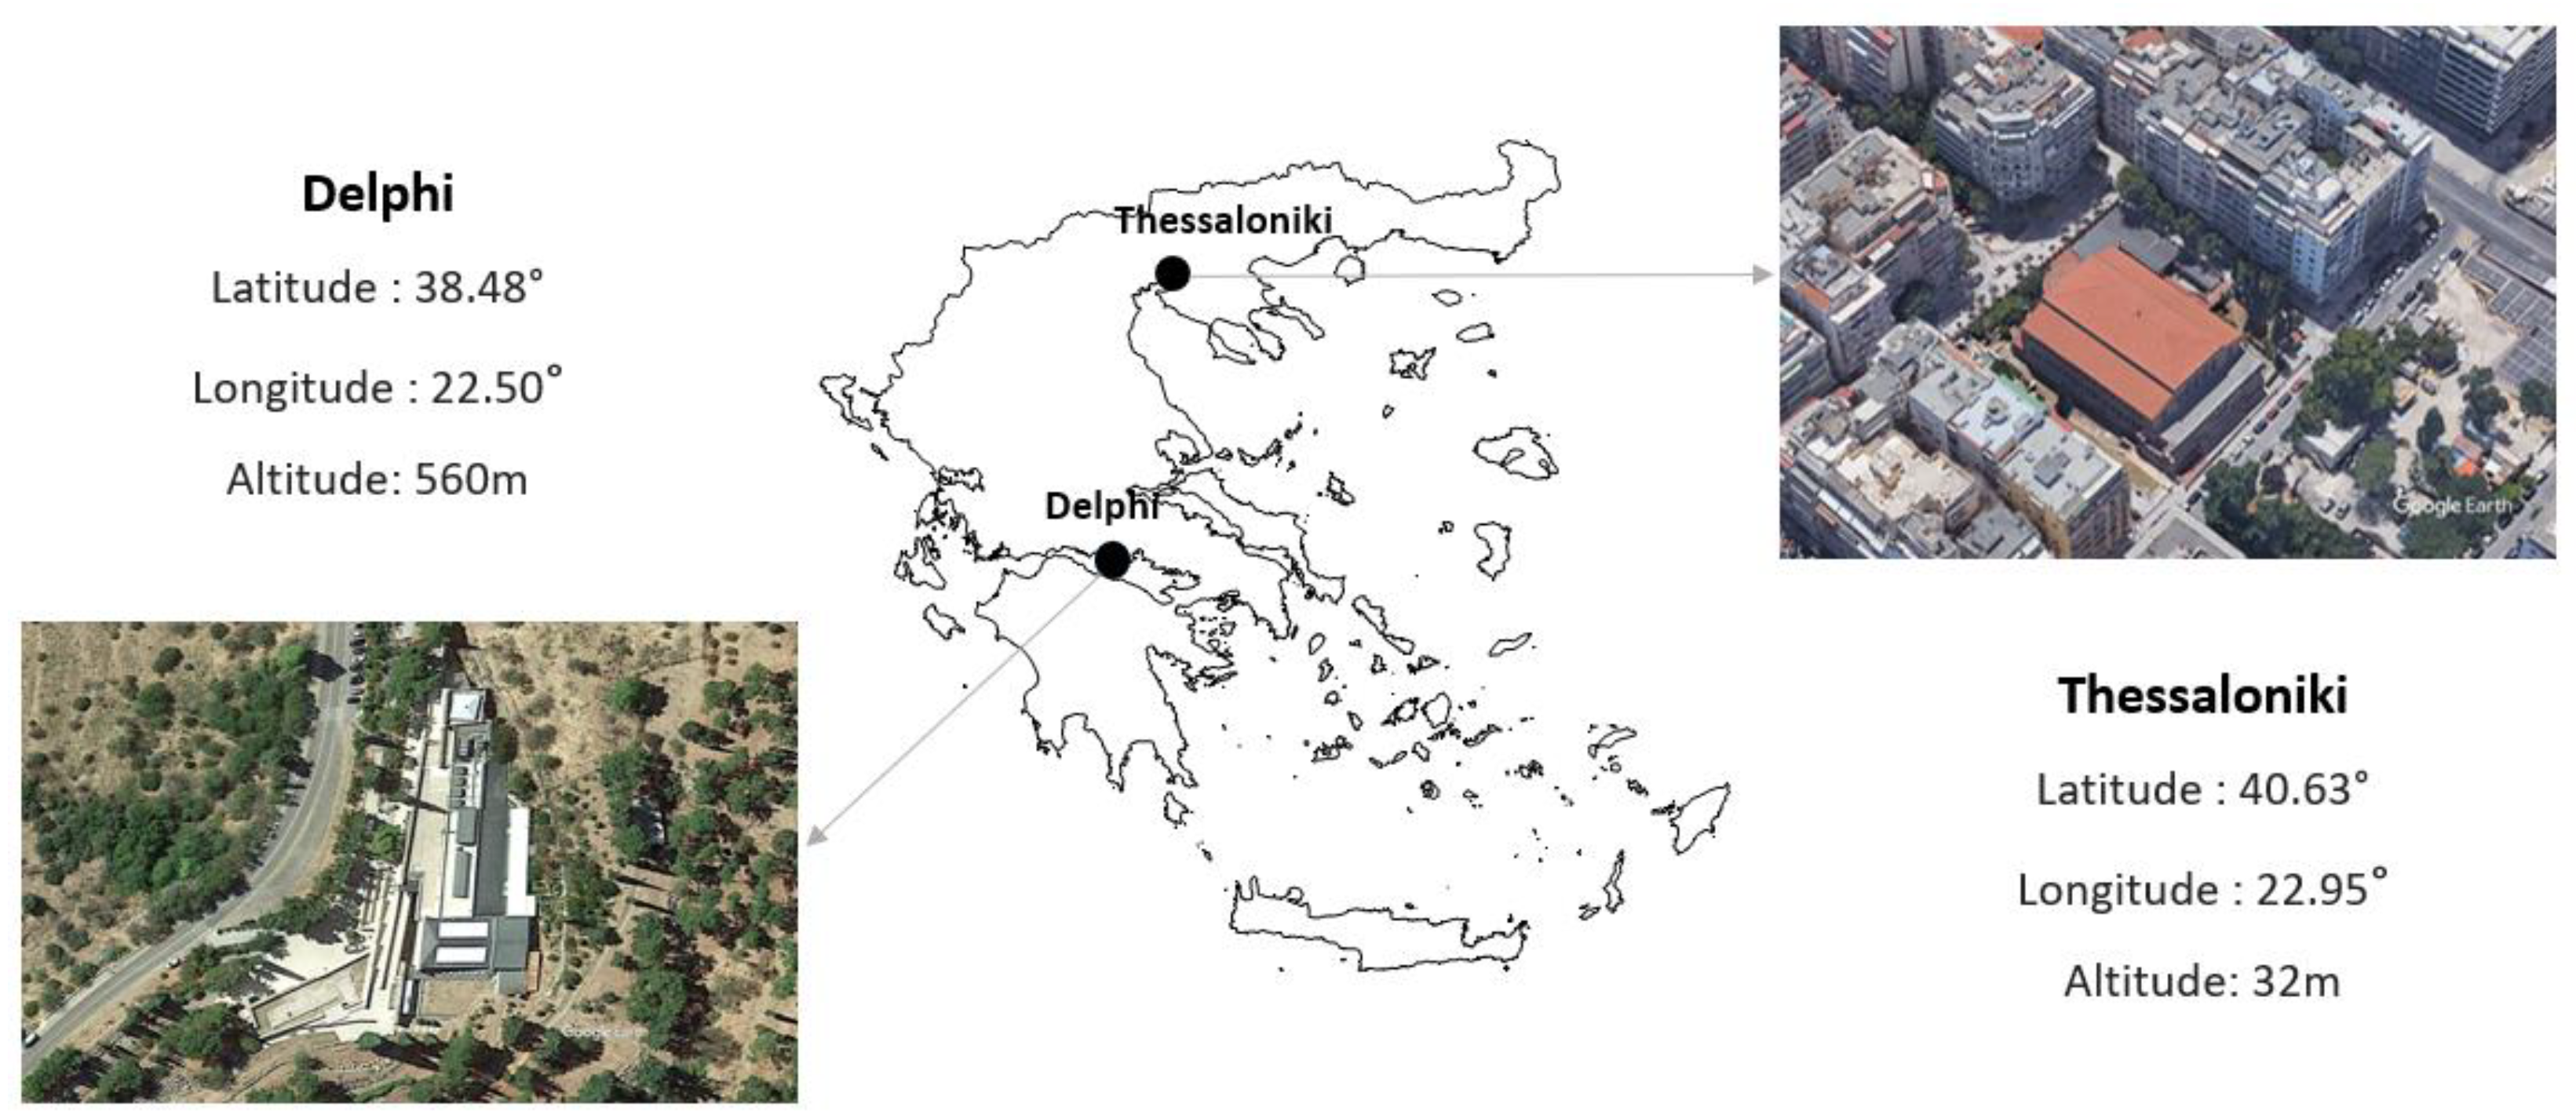
Nevertheless, since the cultural heritage preserved in museums or historical buildings is exposed to the risk of damage and deterioration, due to the microclimatic conditions characteristic of the environment that hosts it, this study focuses on analyzing the indoor environments of specific historical buildings and museums in Thessaloniki and Delphi, Greece. Recognizing the increasing threat posed by climate change to cultural heritage, this study raises the following key questions: How do fluctuations in outdoor climate impact the indoor climate of museums and historical buildings in Greece? And what are the implications for the cultural heritage they accommodate? The primary objective of this work is the assessment of the suitability of internal microclimates, with an emphasis on early warning for extreme conditions. A one-year monitoring campaign was carried out, aiming to provide a detailed assessment of the indoor climate in selected museums and historical buildings in Greece. Striving to actively contribute to the timely mitigation of extreme temperature and humidity values, our study proposes an innovative real-time data analysis approach. To assess the risk of indoor climates and estimate the risk of damage to antiquities, HMRhs and PRD indices were applied. Furthermore, anticipating that future climate change will exert additional pressure on museums’ efforts to maintain stable climatic conditions, we endeavored to examine the trend of internal temperature in relation to outdoor conditions. These findings could be helpful in guiding preservation strategies, informing adaptive measures, and enhancing the resilience of cultural heritage institutions in the face of evolving climate challenges.
The innovation of the work lies in the fact that the proposed methodology allows for the detection of extreme temperature and relative humidity values, accurately identifying the time period requiring more attention. The study’s approach to data analysis in real-time opens new horizons for predicting and promptly responding to extreme temperature and humidity values.
3. Results
3.1. Estimation of Extreme Values
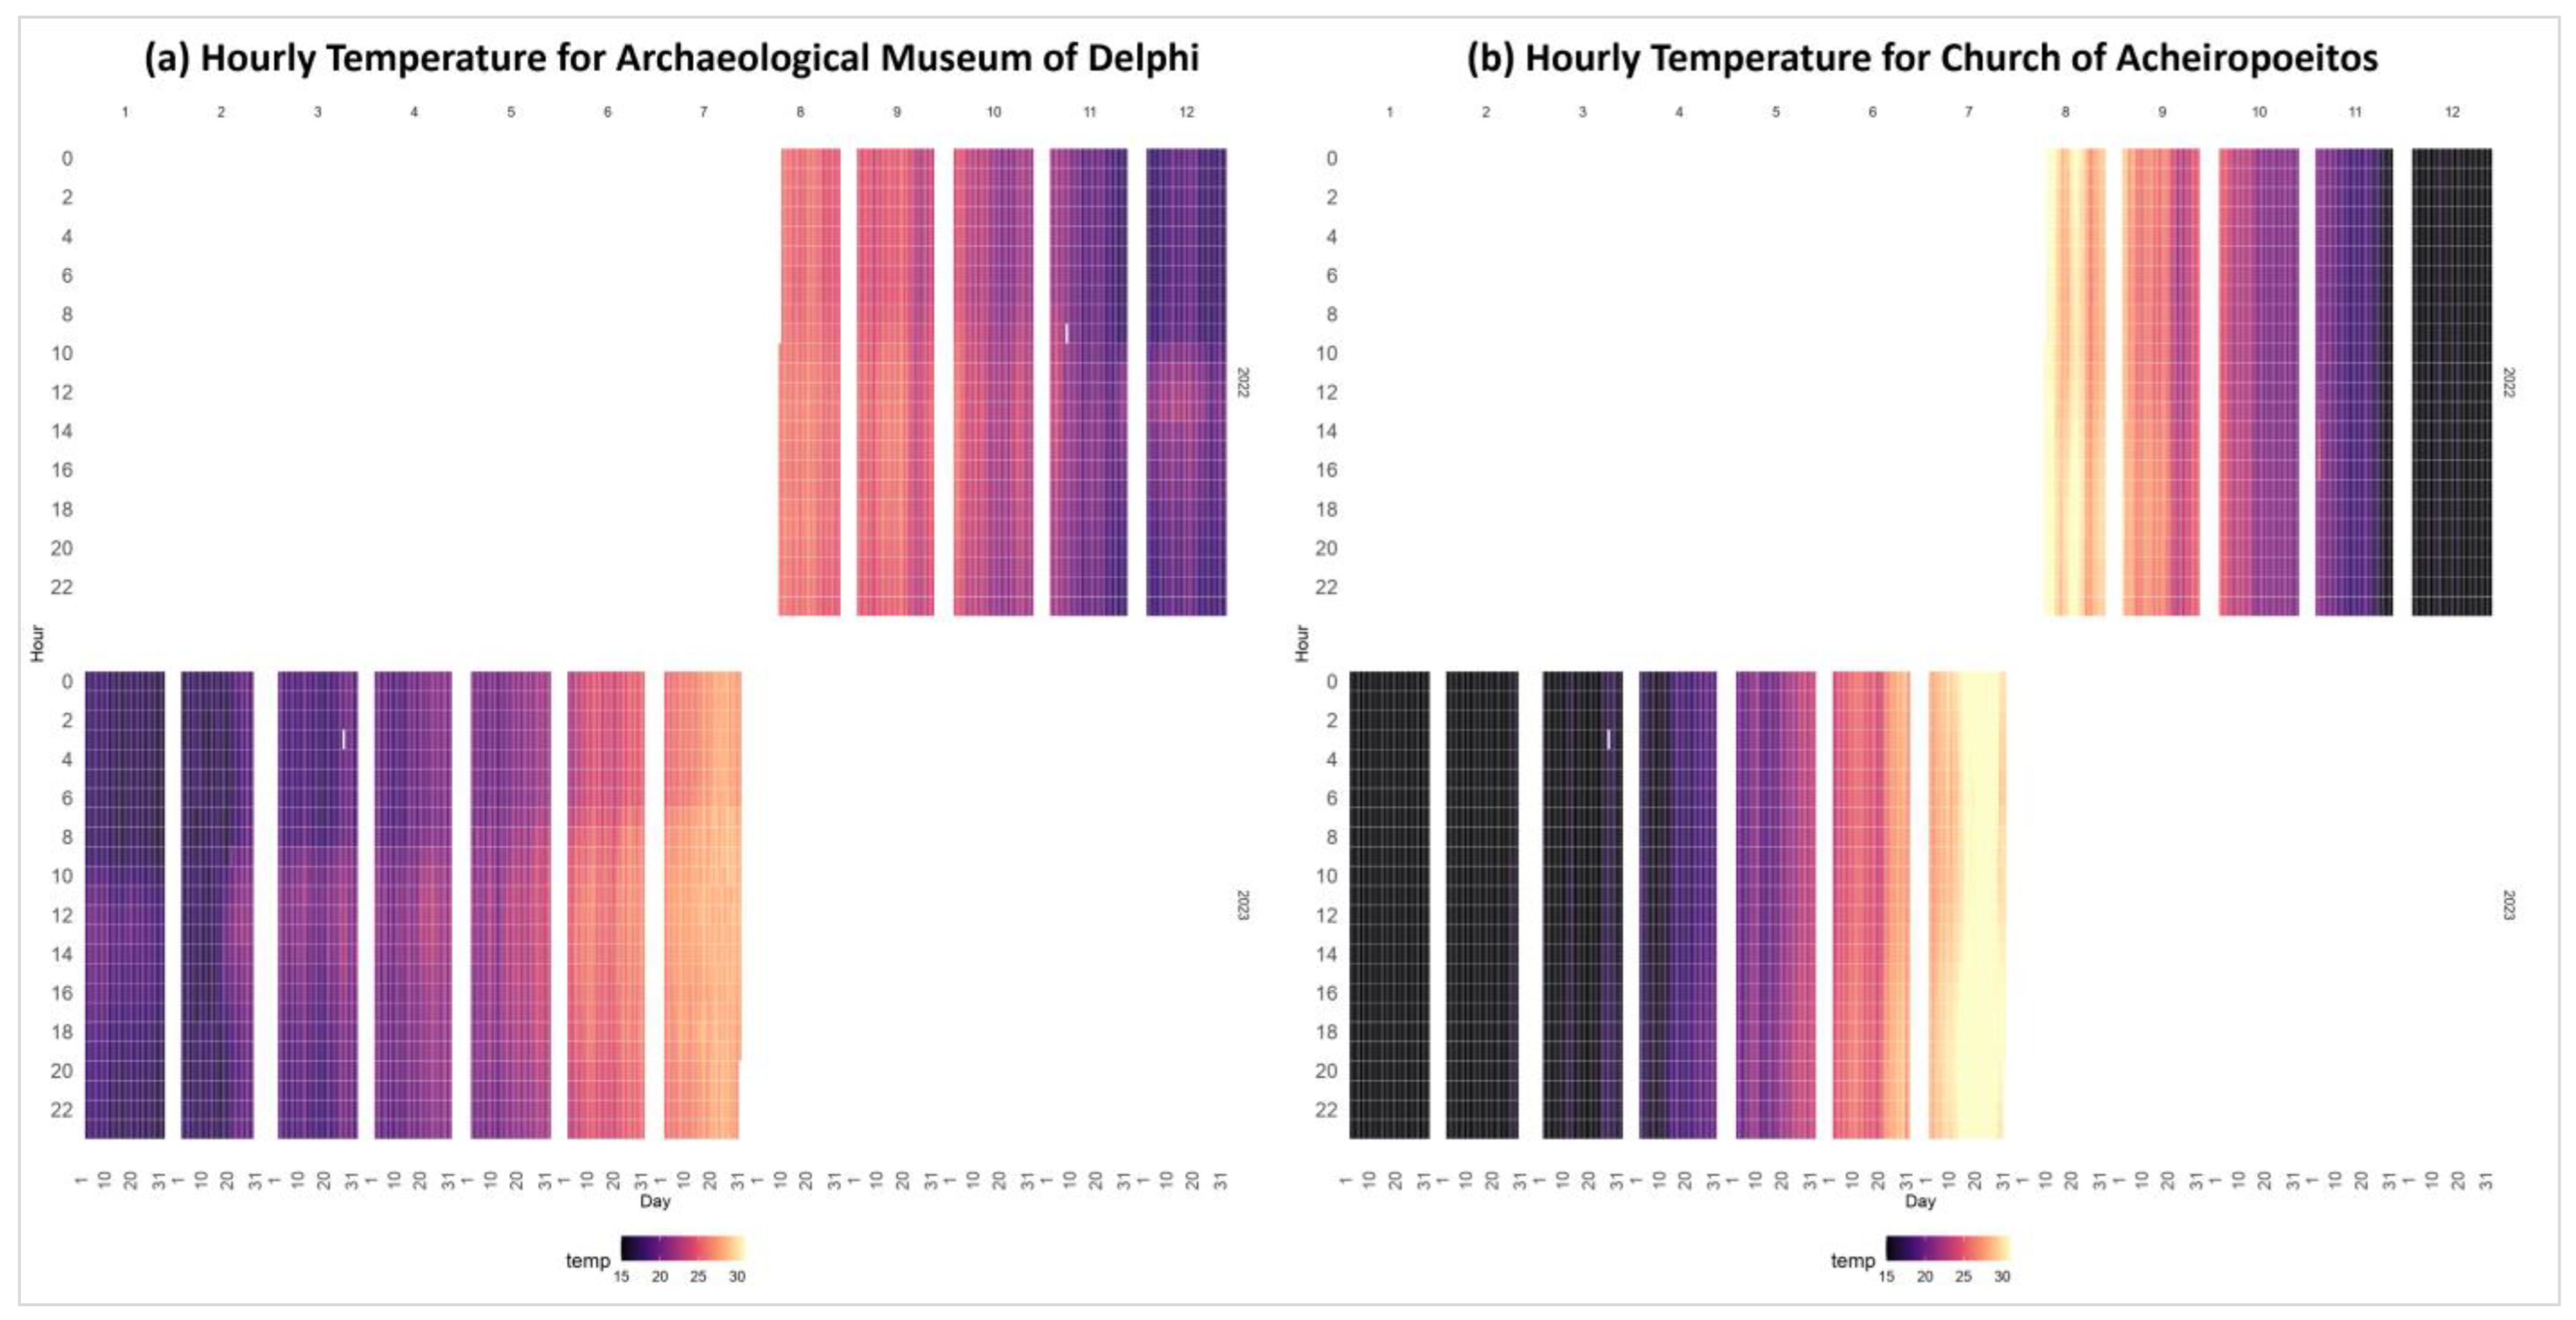
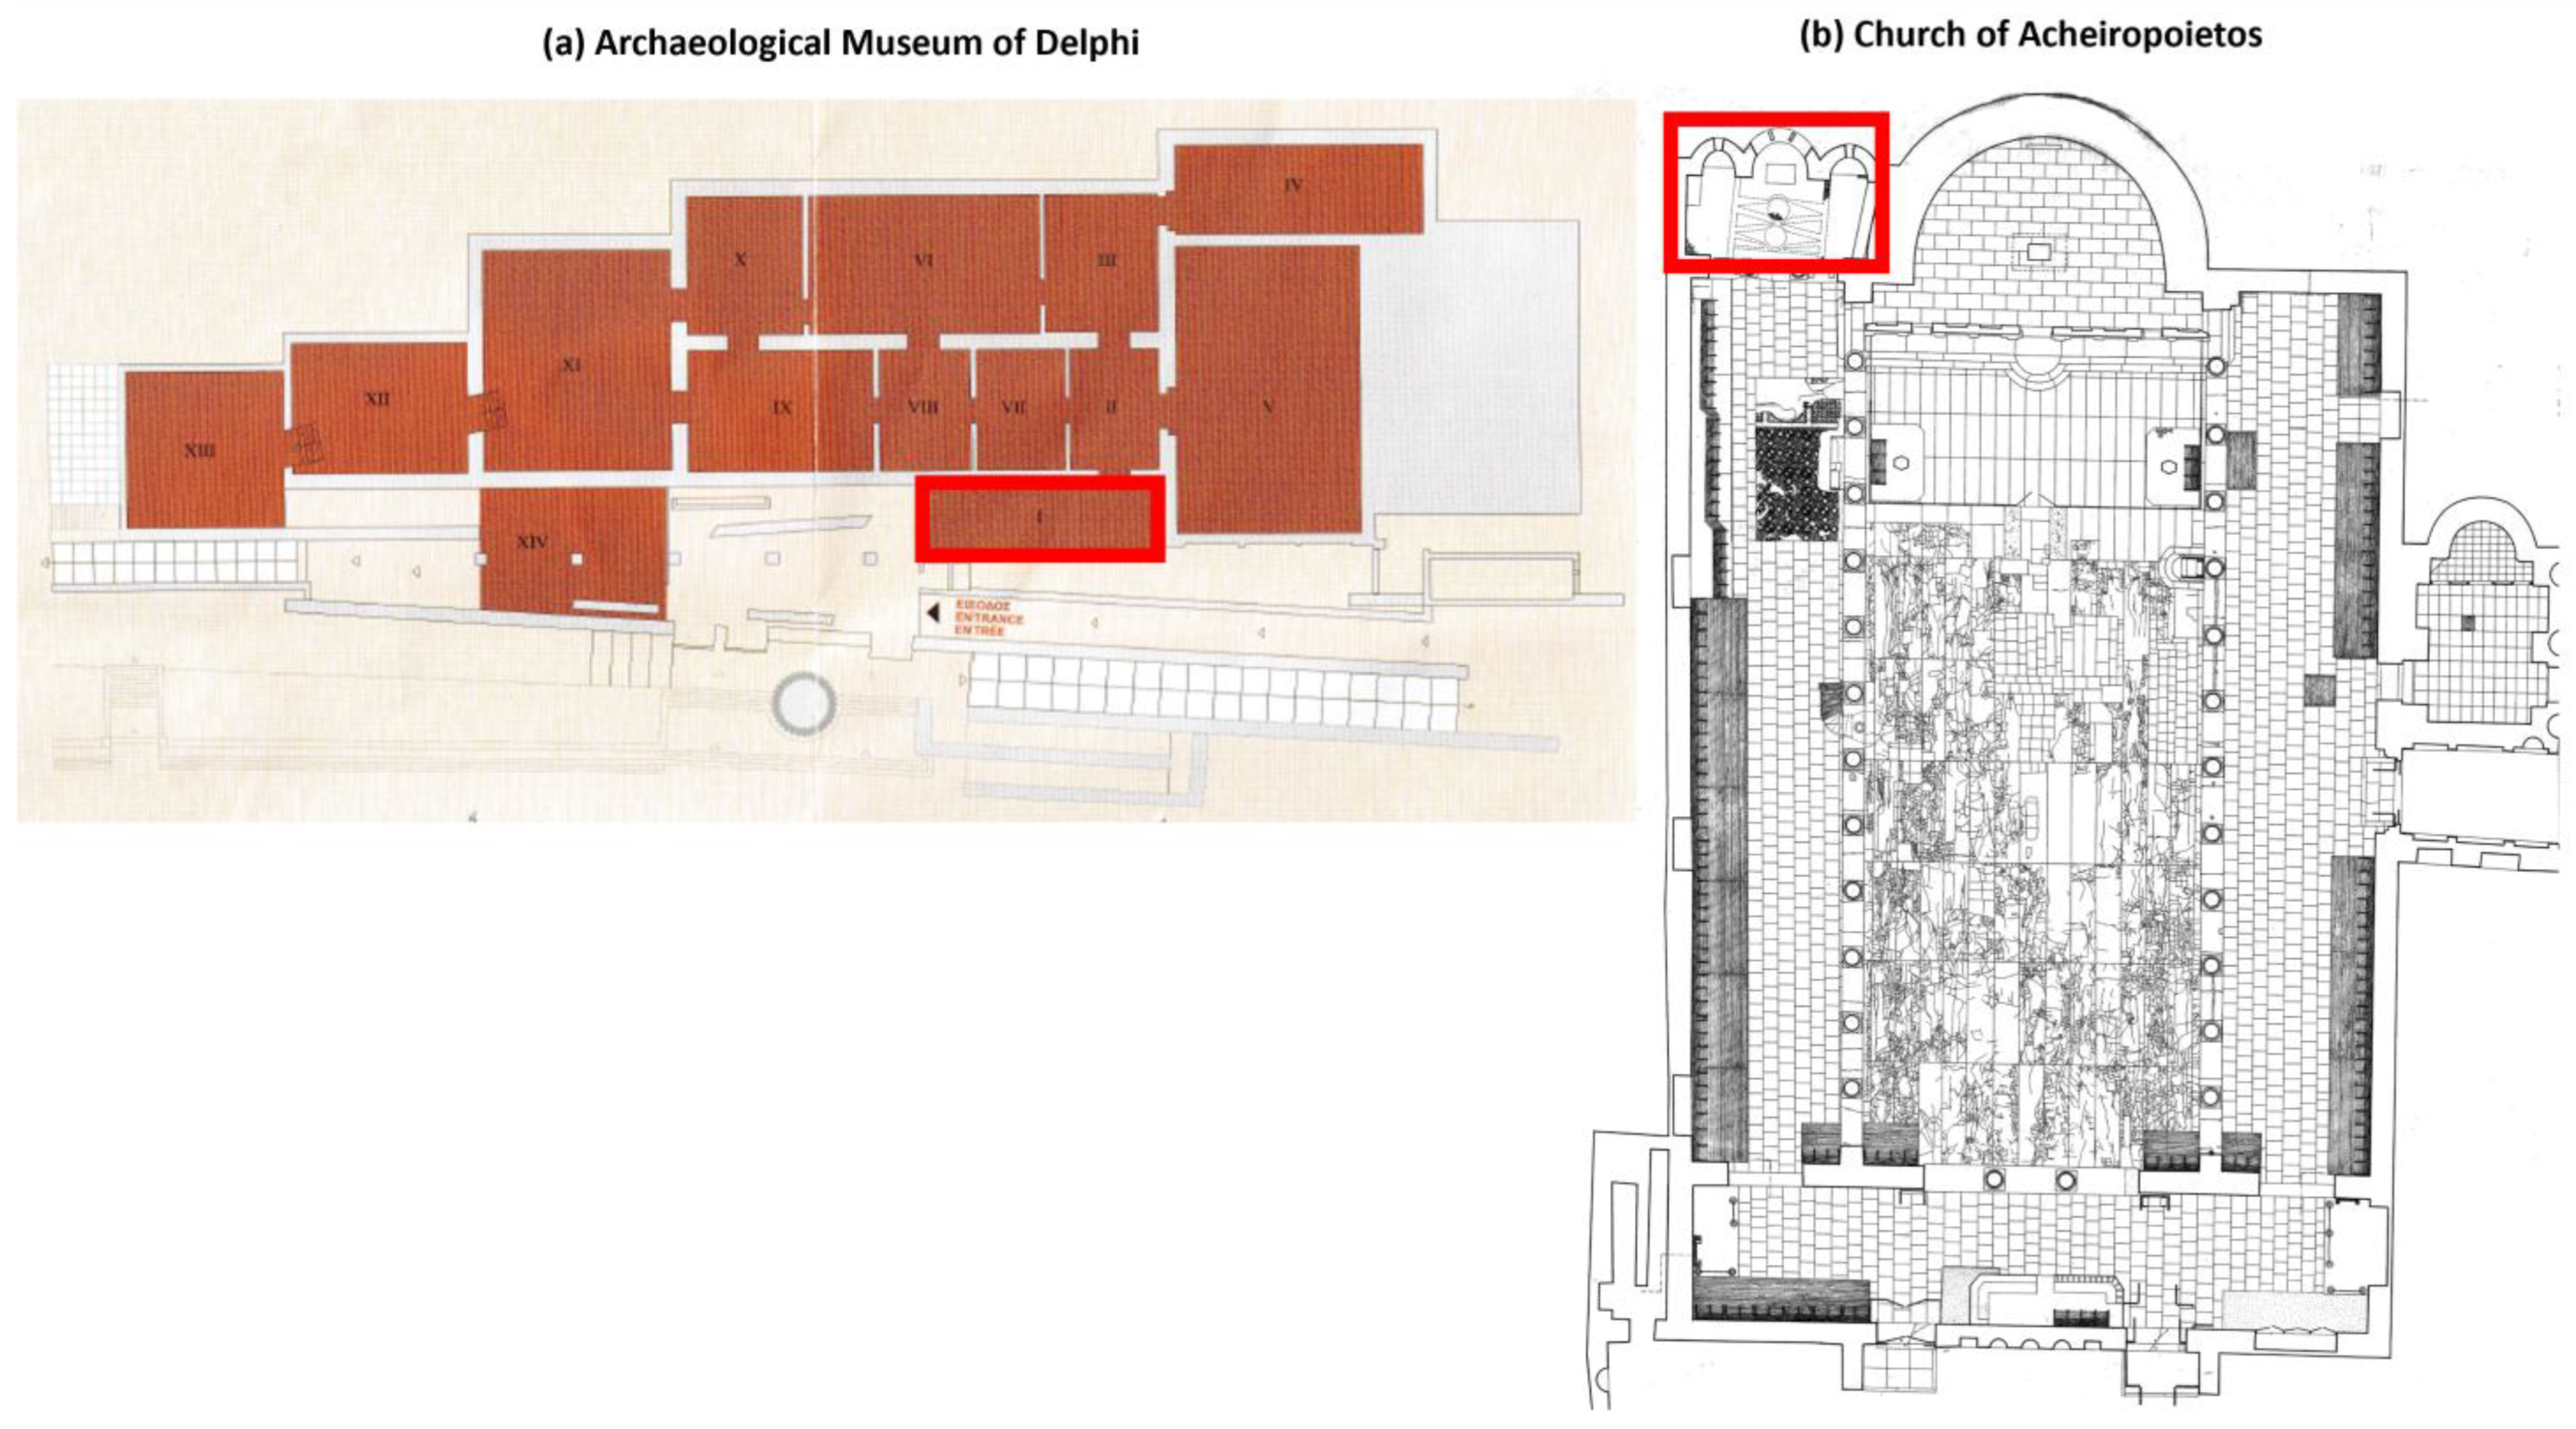
To comprehend the daily, monthly, seasonal, and annual temperature fluctuations, we generated heat maps for each building. In
Figure 3, the heat map for the Archaeological Museum of Delphi is presented on the left, and for the Church of Acheiropoietos is on the right. Each diagram illustrates the hourly temperature throughout the one-year monitoring campaign for the studied rooms of the buildings. The results provide significant information regarding the thermal behavior of the two buildings and enabled us to identify temperature patterns and comprehend their thermal behavior.
The dark-purple and light-yellow colors in the Acheiropoietos church signal a broader range of temperatures, suggesting the presence of more extreme temperatures compared to the Delphi Museum building, possibly due to the lack of heating and cooling systems. Specifically, the temperature range in the chapel of the church for the monitoring campaign year is 8.0 to 33.4 °C, whereas the temperature range for room I in the Delphi Museum is 16.0 to 28.2 °C. The examination of the monthly temperature fluctuations reveals distinctive patterns between the two structures. The Delphi Museum consistently records its lowest temperatures in February and January, whereas the Acheiropoietos church experiences prolonged periods of low temperatures from December to March, with temperatures less than 17.8 °C during this timeframe. The month with the lowest average temperature in the Delphi Museum is January (17.9 °C), while in the Acheiropoietos church, it is February (11.4 °C). The highest temperatures were recorded in July at both buildings. The average indoor temperature in the Delphi Museum during the month of July is 27.2 °C, while in the Acheiropoietos church, it is 30.0 °C. However, the church also noted equally high temperatures in August (average temperature 29.4 °C). In the building of the Delphi Museum, it is observed that during the evening and early morning hours, regardless of the month or season, the temperature is lower. Additionally, there is a daily increase in temperature around 9 a.m. Generally, higher temperature values are noted in the period roughly between 9 p.m. and 5 a.m., during the museum’s operating hours, with the causes varying with the season. Conversely, the Church of Acheiropoietos exhibits minimal daily temperature variation, without pronounced fluctuations as the ones observed in the museum.
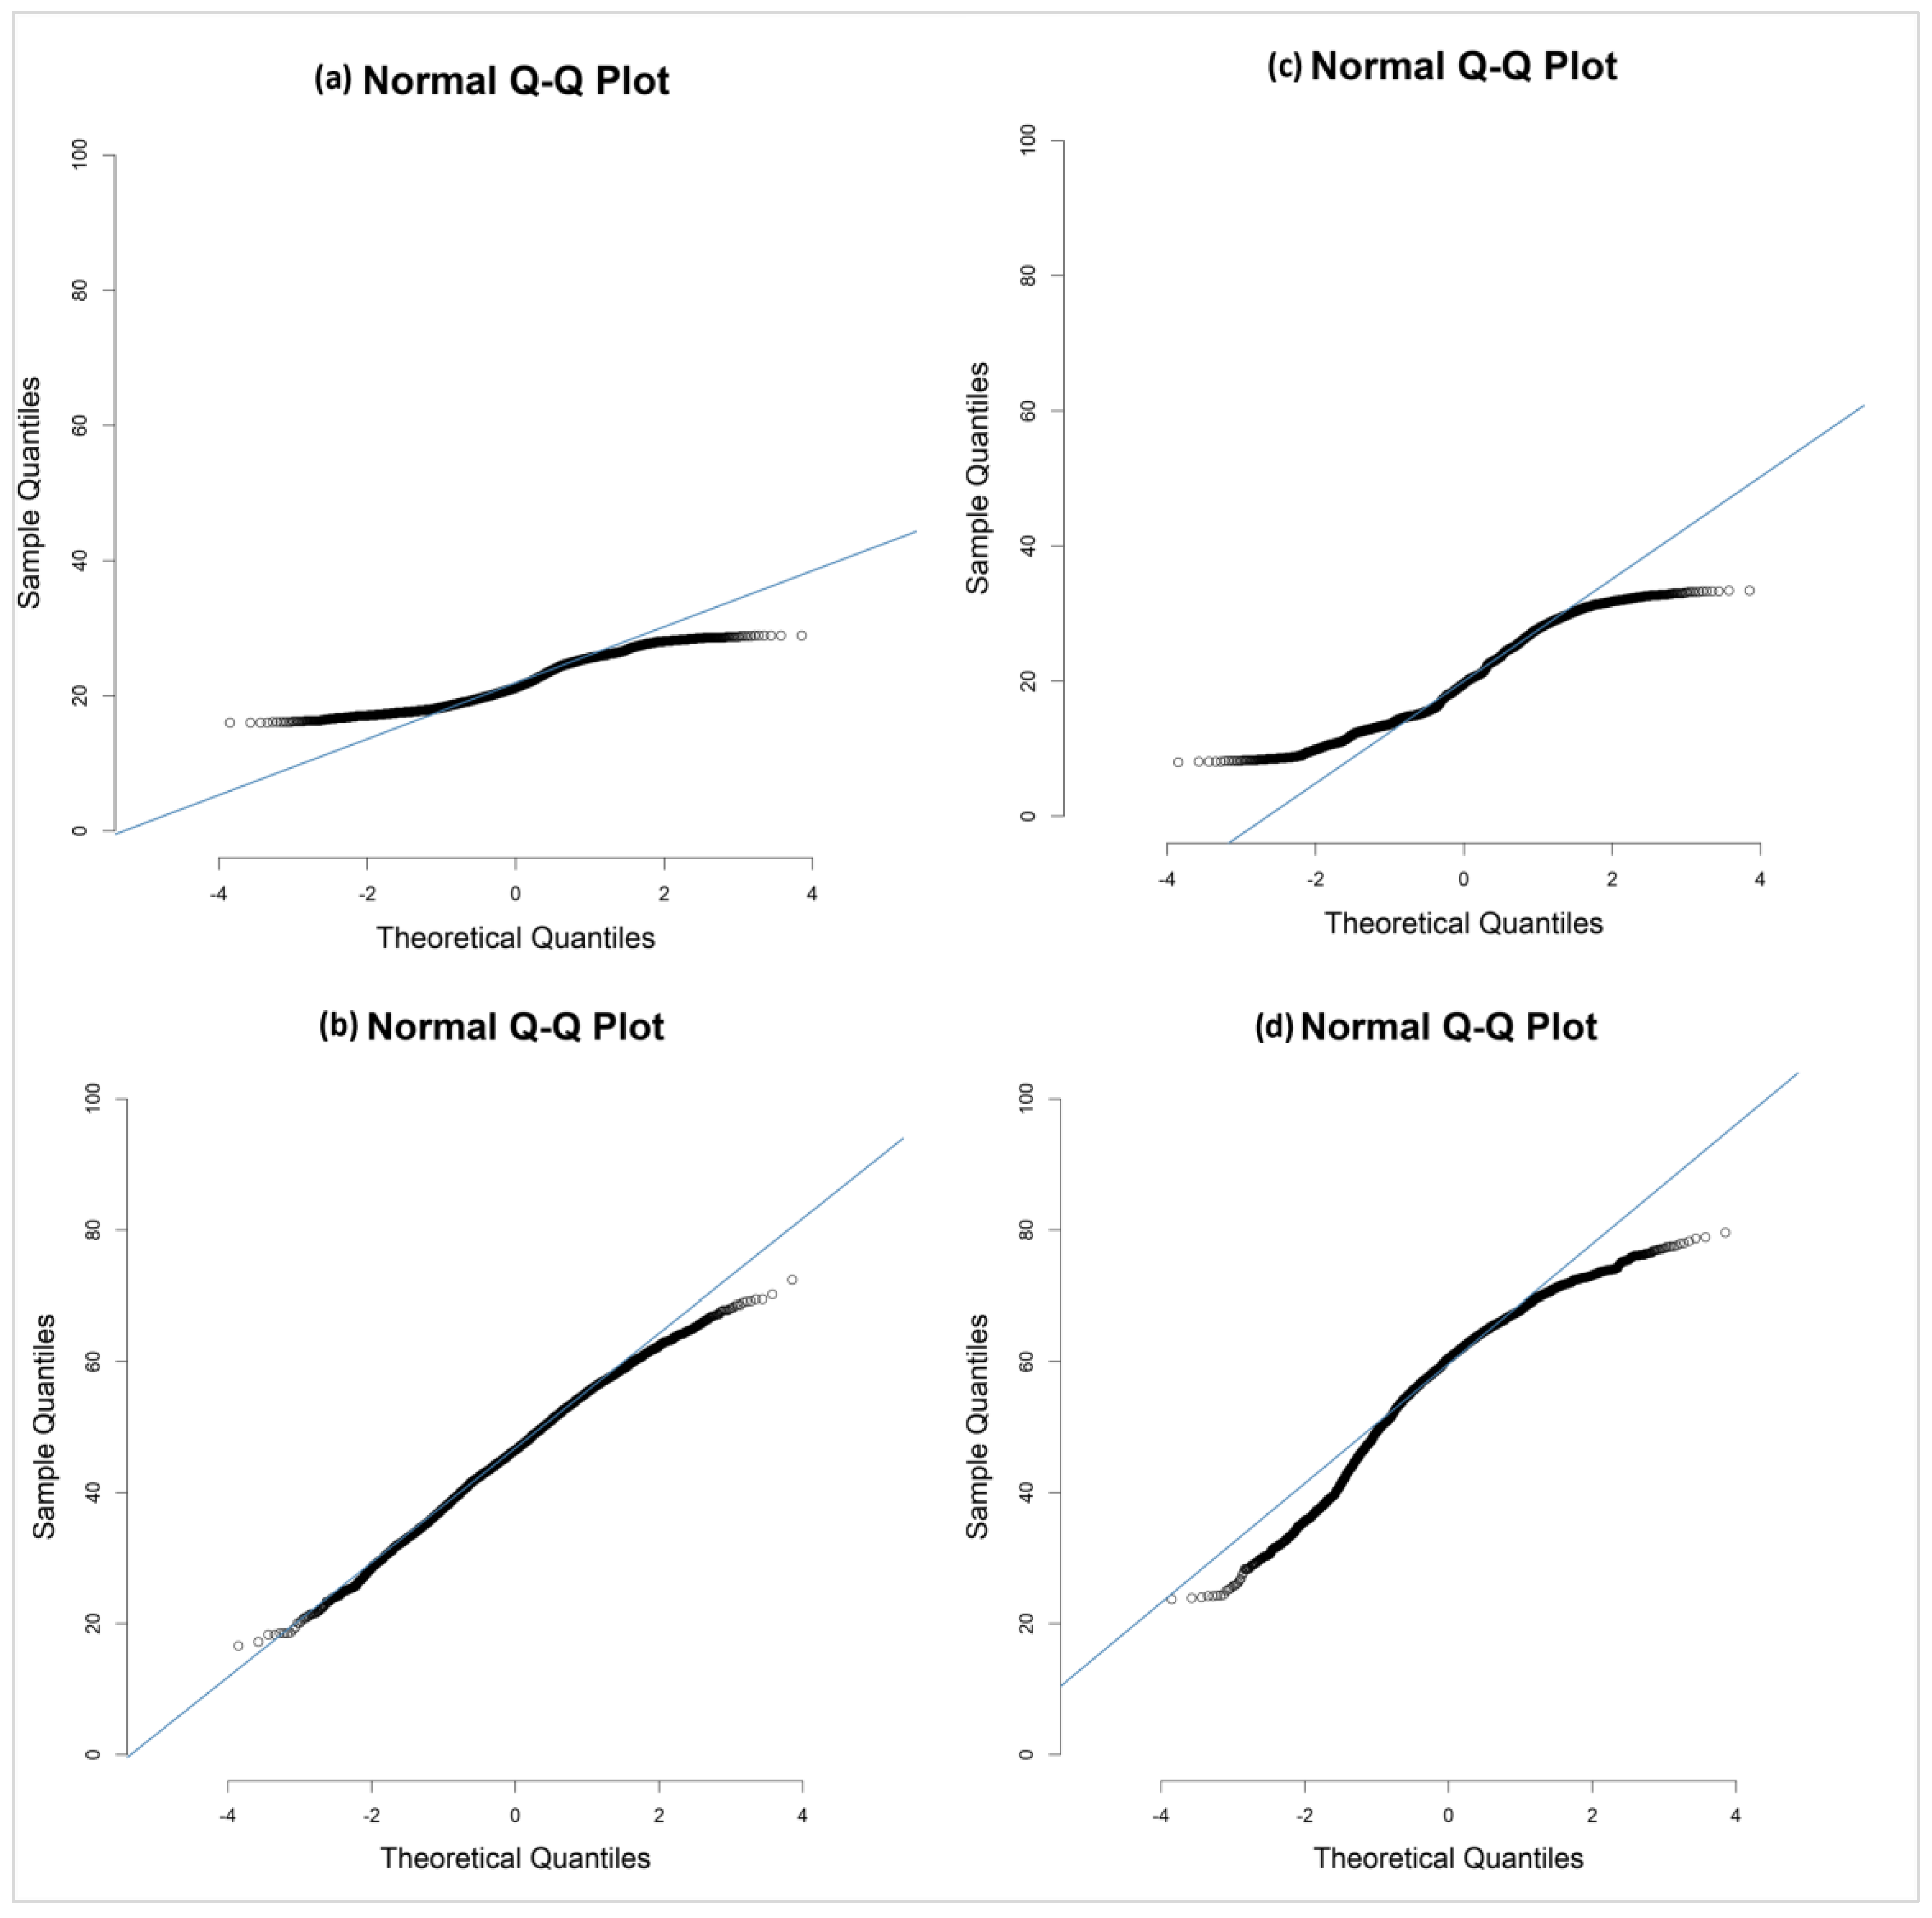
A comprehensive study was conducted to assess the normality of values through the utilization of graphical representations known as Normal Q-Q plots. In our case, Q-Q plots are utilized to compare the humidity distribution in the Delphi Museum and the Church of Acheiropoietos (
Figure 4). Generally, the points in
Figure 4 closely follow the straight line, which indicates that the data are approximately normally distributed. Regarding temperature, a similar distribution of data points is observed in both buildings, but there is a greater deviation at the extremes of the distribution. The increased deviation at the extremes indicates a higher variability in the extreme temperature values. This suggests the possibility of unpredictable and extreme temperature conditions in these buildings, beyond the usual mean values. Regarding relative humidity, differences are observed in the distribution of data points between the two buildings. The Delphi Museum exhibits a distribution of points closely aligned with the line, with minimal deviations at the extremes. This indicates that RH conditions within the museum are more stable and predictable. In contrast, there is a divergence at the extremes of the humidity distribution in the case of the church. This suggests greater variations in relative humidity conditions, rendering them more unstable and potentially less predictable. This could be attributed to factors influencing extreme indoor climatic conditions such as extreme weather phenomena in the outdoor environment. However, it is important to note that although the Q-Q plots offer valuable insights, they do not provide a comprehensive overview of the temperature and relative humidity distributions in the two buildings. Therefore, a more thorough analysis of the internal climate conditions and extreme values follow below.
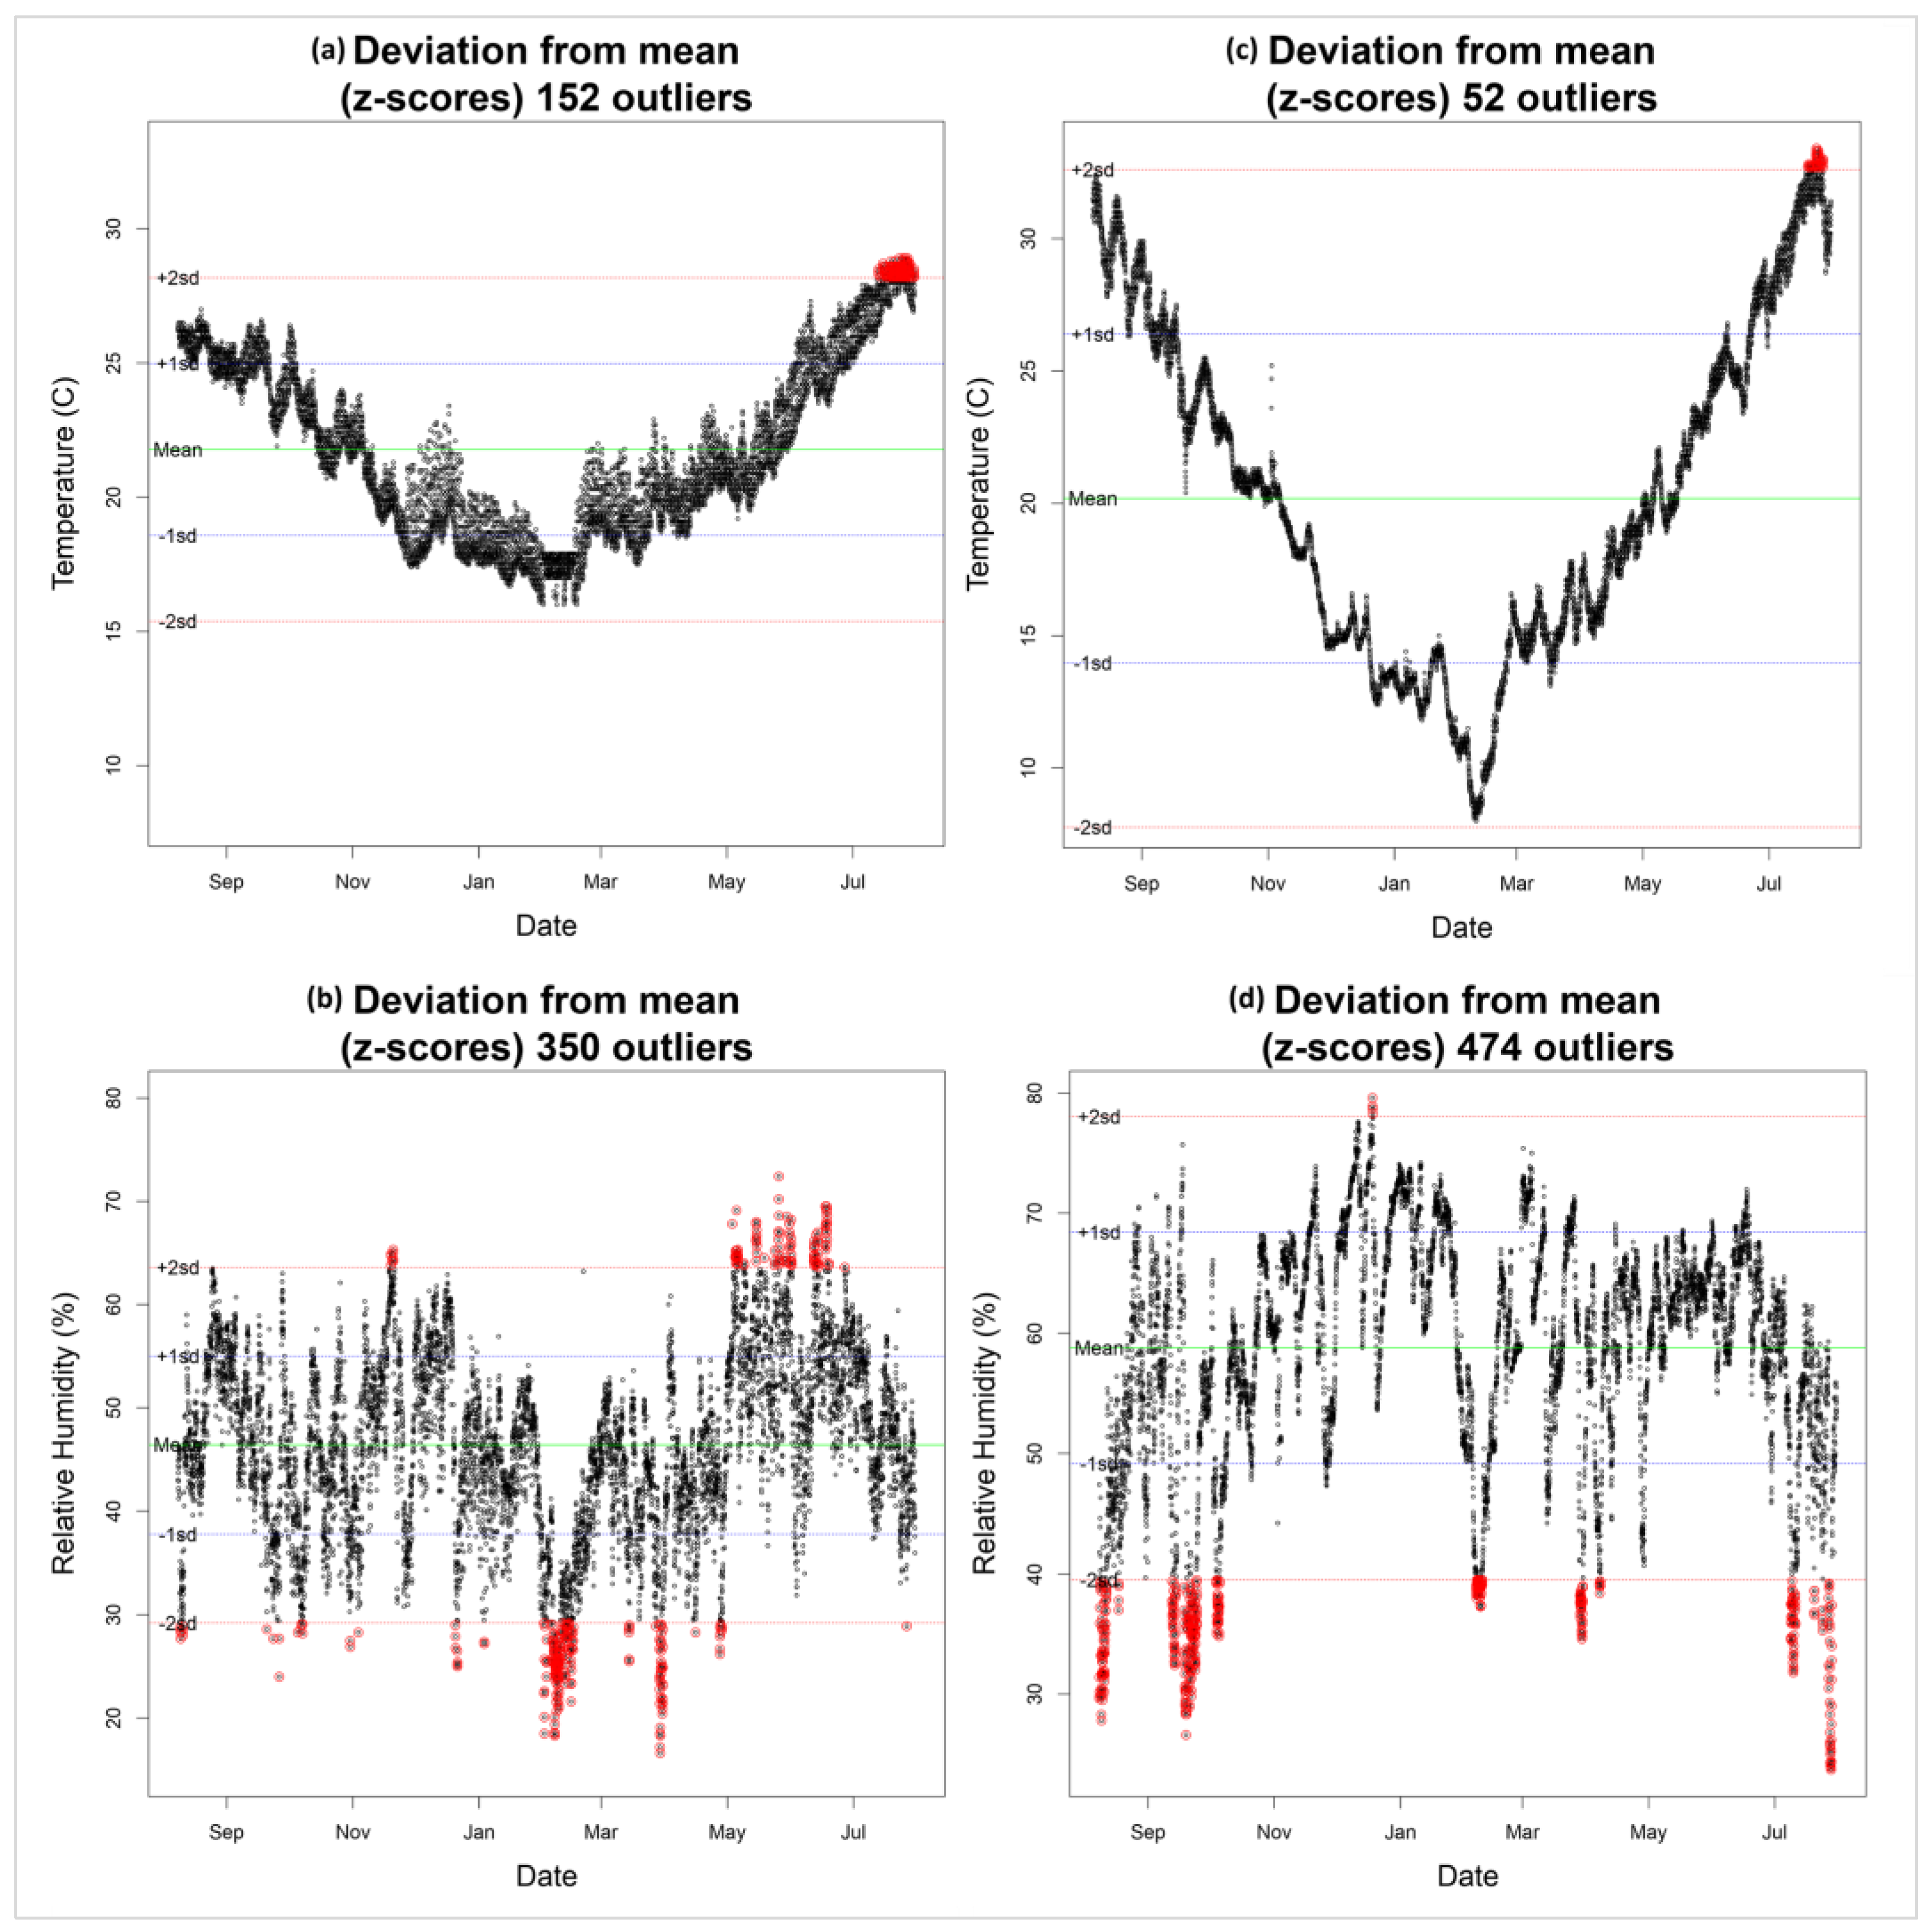
In
Figure 5, “3 × Standard Deviation” and
Z-scores were calculated to estimate the deviation of temperature and relative humidity from the overall mean and identify outliers throughout the entire year. This approach allows for the assessment of the variability or dispersion of the data points around the mean. The identification of outliers signifies cases where the observed values deviate significantly from the expected or average conditions, allowing for a nuanced understanding of climatic dynamics within the studied buildings. The temperature results for the Delphi Museum reveal a notable occurrence of above normal events in July where the temperature markedly surpasses the annual average, marked by 152 outliers. The results for the Acheiropoietos church indicate fewer outliers compared to the museum (52 outliers). However, it is worth noting that these reappear in July. The temperature results suggest that both the museum and the church experience above normal temperature events, particularly in July, where temperatures spike significantly above the yearly average.
Regarding RH, the Museum of Delphi displays a markedly lower average relative humidity compared to the Church of Acheiropoietos. The first records an RH level of 46.4%, while the latter shows 58.8%, signifying a more humid climate. The museum exhibits a total of 350 outliers from the mean RH, with both positive and negative deviations. A series of above-normal values occur during December, May, and June due to positive deviations, resulting from significantly higher humidity compared to the annual average. Conversely, low humidity values appear to be more scattered throughout the year, peaking in February and April. In the second study area, 475 outliers were identified, primarily associated with negative deviations. The majority of extreme events are concentrated in the months of July to October, with fewer occurrences recorded in February and April. This suggests a distinct pattern of humidity variations in the church, with notable differences compared to the museum.
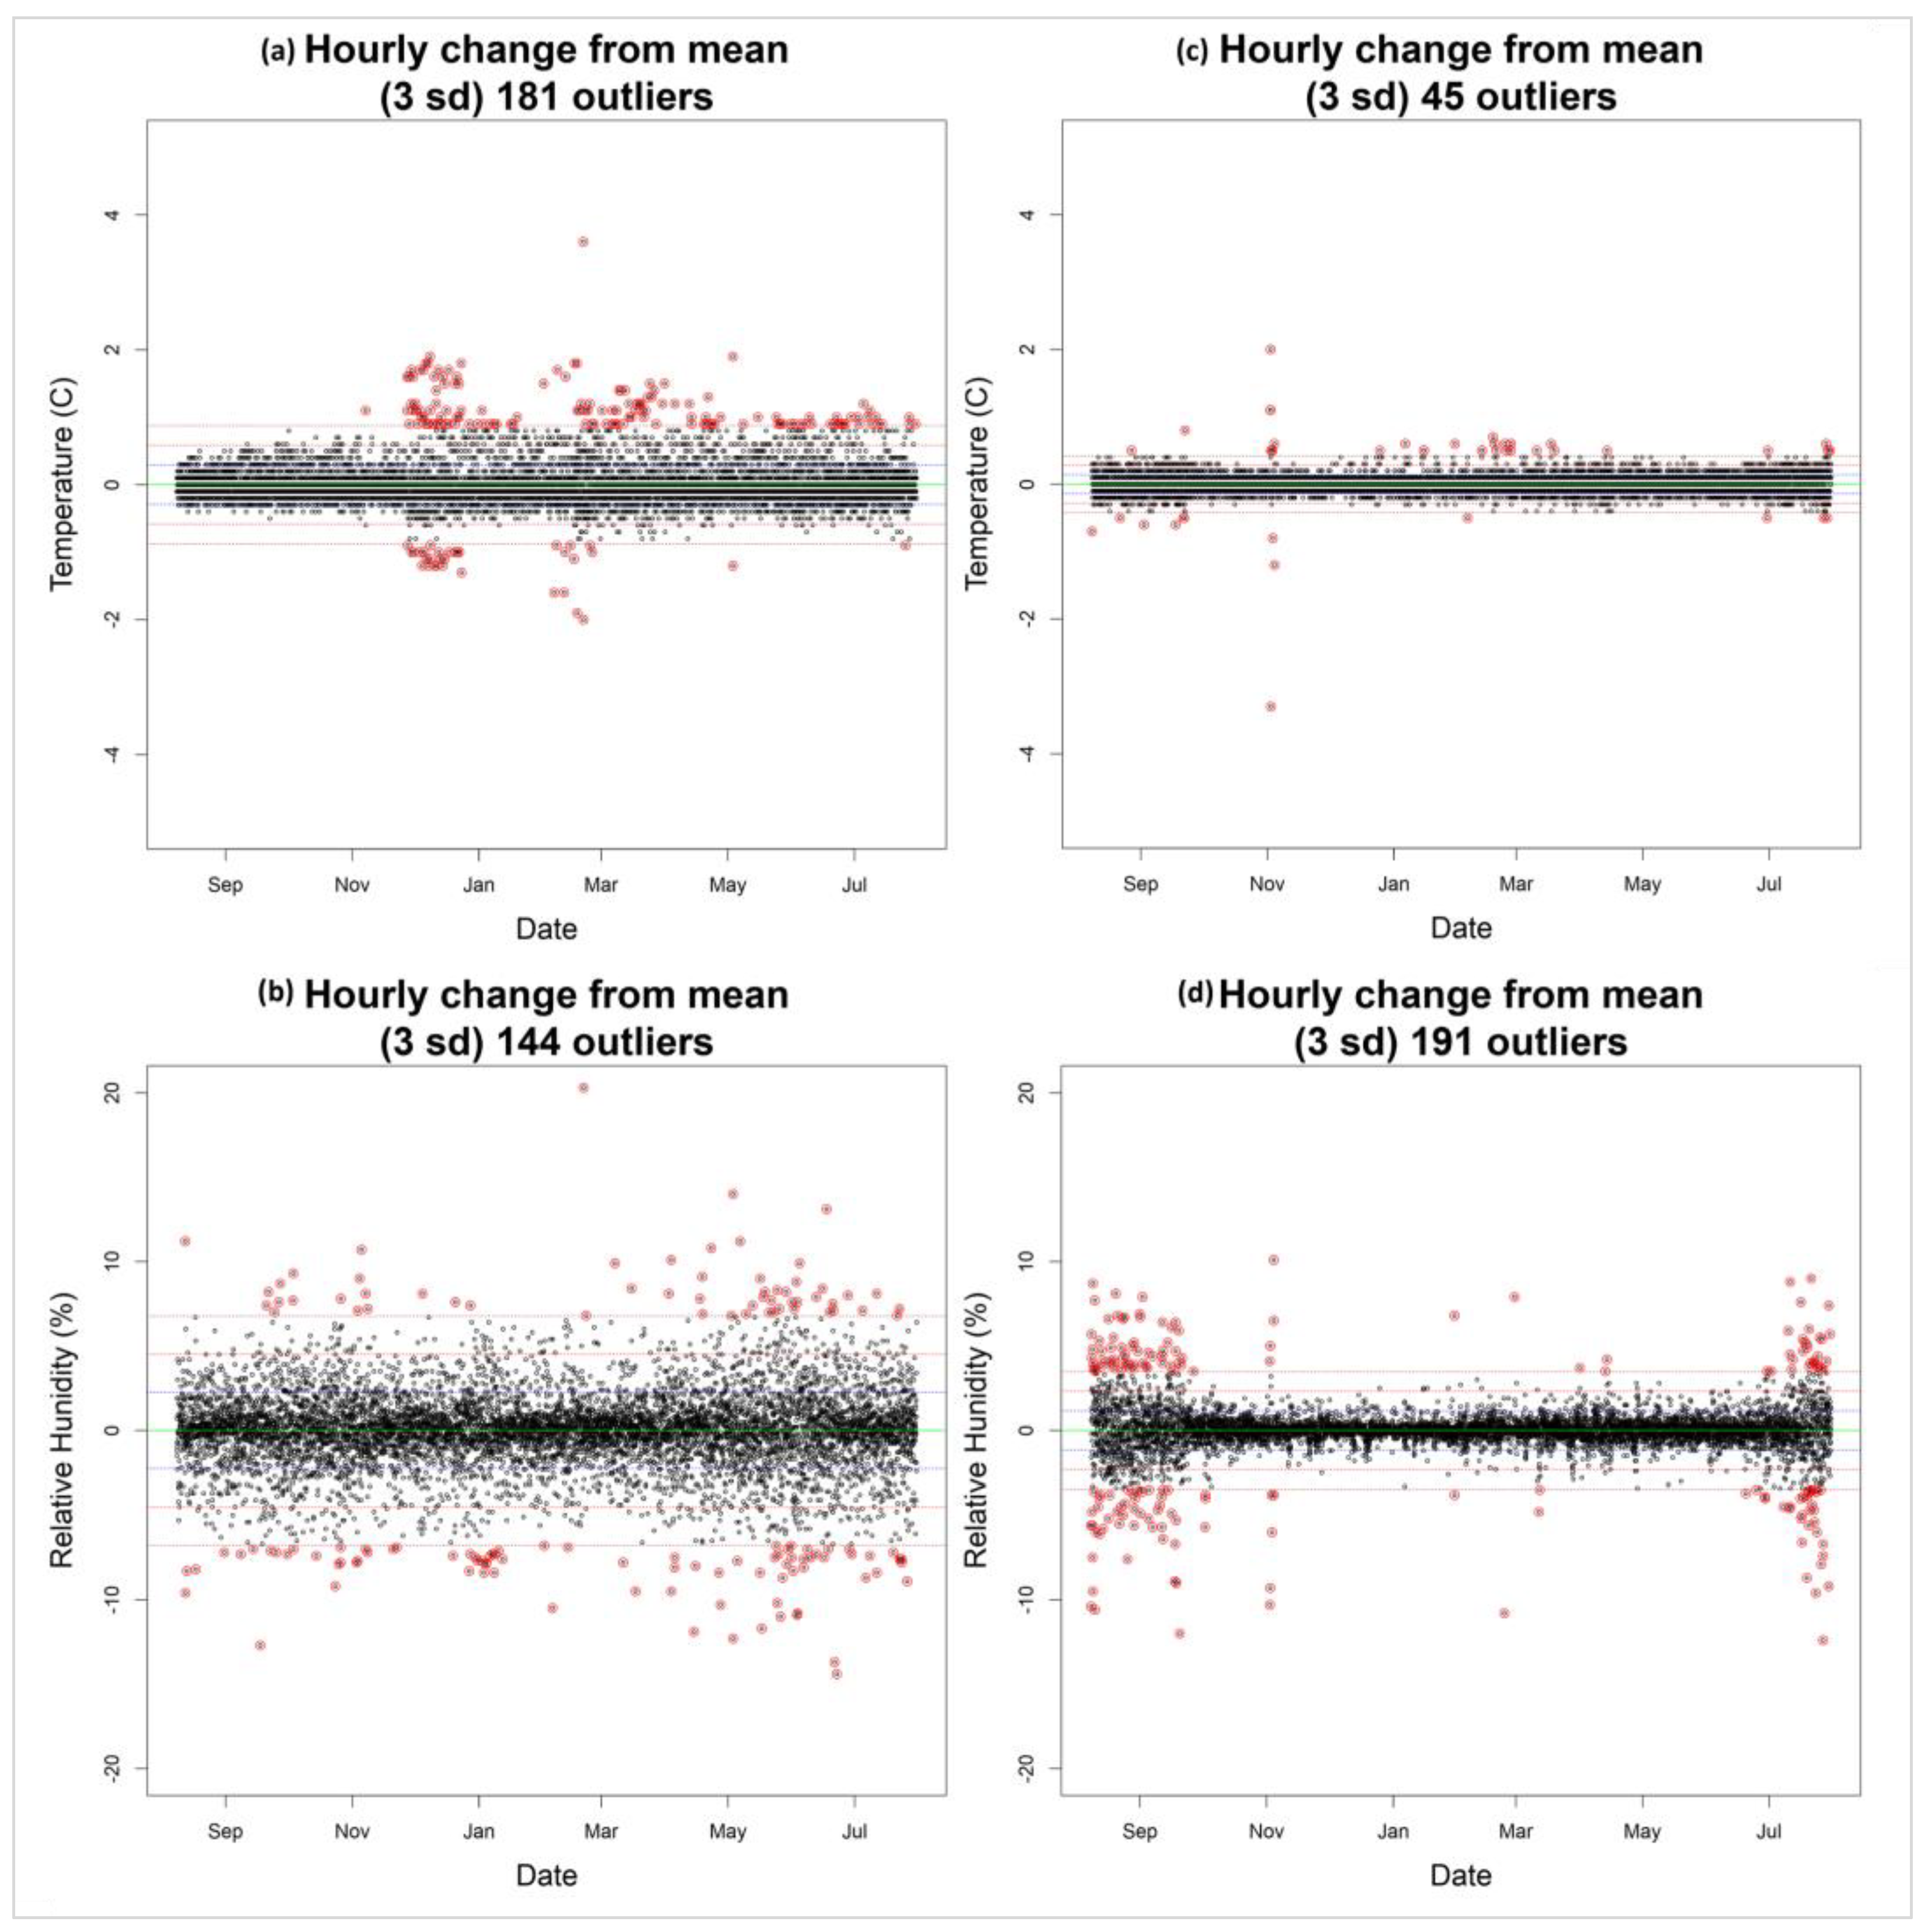
In the subsequent analysis, the hourly observations were compared pairwise, and extreme hourly changes were identified.
Figure 6 illustrates these outliers for both case studies, emphasizing the hourly differences in temperature and RH. In general, the average hourly temperature seemed to be close to zero, suggesting a lack of substantial average deviations. However, a wide variation in the dataset is detected, necessitating a closer, hour-by-hour examination. Examining the results from
Figure 6, specifically for the Delphi Museum, it becomes evident that certain extreme events (181 outliers) occur when comparing hourly temperature data against preceding hours, particularly from December to July, with a peak in December. The largest percentage of the extreme hourly events related to temperature increase occur between 8:30 and 9:30 am, mainly from November to March. This corresponds to the observations in the heat map (
Figure 3), indicating a daily temperature rise during the morning hours. It is clear that fewer outliers were recorded in the church (45 outliers), mainly in the month of November. Similarly, to temperature, the RH average of the hourly difference was close to zero, 144 outliers beyond the three-standard-deviation mark in the museum were found, and 191 outliers in the church were found, indicating a significant variability in humidity levels. In the museum, these outliers are scattered without following a specific pattern, suggesting abrupt fluctuations in humidity throughout the year. Conversely, for the church, it seems that most outliers are recorded during the months of July to September, implying specific periods of pronounced humidity variations. Overall, the deviations from the mean are more scattered in the museum compared to the church, designating those environmental conditions, such as temperature and humidity, as more “unstable” in the museum.
3.2. Temporal Analysis of Indoor and Outdoor Thermo-Hygrometric Conditions. How Could Changes in Outdoor Climate Affect the Indoor Enviromental Conditions of the Buildings under Study?
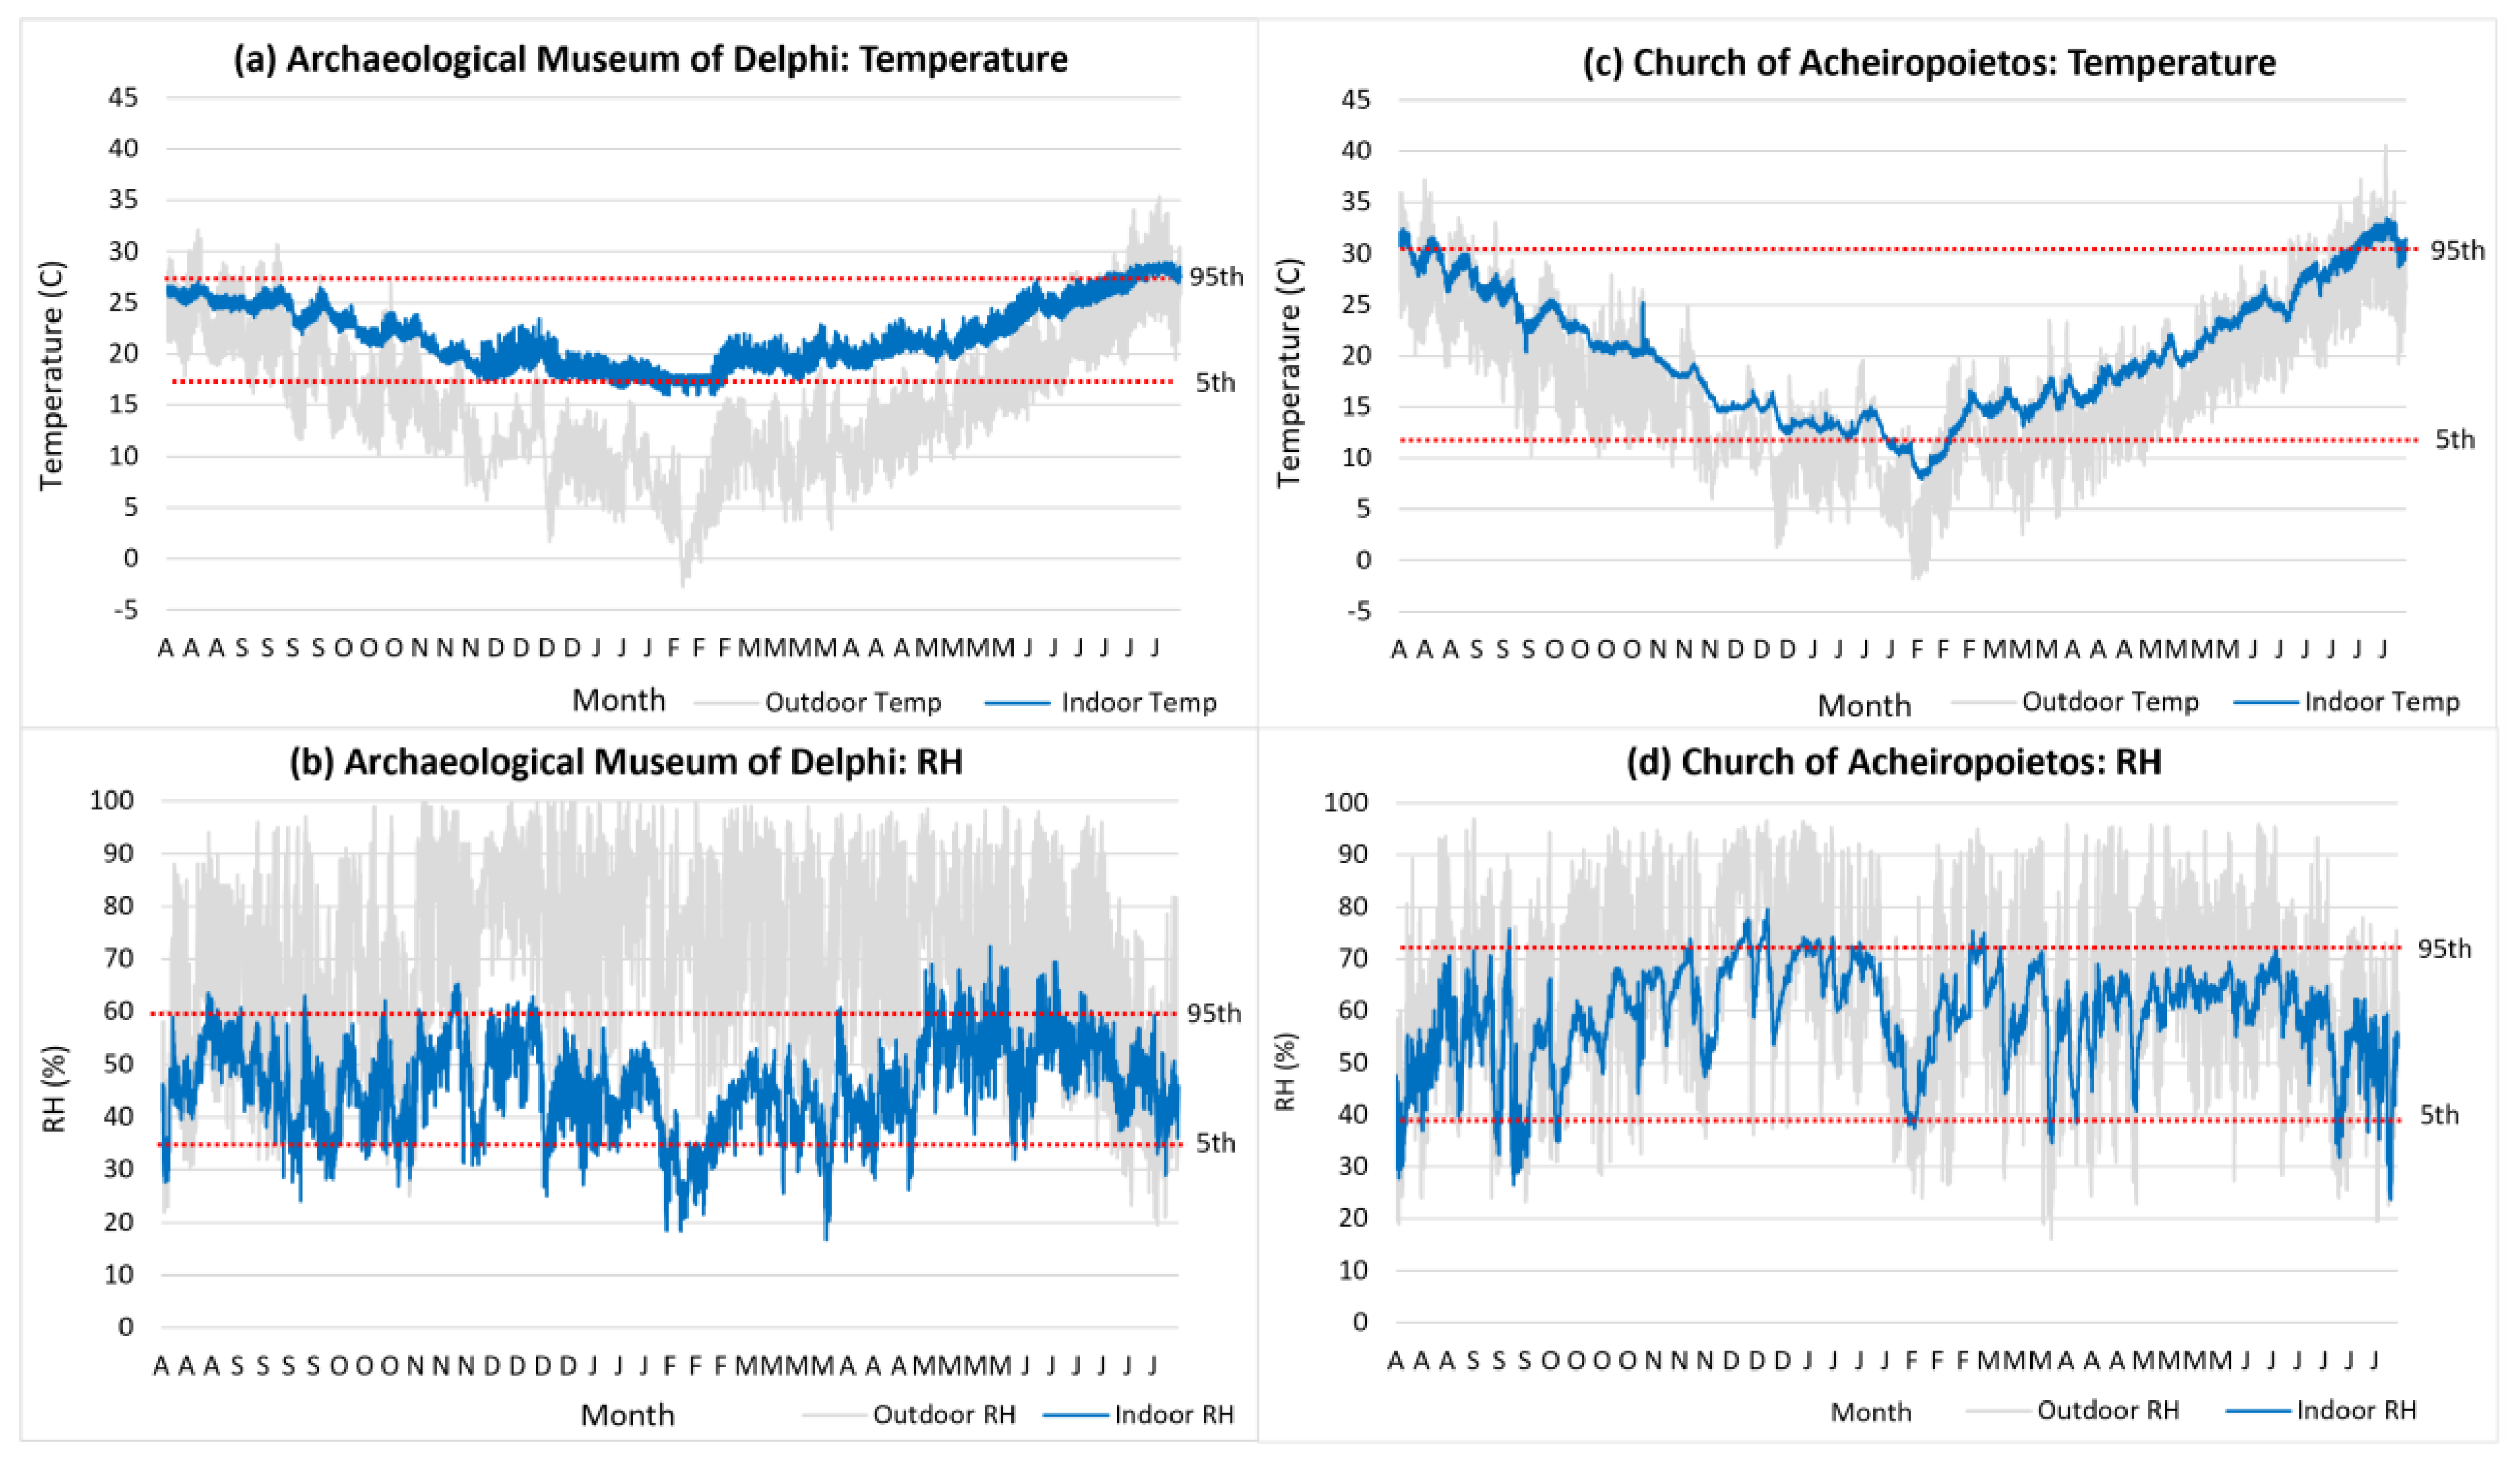
To gain a holistic insight into a building’s hygrothermal behavior, it is crucial to comprehend not only its indoor microclimate but also its interaction with the outdoor environment. Therefore, hourly variations of both internal and outdoor temperatures were examined for both sites (
Figure 7).
Overall, it was observed that the indoor temperature trends align with the outdoor temperature trends. The internal temperature of the Archaeological Museum of Delphi and the Church of Acheiropoietos exhibit average fluctuations of 6.5 and 3.3 °C higher than the outdoor temperature, respectively. This suggests that the average temperature of the church is relatively closer to the outside temperature compared to the other building, given the absence of climate control (HVAC systems). In the summer, the museum appears to be cooler compared to the outdoor environment, remaining below 30 °C even when outdoor temperatures reach 40 °C. However, without an HVAC system, the indoor temperature of the church seems to steadily rise with external temperatures, sometimes reaching 35 °C. Further insights into the thermal characteristics of each building are provided by temperature percentiles. For the museum, the 95th percentile temperature is 27 °C, indicating the upper range of extreme temperatures, while the 5th percentile is 17 °C, representing lower extreme temperatures. In contrast, the church exhibits a broader temperature range, with a 95th percentile temperature of 30 °C and a 5th percentile temperature of 12 °C. The church’s wider temperature range reflects its heightened sensitivity to extreme climatic conditions.
Contrarily, the indoor relative humidity (RH) trend in the Archaeological Museum of Delphi does not exhibit any similarity to the trend of outdoor RH. Additionally, the average indoor RH levels of the Archaeological Museum of Delphi and the Church of Acheiropoietos fluctuate, on average, by 23.2 and 8.4 units, respectively, lower than the outdoor RH. For the Archaeological Museum of Delph, the 95th percentile RH is 60%, with the 5th percentile at 32%. For the church, the 95th percentile RH is 72%, and the 5th percentile is 39%. It is observed that the church exhibits a wider range of humidity levels compared to the museum. The fact that the church has a higher humidity range may have significant implications for the preservation of objects and materials. These RH percentile values provide additional information to the understanding of each building’s hygrothermal behavior, highlighting the variability in humidity conditions and emphasizing the need to consider both indoor and outdoor factors in the preservation of cultural heritage sites.
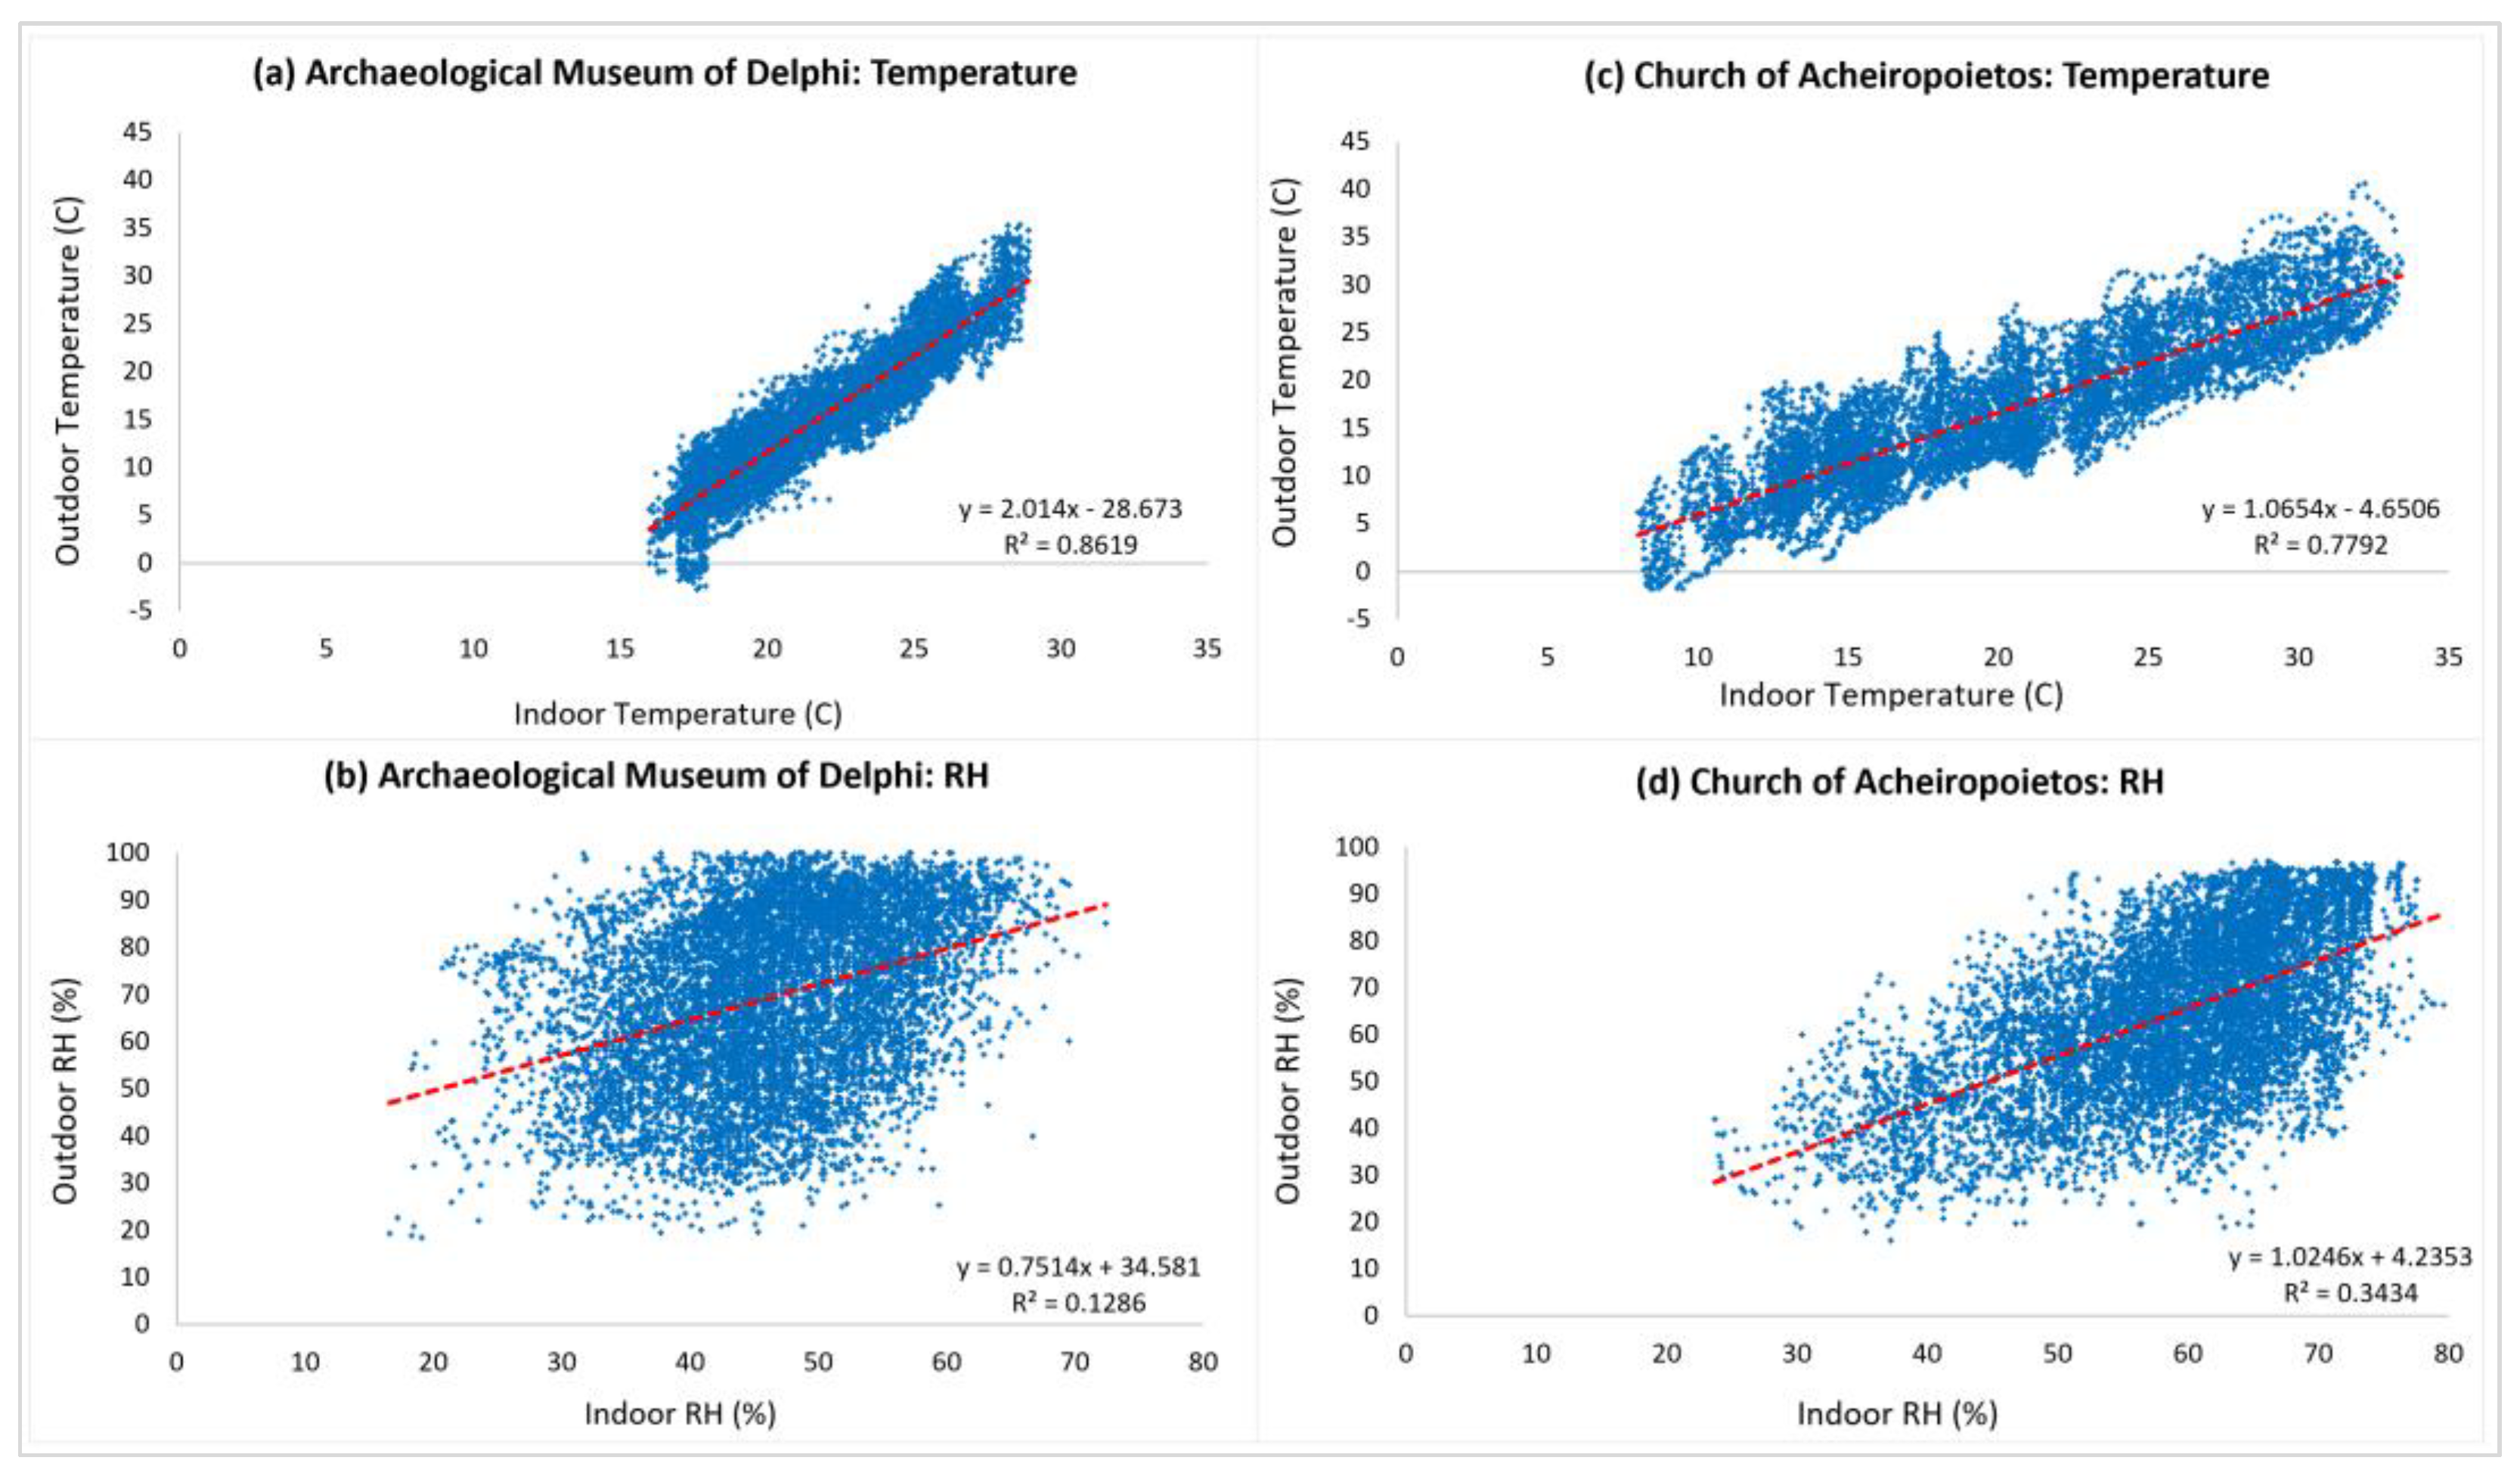
Figure 8 displays scatter plots between indoor and outdoor temperature for the Archaeological Museum of Delphi (
Figure 8a,c) and for the Church of Acheiropoietos (
Figure 8b,d). These plots were constructed with the aim of anticipating potential changes. The R-value represents the correlation strength and direction between indoor and outdoor temperatures, offering valuable insights into the thermal dynamics of each building. An R-value close to zero implies a minimal influence of the independent variable (outdoor temperature) on the internal temperature (dependent variable). Specifically, both buildings under study indicate a strong positive correlation between indoor and outdoor temperature. The R-value is 0.861 for the museum and 0.7792 for the church, indicating a significant tendency for the indoor temperature to increase when the outdoor temperature increases.
The equivalent RH R-values for the museum and the church are 0.1286 and 0.3434, respectively. The R-value of 0.1286 for the Delphi Museum indicates a weak correlation, suggesting minimal influence of outdoor conditions on indoor humidity, while the 0.3434 value found for Acheiropoietos shows a slightly stronger positive correlation, and a more pronounced tendency for indoor humidity to increase with the respected outdoor increase. Overall, the results highlight a variety in the hygrothermal behavior of both buildings, with a strong (weak) positive correlation between indoor and outdoor temperatures (relative humidity).
3.3. Heritage Microclimate Risk (Historical) and Predicted Damage Risk Indices
It is well-known that unsuitable microclimate conditions can lead to the deterioration, discoloration, or other forms of degradation of antiquities and artworks. Thus, the Heritage Microclimate Risk and Predicted Damage Risk indices were used in order to assess the appropriateness of microclimates and to evaluate the risk of potential damage. According to the directors and conservators of the antiquities at the Archaeological Museum of Delphi, regular checks are carried out on both the assets and values housed within, as well as the preservation conditions of the buildings themselves. To date, no signs of deterioration have been discovered in either museum. For the Church of Acheiropoietos, we considered that the assets of the values and the paintings have adapted to the microclimatic conditions of their environment. For the reasons mentioned above, both HMR
hs.low and HMR
hs.high were computed from time series collected from the environmental monitoring sensors in the museums rather than from standard reports [
42].
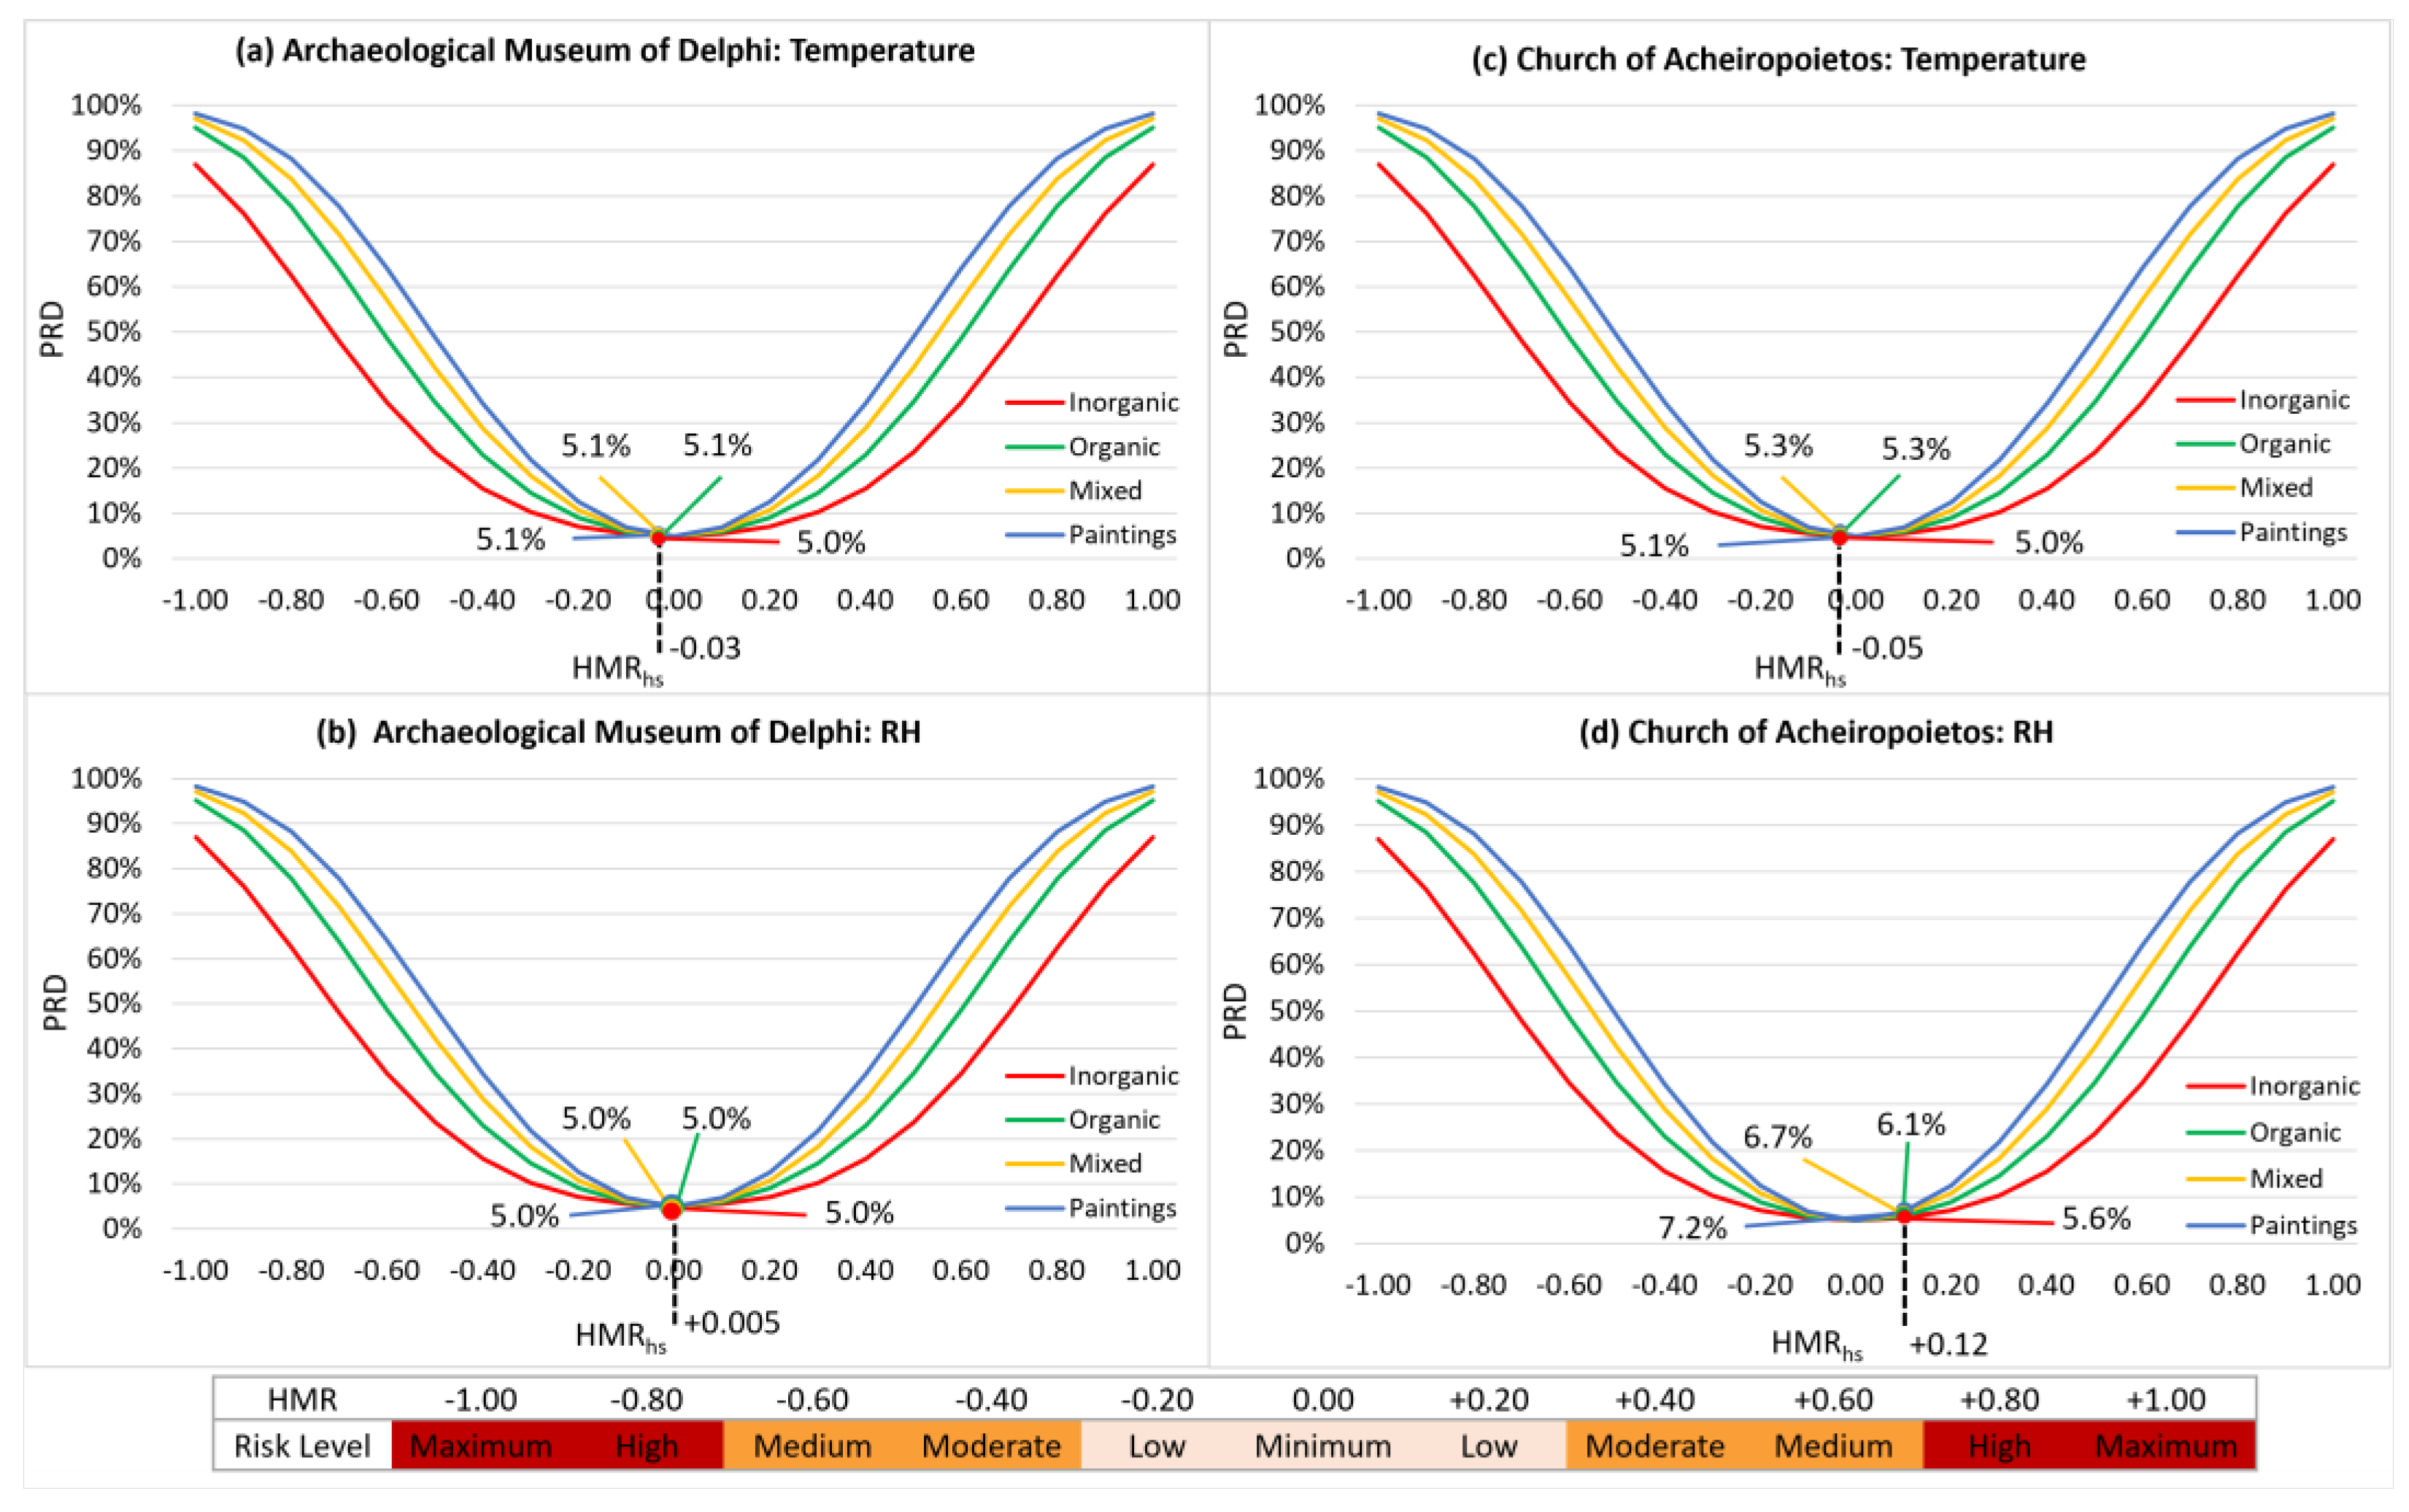
Figure 9 depicts the results of the HMR
hs and PRD indices which were applied for inorganic, organic, mixed, and painted materials/objects because these materials are predominant in the two buildings under study. The results of HMR
hsenv and HMR
hsfluc for the temperature parameter in the Archaeological Museum of Delphi are, respectively, −0.06 and +0.11, indicating a minimum microclimate risk. Consequently, as per
Figure 9, the total HMR
hs index value of −0.03 corresponds to a potential damage probability of 5.0%, 5.1%, 5.1%, and 5.1% for inorganic, organic, mixed, and painted materials/objects, respectively, suggesting a reduced probability of damage. Similarly, for the Church of Acheiropoietos, the HMR
hsenv is −0.1 and the HMR
hsfluc is 0.0 leading to an HMR
hs index = −0.05. Additionally, there is a reduced probability of damage as well: 5.0%, 5.3%, 5.3%, and 5.1%. As in the case of the Archaeological Museum of Delphi, the Acheiropoietos Church’s negative values (−) for the HMR
hs index indicate that the average temperatures are closer to the lower limit of the time series data. This could suggest that in both cases, the risk is more linked to low temperatures rather than high temperatures.
In the case of RH, the HMR
hs index for the museum is almost zero (+0.005) (HMR
env historical = 0.03 and HMR
fluc historical = 0.005) and the PRD index is set at 5% because according to the literature [
42], no indoor environments is entirely free from the risk of damage for the conservation of any type of material. The slightly higher HMR
hs index of +0.11 (HMR
env historical = 0.22 and HMR
fluc historical = 0.0) attributed to the RH in the Acheiropoietos Church appears to primarily impact the mixed materials and the paintings adorning the church’s surroundings, indicating predicted a risk of damage of 7.2% and 6.6%, respectively. Overall, the indoor microclimate of the rooms under study at the Archaeological Museum of Thessaloniki and Delphi can guarantee the preventive conservation of the antiquities hosted there.
4. Discussion
The overarching goal of museums is to host, preserve, and safeguard cultural and historical content, including the antiquities found within them. Undoubtedly, environmental monitoring is a key activity to evaluate both the quality of indoor spaces and the preservation of the artworks hosted in those historical building [
16]. Recognizing the rich cultural heritage of Greece and the importance of its protection and transmission to future generations, this research focuses on studying the indoor climates of a modern museum and an ancient church in Greece. The objective is to examine the hygrothermal behavior of the buildings under study and propose a customized methodology for the early detection of extreme conditions, with the ultimate goal of safeguarding cultural heritage in the face of a constantly changing climate.
The results reveal a normal temperature behavior of the two buildings, with higher temperatures recorded during the summer months and lower temperatures during the winter. Nevertheless, the absence of HVAC systems in the Church of Acheiropoietos leads to a boarder range of temperatures (8.0 to 33.4 °C) compared to Room I of the Delphi Museum (16.0 to 28.2 °C), where the climate is controlled with HVAC systems. Additionally, a daily temperature increase was observed around 9 p.m. in the museum room, with temperatures remaining at higher levels until the early afternoon. This is because museums, beyond their crucial role in preserving cultural heritage, aim to provide optimal conditions for their visitors [
43]. However, Camuffo et al. [
44] conducted environmental monitoring in four European museums and reported that although such a practice is acceptable for human habitation, it can be dangerous for artifact preservation due to changes in the temporal and spatial gradients of temperature and RH. To address this issue, the Archaeological Museum of Delphi and some other museums have implemented the use of showcases, thereby enhancing environmental conditions. Regarding the outliers, both buildings exhibited a similar pattern with significant instances of above normal temperatures, especially in July, with temperatures significantly surpassing the overall annual average. This suggests that there are more unstable and potentially less predictable temperature conditions during this month in both buildings, indicating the need for improved temperature control. Additionally, regarding relative humidity (RH), the Delphi Museum maintains a significantly lower average humidity (46.4%) compared to the church (58.8%), which is characterized by a more humid climate. Extreme events in the museum are associated with both negative and high RH values, in contrast to the church where they are mainly linked to low RH levels. These variations may be attributed to solar heating, local microclimate characteristics, and a building’s construction materials, especially in the cases where there are no heating and cooling systems as in the case of the church [
25,
36]. As mentioned in the methodology, the museum’s Room I is the first space at the museum entrance and is affected by frequent door openings, as well as the frequent congregation of tourists before dispersing into the subsequent rooms. These were the primary concerns raised by the museum authorities, who sought the analysis of the climate in this area. Indeed, Ferdyn-Grygierek et al. [
15], in their study for hygrothermal risk in museums buildings, showed that the cooling system was able to compensate for an increase in temperature caused by the presence of a large group of people, but was not able to maintain constant RH even nine hours after visitors had left. In general, the comparison of hourly temperature values indicated that the average difference in hourly temperatures seems to be close to zero, suggesting a lack of significant deviations for both buildings. However, further analysis revealed some deviations from the mean in both examined parameters and buildings. Regarding the museum, heating and cooling systems, along with the accumulation of visitors and the impact of the door, can contribute to these extreme events. On the other hand, despite the wider temperature range of the church with more extreme values, fewer extreme events were recorded in hourly fluctuations, indicating the resilience and adaptability of the architectural features of the church. Aste et al. [
16], in their work on microclimatic monitoring in the Milan Cathedral, found similar results and explain that the high inertia of the cathedral’s envelope allows the maintenance of almost stable temperature values during daily cycles and causes gradual and mitigated changes in relation to external conditions throughout the seasons.
The examination of the relationship between internal and external thermo-hygrometric conditions revealed that both buildings exhibit a strong response to changes in external temperature while showing a less pronounced reaction to variations in external humidity. This suggests that internal microclimatic conditions are directly influenced by outdoor climatic conditions, raising concerns about the potential impact of future climate change. The results of HMR
hs and PRD indices show that both buildings are characterized by minimum microclimate risk for both temperature and RH, leading to a reduced probability of damage for all materials studied (inorganic, organic, mixed, and paintings). Nonetheless, the slightly higher HMR
hs index resulting from RH in the church of Acheiropoietos appears to primarily impact the mixed materials and the paintings that adorn the church’s surroundings. Therefore, it would be useful to emphasize the microclimatic conditions of the Church of Acheiropoietos due to the presence of more sensitive materials. Recognizing the vulnerability of objects to projected climate change in historical buildings, it is generally suggested that the indoor microclimate be constantly monitored along with suitable cleaning conditions, proper ventilation, and natural ventilation, and often opening doors and windows [
21] Therefore, as we move forward, it becomes crucial to not only address the immediate concerns, but also to establish a framework for continuous monitoring and adaptive conservation practices to ensure the long-term resilience of the Church of Acheiropoietos against the potential challenges posed by a changing climate.
5. Conclusions
In the present research, a one-year monitoring campaign was conducted in order to investigate the indoor climate of a museum and a historical building in Greece. This study proposes a new real-time data analysis method for detecting indoor extreme temperature and relative humidity values, aiming for timely warnings. To assess the suitability of the microclimate within buildings and to estimate the potential risk of damage to cultural artifacts, the HMRhs and PRD indices were applied. In addition to the findings mentioned above, this research emphasizes the significance of long-term monitoring in understanding the seasonal variations and trends in indoor microclimates. The year-long study allowed a comprehensive assessment of how temperature and humidity fluctuate during different seasons, shedding light on patterns that might not be apparent in shorter monitoring periods. This extended monitoring period enhances our ability to develop more robust preservation strategies that account for the nuanced interplay of environmental factors.
Overall, this study underlines the importance of microclimate monitoring in preserving artifacts within museums and historic structures. It enables the prompt identification of extreme temperature and humidity values, allowing for effective intervention. The impact of the outdoor environment on indoor climatic conditions persists, even with HVAC systems in place. Notably, the role of building materials and architecture are crucial in mitigating sudden fluctuations. Looking ahead, the study highlights the potential significant impacts of future climate change on the internal environment of museums and historical buildings, presenting new challenges. Real-time data analysis provides valuable insights for artifact preservation, enabling proactive adaptation to environmental challenges. The proposed approach facilitates a thorough understanding of climate change effects on indoor conditions, empowering museums to implement targeted measures for preservation.
Furthermore, our study advocates for the integration of advanced technologies, such as sensor networks and machine learning algorithms, to further refine the real-time data analysis process. By leveraging these technological advancements, museums and historical buildings can move beyond basic monitoring and prediction to proactive intervention. This approach involves not only identifying extreme values but also predicting potential future fluctuations based on historical data. Implementing these technologies aligns with the broader trend of incorporating innovative solutions in heritage conservation, ensuring a more dynamic and adaptive approach to artifact preservation.
We intend to continue with microclimate monitoring within museums and historical buildings and enhance the methodology for early detection of extreme values. Simultaneously focusing on future climate conditions and providing detailed information to museum authorities constitutes a crucial aspect in ensuring the effective protection of cultural artifacts.


