Abstract
Identifying a painting’s pigment palette is crucial for comprehending the author’s technique, as well as for evaluating the degradation of the materials. This paper investigates the stratigraphy and pigments distribution of a 16th-century painting from the Uffizi Galleries collection. Firstly, we obtained compositional information through the cross-sectional analysis of samples using scanning electron microscopy. Secondly, we performed elemental mapping using macro-X-ray fluorescence followed by reflectance imaging spectroscopy. The painting image cube was analysed using the spectral correlation mapping (SCM) classification algorithm to accurately identify the distribution and composition of the pigment mixtures.
1. Introduction
Analysing an artist’s pigment palette is a key aspect in heritage painting studies. It not only sheds light on the author’s creative process but also helps assess the conservation status of the materials, enabling informed decisions on the most appropriate restoration strategies. Chemical analysis can be used to identify painting materials at the stratigraphic level when sampling is possible. However, studying fragments only provides information on the extraction area, which may not be representative of the entire surface. Non-invasive approaches, on the other hand, may not always provide comprehensive information on the inner layers, especially when optically opaque materials prevent the penetration of the radiation used as a probe. A commonly used analysis protocol involves the combined application of imaging techniques that profitably integrate different types of chemical information to analyse large areas of paintings without the need to sample. Elemental mapping by macro X-ray fluorescence (MA-XRF) is typically combined with reflectance imaging spectroscopy (RIS) [1,2]. MA-XRF produces elemental distribution maps of the analysed area [3,4]. RIS is based on the detection of spectral features determined by electronic or vibrational transitions in the visible infrared (Vis-IR) spectral range [5]. Multivariate statistical (MVS) methods [6,7] are used to analyse RIS data and extract meaningful information. These methods are applied to reduce the dimensionality of image cubes and identify characteristic reflectance spectra. The two most frequently used MVS methods for pigment mapping are spectral image classification and spectral unmixing. Spectral angle mapping (SAM) [8] and spectral correlation mapping (SCM) [9] are algorithms that fall under the former category. Both algorithms classify pigments based on the spectral similarity between a reference spectrum and the target spectra in the image cube. The reference spectrum, representing the unique spectral signature of the pure components, is called endmember. Internal endmembers are extracted from the image cube of the painting, while external endmembers are obtained from samples of known composition. Both the SAM and SCM algorithms produce pigment maps for each pigment, displaying their spatial distribution across the painting.
This paper reports on the analysis of a 16th-century painting belonging to the Uffizi Galleries (Florence). The painting is notable for its rich use of colour and intricate layering, which may be concealing a second painting beneath the visible depiction of the Holy Family. To enhance our understanding of the artist’s technique and production, and to conduct an informed conservation intervention, it is essential to identify and map the pigments used and to study the pictorial stratigraphy. This information is also crucial to the accurate interpretation of future analyses aimed at uncovering the hidden painting.
Micro-sampling was initially carried out to verify the presence of the underlying pictorial layer. Therefore, the collection of micro-fragments was exploratory and based on raking light observation of the surface morphology, which suggested the presence of covered paint brush strokes. The fragments were cross-sectionally analysed using a scanning electron microscope equipped with an energy dispersive spectrometer (SEM-EDS) [10,11]. Based on the stratigraphic information, three areas of the painting were selected for MA-XRF scanning. The results from MA-XRF and SEM-EDS were cross-referenced, focusing solely on the superficial layers pertaining to the visible depiction. This enabled us to form an initial hypothesis about the pigments used. The entire painting was then scanned with a multispectral scanner and the SCM algorithm was applied to the image cube to identify and map the pigments of the Holy Family. The selection of the external endmembers was based on the results of XRF and SEM-EDS. The resulting SC maps were used to characterise the pigment mixtures for each figurative element of the Holy Family, with a focus on the overlapping areas.
2. Materials and Methods
2.1. Case Study
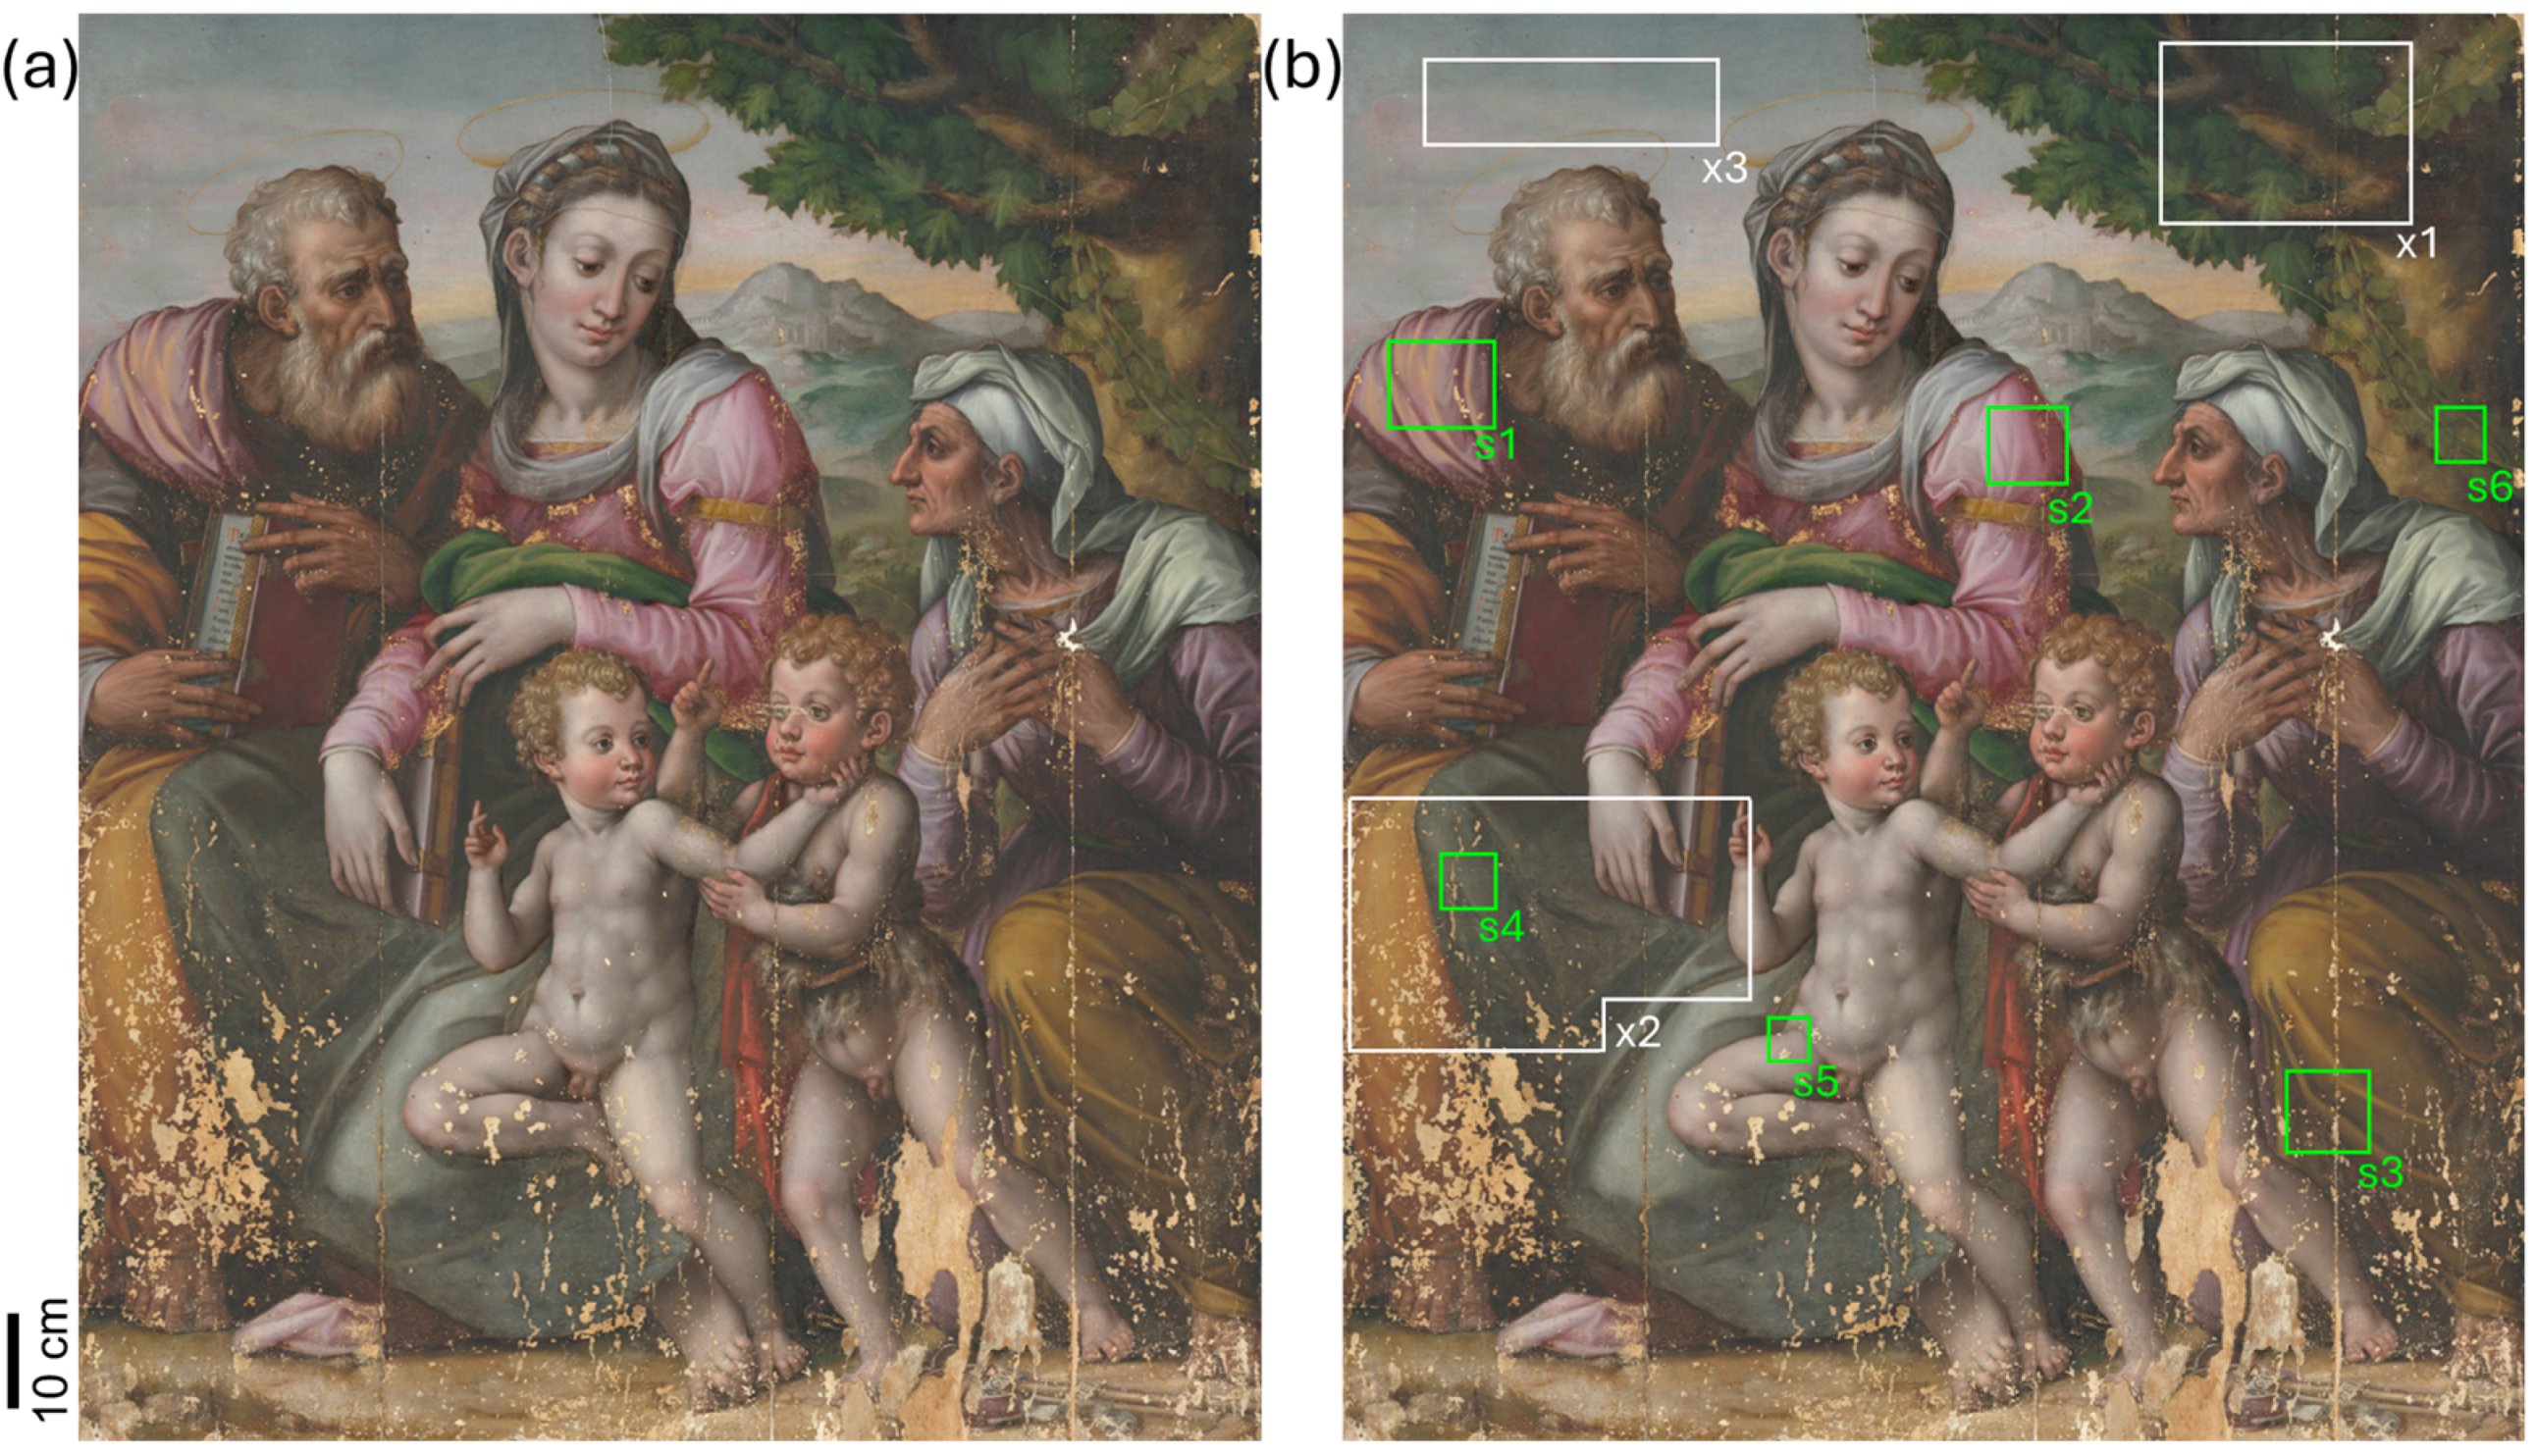
The painting (Figure 1), dating from the second half of the 16th century, comes from the Uffizi storage collection. The analyses reported here were carried out in the laboratories of the Opificio delle Pietre Dure during its restoration [12]. The scene depicting the Holy Family with St. John and St. Elisabetta is oil-painted on panel (size: 160 × 135 cm2). The work has recently been attributed to Domenico Beceri, a Florentine painter whose production is still poorly documented, although it was mentioned by Giorgio Vasari in his treatise Le Vite. Archival reconstruction of the painting’s more recent history has revealed that much of the structural and pictorial damage dates from the Second World War—and not, as previously thought, from the 1966 flood of Florence. The study of the painted scene, whose refined colourism is in keeping with the Florentine Mannerist fashion of the time, has led to speculation about the existence of additional underlying pictorial layers. The analysis of the underlying figuration will be the subject of a forthcoming paper.
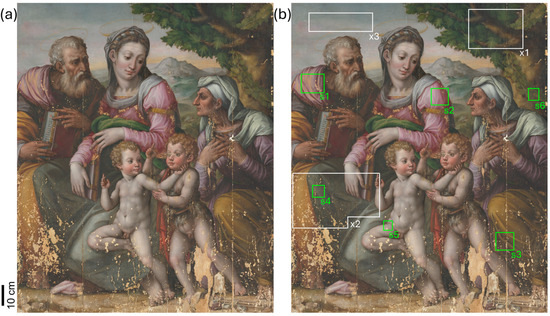
Figure 1.
(a) RGB image of the painting (size: 160 × 135 cm2) obtained with the multispectral scanner; (b) the white rectangles (x1–3) correspond to the areas measured with MA-XRF, whereas the green rectangles (s1–6) indicate the ROIs where the fragments were sampled for cross-sectional analysis. The fragment in s4 was taken within the area x2 mapped by XRF.
2.2. Reference Samples
A series of oil paints on wooden support was used as a reference for SCM analysis. All samples were prepared by the Opificio delle Pietre Dure in 1996 according to late Medieval and Renaissance recipes [13]. Pure powdered pigments (by Zecchi™, Florence, Italy), chemically characterised by FT-IR and SEM-EDS, were dispersed in stand oil (Zecchi™). The paint layers were applied on a preparatory ground (gypsum and animal glue), finished with rabbit glue.
2.3. SEM-EDS
Scanning electron microscopy was performed on the sampled fragments with an EVO® MA 25 Zeiss microscope. Each sample was embedded in polyester resin to obtain cross-sections, polished with abrasive paper and studied with optical microscopy (visible and UV light). The cross-sections were carbon-coated for SEM analysis. The analysis was performed in high-vacuum conditions using 20 kV voltage and 200–400 pA beam current, with backscattered (BSE) and secondary (SE) electron detectors. Elemental analysis was carried out with the energy dispersive probe X-MAX 80 mm2 (Oxford, UK). AZTEC® software version 4.0 was used for image acquisition and processing.
2.4. Macro-Scanning X-ray Fluorescence Mapping (MA-XRF)
The MA-XRF scanner used in this work is a lightweight portable piece of equipment developed in the framework of the Cultural Heritage Network of the Italian National Institute of Nuclear Physics, INFN-CHNet [14]. The instrument, which is described in detail in [15], comprises a measuring head mounted on three linear stages placed on top of a carbon fibre box containing the power supplies, the signal digitiser, and all the auxiliary elements. The measuring head is composed of an X-ray tube (Moxtek©—Orem, UT 84057 USA, 40 kV maximum voltage 0.1 mA maximum anode current, with Mo anode), a silicon drift detector (Amptek© XR100 SDD—Bedford, MA 01730 USA, 50 mm2 effective active surface, 500 μm thickness), and a telemeter (Keyence IA-100, Osaka, Japan) for keeping the sample-to-instrument distance constant when scanning. The motor stages (Physik Instrumente©—Karlsruhe, Germany) allow for a maximum scanning area of 300 mm2, with a 50 mm travel range in the axial direction.
The elemental distribution map Is reconstructed by selecting an energy range that typically corresponds to the characteristic X-ray line of the element. The purposely developed dedicated software will assign a greyscale level to each pixel based on the X-ray counts of the selected peak. White and black correspond to the maximum and minimum counts, respectively.
The experimental conditions for this campaign were as follows: 40 kV anode voltage, 60 μA filament current, 10 mm/s scanning speed, 1 mm pixel size, beam diameter ~1 mm on sample, no helium flow.
2.5. Reflectance Imaging Spectrosocpy (RIS)
The multispectral scanner used in this work was developed at the National Institute of Optics of the National Research Council (CNR-INO). It combines whiskbroom scanning with filtering to simultaneously acquire 32 narrow-band images (16 Vis + 16 NIR) and pointwise spectral information in the range 395–2550 nm [16,17]. The lighting system comprises two low-voltage current-stabilised halogen lamps equipped with an aluminium back reflector (beam divergence ± 5°) and two narrow-spot high-power white LEDs (1 W, beam divergence ± 4.5°). A catoptric system (field of view, FOV, of 0.29°) focuses the light backscattered from the painting on the input facet of a square-shaped fibre bundle, which delivers it to a set of Si and InGaAs photodiodes, each of them equipped with an interferential filter. The optical head, composed of the lighting system and the collecting optics, is placed in a 45°/0° illumination/detection geometry and is moved by an XY scanning system with a 250 μm sampling step (4 points/mm) and 500 mm/s speed, resulting in 3 h acquisition time for the maximum scanning area of 1 m2. A Z stage with a total run of 100 mm keeps the optical head in focus while scanning the surface. The instrument output is a set of perfectly superimposing monochromatic images, metrically correct and free from aberrations.
Five acquisitions were required to scan the entire painting, which were then stitched together into a single image cube using a routine specifically developed for this purpose in Adobe Photoshop® (version CC 2023). A proper calibration procedure was performed by measuring a certified standard reference (100% reflectance) and the background noise, following CIE indications for non-contact spectrophotometric measurements.
Spectral Correlation Mapping (SCM)
Spectral mapping was performed with an automated classification method to directly compare two spectra through the criterion of similarity. The SCM algorithm [18] regards spectra as vectors in the N-dimensional space, where N corresponds to the number of spectral bands. The similarity between the reference (r) and target spectrum (t) is measured by the angle between them, expressed in radians (0, π). The smaller the angle, the higher the degree of similarity. For each pair of target and reference spectra, the strength of the relationship between them is assessed by Pearson’s correlation coefficient, R (Equation (1)):
SCM calculates similarity by centralising the data at their mean. The correlation coefficient (R) ranges from −1 to 1, with 1 indicating maximum correlation. This method yields a more accurate classification than SAM, which does not account for negative correlation [19].
In SCM images, the intensity of each pixel corresponds to the similarity between the vector representing the spectrum of that pixel and the reference (or endmember) being mapped. A close match means a high intensity value in the image.
The SCM maps were generated using customised software developed in-house in Matlab® (version 2021a). A spectral similarity range between 0.9 and 1 was chosen. Therefore, the areas highlighted on the maps (image brightness in each pixel in the dynamic range of 0–255) indicate the presence of the reference pigment with high confidence.
3. Results
3.1. Elemental Analysis
SEM-EDS analysis of the fragments collected from areas s1–6, combined with XRF x1–3 maps, aimed to identify the main chemical elements, visualise the stratigraphy, and verify the presence of the underlying paint. Micro-sampling was performed only in the regions of interest (ROIs) to minimise the invasiveness of the procedure (Figure 1).
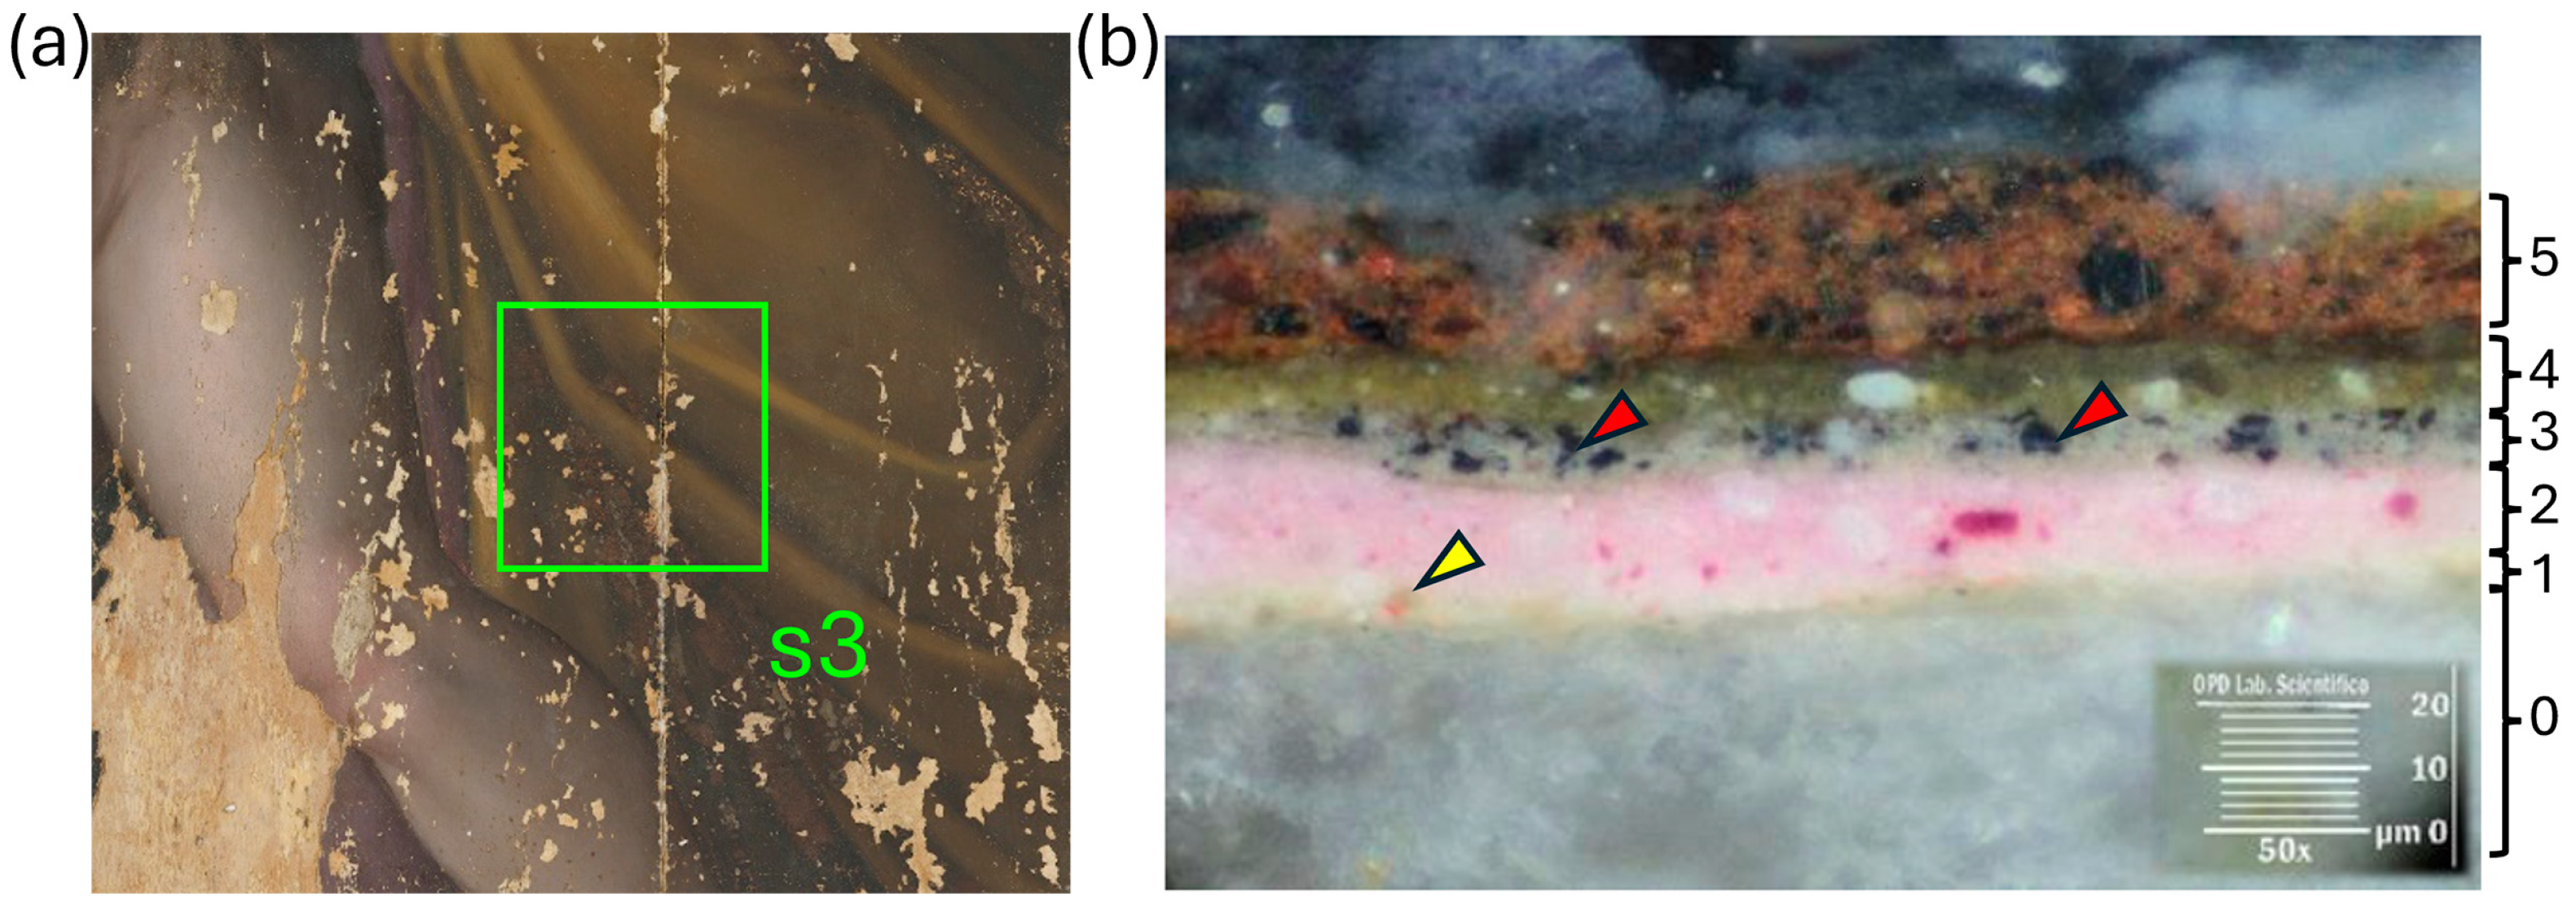
In all the analysed sections, a thin layer of white paint with orange inclusions (~5 μm) was observed above the gypsum and glue preparation (layer 1 in Figure 2b). This is a lead-white based primer (imprimitura) that was commonly applied as a coloured background over the entire painting [20]. SEM-EDS analysis of the orange grains revealed the predominant presence of iron, silicon, and alumina. These elements are consistent with red earth pigments, specifically yellow/red ochres (iron oxides and hydroxides). Above the priming layer, some of the sampled fragments show a first pictorial layer (layer 2 in Figure 2b), which is attributed to the hidden painting later covered with the depiction of the Holy Family. The two paintings are interspersed with an additional layer of imprimitura, 5–10 μm thick (layer 3 in Figure 2b), consisting of a mixture of lead white (2 PbCO3·Pb(OH)2) and a dark pigment of organic origin, given the absence of elemental markers. It could be vine black or carbon black, or even indigo (C16H10N2O2), given the sometimes bluish appearance of the grains. The intermediate priming layer is visible in all sections, with greater thickness and darker hue in the presence of the underlying paint to increase the covering effect.

Figure 2.
Detail of the ROI (a) where the micro-fragment was extracted; cross-section showing the stratigraphy (b): preparation layer (0); first imprimitura (1—the yellow marker indicates the orange grain); first pictorial layer (2); second imprimitura (3—the red marker indicates the dark grains); Holy Family pictorial layer (4); retouching (5).
The Holy Family’s complex and detailed underdrawing, not shown in this study, was produced over the intermediate imprimitura layer.
The most superficial pictorial layer, attributed to the depiction of the Holy Family, varies greatly from area to area, being thinner in the complexion of the figures (5–10 µm) and thicker in the draperies. This is the case for the yellow robe of St. Elizabeth (layer 4 in Figure 2b) and the green-blue robe of the Virgin (Figure 3b,c), measuring 10–15 µm and 35–40 µm, respectively. Overall, it seems that the artist most often used pigment mixtures, as there are few instances of overlapping pictorial layers. Some areas show evidence of later retouching, such as the brown inpainting on St. Elizabeth’s robe (layer 5 in Figure 2b), mainly composed of iron-based earth pigments.
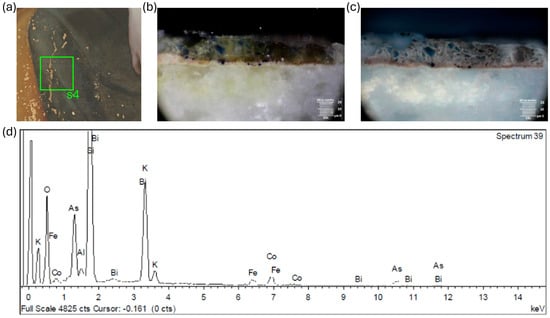
Figure 3.
Cross-sectional elemental analysis on the micro-fragment extracted from s4 (a); microscope images of the cross-section in visible (b) and UV (c) light—the red arrows indicate black or indigo pigment inclusions in the intermediate primer layer; the grain of smalt pigment, indicated by the blue markers, was analysed using SEM elemental analysis (d).
The pigment palette was hypothesised by cross-referencing the elemental results of SEM-EDS analysis and XRF mapping, as summarised in Table 1. For instance, the elemental markers Si, K, and Co suggest the use of smalt, a synthetic cobalt-doped potash glass, for the bluish robe of the Virgin (Figure 3a–d). The presence of traces of As and Bi indicates that cobalt extraction took place after 1520 [21,22]. The pigment has poor covering power, which explains the relatively coarse grinding and consistent thickness of the pictorial layer. The cross-section displays smalt discolouration, which has turned light grey. This chemical alteration typically occurs when an oil binder is present and is mainly caused by cobalt, which acts as a catalyst in the oxidation of the binder. This results in the formation of an organometallic compound at the edges of the grains [23,24]. When smalt is mixed with lead white in oil, lower degrees of alterations are observed, as in the case of the sky, where the blue hue is still unaltered (x3) [25].

Table 1.
Pigments suggested by elemental results (SEM-EDS analysis and XRF mapping) for the main figurative elements.
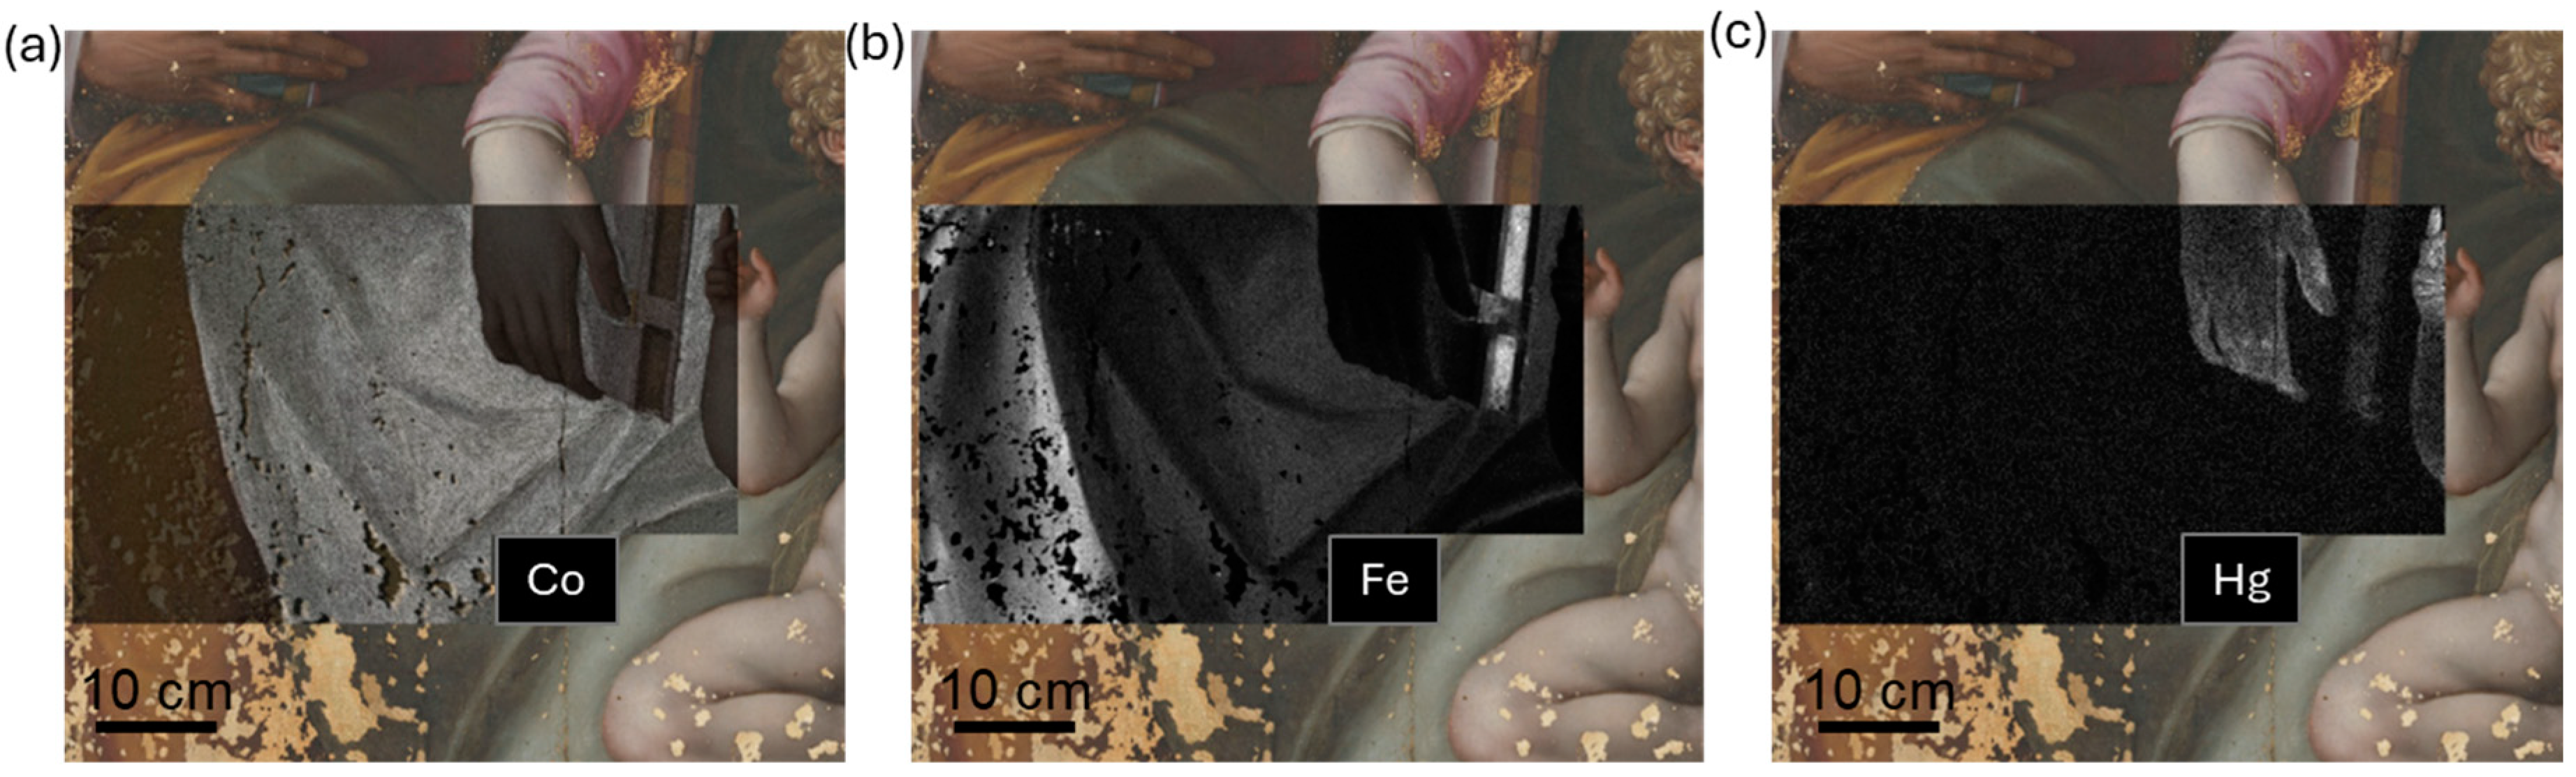
The x2 map in Figure 4a shows the uniformity of the Co signal throughout the Virgin’s robe. The presence of Fe (Figure 4b) is likely an impurity of smalt but may also be due to a mixture with iron oxides/hydroxides (earth/ochres) employed to achieve the modelling of the blue drapery. In the same area, a rather intense signal of Hg and Pb was detected on the hand of the Virgin and Child (Figure 4c), which may attest to the presence of vermilion (HgS) and lead white. On the flesh tone of the Child (s5), the signal of Fe was also detected, suggesting the use of earth pigments such as ochre (iron(III) oxide-hydroxide, known as limonite) and green earth, containing iron (II) and iron (III) silicates of potassium, manganese, aluminium, and oxides of Fe, Mg, Al, and K.
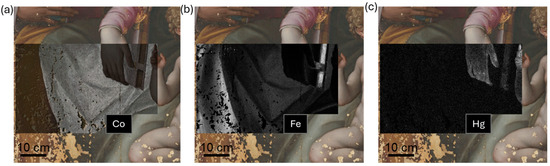
Figure 4.
MA-XRF mapping on area x2: distribution of cobalt (a), iron (b), and mercury (c).
The presence of a dye of organic origin, such as red lacquer, often combined with lead white and smalt [26], may be responsible for the detection of Al and K signals in the pinkish zones (SEM analysis in s1 and s2).
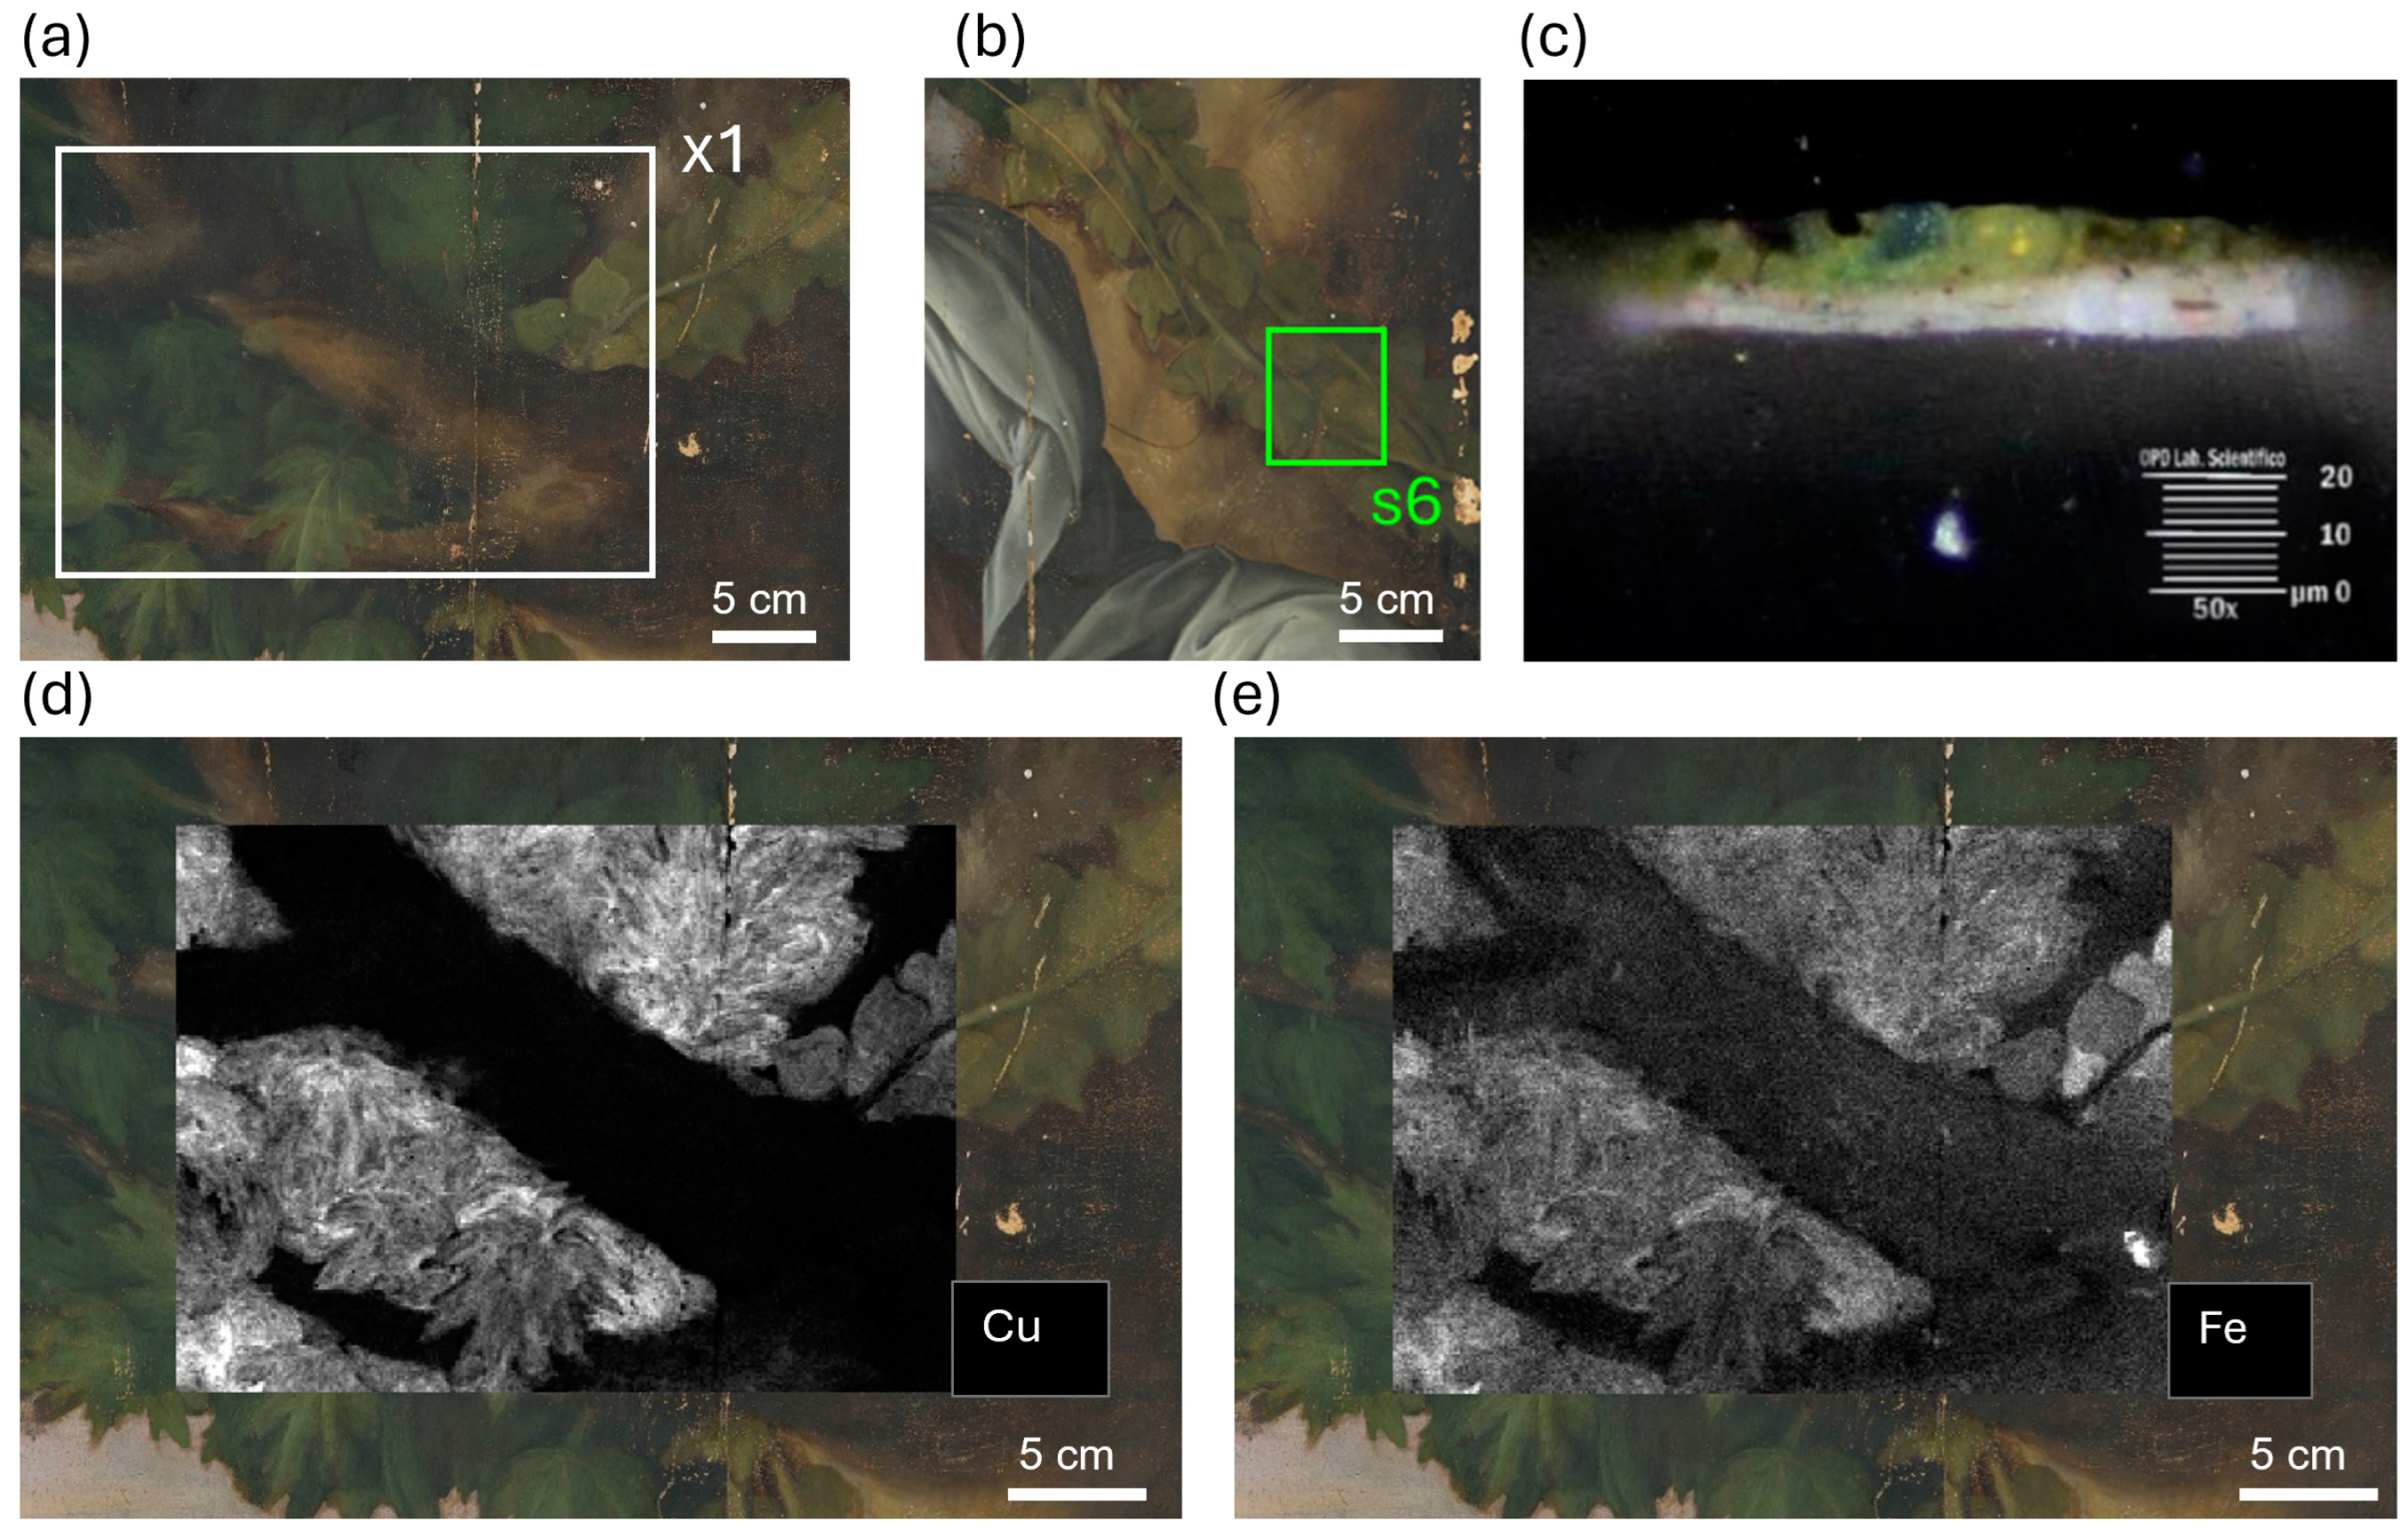
Both the foliage and branches of the tree (Figure 5a) are characterised by Cu and Fe in XRF maps (Figure 5d,e). Fe and Pb were also detected in both XRF spectra and SEM-EDS analysis of the fragment taken from the leaves (s6 in Figure 5b). The detected elements indicate the use of yellow ochre, green earth, lead white, and a green Cu-based pigment, such as malachite (Cu2(OH)2CO3), verdigris (Cu(CH3COO)2), or copper resinate (obtained by mixing verdigris with terpenic resins). The microscope image shows that the green pictorial layer in the leaf fragment has a thickness of ~15 µm (Figure 5c).
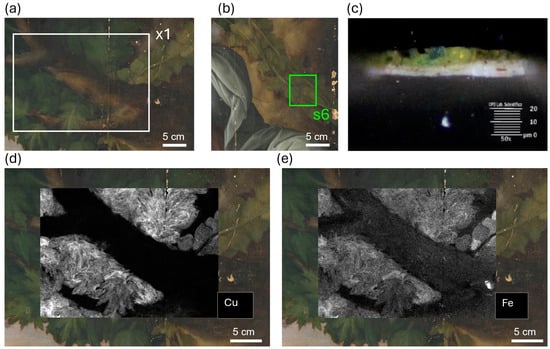
Figure 5.
RGB image of regions x1 and s6 of XRF mapping (a) and sampling (b); microscope image of the fragment cross-section in visible light (c); copper (d) and iron (e) maps of the vegetation.
3.2. Spectral Correlation Mapping (SCM)
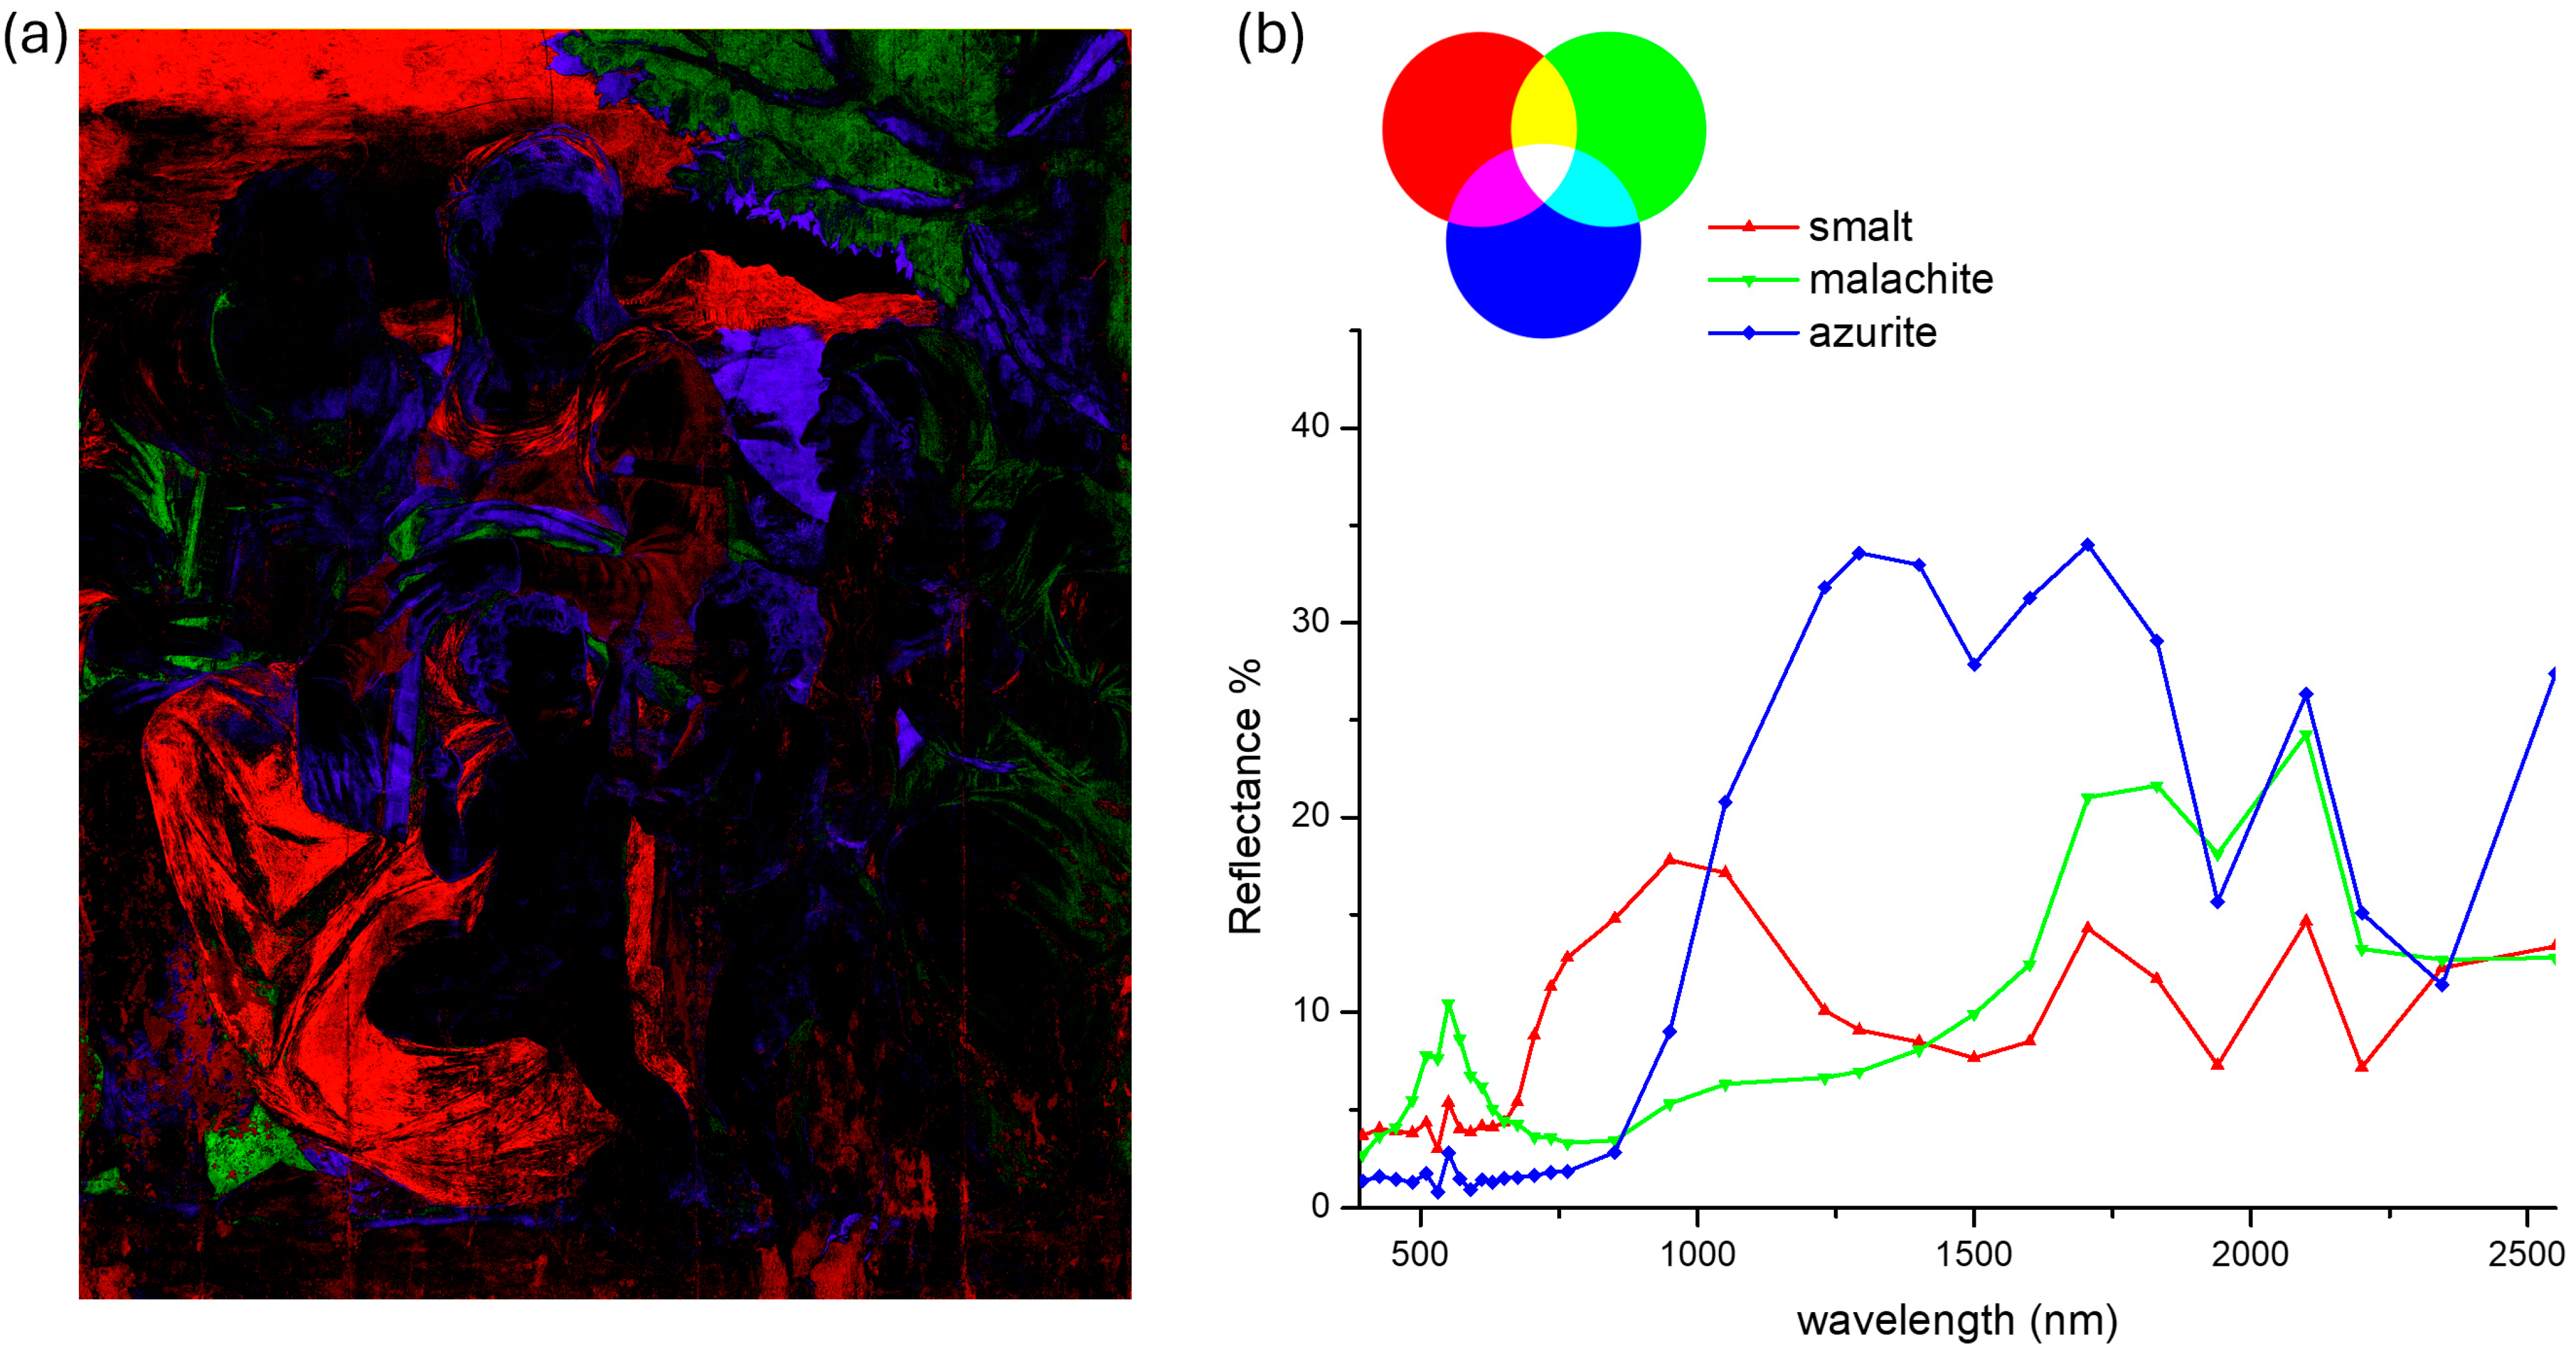
Based on the results of the elemental analysis, we used SCM to map the distribution of hypothesised pigments throughout the painting. We assumed that additional pigments were present in areas not analysed by MA-XRF or where no fragments had been collected. For instance, the use of azurite (2 CuCO3·Cu(OH)2), lapis lazuli (from the feldspathoid silicate mineral lazurite), and indigo was suspected for the bluish areas, as their presence is common in paintings from the same period and provenance [27]. Each endmember extracted from the oil-painted reference samples was used to calculate the spectral correlation with the painting’s image-cube using a dedicated software. An example of the data processing output is shown in Figure S1 in the Supplementary Material. The three spectral correlation maps show the distribution of the respective endmember (smalt, azurite, and malachite) in greyscale. Figure 6a displays the maps of the three pigments merged into a single image, with smalt, malachite, and azurite assigned to the red (R), green (G), and blue (B) colour channels, respectively. The overlapping areas of two or three maps produce a linear combination of their respective colour channels, resulting in magenta (R + B), yellow (R + G), cyan (G + B), and white (R + G + B) hues, as shown in the diagram (Figure 6b).
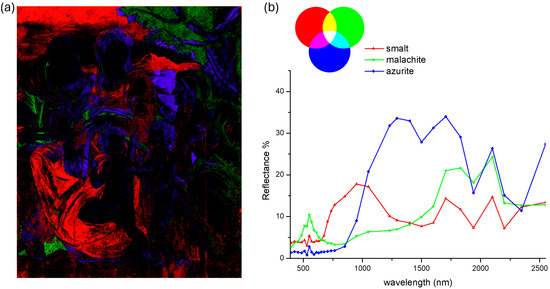
Figure 6.
Combined SC maps of smalt, malachite, and azurite (a) and the respective endmembers (b).
The artist’s palette was determined by first mapping the entire scene, as shown in Figure S3 in the Supplementary Material. Then, the various figurative elements, such as the characters’ clothing and complexion, the vegetation, and the background, were analysed. Table 2 reports the main pigments identified for each examined region.
Table 2.
Pigment mixtures identified through SCM.
The analysis of the blue pigments only allowed for the clear identification of smalt and azurite, while the distributions of lapis lazuli and indigo were found to overlap almost perfectly (Figure S2). The spectral differences of the latter two pigments, such as the absorption maximum at about 600 and 660 nm for lapis lazuli and indigo, respectively, are very subtle or undetectable with the spectral resolution of the scanner [28]. Furthermore, both pigments exhibited an inflection point at 700–720 nm, with a sharp increase in reflectance that reached high values at 900 nm. Asserting whether both pigments are present in mixture or individually is extremely difficult with this methodology. However, using the same classification threshold for both endmembers led to slightly higher intensity values in the indigo SC map compared to the lapis SC map.
The spectral maps of the Virgin’s dress revealed that the light pink hue was obtained with a mixture of vermilion and yellow/red ochre (Figure 7). Red lacquer and lead white were used for the highlights, while the shadows were produced with a mixture of red ochre, a natural earth pigment like burnt sienna (anhydrous iron oxide), and indigo/lapis. Despite high spectral correlation with vermilion, elemental analysis revealed no presence of Hg. However, as the fragment analysed may not be representative of the whole area, the use of this pigment cannot be excluded.
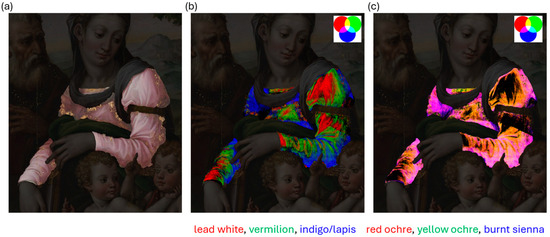
Figure 7.
SCM of the Virgin’s dress (a) showing the combined RGB distribution of lead white–vermilion–indigo (b) and red ochre–yellow ochre–burnt sienna (c).
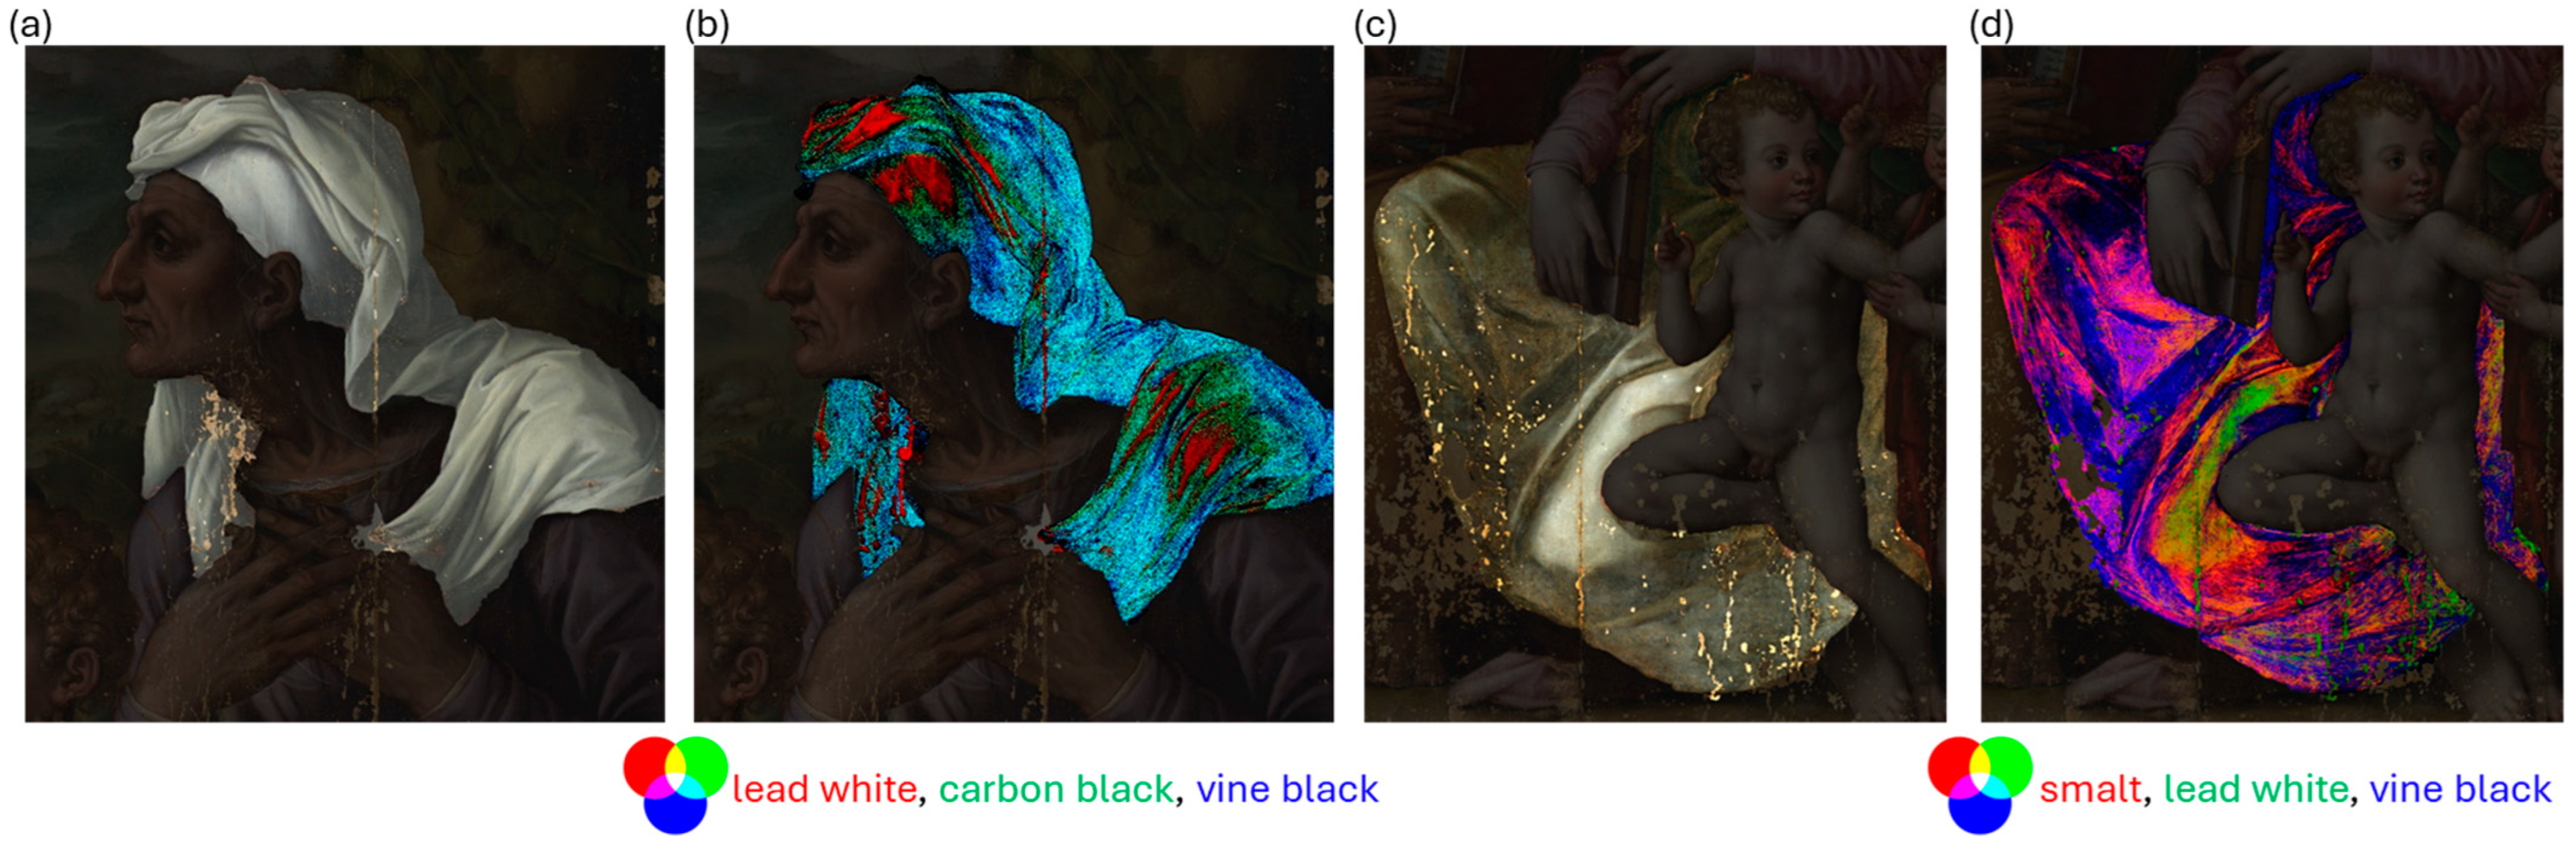
Despite the spectral similarity between the black organic pigments, i.e., vine black and carbon black, their correlation maps resulted in distinguishable differences. Therefore, we can assume that both were used. An example of this can be seen in the light grey veil of St. Elizabeth (Figure 8a,b), which was painted using lead white with a differentiated mixture of carbon black and vine black applied for the shadows. Instead, the darker folds of the Virgin’s smalt-based robe were painted with only vine black (Figure 8c,d). SCM analysis confirmed that the greyish hue observed in some areas is due to the discolouration of smalt, and not to the presence of other pigments.
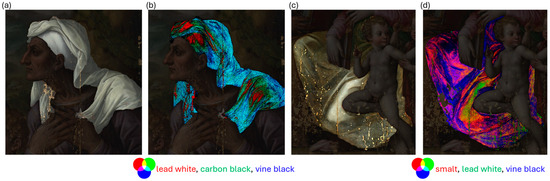
Figure 8.
SCM results on St. Elizabeth’s veil (a,b) and the Virgin’s robe (c,d) showing the combined distribution of lead white–carbon black–vine black (b) and smalt–lead white–vine black (d).
The SC maps relative to the flesh tone are reported in Figure 9. Consistent with the previously identified elemental composition and artistic practices of the time [29], the artist utilised a combination of green earth, yellow ochre, and burnt sienna for the shadows and midtones; the highlights and warmer tones were achieved with white lead, vermilion, and red lacquer.
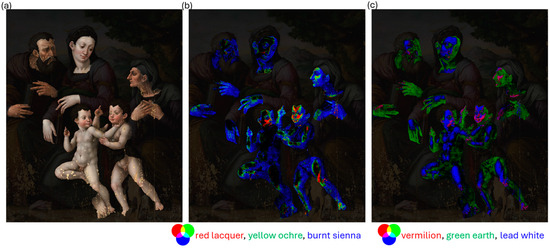
Figure 9.
SCM of the flesh tone (a) showing the combined distribution of red lacquer–yellow ochre–burnt sienna (b) and vermilion–green earth–lead white (c).
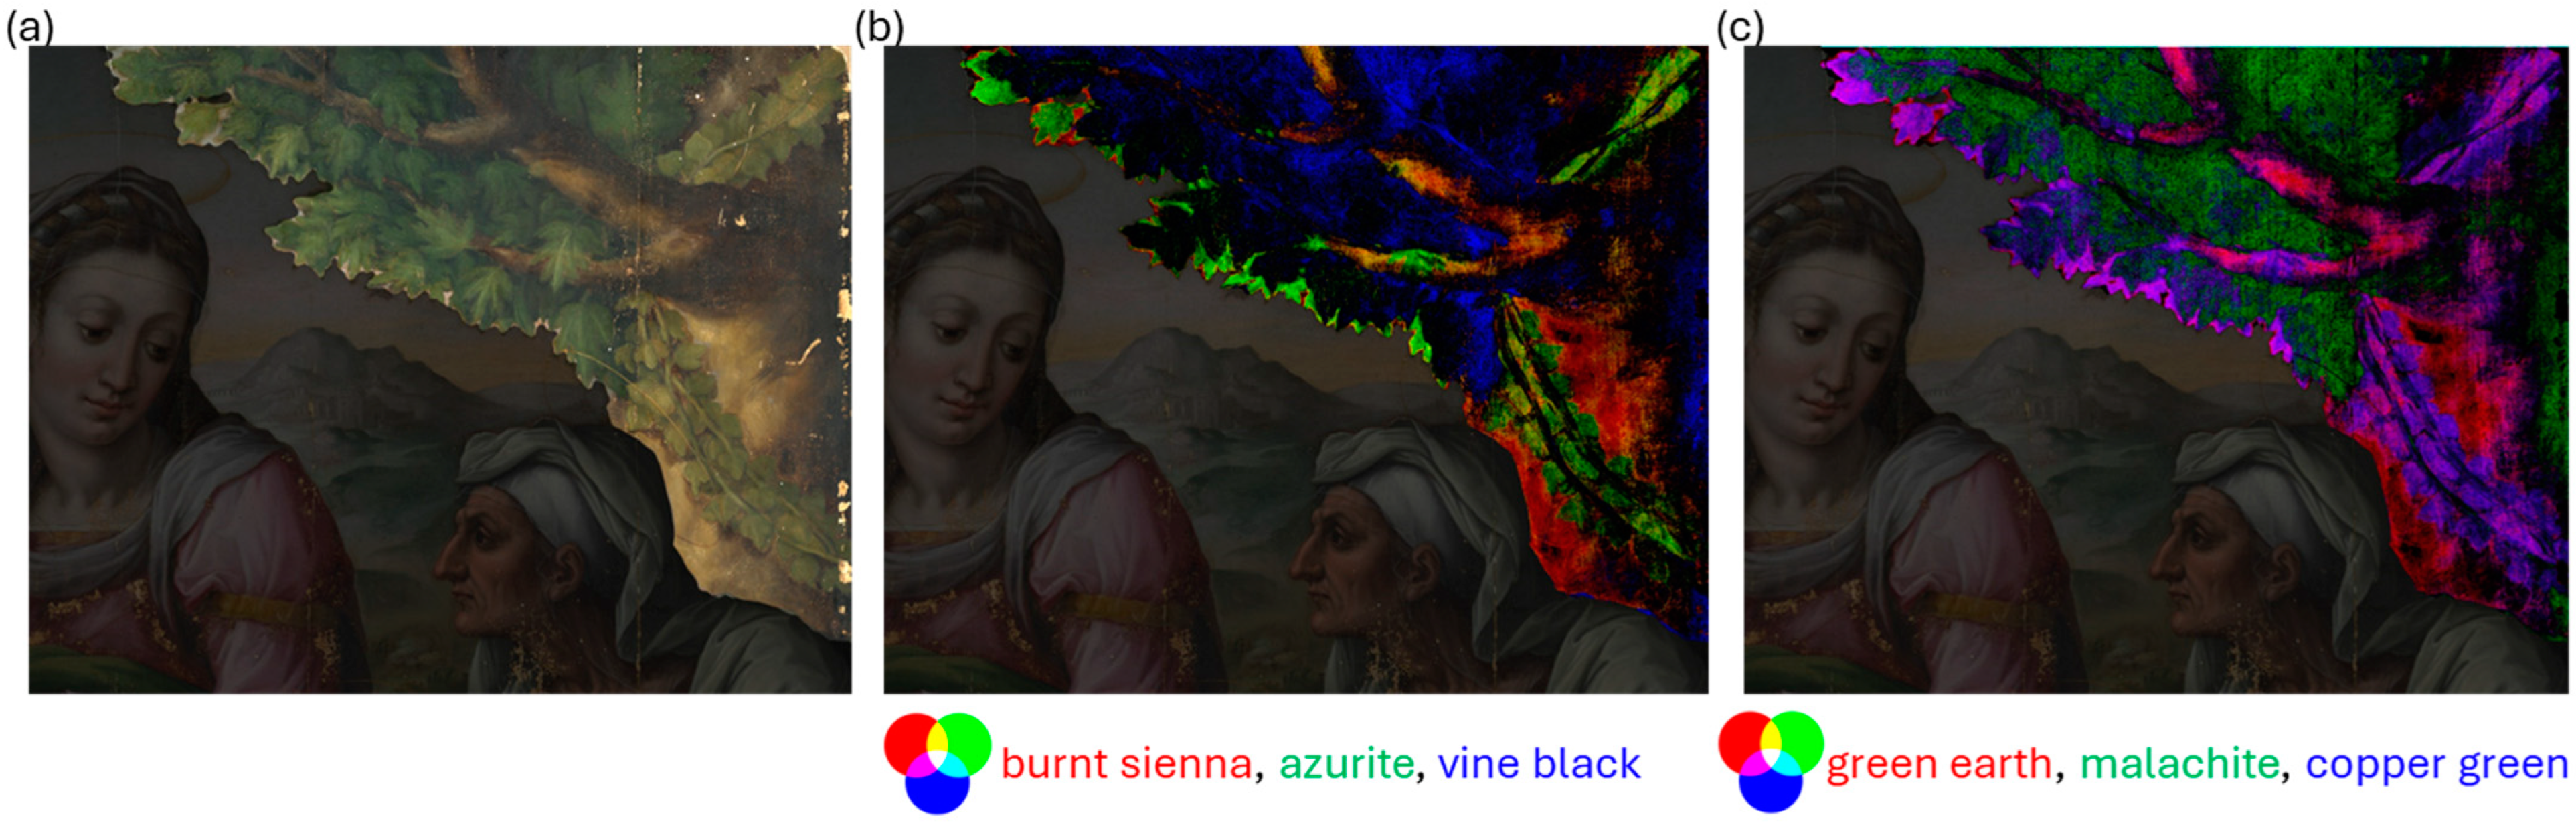
The vegetation (Figure 10a–c) was realized with malachite and vine black (foliage), with a mixture of green earth, copper green, and azurite for the leaves located at the edges of the tree crown and on the trunk. The latter was mainly painted with burnt sienna and green earth mixed with small amounts of azurite and copper green. The use of both malachite and azurite is compatible with the detection of Cu by XRF in the same area.
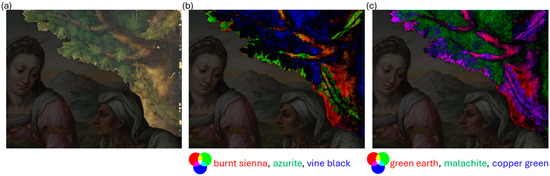
Figure 10.
SCM of vegetation (a) showing the combined distribution of burnt sienna–azurite–vine black (b) and green earth–malachite–copper green (c).
The sky was painted with delicate tones of smalt, lead white, and carbon black (Figure 11b), while the hills and mist in the distance were painted with a mixture of ochre and burnt sienna (Figure 11c). Indigo/lapis was used for the shaded hillside.
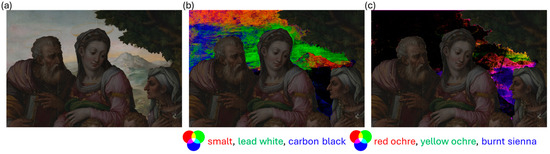
Figure 11.
SCM of the background (a) showing the combined distribution of smalt–lead white–carbon black (b) and red ochre–yellow ochre–burnt sienna (c).
4. Discussion
Possible misinterpretation of SC maps can be related to the fact that multispectral reflectography does not offer sufficient spectral resolution to detect subtle differences between optically similar pigments, such as indigo and lapis lazuli, or black organic pigments. For a more accurate identification, non-invasive vibrational and infrared spectroscopies could be used [30]. In the specific case of St Elizabeth’s dress, it is likely that a red pigment, not identified by RIS, was mixed with smalt and lead white to produce the purple hue. It is possible that the red pigment was used in small quantities and therefore its spectral contribution is masked by the other pigments in the mixture. Elemental or molecular analysis could be carried out in this area to integrate the results of the spectral mapping.
In the case of the foliage, the use of azurite for the green leaves seems unusual and could be due to a misinterpretation. However, the spectral differences between azurite and other copper-based pigments are sufficiently defined to be resolved by the multispectral scanner. Since the presence of azurite is limited to some leaves at the edge of the foliage, we can hypothesise that this pigment was used in mixture with an unidentified yellow pigment to refine the contours of the foliage with a slightly different shade of green. The chemical composition of the leaves could be better identified with a complementary point analysis.
On the other hand, SCM allowed for the identification of chemically similar pigments suggested by the elemental data, e.g., iron-based earths were distinguished by the distribution of individual pigments such as yellow and red ochre and burnt sienna.
The classification algorithm used in this study was capable of identifying only the spatial distribution of the pigments. To obtain information on pigment abundance, spectral unmixing algorithms can be used. However, unmixing methods have a significant limitation: they assume that the spectrum is a linear combination of two or more endmembers, which ideally represent pure pigments. Pigment mixtures commonly found in paintings give a non-linear response, as pigments are often mixed in different proportions or applied as overlapping layers [31]. Recently introduced alternative methods can address the limitations of linear unmixing. One possible solution could be to use a simplified Kubelka–Munk (KM) model for opaque and infinitely thick samples, which approximates the reflectance of mixed pigments at the expense of intensive computational operations [32]. Deep learning (DL), particularly neural networks (NNs), has recently been tested for prior selection of pigments in hyperspectral data cubes, showing promising results [33]. However, to create accurate material maps using NNs, it is necessary to generate large training datasets of labelled reflectance spectra [34]. In the last few years, Borsoi et al. proposed a generative deep learning-based model for unsupervised unmixing using low-dimensional representations of the endmembers [35]. The same author also introduced multitemporal hyperspectral unmixing based on a variational recurrent neural network to represent the dynamic variations of the materials and their abundances in a given scene [36]. These promising results encourage further research to accurately model the interaction between the materials in painting mapping.
5. Conclusions
This work examined the stratigraphy and pigment palette of a 16th-century painting. The uniqueness of the painting is due to the variety of pigments used and, in particular, to the concealed painting, which will be the focus of a future analysis. To enhance our understanding of the artist’s technique and production, and to conduct an informed conservation intervention, it was essential to study the pictorial stratigraphy and to identify and map the pigments used in the visible representation of the Holy Family. We carried out a cross-sectional SEM-EDS analysis and elemental mapping to obtain preliminary compositional information and to make an initial hypothesis about the pigments used for specific areas of the painting. RIS was then performed on the entire painting and the SCM classification algorithm was applied to the image cube. The reference pigments were selected as external endmembers based on the previously hypothesised pigments.
Most of the mixtures in the examined areas have been fully characterised and confirmed by cross-referencing the results of the different techniques. This information is crucial for accurately interpreting future analyses aimed at uncovering the concealed painting. The results reported in this study demonstrate the effectiveness of combined elemental and spectral analysis in identifying and mapping pigments in complex paintings.
Supplementary Materials
The following supporting information can be downloaded at: https://www.mdpi.com/article/10.3390/heritage7030063/s1, Figure S1, SC maps showing the distribution of smalt (b), azurite (c), and malachite (d); Figure S2, Combined SCM of lead white—vermilion—lapis lazuli (left) and lead white—vermilion—indigo (middle), with their respective spectra (right) used for the analysis.; Figure S3, Combined SC maps showing the distribution of all the identified pigments all over the painting.
Author Contributions
Conceptualisation, A.D.F.; methodology, A.D.F., R.F., A.M., M.M., C.T. and M.G.; validation, R.F.; formal analysis, A.D.F., R.F., A.M., M.M., C.T. and M.G.; writing—original draft preparation, A.D.F.; writing—review and editing, A.D.F., R.F., A.M., M.M., C.T. and M.G.; funding acquisition, R.F. All authors have read and agreed to the published version of the manuscript.
Funding
This research was funded by the PNRR H2IOSC (Humanities and Cultural Heritage Italian Open Science Cloud) Project (IR0000029), CUP_B63C22000730005, funded by Next Generation EU. The contents reflect only the authors’ view and the European Commission is not responsible for any use that may be made of the information it contains.
Data Availability Statement
The data presented in this study are available on request from the corresponding author.
Acknowledgments
Director of the Uffizi Galleries Eike Schmidt and Superintendent Emanuela Daffra (OPD) are gratefully acknowledged.
Conflicts of Interest
The authors declare no conflicts of interest.
References
- de Viguerie, L.; Glanville, H.; Radepont, M.; Cerasuolo, A.; Rullo, A.; Seccaroni, C.; Walter, P. An investigation of Bellini’s Transfiguration in the Capodimonte museum by means of XRF and visible reflectance hyperspectral imaging: Bellini’s handling of materials in the head and figure of the transfigured Christ. Herit. Sci. 2023, 11, 163. [Google Scholar] [CrossRef]
- Brocchieri, J.; Scialla, E.; D’Onofrio, A.; Sabbarese, C. Combining XRF, Multispectral Imaging and SEM/EDS to Characterize a Contemporary Painting. Quantum Beam Sci. 2023, 7, 13. [Google Scholar] [CrossRef]
- Alfeld, M. MA-XRF for Historical Paintings: State of the Art and Perspective. Microsc. Microanal. 2020, 26, 72–75. [Google Scholar] [CrossRef]
- de Almeida Nieto, L.M.; Gabrieli, F.; van Loon, A.; Gonzalez, V.; Dik, J.; Van de Plas, R.; Alfeld, M. Comparison of macro x-ray fluorescence and reflectance imaging spectroscopy for the semi-quantitative analysis of pigments in easel paintings: A study on lead white and blue verditer. X-ray Spectrom. 2023. [Google Scholar] [CrossRef]
- Cucci, C.; Delaney, J.K.; Picollo, M. Reflectance hyperspectral imaging for investigation of works of art: Old master paintings and illuminated manuscripts. Acc. Chem. Res. 2016, 49, 2070–2079. [Google Scholar] [CrossRef] [PubMed]
- Dong, Y.; Du, B.; Zhang, L.; Zhang, L. Dimensionality reduction and classification of hyperspectral images using ensemble discriminative local metric learning. IEEE Trans. Geosci. Remote Sens. 2017, 55, 2509–2524. [Google Scholar] [CrossRef]
- Richards, J.A. Richards. In Remote Sensing Digital Image Analysis, 3; Springer: Berlin, Germany, 1999; pp. 10–38. [Google Scholar]
- Grabowski, B.; Masarczyk, W.; Głomb, P.; Mendys, A. Automatic pigment identification from hyperspectral data. J. Cult. Herit. 2018, 31, 1–12. [Google Scholar] [CrossRef]
- Deborah, H.; George, S.; Hardeberg, J.Y. Pigment mapping of the scream (1893) based on hyperspectral imaging. In International Conference on Image and Signal Processing; Springer: Cham, Switzerland, 2014; pp. 247–256. [Google Scholar]
- Schreiner, M.; Melcher, M.; Uhlir, K. Scanning electron microscopy and energy dispersive analysis: Applications in the field of cultural heritage. Anal. Bioanal. Chem. 2007, 387, 737–747. [Google Scholar] [CrossRef]
- Irazola, M.; Olivares, M.; Castro, K.; Maguregui, M.; Martínez-Arkarazo, I.; Madariaga, J.M. In situ Raman spectroscopy analysis combined with Raman and SEM-EDS imaging to assess the conservation state of 16th century wall paintings. J. Raman Spectrosc. 2012, 43, 1676–1684. [Google Scholar] [CrossRef]
- Morello, M. Il Restauro del Dipinto su Tavola “Sacra Famiglia con San Giovannino e Santa Elisabetta” Attribuito a Domenico Beceri: Una Complessa Storia d’Esecuzione e di Conservazione. Trattamento dei Residui Cerosi e Ricerca sulla Compatibilità dei Materiali per l’Integrazione Materica. Master’s Thesis, Rel. Coord. C. Toso, Scuola di Alta Formazione e Studio (SAFS) Opificio delle Pietre Dure, Firenze, Italy, 2022. [Google Scholar]
- Aldrovandi, A.; Altamura, M.L.; Cianfanelli, M.T.; Riitano, P. I Materiali Pittorici: Tavolette Campione Per La Caratterizzazione Mediante Analisi Multispettrale. OPD Restauro 1996, 8, 101–103, 191–210. Available online: http://www.jstor.org/stable/24395397 (accessed on 24 February 2024).
- CHNet—Cultural Heritage Network. Available online: https://chnet.infn.it (accessed on 10 August 2022).
- Taccetti, F.; Castelli, L.; Czelusniak, C.; Gelli, N.; Mazzinghi, A.; Palla, L.; Ruberto, C.; Censori, C.A.; Lo Giudice, A.; Re, D.; et al. A multipurpose X-ray fluorescence scanner developed for in situ analysis. Rend. Lincei. Sci. Fis. E Nat. 2019, 30, 307–322. [Google Scholar] [CrossRef]
- Striova, J.; Dal Fovo, A.; Fontana, R. Reflectance imaging spectroscopy in heritage science. Riv. Nuovo C. 2020, 43, 515–566. [Google Scholar] [CrossRef]
- Striova, J.; Ruberto, C.; Barucci, M.; Blažek, J.; Kunzelman, D.; Dal Fovo, A.; Pampaloni, E.; Fontana, R. Spectral imaging and archival data in analysing Madonna of the Rabbit paintings by Manet and Titian. Angew. Chem. 2018, 130, 7530–7534. [Google Scholar] [CrossRef]
- Mandal, D.J.; Pedersen, M.; George, S.; Deborah, H.; Boust, C. An experiment-based comparative analysis of pigment classification algorithms using hyperspectral imaging. J. Imaging Sci. Technol. 2023, 67, 30403–30418. [Google Scholar] [CrossRef]
- De Carvalho, O.A.; Meneses, P.R. Spectral correlation mapper (SCM): An improvement on the spectral angle mapper (SAM). In Summaries of the 9th JPL Airborne Earth Science Workshop, JPL Publication 00-18; JPL Publication: Pasadena, CA, USA, 2000; Volume 9, p. 2. [Google Scholar]
- Lalli, C.G.; Innocenti, F. Tecniche artistiche di dipinti su tavola dal XII al XVI secolo. OPD Restauro 2015, 27, 309–322. Available online: http://www.jstor.org/stable/44627776 (accessed on 24 February 2024).
- Ricciardi, P.; Mazzinghi, A.; Legnaioli, S.; Ruberto, C.; Castelli, L. The choir books of San Giorgio Maggiore in Venice: Results of in depth non-invasive analyses. Heritage 2019, 2, 1684–1701. [Google Scholar] [CrossRef]
- Zucchiatti, A.; Bouquillon, A.; Katona, I.; D’Alessandro, A. The ‘della Robbia blue’: A case study for the use of cobalt pigments in ceremics during the Italian Renaissance. Archaeometry 2006, 48, 131–152. [Google Scholar] [CrossRef]
- Giovanni, C.; Riccardi, M.P. Glass-based pigments in painting: Smalt blue and lead–tin yellow type II. Archaeol. Anthropol. Sci. 2021, 13, 199. [Google Scholar]
- Coccato, A.; Moens, L.; Vandenabeele, P. On the stability of mediaeval inorganic pigments: A literature review of the effect of climate, material selection, biological activity, analysis and conservation treatments. Herit. Sci. 2017, 5, 12. [Google Scholar] [CrossRef]
- Pottasch, C.; van Loon, A.; Haswell, R. Analysing the influence of lead white on smalt degradation in three paintings by Pellegrini, using SEM-EDX quantitative mapping. In Proceedings of the 4th International Congress Chemistry for Cultural Heritage, Brussels, Belgium, 5–9 July 2016; p. 70. [Google Scholar]
- Vitorino, T.; Casini, A.; Cucci, C.; Melo, M.J.; Picollo, M.; Stefani, L. Non-invasive identification of traditional red lake pigments in fourteenth to sixteenth centuries paintings through the use of hyperspectral imaging technique. Appl. Phys. A 2015, 121, 891–901. [Google Scholar] [CrossRef]
- Stanzani, E.; Bersani, D.; Lottici, P.P.; Colomban, P. Analysis of artist’s palette on a 16th century wood panel painting by portable and laboratory Raman instruments. Vib. Spectrosc. 2016, 85, 62–70. [Google Scholar] [CrossRef]
- Aceto, M.; Agostino, A.; Fenoglio, G.; Idone, A.; Gulmini, M.; Picollo, M.; Delaney, J.K. Characterisation of colourants on illuminated manuscripts by portable fibre optic UV-visible-NIR reflectance spectrophotometry. Anal. Methods 2014, 6, 1488–1500. [Google Scholar] [CrossRef]
- Dal Fovo, A.; Mattana, S.; Ruberto, C.; Castelli, L.; Ramat, A.; Riitano, P.; Fontana, R. Novel integration of non-invasive imaging techniques for the analysis of an egg tempera painting by Pietro Lorenzetti. Eur. Phys. J. Plus 2023, 138, 71. [Google Scholar] [CrossRef]
- Colantonio, C.; Clivet, L.; Laval, E.; Coquinot, Y.; Maury, C.; Melis, M.; Boust, C. Integration of multispectral imaging, XRF mapping and Raman analysis for noninvasive study of illustrated manuscripts: The case study of fifteenth century “Humay meets the Princess Humayun” Persian masterpiece from Louvre Museum. Eur. Phys. J. Plus 2021, 136, 958. [Google Scholar] [CrossRef]
- Duncan, D.R. The colour of pigment mixtures. Proc. Phys. Soc. 1940, 52, 390–401. [Google Scholar] [CrossRef]
- Kleynhans, T.; Messinger, D.W.; Delaney, J.K. Towards automatic classification of diffuse reflectance image cubes from paintings collected with hyperspectral cameras. Microchem. J. 2020, 157, 104934. [Google Scholar] [CrossRef]
- Valero, E.M.; Martínez-Domingo, M.A.; López-Baldomero, A.B.; López-Montes, A.; Abad-Muñoz, D.; Vílchez-Quero, J.L. Unmixing and pigment identification using visible and short-wavelength infrared: Reflectance vs. logarithm reflectance hyperspaces. J. Cult. Herit. 2023, 64, 290–300. [Google Scholar] [CrossRef]
- Chaudhry, F.; Wu, C.C.; Liu, W.; Chang, C.I.; Plaza, A. Pixel purity index-based algorithms for endmember extraction from hyperspectral imagery. Recent Adv. Hyperspect. Signal Image Process. 2006, 37, 29–62. [Google Scholar]
- Borsoi, R.A.; Imbiriba, T.; Bermudez, J.C.M. Deep generative endmember modeling: An application to unsupervised spectral unmixing. IEEE Trans. Comput. Imaging 2019, 6, 374–384. [Google Scholar] [CrossRef]
- Borsoi, R.A.; Imbiriba, T.; Closas, P. Dynamical Hyperspectral Unmixing with Variational Recurrent Neural Networks. IEEE Trans. Image Process. 2023, 32, 2279–2294. [Google Scholar] [CrossRef]


Disclaimer/Publisher’s Note: The statements, opinions and data contained in all publications are solely those of the individual author(s) and contributor(s) and not of MDPI and/or the editor(s). MDPI and/or the editor(s) disclaim responsibility for any injury to people or property resulting from any ideas, methods, instructions or products referred to in the content. |
© 2024 by the authors. Licensee MDPI, Basel, Switzerland. This article is an open access article distributed under the terms and conditions of the Creative Commons Attribution (CC BY) license (https://creativecommons.org/licenses/by/4.0/).