
Mapping and Assessing Cultural Ecosystem Services to Inform Maritime Spatial Planning: A Systematic Review


Abstract
1. Introduction
2. Cultural Ecosystem Services: Are They Significant to MSP?
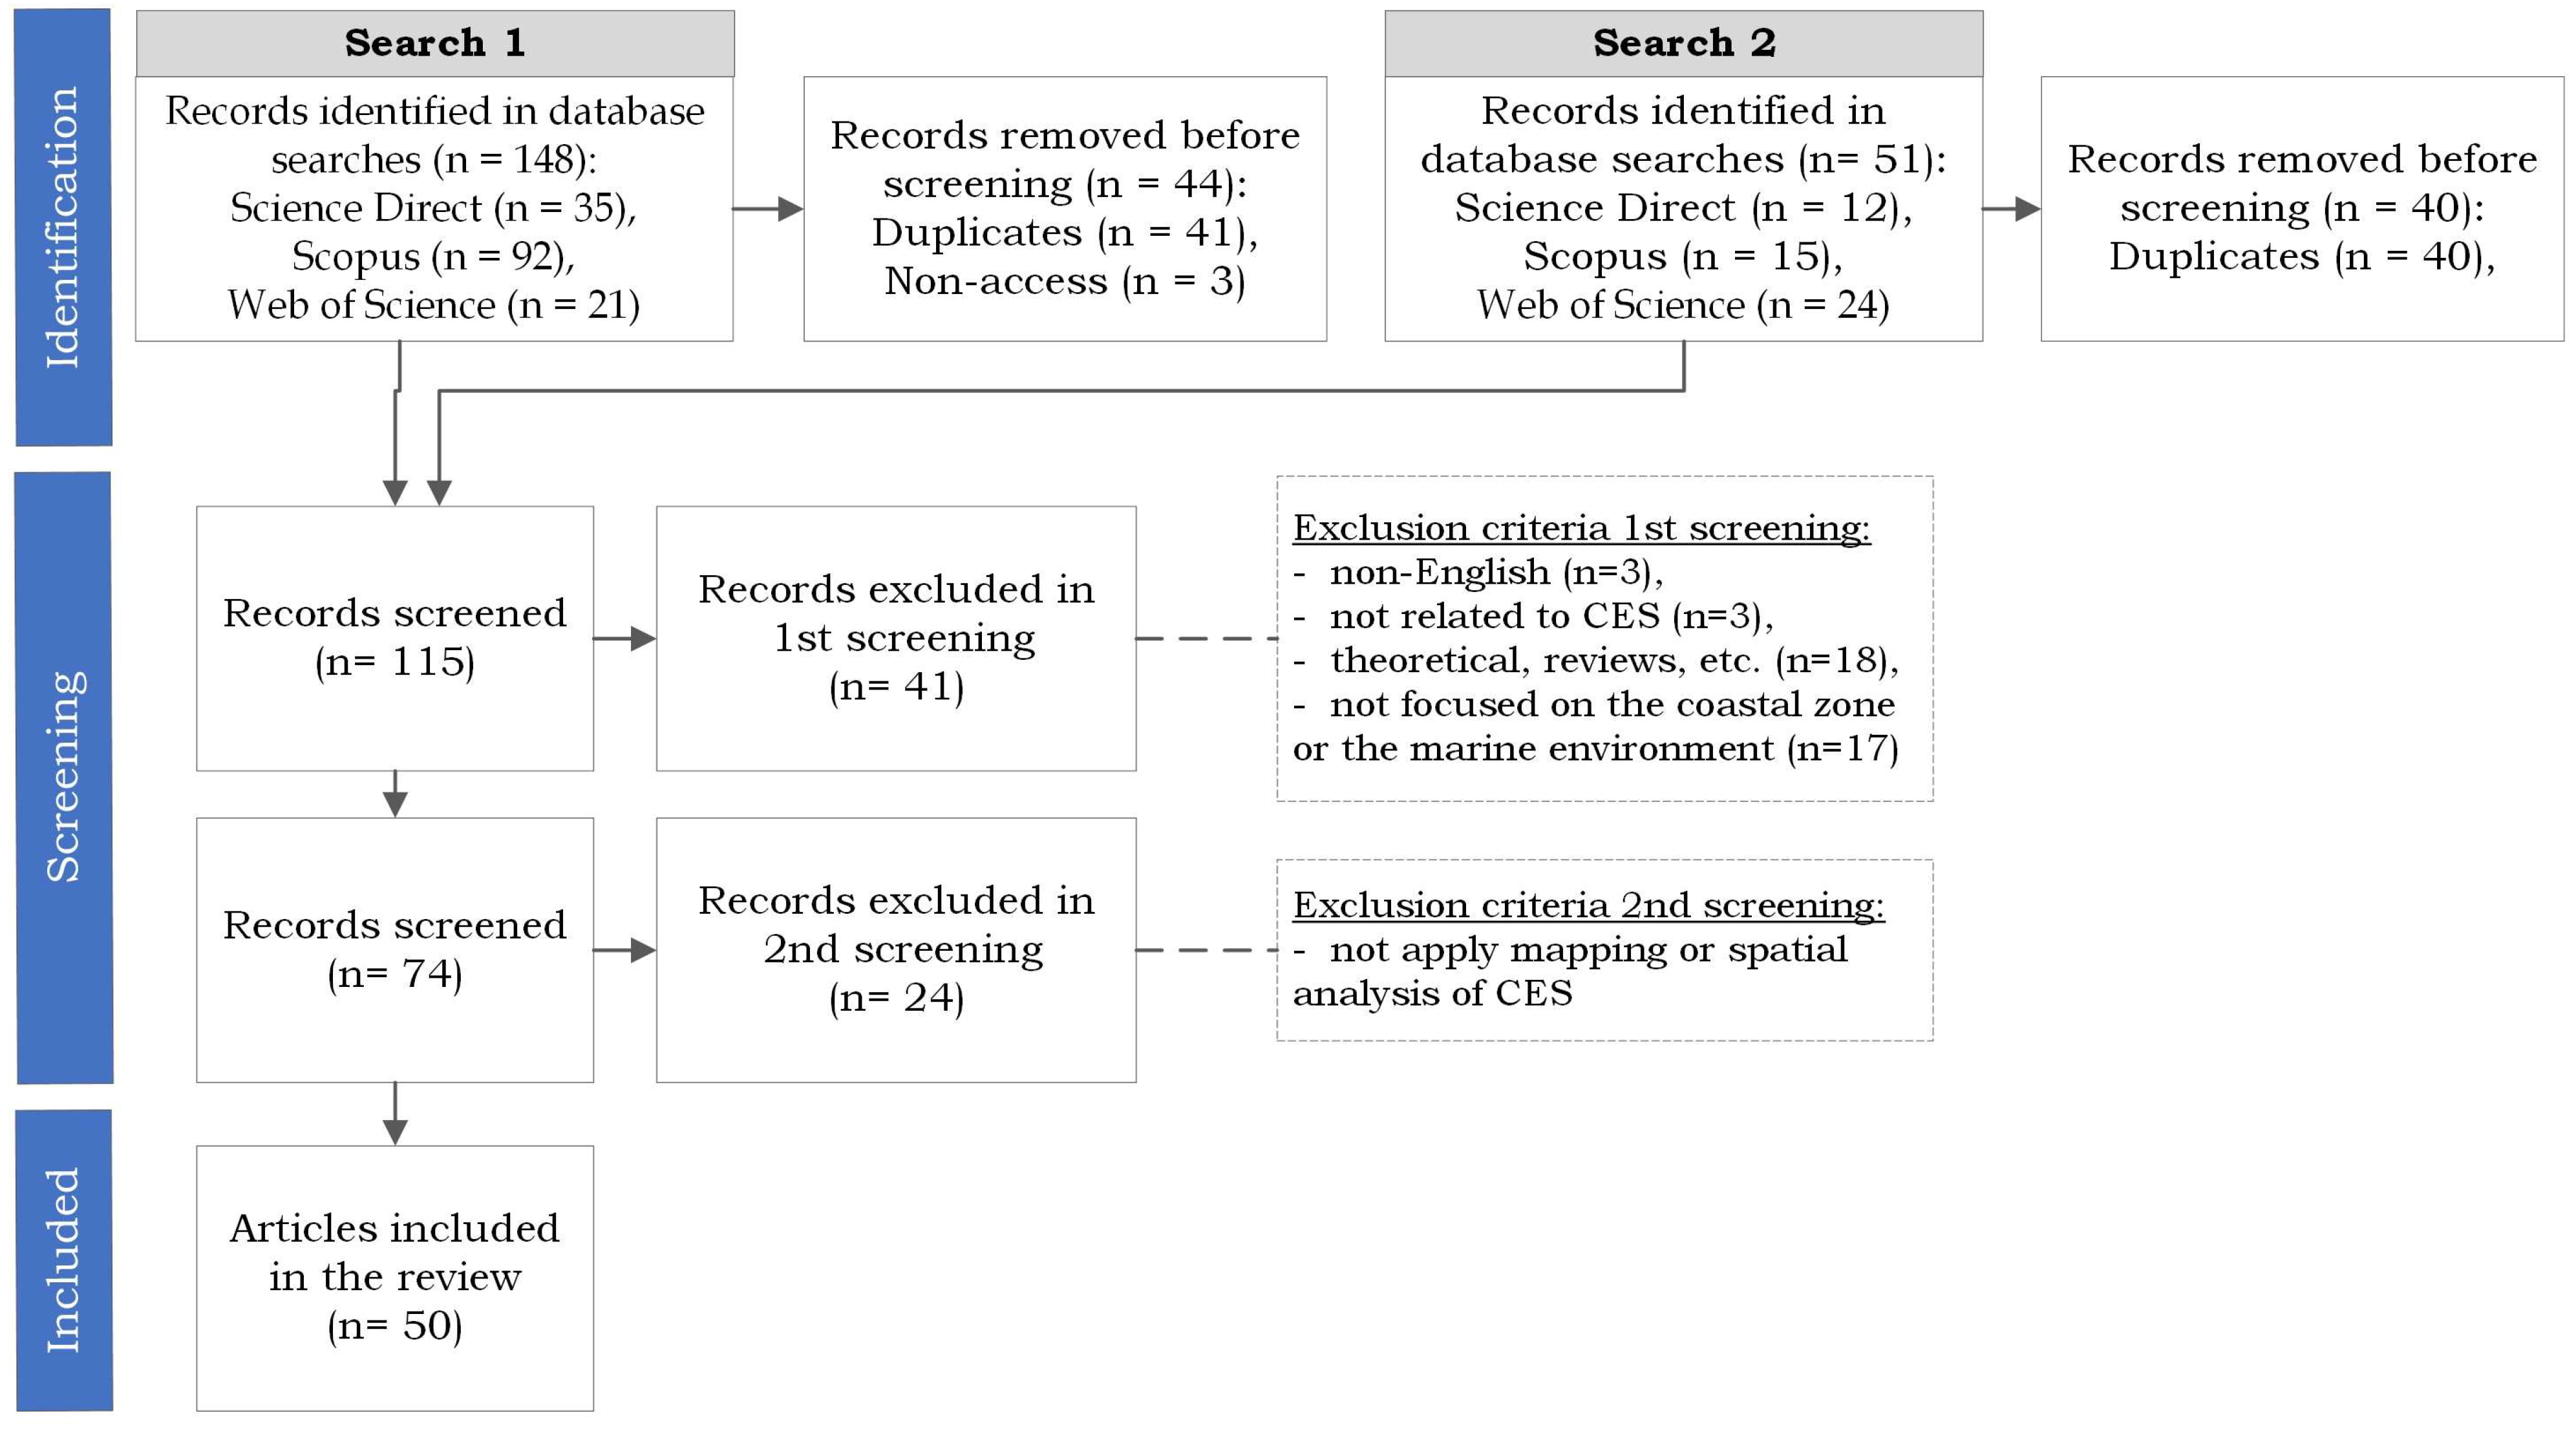
3. Materials and Methods
- written in a language other than English;
- not related to CES;
- theoretical articles—opinion papers and reviews, etc.;
- focused on other environments than the coastal zone or the marine environment.
- (1)
- Spatial analysis (GIS), which refers to any technique or tool applied in a GIS environment.
- (2)
- Statistical analysis, which signifies any statistical method applied in a statistical software;
- (3)
- Modelling for ES, meaning software tools developed specifically for ES assessment, such as the InVEST1 (Integrated Valuation of Ecosystem Services and Tradeoffs). InVEST is a set of free, open-source software models that “enables decision-makers to quantify the importance of natural capital, to assess the trade-offs associated with alternative choices, and to integrate conservation and human development”. SolVES (Social Values for Ecosystem Services), is “a fully open-source, GIS-based tool designed to aid in the creation of quantitative, spatially explicit models of the nonmonetary values attributed to CES, specifically to facilitate their incorporation into larger ecosystem service assessments” [52]; and
- (4)
- other type of analysis, which refers to any other method, technique or tool applied that does not fall into the previous categories. Participatory techniques, tools, and software regarding decision-making techniques and web-based surveys for data collection were collected as well.
4. Results
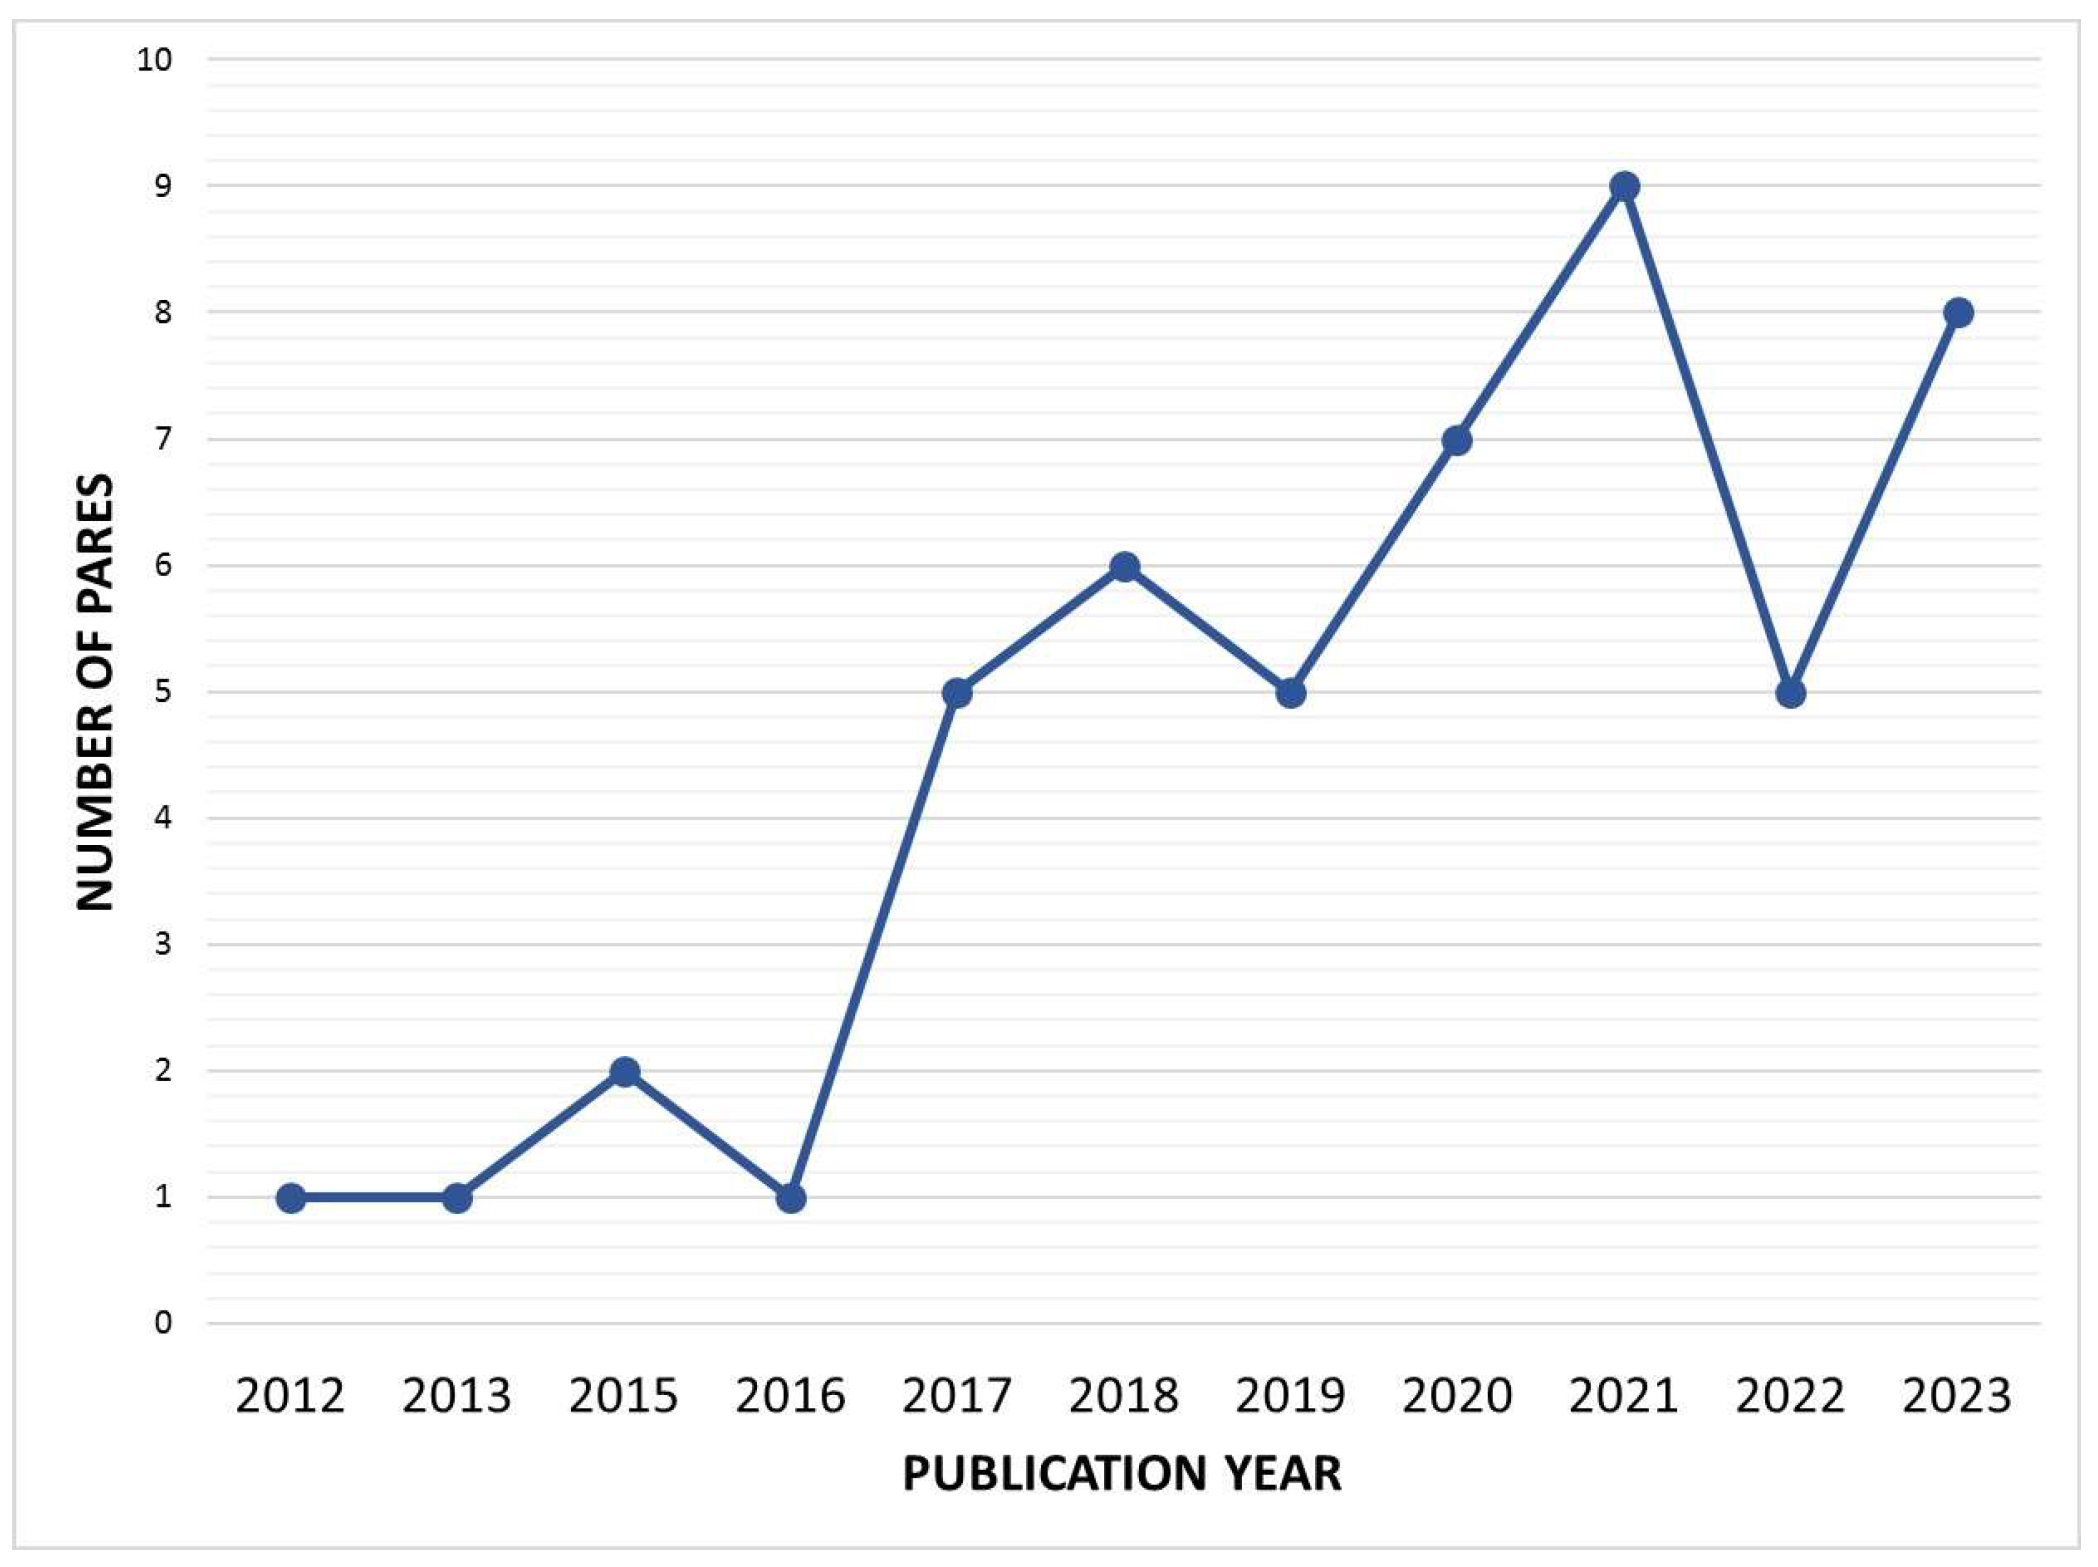
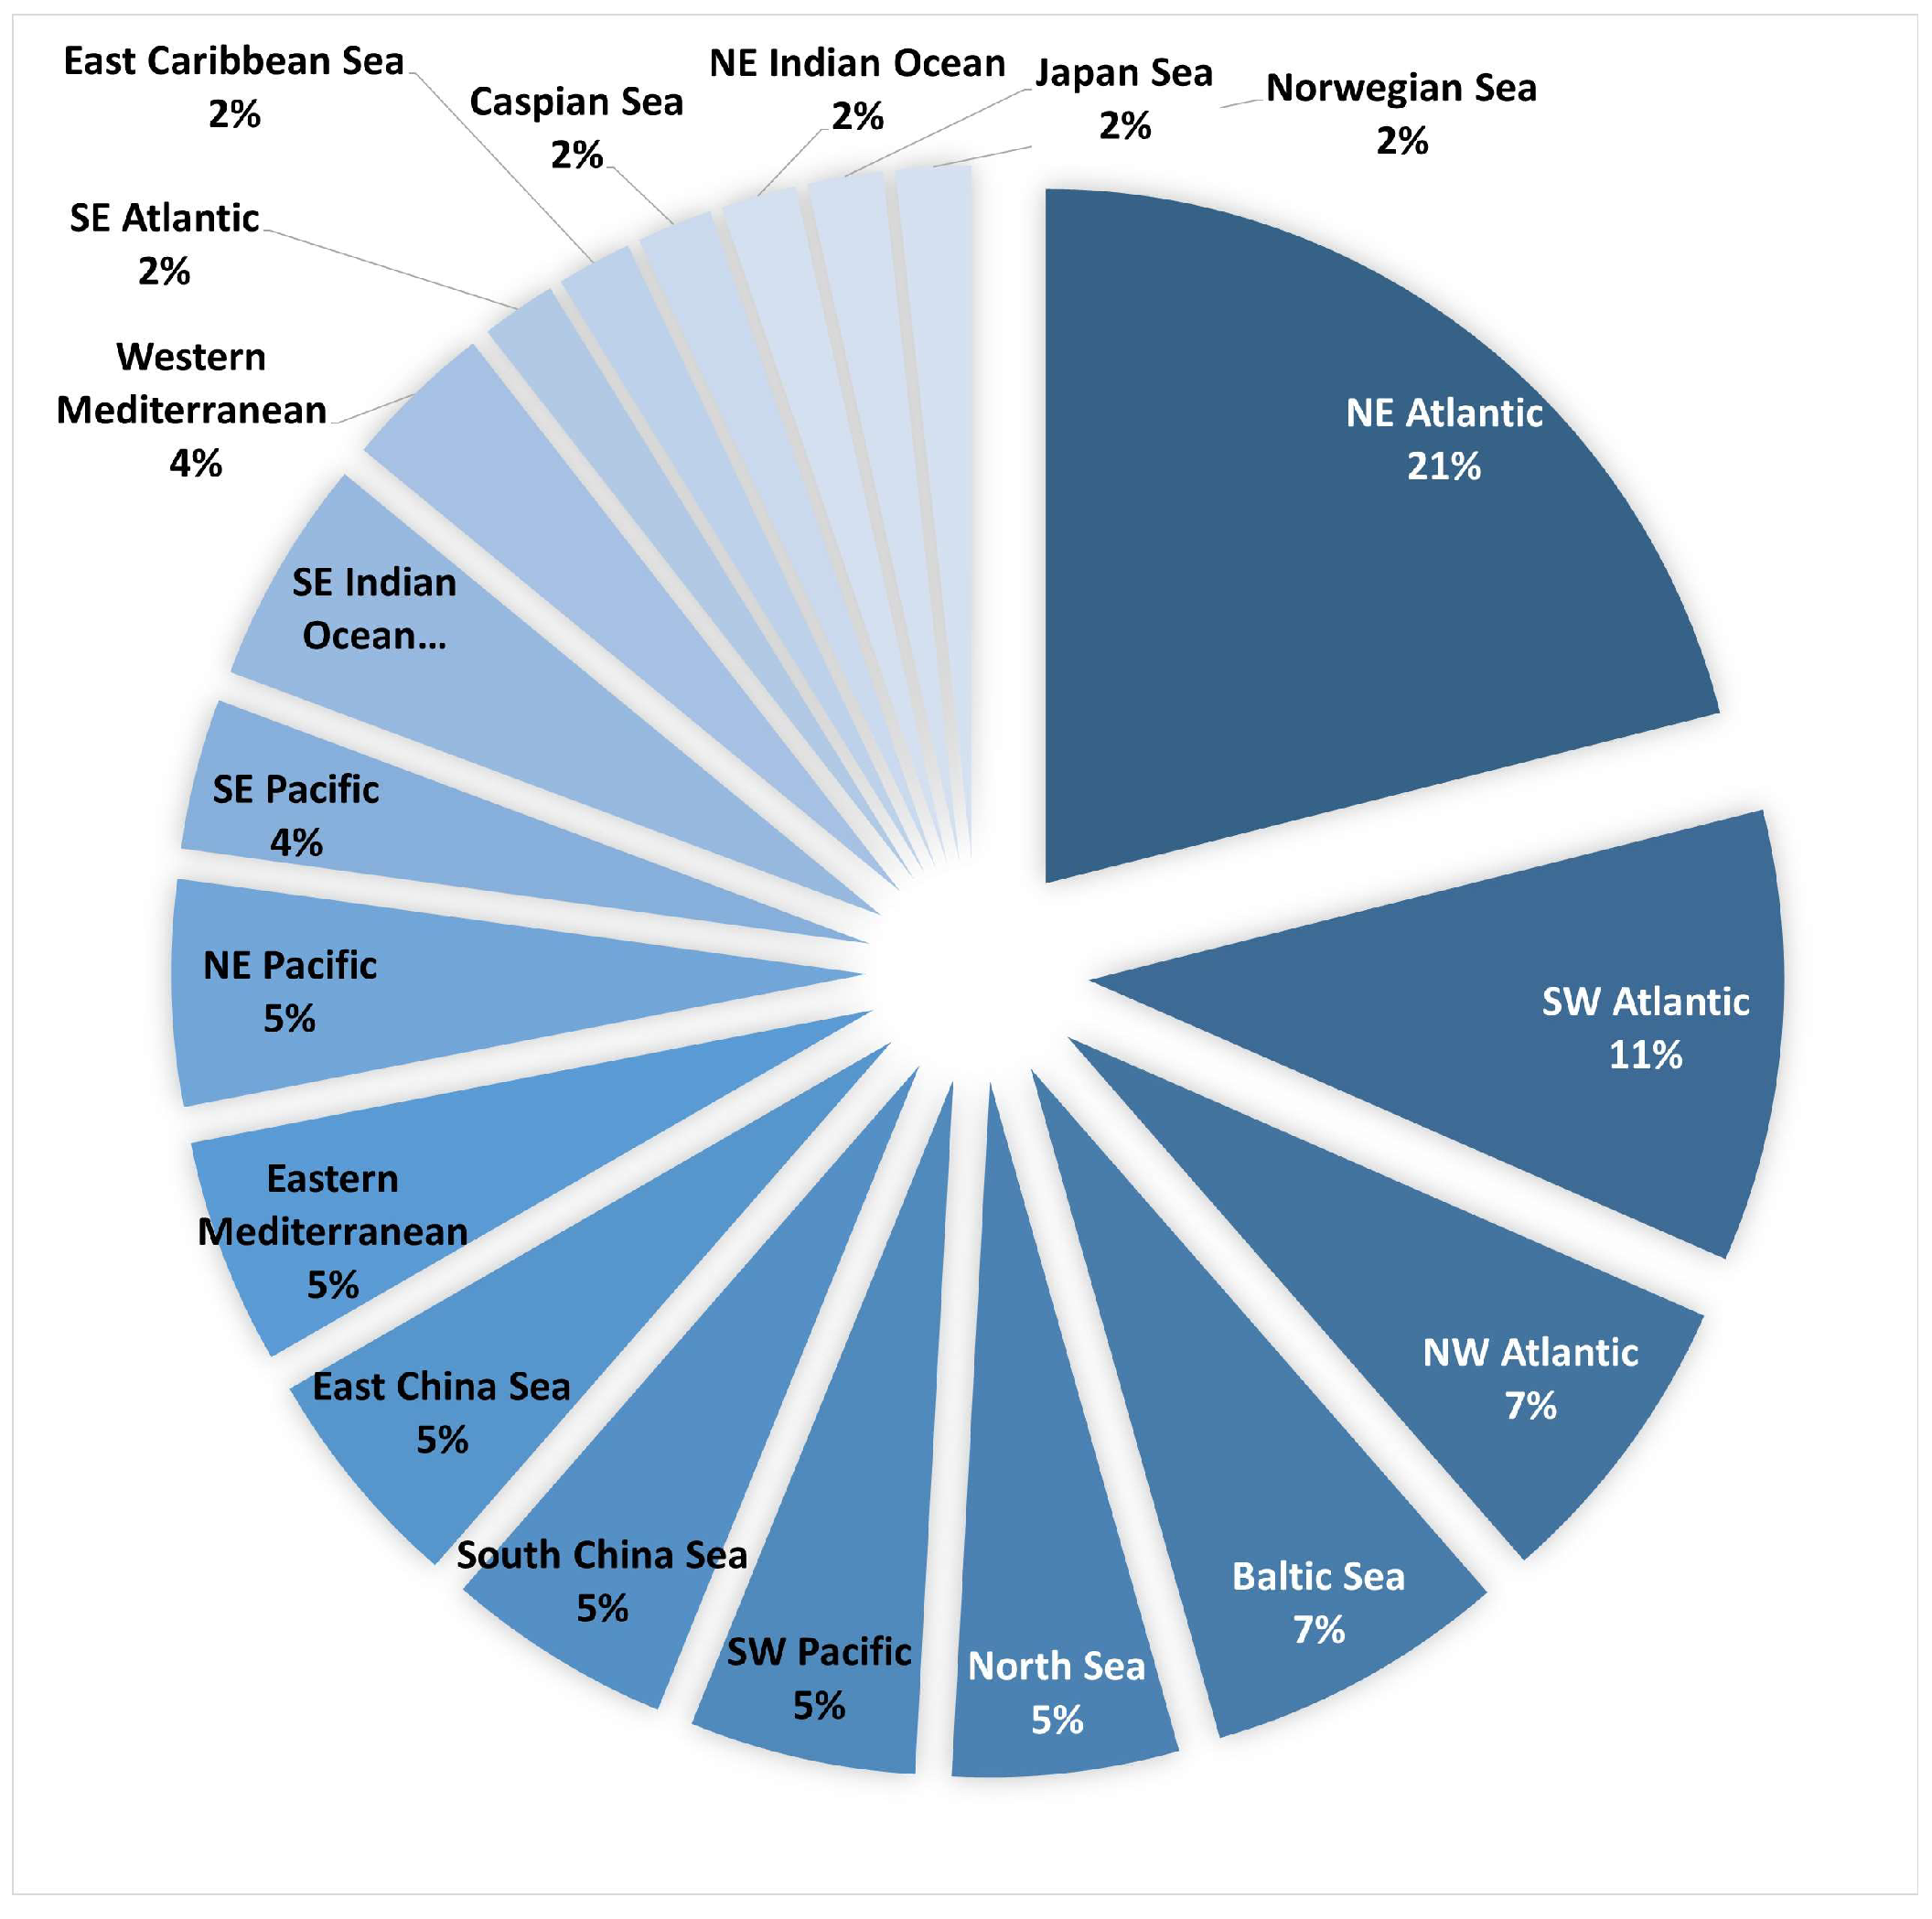
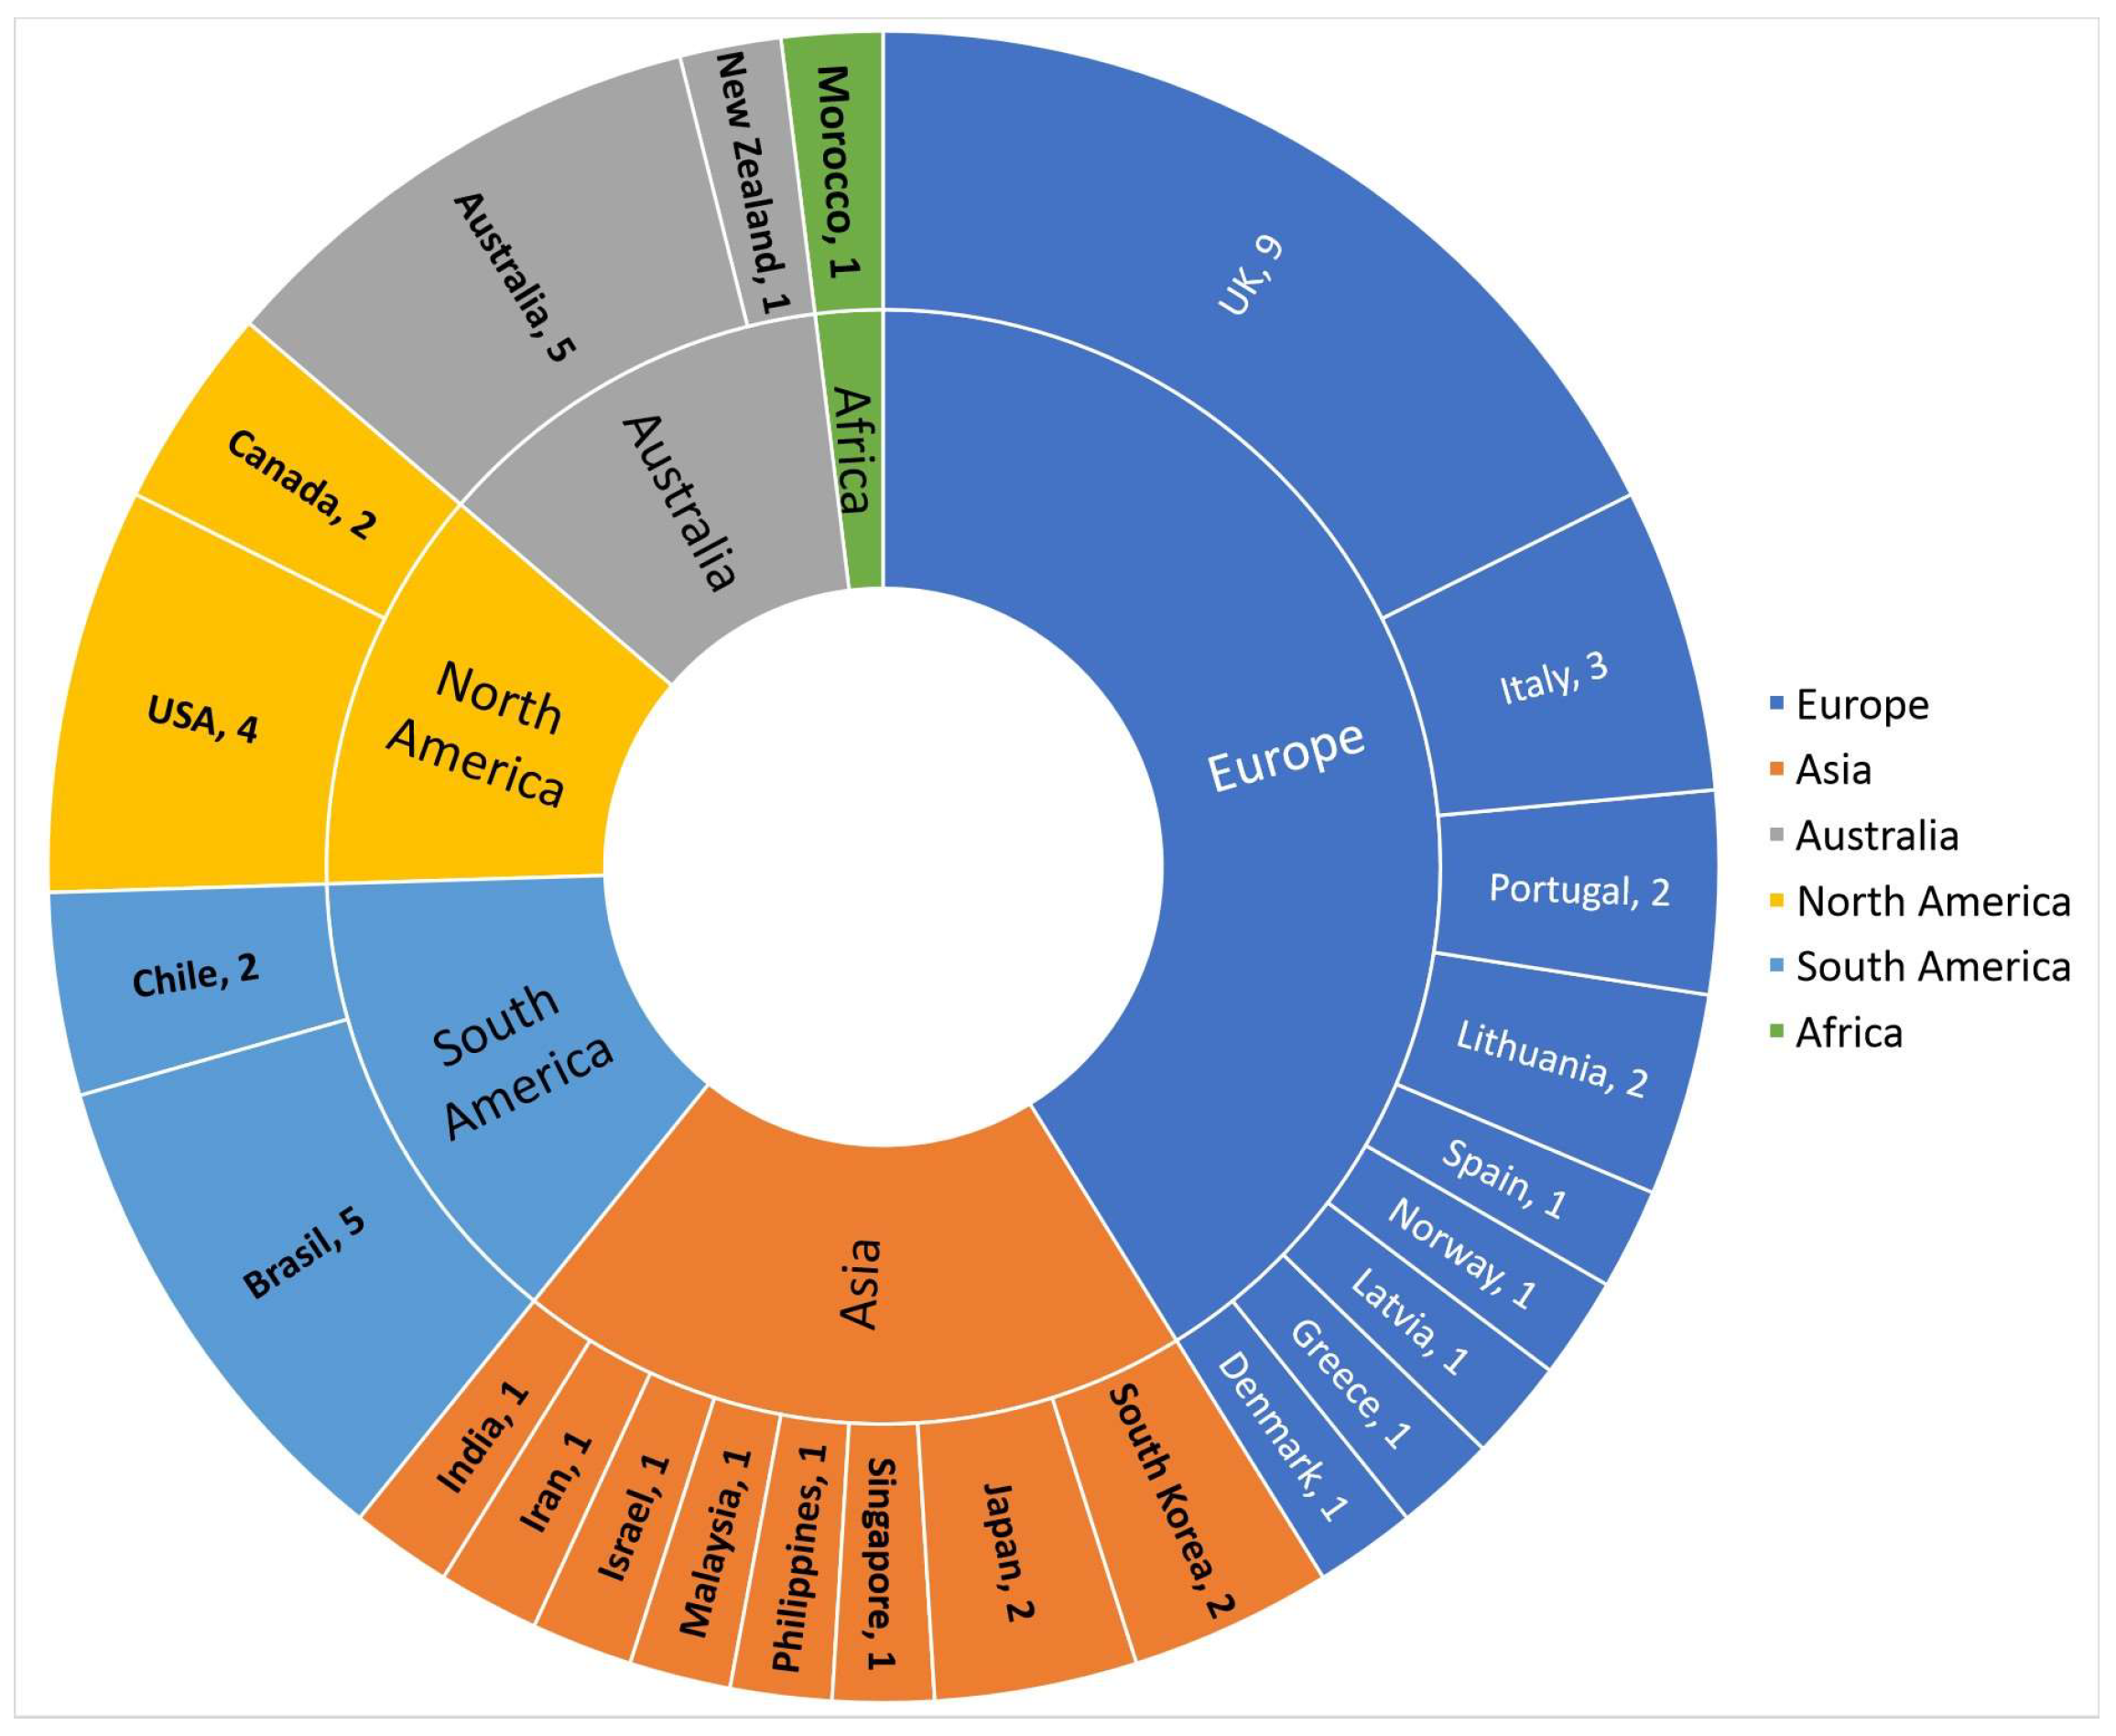
4.1. Spatial and Temporal Distribution of the Papers
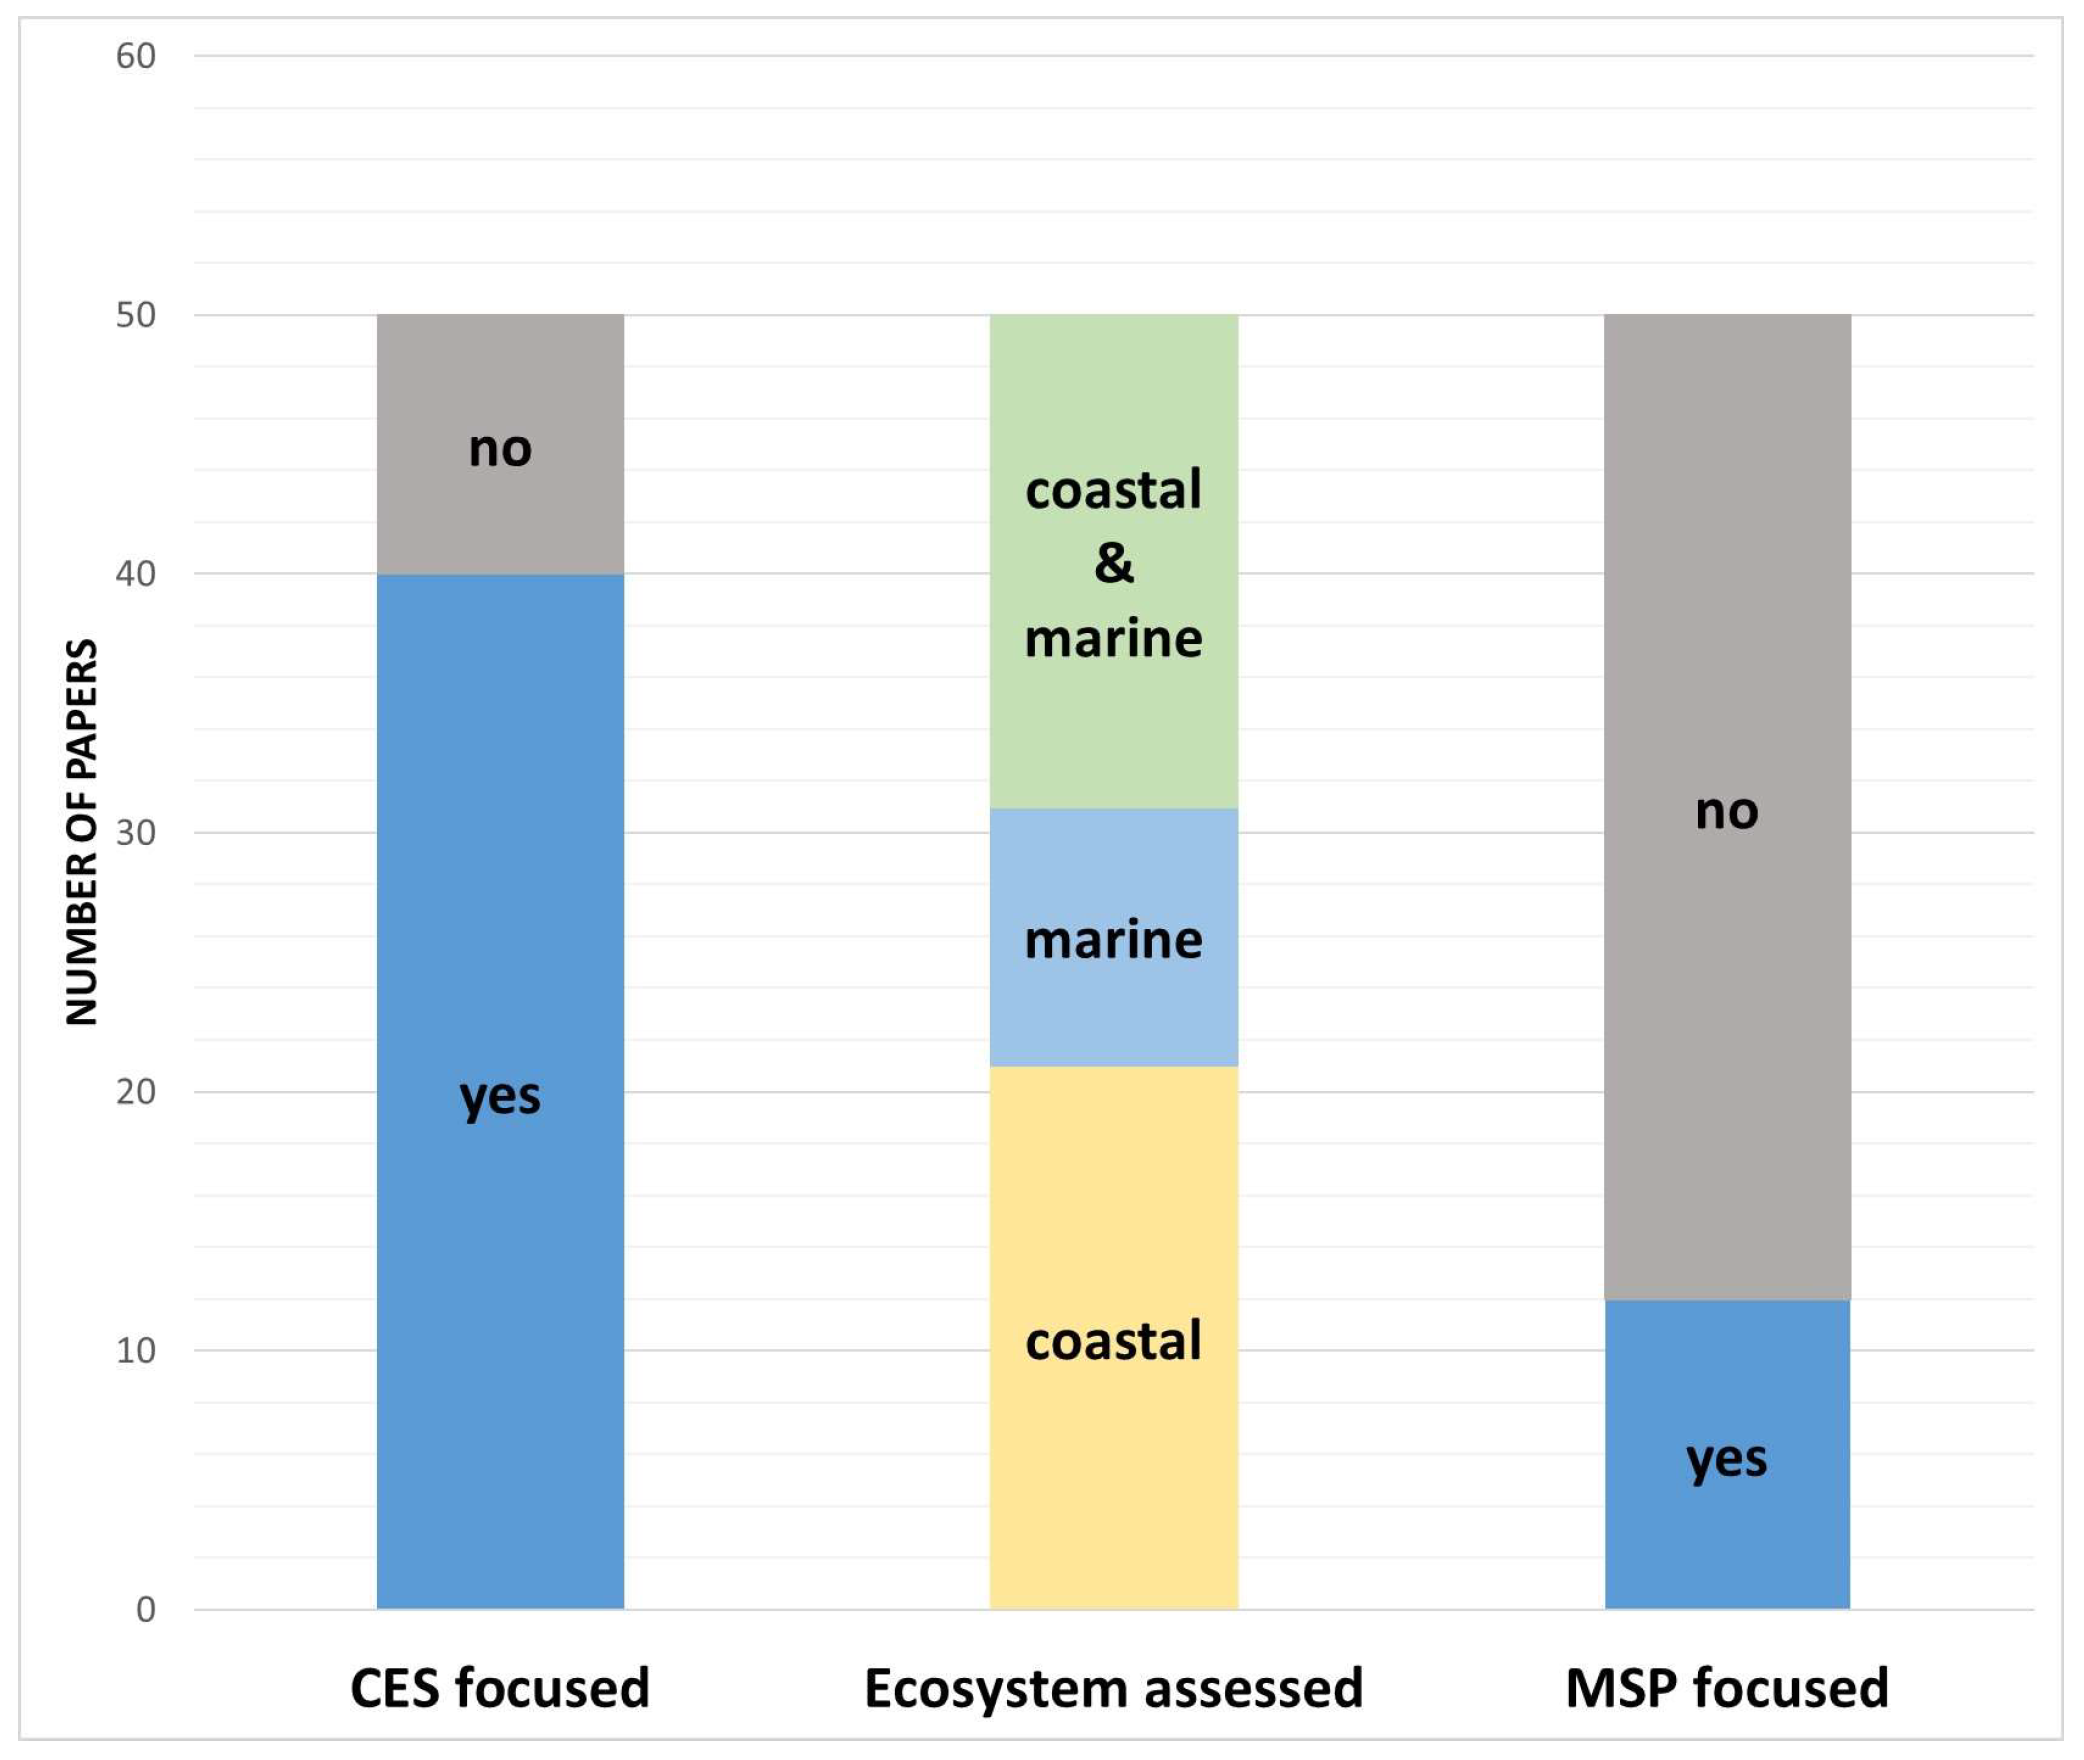
4.2. Focus of the Papers
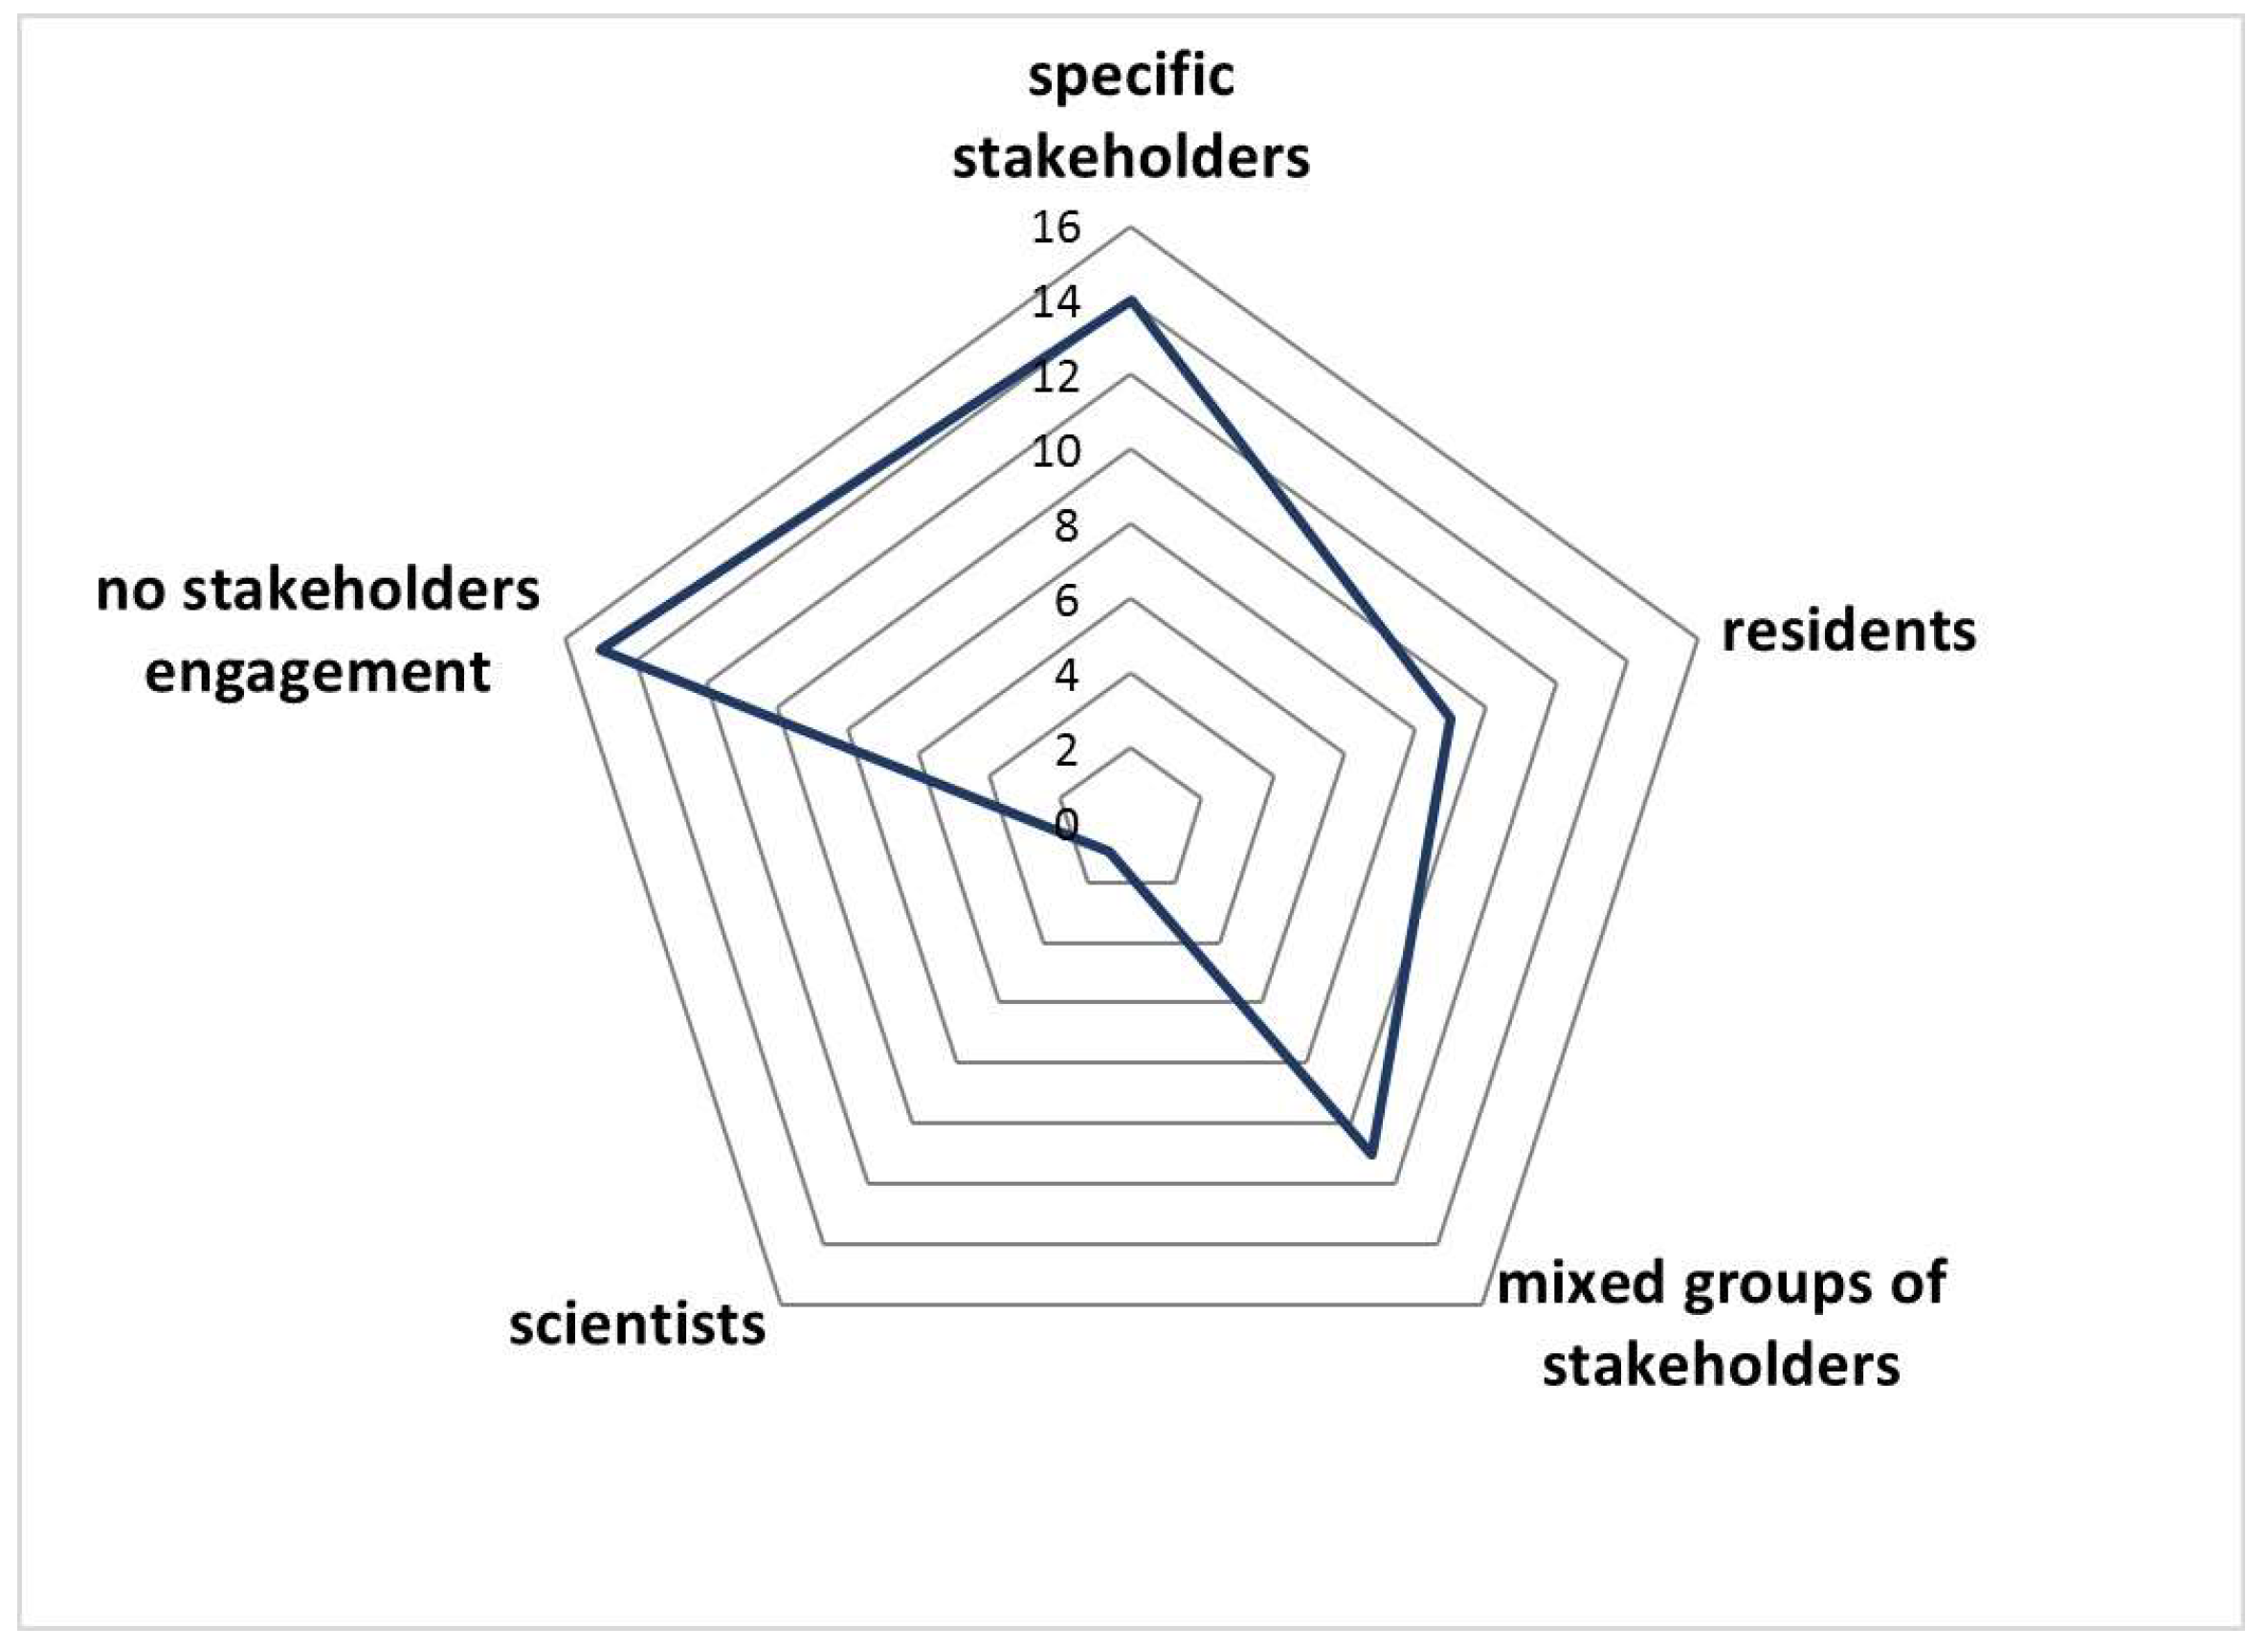
4.3. Type of Engaged Stakeholders
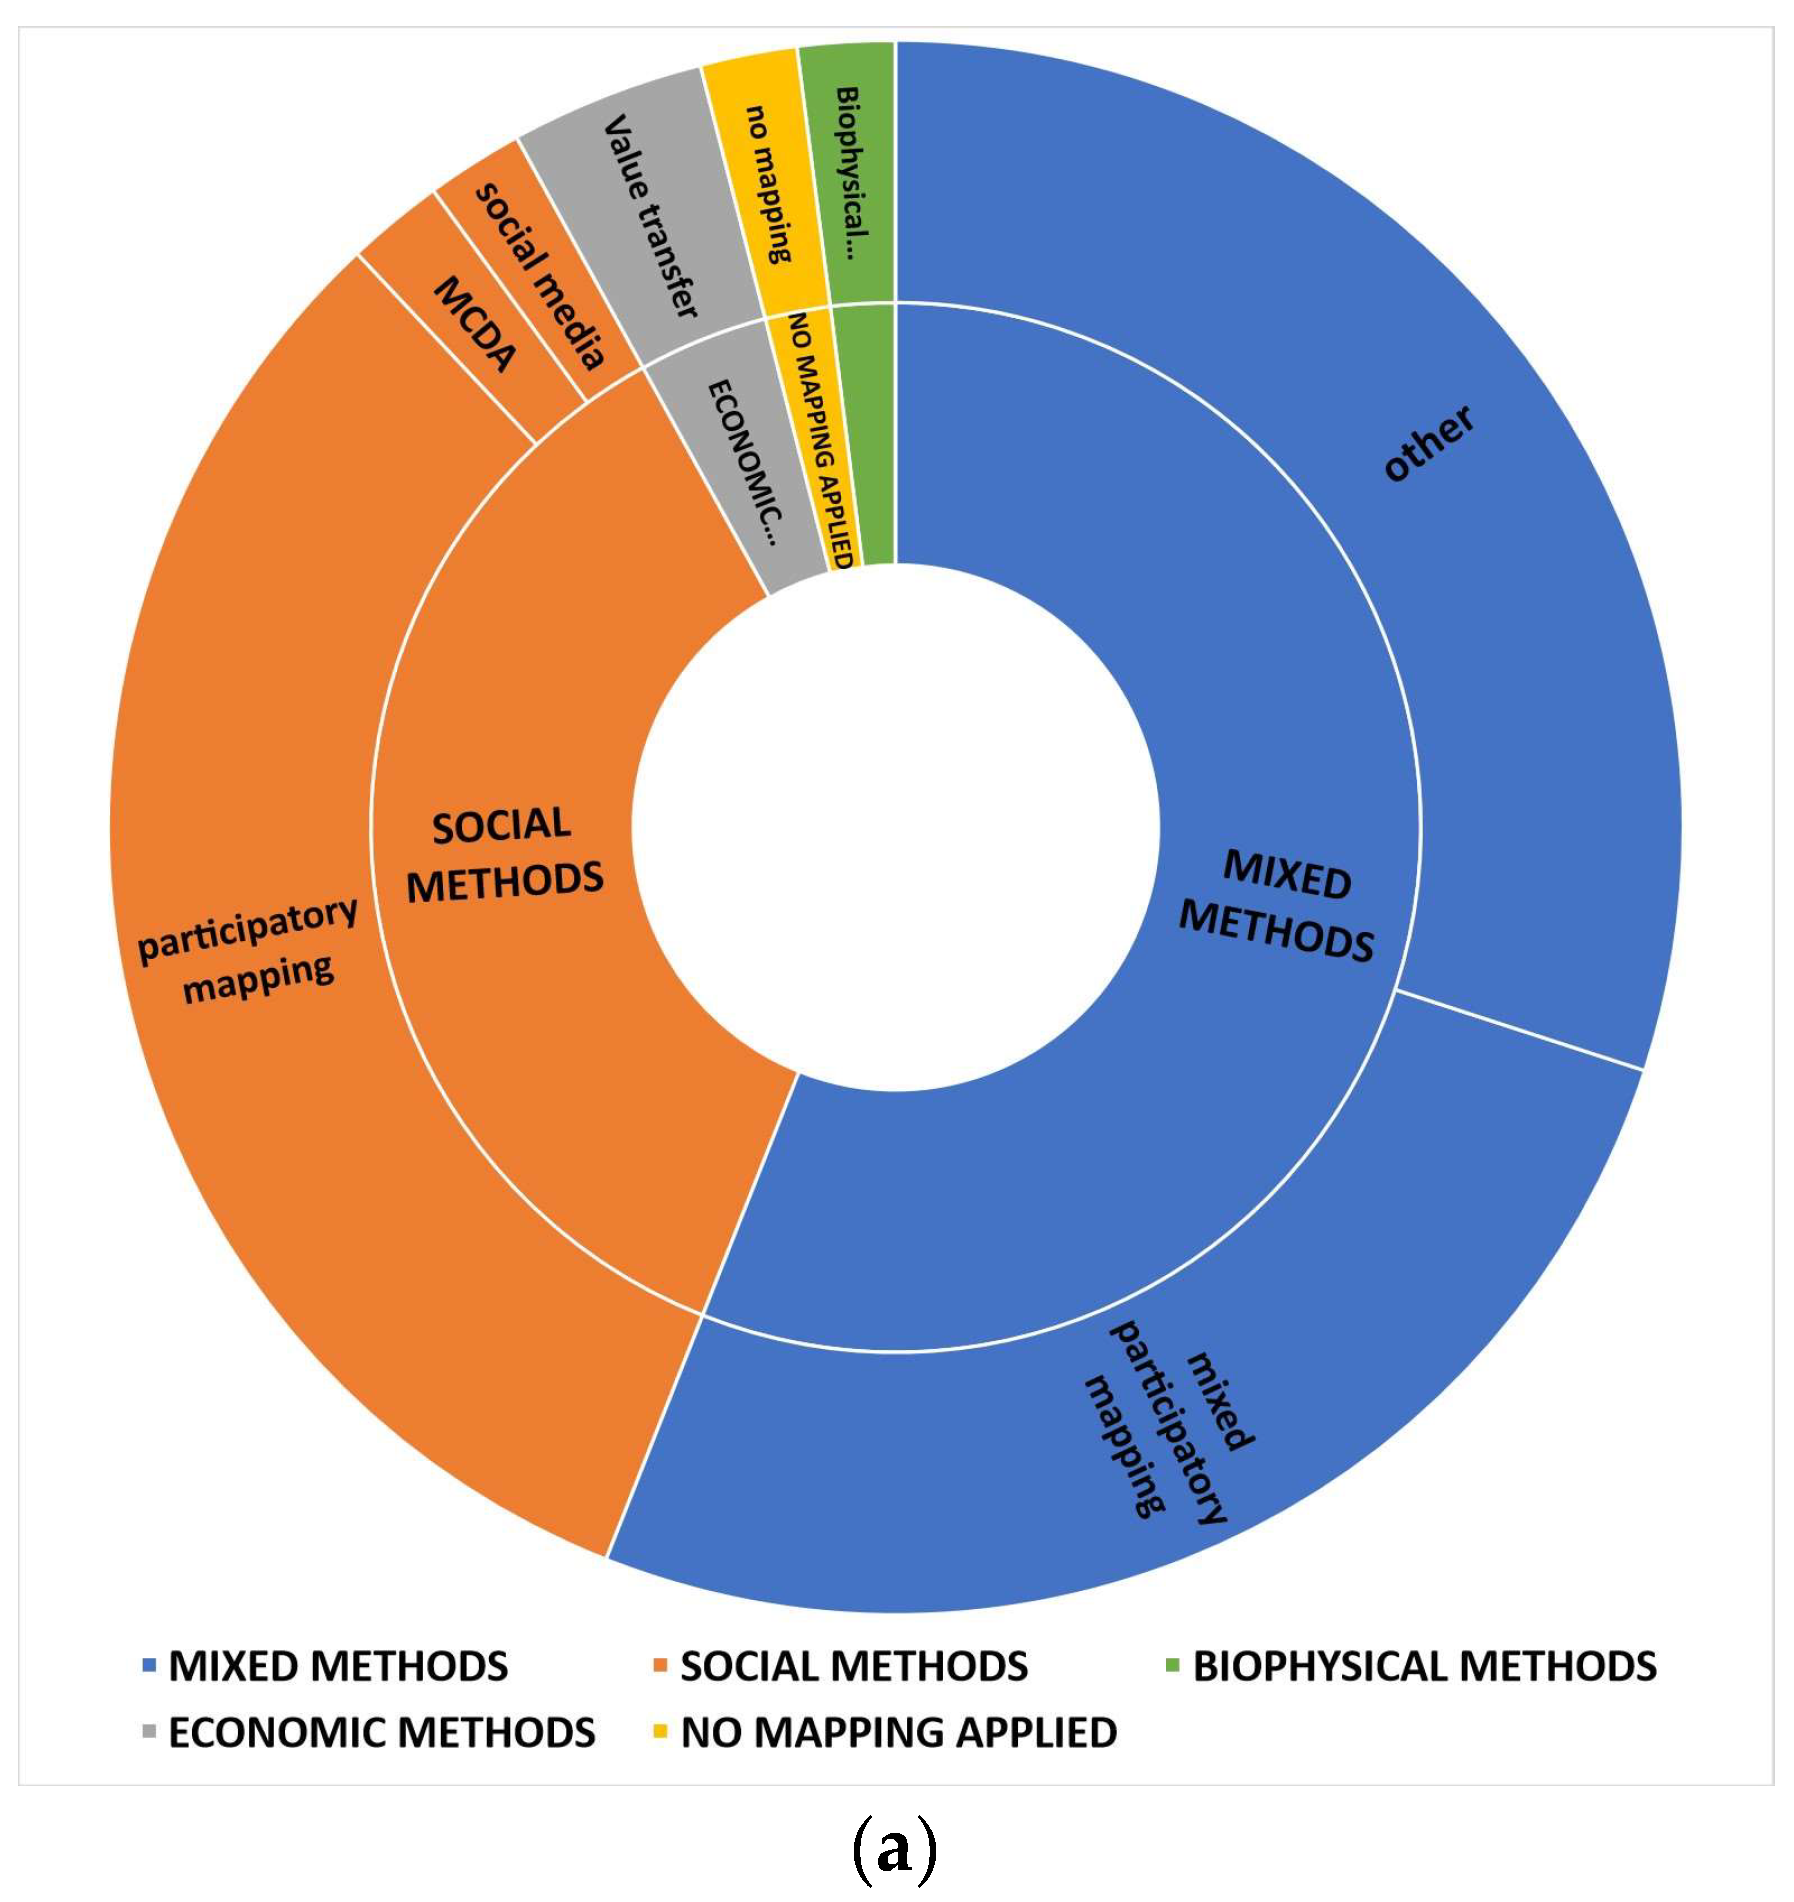
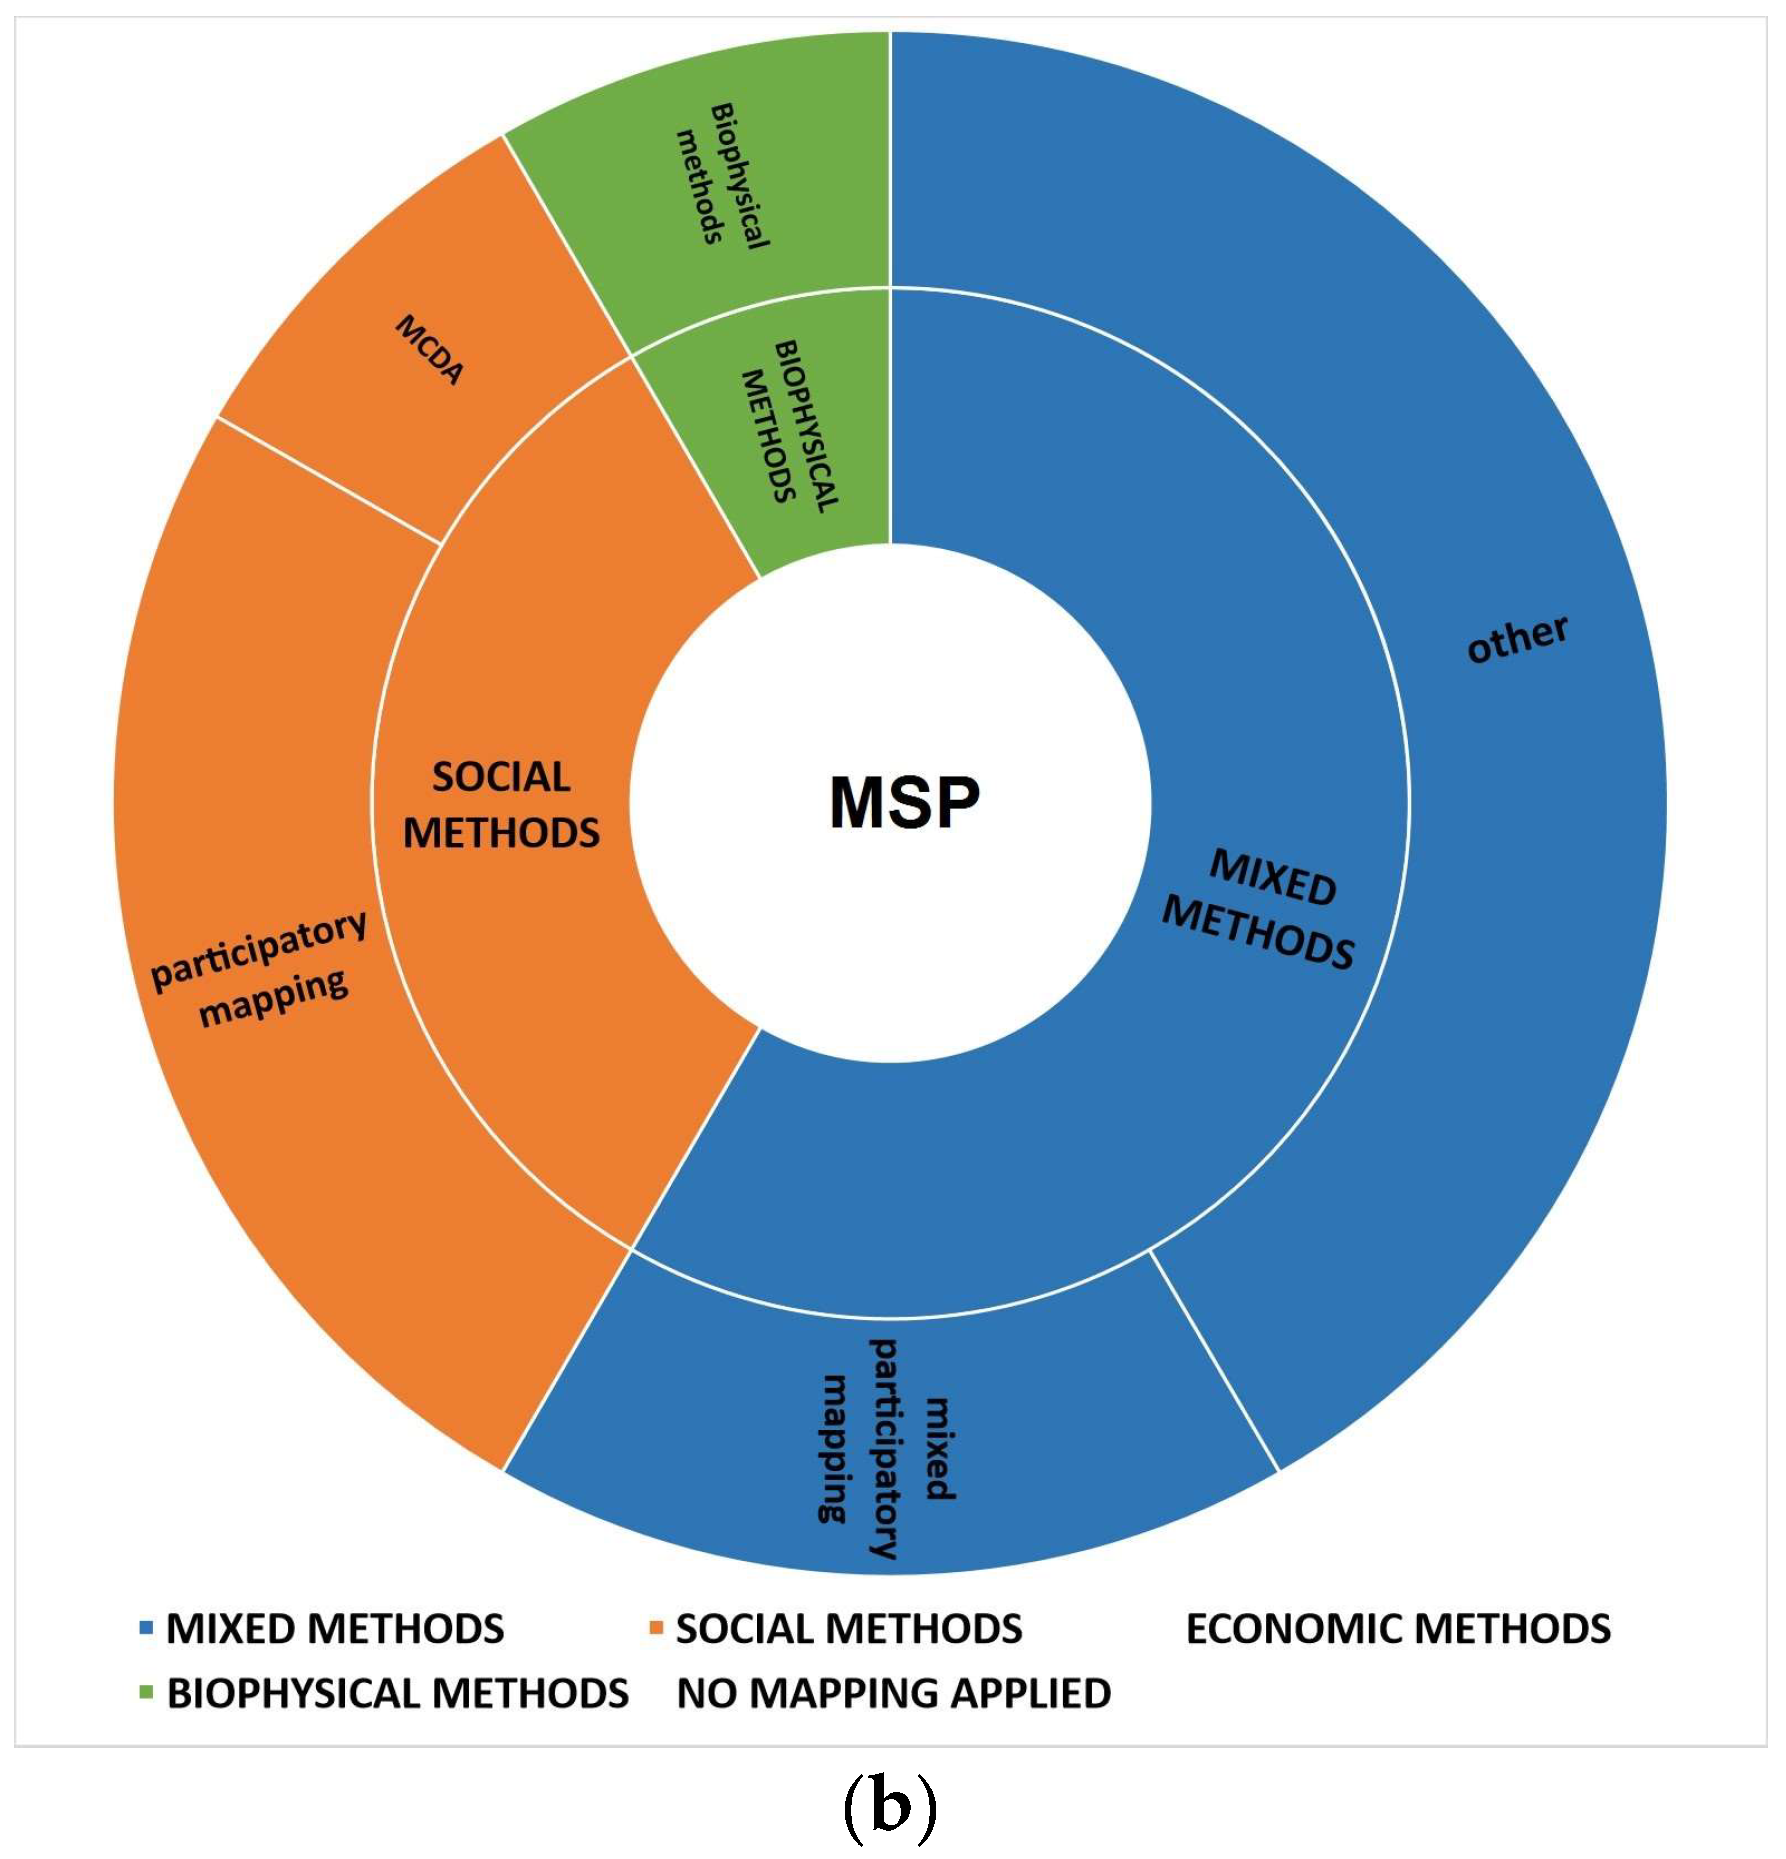
4.4. Mapping Approaches
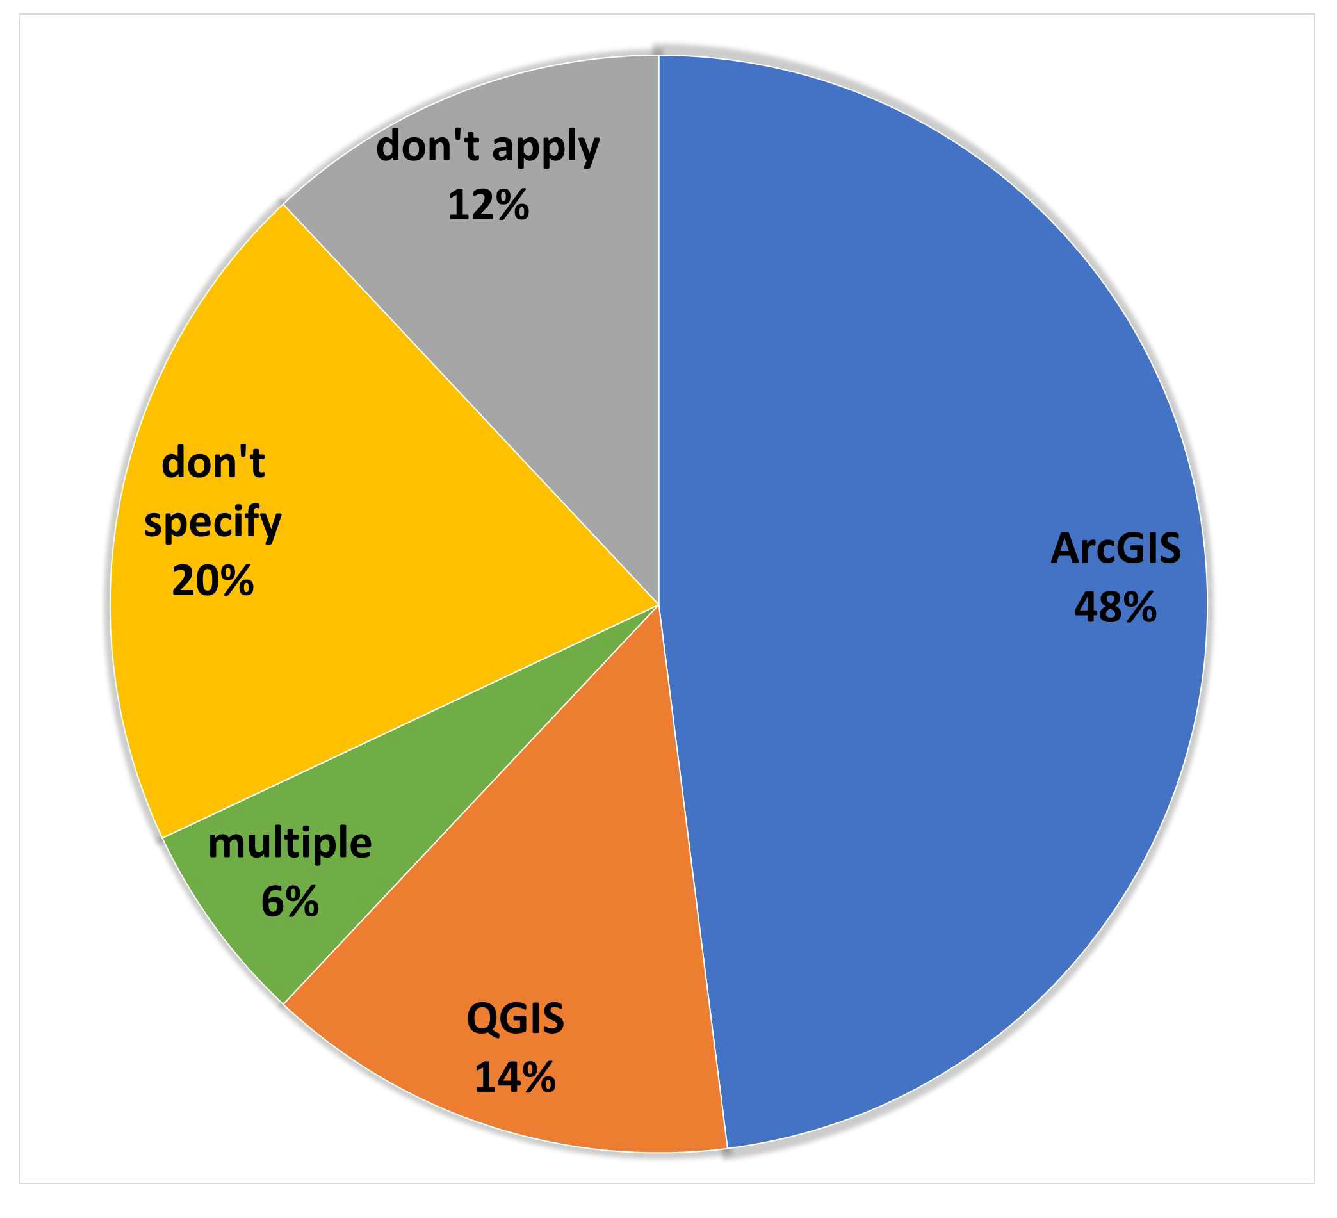
4.4.1. Use of Participatory Geographic Information Systems (GIS)
4.4.2. Other Types of Mapping Approaches
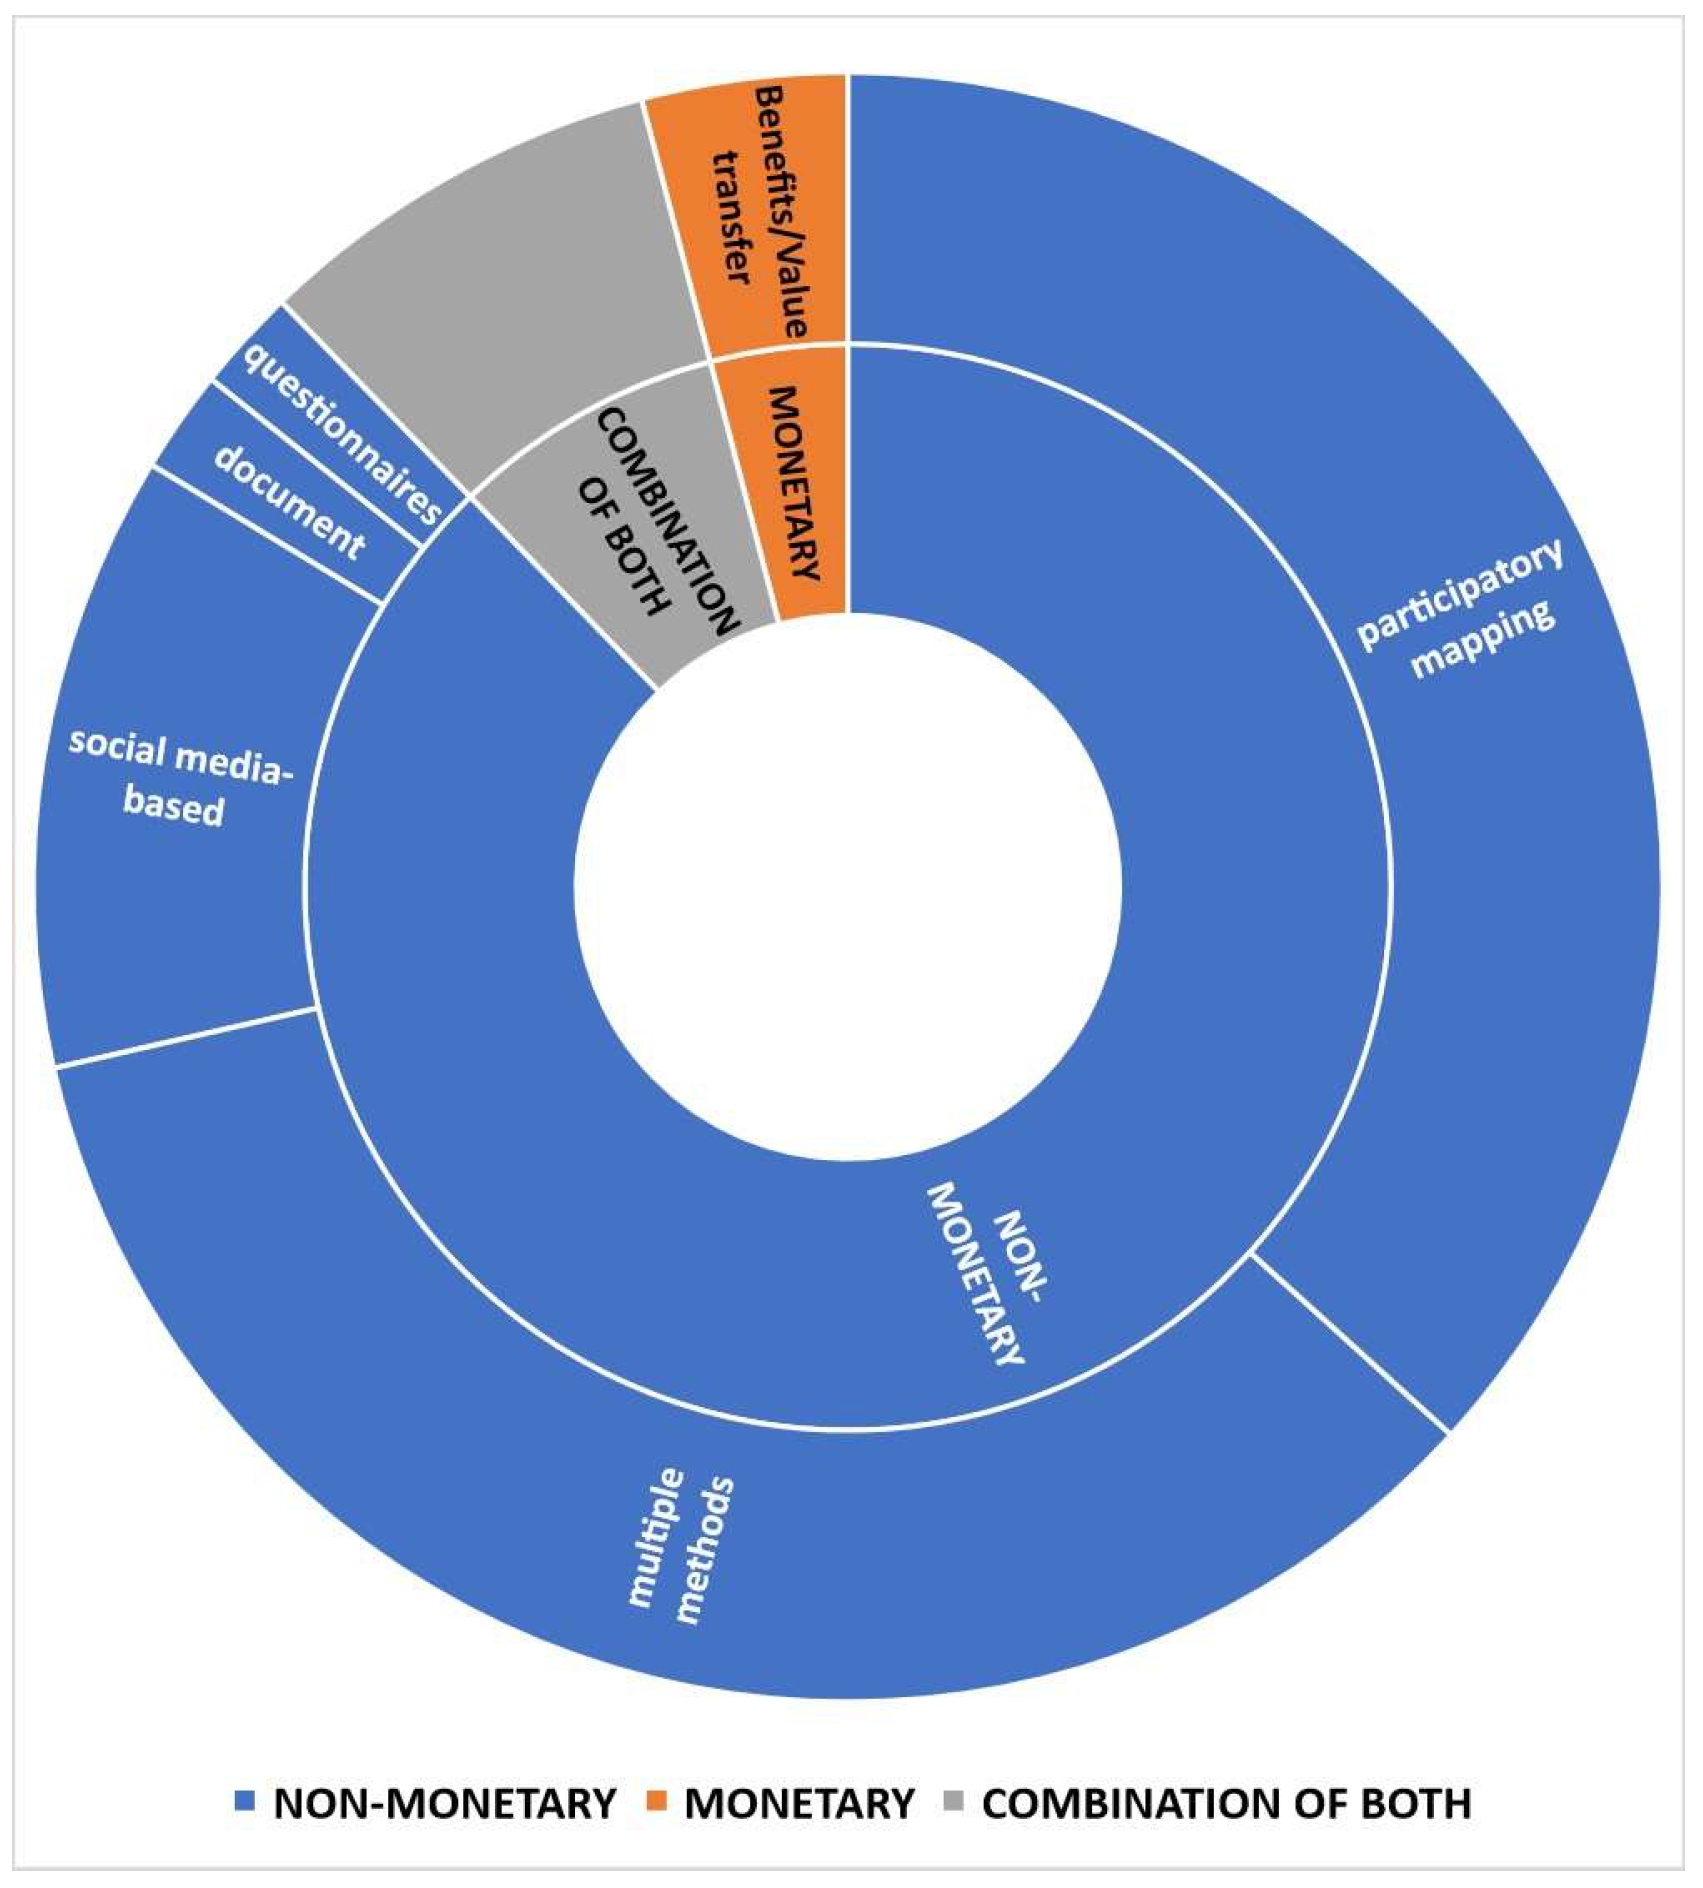
4.5. Valuation Methods Applied
4.6. Techniques, Tools and Software Used
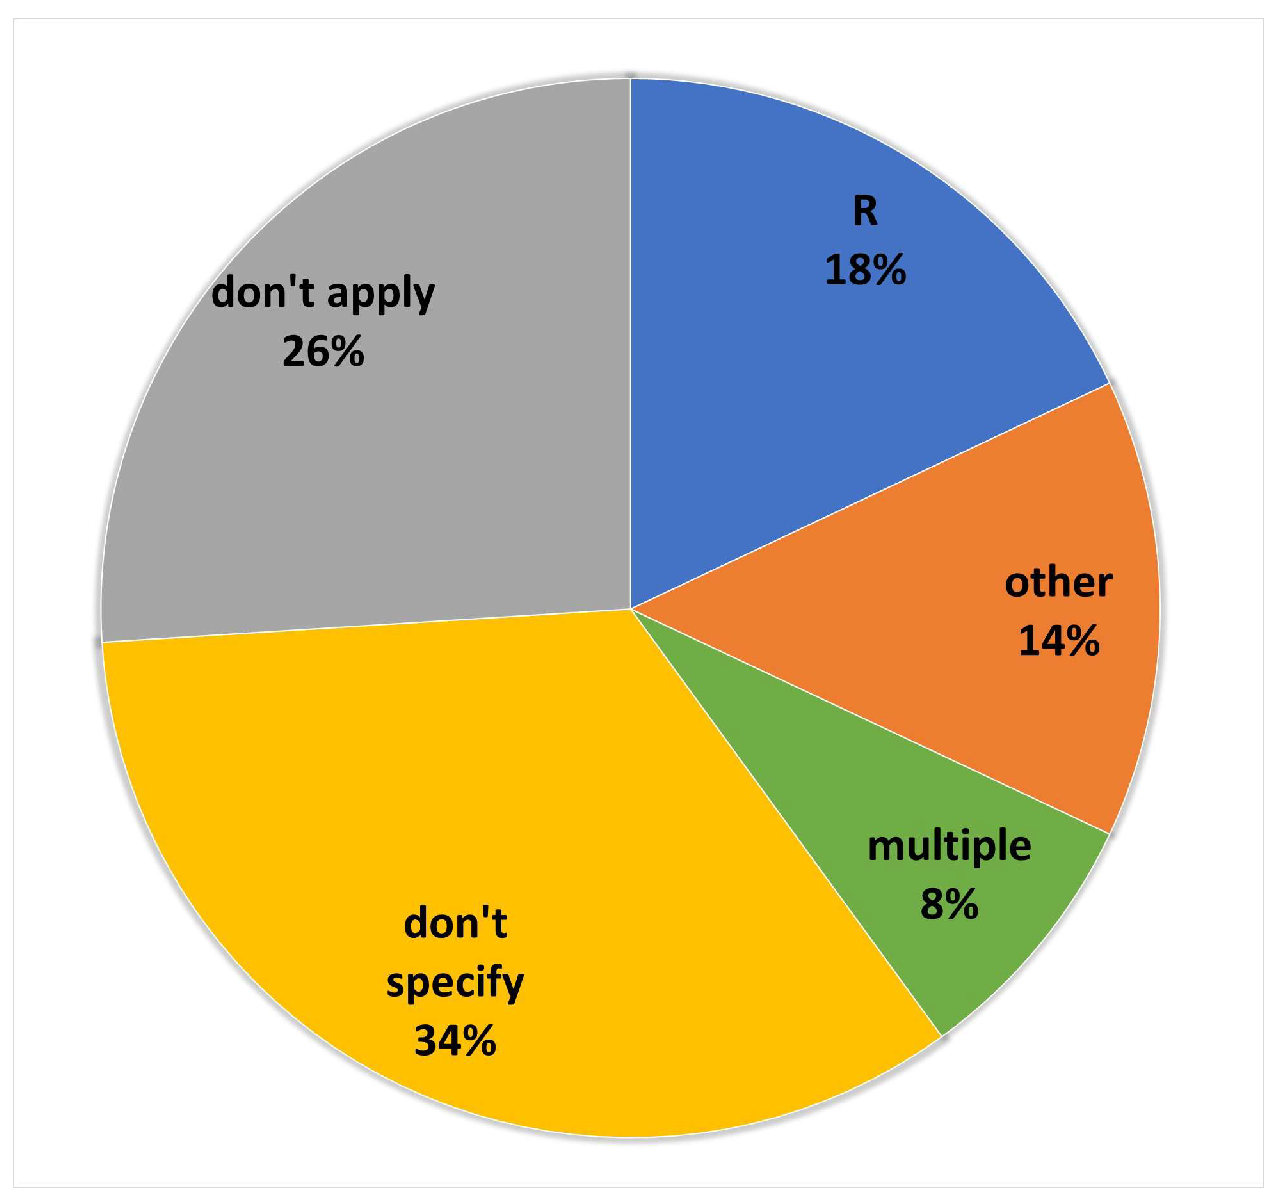
4.6.1. Per Category of Desk Analysis
- Chi-square tests to check if the proportion of photographs (coming from the social media) and user counts for specific CES, varied significantly between categories or between different sites in social media analysis [69,82] or to examine the distribution of values in relation to different factors (e.g., by coastal and non-coastal areas, by type of marine protected area, by access, by population density, etc.) [9,58,74]. In some cases, the chi-square independence analysis test was applied along with proportional analysis that tests dependence [9,58].
- Pearson correlation analysis to verify the accuracy of spatial assessment by comparing the results with existing datasets [57,60,86] or to examine for possible relationships between different coastal activities and the reasons that undermine them [73] or to evaluate spatial association between different CES [69].
- The non-parametric Spearman’s rank correlation coefficient to examine the correlation between different pairs of values (e.g., non-monetary– monetary, non-monetary–threats) [24] and between different CES and CES components (e.g., naturalness, tree density, silent areas, religious sites, and accommodation) [63].
- Finally, canonical correlation analysis was used to investigate whether coastal activities (e.g., fishing) were correlated with stressors (e.g., overcrowded spaces) [73].
- Kruskal–Wallis test, to examine influence of a hub on the likelihood of a location being valued depending on its distance to the nearest hub [64] or to compare the mean ranks of scores for different aspects (e.g., ES) of different livelihood groups [87], or to analyze the difference in the total number of CES locations between groups and to examine the effect of the number of tourist visits on the number of CES points [74];
- The Kruskal–Wallis test was also used in combination with other tests (Dunn’s posteriori tests, Steel–Dwass test) [87];
- One-way ANOVA was used to examine potential differences in the level of habitat risks and the provision of four services between conservation-dominated and reclamation-dominated counties, as well as to examine whether several factors—including demographic, socioeconomic, and biophysical determinants—are different between groups [60] or to identify the environmental drivers (e.g., distance to nearest road, settlement, or airfield for access; distance to the nearest patch of invasive species; and mean slope) that drive the location of CES between different groups [72];
- Analysis of similarities—ANOSIM to compare the presence/absence of biotopes between those cells used/not used by divers [11]; and
- Permutational multivariate analysis of variance (PERMANOVA) to test for the influence of several attributes on the responses provided by the users [65].
- Linear regression to understand the relationship between socio-demographic variables and the perception of non-material values others used [54];
- Multinomial regression to identify the demographic identity of each group as well as the environmental drivers that drive the location of CES for each of the groups [72];
- Multivariate linear regression to assess tourists’ preferences for cultural and natural landscapes (e.g., natural features, land-cover and land-use types, accessibility, and amenities for tourists) using multiple sources of UGC [86];
- k-means cluster analysis of the Flickr users to better contextualize the types and association of CES engagement at the user level [69];
- Principal component analysis (PCA) to compare the results of different methods [81];
- macro-ecological modelling (MaxEnt) to model the spatial distribution of different CES in social-media analysis [82];
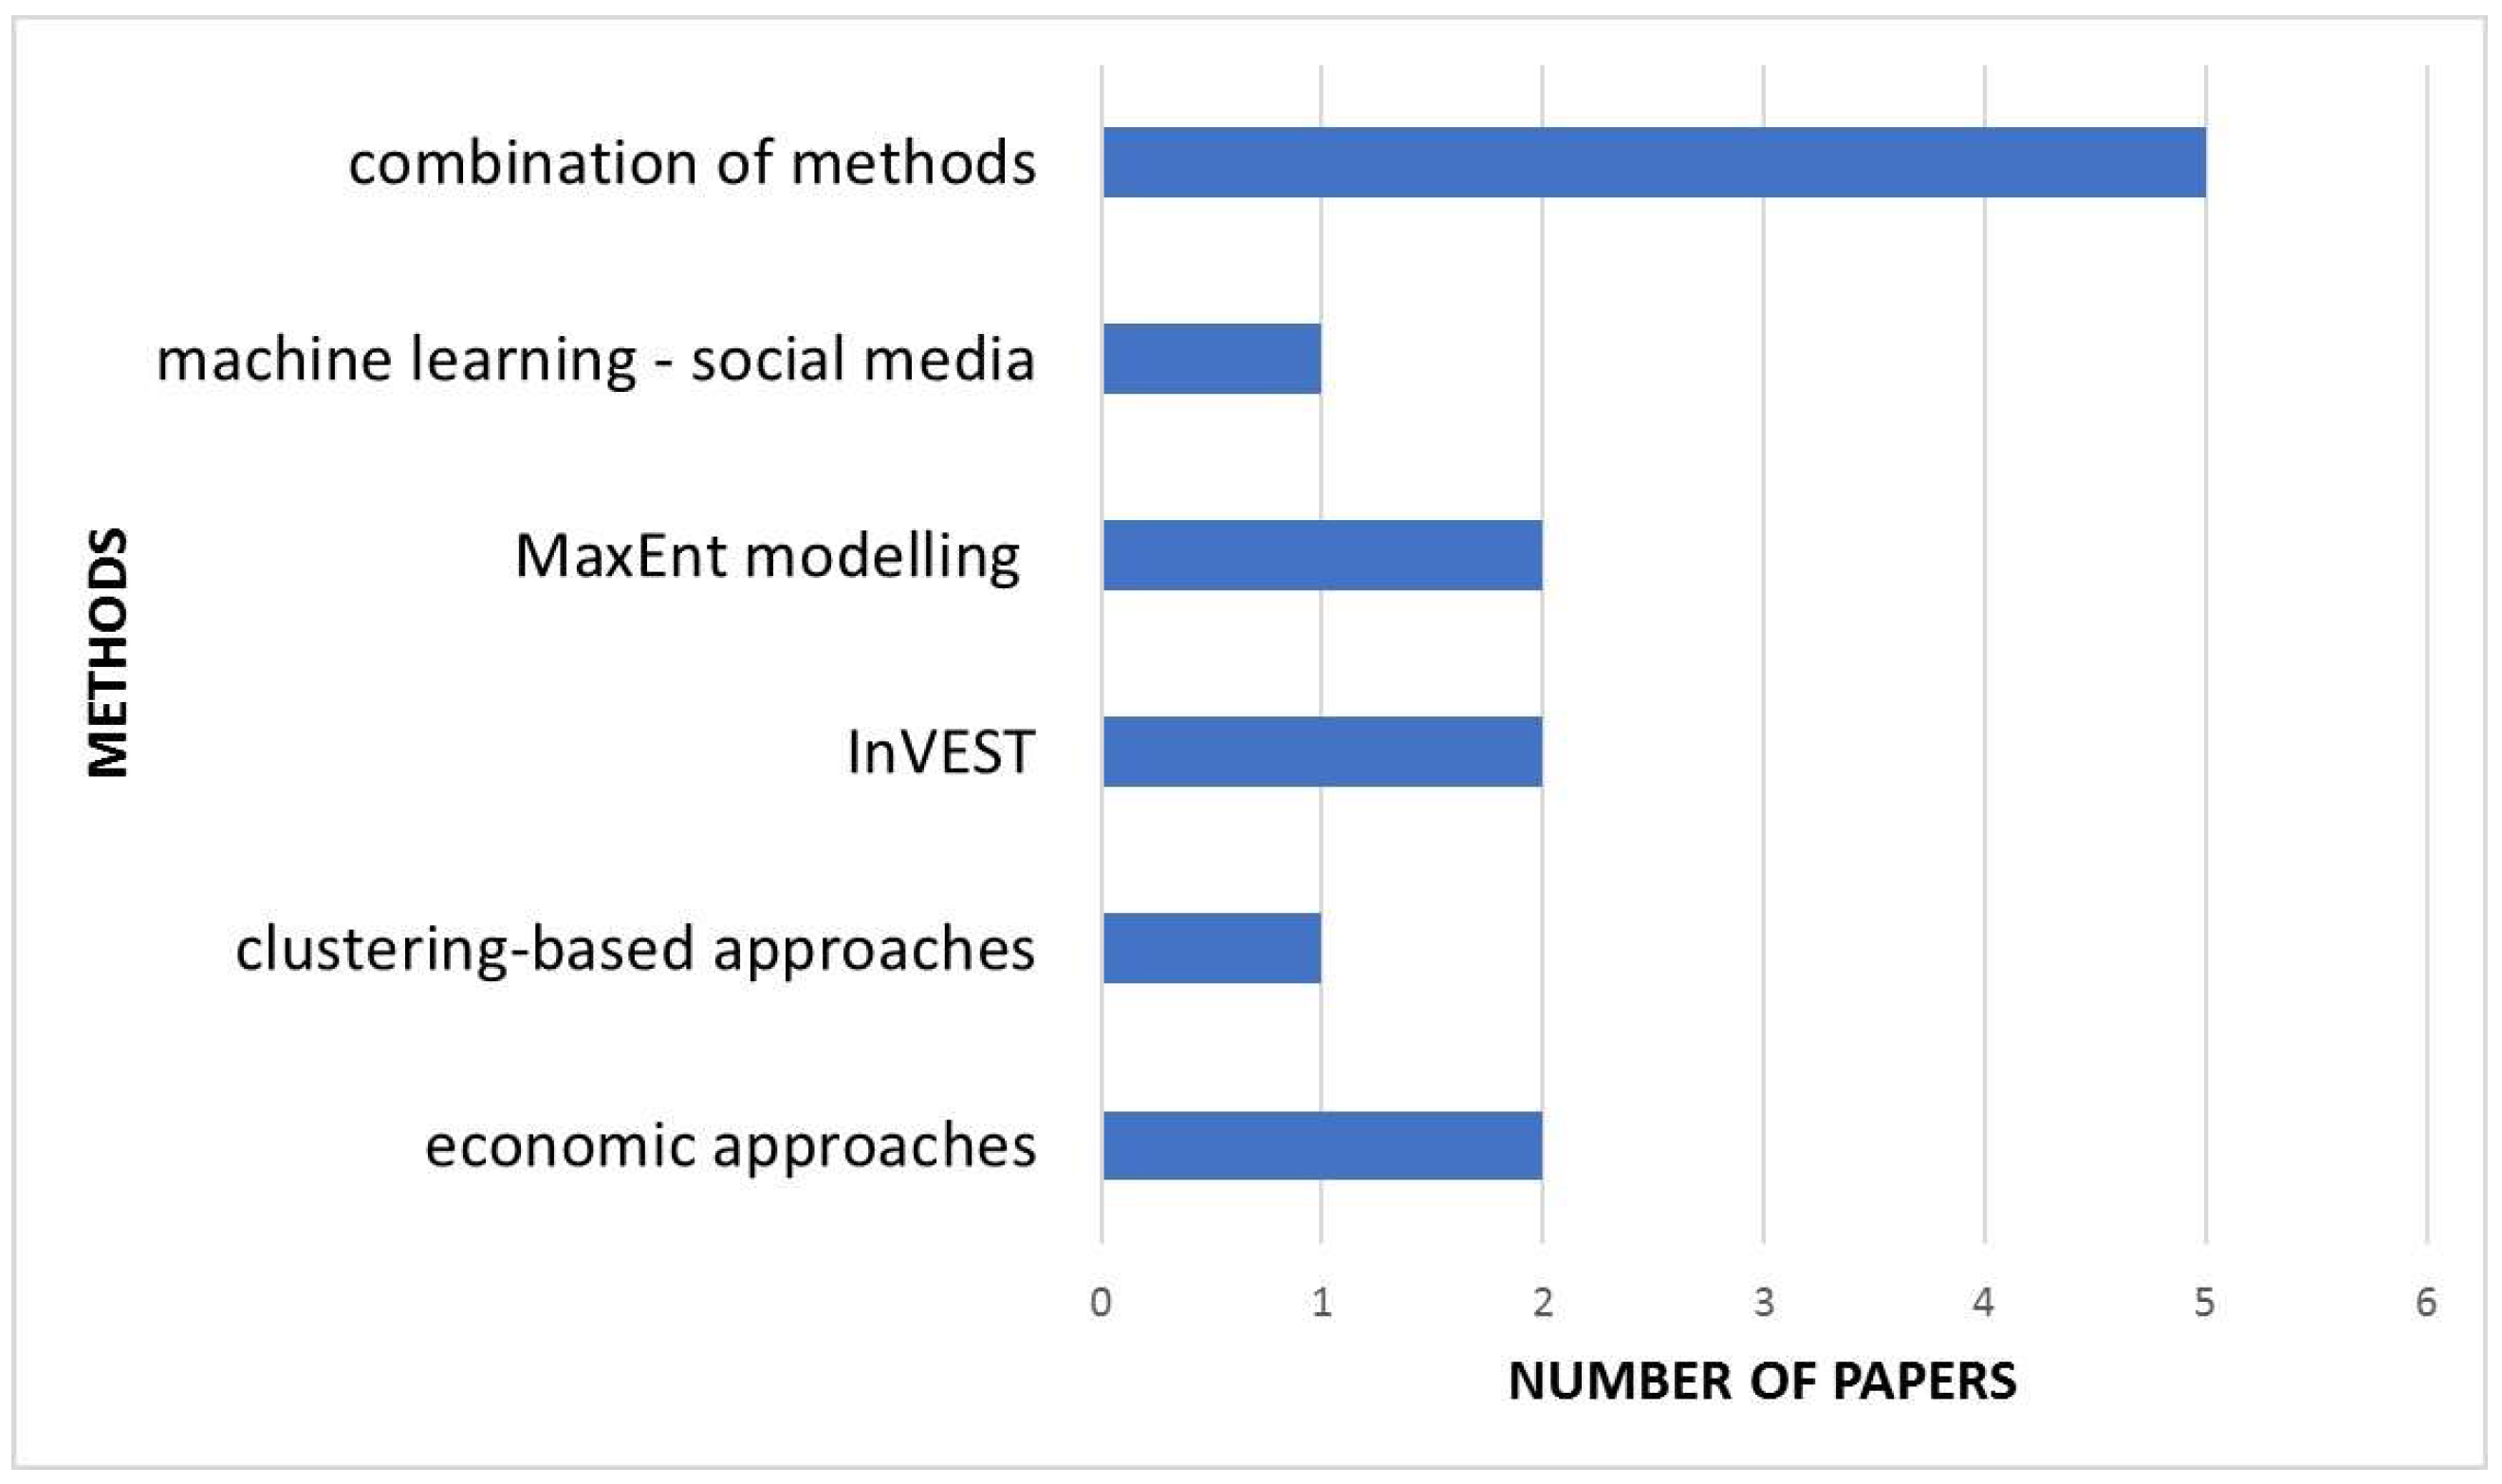
4.6.2. Participatory Techniques, Tools, and Software
5. Discussion
- ▪
- ▪
- ▪
- ▪
- ▪
- mapping different aspects of ES (supply, demand, and flow) [63];
- ▪
- environmental factors (distance to protected areas and ecosystems, naturalness, presence/absence of biotopes, etc.);
- socio-economic factors (land-cover and land-use types, distance to hubs, access, population density, etc.); as well as
6. Conclusions
Author Contributions
Funding
Disclaimer
Data Availability Statement
Acknowledgments
Conflicts of Interest
Appendix A

| AHP | Analytic Hierarchy Process |
| ANOSIM | Analysis of similarities—ANOSIM |
| ANP | Analytic Network Process |
| CA | Correspondence analysis |
| CFA | Confirmatory factor analysis |
| CES | Cultural Ecosystem Services |
| CoP | Community of practice |
| EA | Ecosystem Approach |
| EMFF | European Maritime Fisheries Fund |
| ES | Ecosystem Services |
| EU | European Union |
| GIS | Geographic Information Systems |
| IDW | Inverse Distance Weighting |
| InVEST | Integrated Valuation of Ecosystem Services and Tradeoffs |
| MCA | Multi-criteria analysis |
| MCDA | Multi-criteria Decision Analysis |
| MEA | Millenium Ecosystem Assessment |
| MSP | Marine/Maritime Spatial Planning |
| MSPD | Maritime Spatial Planning Directive (MSPD), |
| MSPlans | Marine/Maritime Spatial Plans |
| MGWR | Multiscale Geographically Weighted Regression |
| NDVI | Normalized Difference Vegetation Index |
| PCA | Principal Component Analysis |
| PERMANOVA | Permutational Multivariate Analysis of Variance |
| PPGIS | Public Participation Geographic Information Systems |
| SEA | Strategic Environmental Assessment |
| SMCDA | Spatial Multi-Criteria Decision Analysis |
| SODA | Strategic Options Development Analysis |
| SoLVES | Social Values for Ecosystem Services |
| UNESCO | United Nations Educational, Scientific and Cultural Organization |
| Title, Acronym, Duration and Lead Partner of the Project | Focus | Innovation Acheivement | References |
|---|---|---|---|
| HERCULES, 2013–2016 HERitage in CULtural landscapES Humboldt University in Berlin | Focused on preserving cultural landscapes through the empowerment of public and private actors. Use of PPGIS and crowdsourcing for the assessment of cultural landscapes in different spatial scales (local, national, pan-European). Case studies in 8 different countries (Estonia, Greece, Switzerland, France, Spain, UK, Netherlands, and Sweden). | Use of innovative technologies and tools. Communication amongst stakeholders and the general public through the Knowledge Hub platform. | [104,105] |
| LIFE-IP 4 Natura Project, 2018–2025 Integrated actions for the conservation and management of Natura 2000 sites, species, habitats and ecosystems. | Provided a web-based PPGIS, developed by Greek academia, government and NGOs. | PPGIS/webGIS which presents ES provided by Greek ecosystems (such as timber production, climate regulation, tourism and recreation) and is available for governmental, professional and public use. | [106] |
| Mare Nostrum funded by the EC under the ENPI CBCMED Programme | A cross-border project exploring new ways of protecting the Mediterranean coastline | A web-based PPGIS was developed in order to collect local knowledge and draw eco-heritage trails in the Grand Harbour of Malta | [107] |
| Horizon 2020 REINVENT, 2016–2018 Re-inventory-ing Heritage: Exploring the potential of PPGIS to capture heritage values and dissonance, (Marie Sklodowska-Curie grant agreement) | Addressed challenges related to the management of cultural heritage in Europe in a cross-border context, using as case study the city of Derry~Londonderry in North West Ireland. | Through MyValuedPlaces (a web-based pilot survey) communities’ values are captured (such as, recreation, spiritual, therapeutic) at multiple scales. The project developed “the first cross-border cultural heritage atlas”. | [108,109] |
| PERICLES project 2018–2021 Preserving and sustainably governing cultural heritage and landscapes in European coastal and maritime regions, Funded by Horizon 2020. | PERICLES promoted sustainable, participatory governance of maritime cultural heritage in European coastal and maritime regions through an interdisciplinary and geo-graphically wide-ranging approach. | The project developed an online mapping platform called “MapYourHeritage” for the collection of data on tangible and intangible cultural heritage on eight European regions (e.g., Aegean Sea, Brittany, Denmark). The aim of the portal was to provide an opportunity for the public to engage with coastal and marine cultural heritage. | [101] |
Appendix B
| a/a | Publications | Included, Excluded | Criterion of Exclusion |
|---|---|---|---|
| 1 | Agnew, S., Kopke, K., Power, O.-P., Troya, M.D.C., Dozier, A., 2022. Transdisciplinary Research: Can Citizen Science Support Effective Decision-Making for Coastal Infrastructure Management, Front. Mar. Sci. 9, 809284. https://doi.org/10.3389/fmars.2022.809284 | EXCLUDED | Theoretical articles, discussions, reviews, etc. |
| 2 | Ainsworth, G.B., Kenter, J.O., O’Connor, S., Daunt, F., Young, J.C., 2019. A fulfilled human life: Eliciting sense of place and cultural identity in two UK marine environments through the Community Voice Method. Ecosystem Services 39, 100992. https://doi.org/10.1016/j.ecoser.2019.100992 | EXCLUDED | Does not apply spatial analysis or mapping |
| 3 | Anbleyth-Evans, J., Lacy, S.N., Aguirre-Muñoz, C., Tredinnick-Rowe, J., 2020. Port dumping and participation in England: Developing an ecosystem approach through local ecological knowledge. Ocean & Coastal Management 192, 105195. https://doi.org/10.1016/j.ocecoaman.2020.105195 | INCLUDED | |
| 4 | Ancona, Z.H., Bagstad, K.J., Le, L., Semmens, D.J., Sherrouse, B.C., Murray, G., Cook, P.S., DiDonato, E., 2022. Spatial social value distributions for multiple user groups in a coastal national park. Ocean & Coastal Management 222, 106126. https://doi.org/10.1016/j.ocecoaman.2022.106126 | INCLUDED | |
| 5 | Andreeva, I., 2019. SPATIAL ASSESSMENT OF RECREATIONAL ECOSYSTEM SERVICES IN THE LARGE INLAND RIVER BASIN (UPPER OB, RUSSIA). Carpath. J. Earth Environ. Sci. 14, 67–76. https://doi.org/10.26471/cjees/2019/014/059 | EXCLUDED | Does not focus on the coastal zone or the marine environment |
| 6 | Auer, A., Nahuelhual, L., Maceira, N., 2018. Cultural ecosystem services trade-offs arising from agriculturization in Argentina: A case study in Mar Chiquita Basin. Applied Geography 91, 45–54. https://doi.org/10.1016/j.apgeog.2017.12.025 | EXCLUDED | Does not focus on the coastal zone or the marine environment |
| 7 | Banela, M., Kitsiou, D., 2023. Mapping cultural ecosystem services: A case study in Lesvos Island, Greece. Ocean & Coastal Management 246, 106883. https://doi.org/10.1016/j.ocecoaman.2023.106883 | INCLUDED | |
| 8 | Baulcomb, C., Fletcher, R., Lewis, A., Akoglu, E., Robinson, L., von Almen, A., Hussain, S., Glenk, K., 2015. A pathway to identifying and valuing cultural ecosystem services: An application to marine food webs. Ecosystem Services 11, 128–139. https://doi.org/10.1016/j.ecoser.2014.10.013 | EXCLUDED | Does not apply spatial analysis or mapping |
| 9 | Blake, D., Carver, S., Ziv, G., 2021. Demographic, natural and anthropogenic drivers for coastal Cultural ecosystem services in the Falkland Islands. Ecological Indicators 130, 108087. https://doi.org/10.1016/j.ecolind.2021.108087 | INCLUDED | |
| 10 | Blake, D., Augé, A. A., & Sherren, K. (2017). Participatory mapping to elicit cultural coastal values for marine spatial planning in a remote archipelago. Ocean and Coastal Management, 148, 195–203. https://doi.org/10.1016/j.ocecoaman.2017.08.010 | INCLUDED | |
| 11 | Börger, T., Hooper, T. L., Austen, M. C., Marcone, O., & Rendón, O. (2020). Using stated preference valuation in the offshore environment to support marine planning. Journal of Environmental Management, 265 https://doi.org/10.1016/j.jenvman.2020.110520 | EXCLUDED | Does not apply spatial analysis or mapping |
| 12 | Brown, G., & Hausner, V. H. (2017). An empirical analysis of cultural ecosystem values in coastal landscapes. Ocean and Coastal Management, 142, 49–60. https://doi.org/10.1016/j.ocecoaman.2017.03.019 | INCLUDED | |
| 13 | Bryce, R., Irvine, K. N., Church, A., Fish, R., Ranger, S., & Kenter, J. O. (2016). Subjective well-being indicators for large-scale assessment of cultural ecosystem services. Ecosystem Services, 21, 258–269. https://doi.org/10.1016/j.ecoser.2016.07.015 | EXCLUDED | Does not apply spatial analysis or mapping |
| 14 | Cerreta, M., Clemente, M., Ettorre, B., Poli, G., 2021. A Multidimensional Approach for Cultural Ecosystem Services (CES) Assessment: The Cilento Coast Case Study (Italy), in: Computational Science and Its Applications—ICCSA 2021: 21st International Conference, Cagliari, Italy, September 13–16, 2021, Proceedings, Part VII, pp. 490–503. https://doi.org/10.1007/978-3-030-87007-2_35 | INCLUDED | |
| 15 | Chakraborty, S., Gasparatos, A., 2019. Community values and traditional knowledge for coastal ecosystem services management in the “satoumi” seascape of Himeshima island, Japan. Ecosystem Services 37, 100940. https://doi.org/10.1016/j.ecoser.2019.100940 | INCLUDED | |
| 16 | Chang, P., Olafsson, A.S., 2022. The scale effects of landscape variables on landscape experiences: a multi-scale spatial analysis of social media data in an urban nature park context. Landsc Ecol 37, 1271–1291. https://doi.org/10.1007/s10980-022-01402-2 | INCLUDED | |
| 17 | Cheng, X., Van Damme, S., Li, L., Uyttenhove, P., 2022. Cultural ecosystem services in an urban park: understanding bundles, trade-offs, and synergies. Landsc Ecol 37, 1693–1705. https://doi.org/10.1007/s10980-022-01434-8 | EXCLUDED | Does not focus on the coastal zone or the marine environment |
| 18 | Chimienti, G., Stithou, M., Mura, I.D., Mastrototaro, F., D’Onghia, G., Tursi, A., Izzi, C., Fraschetti, S., 2017. An Explorative Assessment of the Importance of Mediterranean Coralligenous Habitat to Local Economy: The Case of Recreational Diving. JEAM 5, 315–325. https://doi.org/10.5890/JEAM.2017.12.004 | INCLUDED | |
| 19 | Chung, M.G., Kang, H., Choi, S.-U., 2015. Assessment of Coastal Ecosystem Services for Conservation Strategies in South Korea. PLOS ONE 10, e0133856. https://doi.org/10.1371/journal.pone.0133856 | INCLUDED | |
| 20 | Clarke, B., Thet, A.K., Sandhu, H., Dittmann, S., 2021. Integrating Cultural Ecosystem Services valuation into coastal wetlands restoration: A case study from South Australia. Environmental Science & Policy 116, 220–229. https://doi.org/10.1016/j.envsci.2020.11.014 | EXCLUDED | Does not apply spatial analysis or mapping |
| 21 | Conejo-Watt, H., Muench, A., Mangi, S.C., Jeffery, K., Hyder, K., 2021. Fishers perspectives on the barriers for the English inshore fleet to diversify into aquaculture. Marine Policy 131, 104610. https://doi.org/10.1016/j.marpol.2021.104610 | EXCLUDED | Does not apply spatial analysis or mapping |
| 22 | Cunha, J., Elliott, M., & Ramos, S. (2018). Linking modelling and empirical data to assess recreation services provided by coastal habitats: The case of NW portugal. Ocean and Coastal Management, 162, 60–70. https://doi.org/10.1016/j.ocecoaman.2017.12.022 | INCLUDED | |
| 23 | Dasgupta, R., Hashimoto, S., Basu, M., Okuro, T., Johnson, B.A., Kumar, P., Dhyani, S., 2022. Spatial characterization of non-material values across multiple coastal production landscapes in the Indian Sundarban delta. Sustain Sci 17, 725–738. https://doi.org/10.1007/s11625-020-00899-3 | INCLUDED | |
| 24 | Daymond, T., Andrew, M.E., Kobryn, H.T., 2023. Crowdsourcing social values data: Flickr and public participation GIS provide different perspectives of ecosystem services in a remote coastal region. Ecosystem Services 64, 101566. https://doi.org/10.1016/j.ecoser.2023.101566 | INCLUDED | |
| 25 | Depellegrin, D., Menegon, S., Gusatu, L., Roy, S., & Misiunė, I. (2020). Assessing marine ecosystem services richness and exposure to anthropogenic threats in small sea areas: A case study for the lithuanian sea space. Ecological Indicators, 108 https://doi.org/10.1016/j.ecolind.2019.105730 | INCLUDED | |
| 26 | Depietri, Y., Ghermandi, A., Campisi-Pinto, S., Orenstein, D.E., 2021. Public participation GIS versus geolocated social media data to assess urban cultural ecosystem services: Instances of complementarity. Ecosystem Services 50, 101277. https://doi.org/10.1016/j.ecoser.2021.101277 | INCLUDED | |
| 27 | Donahue, M.L., Keeler, B.L., Wood, S.A., Fisher, D.M., Hamstead, Z.A., McPhearson, T., 2018. Using social media to understand drivers of urban park visitation in the Twin Cities, MN. Landscape and Urban Planning 175, 1–10. https://doi.org/10.1016/j.landurbplan.2018.02.006 | EXCLUDED | Does not focus on the coastal zone or the marine environment |
| 28 | Egarter Vigl, L., Depellegrin, D., Pereira, P., de Groot, R., Tappeiner, U., 2017. Mapping the ecosystem service delivery chain: Capacity, flow, and demand pertaining to aesthetic experiences in mountain landscapes. Science of The Total Environment 574, 422–436. https://doi.org/10.1016/j.scitotenv.2016.08.209 | EXCLUDED | Does not focus on the coastal zone or the marine environment |
| 29 | Elwell, T.L., López-Carr, D., Gelcich, S., Gaines, S.D., 2020. The importance of cultural ecosystem services in natural resource-dependent communities: Implications for management. Ecosystem Services 44, 101123. https://doi.org/10.1016/j.ecoser.2020.101123 | INCLUDED | |
| 30 | Fairchild, T.P., Weedon, J., Griffin, J.N., 2022. Species diversity enhances perceptions of urban coastlines at multiple scales. People and Nature 4, 931–948. https://doi.org/10.1002/pan3.10330 | EXCLUDED | Does not apply spatial analysis or mapping |
| 31 | Filho, L.M., Roebeling, P., Villasante, S., Bastos, M.I., 2022. Ecosystem services values and changes across the Atlantic coastal zone: Considerations and implications. Marine Policy 145, 105265. https://doi.org/10.1016/j.marpol.2022.105265 | INCLUDED | |
| 32 | Fisher, D.M., Wood, S.A., Roh, Y.-H., Kim, C.-K., 2019. The Geographic Spread and Preferences of Tourists Revealed by User-Generated Information on Jeju Island, South Korea. Land 8, 73. https://doi.org/10.3390/land8050073 | INCLUDED | |
| 33 | Fletcher, R., Baulcomb, C., Hall, C., Hussain, S., 2014. Revealing marine cultural ecosystem services in the Black Sea. Marine Policy 50, 151–161. https://doi.org/10.1016/j.marpol.2014.05.001 | EXCLUDED | Does not apply spatial analysis or mapping |
| 34 | Gajardo, L.J., Sumeldan, J., Sajorne, R., Madarcos, J.R., Goh, H.C., Culhane, F., Langmead, O., Creencia, L., 2023. Cultural values of ecosystem services from coastal marine areas: Case of Taytay Bay, Palawan, Philippines. Environmental Science & Policy 142, 12–20. https://doi.org/10.1016/j.envsci.2023.01.004 | INCLUDED | |
| 35 | Garcia, X., Benages-Albert, M., Vall-Casas, P., 2018. Landscape conflict assessment based on a mixed methods analysis of qualitative PPGIS data. Ecosystem Services 32, 112–124. https://doi.org/10.1016/j.ecoser.2018.07.003 | EXCLUDED | Does not focus on the coastal zone or the marine environment |
| 36 | Gee, K., Kannen, A., Adlam, R., Brooks, C., Chapman, M., Cormier, R., Fischer, C., Fletcher, S., Gubbins, M., Shucksmith, R., Shellock, R., 2017. Identifying culturally significant areas for marine spatial planning. Ocean & Coastal Management 136, 139–147. https://doi.org/10.1016/j.ocecoaman.2016.11.026 | EXCLUDED | Theoretical articles, discussions, reviews, etc. |
| 37 | Gee K., Burkhard B., 2017. Tracing regime shifts in the provision of coastal-marine cultural ecosystem services. Offshore Energy and Marine Spatial Planning, pp. 113–131, https://doi.org/10.4324/9781315666877 | NO ACCESS | |
| 38 | Ghasemi, M., Charrahy, Z., González-García, A., 2023. Mapping cultural ecosystem services provision: An integrated model of recreation and ecotourism opportunities. Land Use Policy 131, 106732. https://doi.org/10.1016/j.landusepol.2023.106732 | INCLUDED | |
| 39 | Gould, R.K., Klain, S.C., Ardoin, N.M., Satterfield, T., Woodside, U., Hannahs, N., Daily, G.C., Chan, K.M., 2015. A protocol for eliciting nonmaterial values through a cultural ecosystem services frame. Conservation Biology 29, 575–586. https://doi.org/10.1111/cobi.12407 | EXCLUDED | Does not apply spatial analysis or mapping |
| 40 | Gould, R.K., Ardoin, N.M., Woodside, U., Satterfield, T., Hannahs, N., Daily, G.C., 2014. The forest has a story: cultural ecosystem services in Kona, Hawai‘i. E&S 19, art55. https://doi.org/10.5751/ES-06893-190355 | EXCLUDED | Does not focus in the coastal zone or the marine environment |
| 41 | Herbst, D. F., Gerhardinger, L. C., Vila-Nova, D. A., de Carvalho, F. G., & Hanazaki, N. (2020). Integrated and deliberative multidimensional assessment of a subtropical coastal-marine ecosystem (babitonga bay, brazil). Ocean and Coastal Management, 196 https://doi.org/10.1016/j.ocecoaman.2020.105279 | INCLUDED | |
| 42 | Hilmi, N., Sutherland, M., Farahmand, S., Haraldsson, G., Van Doorn, E., Ernst, E., Wisz, M.S., Claudel Rusin, A., Elsler, L.G., Levin, L.A., 2023. Deep sea nature-based solutions to climate change. Front. Clim. 5, 1169665. https://doi.org/10.3389/fclim.2023.1169665 | EXCLUDED | Theoretical articles, discussions, reviews, etc. |
| 43 | Hyytiäinen, K., Bauer, B., Bly Joyce, K., Ehrnsten, E., Eilola, K., Gustafsson, B. G.,… Zandersen, M. (2021). Provision of aquatic ecosystem services as a consequence of societal changes: The case of the baltic sea. Population Ecology, 63(1), 61–74. https://doi.org/doi:10.1002/1438-390X.12033 | EXCLUDED | Does not apply spatial analysis or mapping |
| 44 | Inácio, M., Gomes, E., Bogdzevič, K., Kalinauskas, M., Zhao, W., Pereira, P., 2022. Mapping and assessing coastal recreation cultural ecosystem services supply, flow, and demand in Lithuania. Journal of Environmental Management 323, 116175. https://doi.org/10.1016/j.jenvman.2022.116175 | INCLUDED | |
| 45 | Jardeweski, C.L.F., Marenzi, R.C., Garcia, J.R., 2021. Impact assessment of the Arvoredo Marine Biological Reserve on ecosystem services and its stakeholders—Análise de impactos da Reserva Biológica Marinha do Arvoredo sobre os serviços ecossistêmicos e os stakeholders. Desenvolv. Meio Ambiente 58. https://doi.org/10.5380/dma.v58i0.75786 | EXCLUDED | non-English |
| 46 | Jobstvogt, N., Watson, V., Kenter, J.O., 2014. Looking below the surface: The cultural ecosystem service values of UK marine protected areas (MPAs). Ecosystem Services 10, 97–110. https://doi.org/10.1016/j.ecoser.2014.09.006 | EXCLUDED | Does not apply spatial analysis or mapping |
| 47 | Kalinauskas, M., Mikša, K., Inácio, M., Gomes, E., Pereira, P., 2021. Mapping and assessment of landscape aesthetic quality in Lithuania. Journal of Environmental Management 286, 112239. https://doi.org/10.1016/j.jenvman.2021.112239 | EXCLUDED | Does not focus on the coastal zone or the marine environment |
| 48 | Kenter, J. O., Integrating deliberative monetary valuation, systems modelling and participatory mapping to assess shared values of ecosystem services, Ecosystem Services, Volume 21, Part B, 2016, Pages 291–307, ISSN 2212-0416, https://doi.org/10.1016/j.ecoser.2016.06.010 | INCLUDED | |
| 49 | Kim, M., Lee, S., Oh, C.-O., 2021. Assessing Tradeoffs between Development and Conservation: A Case of Land Use Change in a National Park of Korea. Land 10, 152. https://doi.org/10.3390/land10020152 | EXCLUDED | not related to CES |
| 50 | Klain, S. C., & Chan, K. M. A. (2012). Navigating coastal values: Participatory mapping of ecosystem services for spatial planning. Ecological Economics, 82, 104–113. https://doi.org/10.1016/j.ecolecon.2012.07.008 | INCLUDED | |
| 51 | Klain, S.C., Satterfield, T.A., Chan, K.M.A., 2014. What matters and why? Ecosystem services and their bundled qualities. Ecological Economics 107, 310–320. https://doi.org/10.1016/j.ecolecon.2014.09.003 | EXCLUDED | Does not apply spatial analysis or mapping |
| 52 | Kobryn, H. T., Brown, G., Munro, J., & Moore, S. A. (2018). Cultural ecosystem values of the kimberley coastline: An empirical analysis with implications for coastal and marine policy. Ocean and Coastal Management, 162, https://doi.org/10.1016/j.ocecoaman.2017.09.002 | INCLUDED | |
| 53 | Kochalski, S. Carsten Riepe, Robert Arlinghaus; Perceived socio-cultural ecosystem services provided by wild Atlantic Salmon populations in four European countries. Aquatic Ecosystem Health & Management 1 July 2022; 25 (3): 12–21. doi: https://doi.org/10.14321/aehm.025.03.12 | NO ACCESS | |
| 54 | Kochalski, S., Riepe, C., Arlinghaus, R., 2022. Perceived socio-cultural ecosystem services provided by wild Atlantic Salmon populations in four European countries. Aquatic Ecosystem Health & Management (2022) 25 (3): 12–21. https://doi.org/10.14321/aehm.025.03.12 | NO ACCESS | |
| 55 | Kovács, B., Marquez-Linares, M.A., Rodriguez-Espinosa, P.F., Gutierrez-Yurrita, P.J., Perez-Verdin, G., 2021. Analysis of cultural ecosystem services of rock climbing settings in Mexico City: the case of Los Dinamos Recreational Park. Ecosystems and People 17, 370–382. https://doi.org/10.1080/26395916.2021.1946594 | EXCLUDED | Does not focus on the coastal zone or the marine environment |
| 56 | Lai, S., Motroni, S., Santona, L., Schirru, M., 2021. One Place, Different Communities’ Perceptions. Mapping Cultural Ecosystem Services in the Asinara National Park (Italy). In: Et al. Computational Science and Its Applications—ICCSA 2021. ICCSA 2021. Lecture Notes in Computer Science(), Vol 12955. Springer, Cham. https://doi.org/10.1007/978-3-030-87007-2_48 | INCLUDED | |
| 57 | Liu, S., Shen, P., Huang, Y., Jiang, L., Feng, Y., 2022. Spatial Distribution Changes in Nature-Based Recreation Service Supply from 2008 to 2018 in Shanghai, China. Land 11, 1862. https://doi.org/10.3390/land11101862 | EXCLUDED | Does not focus on the coastal zone or the marine environment |
| 58 | S. C. Mangi, “The Impact of Offshore Wind Farms on Marine Ecosystems: A Review Taking an Ecosystem Services Perspective,” in Proceedings of the IEEE, vol. 101, no. 4, pp. 999–1009, April 2013, https://doi.org/doi/10.1109/JPROC.2012.2232251. | EXCLUDED | Theoretical articles, discussions, reviews, etc. |
| 59 | Martin, C.L., Momtaz, S., Gaston, T., Moltschaniwskyj, N.A., 2020. Mapping the intangibles: Cultural ecosystem services derived from Lake Macquarie estuary, New South Wales, Australia. Estuarine, Coastal and Shelf Science 243, 106885. https://doi.org/10.1016/j.ecss.2020.106885 | INCLUDED | |
| 60 | Martin, C.L., Momtaz, S., Gaston, T., Moltschaniwskyj, N.A., 2016. A systematic quantitative review of coastal and marine cultural ecosystem services: Current status and future research. Marine Policy 74, 25–32. https://doi.org/10.1016/j.marpol.2016.09.004 | EXCLUDED | Theoretical articles, discussions, reviews, etc. |
| 61 | Mocior, E., Kruse, M., 2016. Educational values and services of ecosystems and landscapes—An overview. Ecological Indicators 60, 137–151. https://doi.org/10.1016/j.ecolind.2015.06.031 | EXCLUDED | Theoretical articles, discussions, reviews, etc. |
| 62 | Mouttaki, I., Khomalli, Y., Maanan, Mohamed, Bagdanavičiūtė, I., Rhinane, H., Kuriqi, A., Pham, Q.B., Maanan, Mehdi, 2021. A New Approach to Mapping Cultural Ecosystem Services. Environments 8, 56. https://doi.org/10.3390/environments8060056 | INCLUDED | |
| 63 | Muenzel, D., Martino, S., 2018. Assessing the feasibility of carbon payments and Payments for Ecosystem Services to reduce livestock grazing pressure on saltmarshes. Journal of Environmental Management 225, 46–61. https://doi.org/10.1016/j.jenvman.2018.07.060 | INCLUDED | |
| 64 | Munro, J., Kobryn, H., Palmer, D., Bayley, S., Moore, S.A., 2019. Charting the coast: spatial planning for tourism using public participation GIS. Current Issues in Tourism 22, 486–504. https://doi.org/10.1080/13683500.2017.1346589 | INCLUDED | |
| 65 | Nahuelhual, L., Vergara, X., Kusch, A., Campos, G., & Droguett, D. (2017). Mapping ecosystem services for marine spatial planning: Recreation opportunities in sub-antarctic chile. Marine Policy, 81, 211–218. https://doi.org/10.1016/j.marpol.2017.03.038 | INCLUDED | |
| 66 | Neill, A., O’Donoghue, C., Stout, J., 2023. Spatial analysis of cultural ecosystem services using data from social media: A guide to model selection for research and practice. OE 8, e95685. https://doi.org/10.3897/oneeco.8.e95685 | EXCLUDED | Does not focus on the coastal zone or the marine environment |
| 67 | Neumann, B., Ott, K., Kenchington, R., 2017. Strong sustainability in coastal areas: a conceptual interpretation of SDG 14. Sustain Sci 12, 1019–1035. https://doi.org/10.1007/s11625-017-0472-y | EXCLUDED | Theoretical articles, discussions, reviews, etc. |
| 68 | Nieminen, E., Ahtiainen, H., Lagerkvist, C.-J., Oinonen, S., 2019. The economic benefits of achieving Good Environmental Status in the Finnish marine waters of the Baltic Sea. Marine Policy 99, 181–189. https://doi.org/10.1016/j.marpol.2018.10.014 | EXCLUDED | Does not apply spatial analysis or mapping |
| 69 | Niz, W.C., Laurino, I.R.A., Freitas, D.M.D., Rolim, F.A., Motta, F.S., Pereira-Filho, G.H., 2023. Modeling risks in marine protected areas: Mapping of habitats, biodiversity, and cultural ecosystem services in the southernmost atlantic coral reef. Journal of Environmental Management 345, 118855. https://doi.org/10.1016/j.jenvman.2023.118855 | INCLUDED | |
| 70 | O’Higgins, T., Dunne, D., Black, K., 2018. Many Points of View: Visibility Mapping for Marine Spatial Planning. International Journal of Spatial Data Infrastructure Research 302–314. https://doi.org/10.2902/1725-0463.2018.13.art18 | INCLUDED | |
| 71 | Ocelli Pinheiro, R., Triest, L., Lopes, P.F.M., 2021. Cultural ecosystem services: Linking landscape and social attributes to ecotourism in protected areas. Ecosystem Services 50, 101340. https://doi.org/10.1016/j.ecoser.2021.101340 | INCLUDED | |
| 72 | Orchard-Webb, J., Kenter, J.O., Bryce, R., Church, A., 2016. Deliberative Democratic Monetary Valuation to implement the Ecosystem Approach. Ecosystem Services 21, 308–318. https://doi.org/10.1016/j.ecoser.2016.09.005 | EXCLUDED | Does not apply spatial analysis or mapping |
| 73 | Papathanasopoulou, E., Beaumont, N., Hooper, T., Nunes, J., Queirós, A.M., 2015. Energy systems and their impacts on marine ecosystem services. Renewable and Sustainable Energy Reviews 52, 917–926. https://doi.org/10.1016/j.rser.2015.07.150 | EXCLUDED | Theoretical articles, discussions, reviews, etc. |
| 74 | Pellowe, K.E., Leslie, H.M., 2021. Ecosystem service lens reveals diverse community values of small-scale fisheries. Ambio 50, 586–600. https://doi.org/10.1007/s13280-020-01405-w | EXCLUDED | Does not apply spatial analysis or mapping |
| 75 | Pike, K., Wright, P., Wink, B., Fletcher, S., 2015. The assessment of cultural ecosystem services in the marine environment using Q methodology. J Coast Conserv 19, 667–675. https://doi.org/10.1007/s11852-014-0350-z | EXCLUDED | Does not apply spatial analysis or mapping |
| 76 | Piñeiro-Corbeira, C., Barreiro, R., Olmedo, M., & De la Cruz-Modino, R. (2020). Recreational snorkeling activities to enhance seascape enjoyment and environmental education in the islas atlánticas de galicia national park (spain). Journal of Environmental Management, 272 https://doi.org/doi:10.1016/j.jenvman.2020.111065 | INCLUDED | |
| 77 | Pouso, S., Borja, Á., Martín, J., & Uyarra, M. C. (2019). The capacity of estuary restoration to enhance ecosystem services: System dynamics modelling to simulate recreational fishing benefits. Estuarine, Coastal and Shelf Science, 217, 226–236. https://doi.org/doi:10.1016/j.ecss.2018.11.026 | EXCLUDED | Does not apply spatial analysis or mapping |
| 78 | Quilliam, R.S., Kinzelman, J., Brunner, J., Oliver, D.M., 2015. Resolving conflicts in public health protection and ecosystem service provision at designated bathing waters. Journal of Environmental Management 161, 237–242. https://doi.org/10.1016/j.jenvman.2015.07.017 | EXCLUDED | Theoretical articles, discussions, reviews, etc. |
| 79 | Ramirez Aranda et al. (2023). Cultural ecosystem services along the Woluwe River: mapping the potential for a cross-regional green-blue network during theCOVID-19 pandemic. Journal of Environmental Planning and Management, 2023 https://doi.org/10.1080/09640568.2023.2177141 | EXCLUDED | Does not focus on the coastal zone or the marine environment |
| 80 | Ranger, S., Kenter, J.O., Bryce, R., Cumming, G., Dapling, T., Lawes, E., Richardson, P.B., 2016. Forming shared values in conservation management: An interpretive-deliberative-democratic approach to including community voices. Ecosystem Services 21, 344–357. https://doi.org/10.1016/j.ecoser.2016.09.016 | EXCLUDED | Does not apply spatial analysis or mapping |
| 81 | Raum, S., 2018. A framework for integrating systematic stakeholder analysis in ecosystem services research: Stakeholder mapping for forest ecosystem services in the UK. Ecosystem Services 29, 170–184. https://doi.org/10.1016/j.ecoser.2018.01.001 | EXCLUDED | Does not focus on the coastal zone or the marine environment |
| 82 | Raymond, C.M., Kenter, J.O., Plieninger, T., Turner, N.J., Alexander, K.A., 2014. Comparing instrumental and deliberative paradigms underpinning the assessment of social values for cultural ecosystem services. Ecological Economics 107, 145–156. https://doi.org/10.1016/j.ecolecon.2014.07.033 | EXCLUDED | Theoretical articles, discussions, reviews, etc. |
| 83 | Retka, J., Jepson, P., Ladle, R.J., Malhado, A.C.M., Vieira, F.A.S., Normande, I.C., Souza, C.N., Bragagnolo, C., Correia, R.A., 2019. Assessing cultural ecosystem services of a large marine protected area through social media photographs. Ocean & Coastal Management 176, 40–48. https://doi.org/10.1016/j.ocecoaman.2019.04.018 | INCLUDED | |
| 84 | Richards, D.R., Friess, D.A., 2015. A rapid indicator of cultural ecosystem service usage at a fine spatial scale: Content analysis of social media photographs. Ecological Indicators 53, 187–195. https://doi.org/10.1016/j.ecolind.2015.01.034 | INCLUDED | |
| 85 | Román, C., Borja, A., Uyarra, M.C., Pouso, S., 2022. Surfing the waves: Environmental and socio-economic aspects of surf tourism and recreation. Science of The Total Environment 826, 154122. https://doi.org/10.1016/j.scitotenv.2022.154122 | EXCLUDED | Theoretical articles, discussions, reviews, etc. |
| 86 | Garcia Rodrigues, J., Conides, A., Rivero Rodriguez, S., Raicevich, S., Pita, P., Kleisner, K., Pita, C., Lopes, P., Alonso Roldán, V., Ramos, S., Klaoudatos, D., Outeiro, L., Armstrong, C., Teneva, L., Stefanski, S., Böhnke-Henrichs, A., Kruse, M., Lillebø, A., Bennett, E., Belgrano, A., Murillas, A., Sousa Pinto, I., Burkhard, B., Villasante, S., 2017. Marine and Coastal Cultural Ecosystem Services: knowledge gaps and research priorities. OE 2, e12290. https://doi.org/10.3897/oneeco.2.e12290 | EXCLUDED | Theoretical articles, discussions, reviews, etc. |
| 87 | Román, C., Borja, A., Uyarra, M.C., Pouso, S., 2022. Surfing the waves: Environmental and socio-economic aspects of surf tourism and recreation. Science of The Total Environment 826, 154122. https://doi.org/10.1016/j.scitotenv.2022.154122 | EXCLUDED | Theoretical articles, discussions, reviews, etc. |
| 88 | Ruiz-Frau, A., Hinz, H., Edwards-Jones, G., & Kaiser, M. J. (2013). Spatially explicit economic assessment of cultural ecosystem services: Non-extractive recreational uses of the coastal environment related to marine biodiversity. Marine Policy, 38, 90–98. https://doi.org/10.1016/j.marpol.2012.05.023 | INCLUDED | |
| 89 | Ruskule, A., Klepers, A., Veidemane, K., 2018. Mapping and assessment of cultural ecosystem services of Latvian coastal areas. One Ecosystem 3. https://doi.org/10.3897/oneeco.3.e25499 | INCLUDED | |
| 90 | Santos Vieira, F.A., Vinhas Santos, D.T., Bragagnolo, C., Campos-Silva, J.V., Henriques Correia, R.A., Jepson, P., Mendes Malhado, A.C., Ladle, R.J., 2021. Social media data reveals multiple cultural services along the 8.500 km of Brazilian coastline. Ocean & Coastal Management 214, 105918. https://doi.org/10.1016/j.ocecoaman.2021.105918 | INCLUDED | |
| 91 | Cordoves Sánchez, M.A., Vallejos Romero, A., 2019. Mapeo del valor social en el marco de los servicios ecosistémicos. IB 33, 177. https://doi.org/10.22201/iibi.24488321xe.2019.79.58008 | EXCLUDED | non-English |
| 92 | Santarém, F., Saarinen, J., Brito, J.C., 2020. Mapping and analysing cultural ecosystem services in conflict areas. Ecological Indicators 110, 105943. https://doi.org/10.1016/j.ecolind.2019.105943 | EXCLUDED | Does not focus on the coastal zone or the marine environment |
| 93 | Satz, D., Gould, R.K., Chan, K.M.A., Guerry, A., Norton, B., Satterfield, T., Halpern, B.S., Levine, J., Woodside, U., Hannahs, N., Basurto, X., Klain, S., 2013. The Challenges of Incorporating Cultural Ecosystem Services into Environmental Assessment. AMBIO 42, 675–684. https://doi.org/10.1007/s13280-013-0386-6 | EXCLUDED | Theoretical articles, discussions, reviews, etc. |
| 94 | Scholte, S.S.K., van Teeffelen, A.J.A., Verburg, P.H., 2015. Integrating socio-cultural perspectives into ecosystem service valuation: A review of concepts and methods. Ecological Economics 114, 67–78. https://doi.org/10.1016/j.ecolecon.2015.03.007 | EXCLUDED | Theoretical articles, discussions, reviews, etc. |
| 95 | Sherrouse, B.C., Semmens, D.J., Ancona, Z.H., 2022. Social Values for Ecosystem Services (SolVES): Open-source spatial modeling of cultural services. Environmental Modelling & Software 148, 105259. https://doi.org/10.1016/j.envsoft.2021.105259 | EXCLUDED | Does not focus on the coastal zone or the marine environment |
| 96 | Seijo, C., Calado, H., McClintock, W., Gil, A., Fonseca, C., 2021. Mapping recreational ecosystem services from stakeholders’ perspective in the Azores. OE 6, e65751. https://doi.org/10.3897/oneeco.6.e65751 | INCLUDED | |
| 97 | Sijtsma, F.J., Mehnen, N., Angelstam, P., Muñoz-Rojas, J., 2019. Multi-scale mapping of cultural ecosystem services in a socio-ecological landscape: A case study of the international Wadden Sea Region. Landscape Ecol 34, 1751–1768. https://doi.org/10.1007/s10980-019-00841-8 | INCLUDED | |
| 98 | Speir, C., Phillips, A., Mamula, A., Norman, K., 2023. A measure of port-level resilience to shocks in commercial fisheries. Marine Policy 151, 105575. https://doi.org/10.1016/j.marpol.2023.105575 | EXCLUDED | Not related to CES |
| 99 | Smart, L. S., Vukomanovic, J., Sills, E. O., & Sanchez, G. (2021). Cultural ecosystem services caught in a ‘coastal squeeze’ between sea level rise and urban expansion. Global Environmental Change, 66 https://doi.org/doi:10.1016/j.gloenvcha.2020.102209 | INCLUDED | |
| 100 | Spalding, M.D., Longley-Wood, K., McNulty, V.P., Constantine, S., Acosta- Morel, M., Anthony, V., Cole, A.D., Hall, G., Nickel, B.A., Schill, S.R., Schuhmann, P.W., Tanner, D., 2023. Nature dependent tourism—Combining big data and local knowledge. Journal of Environmental Management 337, 117696. https://doi.org/10.1016/j.jenvman.2023.117696 | INCLUDED | |
| 101 | Spanou, E., Jasper O. Kenter, Marcello Graziano, The Effects of Aquaculture and Marine Conservation on Cultural Ecosystem Services: An Integrated Hedonic—Eudaemonic Approach, Ecological Economics, Volume 176, 2020, 106757, ISSN 0921-8009, https://doi.org/10.1016/j.ecolecon.2020.106757 | INCLUDED | |
| 102 | Stebbings, E., Papathanasopoulou, E., Hooper, T., Austen, M.C., Yan, X., 2020. The marine economy of the United Kingdom. Marine Policy 116, 103905. https://doi.org/10.1016/j.marpol.2020.103905 | EXCLUDED | Does not apply spatial analysis or mapping |
| 103 | Strand, M., Rivers, N., Snow, B., 2023. The complexity of evaluating, categorising and quantifying marine cultural heritage. Marine Policy 148, 105449. https://doi.org/10.1016/j.marpol.2022.105449 | EXCLUDED | Theoretical articles, discussions, reviews, etc. |
| 104 | Tajima, Y., Hashimoto, S., Dasgupta, R., Takahashi, Y., 2023. Spatial characterization of cultural ecosystem services in the Ishigaki Island of Japan: A comparison between residents and tourists. Ecosystem Services 60, 101520. https://doi.org/10.1016/j.ecoser.2023.101520 | INCLUDED | |
| 105 | Tenerelli, P., Demšar, U., Luque, S., 2016. Crowdsourcing indicators for cultural ecosystem services: A geographically weighted approach for mountain landscapes. Ecological Indicators 64, 237–248. https://doi.org/10.1016/j.ecolind.2015.12.042 | EXCLUDED | Does not focus on the coastal zone or the marine environment |
| 106 | Torralba-Burrial, A., Dopico, E., 2023. Promoting the Sustainability of Artisanal Fishing through Environmental Education with Game-Based Learning. Sustainability 15, 12905. https://doi.org/10.3390/su151712905 | EXCLUDED | Does not apply spatial analysis or mapping |
| 107 | van Oudenhoven, A.P.E., Aukes, E., Bontje, L.E., Vikolainen, V., van Bodegom, P.M., Slinger, J.H., 2018. ‘Mind the Gap’ between ecosystem services classification and strategic decision making. Ecosystem Services 33, 77–88. https://doi.org/10.1016/j.ecoser.2018.09.003 | EXCLUDED | Does not apply spatial analysis or mapping |
| 108 | Vande Velde, K., Hugé, J., Friess, D.A., Koedam, N., Dahdouh-Guebas, F., 2019. Stakeholder discourses on urban mangrove conservation and management. Ocean & Coastal Management 178, 104810. https://doi.org/10.1016/j.ocecoaman.2019.05.012 | EXCLUDED | Does not apply spatial analysis or mapping |
| 109 | Van Riper, C.J., Kyle, G.T., Sherrouse, B.C., Bagstad, K.J., Sutton, S.G., 2017. Toward an integrated understanding of perceived biodiversity values and environmental conditions in a national park. Ecological Indicators 72, 278– 287. https://doi.org/10.1016/j.ecolind.2016.07.029 | INCLUDED | |
| 110 | Wang, Z., Jian, Y., Huang, Z., Qureshi, S., Cheng, K., Bai, Z., Zhang, Q., 2023. Transforming Research on Recreational Ecosystem Services into Applications and Governance. Land 12, 509. https://doi.org/10.3390/land12020509 | EXCLUDED | Theoretical articles, discussions, reviews, etc. |
| 111 | Weslawski, J. & Andrulewicz, Eugeniusz & Boström, Christoffer & Horbowy, Jan & Linkowski, Tomasz & Mattila, Johanna & Olenin, Sergej & Piwowarczyk, Joanna & Skóra, Krzysztof. (2017). Ecosystem goods, services and management. https://doi.org/10.1007/978-94-007-0668-2_18 | EXCLUDED | Theoretical articles, discussions, reviews, etc. |
| 112 | Wilkins, E.J., Chikamoto, Y., Miller, A.B., Smith, J.W., 2021. Climate change and the demand for recreational ecosystem services on public lands in the continental United States. Global Environmental Change 70, 102365. https://doi.org/10.1016/j.gloenvcha.2021.102365 | EXCLUDED | Does not focus on the coastal zone or the marine environment |
| 113 | Willis, C., Papathanasopoulou, E., Russel, D., Artioli, Y., 2018. Harmful algal blooms: the impacts on cultural ecosystem services and human well-being in a case study setting, Cornwall, UK. Marine Policy 97, 232–2 https://doi.org/10.1016/j.marpol.2018.06.002 | EXCLUDED | Does not apply spatial analysis or mapping |
| 114 | DAI Peichao, ZHANG Shaoliang, LIU Run, YANG Yongjun, 2019. Research advances in cultural ecosystem services—An analysis based on Web of Science, 2019,39(5):1863~1875 https://doi.org/10.5846/stxb201712262325 | EXCLUDED | non-English |
| 115 | Zhao, Q., Chen, Y., Gone, K.P., Wells, E., Margeson, K., Sherren, K., 2023. Modelling cultural ecosystem services in agricultural dykelands and tidal wetlands to inform coastal infrastructure decisions: A social media data approach. Marine Policy 150, 105533. https://doi.org/10.1016/j.marpol.2023.105533 | INCLUDED |
| Type of Desk Analysis | Methods, Techniques, Models, Tools | Software and Tools Used |
|---|---|---|
| Spatial Analysis (GIS) |
| ArcGIS, QGIS, Python (1) (Python spatial analysis library—PySAL), ENVI (2) |
| Statistical Analysis |
| Microsoft Excel, R, SPSS, Statistica, SAS studio, JMP Pro, PRIMER (1), NLOGIT (2) |
| Modelling for Ecosystem Services |
| InVEST (Integrated Valuation of Ecosystem Services and Tradeoffs), SoLVES (Social Values for Ecosystem Services) |
| Other |
| Cloud computing platform Clarifai (1), Google Cloud Vision API (2), MaxEnt (3), python—Tools4MSP (4), FUTure Urban-Regional Environment Simulation (FUTURES) (5), photoQuad software (6), EventMeasure (SeaGIS) software (7) |
| 1 | https://naturalcapitalproject.stanford.edu/software/invest, accessed on 25 September 2022. |
| 2 |
References
- Cabral, H.; Fonseca, V.; Sousa, T.; Costa Leal, M. Synergistic Effects of Climate Change and Marine Pollution: An Overlooked Interaction in Coastal and Estuarine Areas. Int. J. Environ. Res. Public Health 2019, 16, 2737. [Google Scholar] [CrossRef] [PubMed]
- Hattam, C.; Atkins, J.P.; Beaumont, N.; Börger, T.; Böhnke-Henrichs, A.; Burdon, D.; De Groot, R.; Hoefnagel, E.; Nunes, P.A.L.D.; Piwowarczyk, J.; et al. Marine ecosystem services: Linking indicators to their classification. Ecol. Indic. 2015, 49, 61–75. [Google Scholar] [CrossRef]
- O’Higgins, T.; Dunne, D.; Black, K. Many Points of View: Visibility Mapping for Marine Spatial Planning. Int. J. Spat. Data Infrastruct. Res. 2018, 13, 302–314. [Google Scholar] [CrossRef]
- Sousa, L.P.; Alves, F.L. A model to integrate ecosystem services into spatial planning: Ria de Aveiro coastal lagoon study. Ocean Coast. Manag. 2020, 195, 105280. [Google Scholar] [CrossRef]
- Ivarsson, M.; Magnussen, K.; Heiskanen, A.-S.; Ståle, N.; Viitasalo, M. Ecosystem Services in MSP, Ecosystem Services Approach as a Common Nordic Understanding for MSP; Nordic Council of Ministers, TemaNord: Copenhagen, Denmark, 2017; p. 536. [Google Scholar]
- Pennino, M.G.; Brodie, S.; Frainer, A.; Lopes, P.F.M.; Lopez, J.; Ortega-Cisneros, K.; Selim, S.; Vaidianu, N. The Missing Layers: Integrating Sociocultural Values into Marine Spatial Planning. Front. Mar. Sci. 2021, 8, 633198. [Google Scholar] [CrossRef]
- Papageorgiou, M.; Kyvelou, S. Aspects of marine spatial planning and governance: Adapting to the transboundary nature and the special conditions of the sea. Eur. J. Environ. Sci. 2018, 8, 31–37. [Google Scholar] [CrossRef]
- Ruskule, A.; Klepers, A.; Veidemane, K. Mapping and assessment of cultural ecosystem services of Latvian coastal areas. One Ecosyst. 2018, 3, e25499. [Google Scholar] [CrossRef]
- Kobryn, H.T.; Brown, G.; Munro, J.; Moore, S.A. Cultural ecosystem values of the Kimberley coastline: An empirical analysis with implications for coastal and marine policy. Ocean Coast. Manag. 2018, 162, 71–84. [Google Scholar] [CrossRef]
- Nahuelhual, L.; Vergara, X.; Kusch, A.; Campos, G.; Droguett, D. Mapping ecosystem services for marine spatial planning: Recreation opportunities in Sub-Antarctic Chile. Mar. Policy 2017, 81, 211–218. [Google Scholar] [CrossRef]
- Ruiz-Frau, A.; Hinz, H.; Edwards-Jones, G.; Kaiser, M.J. Spatially explicit economic assessment of cultural ecosystem services: Non-extractive recreational uses of the coastal environment related to marine biodiversity. Mar. Policy 2013, 38, 90–98. [Google Scholar] [CrossRef]
- Guerry, A.D.; Ruckelshaus, M.H.; Arkema, K.K.; Bernhardt, J.R.; Guannel, G.; Kim, C.-K.; Marsik, M.; Papenfus, M.; Toft, J.E.; Verutes, G.; et al. Modeling Benefits from Nature: Using Ecosystem Services to Inform Coastal and Marine Spatial Planning. Int. J. Biodivers. Sci. Ecosyst. Serv. Manag. 2012, 8, 107–121. [Google Scholar] [CrossRef]
- Drakou, E.G.; Kermagoret, C.; Liquete, C.; Ruiz-Frau, A.; Burkhard, K.; Lillebø, A.I.; van Oudenhoven, A.P.E.; Ballé-Béganton, J.; Rodrigues, J.G.; Nieminen, E.; et al. Marine and coastal ecosystem services on the science–policy–practice nexus: Challenges and opportunities from 11 European case studies. Int. J. Biodivers. Sci. Ecosyst. Serv. Manag. 2017, 13, 51–67. [Google Scholar] [CrossRef]
- European MSP Platform. Available online: www.msp-platform.eu (accessed on 26 November 2023).
- Millennium Ecosystem Assessment. Ecosystems and Human Well-being: Synthesis; Island Press: Washington, DC, USA, 2005. [Google Scholar]
- Satz, D.; Gould, R.K.; Chan, K.M.A.; Guerry, A.; Norton, B.; Satterfield, T.; Halpern, B.S.; Levine, J.; Woodside, U.; Hannahs, N.; et al. The Challenges of Incorporating Cultural Ecosystem Services into Environmental Assessment. AMBIO 2013, 42, 675–684. [Google Scholar] [CrossRef] [PubMed]
- Fish, R.; Church, A.; Willis, C.; Winter, M.; Tratalos, J.A.; Haines-Young, R.; Potschin, M. Making space for cultural ecosystem services: Insights from a study of the UK nature improvement initiative. Ecosyst. Serv. 2016, 21, 329–343. [Google Scholar] [CrossRef]
- Costanza, R.; De Groot, R.; Braat, L.; Kubiszewski, I.; Fioramonti, L.; Sutton, P.; Farber, S.; Grasso, M. Twenty years of ecosystem services: How far have we come and how far do we still need to go? Ecosyst. Serv. 2017, 28, 1–16. [Google Scholar] [CrossRef]
- EU Biodiversity Strategy 2020, EUR-lex. Available online: https://eur-lex.europa.eu/EN/legal-content/summary/biodiversity-strategy-for-2020.html (accessed on 26 November 2023).
- Schaich, H.; Bieling, C.; Plieninger, T. Linking Ecosystem Services with Cultural Landscape Research. GAIA-Ecol. Perspect. Sci. Soc. 2010, 19, 269–277. [Google Scholar] [CrossRef]
- Chan, K.M.; Satterfield, T.; Goldstein, J. Rethinking ecosystem services to better address and navigate cultural values. Ecol. Econ. 2012, 74, 8–18. [Google Scholar] [CrossRef]
- Chan, K.M.A.; Guerry, A.D.; Balvanera, P.; Klain, S.; Satterfield, T.; Basurto, X.; Bostrom, A.; Chuenpagdee, R.; Gould, R.; Halpern, B.S.; et al. Where are Cultural and Social in Ecosystem Services? A Framework for Constructive Engagement. BioScience 2012, 62, 744–756. [Google Scholar] [CrossRef]
- Hernández-Morcillo, M.; Plieninger, T.; Bieling, C. An empirical review of cultural ecosystem service indicators. Ecol. Indic. 2013, 29, 434–444. [Google Scholar] [CrossRef]
- Klain, S.C.; Chan, K.M.A. Navigating coastal values: Participatory mapping of ecosystem services for spatial planning. Ecol. Econ. 2012, 82, 104–113. [Google Scholar] [CrossRef]
- Brown, G.; Fagerholm, N. Empirical PPGIS/PGIS mapping of ecosystem services: A review and evaluation. Ecosyst. Serv. 2015, 13, 119–133. [Google Scholar] [CrossRef]
- Kenter, J.O. Integrating Deliberative Monetary Valuation, Systems Modelling and Participatory Mapping to Assess Shared Values of Ecosystem Services. Ecosyst. Serv. 2016, 21, 291–307. [Google Scholar] [CrossRef]
- Cooper, N.; Brady, E.; Steen, H.; Bryce, R. Aesthetic and spiritual values of ecosystems: Recognising the ontological and axiological plurality of cultural ecosystem ‘services’. Ecosyst. Serv. 2016, 21, 218–229. [Google Scholar] [CrossRef]
- Murray, G.; D’anna, L.; MacDonald, P. Measuring what we value: The utility of mixed methods approaches for incorporating values into marine social-ecological system management. Mar. Policy 2016, 73, 61–68. [Google Scholar] [CrossRef]
- Diaz, S.; Pascual, U.; Stenseke, M.; Martín-López, B.; Watson, R.T.; Molnár, Z.; Hill, R.; Chan, K.M.A.; Baste, I.A.; Brauman, K.A.; et al. Assessing nature’s contributions to people. Science 2018, 359, 270–272. [Google Scholar] [CrossRef]
- Braat, L.C. Five reasons why the Science publication “Assessing nature’s contributions to people” (Diaz et al. 2018) would not have been accepted in Ecosystem Services. Ecosyst. Serv. 2018, 30, A1–A2. [Google Scholar] [CrossRef]
- Gee, K.; Kannen, A.; Adlam, R.; Brooks, C.; Chapman, M.; Cormier, R.; Fischer, C.; Fletcher, S.; Gubbins, M.; Shucksmith, R.; et al. Identifying culturally significant areas for marine spatial planning. Ocean Coast. Manag. 2017, 136, 139–147. [Google Scholar] [CrossRef]
- Halpern, B.S.; Diamond, J.; Gaines, S.; Gelcich, S.; Gleason, M.; Jennings, S.; Lester, S.; Mace, A.; McCook, L.; McLeod, K.; et al. Near-term priorities for the science, policy and practice of Coastal and Marine Spatial Planning (CMSP). Mar. Policy 2012, 36, 198–205. [Google Scholar] [CrossRef]
- Fletcher, R.; Baulcomb, C.; Hall, C.; Hussain, S. Revealing Marine Cultural Ecosystem Services in the Black Sea. Mar. Policy 2014, 50, 151–161. [Google Scholar] [CrossRef]
- Potts, T.; Burdon, D.; Jackson, E.; Atkins, J.; Saunders, J.; Hastings, E.; Langmead, O. Do marine protected areas deliver flows of ecosystem services to support human welfare? Mar. Policy 2014, 44, 139–148. [Google Scholar] [CrossRef]
- Turner, R.K.; Schaafsma, M. (Eds.) Coastal Zones Ecosystem Services, From Science to Values and Decision Making; Part of the Studies in Ecological Economics Book Series (SEEC); Springer: Berlin/Heidelberg, Germany, 2015; Volume 9. [Google Scholar] [CrossRef]
- Barbier, E.B.; Hacker, S.D.; Kennedy, C.; Koch, E.W.; Stier, A.C.; Silliman, B.R. The value of estuarine and coastal ecosystem services. Ecol. Monogr. 2011, 81, 169–193. [Google Scholar] [CrossRef]
- Saunders, J.; Beaumont, N.; Atkins, J.P.; Lannin, A.; Lear, D.; Ozdemiroglu, E.; Potts, T. A review of marine and coastal ecosystem services data and tools to incorporate this into decision-making. In Coastal Zones Ecosystem Services; Turner, R., Kerry, R.K., Schaafsma, M., Eds.; Springer International Publishing: Heidelberg/Berlin, Germany, 2015; pp. 145–165. [Google Scholar]
- Luisetti, T.; Turner, R.; Jickells, T.; Andrews, J.; Elliott, M.; Schaafsma, M.; Beaumont, N.; Malcolm, S.; Burdon, D.; Adams, C.; et al. Coastal Zone Ecosystem Services: From science to values and decision making; a case study. Sci. Total Environ. 2014, 493, 682–693. [Google Scholar] [CrossRef] [PubMed]
- Ranger, S.; Kenter, J.; Bryce, R.; Cumming, G.; Dapling, T.; Lawes, E.; Richardson, P. Forming shared values in conservation management: An interpretive-deliberative-democratic approach to including community voices. Ecosyst. Serv. 2016, 21, 344–357. [Google Scholar] [CrossRef]
- Baulcomb, C.; Fletcher, R.; Lewis, A.; Akoglu, E.; Robinson, L.; von Almen, A.; Hussain, S.; Glenk, K. A pathway to identifying and valuing cultural ecosystem services: An application to marine food webs. Ecosyst. Serv. 2015, 11, 128–139. [Google Scholar] [CrossRef]
- Noor, M.I.M.; Alagappar, P.N.; Then, A.Y.-H.; Justine, E.V.; Lim, V.-C.; Goh, H.C. Perspectives of youths on cultural ecosystem services provided by Tun Mustapha Park, Malaysia through a participatory approach. Environ. Educ. Res. 2023, 29, 63–80. [Google Scholar] [CrossRef]
- Kenter, J.O.; Bryce, R.; Christie, M.; Cooper, N.; Hockley, N.; Irvine, K.N.; Fazey, I.; O’brien, L.; Orchard-Webb, J.; Ravenscroft, N.; et al. Shared values and deliberative valuation: Future directions. Ecosyst. Serv. 2016, 21, 358–371. [Google Scholar] [CrossRef]
- Bryce, R.; Irvine, K.N.; Church, A.; Fish, R.; Ranger, S.; Kenter, J.O. Subjective well-being indicators for large-scale assessment of cultural ecosystem services. Ecosyst. Serv. 2016, 21, 258–269. [Google Scholar] [CrossRef]
- Banela, M.; Kitsiou, D. Mapping cultural ecosystem services: A case study in Lesvos Island, Greece. Ocean Coast. Manag. 2023, 246, 106883. [Google Scholar] [CrossRef]
- Barianaki, E.; Kyvelou, S.S.; Ierapetritis, D.G. How to Incorporate Cultural Values and Heritage in Maritime Spatial Planning: A Systematic Review. Heritage 2024, 7, 380–411. [Google Scholar] [CrossRef]
- Brander, L.M.; van Beukering, P.; Balzan, M.; Broekx, S.; Liekens, I.; Marta-Pedroso, C.; Szkop, Z.; Vause, J.; Maes, J.; Santos-Martin, F.; et al. Report on Economic Mapping and Assessment Methods for Ecosystem Services; Deliverable D3.2 EU Horizon 2020 ESMERALDA Project. Grant Agreement No. 642007; ESMERALDA: Hannover, Germany, 2018. [Google Scholar]
- Santos-Martín, F.; Plieninger, T.; Torralba, M.; Fagerholm, N.; Vejre, H.; Luque, S.; Weibel, B.; Rabe, S.-E.; Balzan, M.; Czúcz, B.; et al. Report on Social Mapping and Assessment Methods; Deliverable D3.1EU Horizon 2020 ESMERALDA Project, Grant Agreement No. 642007; ESMERALDA: Hannover, Germany, 2018. [Google Scholar]
- Santos-Martín, F.; Brander, L.; van Beukering, P.; Vihervaara, P.; Potschin-Young, M.; Liekens, I.; Broeks, S.; Weibel, B.; Rabe, S.-E.; Mononen, L.; et al. Guidance Report on a Multi-Tiered Flexible Methodology for Integrating Social, Economic and Biophysical Methods; Deliverable D3.4. EU Horizon 2020 ESMERALDA Project, Grant Agreement No. 642007; ESMERALDA: Hannover, Germany, 2018. [Google Scholar]
- Vihervaara, P.; Mononen, L.; Nedkov, S.; Viinikka, A. Biophysical Mapping and Assessment Methods for Ecosystem Services; Deliverable D3.3 EU Horizon 2020 ESMERALDA Project, Grant Agreement No. 642007; ESMERALDA: Hannover, Germany, 2018. [Google Scholar]
- Smart, L.S.; Vukomanovic, J.; Sills, E.O.; Sanchez, G. Cultural Ecosystem Services Caught in a ‘Coastal Squeeze’ between Sea Level Rise and Urban Expansion. Glob. Environ. Change 2021, 66, 102209. [Google Scholar] [CrossRef]
- Cheng, X.; Van Damme, S.; Li, L.; Uyttenhove, P. Evaluation of Cultural Ecosystem Services: A Review of Methods. Ecosyst. Serv. 2019, 37, 100925. [Google Scholar] [CrossRef]
- Sherrouse, B.C.; Semmens, D.J.; Ancona, Z.H. Social Values for Ecosystem Services (SolVES): Open-Source Spatial Modeling of Cultural Services. Environ. Model. Softw. 2022, 148, 105259. [Google Scholar] [CrossRef]
- Ancona, Z.H.; Bagstad, K.J.; Le, L.; Semmens, D.J.; Sherrouse, B.C.; Murray, G.; Cook, P.S.; DiDonato, E. Spatial Social Value Distributions for Multiple User Groups in a Coastal National Park. Ocean Coast. Manag. 2022, 222, 106126. [Google Scholar] [CrossRef]
- Dasgupta, R.; Hashimoto, S.; Basu, M.; Okuro, T.; Johnson, B.A.; Kumar, P.; Dhyani, S. Spatial Characterization of Non-Material Values across Multiple Coastal Production Landscapes in the Indian Sundarban Delta. Sustain. Sci. 2022, 17, 725–738. [Google Scholar] [CrossRef]
- Sijtsma, F.J.; Mehnen, N.; Angelstam, P.; Muñoz-Rojas, J. Multi-Scale Mapping of Cultural Ecosystem Services in a Socio-Ecological Landscape: A Case Study of the International Wadden Sea Region. Landsc. Ecol. 2019, 34, 1751–1768. [Google Scholar] [CrossRef]
- Filho, L.M.; Roebeling, P.; Villasante, S.; Bastos, M.I. Ecosystem Services Values and Changes across the Atlantic Coastal Zone: Considerations and Implications. Mar. Policy 2022, 145, 105265. [Google Scholar] [CrossRef]
- Mouttaki, I.; Khomalli, Y.; Maanan, M.; Bagdanavičiūtė, I.; Rhinane, H.; Kuriqi, A.; Pham, Q.B.; Maanan, M. A New Approach to Mapping Cultural Ecosystem Services. Environments 2021, 8, 56. [Google Scholar] [CrossRef]
- Brown, G.; Hausner, V.H. An Empirical Analysis of Cultural Ecosystem Values in Coastal Landscapes. Ocean Coast. Manag. 2017, 142, 49–60. [Google Scholar] [CrossRef]
- Cunha, J.; Elliott, M.; Ramos, S. Linking Modelling and Empirical Data to Assess Recreation Services Provided by Coastal Habitats: The Case of NW Portugal. Ocean Coast. Manag. 2018, 162, 60–70. [Google Scholar] [CrossRef]
- Chung, M.G.; Kang, H.; Choi, S.-U. Assessment of Coastal Ecosystem Services for Conservation Strategies in South Korea. PLoS ONE 2015, 10, e0133856. [Google Scholar] [CrossRef]
- Chakraborty, S.; Gasparatos, A. Community Values and Traditional Knowledge for Coastal Ecosystem Services Management in the “Satoumi” Seascape of Himeshima Island, Japan. Ecosyst. Serv. 2019, 37, 100940. [Google Scholar] [CrossRef]
- Depellegrin, D.; Menegon, S.; Gusatu, L.; Roy, S.; Misiunė, I. Assessing Marine Ecosystem Services Richness and Exposure to Anthropogenic Threats in Small Sea Areas: A Case Study for the Lithuanian Sea Space. Ecol. Indic. 2020, 108, 105730. [Google Scholar] [CrossRef]
- Inácio, M.; Gomes, E.; Bogdzevič, K.; Kalinauskas, M.; Zhao, W.; Pereira, P. Mapping and Assessing Coastal Recreation Cultural Ecosystem Services Supply, Flow, and Demand in Lithuania. J. Environ. Manag. 2022, 323, 116175. [Google Scholar] [CrossRef]
- Blake, D.; Augé, A.A.; Sherren, K. Participatory Mapping to Elicit Cultural Coastal Values for Marine Spatial Planning in a Remote Archipelago. Ocean Coast. Manag. 2017, 148, 195–203. [Google Scholar] [CrossRef]
- Piñeiro-Corbeira, C.; Barreiro, R.; Olmedo, M.; De la Cruz-Modino, R. Recreational Snorkeling Activities to Enhance Seascape Enjoyment and Environmental Education in the Islas Atlánticas de Galicia National Park (Spain). J. Environ. Manag. 2020, 272, 111065. [Google Scholar] [CrossRef] [PubMed]
- Seijo, C.; Calado, H.; McClintock, W.; Gil, A.; Fonseca, C. Mapping Recreational Ecosystem Services from Stakeholders’ Perspective in the Azores. One Ecosyst. 2021, 6, e65751. [Google Scholar] [CrossRef]
- Niz, W.C.; Laurino, I.R.A.; Freitas, D.M.D.; Rolim, F.A.; Motta, F.S.; Pereira-Filho, G.H. Modeling Risks in Marine Protected Areas: Mapping of Habitats, Biodiversity, and Cultural Ecosystem Services in the Southernmost Atlantic Coral Reef. J. Environ. Manag. 2023, 345, 118855. [Google Scholar] [CrossRef]
- Chimienti, G.; Stithou, M.; Mura, I.D.; Mastrototaro, F.; D’Onghia, G.; Tursi, A.; Izzi, C.; Fraschetti, S. An Explorative Assessment of the Importance of Mediterranean Coralligenous Habitat to Local Economy: The Case of Recreational Diving. JEAM 2017, 5, 315–325. [Google Scholar] [CrossRef]
- Retka, J.; Jepson, P.; Ladle, R.J.; Malhado, A.C.M.; Vieira, F.A.S.; Normande, I.C.; Souza, C.N.; Bragagnolo, C.; Correia, R.A. Assessing Cultural Ecosystem Services of a Large Marine Protected Area through Social Media Photographs. Ocean Coast. Manag. 2019, 176, 40–48. [Google Scholar] [CrossRef]
- Cerreta, M.; Clemente, M.; Ettorre, B.; Poli, G. A Multidimensional Approach for Cultural Ecosystem Services (CES) Assessment: The Cilento Coast Case Study (Italy). In Proceedings of the Computational Science and Its Applications—ICCSA 2021: 21st International Conference, Cagliari, Italy, 13–16 September 2021; pp. 490–503. [Google Scholar]
- Daymond, T.; Andrew, M.E.; Kobryn, H.T. Crowdsourcing Social Values Data: Flickr and Public Participation GIS Provide Different Perspectives of Ecosystem Services in a Remote Coastal Region. Ecosyst. Serv. 2023, 64, 101566. [Google Scholar] [CrossRef]
- Blake, D.; Carver, S.; Ziv, G. Demographic, Natural and Anthropogenic Drivers for Coastal Cultural Ecosystem Services in the Falkland Islands. Ecol. Indic. 2021, 130, 108087. [Google Scholar] [CrossRef]
- Ocelli Pinheiro, R.; Triest, L.; Lopes, P.F.M. Cultural Ecosystem Services: Linking Landscape and Social Attributes to Ecotourism in Protected Areas. Ecosyst. Serv. 2021, 50, 101340. [Google Scholar] [CrossRef]
- Tajima, Y.; Hashimoto, S.; Dasgupta, R.; Takahashi, Y. Spatial Characterization of Cultural Ecosystem Services in the Ishigaki Island of Japan: A Comparison between Residents and Tourists. Ecosyst. Serv. 2023, 60, 101520. [Google Scholar] [CrossRef]
- Muenzel, D.; Martino, S. Assessing the Feasibility of Carbon Payments and Payments for Ecosystem Services to Reduce Livestock Grazing Pressure on Saltmarshes. J. Environ. Manag. 2018, 225, 46–61. [Google Scholar] [CrossRef] [PubMed]
- Spanou, E.; Kenter, J.O.; Graziano, M. The Effects of Aquaculture and Marine Conservation on Cultural Ecosystem Services: An Integrated Hedonic–Eudaemonic Approach. Ecol. Econ. 2020, 176, 106757. [Google Scholar] [CrossRef]
- Gajardo, L.J.; Sumeldan, J.; Sajorne, R.; Madarcos, J.R.; Goh, H.C.; Culhane, F.; Langmead, O.; Creencia, L. Cultural Values of Ecosystem Services from Coastal Marine Areas: Case of Taytay Bay, Palawan, Philippines. Environ. Sci. Policy 2023, 142, 12–20. [Google Scholar] [CrossRef]
- Herbst, D.F.; Gerhardinger, L.C.; Vila-Nova, D.A.; de Carvalho, F.G.; Hanazaki, N. Integrated and Deliberative Multidimensional Assessment of a Subtropical Coastal-Marine Ecosystem (Babitonga Bay, Brazil). Ocean Coast. Manag. 2020, 196, 105279. [Google Scholar] [CrossRef]
- Martin, C.L.; Momtaz, S.; Gaston, T.; Moltschaniwskyj, N.A. Mapping the Intangibles: Cultural Ecosystem Services Derived from Lake Macquarie Estuary, New South Wales, Australia. Estuar. Coast. Shelf Sci. 2020, 243, 106885. [Google Scholar] [CrossRef]
- Lai, S.; Motroni, S.; Santona, L.; Schirru, M. One Place, Different Communities’ Perceptions. Mapping Cultural Ecosystem Services in the Asinara National Park (Italy). In Proceedings of the Computational Science and Its Applications—ICCSA 2021: 21st International Conference, Cagliari, Italy, 13–16 September 2021; Lecture Notes in Computer Science. Springer: Cham, Switzerland, 2021; Volume 12955. [Google Scholar]
- Depietri, Y.; Ghermandi, A.; Campisi-Pinto, S.; Orenstein, D.E. Public Participation GIS versus Geolocated Social Media Data to Assess Urban Cultural Ecosystem Services: Instances of Complementarity. Ecosyst. Serv. 2021, 50, 101277. [Google Scholar] [CrossRef]
- Richards, D.R.; Friess, D.A. A Rapid Indicator of Cultural Ecosystem Service Usage at a Fine Spatial Scale: Content Analysis of Social Media Photographs. Ecol. Indic. 2015, 53, 187–195. [Google Scholar] [CrossRef]
- Zhao, Q.; Chen, Y.; Gone, K.P.; Wells, E.; Margeson, K.; Sherren, K. Modelling Cultural Ecosystem Services in Agricultural Dykelands and Tidal Wetlands to Inform Coastal Infrastructure Decisions: A Social Media Data Approach. Mar. Policy 2023, 150, 105533. [Google Scholar] [CrossRef]
- Santos Vieira, F.A.; Vinhas Santos, D.T.; Bragagnolo, C.; Campos-Silva, J.V.; Henriques Correia, R.A.; Jepson, P.; Mendes Malhado, A.C.; Ladle, R.J. Social Media Data Reveals Multiple Cultural Services along the 8.500 Kilometers of Brazilian Coastline. Ocean Coast. Manag. 2021, 214, 105918. [Google Scholar] [CrossRef]
- Ghasemi, M.; Charrahy, Z.; González-García, A. Mapping Cultural Ecosystem Services Provision: An Integrated Model of Recreation and Ecotourism Opportunities. Land Use Policy 2023, 131, 106732. [Google Scholar] [CrossRef]
- Fisher, D.M.; Wood, S.A.; Roh, Y.-H.; Kim, C.-K. The Geographic Spread and Preferences of Tourists Revealed by User-Generated Information on Jeju Island, South Korea. Land 2019, 8, 73. [Google Scholar] [CrossRef]
- Elwell, T.L.; López-Carr, D.; Gelcich, S.; Gaines, S.D. The Importance of Cultural Ecosystem Services in Natural Resource-Dependent Communities: Implications for Management. Ecosyst. Serv. 2020, 44, 101123. [Google Scholar] [CrossRef]
- Anbleyth-Evans, J.; Lacy, S.N.; Aguirre-Muñoz, C.; Tredinnick-Rowe, J. Port Dumping and Participation in England: Developing an Ecosystem Approach through Local Ecological Knowledge. Ocean Coast. Manag. 2020, 192, 105195. [Google Scholar] [CrossRef]
- Chang, P.; Olafsson, A.S. The Scale Effects of Landscape Variables on Landscape Experiences: A Multi-Scale Spatial Analysis of Social Media Data in an Urban Nature Park Context. Landsc. Ecol. 2022, 37, 1271–1291. [Google Scholar] [CrossRef]
- Maniatakou, S.; Berg, H.; Maneas, G.; Daw, T.M. Unravelling Diverse Values of Ecosystem Services: A Socio-Cultural Valuation Using Q Methodology in Messenia, Greece. Sustainability 2020, 12, 10320. [Google Scholar] [CrossRef]
- Vlami, V.; Kokkoris, I.P.; Zogaris, S.; Kehayias, G.; Dimopoulos, P. Cultural Ecosystem Services in the Natura 2000 Network: Introducing Proxy Indicators and Conflict Risk in Greece. Land 2021, 10, 4. [Google Scholar] [CrossRef]
- Martin, C.L.; Momtaz, S.; Gaston, T.; Moltschaniwskyj, N.A. A Systematic Quantitative Review of Coastal and Marine Cultural Ecosystem Services: Current Status and Future Research. Mar. Policy 2016, 74, 25–32. [Google Scholar] [CrossRef]
- Węsławski, J.M.; Andrulewicz, E.; Boström, C.; Horbowy, J.; Linkowski, T.; Mattila, J.; Olenin, S.; Piwowarczyk, J.; Skóra, K. Ecosystem goods, services and management. In Biological Oceanography of the Baltic Sea; Snoeijs-Leijonmalm, P., Schubert, H., Radziejewska, T., Eds.; Springer: Dordrecht, The Netherlands, 2017. [Google Scholar] [CrossRef]
- Nahuelhual, L.; Vergara, X.; Bozzeda, F.; Campos, G.; Subida, M.D.; Outeiro, L.; Villasante, S.; Fernández, M. Exploring Gaps in Mapping Marine Ecosystem Services: A Benchmark Analysis. Ocean Coast. Manag. 2020, 192, 105193. [Google Scholar] [CrossRef]
- Scholte, S.S.K.; Van Teeffelen, A.J.A.; Verburg, P.H. Integrating Socio-Cultural Perspectives into Ecosystem Service Valuation: A Review of Concepts and Methods. Ecol. Econ. 2015, 114, 67–78. [Google Scholar] [CrossRef]
- Nahuelhual, L.; Benra Ochoa, F.; Rojas, F.; Díaz, G.I.; Carmona, A. Mapping Social Values of Ecosystem Services: What Is behind the Map? Ecol. Soc. 2016, 21, 24. [Google Scholar] [CrossRef]
- Burkhard, B.; Maes, J. Mapping Ecosystem Services; Pensoft Publishers: Sofia, Bulgaria, 2017. [Google Scholar]
- Paracchini, M.L.; Zulian, G.; Kopperoinen, L.; Maes, J.; Schägner, J.P.; Termansen, M.; Zandersen, M.; Perez-Soba, M.; Scholefield, P.A.; Bidoglio, G. Mapping Cultural Ecosystem Services: A Framework to Assess the Potential for Outdoor Recreation across the EU. Ecol. Indic. 2014, 45, 371–385. [Google Scholar] [CrossRef]
- Pinke, Z.; Vári, Á.; Kovács, E.T. Value Transfer in Economic Valuation of Ecosystem Services–Some Methodological Challenges. Ecosyst. Serv. 2022, 56, 101443. [Google Scholar] [CrossRef]
- Jobstvogt, N.; Watson, V.; Kenter, J.O. Looking below the Surface: The Cultural Ecosystem Service Values of UK Marine Protected Areas (MPAs). Ecosyst. Serv. 2014, 10, 97–110. [Google Scholar] [CrossRef]
- Kenter, J.; Cambridge, H. Interactive Online CH Mapping Portal. In PrEseRvIng and Sustainably Governing Cultural Heritage and Landscapes in European Coastal and Maritime regionS; PERICLES_D3.1_v2.0, Dissemination Level: PU; European Commission: Brussels, Belgium, 2019. [Google Scholar]
- Golding, N.; Black, B. Final Report from the DPLUS065 Mapping Falklands and South Georgia Coastal Margins for Spatial Planning Project. SAERI. 2020, p. 102. Available online: https://www.darwininitiative.org.uk/Documents/DPLUS027/23882/DPLUS027%20FR%20-%20edited.pdf (accessed on 10 November 2023).
- Patera, A.; Pataki, Z.; Kitsiou, D. Development of a webGIS Application to Assess Conflicting Activities in the Framework of Marine Spatial Planning. JMSE 2022, 10, 389. [Google Scholar] [CrossRef]
- Claudia, B.; Bürgi, M.; Le Du-Blayo, L.; Martín, M.G.; Girod, G.; von Hackwitz, K.; Howard, P.; Karro, K.; Kizos, T.; de Kleijn, M.; et al. D3.1 List and Documentation of Case Study Landscapes Selected for HERCULES, WP3 Landscape-Scale Case Studies (Short-Term History); HERCULES: Brussels, Belgium, 2014. [Google Scholar]
- Trommler, K.; Plieninger, T. Sustainable Futures for Europe’s Heritage in Cultural Landscapes: Tools for Understanding, Managing, and Protecting Landscape Functions and Values; Mid-Term Assessment Report; Hercules, FP7; Collaborative Project: Berlin, Germany; Copenhagen, Denmark, 2015. [Google Scholar]
- Mallinis, G.; Chalkidou, S.; Roustanis, T.; Kokkoris, I.P.; Chrysafis, I.; Karolos, I.-A.; Vagiona, D.; Kavvadia, A.; Dimopoulos, P.; Mitsopoulos, I. A National Scale Web Mapping Platform for Mainstreaming Ecosystem Services in Greece. Ecol. Inform. 2023, 78, 102349. [Google Scholar] [CrossRef]
- Pellach, C.; Carmon, D.; Teschner, N.; Boral, R. Legal-Institutional Instruments for Integrated Coastal Zone Management (ICZM) in the Mediterranean. Final Report, 2016, Mare Nostrum Project. Available online: https://curs.net.technion.ac.il/Files/2018/11/Mare-Nostrum-Final-Report.pdf (accessed on 26 November 2023).
- McClellandb, A. Towards a Cross-Border Cultural Heritage Atlas for the North West: Data Availability, Webhosting and Guiding Principles for the GIS Mapping of Heritage Inventory and Other Datasets; National Institute for Regional and Spatial Analysis (NIRSA); Maynooth University Social Science Institute (MUSSI): Maynooth, Ireland, 2016. [Google Scholar]
- McClelland, A. Spaces for Public Participation: Valuing the cross-border landscape in North West Ireland’. Ir. Geogr. 2019, 52, 193–211. [Google Scholar] [CrossRef]


| Search 1 | Find Articles with these terms: | “marine spatial planning” OR “maritime spatial planning” OR “marine planning” OR “coastal planning” |
| AND Search in Title, Abstract, Keywords for: | “cultural ecosystem services” OR “cultural ecosystem values” OR “intangible benefits” OR “non-material benefits” | |
| Search 2 | Search in Title, Abstract, Keywords for: | (“cultural ecosystem services” OR “cultural ecosystem values” OR “intangible benefits” OR “non-material benefits”) AND (marine OR coastal) AND (“participatory mapping” OR “Participatory GIS” OR PGIS OR “Public Participation GIS” OR PPGIS) |
| Search 3 | Projects, Report Summaries: | (“ecosystem services” OR “cultural ecosystem services” OR “cultural eco-system values” OR “cultural values” OR “landscape values” OR “intangible benefits” OR “non-material benefits” OR “natural heritage” OR “eco-heritage”) AND (“participatory mapping” OR “Participatory GIS” OR PGIS OR “Public Participation GIS” OR PPGIS OR “marine spatial planning” OR MSP) |
| Search 4 | Find Articles with these terms: | (“cultural ecosystem services” OR “cultural ecosystem values” OR “intangible benefits” OR “non-material benefits”) AND (marine OR coastal) |
| AND Search in Title, Abstract, Keywords for: | “ecosystem services” AND (webGIS OR “web-GIS”) |
| Criteria | Categories |
|---|---|
| Year of publication | without time frame |
| Who | scientific community, government/regional/local authorities, other |
| Ocean/sea | NW Atlantic, West Mediterranean, etc. |
| Continent/country | Asia/China, Europe/UK, Australia/New Zealand, North America/USA, etc. |
| Scale of paper | Basin-centered, national, regional (region of country, county of region, etc.), Local (1 or more municipalities), coastal zone (landwards and seawards), Multi-scale, comparative papers. |
| Ecosystem assessed | coastal, marine, coastal and marine |
| MSP focused | yes, no |
| CES focused | Yes, no |
| Stakeholders category | residents, specific stakeholders, scientists, mixed groups of stakeholders, no stakeholder’s engagement |
| Mapping approaches & methods (focused on CES) | Social methods (participatory mapping, social media-based, etc.), Economic methods (hedonic pricing, value transfer, etc.), Mixed methods (mixed participatory mapping, other). |
| Valuation types & methods | Monetary (hedonic pricing, travel cost, deliberative valuation, etc.), Non-monetary (participatory mapping, personal interviews, questionnaires, etc.), Combination of both. |
| Type of Method | Description |
|---|---|
| Biophysical methods | These include direct (e.g., remote sensing and earth observation) or indirect measurement (remote sensing and earth observation derivatives, use of statistical data, and spatial proxy methods) and modelling (e.g., macro-ecological models, statistical models, and conceptual models). |
| Social methods | These measure individual and collective preferences for mapping and assessing ES (e.g., official statistics, personal interviews, participatory mapping, and focus groups) |
| Economic methods | This is a group of methods developed for estimating the economic value of ES (e.g., hedonic pricing, market value, and value transfer); |
| Mixed methods | These refer to mapping approaches that link or integrate methods and information from different disciplines (e.g., biophysical, social, and economic) |
| Participatory | Methods, Techniques, Tools | Software Used |
|---|---|---|
| Decision making | GIS-based Technique for Order Preference by Similarity to Ideal Solution [GeoTOPSIS] (1), Analytic Hierarchy Process (AHP) (2), Analytic Network Process (ANP) method (3), Strategic Options Development Analysis (SODA) approach (4), | QGIS (1), IDRISI SELVA (2), Super Decisions software (3), Decision Explorer software (4) |
| Web-based surveys | Google Maps platform, Scribble Maps, ESRI ’s Survey123, Greenmapper survey tool, SeaSketch | |
Disclaimer/Publisher’s Note: The statements, opinions and data contained in all publications are solely those of the individual author(s) and contributor(s) and not of MDPI and/or the editor(s). MDPI and/or the editor(s) disclaim responsibility for any injury to people or property resulting from any ideas, methods, instructions or products referred to in the content. |
© 2024 by the authors. Licensee MDPI, Basel, Switzerland. This article is an open access article distributed under the terms and conditions of the Creative Commons Attribution (CC BY) license (https://creativecommons.org/licenses/by/4.0/).
Share and Cite
Banela, M.; Kyvelou, S.S.; Kitsiou, D. Mapping and Assessing Cultural Ecosystem Services to Inform Maritime Spatial Planning: A Systematic Review. Heritage 2024, 7, 697-736. https://doi.org/10.3390/heritage7020035
Banela M, Kyvelou SS, Kitsiou D. Mapping and Assessing Cultural Ecosystem Services to Inform Maritime Spatial Planning: A Systematic Review. Heritage. 2024; 7(2):697-736. https://doi.org/10.3390/heritage7020035
Chicago/Turabian StyleBanela, Marina, Stella Sofia Kyvelou, and Dimitra Kitsiou. 2024. "Mapping and Assessing Cultural Ecosystem Services to Inform Maritime Spatial Planning: A Systematic Review" Heritage 7, no. 2: 697-736. https://doi.org/10.3390/heritage7020035
APA StyleBanela, M., Kyvelou, S. S., & Kitsiou, D. (2024). Mapping and Assessing Cultural Ecosystem Services to Inform Maritime Spatial Planning: A Systematic Review. Heritage, 7(2), 697-736. https://doi.org/10.3390/heritage7020035