Article

Scientific Investigation of Contemporary Pastel Painting by Roberto Sebastian Matta: Characterization of Original Materials through Multispectral Imaging and Spectroscopic Techniques

1
Institute of Heritage Science (CNR-ISPC), National Research Council of Italy, Area della Ricerca di Roma 1, 00010 Montelibretti, Italy
2
Department of Economics, Engineering, Society and Business Organization, University of Tuscia, Largo dell’Università, 01100 Viterbo, Italy
3
Diagnostics and Metrology Laboratory FSN-TECFIS ENEA CR Frascati, Via Enrico Fermi, 45, 00044 Frascati, Italy
4
Conservation and Restoration Course, University of Tuscia, Largo dell’Università, 01100 Viterbo, Italy
*
Author to whom correspondence should be addressed.
Heritage 2023, 6(3), 2541-2558; https://doi.org/10.3390/heritage6030134
Submission received: 31 January 2023 / Revised: 24 February 2023 / Accepted: 27 February 2023 / Published: 28 February 2023

Abstract

:
The conservation of contemporary art often offers unique occasions to study complex multi-material artworks and understand their creative process and esteem degradation distress. The recent diagnostic campaign on the surrealist artwork Perché le vittime vincano (For the victims to win) (1974–75) by the artist Roberto Sebastian Matta allowed us to characterize the original painting materials (pastels on spolvero paper), never investigated and completely unknown, in order to support the imminent restoration. Due to the great dimensions of the artwork and its conservative issues, non-invasive multispectral imaging (HMI) analyses were done to investigate the whole painted surface, mapping and differentiating original materials and possible degradation patterns. Imaging data supported analytical characterization analyses run through elemental (portable X-ray fluorescence spectroscopy and scanning electron microscopy coupled with energy-dispersive spectroscopy) and molecular spectroscopy (Fourier transform infrared and portable µ-Raman spectroscopy) to identify the original artist’s materials and to support the restoration operations. The analysis revealed that the painting materials used by Matta are pastels characterized by modern pigments and dyes, such as Cu-phthalocyanines, chrome orange, titanium and zinc whites, compacted with kaolin without any organic binder or with a possible minuscule amount of gum.

1. Introduction

The Chilean artist Roberto Sebastian Matta (1911, Santiago, Chile–2002, Civitavecchia, Italy) is one of the most outstanding personalities of the Surrealist art movement, to which he was introduced by the founder André Breton at the beginning of the 1930s [1,2]. His paintings are exhibited in the world’s most valuable contemporary art collections such as London’s Tate Modern, the Metropolitan (MET) and Museum of Modern Art (MoMA) in New York, the Art Institute of Chicago and Centre Pompidou in Paris [3,4]. In his latest works, in a phase of overcoming Surrealism, Matta devotes himself to the pastel technique and to his desire to expose current events and turn to man’s actions by denouncing their cruelty, voracity and “bestial imbecility” [5]. To this artistic moment and inspiration belongs the triptych Perchè le vittime vincano (For the victims to win) (1974–1975) made up of three separate large paper sheets lined on canvas, two smaller lateral ones (179.1 × 150.6 cm) and a central one (180.3 × 405.1 cm), this last being the object of the present paper. The paintings settle in the great cycles of pastel artworks that Matta realized in Tarquinia (central Italy). In this artwork, Matta recalls figures of ancient codes of the Mayan, Azteche and Araucana peoples brutally subdued by Spanish conquerors and the violence of the military coup which in 1973 dismissed Salvador Allende from the legit democratic leadership of Chile. According to the sources [6], in 1975, the triptych was donated to the municipality of Tarquinia by Roberto Sebastian Matta as a sign of thankfulness for the received honorary citizenship and it was exhibited in the Hall of the Council of the town hall of Tarquinia since the moment of its donation. The central panel (Figure 1) was investigated with both spectroscopic methods and innovative diagnostic imaging techniques in order to understand its creative process, characterize painting materials and evaluate the state of conservation of the painting.
The pastel painting technique, of which the first experimentations date back to the 16th century, became extremely popular in the European artistic scene during the 18th century [7]. The scientific study of the chemical–physical characterization, production processes, painting techniques and conservation protocols still present some aspects to enlighten respect to other artists’ materials [8,9]. Although their very first commercialization is unknown and a variety of chemical compositions have been found in the lucky cases of untouched original colors in artists’ studios, the pastel painting technique offered a new expressive medium to artists that could rapidly impress their creative impulse in a diversified bright palette on different supports, without the preparation of the color or binder to add [10]. The simplicity and directness of their usage have a downside in conservation issues due to their poor adherence to the support and to degradation processes involving new synthetic pigments available from the late 18th [11] and the eventual content of organic binders. In fact, pastel painting can behave like an overlay of powdery layers, which can be severely affected by vibrations [12]; for this reason, spray fixatives on the artwork’s surface were often applied by artists since their first use in the 18th century [13] and conservators to avoid the loss of pictorial material.
The scientific studies available in the literature on pastel degradation and conservation treatments [14,15,16] also attested that this kind of painting material is very sensitive to humidity and light which can induce “severe mould outbreaks of the pastels” as testified by an early study in Rijksmuseum pastels collection [17].
Moreover, a problem with these artist’s materials is also their weak adhesion to the support (generally paper) which is a consequence of low concentrations of the binding medium used in some kinds of pastel sticks [18,19].
In order to investigate the materials of Matta’s artwork, a diagnostic and analytical campaign was planned at the beginning of the restoration process, mainly through non-invasive on-site techniques.
Specifically, ultraviolet fluorescence photography (UVF) and hypercolorimetric multispectral imaging (HMI) were performed to gather overall information about the painting materials and conservation status. Moreover, these techniques allowed us to address the subsequent point analysis through X-ray fluorescence (XRF) and µ-Raman spectroscopy performed by portable instruments; the imaging data represented a useful tool of comparison to support the results of the analytical surveys [20]. All these analyses gave information on the materials and allowed to limit the sampling (possible only in correspondence of a pre-existing tear) for stratigraphic observation under an optical microscope and scanning electron microscopy coupled with energy dispersive spectroscopy (SEM-EDS) investigation. Lastly, we had the opportunity to analyze an original pasted obtained from Matta’s workshop through Fourier transform infrared spectroscopy (FTIR) with the aim to gather information about the binders.

2. Materials and Methods

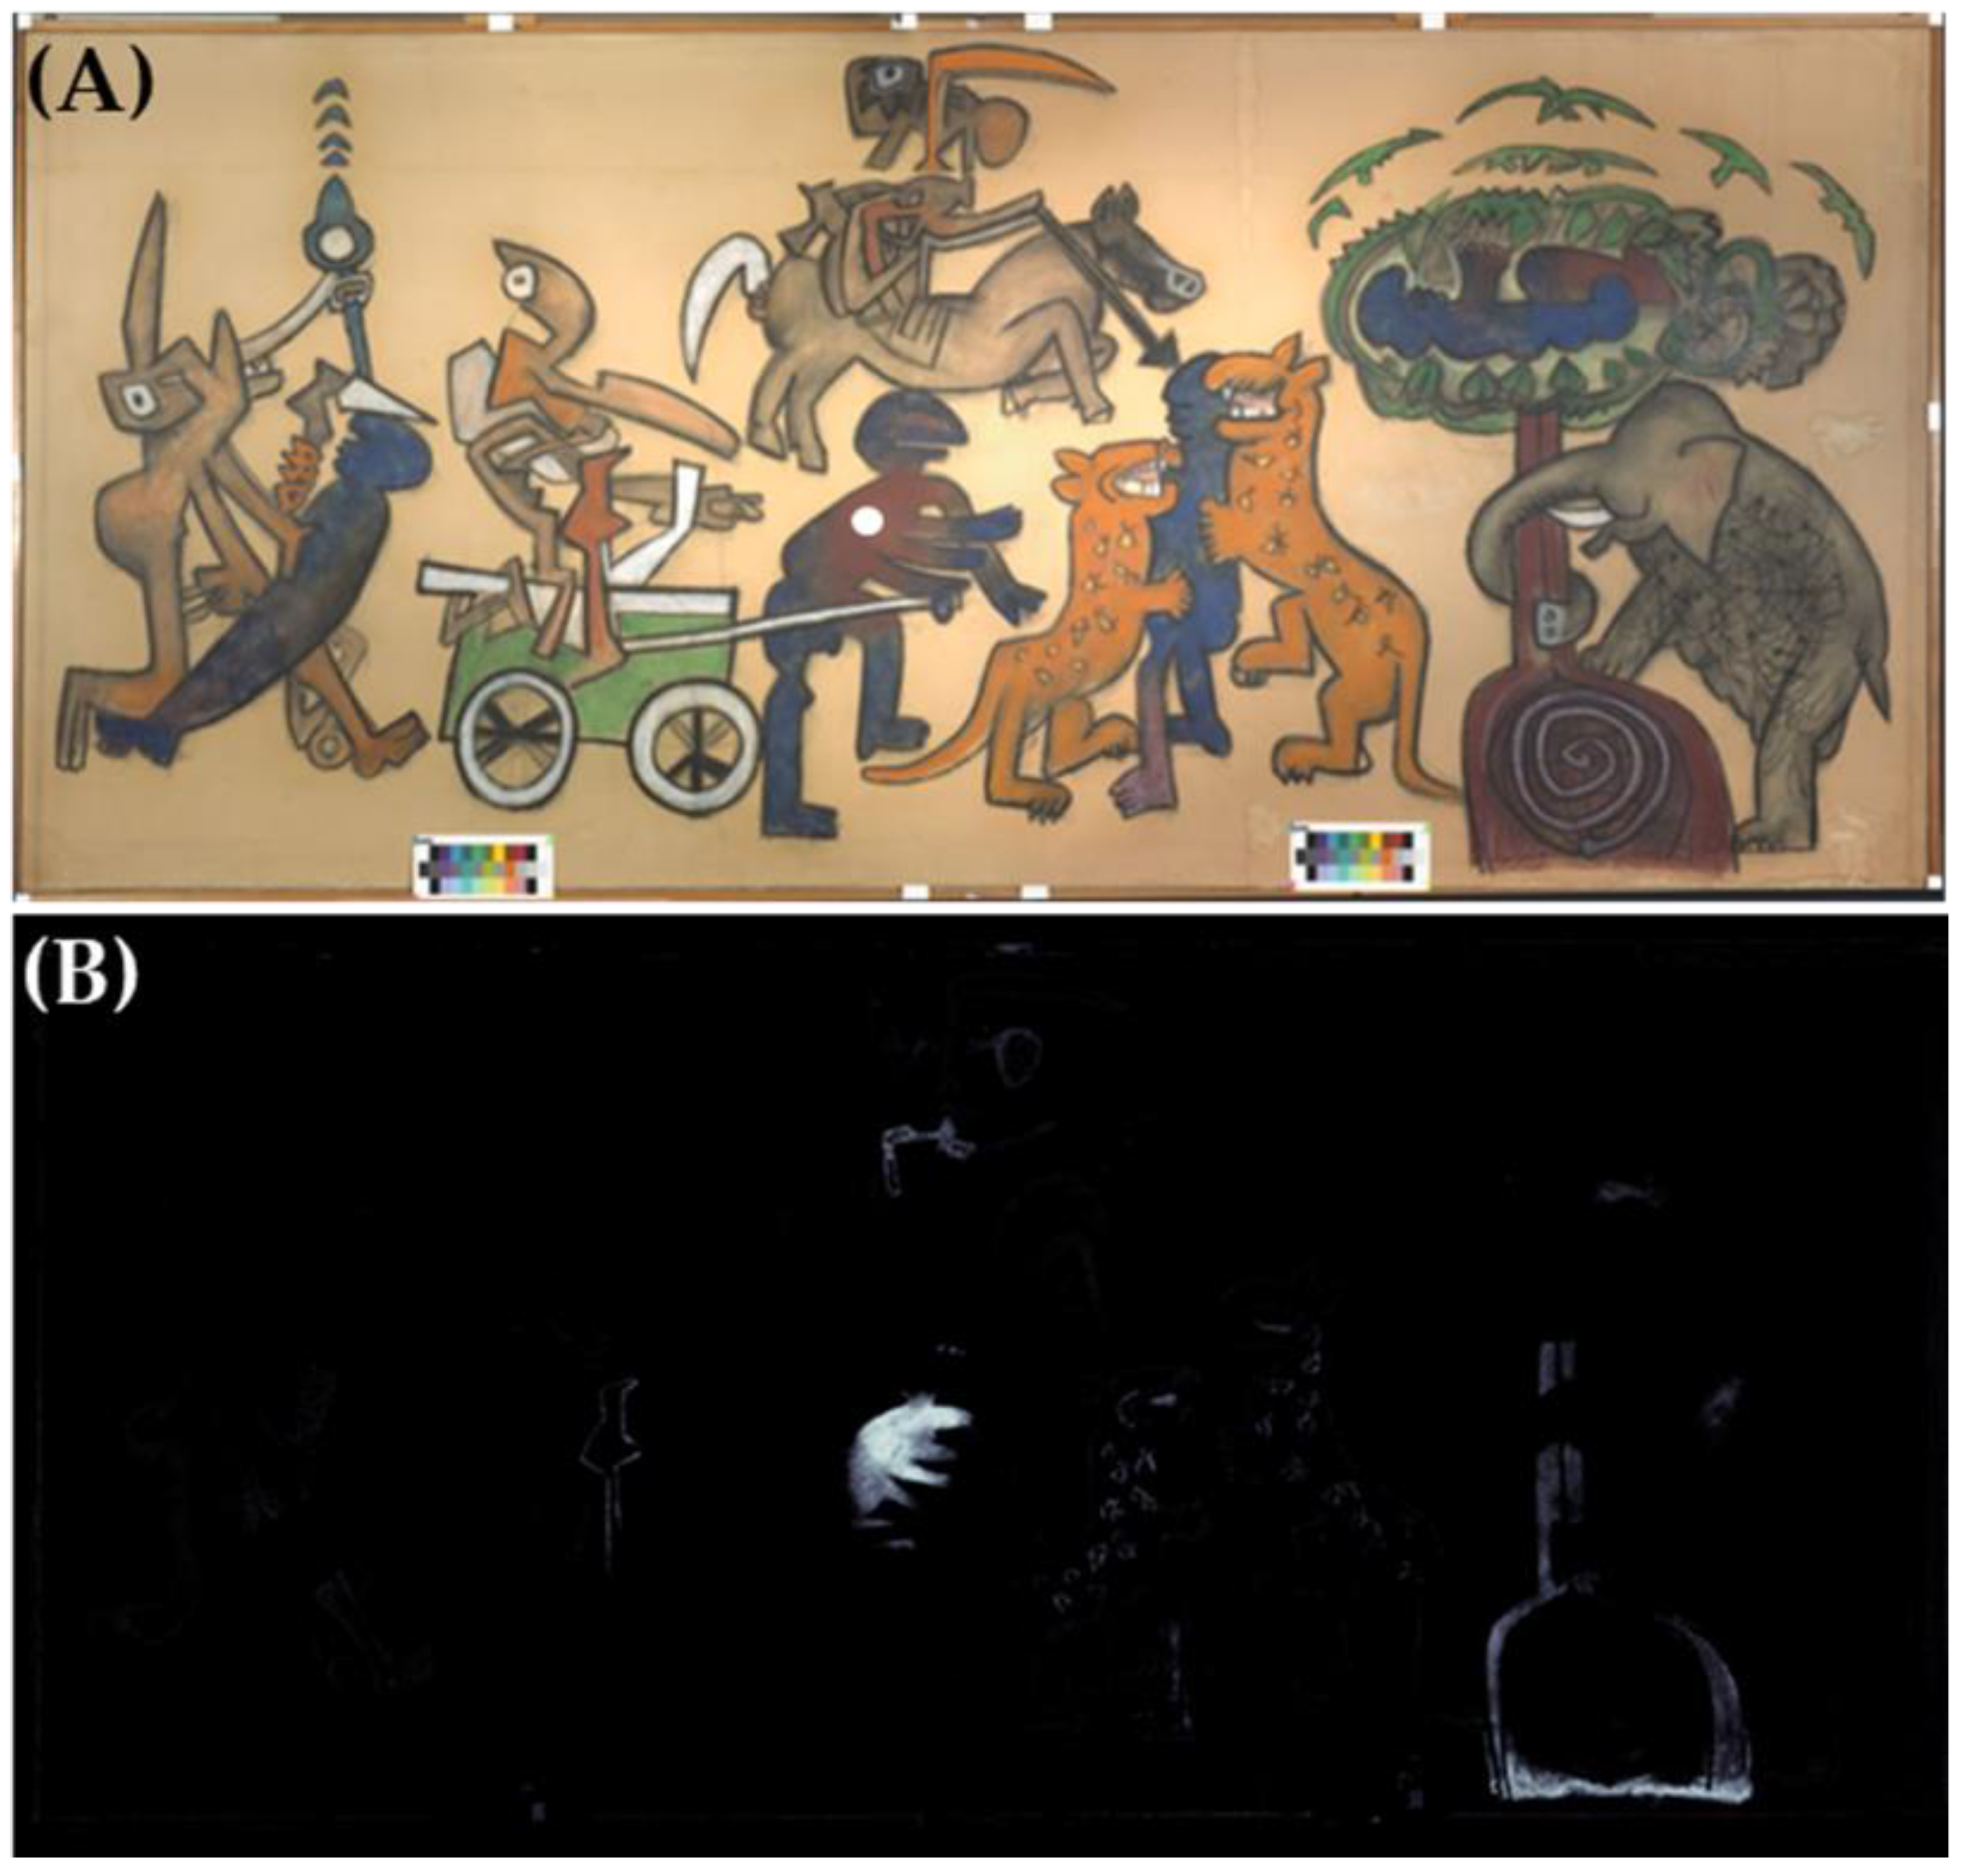
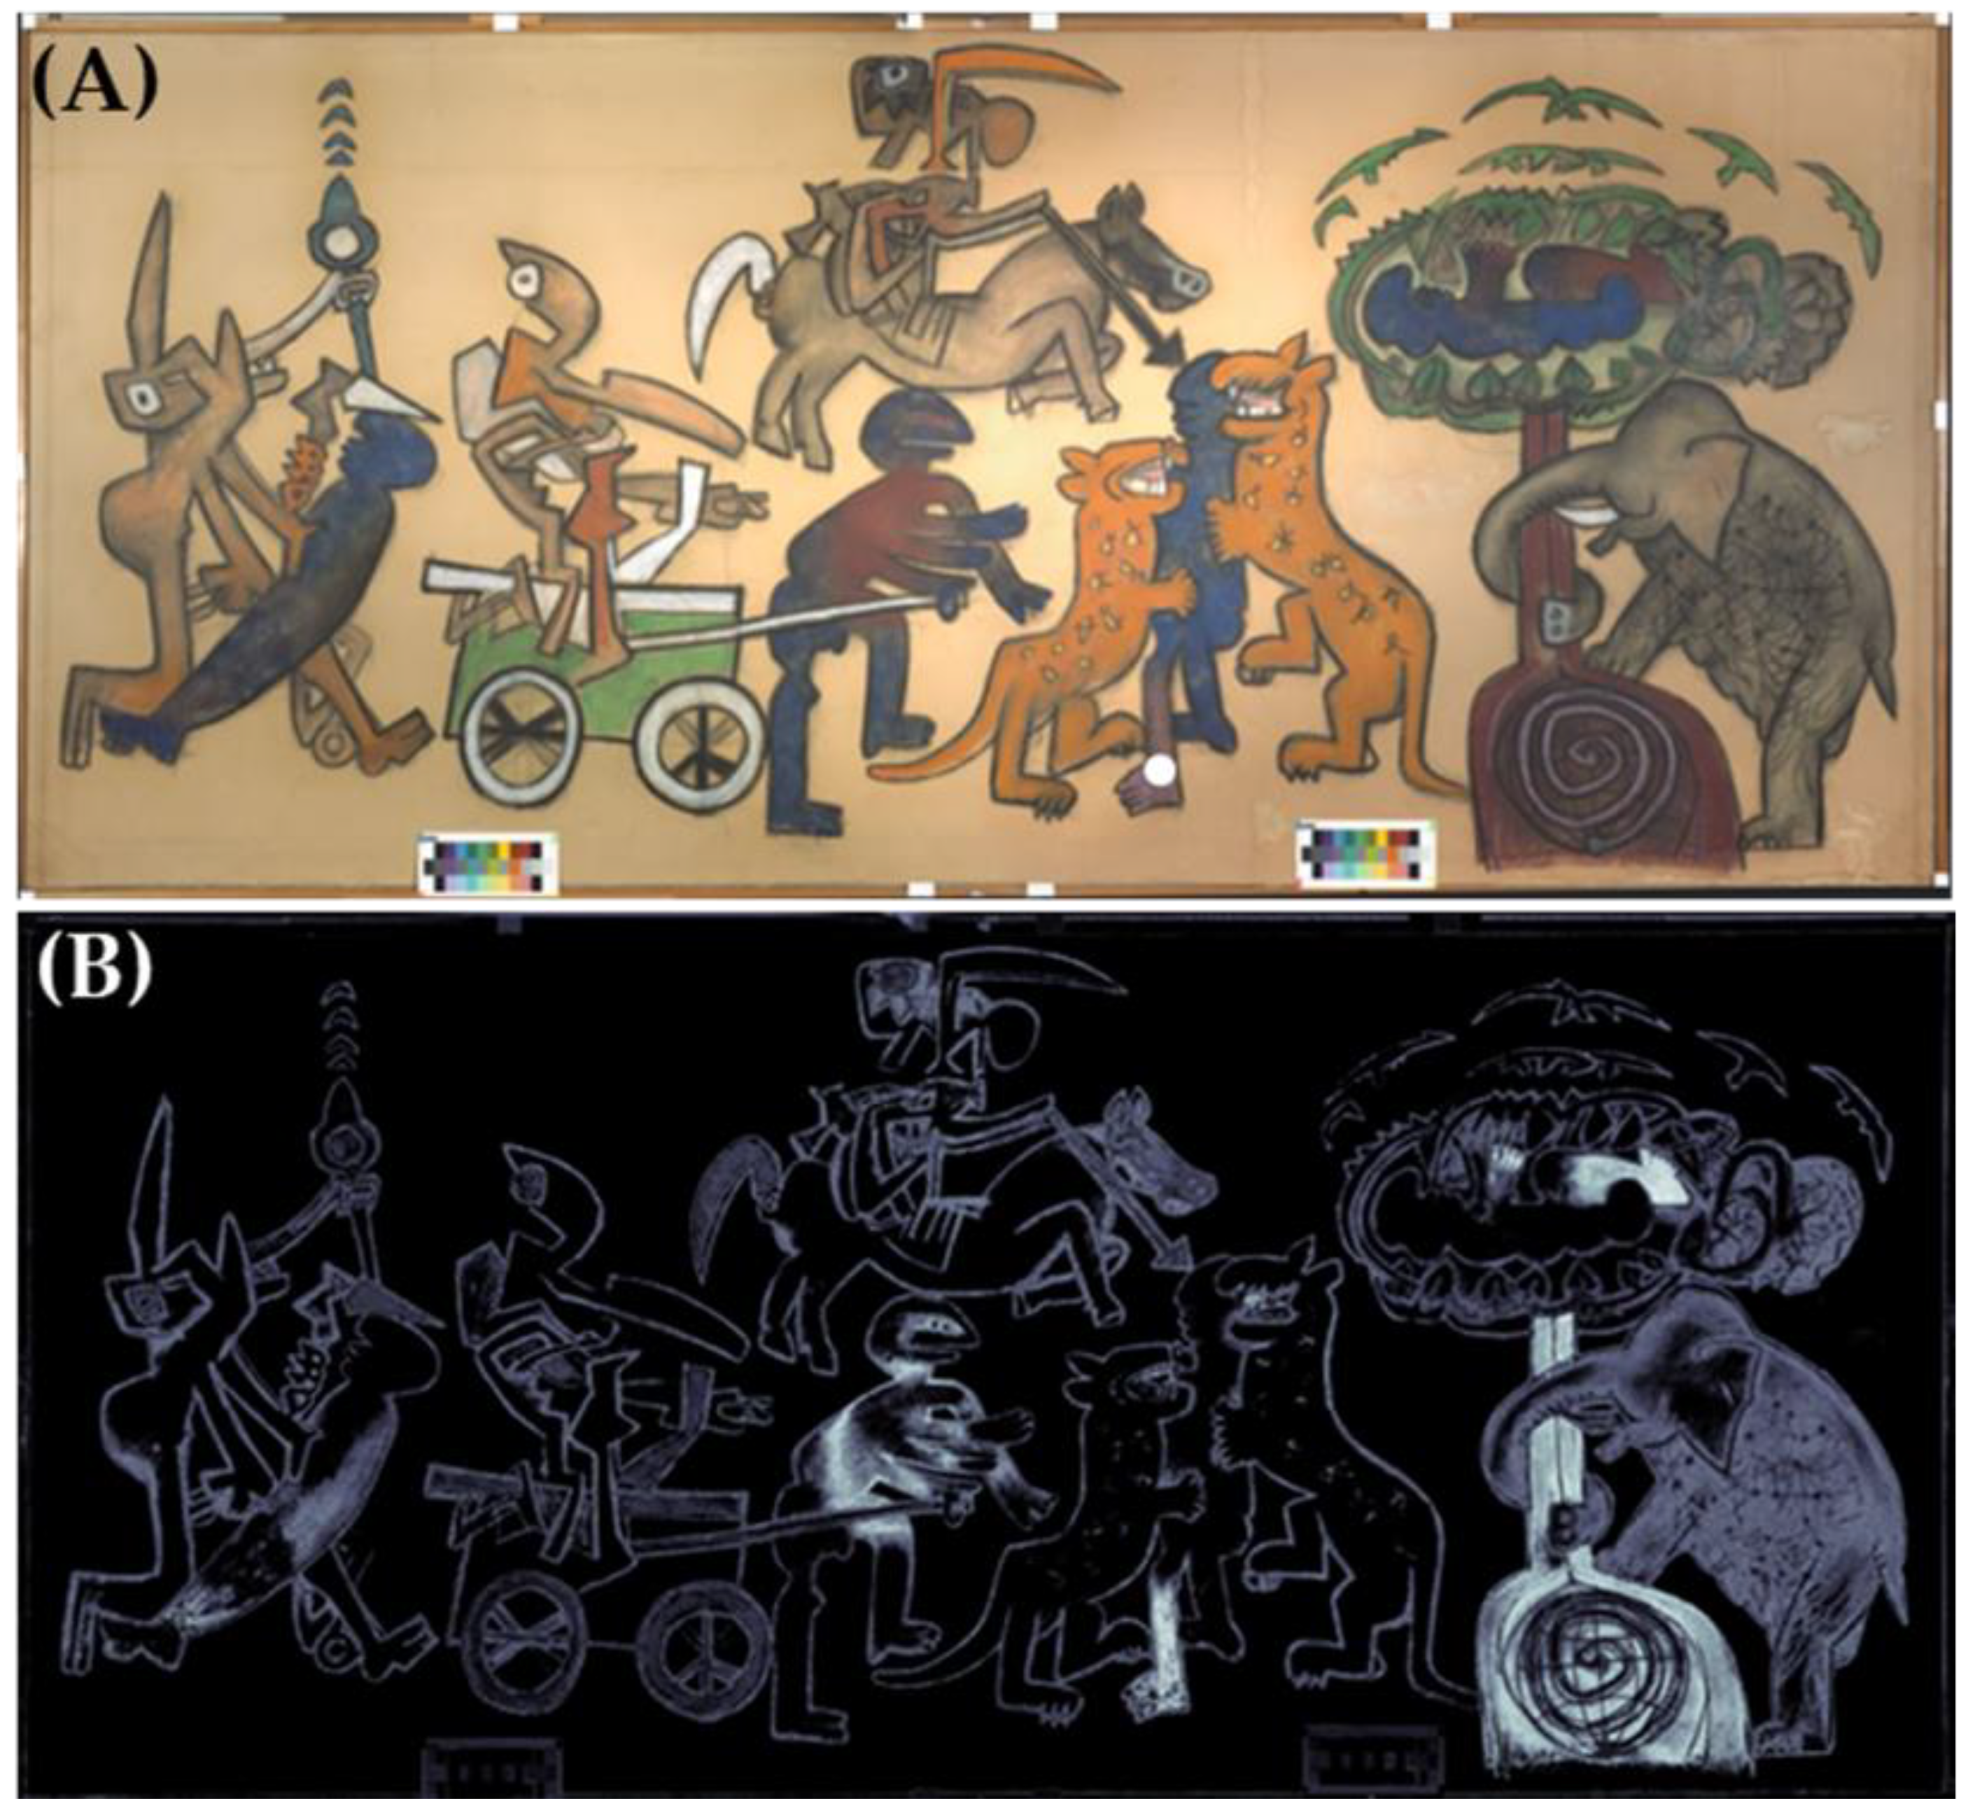
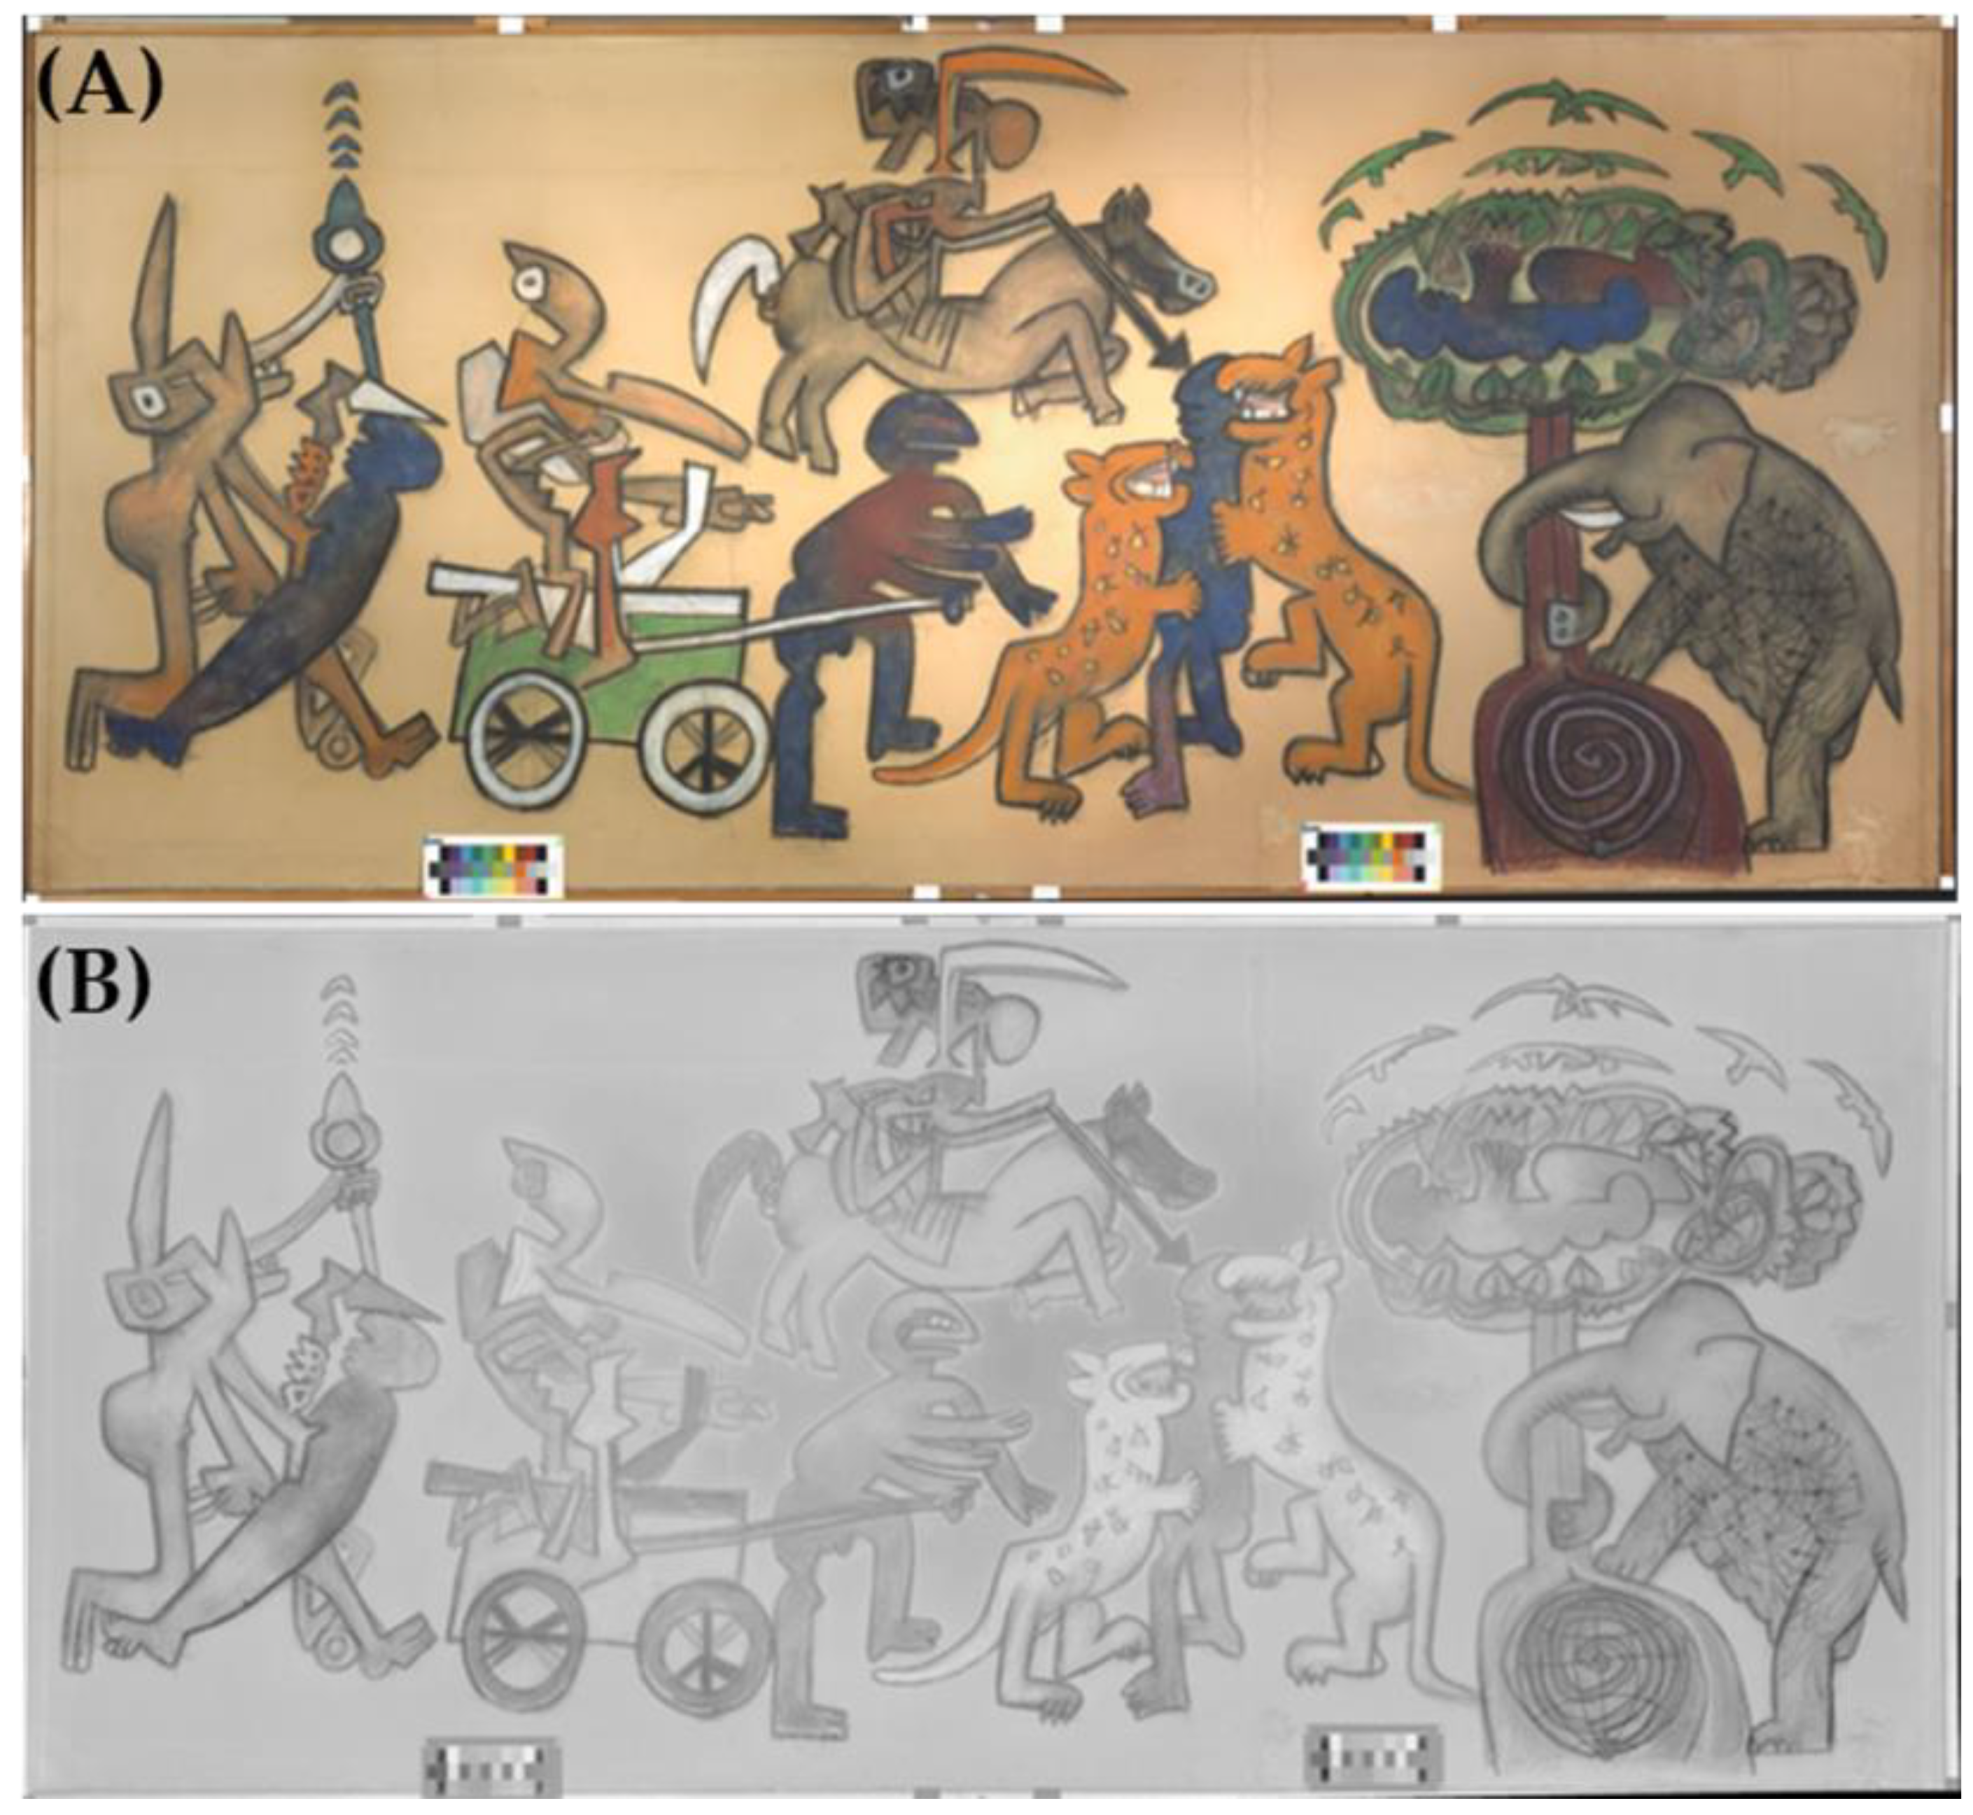
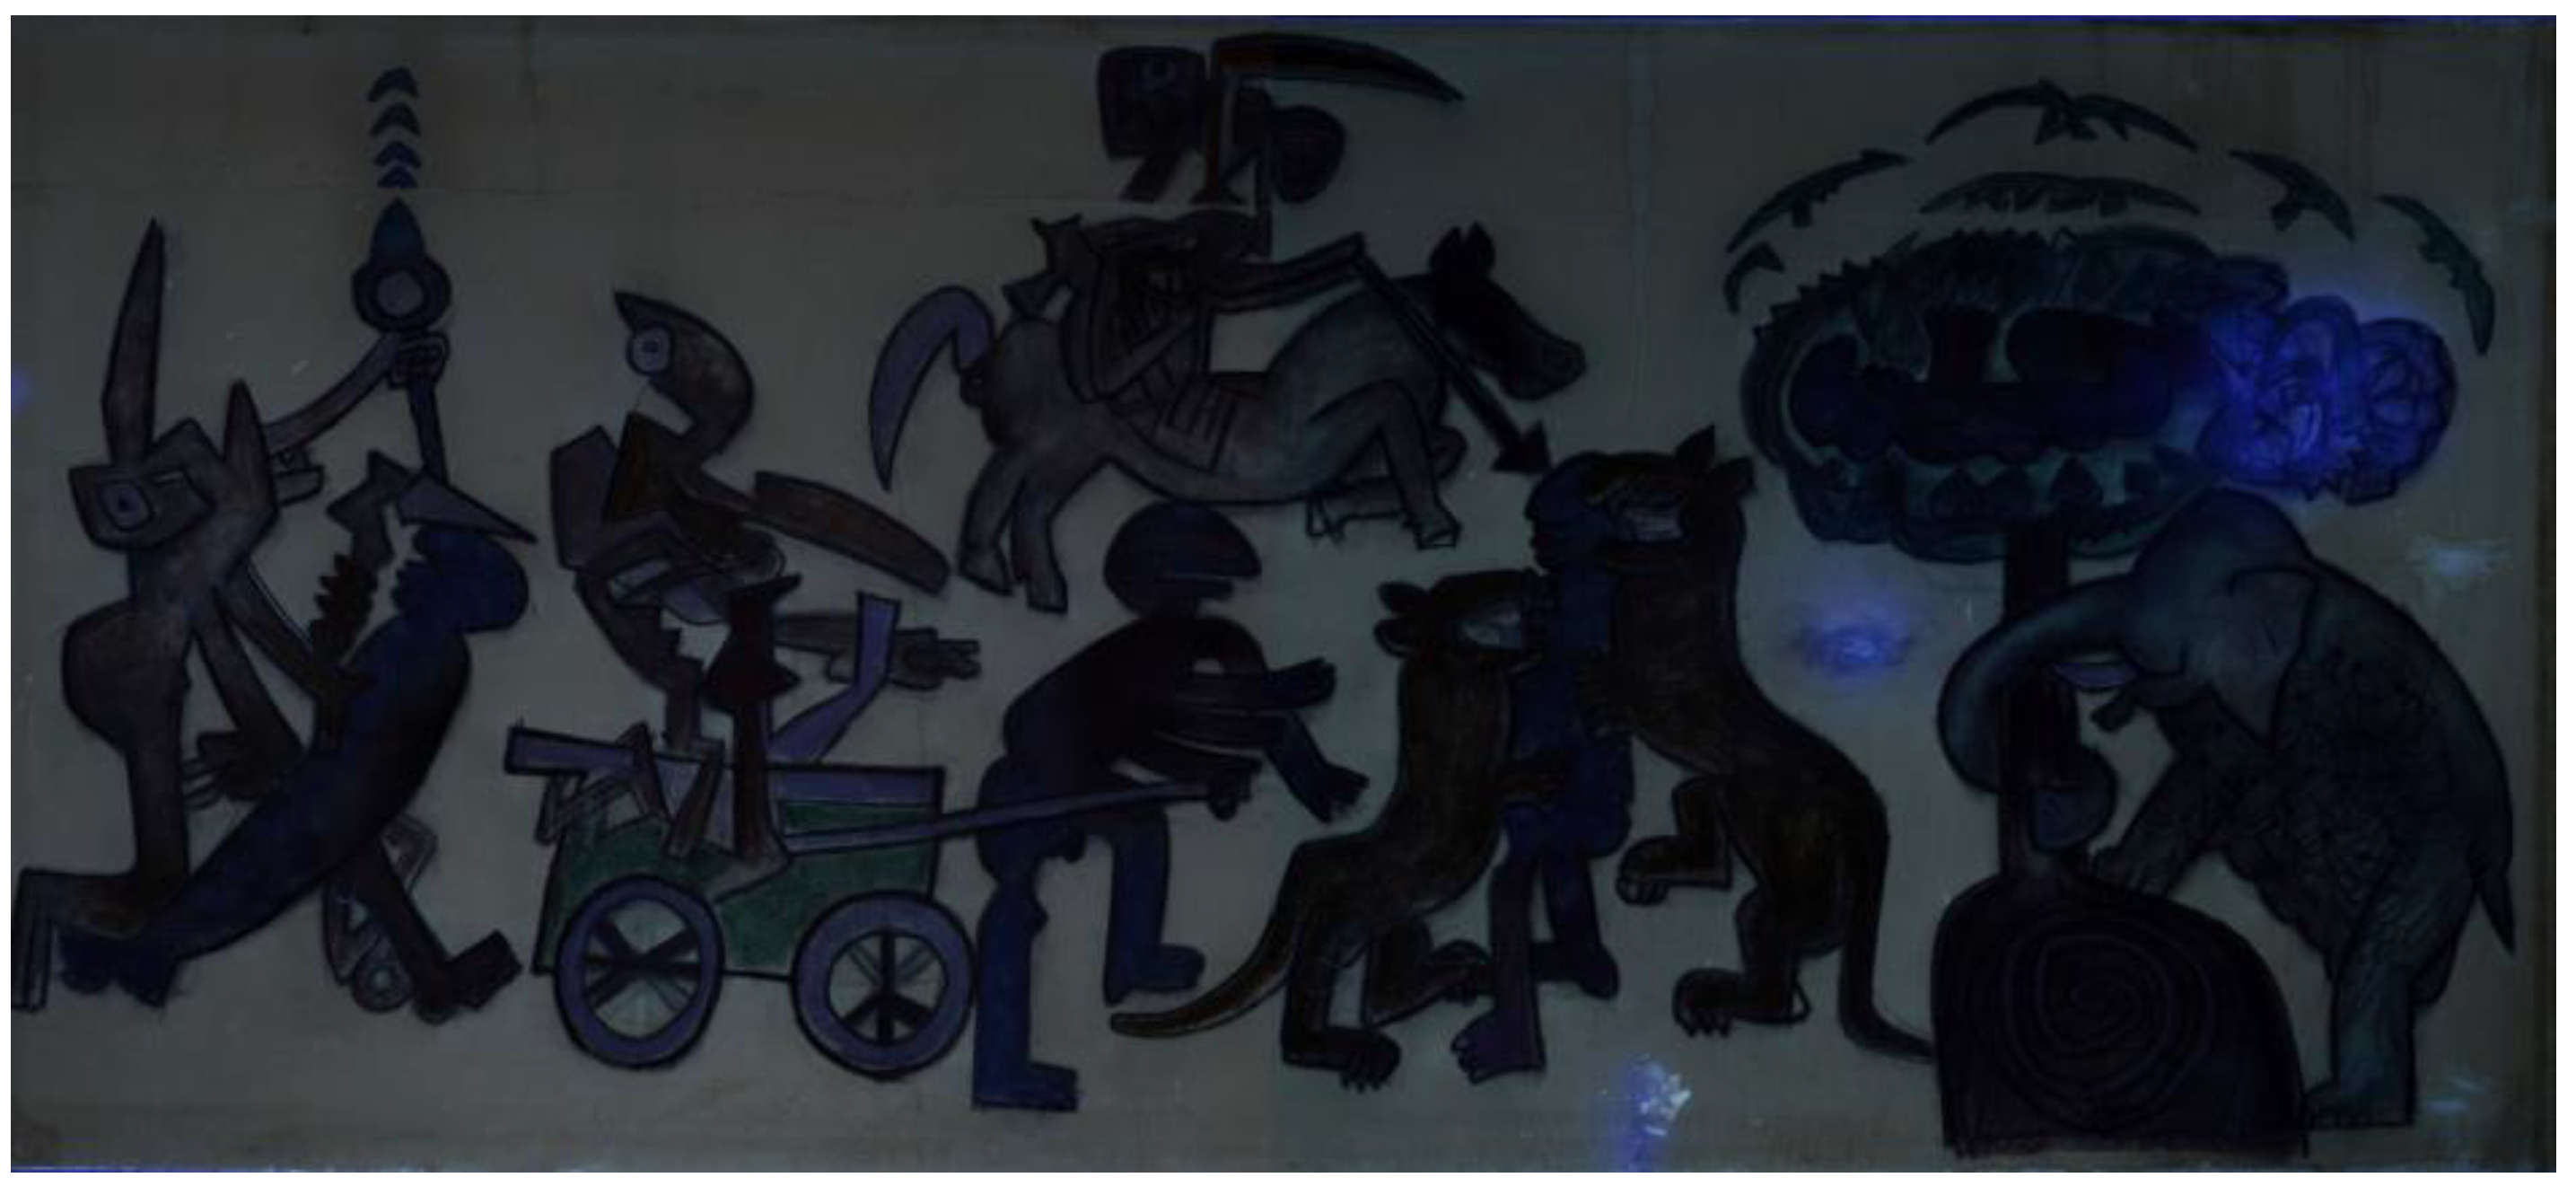
2.1. Hypercolorimetric Multispectral Imaging (HMI) and Ultraviolet Fluorescence Photography (UVF)

HMI, including UVF, is a rapid and portable multispectral imaging system for the in-situ analysis of artworks and materials developed by the Italian engineering society Profilocolore based in Rome. The system may be illustrated in three sections:
(1)
The acquisition set, made of a modified digital camera Nikon D800 (Nital SpA, Moncalieri Torino, Italy) able to acquire the images from 300 to 1000 nm, three bandpass filters for selecting the spectral region, a series of white reference patches, a color checker with 36 colors by Natural Color System (NCS)®© (NCS, Milan, Italy), two modified flashes covering the region from 300 to 1000 nm and two CR230B-HP 10W UV LED projectors, peak emission at 365 nm, mounted at 45° in respect to the camera for acquiring the UV-induced fluorescence (UVF);
(2)
A calibration software named SpectraPick® (Version 1.1, created by Profilocolore, Rome, Italy) based on artificial intelligence and convolutional neural network algorithms for a highly accurate calibration of multispectral images using the white and color references, so that to obtain 7 monochromatic images centered at 350, 450, 550, 650, 750, 850 and 950 nm with high accuracy in reflectance (more than 95%) and color measurement (ΔE around 1.5, where ΔE is the total color difference in the CIELAB1976 space);
(3)
A processing software named PickViewer® (Version 1.0, created by Profilocolore, Rome, Italy) that allows us to apply several algorithms to process the calibrated images [21,22,23].
Because of the great dimensions of the central panel of For the victim to win, two sets of acquisition—each made of three shots, two for generating the seven spectral bands and one to acquire the UVF photography—were done sliding the camera on a parallel plane and then merging the two images with PTGui software [24].

2.2. X-ray Fluorescence (XRF) Spectroscopy

X-ray Fluorescence spectra were collected with a portable XRF spectrometer (Surface Monitor II, Assing, Rome, Italy). The instrument is based on a silver anode as the excitation source and detector X-123 Si Pin that allows the detection of elements from atomic number 16 (S) to 92 (U) with an energy resolution of 146 eV. The X-ray beam is collimated to a spot diameter of about 2.0 mm in diameter. For all measurements on the painting, the following experimental conditions were employed: tube voltage 40 kV; tube anode current 76 μA, acquisition time 60 s. XRF measurements were performed in a total of 18 points (X1–X18) on all the different color pastels used in the work, also including 3 points of the paper support as a reference and to explore the possibility of possible dyeing of the paper (Figure 2).

2.3. µ-. Raman Spectroscopy

Raman spectroscopy measurements were done with a portable BWTek (B&W Tek, Plainsboro, NJ, USA) i-Raman system equipped with a 785 nm laser source and a cooled 2048 pixels CCD array detector, with a spectral resolution of 3 cm−1 and coverage of the spectral range from 0 to 4000 cm−1. The instrument is calibrated in Raman shift by the manufacturer, which periodically carries out system maintenance. At the beginning of each measurement campaign, the spectral calibration is rechecked using a reference sample in polytetrafluoroethylene (PTFE), characterized by clean and well-defined Raman bands. Several measurements under different experimental conditions were acquired for six points (P1–P6) of analysis corresponding to six different pastel colors used by Matta. These points were chosen where XRF spectroscopy did not give definitive and certain results.
Different combinations of laser power and integration time were tested; the measurements, in fact, suffer from the presence of a notable fluorescence signal, mainly due to the paper, which tends to cover the already weak Raman signal that could be detected. Increasing the laser power could enable it to obtain a detectable Raman signal, but it would mean a considerable rise in the fluorescence signal and potential microdamage to the painted surface. For these reasons, the laser power was kept between 10% and 20% of the maximum rated power of 30 mW with an integration time of 30 s. The points of Raman analysis are shown in Figure 3.

2.4. Fourier Transform InfraRed (FTIR) Spectroscopy

FTIR analysis was performed by bench spectrophotometer Nicolet Avatar 360 on an original red pastel used by Matta in his late artistic production in Italy. The spectrometer consists of an IR source and a DTGS detector (Deuterated Try-Glycine Sulphate) and operates in the spectral range between 400 and 4000 cm−1 with a resolution of 4 cm−1. A quantity of 5 mg from a red pastel “Rembrandt soft pastel” found in the artist’s studio in Tarquinia was grounded without any treatment in agate mortar with potassium bromide (KBr) used also as background material. For each sample, 256 scans were acquired in diffused reflectance mode DRIFT (Diffuse Reflectance). The functionality of the different parts of the spectrometer was checked before the measurements by running the diagnostic tests on the different components of the instrument through the software OMNIC 5.2. Calibration was performed by a standard polystyrene film supplied with the instrument.

2.5. Optical Microscopy and Scanning Electron Microscopy-Energy Dispersive Spectroscopy (SEM-EDS)

A small sample of the pastel painting, picked on a marginal portion of the artwork, in correspondence with a pre-existing tear (the only sample that we were permitted to take), was examined through optical and electronic microscopy as a cross-section. This was prepared after having embedded the micro-sample (about 2 mm2) in a polyester resin (X60 NXMET), suitably cut and polished. The prepared cross-section was observed with a polarized light microscope Zeiss Axioskop; equipped with reflected, transmitted and UV lighting. The images were acquired through Zeiss AxioCam NRc (Zeiss, Oberkochen, Germany) camera and processed using AxioVision software to trace the sequence of stratigraphic layers and to recognize possible traces of organic material or characteristic fluorescence of materials by means of observation with ultraviolet radiation.
The same cross-section was further analyzed through a Jeol (Tokyo, Japan) JSM 6010LA electron microscope working at 20 kV and equipped with an EDS probe. The sample was placed on aluminum stubs, fixed by carbon tape and metallized with gold through a Balsers MED10 sputter coater, operating under a vacuum. Morphological observation of the sample was done with the electronic microscope in back-scattered electrons (BSE) mode at different magnifications to deeply investigate the pictorial layer and the underneath paper support.

3. Results

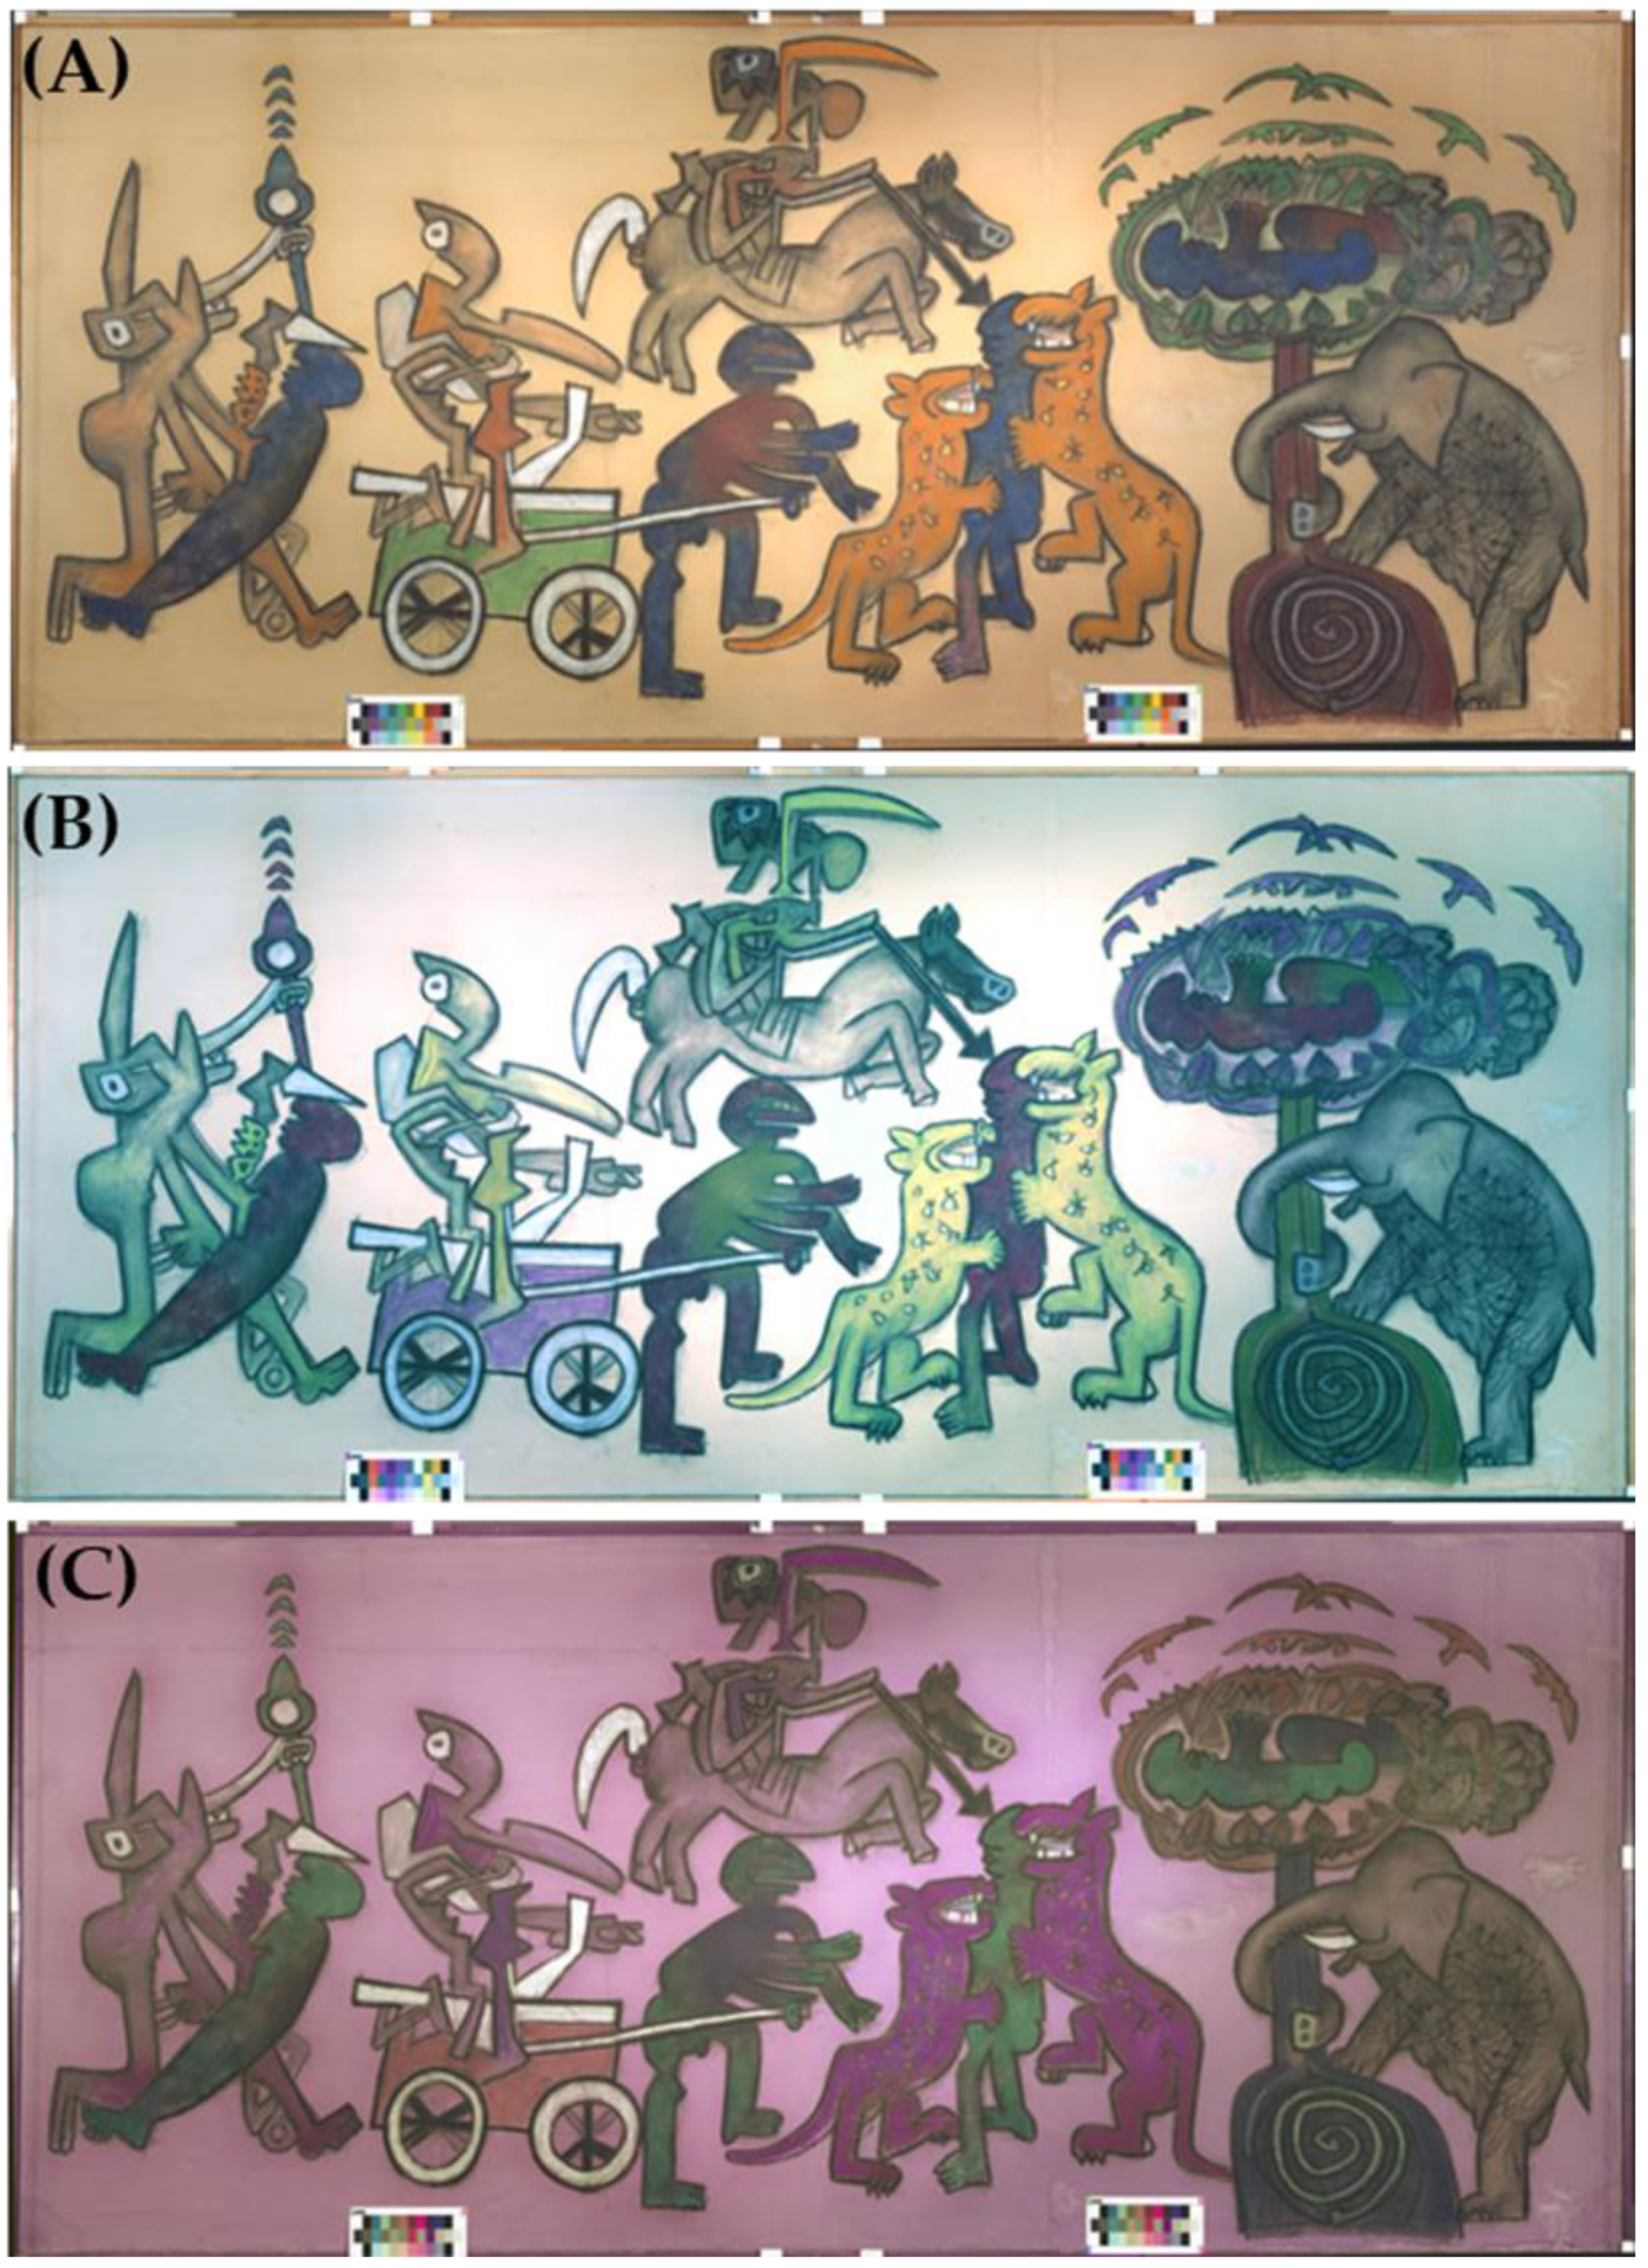
3.1. HMI and UVF Data

HMI-processing software PickViewer® allows us to apply different algorithms, all useful to obtain information on the materials, techniques and conservation status of the artwork. Two typical image-processing techniques are the infrared and ultraviolet false color outputs (IRFC and UVFC, respectively) which can be rapidly and easily produced by the specific tool of PickViewer®. In Figure 4 the IRFC and UVFC images are shown.
According to the literature data, it can be supposed that the blue and green areas are made of phthalocyanine-based pigments that have dark-red and light-violet responses in IRFC, respectively [25,26]. These two pigments have a different response in UVFC: the blue becomes green and the green becomes pink, as reported in the literature [27]. By combining the results of IRFC and UVFC it is possible not only to suppose the composition of green and blue pigments but also to differentiate the two kinds of phthalocyanines.
The other observed change concerns the orange color that in IRFC appears light yellow whereas in UVFC it becomes violet. This behavior seems to be typical of lead chromate-based pigments [28], but no other examples were found in the literature regarding this pigment response in IRFC and UVFC apart from that found in the reference [28] where, however, the pigment is declared to be analogous to crocoite (pigment Kr. 10850) with formula PbCrO4. The other analysis performed in our study, specifically XRF spectroscopy and SEM-EDS, will confirm this hypothesis (see Section 3.2 and Section 3.5) by revealing the presence of Pb and Cr. The formula of chrome orange, as reported in the literature is PbCrO4∙PbO or PbCrO4∙Pb(OH)2 [29,30], but the false colors are probably very similar for the different lead chromate-based pigments.
White color areas appear white in IRFC and very pale yellow in UVFC. In this case, the comparison with the above-considered database does not help to make hypotheses about the composition. Some analogies can be found with lithopone, a mixture of barium sulphate and zinc sulfide [28].
It has been stressed that the IRFC and UVFC images are not resolutive in the characterization of pigments, but they can give some indications to make hypotheses and to address the choice of points for further analysis, such as p-XRF and micro-Raman.
This is particularly relevant in the present case because it was not possible to take pigment samples from the surface. In fact, the only sample that we were permitted to take was that from a lacuna in the lower part of the artwork, as specified in Section 2.5.
The HMI-processing software can be used also to perform chromatic similarity maps in order to investigate the distribution of a pigment or a mixture of pigments on the painting surface. One example is supplied in Figure 5 where the similarity map was obtained for the red color in the figure at the center of the painting.
In addition to the character carrying the cart, this red color has been used also in other limited zones of the painting, in correspondence with the white pixel shown in the figure. Another map was performed for the violet color, probably a mixture of pigments including white, used to paint a leg of the blue figure between the two tigers. In this case, an interesting map has been produced by the algorithm of chromatic similarity (Figure 6).
In fact, the main similarity is found in the violet-red areas of the painting, but also in the contours of all figures and objects of the painting and in the elephant. Considering that the contours appear black in the visible, the violet color of the leg probably contains the black pigments used for obtaining the outlines.
To better highlight the black outlines of the figures and objects in the scene, the NDI (normalized difference index) algorithm was applied to the calibrated bands. In particular, the UV and RGB bands were subtracted from the three IR ones. In Figure 7 the image resulting from the application of the NDI algorithm is displayed clearly showing the outlines of the figures and objects in the scene.
To complete the multispectral acquisition, the UVF image of the painting was also obtained, after stitching the two shots made under ultraviolet radiation (Figure 8).
UVF is usually requested by restorers at the beginning of the intervention in order to have a general view of the conservation status of the artwork surface. In fact, this technique highlights the presence of eventual repainting, grouting, retouching and fluorescence associable with different kinds of materials both organics and inorganics [24,25]. In the image of Figure 8, no fluorescence can be observed on the painting surface, suggesting the absence of the above-mentioned interventions and also of a possible fixative used for pastels. Some light blue fluorescence is observed in the area where a probable restoration has been performed by using an adhesive that could be responsible for the response under UV radiation.

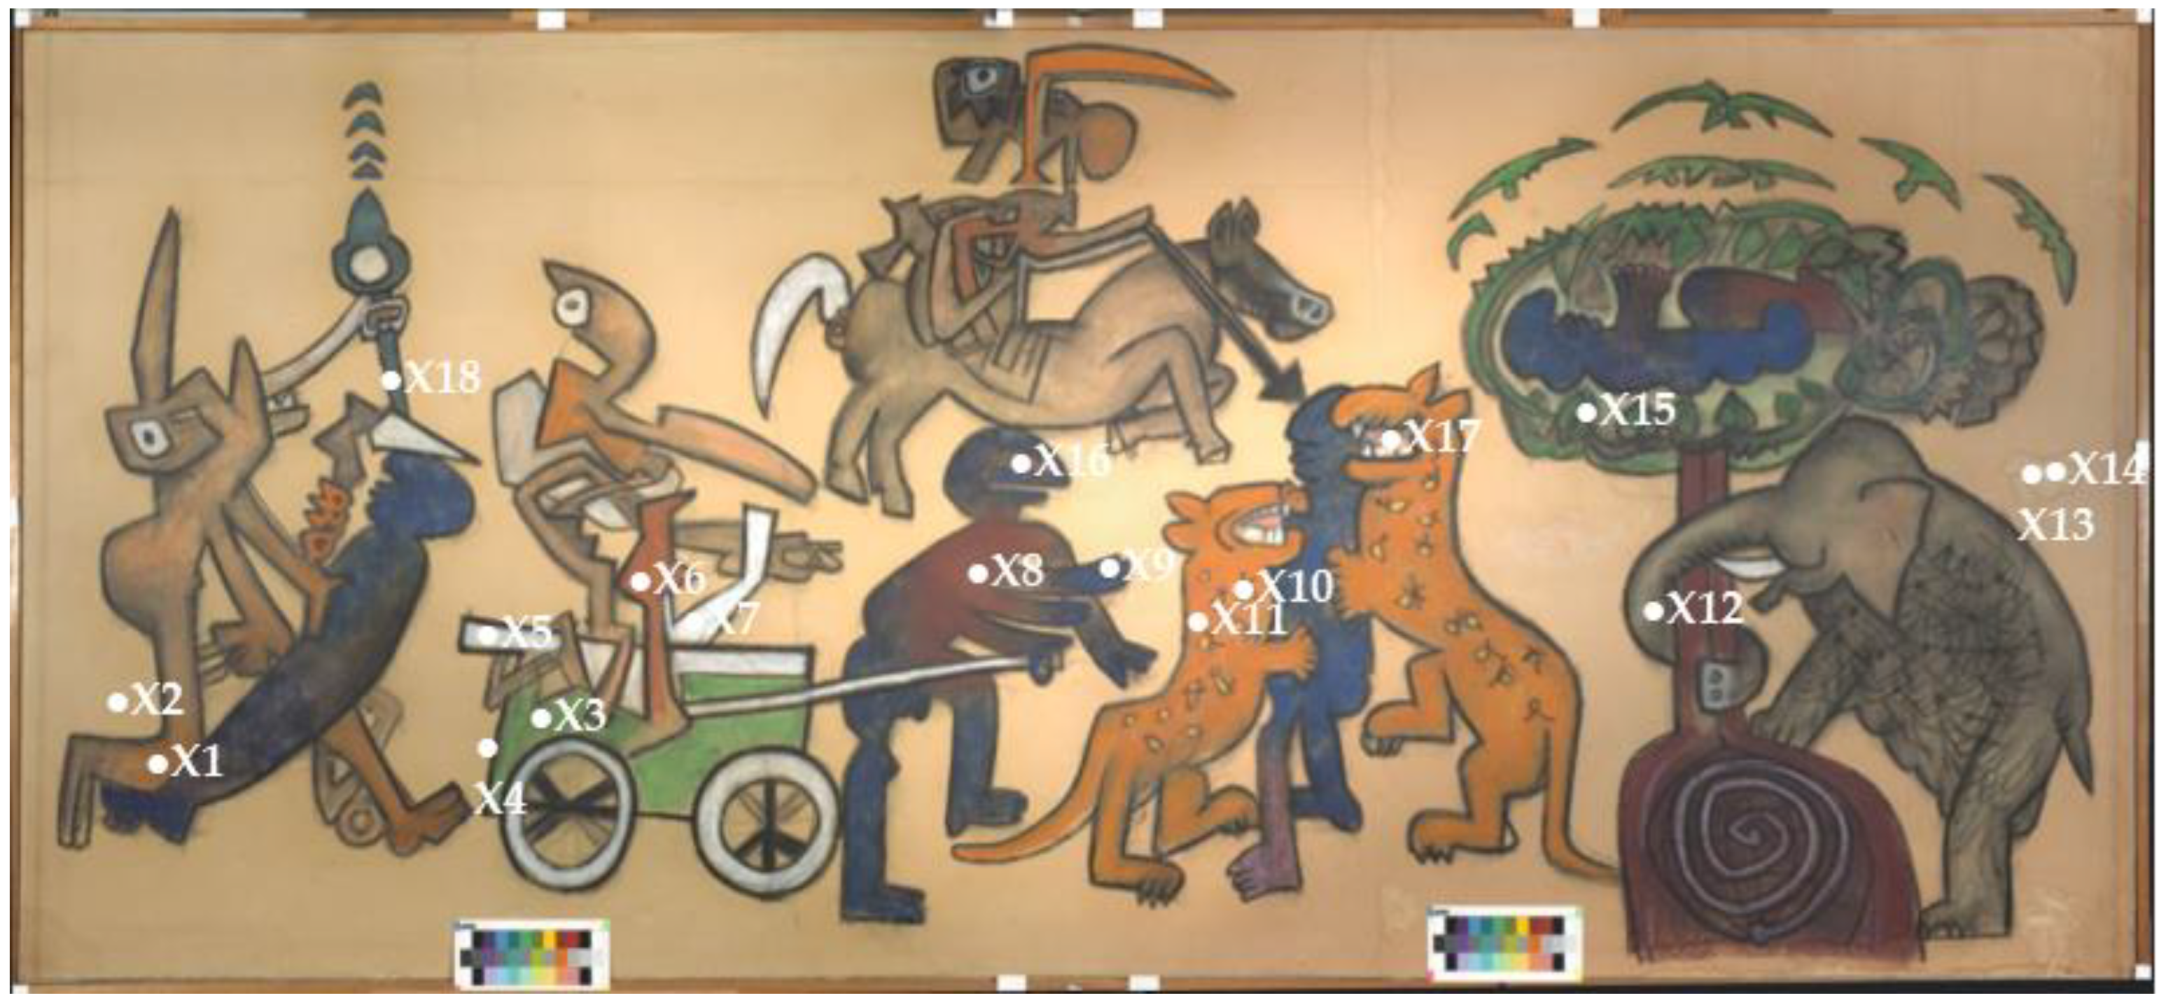
3.2. X-ray Fluorescence Spectroscopy (XRF)

XRF analysis was performed on 18 points on the artwork (as shown previously in Figure 2), to detect the main chemical elements constituting the color palette used by Matta also included two points of the paper support as a reference to explore the hypothesis of possible dyeing of the paper. This hypothesis was formulated by the restorers at the beginning of the intervention, as the surface appeared of a homogeneous and yellowish color. Table 1 reports the main elements detected through XRF spectroscopy for the investigated areas and suggestions for their attribution. Some first observations may be made concerning the elements present in all examined points, i.e., calcium and iron. These elements are detected in low counts (average value for Ca = 123 cps, and for Fe = 216 cps) indicating their probable presence in the paper due to the production cycle. The only point with high counts of Fe is X8 where the element is associated with iron-based pigment. The presence of calcium and iron is probably due to the chemical treatments used in the paper manufacturing process, suggesting the presence of inorganic pigments as mineral fillers during industrial bleaching and opacification processes. According to the literature data, calcium carbonate (CaCO3) is mentioned among the most used materials for the finishing treatment of the paper [31,32]. Therefore, the possibility that the paper was colored by the artist may be excluded.
Other elements widely present in the examined points are barium and zinc that, if associated, may be considered as lithopone, a white made of barium sulfate and zinc sulfide, widely used in contemporary art [33,34].
Ba has been detected also alone in some points (X3, X9, X17 and X18) suggesting the addition of barium white, i.e., BaSO4. Theses pigments, widely used since the 19th century, were often added to organic dyes as inert or extender [35].
The orange and yellow colors contain lead and chromium indicating the use of pigments based on lead chromates [36,37]. The shades of pink do not present significant elements to establish the composition of the pigment, so it could be some organic dye. Green and blue areas reveal the presence of Cu, sometimes associated to Br, which allows us to hypothesize the use of phthalocyanine-based dyes. In the black color, no significant XRF signal was detected so the use of a carbon black pigment can be considered. To deepen the knowledge of the pigment composition, especially in the case where XRF was not resolutive, µ-Raman spectroscopy was applied.
The presence of several elements in the examined points is due to the mixing of colors and to the intrinsic characteristics of contemporary artist materials often containing different extenders [38,39].

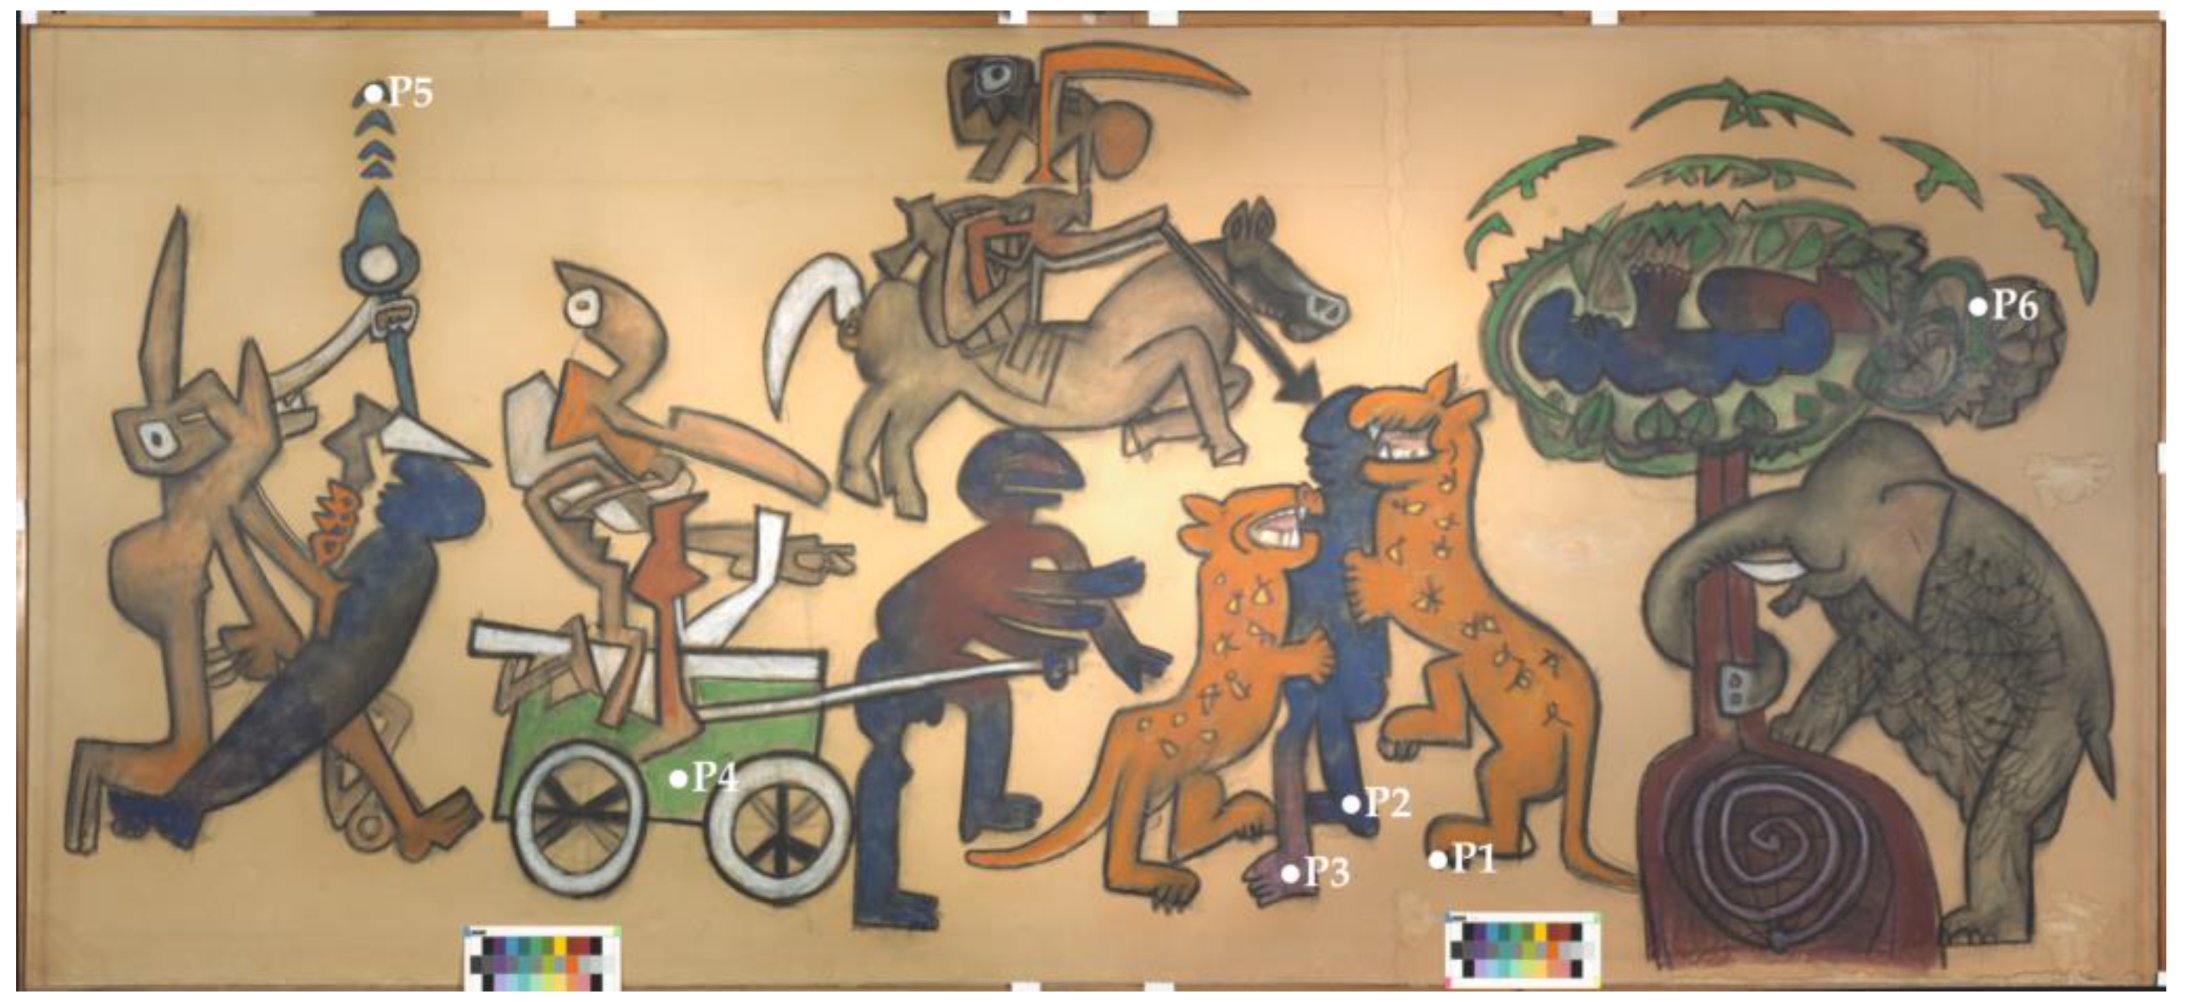
3.3. µ-. Raman Spectroscopy

Raman spectra were acquired in six points of the painted surface (as shown in Figure 3) repeating the measurement for every point to improve the signal/noise ratio. The Infrared and Raman Users Group (IRUG) database was used for comparison with reference spectra [40]. Figure 9 shows all experimental average Raman spectra referred to the six examined points and the relative molecular structure.
The analytical results and Raman spectra are listed below:
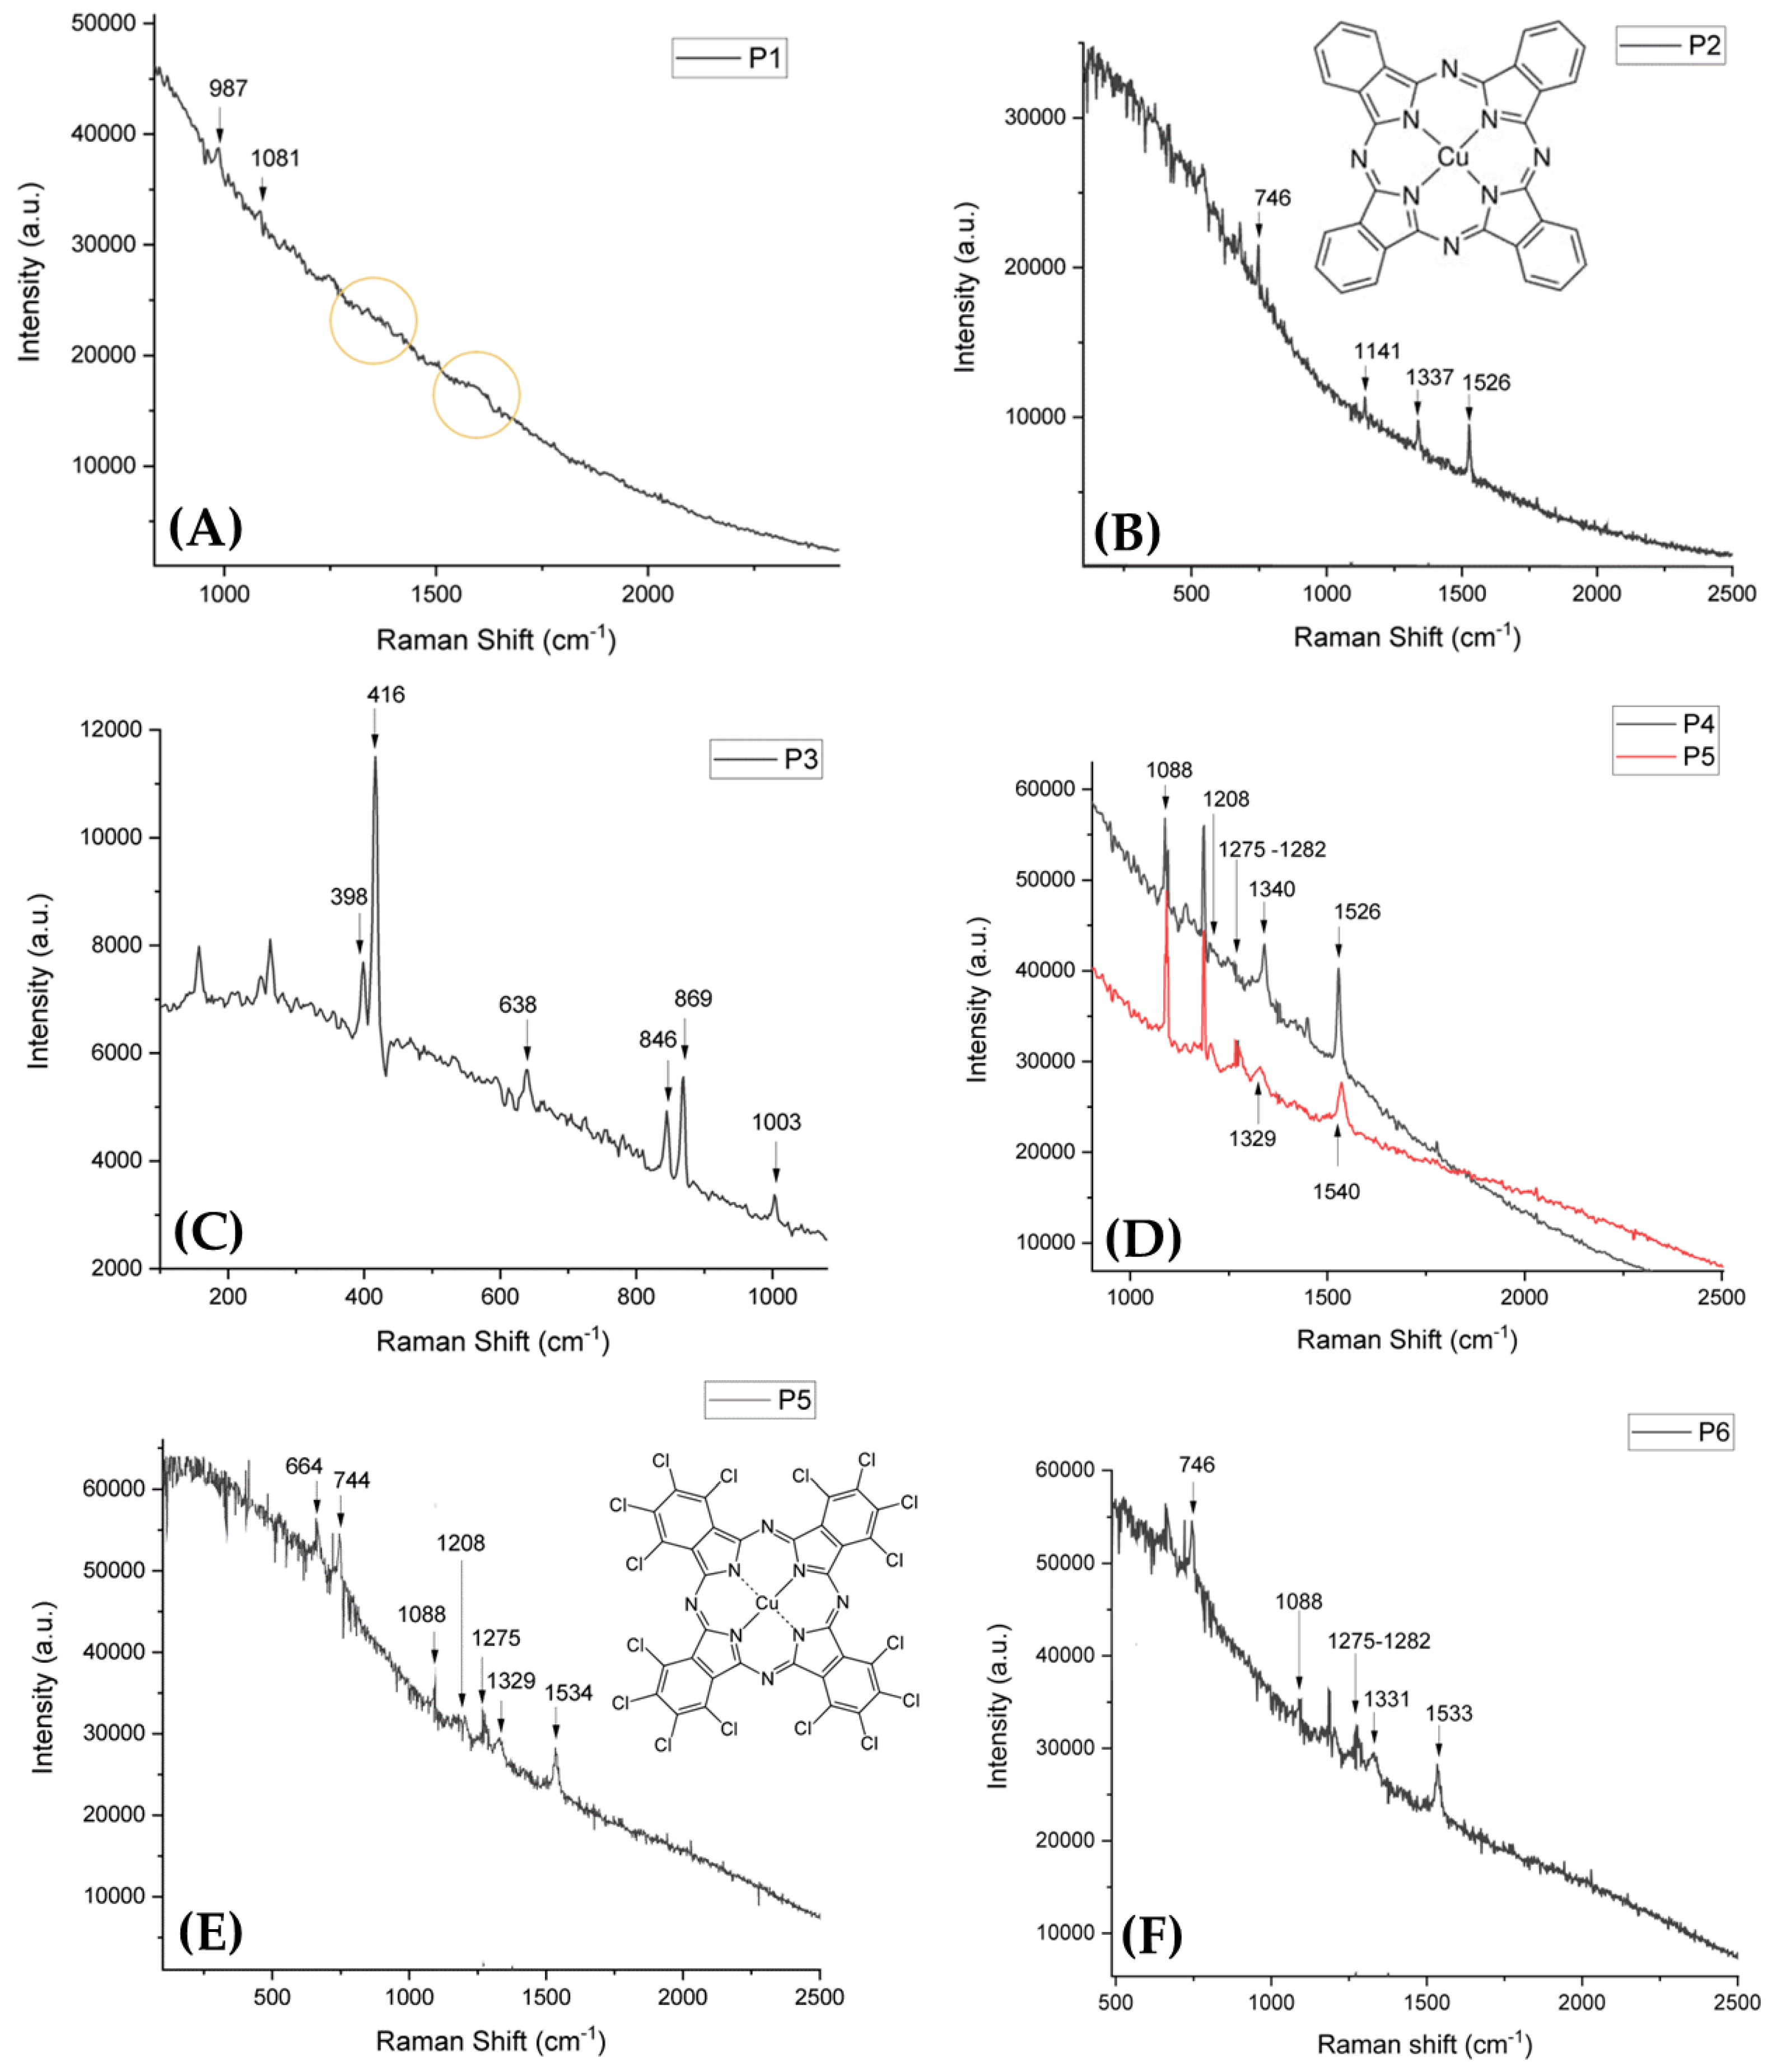
  • Point 1 (P1): black pastel used for the outlines of the figure. The measurement on black is particularly complicated, as it tends to absorb laser radiation and can be degraded very easily. For this reason, only 10% of the maximum rated power of the instrument was used, without overcoming the 3 mW of power. However, the Raman signal is very weak and noisy and the two small peaks at 987 and 1081 cm−1 have not been assigned Figure 9A). Nonetheless, the large band centered at about 1587 cm−1, associated with the presence of bands around 1320–1330 cm−1 (both encircled in yellow in Figure 9), suggest the usage of carbon black pigment [41]. Raman signals at higher Raman shifts and the background signal also suggest the presence of some organic materials.
  • Point 2 (P2): dark-blue pigment. The spectrum can be perfectly superimposed on the IRUG Raman spectrum of Cu-Phtalocyanine Blue, called Monastral Blue as suggested by characteristic Raman peaks at 746, 1141, 1337 and 1526 cm−1 (Figure 9B).
  • Point 3 (P3): rose/violet color. Some Raman signals are clearly readable at 398, 416, 638, 846, 869, 1003, 1778 and 2877 cm−1 (the last two are not shown in Figure 9C). The peak at 1778 cm−1 is weakly present in all collected spectra, regardless of color and investigated area, and is probably referable to the paper support. The peak at 2877 cm−1, visible in various spectra although very weak, could be associated with traces of organics. Other Raman signals refer to the pigment, but they do not correspond to any of the pigments in the IRUG database. Anyway, these signals allow to exclude the presence of pigments such as manganese violet, but also mixtures classically used for the violet yield such as madder lake (red madder) combined with ultramarine blue [42]. On the other hand, the presence of an iron-oxide-based red pigment can be hypothesized on the base of the peaks at low Raman shifts which are close but not perfectly coincident with those of Fe (III) oxide, probably mixed with other inorganic pigments. The signal at 1003 cm−1 could indicate traces of gypsum (although the calcium sulphate line is normally found at 1006–1008 cm−1), often used to lighten dark colors. The two neighboring lines around 400 cm−1 could indicate the presence of azurite, whose main peak is normally placed between 395 and 410 cm−1. The various hypotheses proposed, however, do not allow definitive identification of the pigment mixture.
  • Point 4 (P4) and 5 (P5): light-green and light-blue pastels. Raman spectra revealed that the two colors are very similar chemical compounds (Figure 9D,E). In particular, P4 shows most of the main peaks and the group of signals at 1088, 1208 and 1280 cm−1 that indicate the presence of Cu-polychloride-phthalocyanine, but other Raman shift of the peaks at 664, 744, 1088, 1208, 1329 and 1535 cm−1 suggest a mixture with Cu-Phtalocyanine Green, called Monastral Green. P5 presents Raman peaks clearly comparable to the IRUG spectrum of Cu-polychloride-phthalocyanine.
  • Point 6 (P6): dark-green pastel. Raman data show a spectrum coherent with P5 (Figure 9F).

3.4. Fourier Transform InfraRed (FTIR) Spectroscopy

FTIR analysis supplied the identification of original painting materials. The investigated sample was picked by one of the Rembrandt soft pastels still preserved in Matta’s studio in Tarquinia. This was a unique and invaluable opportunity to compare the artwork’s materials with original contemporary art products of the 20th century perfectly preserved and it also represented helpful support for heritage sciences in this study since the fragility of the pastel painting and the actual risk of pictorial fall and loss strictly limited the number of samples available for analytic surveys. As shown in Figure 10, the FTIR spectrum is complex and rich in signals attributable to both inorganic and organic compounds. The presence of sharp peaks in the spectral range 3696–3200 cm−1 can be associated with -OH stretching which is present in clay materials, such as kaolinite and bole. Further signals attributable to kaolinite/bole can be observed at 1110, 1034, 1011 and 915 cm−1, while the peaks at 540 and 474 cm−1 indicate the presence of iron oxides. Aromatic overtones in the 2138–1965 cm−1 range can be associated with an organic dye of the anthraquinone group, together with signatures between 1323 cm−1 and 1620 cm−1. The IR spectrum does not show the presence of signals referable to binders such as wax or oil that would have shown very strong -CH signals in the 2850–2950 cm−1 spectral range while the ones of the pastel sample’s spectrum are very weak at 2923 and 2856 cm−1. Thus, FTIR attested the use of pastels with high quantities of kaolin and bole and without any wax or oil binders.
It can be affirmed that the pastels used by Matta are produced by mixing ground pigments, a white filler such as kaolin, and a very small amount of binder such as gum Arabic. The powdered ingredients are then combined and rolled into sticks [43,44,45].
These pastels seem quite similar to those used by the artist Francis Bacon and found in his studio [46].
Gum Arabic in a very low amount is difficult to be revealed in the FTIR spectrum, also due to the presence of other materials in much higher concentration, such as kaolin.

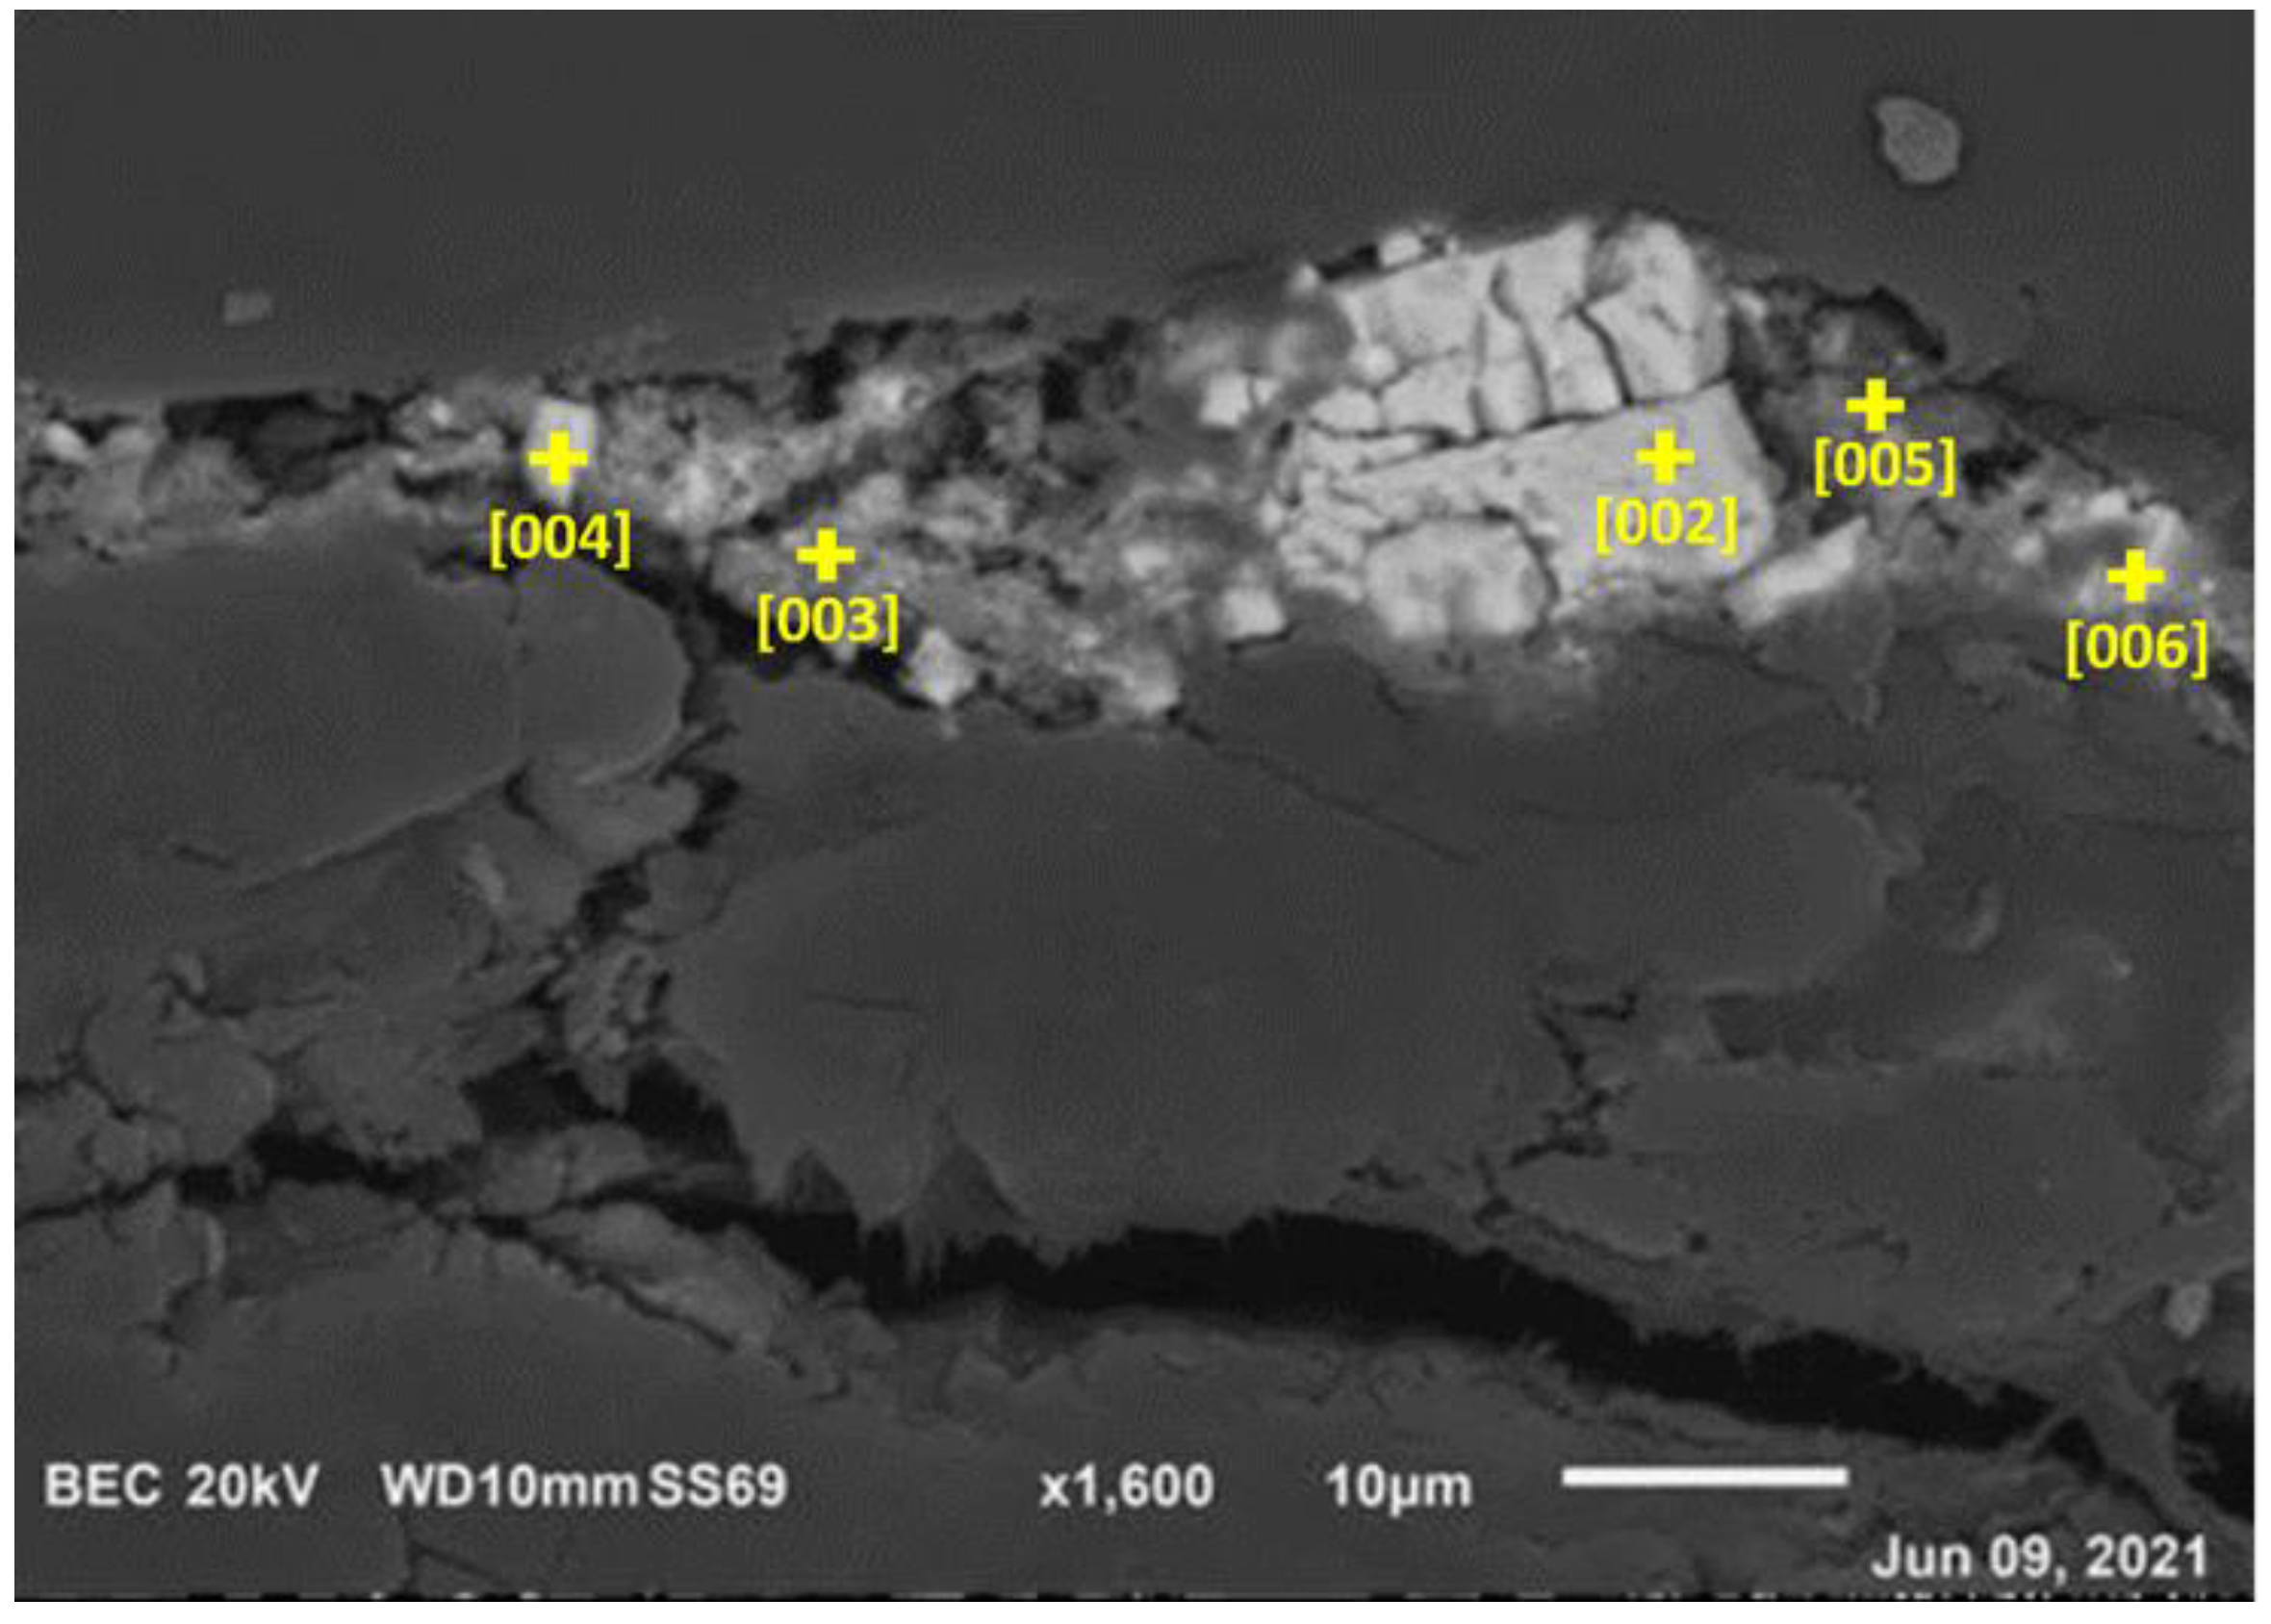
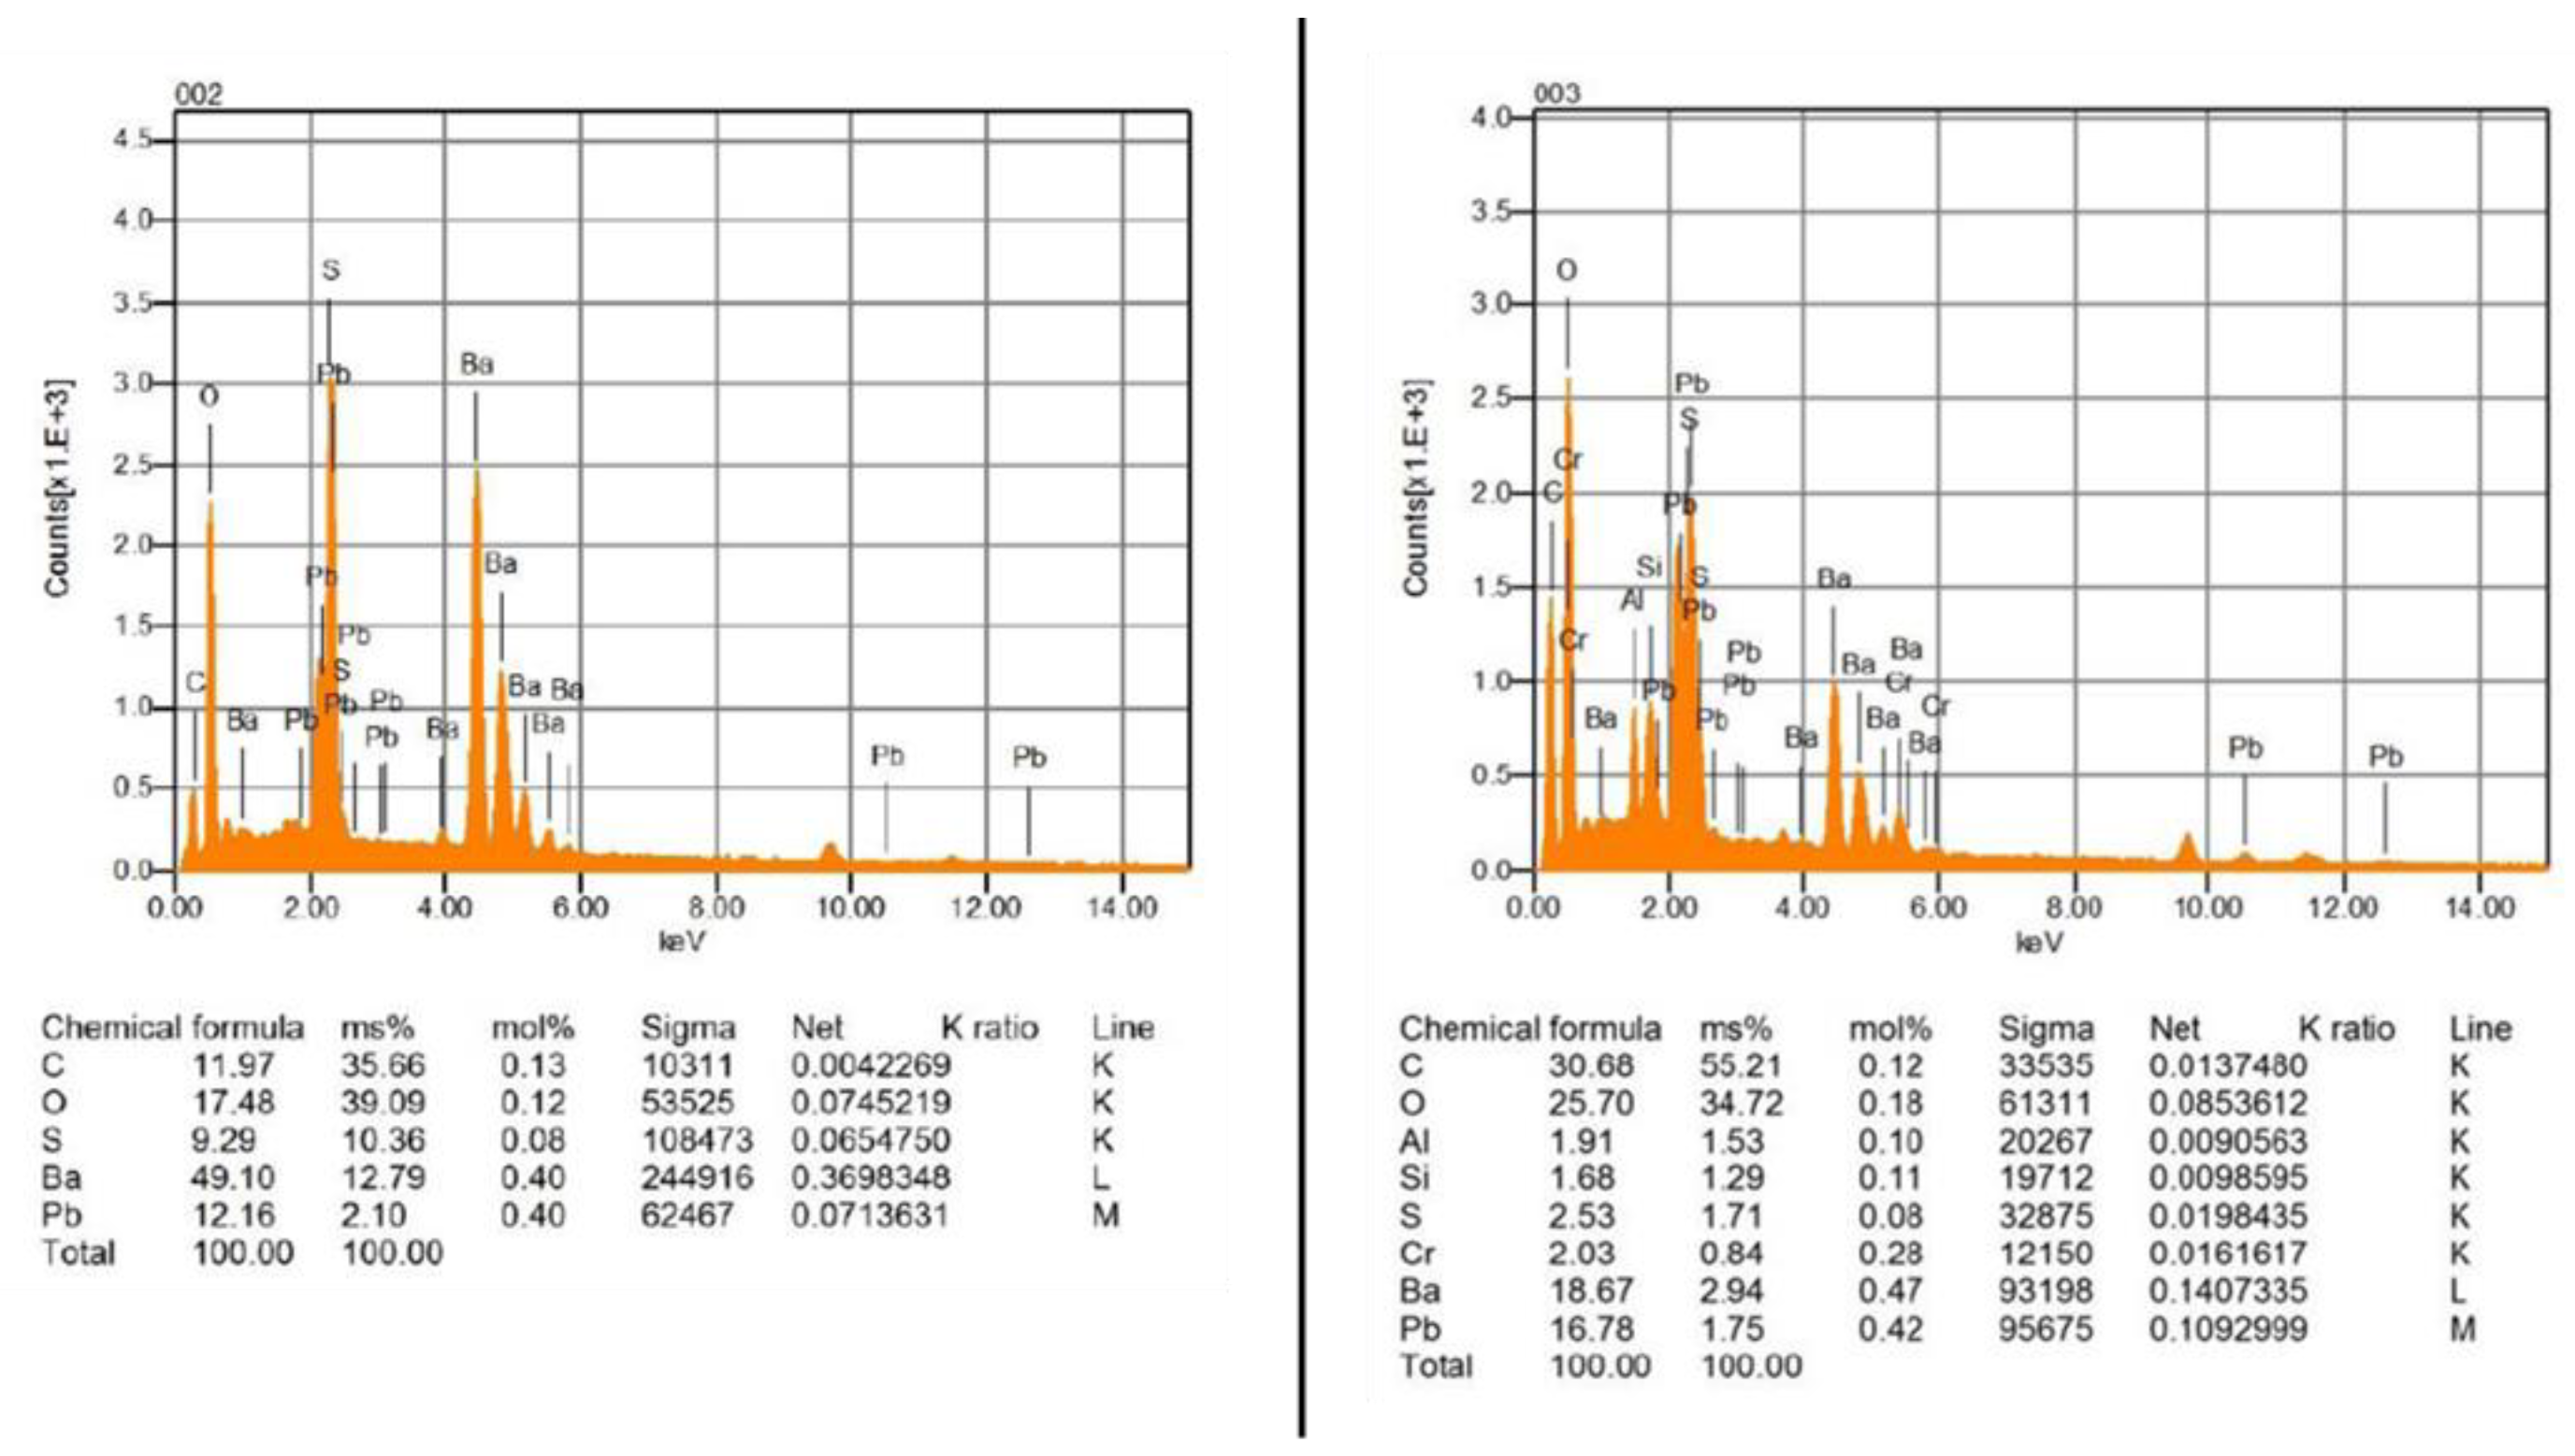
3.5. Optical Microscopy and Scanning Electron Microscopy–Energy-Dispersive Spectroscopy (SEM-EDS) on Cross-Section

The observation under the optical microscope shows the sample cross-section (Figure 11) shows a spolvero paper (translucent sketching paper) support having a thickness between 40–60 µm appearing with a slightly brown color in reflected light (Figure 11D). Under UV radiation (Figure 11E) the paper has a strong light-blue fluorescence that is partially due to the cellulose of the paper and partially to the adhesive used for attaching the paper to the canvas support [47].
The sample was morphologically observed in secondary electrons (SE) modality and through backscattered electrons (BSE) (Figure 12) to map the chemical elements present in the areas examined, which differ according to their atomic number. The observation in BSE at 750× and 1600× shows that the upper layer appears clearer than the rest of the sample, suggesting the presence of heavier elements (Figure 12A,B).
Some white and grey agglomerates are visible within the section close to longitudinal cracks of the paper and close to the pictorial layer (Figure 12C,D). Micro EDS analyses were performed on 5 points relating to BSE images of Figure 12B and reported in Figure 13 (the numbering of the measurement points starts from 002 because of the SEM-EDS software settings).
As it can be seen in the EDS spectra reported for points 002 and 003 in Figure 14 (the spectra of points 004, 005 and 006 in Figure 13 are collected in Supplementary Materials, Figures S1–S3), carbon (C) and oxygen (O) are present in all measurement points as elements of the materials that make up the sample. In the clearest areas of the surface, it is always detected the presence of lead (Pb) and barium (Ba), which is generally present as filler added to contemporary colors in the form of sulphate. This hypothesis can be confirmed by the presence of sulfur (S) which in fact is always detected together with barium. Lead is the element present in the orange pigment of the pictorial layer associated with chromium (Cr) (spectrum 003 in Figure 14). This result confirms that the orange color used by Matta is the chrome orange generally reported in the literature with the formula PbCrO4∙PbO or PbCrO4∙Pb(OH)2 [29,30,36]. Two other elements determined in the surface layer (points 003, 004 and 005) are silicon (Si) and aluminum (Al). These elements can be associated with the pastel that, as shown by FTIR analysis, is constituted by a pigment/dye component and a clayey material such as kaolin, the latter being indeed a silicate containing aluminum.
Concerning the areas shown in Figure 12C,D, the EDS analysis revealed that iron is present only in some points and in low concentrations, confirming that the paper was not painted with iron-based pigments (Figures S4–S8 in the Supplementary Materials), as hypothesized by the restorers at the beginning of the intervention.

4. Conclusions

Contemporary art is often a complex matter in terms of material characterization, conservation practices and the study of degradation factors. In the 19th and 20th century, new and more free expressive research led many artists to introduce new chemical compounds as painting matter and used different materials as supports. Most of these experimentations disrupt the Western school’s painting tradition and invented new techniques as the Surrealism movement [48,49] which did not chase material immortality but were a manifesto of new artistic feelings, conceptual art or voice of reproach and condemnation in this perspective artists used also fragile and perishable materials as Matta did with the spolvero paper.
The diagnostic analyses allowed us to characterize the original painting materials and techniques used by Roberto Sebastian Matta to realize “For the victims to win”.
In fact, the type of pastel chosen by the artist is a stick consisting of pressed pigment combined with a very fine powder of kaolin, characterized through FTIR spectroscopy. The absence of both wax and oil binders makes these colors very soft and particularly dusty, much so to remember chalks rather than classic pastel shades for their blendability and consistency. This aspect made it difficult for Matta to obtain the cohesion of the pigments to the paper support, making the use of some spray fixative mandatory. SEM-EDS, XRF and Raman spectroscopy investigations completed the shaping of the color palette used by Matta for this artwork, mainly composed of iron-oxide based red, phthalocyanine blue and green, lead chromate yellow and orange, lithopone and titanium white.
Particularly interesting results came from IR and UV false color images and from spectral similarity maps provided by multispectral imaging analysis with the HMI technique. The false color analysis gave the first suggestions on pigment attributions, identifying typical UVFC and IRFC responses for lead chromate yellow, phthalocyanine pigments and lithopone, the presence of which was confirmed by spectroscopy in the limited punctual analyses done.
Multispectral and chromatic similarity maps helped to differentiate and locate pastels which were similar in visible light, as the dark red area in the upper body of the central figure, but have different spectral signatures, suggesting the use of a red pigment next to its mixture with the black color used for drawing all the outlines. The multispectral imaging technique proved to be a relevant tool for the rapid and non-invasive diagnostic survey of large artworks where a representative sampling would imply a great number of punctual analyses which is high cost and time consuming.
The diagnostic frame delivered through the integration of imaging and spectroscopy methods was fundamental to approaching a complex restoration intervention on the artworks which is presented in detail in another study soon to be published.

Supplementary Materials

The following supporting information can be downloaded at: https://www.mdpi.com/article/10.3390/heritage6030134/s1, Figure S1: Point 004 of analysis (painting layer in Figure 13) with the chemical elements found. Magnification 1600×; Figure S2: Point 005 of analysis (painting layer in Figure 13) with the chemical elements found. Magnification 1600×; Figure S3. Point 006 of analysis (painting layer in Figure 13) with the chemical elements found. Magnification 1600×; Figure S4. Point 002 of analysis (internal area of the section in the proximity of a crack, in Figure 12C) with the chemical elements found. Magnification 1300×; Figure S5. Point 003 of analysis (internal area of the section in the proximity of a crack, in Figure 12C) with the chemical elements found. Magnification 1300×; Figure S6. Point 004 of analysis (internal area of the section in the proximity of a crack, in Figure 12C) with the chemical elements found. Magnification 1300×; Figure S7. Point 002 of analysis (internal area of the section, area shown in Figure 12D) with the chemical elements found. Magnification 1900×; Figure S8. Point 003 of analysis (internal area of the section, area shown in Figure 12D) with the chemical elements found. Magnification 1900×.

Author Contributions

Conceptualization, C.C., L.L. and C.P.; methodology, C.P. and L.L.; software, L.L.; validation, C.C., C.P., V.S. and I.P.; formal analysis, C.P., L.L. and I.P.; investigation, C.P., C.C., I.P. V.S. and L.L.; resources, C.P., G.C. and V.S.; data curation, C.P., C.C., V.S. and I.P.; writing—original draft preparation, C.C. and C.P.; writing—review and editing, all authors; visualization, L.L., V.S. and C.P.; supervision, G.C., C.P. and L.L.; project administration, C.P. and G.C.; funding acquisition, C.P. and G.C. All authors have read and agreed to the published version of the manuscript.

Funding

This research received no external funding.

Institutional Review Board Statement

Not applicable.

Informed Consent Statement

Not applicable.

Data Availability Statement

Not applicable.

Acknowledgments

The authors would like to thank Anna Rita Taddei of University of Tuscia for her support with SEM-EDS analyses and Giorgia Agresti for the cross-sections’ preparation and acquisition. The diagnostic campaign on Matta’s artwork was performed on the occasion of the restoration carried out in the laboratories of the five years course in Conservation and Restoration of Cultural Heritage, as thesis of Ilaria Partenzi. The work was followed by Maria Ida Catalano, Patrizia Mania, Nicoletta Fontani, Martina Marconi that constituted the thesis’s group. The authors also thank the municipality of Tarquinia, the family and the collaborators of the artist who allowed to investigate the artwork during the restoration.

Conflicts of Interest

The authors declare no conflict of interest.

References

  1. The Matta Archives. Available online: https://robertomatta.com (accessed on 29 January 2023).
  2. Breton, A. Manifesto of Surrealism. In Manifestoes of Surrealism; Seaver, R., Lane, H.R., Arbor, A., Eds.; The University of Michigan Press: Ann Arbor, MI, USA, 1972. [Google Scholar]
  3. Rubin, W. Matta. Mus. Mod. Art Bull. 1957, 25, 35. [Google Scholar] [CrossRef]
  4. Rubin, W. Matta aux Etats-Unis. Une note personnelle. In Matta, Exhibition Catalogue; Bozo, D., Ed.; Musèe National d’Art Moderne, Centre Georges Pompidou: Paris, UK, 1985. [Google Scholar]
  5. Briganti, G. Matta-Pastelli, Catalogue of the Exhibition at Galleria Dell’oca; Galleria dell’Oca: Roma, Italy, 1975. [Google Scholar]
  6. Brunori, M.; Portoni, F. Matta: Dialogo con Tarquinia; Arco Incontri: Rome, Italy, 1975. [Google Scholar]
  7. Tenorio, A.L.; La Nasa, J.; Ferriani, B.; Colombini, M.P.; Modugno, F. The chemistry of pastels: Investigation of the organic materials in a drawing by Umberto Boccioni. J. Cult. Herit. 2019, 35, 235–241. [Google Scholar] [CrossRef]
  8. La Nasa, J.; Doherty, B.; Rosi, F.; Braccini, C.; Broers, F.T.H.; Degano, I.; Matinero, J.M.; Miliani, C.; Modugno, F.; Sabatini, F.; et al. An integrated analytical study of crayons from the original art materials collection of the MUNCH museum in Oslo. Sci. Rep.-UK 2021, 11, 7152. [Google Scholar] [CrossRef] [PubMed]
  9. Burns, T. The Invention of Pastel Painting. In Archetype Books, 1st ed.; Archetype Publications: London, UK, 2008; 244p. [Google Scholar]
  10. Kosek, J.M. The heyday of pastels on the eighteenth century. Pap. Conserv. 1998, 22, 1–9. [Google Scholar] [CrossRef]
  11. Monico, L.; Cartechini, L.; Rosi, F.; Chieli, A.; Grazia, C.; De Meyer, S.; Nuyts, G.; Vanmeert, F.; Janssens, K.; Cotte, M.; et al. Probing the chemistry of CdS paints in The Scream by in situ non-invasive spectroscopies and synchrotron radiation X-ray techniques. Sci. Adv. 2020, 6, eaay3514. [Google Scholar] [CrossRef]
  12. Sauvage, L.; Wei, W.; Martinez, M. When Conservation Meets Engineering: Predicting the Damaging Effects of Vibrations on Pastel Paintings. Stud. Conserv. 2018, 63, 418–420. [Google Scholar] [CrossRef] [Green Version]
  13. Sauvage, L.; Gombaud, C. Liotard’s Pastels: Techniques of an 18th-Century Pastellist’. In Proceedings of the Technology and Practice—Studying 18th Century Paintings and Art on Paper, Copenhagen, Denmark, 2–3 June 2014; Archetype Publications: London, UK, 2015; pp. 31–45. [Google Scholar]
  14. Kosek, J. The porosity of pastels and the effect of water treatment on the suction table: A preliminary investigation. Conservator 1990, 14, 17–22. [Google Scholar] [CrossRef]
  15. Moroz, R. Aqueous treatment in pastel conservation. Restaurator 1997, 18, 39–49. [Google Scholar] [CrossRef]
  16. Daniels, V. Factors influencing the wash-fastness of watercolors. Pap. Conserv. 1995, 19, 31–40. [Google Scholar] [CrossRef]
  17. Gombaud, C.; van Leeuwen, I. Pastel Conservation and Framing at the Rijksmuseum. J. Pap. Conserv. 2017, 18, 42–50. [Google Scholar] [CrossRef]
  18. Lory, V.; Figueira, F.; Cruz, A.J. Comparative Study of Washing Treatments for Pastel Drawings. Restaurator. Int. J. Preserv. Libr. Arch. Mater. 2012, 33, 199–219. [Google Scholar] [CrossRef]
  19. Norville-Day, H.; Townsend, J.H.; Green, T. Degas pastels: Problems with transport and examination and analysis of materials. Conservator 1993, 17, 46–55. [Google Scholar] [CrossRef]
  20. Colantonio, C.; Lanteri, L.; Ciccola, A.; Serafini, I.; Postorino, P.; Censorii, E.; Rotari, D.; Pelosi, C. Imaging Diagnostics Coupled with Non-Invasive and Micro-Invasive Analyses for the Restoration of Ethnographic Artifacts from French Polynesia. Heritage 2022, 5, 215–232. [Google Scholar] [CrossRef]
  21. Colantonio, C.; Pelosi, C.; D’Alessandro, L.; Sottile, S.; Calabrò, G.; Melis, M. Hypercolorimetric Multispectral Imaging (HMI) system for cultural heritage diagnostics: An innovative study for copper painting examination. Eur. Phys. J. Plus 2018, 133, 526. [Google Scholar] [CrossRef]
  22. Laureti, S.; Colantonio, C.; Burrascano, P.; Melis, M.; Calabrò, G.; Malekmohammadi, H.; Sfarra, S.; Ricci, M.; Pelosi, C. Development of integrated innovative techniques for the examination of paintings: The case studies of The Resurrection of Christ attributed to Andrea Mantegna and the Crucifixion of Viterbo attributed to Michelangelo’s workshop. J. Cult. Herit. 2019, 40, 1–16. [Google Scholar] [CrossRef]
  23. Ricci, M.; Laureti, S.; Malekmohammadi, H.; Sfarra, S.; Lanteri, L.; Colantonio, C.; Calabrò, G.; Pelosi, C. Surface and Interface Investigation of a 15th Century Wall Painting Using Multispectral Imaging and Pulse-Compression Infrared Thermography. Coatings 2021, 11, 546. [Google Scholar] [CrossRef]
  24. Lanteri, L.; Pelosi, C. 2D and 3D ultraviolet fluorescence applications on cultural heritage paintings and objects through a low-cost approach for diagnostics and documentation. In Proceedings Volume 11784, Optics for Arts, Architecture, and Archaeology VIII, Online, Munich, Germany, 21–26 June 2021; Liang, H., Groves, R., Eds.; SPIE: Bellingham, WA, USA, 2021; Volume 11784, pp. 1–11. [Google Scholar]
  25. Cosentino, A. Infrared Technical Photography for Art Examination. E-Preserv. Sci. 2016, 13, 1–6. [Google Scholar]
  26. Cosentino, A. Identification of pigments by multispectral imaging; a flowchart method. Herit. Sci. 2014, 2, 8. [Google Scholar] [CrossRef] [Green Version]
  27. Boust, C.; Wohlgelmuth, A. DATABASE: Pigment image database under UV and IR radiations. Sci. Imaging Cult. Herit. 2017, 13. Available online: https://copa.hypotheses.org/552 (accessed on 26 January 2023).
  28. Hyperspectral Imaging. Available online: https://webimgc.inrim.it/Hyperspectral_imaging/Panel3.aspx (accessed on 26 January 2023).
  29. Gliozzo, E.; Ionescu, C. Pigments—Lead-based whites, reds, yellows and oranges and their alteration phases. Archaeol. Anthrop. Sci. 2022, 14, 17. [Google Scholar] [CrossRef]
  30. Molari, R.; Appoloni, C.R. Pigment analysis in four paintings by Vincent van Gogh by portable X-ray fluorescence (pXRF). Radiat. Phys. Chem. 2021, 181, 109336. [Google Scholar] [CrossRef]
  31. Bown, R. Particle size, shape and structure of paper fillers and their effect on paper properties. Pap. Technol. 1998, 39, 44–48. [Google Scholar]
  32. Schabel, S.; Putz, H.-J.; Hamm, U.; Kersten, A.; Bobek, B.; Hirsch, G.; Voss, D. Calcium carbonate in the paper industry—Blessing for coated papermaking and curse for recycling processes. Tappi J. 2014, 13, 47–54. [Google Scholar] [CrossRef]
  33. Stieg, F.B. Opaque white pigments in coatings. Appl. Polym. Sc. 1985, 285, 1249–1269. [Google Scholar]
  34. van Driel, B.A.; van den Berg, K.J.; Gerretzen, J.; Dik, J. The white of the 20th century: An explorative survey into Dutch modern art collections. Herit. Sci. 2018, 6, 16. [Google Scholar] [CrossRef] [Green Version]
  35. Feller, R.L. Barium sulphate—Natural and Synthetic. In Artists’ Pigments. A Handbook of Their History and Characteristics, 1st ed.; Feller, R.L., Ed.; National Gallery of Art: Washington, DC, USA, 1986; Volume 1, pp. 47–64. [Google Scholar]
  36. Kühn, H.; Curran, M. Chrome Yellow and Other Chromate Pigments. In Artists’ Pigments. A Handbook of Their History and Characteristics, 1st ed.; Feller, R.L., Ed.; National Gallery of Art: Washington, DC, USA, 1986; Volume 1, pp. 187–217. [Google Scholar]
  37. Otero, V.; Carlyle, L.; Vilariguesa, M.; Melo, M.J. Chrome yellow in nineteenth century art: Historic reconstructions of an artists’ pigment. RCS Adv. 2012, 2, 1798–1805. [Google Scholar] [CrossRef]
  38. Daly, N.S.; Sullivan, M.; Lee, L. Odilon Redon’s noir drawings: Characterization of materials and methods using noninvasive imaging and spectroscopies. Herit. Sci. 2019, 7, 43. [Google Scholar] [CrossRef]
  39. Brosseau, C.L.; Rayner, K.S.; Casadio, F.; Grzywacz, C.M.; Van Duyne, R.P. Surface-Enhanced Raman Spectroscopy: A Direct Method to Identify Colorants in Various Artist Media. Anal. Chem. 2009, 81, 7443–7447. [Google Scholar] [CrossRef]
  40. IRUG. Infrared and Raman User Group. Available online: http://www.irug.org/search-spectral-database (accessed on 24 January 2023).
  41. Daly, N.S.; Sullivan, M.; Lee, L.; Trentelman, K. Multivariate analysis of Raman spectra of carbonaceous black drawing media for the in-situ identification of historic artist materials. J. Raman Spectrosc. 2018, 49, 1497–1506. [Google Scholar] [CrossRef]
  42. CHSOS. Available online: https://chsopensource.org/manganese-violet-k-45350/ (accessed on 23 January 2023).
  43. Singer, B.; Aslaksby, T.E.; Topalova-Casadiego, B.; Storevik Tveit, E. Investigation of Materials Used by Edvard Munch. Stud. Conserv. 2010, 55, 274–292. [Google Scholar] [CrossRef]
  44. Moore, S. Using Analytical Chemistry to Investigate the Composition of Crayons. Available online: https:://www.azolifesciences.com/article/Using-Analytical-Chemistry-to-Investigate-the-Composition-of-Crayons.aspx (accessed on 17 February 2023).
  45. Janssens, K.; Van der Snickt, G.; Vanmeert, F.; Legrand, S.; Nuyts, G.; Alfeld, M.; Monico, L.; Anaf, W.; De Nolf, W.; Vermeulen, M.; et al. Non-Invasive and Non-Destructive Examination of Artistic Pigments, Paints, and Paintings by Means of X-Ray Methods. Top. Curr. Chem. 2016, 374, 81. [Google Scholar] [CrossRef] [PubMed] [Green Version]
  46. Russell, J.E.; Singer, B.W.; Justin, J.; Perry, J.J.; Bacon, A. Investigation of the materials found in the studio of Francis Bacon (1909–1992). Stud. Conserv. 2012, 57, 195–206. [Google Scholar] [CrossRef]
  47. Measday, D.; Walker, C.; Pemberton, B. A summary of ultraviolet fluorescent materials relevant to Conservation. AICCM Natl. Newsl. 2017, 137. Available online: https://aiccm.org.au/network-news/summary-ultra-violet-fluorescent-materials-relevant-conservation (accessed on 30 January 2023).
  48. Zuena, M.; Buemi, L.P.; Nodari, L.; Subelytė, G.; Stringari, L.; Campanella, B.; Lorenzetti, G.; Palleschi, V.; Tomasin, P.; Legnaioli, S. Portrait of an artist at work: Exploring Max Ernst’s surrealist techniques. Herit Sci. 2022, 10, 139. [Google Scholar] [CrossRef]
  49. Rosi, F.; Grazia, C.; Fontana, R.; Gabrieli, F.; Pensabene Buemi, L.; Pampaloni, E.; Romani, A.; Stringari, C.; Miliani, C. Disclosing Jackson Pollock’s palette in Alchemy (1947) by non-invasive spectroscopies. Herit Sci. 2016, 4, 1–13. [Google Scholar] [CrossRef] [Green Version]
Figure 1. Central panel of For the victims to win, pastels on paper (180.3 × 405.1 cm). Calibrated and stitched RGB images with the color checker and the white targets.
Heritage 06 00134 g001
Figure 2. Location of XRF spectroscopy points of analysis on the artwork For the victims to win.
Heritage 06 00134 g002
Figure 3. Location of Raman analysis points on the artwork For the victims to win.
Heritage 06 00134 g003
Figure 4. Comparison between the RGB (A), the IRFC (B) and the UVFC (C) images of the painting For the victims to win.
Heritage 06 00134 g004
Figure 5. Result (B) of the application of chromatic similarity tool in the red color (white dot in the RGB image shown in (A)).
Heritage 06 00134 g005
Figure 6. Result (B) of the application of chromatic similarity tool in the violet color (white dot in the RGB image shown in (A)).
Heritage 06 00134 g006
Figure 7. RGB image (A) and result (B) of the application of NDI algorithm to calculate the difference between the UV and RGB channels and the three IR (IR1, IR2 and IR3) ones.
Heritage 06 00134 g007
Figure 8. UVF image of the painting, after stitching the two different shots.
Heritage 06 00134 g008
Figure 9. Raman averaged spectra of six different pastel-colored areas on the painting. (A) Raman spectrum of point P1 (black color); (B) Raman spectrum of point P2 (dark-blue color); (C) Raman spectrum of point P3 (rose/violet color); (D) Raman spectra of points P4 and P5 (light green and light blue colors respectively); (E) Raman spectrum of point P5 (light blue color); (F) Raman spectrum of point P6 (dark-green color).
Heritage 06 00134 g009
Figure 10. FTIR spectrum of a red pastel from the collection of Matta’s workshop.
Heritage 06 00134 g010
Figure 11. Micro-sample of Matta’s painting in correspondence of a small tear in the pictorial layer (A); front (B) and back (C) sides of the sample; optical microscope photography of the sample in cross-section at 100× magnification in reflected light (D) and under UV radiation (E).
Heritage 06 00134 g011
Figure 12. SEM images in backscattered electrons: (A) view of the examined area at 750× magnification; (B) detail of heavier elements (whiter area) at the surface of the section at 1600×; (C) internal area of the section in the proximity of a crack, 1300×; (D) lighter agglomerates, 1900×.
Heritage 06 00134 g012
Figure 13. SEM image in backscattered electrons previously shown in Figure 12B mapping the EDS measurement points on the sample.
Heritage 06 00134 g013
Figure 14. EDS spectra of point 002 (left) and 003 (right) with relative abundance of detected elements.
Heritage 06 00134 g014
Table 1. XRF elements detected in the painting. They are reported in descending order of cps (counts per second).
PointColorDetected Elements Hypothesized Pigments and Compounds
X1 Orange (clear)Pb, Ba, Cr, Zn, Ca, Fe, S, Sr, TiLead chromate orange, lithopone, elements of the paper, impurities
X2 PaperFe, Ca, Ti, BaElements of the paper, impurities
X3 GreenBa, Fe, Br, Ca, Sr, CuBarium white, probable Cu-phthalocyanine, elements of the paper
X4BlackCr, Ba, Fe, Ca, Mn, Zn, Cu, Ti, SLithopone, elements of the paper, impurities
X5WhiteZn, Ti, Fe, BaZinc white, titanium white, impurities
X6 Orange (dark)Ba, Fe, Pb, Zn, Cr, Ca, Sr, SLead chromate, lithopone, elements of the paper
X7WhiteZn, Ti, Fe, Ca, SZinc white, titanium white, elements of the paper
X8 Red (dark)Fe, Ba, Ca, Pb, Cr, Zn, Sr, SFe-based pigment, lithopone, lead chromate, elements of the paper
X9Blue (dark)Fe, Ba, Cu, Ca, K, Sr, SBarium white, possible Cu-phthalocyanine, elements of the paper
X10Yellow Pb, Ba, Cr, Zn, Fe, Ca, Sr, SLead chromate yellow, lithopone, elements of the paper
X11Orange (bright)Pb, Cr, Ca, Ba, Fe, SLead chromate orange, barium white, elements of the paper
X12 GreyBa, Zn, Fe, Ca, K, SrLithopone, elements in the paper
X13PaperFe, Ca, SElements of the paper
X14 Paper (white zone)Fe, Ca, CrElements of the paper with traces of Cr from the painting
X15 Green (emerald)Ba, Br, Fe, Sr, Cu, Ca, Zn, K, SLithopone, Cu-phthalocyanine, elements of the paper
X16 Red/magentaBa, Fe, Sr, Ca, SBarium white, elements of the paper
X17 PinkBa, Fe, Sr, Ca, S, BrBarium white, elements of the paper
X18 Blue (clear)Ba, Zn, Fe, Sr, Mn, Cu, Ca, SLithopone, possible Cu-phthalocyanine
Disclaimer/Publisher’s Note: The statements, opinions and data contained in all publications are solely those of the individual author(s) and contributor(s) and not of MDPI and/or the editor(s). MDPI and/or the editor(s) disclaim responsibility for any injury to people or property resulting from any ideas, methods, instructions or products referred to in the content.

