1. Introduction
Numerous studies have been conducted on the application of terrestrial laser scanning (TLS) in heritage architectural projects [
1,
2,
3,
4,
5,
6]. Nowadays, 3-D technology is widely used in various applications, such as road maintenance, urban planning, surveying for industrial use, and heritage preservation [
7]. In these systems, a point cloud is commonly generated, representing a large dataset exhibiting the object’s scanned points, including coordinates, intensity, and color [
8]. There are several processing procedures that can be employed when working with point clouds, such as classifying indoor or outdoor objects by categories, creating 2-D or 3-D cross-sections, creating measurements, and extracting specific objects [
9]. Laser scanning creates high-resolution data and digital model files that can capture objects quickly with more accurate details than other methods [
10]. It is very easy to visualize and process a point cloud using TLS, allowing for cross-sectioning, part isolation, measurement, and visualization of all sides, which is extremely useful for documentation. Using this method, very large objects such as churches and monuments, and very small objects such as a piece of jewelry might be easily documented [
9].
Laser scanning can be helpful for obtaining accurate measurements and modeling objects with intricate details. It also generates this information quickly, without losing resolution, and can be used to document historical objects where high accuracy in x, y, and z coordinates is required. The surveyed point cloud can be modeled using appropriate software to generate a highly realistic model of the objects. Laser scanning can quickly produce a large number of accurate points that, in some cases, make it more suitable for 3-D surveying than photogrammetry and other traditional methods [
11]. The accuracy, speed, cost, scale, and intended use of the 3-D data should be considered when deciding between laser scanning and photogrammetry. The pros and cons of the two approaches are listed in
Table 1.
While photogrammetry is considered a better technique when documenting a small area for which lower accuracy is a tradeoff for higher photorealism. However, the accuracy of laser scanning across a wide area makes it more appropriate for usage in the architecture, engineering, and construction sectors. Recently, TLS has been widely used in the documentation and preservation of historic buildings; accurate 3-D modeling can enable decision-makers to make critical decisions regarding restoration, or how to best combat the effects of climate change on inscriptions, etc. Additionally, 3-D digital heritage models can accurately and efficiently document structures remotely (which was not possible using classical surveying methods) because of their excellent digital information system capabilities for displaying, analyzing, and archiving information [
16,
17,
18,
19,
20,
21,
22,
23,
24]. Several countries depend heavily on the tourism industry for their economic growth. Therefore, the preservation and documentation of archaeological sites through modern technologies is becoming essential. Moreover, history and culture must merge with the digital world to be preserved, animated, augmented, etc.
The Temple of Abu Simbel comprises the Great Temple of Ramses II and the smaller temple of Nefertari; together, they became a UNESCO World Heritage Site in 1979. Every day, more discoveries are being made in Egypt that add to the country’s inventory of cultural assets. Abu Simbel Temple is considered one of Egypt’s most iconic archaeological sites. This study aims to create a digital 3-D model of the temple using non-invasive and non-destructive technology. This can help in the restoration of both the structural features and inscriptions on the walls of the temple if it is subjected to natural threats and general deterioration through time. It also focuses on monitoring the deflection and deformation of the temple, documenting its interior and exterior parts that are of cultural significance. Therefore, this record should be considered an essential addition to both the country’s digital heritage documentation and the documentation of a UNESCO archaeological site that represents a crucial period in the history of an ancient civilization.
2. The Study Area
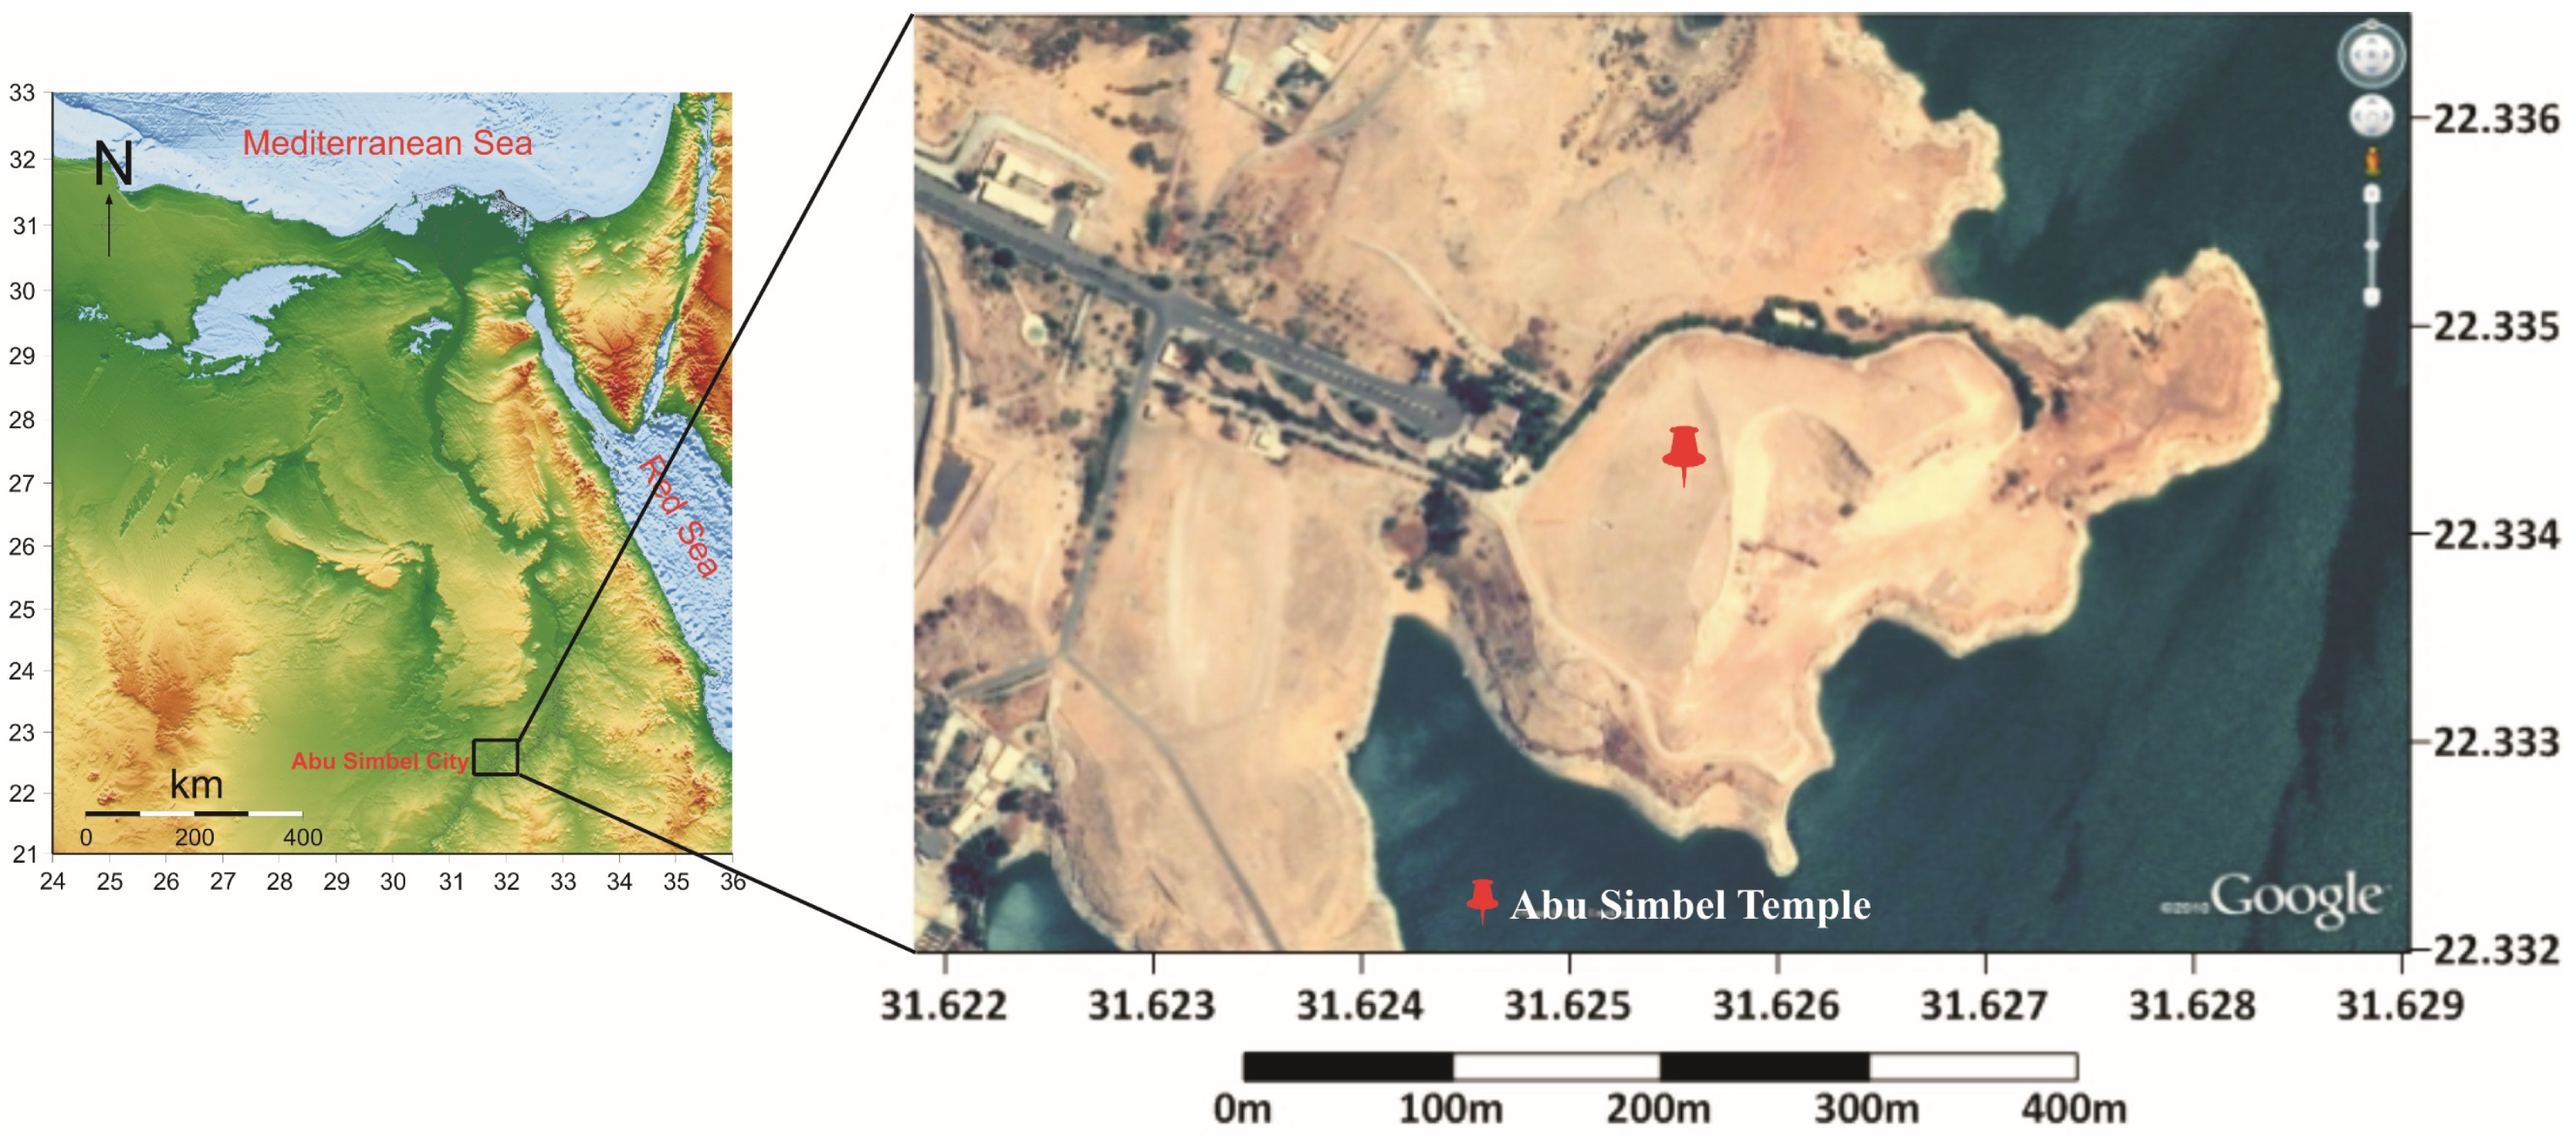
The study area is located near the Sudanese border in the southern part of Egypt. Abu Simbel Temple lies on the west bank of the Nile River, approximately 280 Km southwest of Aswan city (
Figure 1). The temple’s construction was completed in 1206 BC. The Great Temple housed the deities Amun-Ra, Ptah, and Ra-Harakhty, as well as the pharaoh himself, while the smaller temple housed Hathor and Nefertari-meritmut [
25,
26,
27,
28]. During the reign of Ramesses II (19th dynasty), both massive rock structures were constructed to commemorate Ramesses II’s victory over Muwatalli II and the Hittites [
29]. The temples were mostly forgotten until the late 19th century when they were buried in the Western Desert. However, Abu Simbel Temple was rediscovered in 1812 CE by the explorer Burckhardt [
30].
Egyptian authorities began construction of the High Dam in the 1960s after realizing it was necessary to control the annual flooding of the Nile [
31,
32,
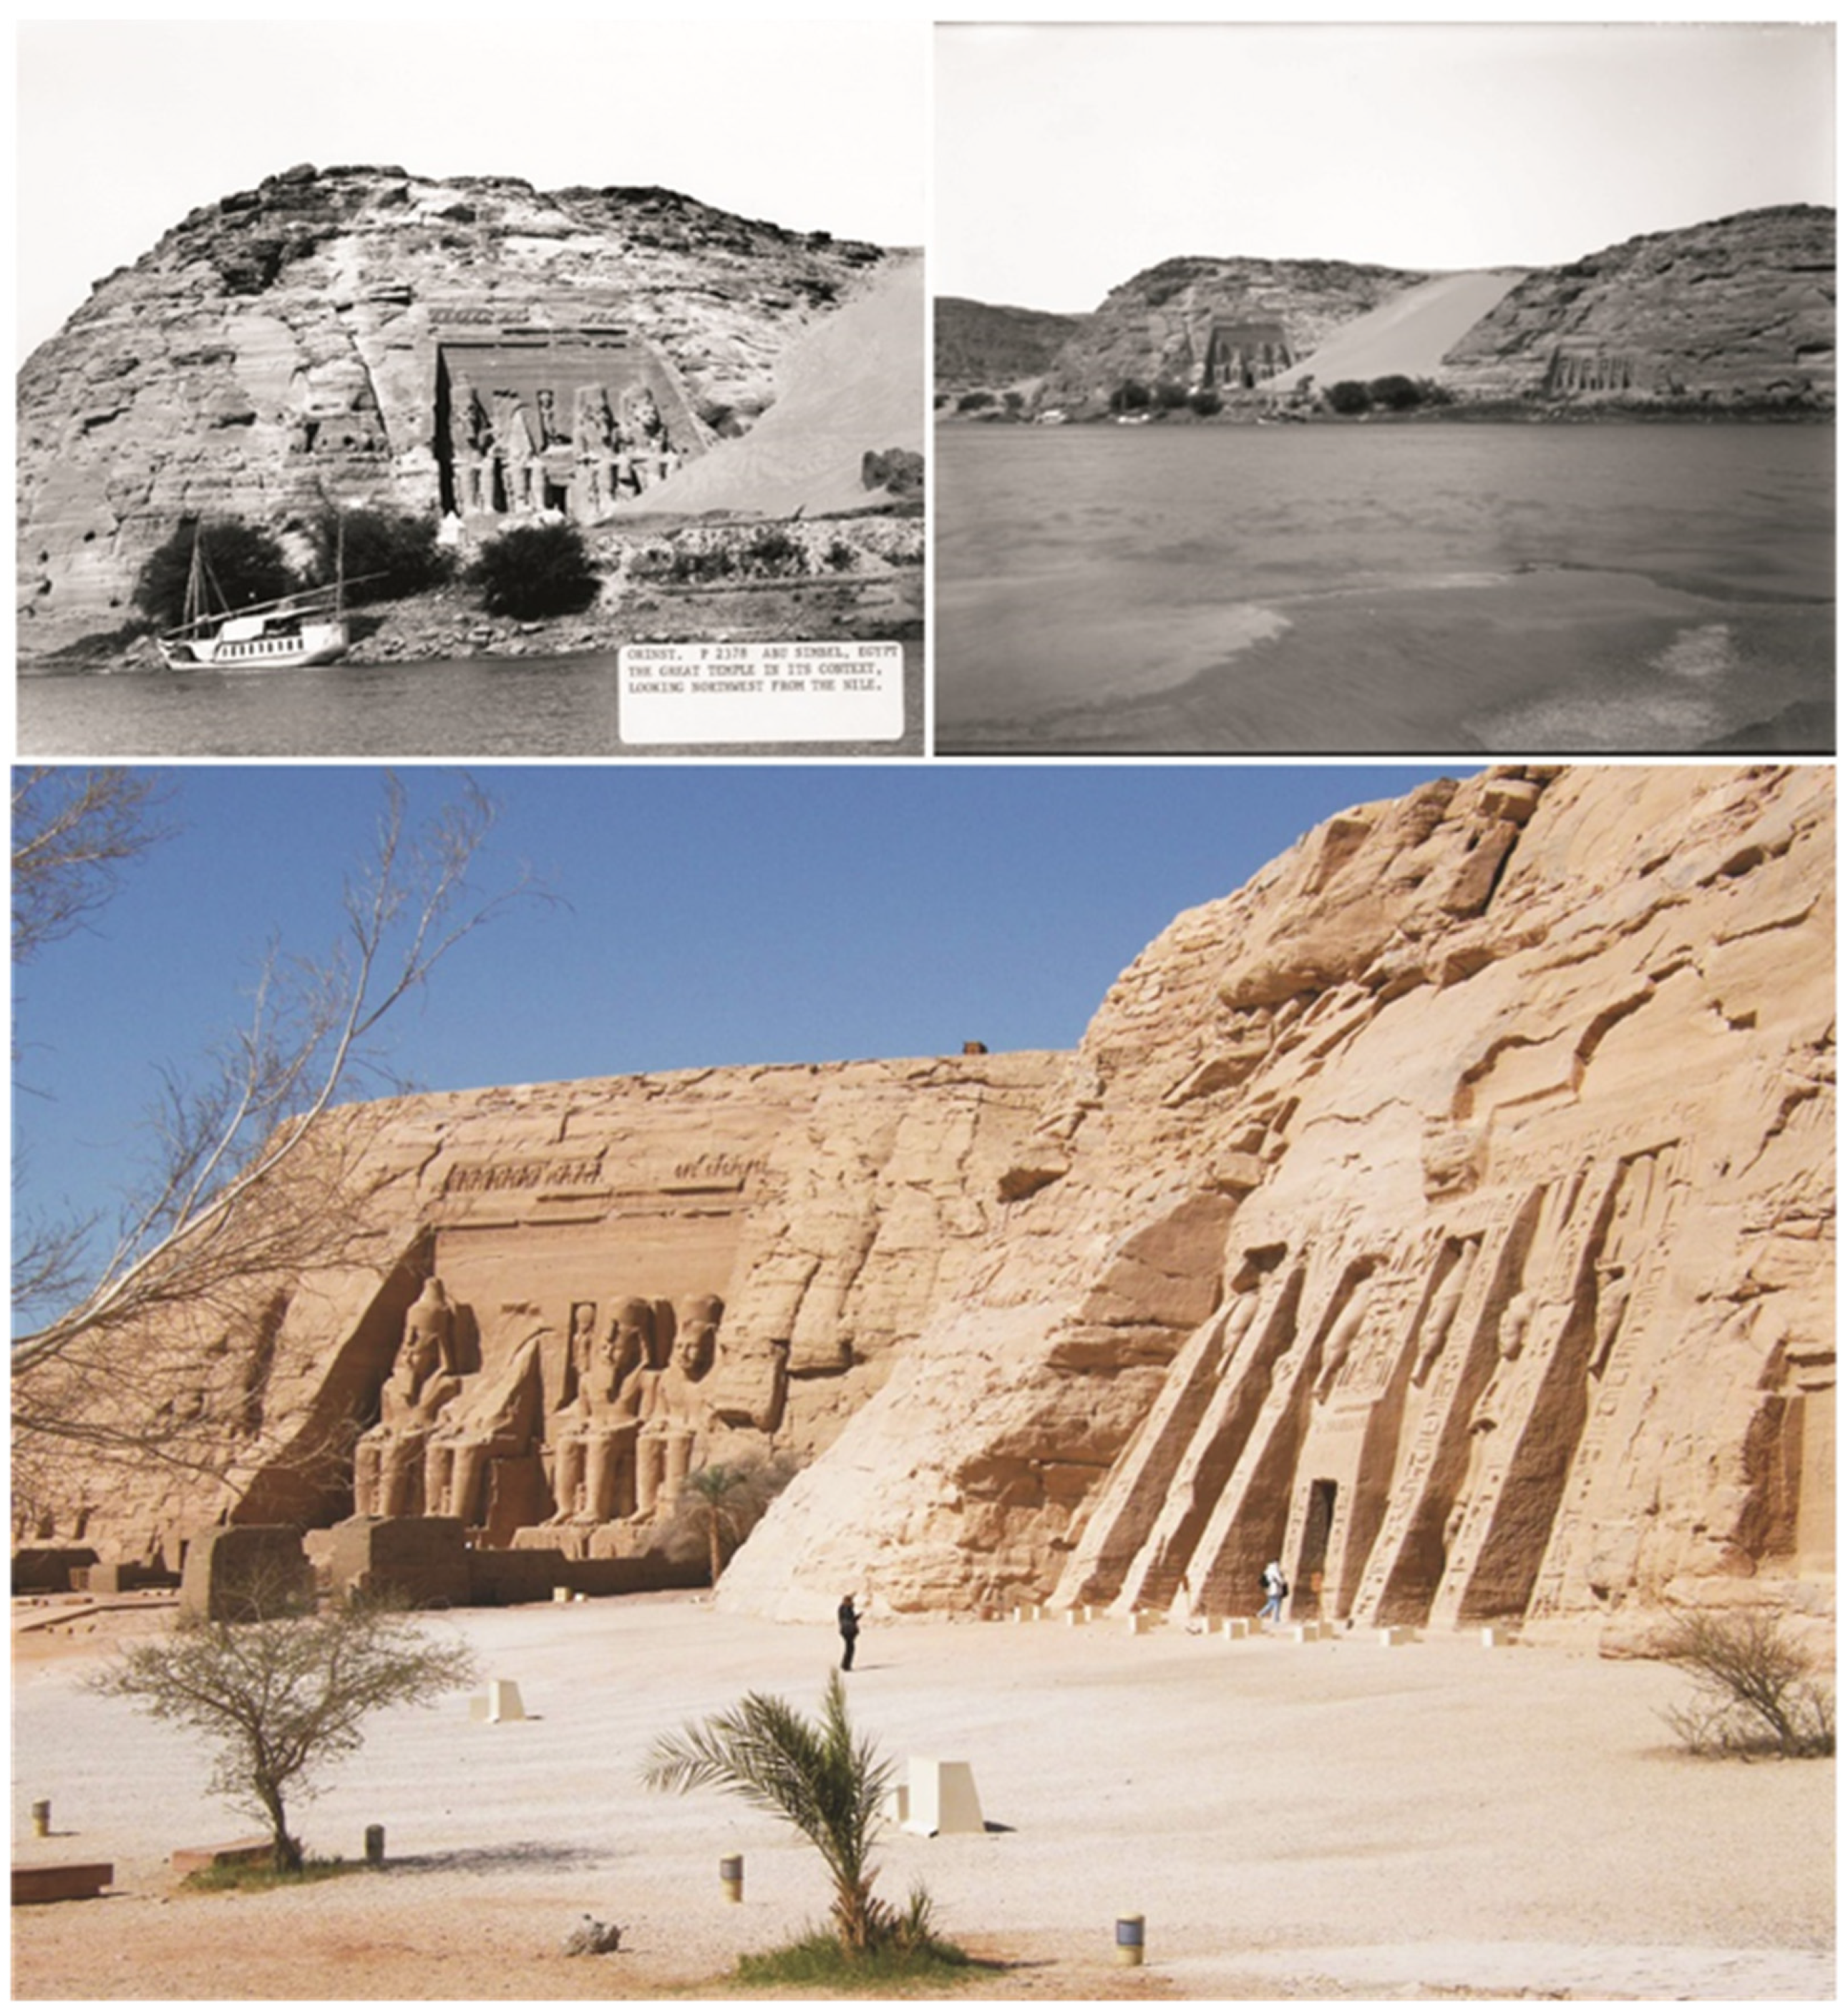
33]. After the High Dam was built, Nasser Lake formed behind it, which led to the submersion of the original location of Abu Simbel Temples (
Figure 2). As part of an international salvage campaign, the temple was relocated during the period between 1964 and 1968 to its current position [
34].
The temple was cut into many blocks, moved, and then reconstructed c. 210 m away from the older coastline in a location that is 65 m above sea level. The blocks of the temple were rebuilt on an artificial rock cliff by an international group of engineers, who restored the biannual solar phenomenon that characterized the great temple [
35]. As a result of the temple reconstruction, the phenomenon has shifted by one day, as it previously appeared on the 21st of February and the 21st of October.
Natural processes and human activities represent a threat to Abu Simbel Temple in its current location. Abu Simbel City is located near two wadi outlets, and when compared with the surrounding areas, this proximity makes the peninsula more vulnerable to flooding. Additionally, the Abu Simbel Temples lie directly below a deep fault or fracturing zone that has been identified as seismically active [
36]. One of the four Ramesses II statues flanking the Great Temple ultimately collapsed due to an earthquake [
37]. As a result of the High Dam’s construction, a significant amount of damage was done. Around 1753 flooded heritage sites were identified, including 781 ancient cemeteries, 392 settlements, 289 rock art sites, and 103 temples and churches, indicating that a significantly higher number of archaeological sites were submerged beneath Lake Nasser [
38]. Additionally, the Great Ethiopian Dam was constructed on the Blue Nile and is considered one of the largest hydroelectric dams in Africa. Given Ethiopia’s extremely high elevation of approximately 500 m above sea level, minor fractures or breakage in this 155-m-elevated dam would cause irreversible damage to archaeological and historical sites along the Nile River in Egypt and Sudan, which have lower elevations relative to Ethiopia. Additionally, the Great Ethiopian Dam has generated debate for various reasons, including how much it has contributed to the loss of Africa’s irreplaceable cultural legacy and the impact it will have on significant sites like those that have been threatened by the High Dam [
39,
40,
41]. Ahmed and Elsanabary (2015) [
42] reported that Egypt and Sudan might suffer from devastating floods, particularly near the Senner Dam near the Sudanese capital and Nasser Lake in Egypt. Moreover, recent microtremor measurements for the Abu Simbel region in Aswan, Egypt, revealed that the fundamental frequencies inside the temple are close to those outside it. Consequently, the occurrence of the resonance phenomenon is probable, which poses a threat to the temple’s structure [
43].
3. Methodology
The Building Information Modeling (BIM) process involves three steps [
44]: modeling the geometry for the object, mapping the object category and component properties, and establishing relationships among them. In the current study, which represents a starting point for research by archaeologists, Egyptologists, art historians, etc., the data were collected and organized in four main stages, as shown in
Figure 3. The first stage began with planning the temple building’s survey and visualizing the locations of the scan stations before starting the on-site stage. The second stage includes data acquisition using the Global Navigation Satellite System (GNSS) and Trimble TX6 outside and inside the temple using flat targets from various heights. The third stage involves data preprocessing and registration for the point cloud. The final stage was to produce a 3-D model to document and preserve the study site. The first and second stages, the third stage, and the fourth stage are explained in
Section 3 and
Section 4,
Section 4, and
Section 5, respectively.
3.1. Terrestrial Laser Scanner “Trimble TX6”
The technology of laser scanners enables the measurement of a wide variety of points on the building or object without causing damage; the scanner emits a laser beam that is reflected by the object being measured. In order to measure a characteristic point on the surface of an object, three steps are necessary: slope distance, horizontal angle α, and vertical angle β. A “point cloud” represents the data produced by these measurements, which is considered a set of points representing the monitored object [
45].
The planning for the Abu Simbel Temple building survey, along with visualizing the locations of the scan stations took 10 days. During the survey, a Trimble TX6 laser scanner was used. This is a full-featured laser scanner, providing a sophisticated solution for acquiring accurate data. It combines Trimble RealWorks software to provide a comprehensive geospatial scanning solution. It has a field view of 360° ∗ 317° and can cover full-density scans, as shown in
Figure 4. The Trimble TX6 is the most effective scanner in its class due to its high scan rate and precision. It is constructed for harsh situations and provides high-quality data even in sunshine. In addition, because it is a class 1 laser, it is considered a safe and non-destructive method to use when documenting heritage. The systematic error range of the Trimble TX6 is less than 2 mm. Furthermore, its high precision and range are delivered at incredibly fast scan speeds [
46,
47,
48]. The Trimble TX6’s scanning characteristics are described in
Table 2.
3.2. Global Navigation Satellite Systems (GNSS)
GNSS surveys require different approaches for planning, executing, and processing. In order to plan GNSS surveying properly, it is necessary to think about several factors, including the configuration of the site or satellites, the status of the satellite, and the number and type of receivers used [
49,
50]. Five ground control points in the UTM coordinate system were established around Abu Simbel temple, as shown in
Figure 5. A Trimble R-8 GNSS receiver determined the coordinates to provide a geo-referenced model for the temple, as shown in
Table 3. The measurement baselines were analyzed using the Trimble Business Centre (TBC) software and other software for calculating adjustment and deformation parameters. Using the International GNSS Service (IGS) stations, the reference stations were used to calculate the coordinates precisely within the International Terrestrial Reference Frame (ITRF).
3.3. Total Station “Trimble S5”
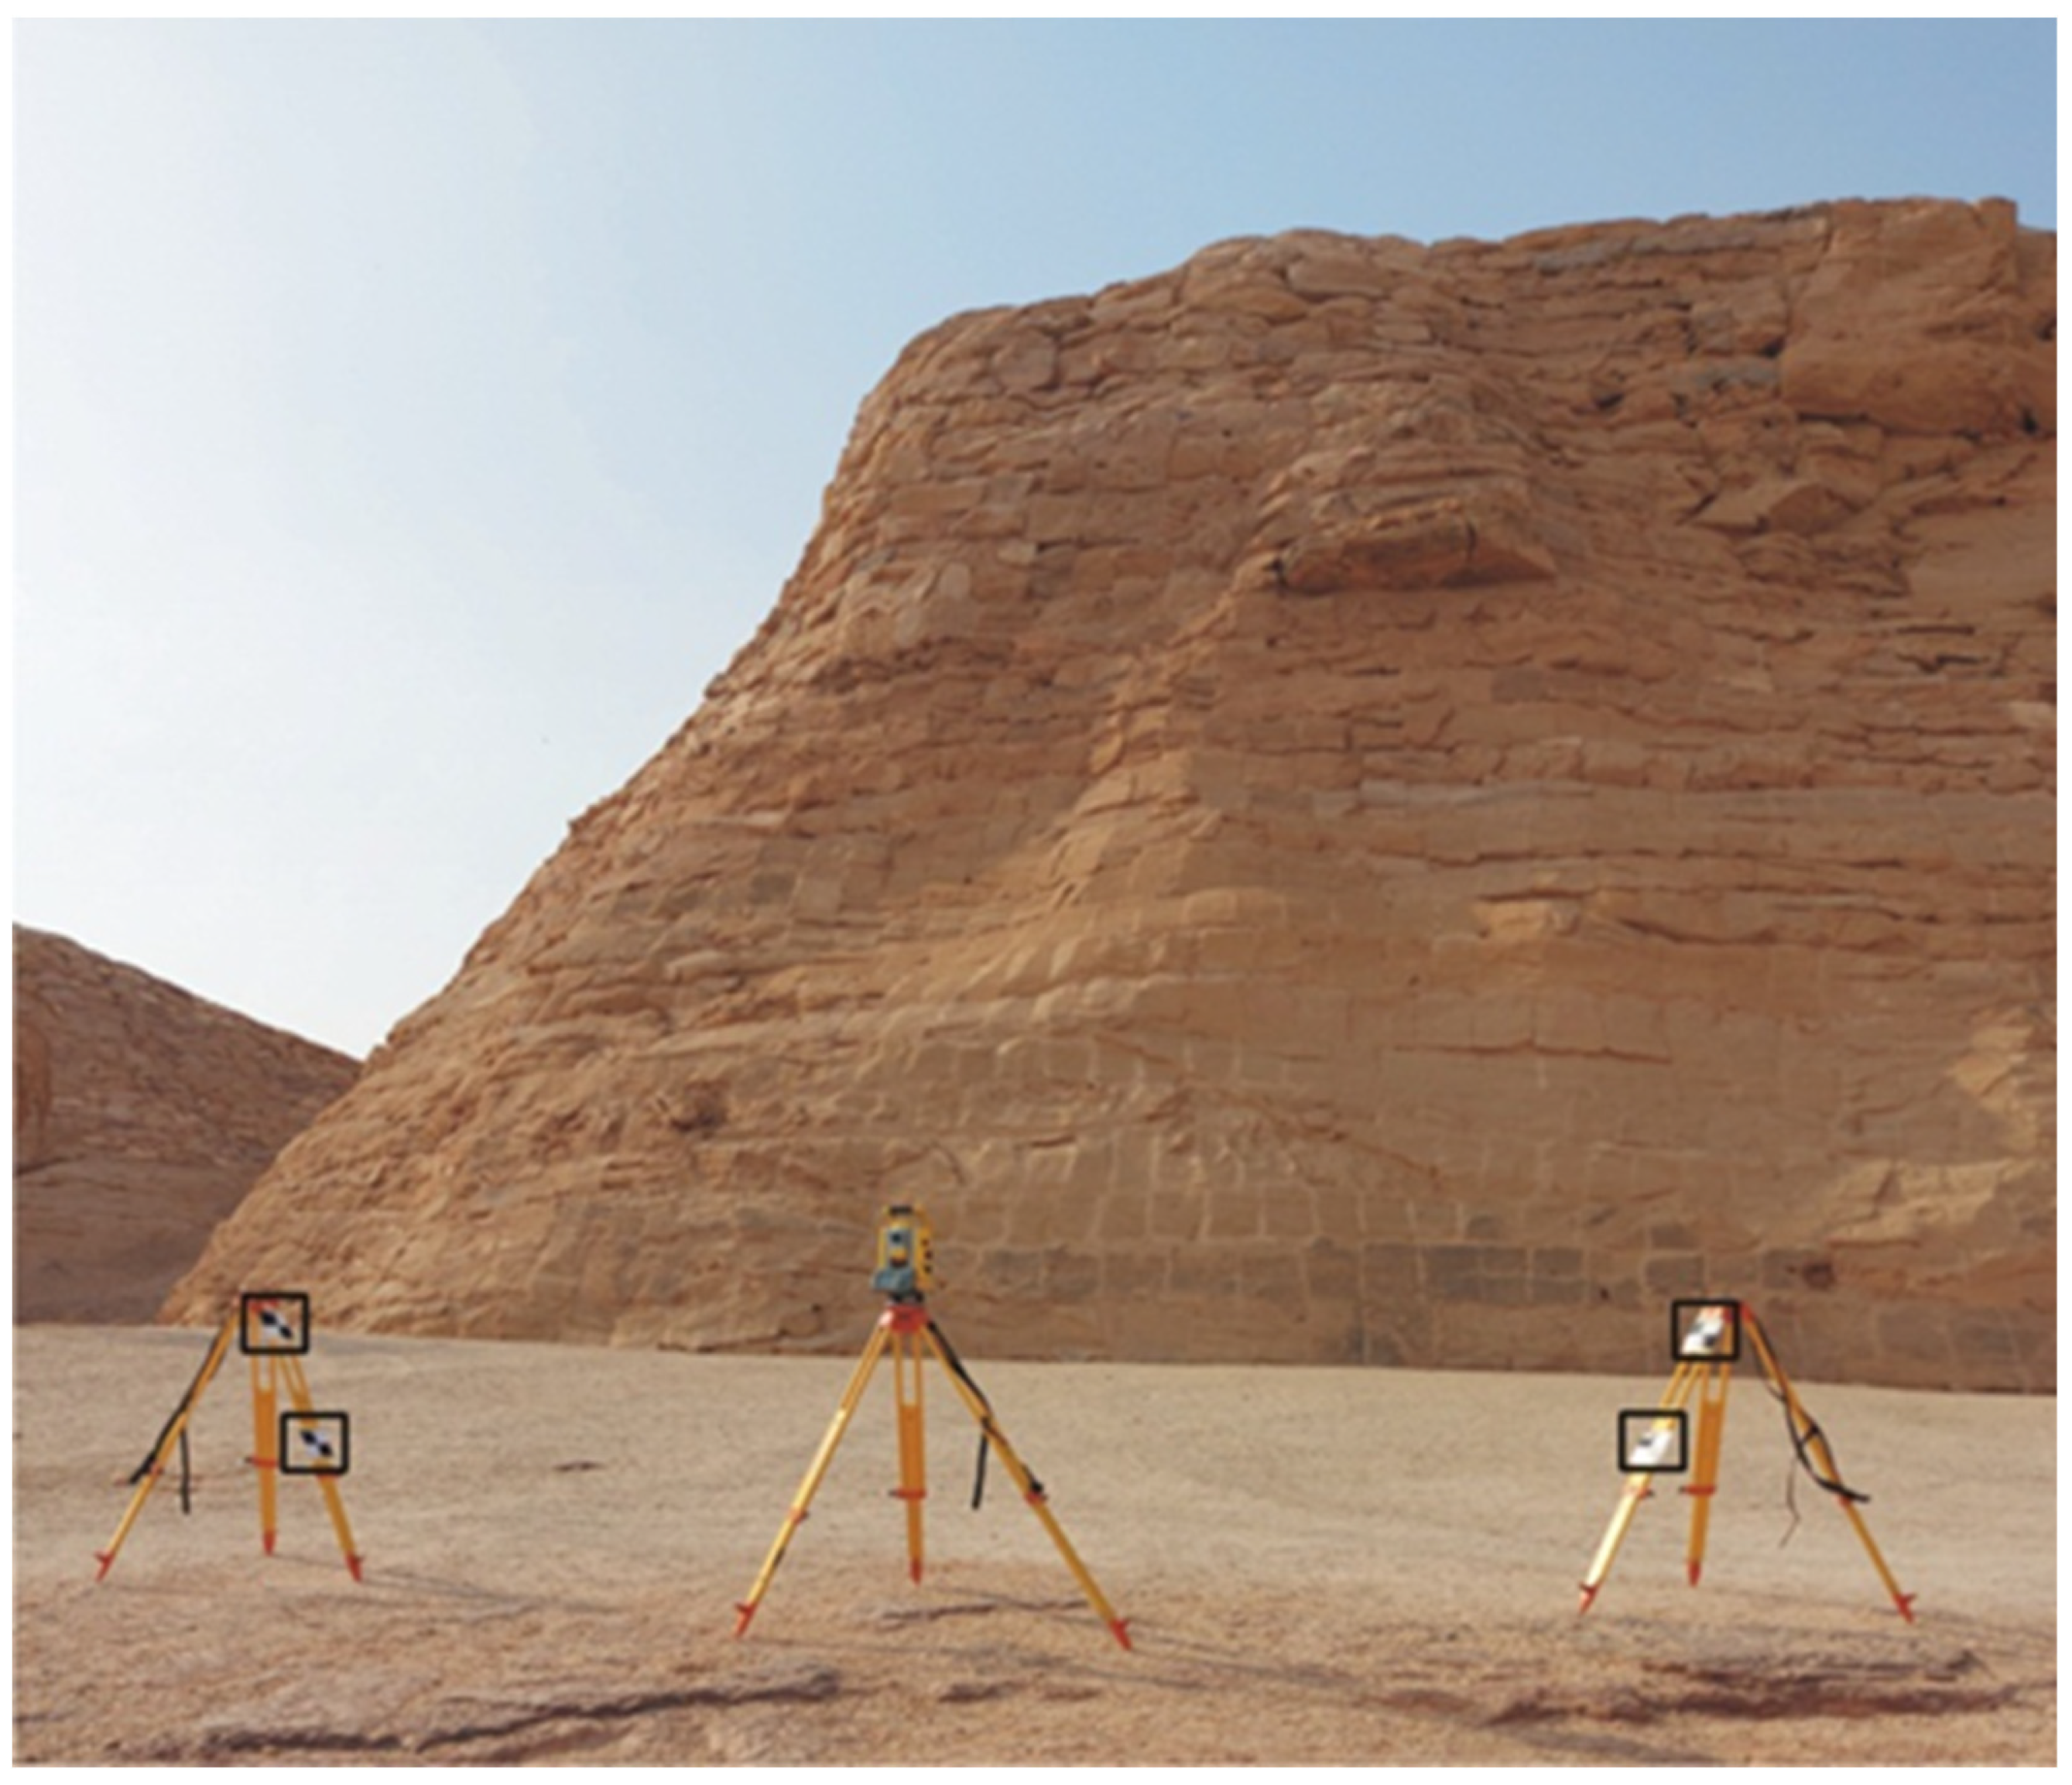
Total stations are optical-electronic devices that combine an electronic transit theodolite with an electronic distance meter (EDM) for modern construction and surveying. In other words, they integrate electronic data accumulators, microprocessors, and storage systems. Using this microprocessor, data can be processed to define the point coordinates, horizontal distance, and fall in level. Such devices detect the vertical and horizontal angles and the distances between items and instruments. In the current study, black and white flat targets were measured by a Trimble S5 (
Figure 6), which was linked to a reference point to form the accurate coordinates (Northing (x), Easting (y), and Elevation (z)) for each point in the final model. Data from the total station were transferred to a computer to calculate the results for the surveyed points using specialized software.
In this investigation, the Trimble S5 was employed because it guaranteed precise pointing and measurements by actively adjusting for unwanted movements such as wind and handling, enables measurement with fewer instrument set-ups, and improves direct reflex performance. The angular accuracy for EDM technology in the Trimble S5 is 1 mm + 2 ppm. Additionally, it is easily integrated with Trimble GNSS receivers and optical measurements for comprehensive surveying [
51,
52,
53].
4. Data Acquisition, Processing, and Registration
The Trimble TX6 has a field of vision of 360° ∗ 317° and a resolution of 0.004 angular meters and can collect data up to 120 m away. Each laser pulse produces a point cloud with coordinates x, y, and z with reflection intensity. To geo-reference the data gathered by Laser TX6, it is essential to set up an array of retroreflectors (Black and White flat targets) that are considered control points. These control points have been measured by a Trimble S5 applying a local coordinate system set up during the survey. The scans from different scanner locations will be grouped into one project and then converted into a world coordinate system.
In the current research, the outdoor and indoor parts of Abu Simbel Temple were covered by 52 scans (
Figure 7a). Twelve scans covered the external facade of the temple with 25 flat targets that were used during data acquisition. Meanwhile, the interior of the temple consists of three halls and several rooms that were surveyed by 40 scans (
Figure 7b). For each scan, the images‘ scanning and capturing took an average of about 21 min. In total, the work was completed in six days as shown in
Table 4. All scans inside and outside the temple were done at level 3. The data acquisition procedure was executed in two steps, laser scanning followed by image capture, and data about the geometry and intensity of facade data were captured using the TX6.
Additionally, RGB values of the geometric object were captured by the integrated HDR camera in the laser TX6, with each scan capturing six images in all directions (Top, bottom, left, right, front, and back) to create a panoramic view of the surrounding area. Using Trimble RealWorks 12.2 software, all of the recorded digital data for the facades of the temple building were automatically stored in the laptop after completing the acquisition step. The procedure of point cloud processing includes checking and cleaning data to ensure that the resulting point cloud accurately represents the underlying objects. Finally, a complete visualization model for Abu Simbel Temple was created by registering these point clouds to the World Geodetic System (WGS84).
In the registration procedure, multiple point clouds were aligned into a well-stratified point cloud model using spatial transformations (e.g., scaling, rotation, translation, etc.). There are two approaches for registration: cloud-to-cloud and target-based. Cloud-to-cloud registration utilizes overlapping scan data to register two or more point clouds, while target-based registration uses black-and-white flat targets that are surveyed by the total station [
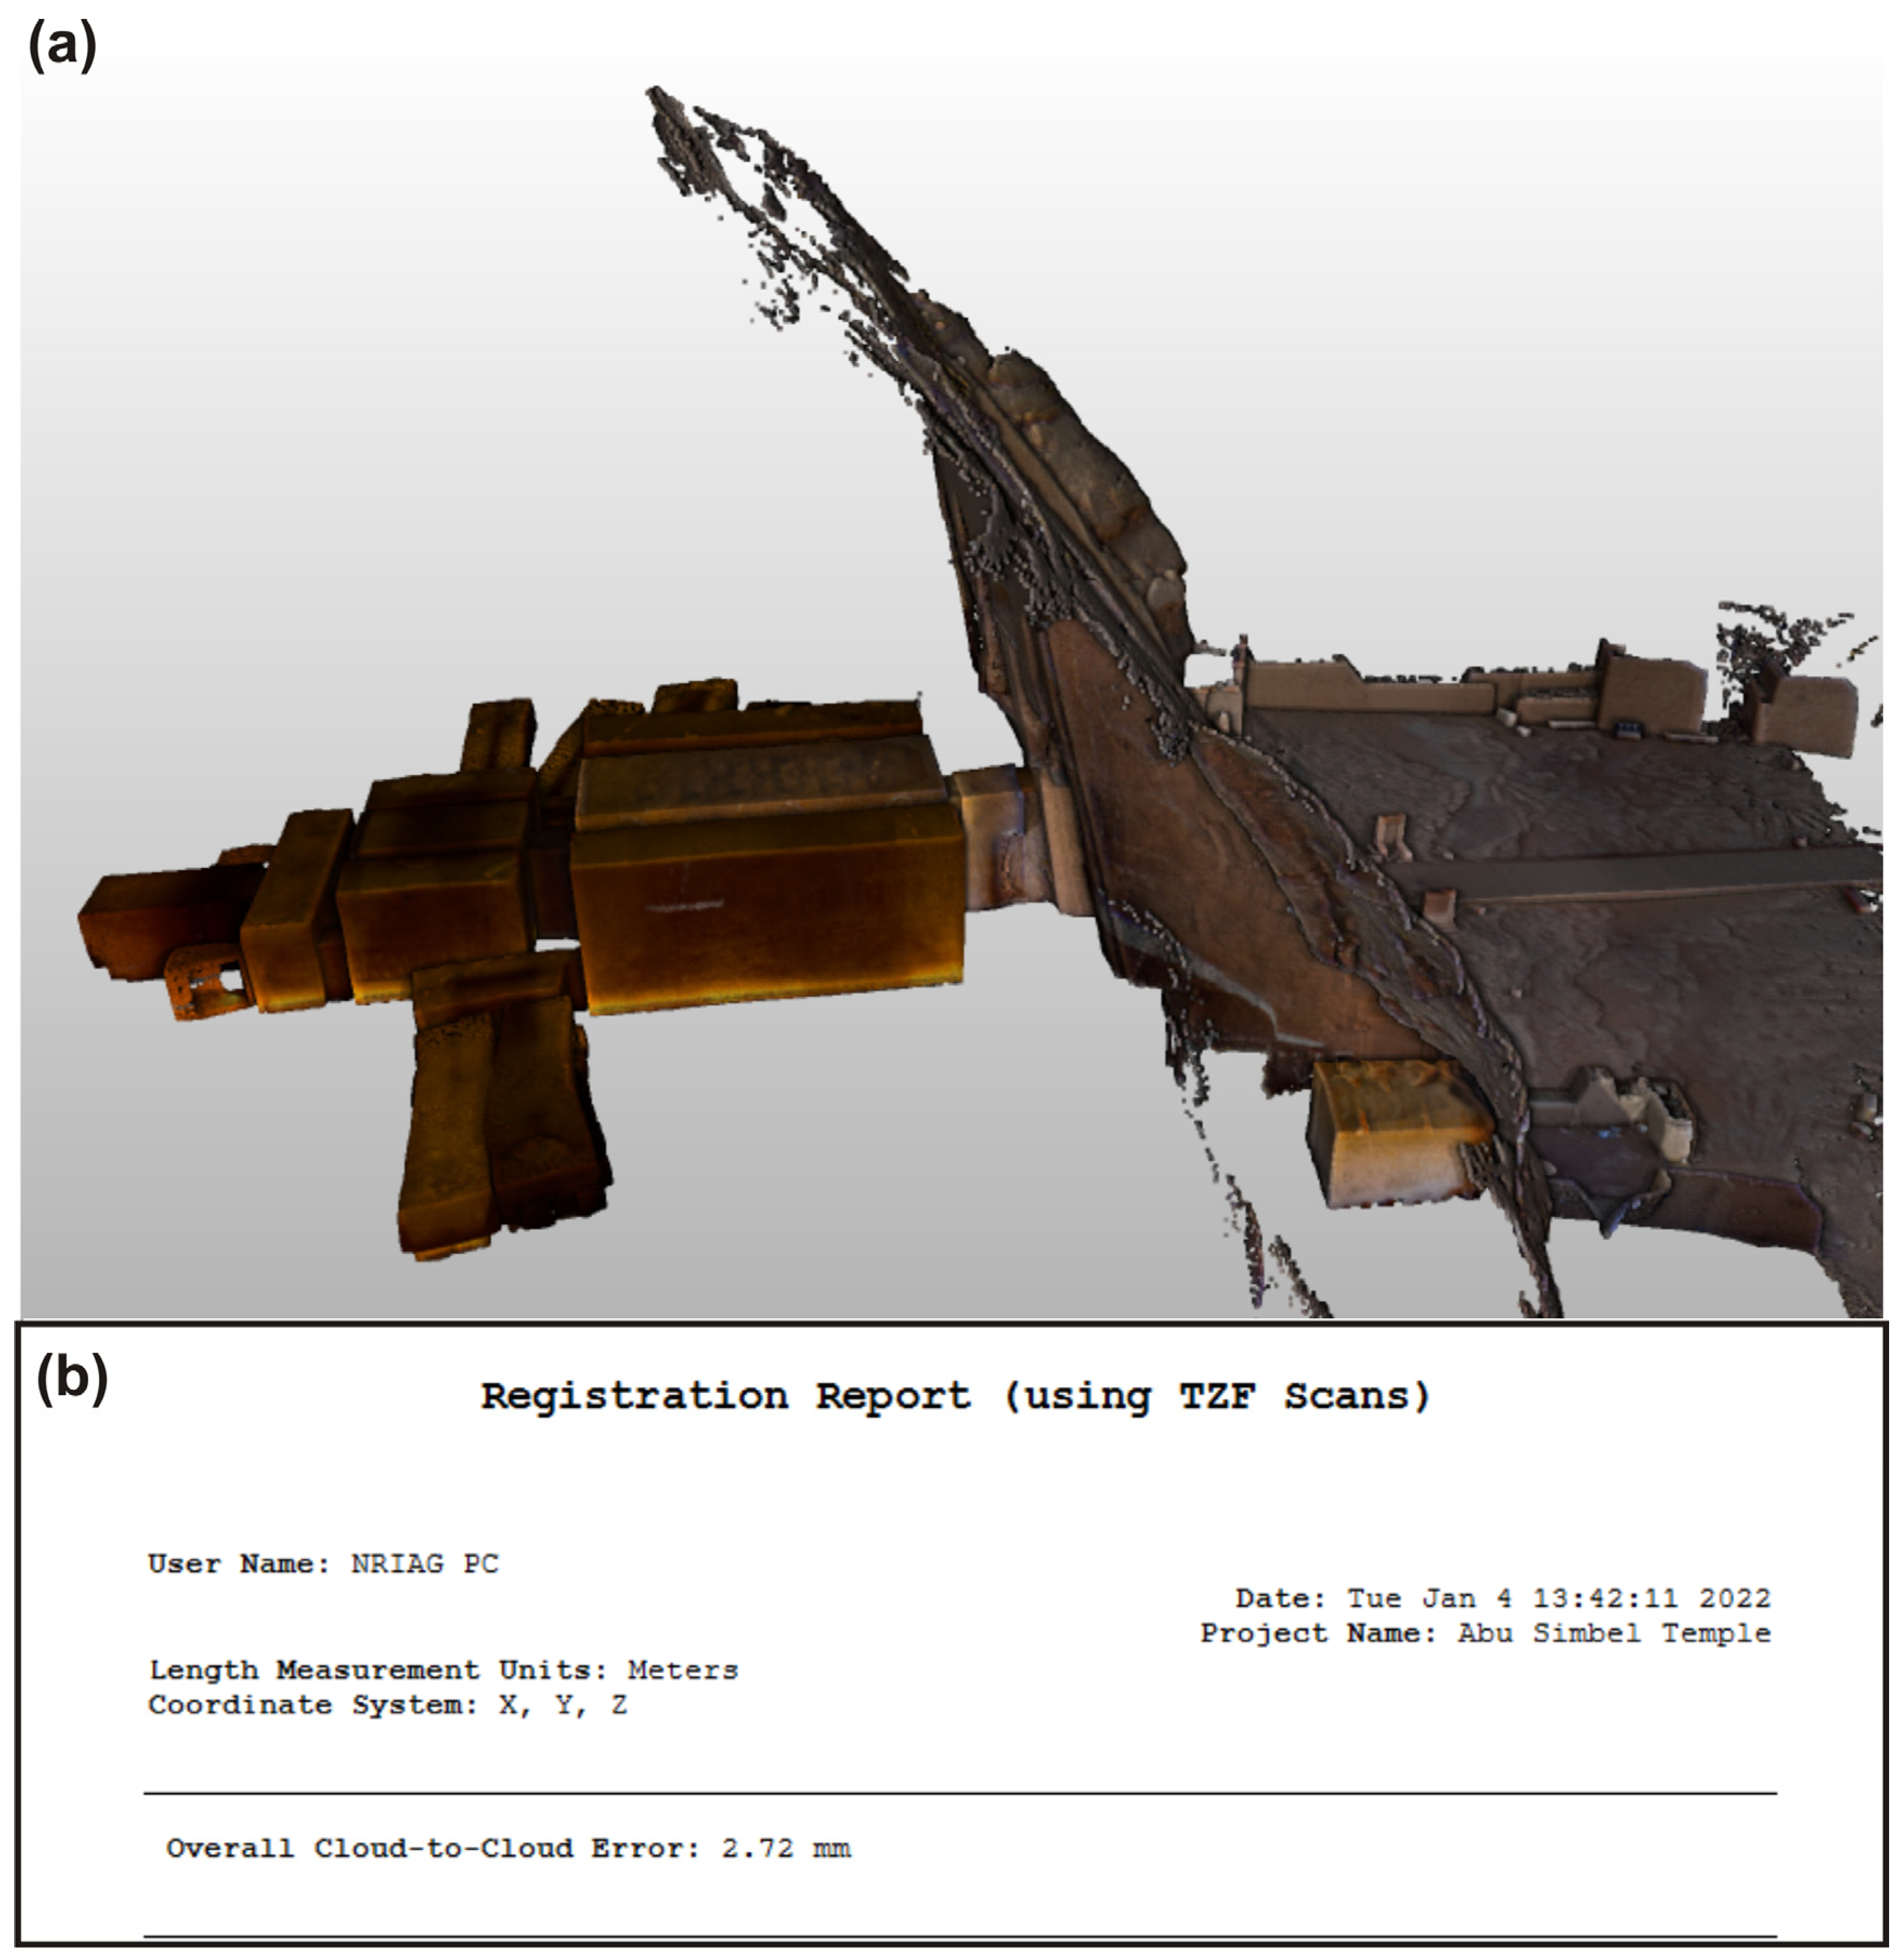
54]. In this survey, both methods of registration have been applied. On the exterior part of the temple, the total station was used to calculate the precise coordinates from scan numbers 1 to 4, which contain black and white flat targets to serve as georeferencing points, while overlapping was used to calculate the remaining scans in the exterior part. In the interior part of the temple, the overlap between each scan was used to register the point cloud (
Figure 8a), and the overall cloud-to-cloud error was 2.72 mm (
Figure 8b). Registration of the 3-D point cloud was done using Trimble RealWorks. The data filtering process was used to correct and remove selected scan points from the geometric object to ensure that the geometric object had an active target representing the range of colors for fit.
After geometric objects had been correctly merged, the color information from the integrated HDR camera was combined with the registered 3-D point clouds. After the final registration of all scans, the resulting 3-D point cloud model has an accuracy of 2.5 mm. The last step of the BIM is to render and complete the documentation in AutoCAD.
The process of cleaning point clouds is difficult, but it is an essential part of the processing [
42,
55,
56]. The scan scene must be free of unwanted objects while keeping visual reference points accessible. It is vital to avoid capturing stationary or moving objects, such as moving people, vehicles, and furniture in the scan, as they can obscure certain scanned elements and add ‘noise’, or undesirable point data that must be filtered and removed from the final point clouds. In the present study, the laser scanning data were processed by removing unwanted and scattered points in each individual scan and combined scans using Trimble RealWorks Software (
Figure 9). After the registration step, the scan explorer was used to extract the point clouds to create different models, such as Ortho-images, 2-D plans, point cloud models, and mesh models.
5. Results and Discussion
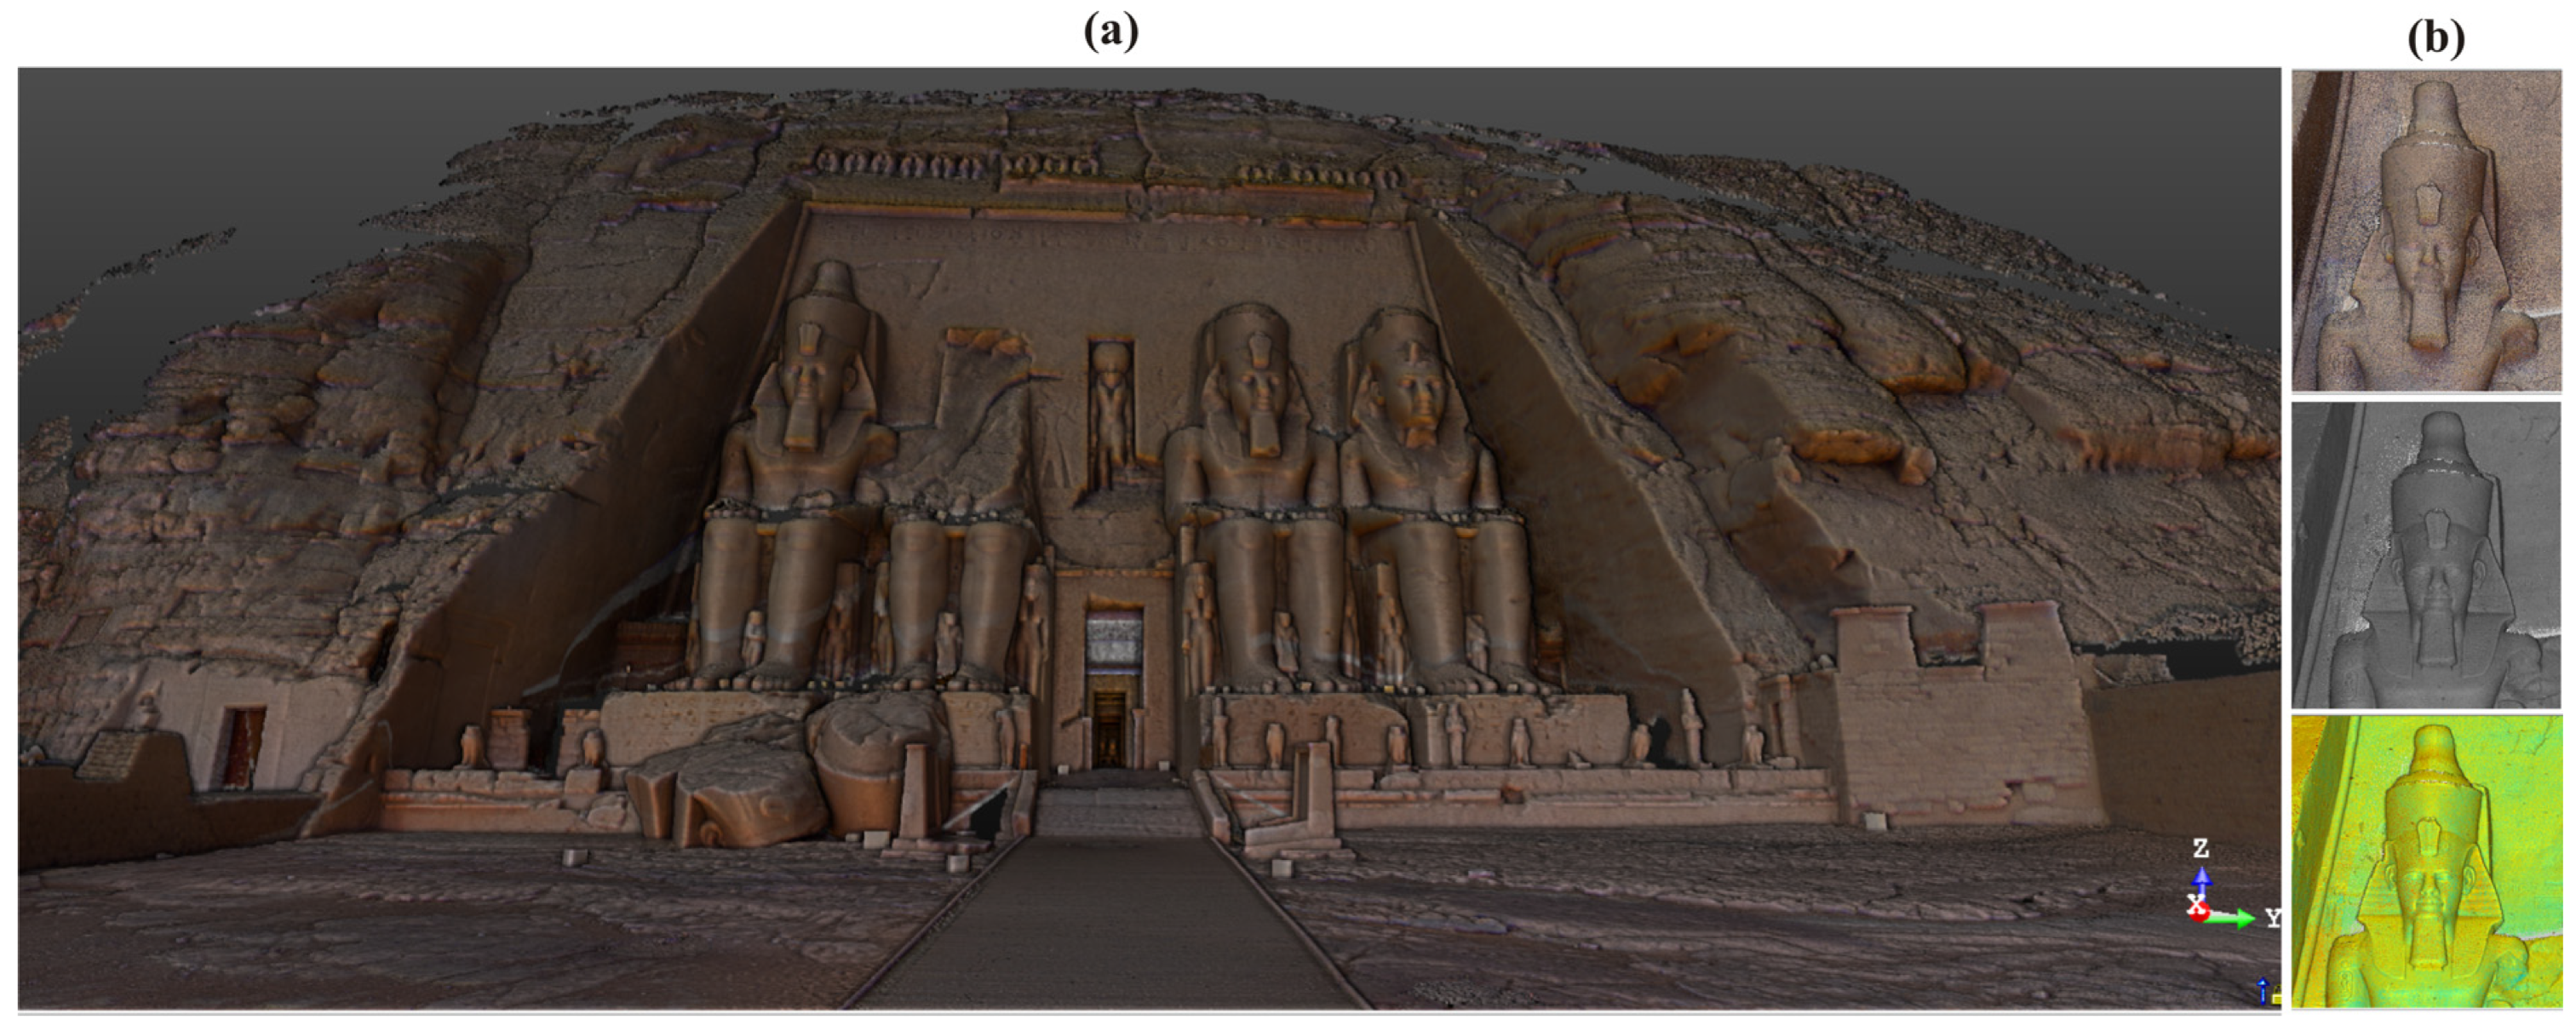
To document existing buildings and restore historical monuments, it is vital to know their geometry. The data collected from the study area were used to create digital models. Using these models, one can graphically preserve this historical building and maintain all necessary information about it. After processing the dataset and obtaining a preliminary model for the temple’s building, it was possible to generate a 3-D visualization model of the architectural elements and the general building’s structure. The first product derived from the collected point cloud is a detailed 3-D point cloud model of the Abu Simbel Temple facade that has numerous architectural features, as shown in
Figure 10.
How well Trimble’s system integrates with the photographing device is of great importance to the resulting 3-D color model quality. These results demonstrate that the model can graphically represent the scanned object in a highly accurate manner that includes all necessary information about the temple that would be required for restoration. This includes 3-D visualizations of the temple’s interior in RGB and grayscale modes (
Figure 11). The interior part of this building consists of three halls, which can be clearly seen in this visualization. The first hall is an atrium with eight pillars, four on each side. Images and hieroglyphs that illustrate Ramesses II’s supposed victory at the Battle of Kadesh are found in the first hall. The second hall has four decorated pillars in the middle of the temple. In the third atrium area, three gods, Ra-Harakhty, Amun, and Ptah, are seated with Ramesses II on a bench.
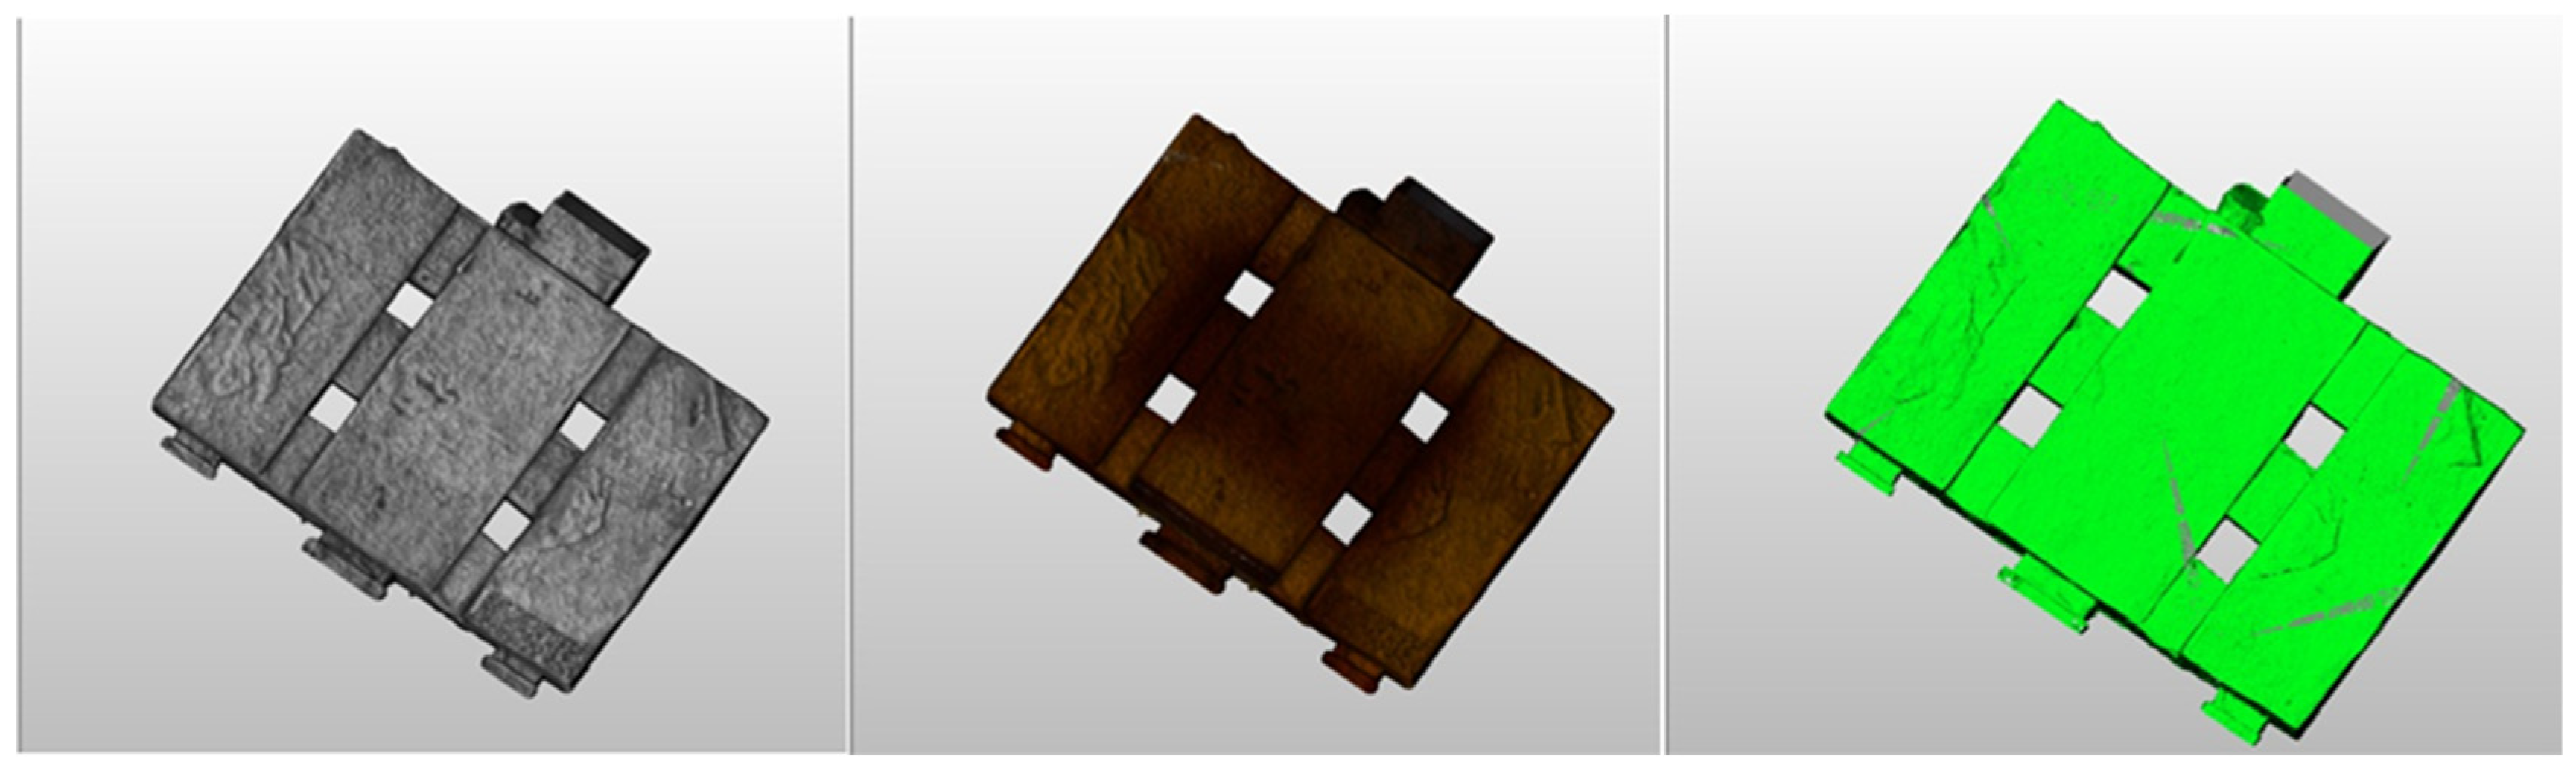
In the next step, a 3-D point cloud model for the temple was created using Trimble RealWorks software. The software registers point clouds and can provide tools for creating simple to complex 3-D mesh models. The computation of point clouds occurs first, followed by the construction of all point clouds. As a result of the previous step, mesh models were computed (Triangulation step), and finally, we obtained the mesh model as shown in
Figure 12. It shows converting gray points or colored points into a mesh model. To create a mesh model, reducing the total number of point clouds is essential to resampling the data with a defined resolution. The first resampling reduced the level of detail to 0.2 cm. Roughly 438 million triangles are created in this mesh model.
The temple model is accurate in terms of its structure and size because height and width measurements are taken using point-cloud models during the generation of 3-D building models. Furthermore, TLS allows quick digitization of real-world objects and provides a complete dataset that is easy to interpret. This is not only a result of the point cloud but also the images recorded. Hence, a complete plan is created, including all existing details, so there is no possibility of accidental omissions of any element.
This study used a common method to delineate traditional architectural line drawings for plans, elevations, and sections. Through the point cloud export, we could trace the plans based on the same measurements obtained from the laser scan. To draw the facades with the architecture and basic characteristics of the temple, the team exported the point clouds from Trimble Real works as DWG or DXF files. In
Figure 13, we can see that the documentation is highly accurate, thanks to eliminating errors from manual measurements based on the real dimensions.
Finally, a virtual tour of the Abu Simbel Temple was created to let users explore various locations while promoting historical awareness and temple documentation. The virtual tour enhances and provides users with the value of sharing comprehensive information about the temple. Using technology, the temples can now be enhanced with digital content, which is suitable for both historical and cultural contexts. A user could be immersed in a manufactured, fictional world known as virtual reality (VR). VR involves a deep inundation into a virtual world without direct interaction with the immediate physical environment. The 3DVista Virtual Tour Pro software creates interactive virtual tours by generating realistic interactive panoramas. Therefore, users can visualize high-quality panoramas using 360° panoramic images. The multi-platform software can be displayed on Mac, PC, iPhone, iPad, and Android in any Web browser. Users can navigate the panorama (look left, right, and up, and move from one panorama to the next, just as if they were moving from one room to another). Moreover, it is possible to open information windows with text, video, and graphic data that offer more details about a certain panorama object. A background sound for the virtual tour can be applied for a more interactive experience.
The temple’s model was loaded as a point cloud into the game engine Unreal Engine 2.24 to produce a virtual tour. In addition to loading point clouds, the lidar point cloud sample plugin needs to be installed on software through Epic Games. The data were exported in LAS format file for the Unreal Engine (XYZ, TXT, PTS, and LAS), and then it was easy to import.
However, due to the project sampling, there was an error in importing the point cloud in the Unreal Engine software. Therefore, gaps between points must be increased to provide appropriate details for the temple. A point budget level-of-detail system uses a point budget approach to maintain steady performance levels disregarding the cloud density’s variations. This se tting determines the maximum number of points to be displayed on the screen at any specific time. Higher values produce better image quality, but this will require more advanced hardware. Additionally, several cameras were distributed in the project, and 360 images were generated.
The high-quality 360° photos and videos obtained with UE4 could be then used to visualize virtual tours with the 3DVista Virtual Tour Pro program. After selecting 360° panoramic images, hotspots were added to link the images together for easy navigation; furthermore, these hotspots would be icons or polygons. Visitors might interact with objects in the scenes during their visit to activate multimedia content (audio, text, and images). The tour consisted of 61 panoramas for more distinctive navigation, as shown in
Figure 14. Moreover, a map was added to the tour to clarify the user’s location for easy navigation. In addition to the user’s navigation, the model could be exported standalone or via the web. The user would navigate the temple through multiple platforms, including mobile, PC, tablet, and head-mounted display (
Figure 15).
It’s important to note that some visitors who had the chance to experience the VR tour of the Temple of Abu Simbel mentioned a number of advantages, including the ability to better see details in narrow places that are difficult to access during a real visit as well as the murals and inscriptions at the top of the temple’s walls that are difficult to see in reality. Also, the sounds used in the VR increase the excitement. However, several users expressed concerns about motion sickness as a result of a difference between their perceptions of what they are seeing and how they actually felt.
6. Conclusions
The condition of cultural heritage may change over time due to various internal and external factors. So, a country should have an inventory, and documentation of its cultural heritage, which can be used to preserve archaeological monuments. Digital documentation can help greatly in restoration in case of any damage due to earthquakes, floods, fires, etc. In this study, laser scanning is deemed effective in obtaining a 3-D model (a point cloud, mesh, and VR models) at Abu Simbel Temple and extracting cross and longitudinal sections.
Because it is one of Egypt’s most famous archaeological sites, the work’s significance rests in developing a digital model to preserve Abu Simbel Temple. After the High Dam in Egypt was built, the temple was moved to its present location. Numerous risks could change the inscriptions on the temple’s walls or have an impact on the structure of the temple. Earthquakes are likely to have an impact on the temple’s main structure due to the temple’s location very close to a fault structure. Additionally, if the Ethiopian Dam collapses, it could cause Lake Nasser’s water level to rise, posing a major threat to the temple. This 3-D model is considered a reference model to notice any changes that may occur in the structure or on the inscriptions of the temple, which play an important role in the digital restoration of damaged elements. In addition to contributing to the spread of cultural awareness of the world’s heritage, this documentation study can help Egyptologists precisely investigate the inscriptions inside the temple. Moreover, this 3-D model has educational value and can be used to disseminate knowledge about the temple to people who cannot visit the site in situ.
One important outcome of the current study is that we could digitize and visualize a 3-D cultural heritage model for Abu Simbel Temple, which enabled us to develop and generate a full visualization model. Furthermore, obtaining a 360° photo of the temple is an important and efficient way of enhancing cultural heritage through VR. To reinforce the results, such information can be combined with traditional archaeological drawings which are more concerned with a visual aspect than a metric one. Additionally, the immense amount of data collected could be used to promote further proposals, particularly concerning integration with restoration projects. In other words, data provide a virtual tour containing useful preservation information; restorers can access this straightforward database, including information about the techniques used to gather the data in real time.
Moving forward, we would advise that similar studies be done on the many important cultural heritage sites in Egypt to create a digital archaeological library. We will also continue to collect data from the geodetic networks around the temple to calculate the rate of deformation in the vertical and horizontal directions. We plan to use the data we obtain, including RGB images and point clouds, to detect cracks, and to recognize important historical features at the site using advanced image processing and machine learning techniques.
Author Contributions
Conceptualization, A.E., A.G., A.M. and H.G.; methodology, A.E., A.G. and A.M.; software, A.E. and A.G.; validation, A.G., A.M. and H.G.; formal analysis, A.E., A.G. and A.M.; investigation, A.E., A.G., A.M. and H.G.; resources, A.E., A.G., A.M., I.M.I. and H.G.; data curation, A.E. and A.G.; writing—original draft preparation, A.E. and A.G.; writing—review and editing, A.M., H.G., A.O. and I.M.I.; visualization, A.E., A.G. and A.O.; supervision, H.G., A.O. and A.M.; project administration, A.G. and A.M.; funding acquisition, A.G. and A.M. All authors have read and agreed to the published version of the manuscript.
Funding
This research was funded by the Science and Technology Development Fund (STDF), grant number 37067.
Data Availability Statement
The datasets used and/or analyzed during the current study are available from the first author upon reasonable request.
Acknowledgments
This work was performed under the financially supported framework of the Science and Technology Development Fund (STDF), project no. 37067. The authors would like to express their gratitude to the four anonymous reviewers for their insightful comments and suggestions, which allowed us to improve the manuscript’s quality. The authors would like to extend their sincere appreciation to Kristen Hopper from Durham University for her proofreading of a version of this paper. Moreover, many thanks to Gad El-Qady, president of NRIAG who supported this research.
Conflicts of Interest
The authors declare no conflict of interest.
References
- Balado, J.; Frías, E.; González-Collazo, S.M.; Díaz-Vilariño, L. New Trends in Laser Scanning for Cultural Heritage. In New Technologies in Building and Construction; Bienvenido-Huertas, D., Moyano-Campos, J., Eds.; Lecture Notes in Civil Engineering; Springer: Singapore, 2022; p. 258. [Google Scholar] [CrossRef]
- Costanzo, A.; Falcone, S.; La Piana, C.; Lapenta, V.; Musacchio, M.; Sgamellotti, A.; Buongiorno, M.F. Laser Scanning Investigation and Geophysical Monitoring to Characterise Cultural Heritage Current State and Threat by Traffic-Induce Vibrations: The Villa Farnesina in Rome. Remote Sens. 2022, 14, 5818. [Google Scholar] [CrossRef]
- Karataş, L.; Alptekin, A.; Yakar, M. Creating Architectural Surveys of Traditional Buildings with the Help of Terrestrial Laser Scanning Method (TLS) and Orthophotos: Historical Diyarbakır Sur Mansion. Adv. LiDAR 2022, 2, 54–63. [Google Scholar]
- Kęsik, J.; Miłosz, M.; Montusiewicz, J.; Israilova, N. Documenting Archaeological Petroglyph Sites with the Use of 3D Terrestrial Laser Scanners—A Case Study of Petroglyphs in Kyrgyzstan. Appl. Sci. 2022, 12, 10521. [Google Scholar] [CrossRef]
- Moyano, J.; Justo-Estebaranz, Á.; Nieto-Julián, J.E.; Barrera, A.O.; Fernández-Alconchel, M. Evaluation of records using terrestrial laser scanner in architectural heritage for information modeling in H.B.I.M. construction: The case study of the La Anunciación church (Seville). J. Build. Eng. 2022, 62, 105190. [Google Scholar] [CrossRef]
- Pepe, M.; Alfio, V.S.; Costantino, D.; Herban, S. Rapid and Accurate Production of 3D Point Cloud via Latest-Generation Sensors in the Field of Cultural Heritage: A Comparison between SLAM and Spherical Videogrammetry. Heritage 2022, 5, 1910–1928. [Google Scholar] [CrossRef]
- Guan, H.; Li, J.; Cao, S.; Yu, Y. Use of mobile LiDAR in road information inventory: A review. Int. J. Image Data Fusion. 2016, 7, 219–242. [Google Scholar] [CrossRef]
- Rosell-Polo, J.R.; Gregorio, E.; Llorens, J. Special Issue on “Terrestrial Laser Scanning”: Editors’ Notes. Sensors 2019, 19, 4569. [Google Scholar] [CrossRef]
- Kwoczynska, B.; Litwin, U.; Piech, I.; Obirek, P.; Sledz, J. The use of terrestrial laser scanning in surveying historic buildings. In 2016 Baltic Geodetic Congress; Geomatics, B.G.C., Ed.; IEEE: Piscataway, NJ, USA, 2016; pp. 263–268. [Google Scholar] [CrossRef]
- Kotoula, E.; Akoglu, K.G.; Weiqi, S.; Wang, Z.; Yang, Y.; Simon, S.; Rushmeier, H. CHER-Ob for Cultural Heritage Research: Unsleben Jewish Cemetery Case Study. In Proceedings of the Digital Cultural Heritage: FUTURE VISIONS London Symposium, London, UK, 13–15 November 2017; Greenop, K., Landorf, C., Eds.; Centre for Architecture Theory Criticism History: Brisbane, Australia, 2019; pp. 77–101. [Google Scholar]
- Gruen, A.; Akca, D. Least squares 3D surface and curve matching. ISPRS J. Photogramm. Remote. Sens. 2005, 59, 151–174. [Google Scholar] [CrossRef]
- Şmuleac, A.; Herbei, M.; Popescu, G.; Popescu, T.; Popescu, C.A.; Barliba, C.; Şmuleac, L. 3D Modeling of Patrimonium Objectives Using Laser Technology. Bulletin of University of Agricultural Sciences and Veterinary Medicine Cluj-Napoca. Horticulture 2019, 76, 106–113. [Google Scholar] [CrossRef]
- Ulvi, A. Documentation, Three-Dimensional (3D) Modelling and visualization of cultural heritage by using Unmanned Aerial Vehicle (UAV) photogrammetry and terrestrial laser scanners. Int. J. Remote Sens. 2021, 42, 1994–2021. [Google Scholar] [CrossRef]
- Marín-Buzón, C.; Pérez-Romero, A.; López-Castro, J.L.; Ben Jerbania, I.; Manzano-Agugliaro, F. Photogrammetry as a new scientific tool in archaeology: Worldwide research trends. Sustainability 2021, 13, 5319. [Google Scholar] [CrossRef]
- Jones, C.A.; Church, E. Photogrammetry is for everyone: Structure-from-motion software user experiences in archaeology. J. Archaeol. Sci. Rep. 2020, 30, 102261. [Google Scholar] [CrossRef]
- Mustafa, M.H.; Ali, M.; Ismail, K.M.; Hashim, K.S.H.Y.; Suhaimi, M.S.M. BIM backed decision support system in the management of heritage building. Int. J. Built Environ. Sustain. 2019, 6, 63–71. [Google Scholar] [CrossRef]
- Cheng, H.-M.; Yang, W.-B.; Yen, Y.-N. BIM applied in historical building documentation and refurbishing. Int. Arch. Photogramm. Remote Sens. Spat. Inf. Sci. 2015, XL–5/W7, 85–90. [Google Scholar] [CrossRef]
- Al-Bayari, O.; Shatnawi, N. Geomatics techniques and building information model for historical buildings conservation and restoration. Egypt. J. Remote. Sens. 2022, 25, 563–568. [Google Scholar] [CrossRef]
- Corso, J.; Casals, J.; Marco, A.; López, D.; Garcia-Almirall, P. Data taking and quality control for complex surveys: Case study Sagrada Familia. In World Heritage and Knowledge: Representation, Restauration, Redesign, Resilience; dei Mercanti, L.V., Ed.; Universitat Politècnica de Catalunya: Barcelona, Spain, 2018; pp. 960–970. [Google Scholar]
- Corso, J.; Garcia-Almirall, P. Architectural surveys as a link between heritage and tourism. In Proceedings of the International Scientific Conference Proceed with Care in Rethinking Cultural Tourism: Proceed with Care in the Age of Excess, Šibeniku, Croatia, 2–5 May 2019; pp. 3–16. Available online: https://www.bib.irb.hr/1073043 (accessed on 2 January 2023).
- Parrinello, S.; De Marco, R. Digital surveying and 3D modelling structural shape pipelines for instability monitoring in historical buildings: A strategy of versatile mesh models for ruined and endangered heritage. Acta IMEKO 2021, 10, 84–97. [Google Scholar] [CrossRef]
- Corso, J.; Garcia-Almirall, P.; Marco, A. High resolution model mesh and 3D printing of the Gaudí’s Porta del Drac. IOP Conf. Ser. Mater. Sci. Eng. 2017, 245, 052091. [Google Scholar] [CrossRef]
- Murtiyoso, A.; Suwardhi, D.; Grussenmeyer, P.; Fadilah, W.; Fauzan, K.; Trisyanti, S.; Macher, H. Heritage documentation and knowledge transfer: A report on the CIPA Tropical School in Candi Sewu (Indonesia). In Proceedings of the 28th CIPA Symposium, Beijing, China, 28 August–1 September 2021; Université Tsinghua: Pekin, Chine, 2021; p. 46. [Google Scholar] [CrossRef]
- Carraro, F.; Monego, M.; Callegaro, C.; Mazzariol, A.; Perticarini, M.; Menin, A.; Giordano, A. The 3D survey of the Roman bridge of San Lorenzo in Padova (Italy): A comparison between SFM and TLS methodologies applied to the arch structure. In Proceedings of the International Archives of the Photogrammetry, Remote Sensing & Spatial Information Sciences, Ávila, Spain, 1–5 September 2019. [Google Scholar] [CrossRef]
- Callender, G. Queen Nefertari, Wife of Rameses II. Anc. Hist. Resour. Teach. 1992, 22, 65. [Google Scholar]
- Heidorn, L.A. Abu Simbel. In Encyclopedia of the Archaeology of Ancient Egypt; Bard, K.A., Ed.; Routledge: London, UK, 1999; pp. 93–97. [Google Scholar]
- Redford, D.B. The Oxford Encyclopedia of Ancient Egypt; Oxford University Press: Oxford, UK, 2005; pp. 4–5. [Google Scholar]
- Spalinger, A.J. Historical observations on the military reliefs of Abu Simbel and other Ramesside temples in Nubia. J. Egypt Archaeol. 1980, 66, 83–99. [Google Scholar] [CrossRef]
- Pearson, W. Rameses II and the battle of Kadesh: A miraculous victory? Anc. Hist. 2010, 40, 1. [Google Scholar]
- Breasted, J.H. A History of Egypt from the Earliest Times to the Persian Conquest; Cambridge University Press: Cambridge, UK, 2016. [Google Scholar] [CrossRef]
- Inman, D.L.; Jenkins, S.A. The Nile littoral cell and man’s impact on the coastal zone of the southeastern Mediterranean. Coast. Eng. 1984, 19, 1600–1617. [Google Scholar] [CrossRef]
- Ghoneim, E.; Mashaly, J.; Gamble, D.; Halls, J.; AbuBakr, M. Nile Delta exhibited a spatial reversal in the rates of shoreline retreat on the Rosetta promontory comparing pre-and post-beach protection. Geomorphology 2015, 228, 1–14. [Google Scholar] [CrossRef]
- El-Behaedi, R.; Ghoneim, E. Flood risk assessment of the Abu Simbel temple complex (Egypt) based on high-resolution spaceborne stereo imagery. J. Archaeol. Sci Rep. 2018, 20, 458–467. [Google Scholar] [CrossRef]
- Hassan, F.A. The Aswan high dam and the international rescue Nubia campaign. Afr. Archaeol. Rev. 2007, 24, 73–94. [Google Scholar] [CrossRef]
- Spencer, T. The Race to Save Abu Simbel is Won. Life Mag. 1966, 61, 32–37. [Google Scholar]
- Gibowicz, S.J.; Droste, Z.; Kebeasy, R.M.; Ibrahim, E.M.; Albert, R.N.H. A microearthquake survey in the Abu-Simbel area in Egypt. Eng. Geol. 1983, 19, 95–109. [Google Scholar] [CrossRef]
- Badawy, A. Historical seismicity of Egypt. Acta Geod. Et Geophys. 1999, 34, 119–135. [Google Scholar] [CrossRef]
- Marchetti, N.; Curci, A.; Gatto, M.C.; Nicolini, S.; Mühl, S.; Zaina, F. A multi-scalar approach for assessing the impact of dams on the cultural heritage in the Middle East and North Africa. J. Cult. Herit. 2019, 37, 17–28. [Google Scholar] [CrossRef]
- Omran, E.S.E.; Negm, A. Environmental impacts of the GERD project on Egypt’s Aswan high dam lake and mitigation and adaptation options. In Grand Ethiopian Renaissance Dam Versus Aswan High Dam; Negm, A., Abdel-Fattah, S., Eds.; The Handbook of Environmental Chemistry; Springer: Cham, Switzerland, 2018; Volume 7, pp. 175–196. [Google Scholar] [CrossRef]
- Zaina, F.; Tapete, D. Satellite-Based Methodology for Purposes of Rescue Archaeology of Cultural Heritage Threatened by Dam Construction. Remote Sens. 2022, 14, 1009. [Google Scholar] [CrossRef]
- Kleinitz, C.; Näser, C. The loss of innocence: Political and ethical dimensions of the Merowe Dam Archaeological Salvage Project at the Fourth Nile Cataract (Sudan). Conserv. Manag. Archaeol. Sites 2011, 13, 253–280. [Google Scholar] [CrossRef]
- Ahmed, A.T.; Elsanabary, M.H. Hydrological and environmental impacts of Grand Ethiopian Renaissance Dam on the Nile River. In Proceedings of the Eighteenth International Water Technology Conference, IWTC18, Sharm El Sheikh, Egypt, 12–14 March 2015; pp. 336–647. [Google Scholar]
- Elbshbeshi, A.; Gomaa, A.; Mohamed, A.; Othman, A.; Ghazala, H. Seismic hazard evaluation by employing microtremor measurements for Abu Simbel area, Aswan, Egypt. J. African Earth Sci. 2022, 196, 104734. [Google Scholar] [CrossRef]
- Tang, P.; Huber, D.; Akinci, B.; Lipman, R.; Lytle, A. Automatic reconstruction of as-built building information models from laser-scanned point clouds: A review of related techniques. Autom. Constr. 2010, 19, 829–843. [Google Scholar] [CrossRef]
- Negrilă, A.; Onose, D. Dam monitoring using terrestrial laser scanning. 1 Decembrie 1918” University of Alba Iulia, RevCAD 15/2013. J. Geod. Cadastre 2013, 1583, 2279. [Google Scholar]
- Mohamed, A.M.S. Potential of 3d laser point cloud data usage for the tourism industry. In Proceedings of the International Conference on Civil and Architecture Engineering (12th International Conference on Civil and Architecture Engineering), Chengdu, China, 27–29 October 2018; Military Technical College: Cairo Governorate, Egypt, 2018; Volume 12, pp. 1–13. [Google Scholar] [CrossRef]
- Jo, Y.H.; Hong, S. Three-dimensional digital documentation of cultural heritage site based on the convergence of terrestrial laser scanning and unmanned aerial vehicle photogrammetry. ISPRS Int. J. Geo-Inf. 2019, 8, 53. [Google Scholar] [CrossRef]
- Karagianni, A. Terrestrial laser scanning and satellite data in cultural heritage building documentation. Int. Arch. Photogramm. Remote Sens. Spat. Inf. Sci. 2021, 46, 361–366. [Google Scholar] [CrossRef]
- Vileikis, O.; Khabibullaeyev, F. Application of Digital Heritage Documentation for Condition Assessments and Monitoring Change in Uzbekistan. In ISPRS Annals of the Photogrammetry, Remote Sensing and Spatial Information Sciences; ISPRS: Beijing, China, 2021; pp. 179–186. [Google Scholar] [CrossRef]
- Petrovič, D.; Grigillo, D.; Kosmatin Fras, M.; Urbančič, T.; Kozmus Trajkovski, K. Geodetic methods for documenting and modelling cultural heritage objects. Int. J. Archit. Herit. 2021, 15, 885–896. [Google Scholar] [CrossRef]
- Fenais, A.; Ariaratnam, S.T.; Smilovsky, N. Assessing the accuracy of an outdoor augmented reality solution for mapping underground utilities. J. Pipeline Syst. Eng. Pract. 2020, 11, 04020029. [Google Scholar] [CrossRef]
- Sanz-Ablanedo, E.; Chandler, J.H.; Ballesteros-Pérez, P.; Rodríguez-Pérez, J.R. Reducing systematic dome errors in digital elevation models through better UAV flight design. Earth Surf. Process. Landf. 2020, 45, 2134–2147. [Google Scholar] [CrossRef]
- Zollini, S.; Alicandro, M.; Dominici, D.; Quaresima, R.; Giallonardo, M. UAV photogrammetry for concrete bridge inspection using object-based image analysis (OBIA). Remote Sens. 2020, 12, 3180. [Google Scholar] [CrossRef]
- Cheok, G.S.; Lipman, R.R.; Witzgall, C.; Bernal, J.; Stone, W.C. Field demonstration of laser scanning for excavation measurement. In Proceedings of the 17th ISARC, Taipei, Taiwan, 18–20 September 2000; pp. 1–6. [Google Scholar] [CrossRef]
- Arayici, Y.; Khosrowshahi, F.; Ponting, A.M.; Mihindu, S.A. Towards implementation of building information modelling in the construction industry. In Proceedings of the Fifth International Conference on Construction in the 21st Century (CITC-V), “Collaboration and Integration in Engineering, Management and Technology”, Istanbul, Turkey, 20–22 May 2009; pp. 1342–1351. [Google Scholar] [CrossRef]
- Guillen, A.J.; Crespo, A.; Gómez, J.; González-Prida, V.; Kobbacy, K.; Shariff, S. Building information modeling as assest management tool. IFAC-Pap. 2016, 49, 191–196. [Google Scholar] [CrossRef]
Figure 1.
Location map of Abu Simbel Temple in Aswan, Egypt.
Figure 1.
Location map of Abu Simbel Temple in Aswan, Egypt.
Figure 2.
In the two images at the top, the Great Temple at its original location is shown in 1905 (Source: Oriental Institute, Chicago University Archive). In the lower photo, Ramesses II’s Great Temple is shown on the left, and Nefertari’s Small Temple is on the right.
Figure 2.
In the two images at the top, the Great Temple at its original location is shown in 1905 (Source: Oriental Institute, Chicago University Archive). In the lower photo, Ramesses II’s Great Temple is shown on the left, and Nefertari’s Small Temple is on the right.
Figure 3.
A flowchart showing the different stages of the survey.
Figure 3.
A flowchart showing the different stages of the survey.
Figure 4.
Surveying Abu Simbel Temple’s interior and exterior parts with terrestrial laser scanner TX6.
Figure 4.
Surveying Abu Simbel Temple’s interior and exterior parts with terrestrial laser scanner TX6.
Figure 5.
Geodetic ground control points around the temple.
Figure 5.
Geodetic ground control points around the temple.
Figure 6.
Black and white flat targets specified within black squares that surveyed using Total Station “Trimble S5”.
Figure 6.
Black and white flat targets specified within black squares that surveyed using Total Station “Trimble S5”.
Figure 7.
(a) Distribution of selected 52 scan stations surrounding Abu Simbel Temple. Green triangles represent exterior stations in facades and red triangles represent interior stations in halls and rooms. (b) The location of the 40 scan stations inside the temple.
Figure 7.
(a) Distribution of selected 52 scan stations surrounding Abu Simbel Temple. Green triangles represent exterior stations in facades and red triangles represent interior stations in halls and rooms. (b) The location of the 40 scan stations inside the temple.
Figure 8.
(a) 3-D register point clouds in Great Abu Simbel Temple and (b) Registration report showing overall cloud-to-cloud error.
Figure 8.
(a) 3-D register point clouds in Great Abu Simbel Temple and (b) Registration report showing overall cloud-to-cloud error.
Figure 9.
An example of removing noise in hall three inside the temple can be seen in the upper and lower images. The upper picture shows point clouds with noise, and the lower one shows the cleaned model.
Figure 9.
An example of removing noise in hall three inside the temple can be seen in the upper and lower images. The upper picture shows point clouds with noise, and the lower one shows the cleaned model.
Figure 10.
Visualization of the model captured on the exterior of Abu Simbel Temple. (a) In RGB mode of the main facade and the temple door. (b) Color mode, grayscale mode, and intensity mode of the face of Ramses II.
Figure 10.
Visualization of the model captured on the exterior of Abu Simbel Temple. (a) In RGB mode of the main facade and the temple door. (b) Color mode, grayscale mode, and intensity mode of the face of Ramses II.
Figure 11.
The 3-D visual model is captured on the interior part of Abu Simbel Temple. (a) Examples of the grayscale mode of Halls and rooms inside the temple and (b) Examples of RGB mode of Halls and rooms inside the temple.
Figure 11.
The 3-D visual model is captured on the interior part of Abu Simbel Temple. (a) Examples of the grayscale mode of Halls and rooms inside the temple and (b) Examples of RGB mode of Halls and rooms inside the temple.
Figure 12.
An example in hall 2 of converting gray points clouds, or colored points into a mesh model.
Figure 12.
An example in hall 2 of converting gray points clouds, or colored points into a mesh model.
Figure 13.
Section report on the Abu Simbel Temple built in a CAD system.
Figure 13.
Section report on the Abu Simbel Temple built in a CAD system.
Figure 14.
An example of panoramic images inside Abu Simbel Temple.
Figure 14.
An example of panoramic images inside Abu Simbel Temple.
Figure 15.
The virtual tour displayed on a PC.
Figure 15.
The virtual tour displayed on a PC.
Table 1.
Advantages and disadvantages of laser scanning and photogrammetry for survey [
12,
13,
14,
15].
Table 1.
Advantages and disadvantages of laser scanning and photogrammetry for survey [
12,
13,
14,
15].
| | Laser Scanning | Photogrammetry |
|---|
| Pros | Most scanners can achieve an accuracy of within 1 mm, and this accuracy scales well across broad areas. High resolution and accuracy. Error rate is fixed and based on the capabilities of the equipment. Automated processes; reduce the possibility of human error after targets are set up and the scanner is turned on. Less time spent on site. Availability of auto-extraction/meshing software for point clouds.
| Significantly cheaper equipment. Most advancements are software-related; therefore, upgrading the equipment is unnecessary to keep up with technology. More accurate texture visualization. It can operate at various scales and dimensions.
|
| Cons | The cost of owning equipment can be exorbitant. Generally, it is necessary to upgrade physical equipment to stay up-to-date with advancements. Can produce a fuzzy point cloud on a highly textured or shiny surface.
| Compared to laser scanners, accuracy is reduced in vast spaces. Scale restrictions depend on the ability of camera lenses to preserve clarity at great distances. Less process automation increases the likelihood of user error; results are highly dependent on operator experience. More time spent on site The software for automatic extraction and meshing is not as advanced. Errors when dealing with transparent/reflective materials.
|
Table 2.
Scanning Characteristics of Trimble Station TX 6.
Table 2.
Scanning Characteristics of Trimble Station TX 6.
| Scanner/Characteristic | Trimble TX6 |
|---|
| Laser Class | 3R |
| Scanning method | Time-of-flight |
| Vertical field of view | 317° |
| Horizontal field of view | 360° |
| Minimum range | 0.6 m |
| Maximum range | 80 m to 100 m on most surfaces |
| Reflectivity | 18–90% reflectivity with a standard range of 2 m to 80 m |
| Scanning speed (pts/s) | 500,000 pts/s |
| Range systematic error | <2 mm |
| Processing software | Trimble RealWorks |
| Tilting sensor | Dual axis compensation |
Table 3.
The coordinates and the elevations of the five control points measured in the area.
Table 3.
The coordinates and the elevations of the five control points measured in the area.
| Point ID | Latitude | Longitude | Elevation (m) |
|---|
| GPS1 | N22°20′33.99352″ | E31°37′30.97976″ | 208.439 |
| GPS2 | N22°20′00.79518″ | E31°37′22.57320″ | 205.628 |
| GPS3 | N22°20′12.78655″ | E31°37′39.41321″ | 194.970 |
| GPS4 | N22°20′23.78150″ | E31°37′21.91291″ | 206.312 |
| GPS5 | N22°20′21.30797″ | E31°37′29.89393″ | 198.469 |
Table 4.
The fieldwork and office work required for creating a 3-D model for Abu Simbel Temple.
Table 4.
The fieldwork and office work required for creating a 3-D model for Abu Simbel Temple.
| Planning Phase |
|---|
| Discussion of the plan by the team took c. 10 working days |
| Fieldwork |
| Establishing and surveying geodetic network | Documenting the temple using Trimble TX6 |
| Team | Required time | Team | Required time |
1 researcher
&
1 technician | 8 working days
(2 × 8 × 8 = 128 h) | 2 researchers
&
1 technician | 6 working days
(3 × 6 × 8 = 144 h) |
| Office work |
| Processing of GPS data | Processing of laser data | From VR planning to final VR |
| Team | Required time | Team | Required time | Team | Required time |
| 1 researcher | 3 working days
(3 × 8 = 24 h) | 1 master architect
&
2 researchers | 15 working days
(3 × 15 × 8 = 360 h) | 1 architect | 20 working days
(20 × 8 = 160 h) |
| Disclaimer/Publisher’s Note: The statements, opinions and data contained in all publications are solely those of the individual author(s) and contributor(s) and not of MDPI and/or the editor(s). MDPI and/or the editor(s) disclaim responsibility for any injury to people or property resulting from any ideas, methods, instructions or products referred to in the content. |
© 2023 by the authors. Licensee MDPI, Basel, Switzerland. This article is an open access article distributed under the terms and conditions of the Creative Commons Attribution (CC BY) license (https://creativecommons.org/licenses/by/4.0/).


 ,
, 


