Abstract
Thebes, located in Boeotia in central Greece, is archaeologically and historically attested to have been an important centre ever since the Early Bronze Age. Regularly sustained glass working, testified by numerous finds in burial and settlement contexts, must have taken place since the Mycenaean times. In the current study, 35 samples of glass beads (30) and vessels (5), dating roughly from the 7th to 1st cent. BCE (Archaic to the Hellenistic/Early Roman era) are the subject of research. The aim was to assess some technological aspects of the assemblage, provide a chemical fingerprint for it and suggest a likely provenance, in an attempt to discuss issues of glass consumption and trade at a given era and culture. A combination of quasi-destructive techniques was applied, namely LA-ICP-MS and SEM-EDS for the identification of the major, minor and trace element composition. The results have provided evidence for different technological choices, reflected in the choice of raw materials and different origins are suggested for the subgroups identified in the course of the study.
Keywords:
glass beads; core formed; LA-ICP-MS; SEM-EDS; first millennium BC; Thebes Greece; provenance; technology 1. Introduction
Glass production was adopted as a cutting-edge technology in the Aegean, from the 16th cent. BCE onwards, reaching unprecedented heights at the time of the rise of the palaces with a predilection for beads and relief plaques. When the Mycenaean palaces fall by the end of the second millennium BCE (around 1190/1180 BCE), in the last phase of the Late Bronze Age, the complex and sophisticated Mycenaean level of culture reverts to a much simpler one. It is observed that the number of beads used in post-palatial times decreases, until they finally disappear [1].
At the beginning of the early Iron Age, there is a relevant, yet small rise in the numbers of glass objects retrieved from archaeological contexts in Greece and particularly from the late 10th cent. BCE onwards. However, it is during the middle 7th cent. BCE that there is a noticeable increase in the quantity of glass objects and especially glass vessels. It is in this period that the introduction of core formed vessels, the so-called Mediterranean vessels, occurs with the revival of the technique, which first appeared possibly in Mesopotamia or Egypt some time in the Late Bronze Age. These vessels constitute the largest numbers of glass vessels circulated in the Mediterranean area and were manufactured between the mid-6th cent. BCE and the beginning of the 1st cent. CE. In addition, from the late 5th cent. BCE onwards colourless or/and transparent slightly coloured glass appears in the Greek region in parallel with the core formed vessels [2,3].
In the Hellenistic period, there is an assumed growth in artistic production with parallel technological advances, as suggested by the abundance of glass artifacts retrieved. Overall, during the Hellenistic period the large increase in the production of glass made objects available to the middle class [4]. This continued until between the mid-second century BCE and the first half of the first century CE, when a series of discoveries dramatically changed the course of glassmaking with much simpler and cheaper methods of production and new techniques, such as glass blowing [5,6]. Mass production of Late Hellenistic moulded bowls occurred in the Levant, probably in Beirut. The latter seems to have been coupled with an increase in the demand for luxury items in new markets occurring from longer distance trade.
Thebes
Thebes held a prominent role in glass consumption ever since its establishment in Greece. Located in Boeotia, central Greece, archaeological evidence has demonstrated its importance since the Early Bronze Age (Figure 1). During Mycenaean times, Thebes was a first-order centre as the seat of a palatial administration [7]. Its geographical location, at the crossroads of central Greece, made this region a focal point of cultural, economic, and political developments [8]. Secondary glass production may have occurred occur, as implied by numerous finds in burial and settlement contexts, though this does not constitute enough proof. It has also been suggested that Thebes could have been a centre of primary glassmakingIf this is the case this industry is clearly set apart from the equivalent of other major Mycenaean centres [9]. Nevertheless, in the absence of industrial glass debris there remains a contentious suggestion and an avenue for more research in hope for more evidence to support glassmaking in Thebes.
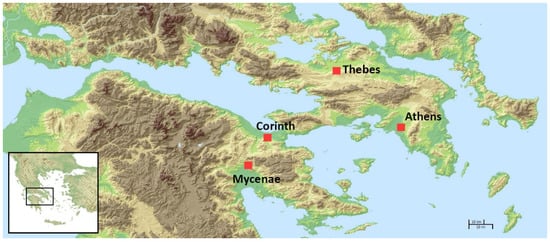
Figure 1.
Map showing the location of Thebes in central Greece and major sites relevant to the discussion.
The area of Boeotia in general did not escape the consequences of the collapse of the major Mycenaean palatial centres around 1200 BCE. Boeotia was drastically depopulated and was gradually controlled by a Thessalian tribe, the Boiotoi [8,10]. Some signs of reoccupation in the area of the palace at Thebes are detectable from the 12th century, but this phase shows a low level of activity and there is no reason to believe that the site recovered to a prestigious level following the destruction, since no large tombs, wall paintings, or other architectural refinements, no workshops with luxury goods, and no writing seem to have been part of the activity in these times. Thus, the archaeological record suggests that the region fell into decline, only to rise again in the eighth century [10,11].
It was by 8th–7th cent. BCE that Boeotia had become one of the most vigorous artistic and cultural centres of Greece [11]. At this time, the Greek world underwent the same great changes that took place all over the Aegean. It is then that it gradually developed its famous political landscape of several hundreds of city-states, each ranging from a few hundreds to around ten thousand residents. By the 6th cent. BCE at least five hundred such poleis were established [12]. It is certain that Greek poleis were a community of citizens. As Kõiv [13] discusses, we have every reason to believe that most of the Greek communities at this time witnessed the emergence of powerful and comparatively narrow elites, supported by both archaeological and literary evidence. The 8th cent. BCE was the end of the Dark Age and the inception of the Archaic period, witnessed by a growth in the wealth displayed at burial sites. The Archaic era was not only the period of the emergence of urbanism and of the formation of polis, but also an era of an active aristocratic display of wealth and power [14]. In all probability, the aristocracy was the social group which mainly financed the building of the first monumental temples. In searching for new forms of government and administration to manage the new complexity of the poleis, the introduction of coinage must have made administration and organization more manageable. We have every reason to believe that Boeotian cities and Thebes followed this political and societal transformation.
In these times of huge social change, the consumption of glass seems to have increased and archaeological research has brought to light a vast array of finds dating to all later periods. During the late Classical and Early Hellenistic centuries, Boeotian cities reached their maximum size. The gradual growth of the city of Thebes in terms of population, wealth and power culminates in the Classical period as expressed by the second ring of fortifications alluded to in Xenophon and Arrian [15]. The development of the area of Greater Thebes in the Archaic and Classical periods provided the opportunity to shape the area according to the communal needs of the rising polis. The increasing elaboration and constitutionalisation of the city’s social and political life was paralleled by a physical monumental expansion and the emergence of an additional new network of boundaries [15]. As Manolova [16] suggests, the construction of the wall of Greater Thebes shows how political development and physical space interact and develop in parallel over time in the polis. The siege in 335 BCE by Alexander caused both the destruction of the wall and Theban power. In the Late Hellenistic era after ca. 150 BCE and into Early Roman Imperial times, Boeotian cities mostly contracted in size, while their hinterlands saw a dramatic reduction of activity [17]. When Pausanias visited Thebes in the second half of the second century, the ongoing decline taking place in the previous centuries had considerably reduced the size of the city, which was restricted to a citadel.
Therefore, with this wealth of activity and information and major questions remaining obscure, Thebes offers an ideal setting in attempting to address them. With respect to glass studies, answers to questions related to the nature of production, whether primary or secondary, to technology and provenance issues still need to be obtained.
2. Materials and Methods
2.1. The Samples
In the current study a set of glass beads and vessels dating from between approximately the 7th to 1st cent. BCE are investigated using complementary techniques, aiming to identify the technology use to make them and determine the provenance of the glass, in an attempt to enhance our understanding of the first millennium BCE glass industry. The assemblage comprises 30 beads and 5 fragments of vessels, all of which were found in burial contexts (Figure 2, Table 1). They were found during works undertaken under the railway lines (excavation of Hellenic Railways Organisation) on the Thebes–Mourikion road axis, in the so-called OSE necropolis, at a distance ca. 2 km southeast from the town’s centre [18]. The site comprised 843 excavated tombs of which 23 are Early proto-Hellenic, 3 Late Geometric, 34 Archaic, 504 Classical, 270 of the Hellenistic era, and 9 Early Roman. The cemetery crossed an 8 m wide avenue, part of which was uncovered during the excavation. The tombs were adjacent to the curbs of the road and extended on either side to a width of more than 300 m and an unknown length. The contents of the tombs (approximately 7000 vessels, 2000 figurines and thousands of small objects) were varied and sometimes very rich.
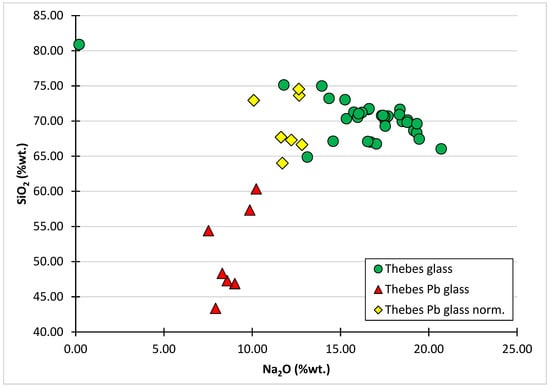
Figure 2.
Correlation between silica and soda for the Theban glasses. There are two distinct groups, based on their soda and silica levels. The low sodium group has elevated amount of Pb.

Table 1.
Compositional data for major, minor and trace elements from LA-ICP-MS analysis.
In the southern area of the excavation, the 291 tombs (N 279–570) uncovered are representative of all kinds of tombs that survive in the Boeotian cemeteries of historical times. From the Classical period onwards, a clear preference toward lacquered and tiled tombs was found. The tombs were constructed at various depths, but did not correspond to different chronological phases, thus, later tombs are often present in greater depth than the earlier, due to ignoring previous burials and over-cutting. The tombs of the Archaic period are mainly located on either side of the ancient road that was already in use, whilst those of the Classical and Hellenistic periods were revealed throughout the excavated area and appear to have been used as a necropolis without interruption until the 1st cent. BCE [18].
2.2. Methodology
The preparation of samples followed a standard procedure implemented in glass studies. A small fragment of glass (less than 2 mm wide) was removed from the samples using diamond cutting discs and cutting pliers. The small fragments were embedded in epoxy resin blocks which were ground using SiC papers of various grits (800, 1200, 2000, 4000) and were fine polished using clothes and diamond pastes of 3–6 μm.
A combination of quasi-destructive techniques was used to analyse the samples in order to identify major, minor and trace elements. In particular, LA-ICP-MS instruments were used, one is located at the British Geological Survey (BGS), Nottingham (UK) and the other at the National Institute of Chemistry (NIC), Ljubljana (Slovenia). Different sub-sets of samples were measured at the two LA-ICP-MS facilities, and comparison between these sets is therefore not possible. Furthermore, SEM-EDS was conducted at the Science and Technology in Archaeology and Culture Research Center (STARC), The Cyprus Institute.
The LA-ICP-MS facility in BGS consists of a NewWave UP193FX excimer (193 nm) laser system coupled to an Agilent 7500 series ICP-MS. Laser ablation craters were set at 70 μm, the laser being fired for 45 s at 10 Hz and a typical fluence of 2.8 J cm−2. The protocol followed is described analytically elsewhere [19]. Calibration of the system was performed using the NIST SRM610 trace element glass standard, while NIST SRM612 was used for quality control purposes (Table 2).
Table 2.
Quality control of the LA-ICP-MS facility at BGS using the NIST 612 standard reference material.
The LA-ICP-MS facility at the NIC comprises an Analyte G2 excimer laser system (193 nm, Teledyne CETAC Technologies, Omaha, NE, USA) interfaced with an Agilent 7900 series ICP-MS. All ablation areas were pre-ablated before measurement to clean the surface contamination, followed by analysis in line scanning mode (three lines per sample with a length of ca. 0.6 mm per line). LA-ICP-MS conditions were as follows: beam size, 80 μm (square mask); fluence, 4.45 J cm−2; repetition rate, 10 Hz; scanning speed, 10 μm s−1; dwell time, 0.1 s per element (55 elements measured). Quantification was by sum normalization calibration according to protocols developed previously [20]. The data was set against the reported values in Corning Museum Glass B, C and D reference materials (Table 3). Alongside, Corning B reference material was measured by both facilities and the data obtained is reported in Table 4.
Table 3.
Quality control of the LA-ICP-MS facility at NIC using the Corning B, C and D standard reference materials.
Table 4.
Corning B reference material measured from the BGS and NIC facilities.
Part of the assemblage was analysed using a Zeiss Evo 15 scanning electron microscope (SEM), coupled with an Ultim Max EDS Detector (Oxford Instrument) housed at the Science and Technology in Archaeology and Culture Research Center (STARC), Cyprus Institute. The accelerating voltage was set at 20 kV, with a beam current of 1 nA and a working distance of 8.5 mm. The accuracy of the instrument calibration was tested using Corning A and B standard reference materials. The detection limit for most of the oxides analysed is better than approximately 0.1 wt%. When the concentrations of the analysed samples are above this threshold, the analytical results have an error margin lower than 10% (and in most cases lower than 5%).
3. Results
Glass from Thebes falls into the general soda–lime–silica category, with sand used as the main component for most glass samples to be fused and with a mineral source of flux, most probably natron, since both potash and magnesia contents are below 1.5 wt%. Five glass beads (TH8, TH9, TH13, TH14, TH15) and two opaque yellow glass decorative stripes of core formed vessels (TH23y, TH24y) exhibit different chemical compositions and will be discussed later in this study.
Natron is the raw material that lowers the melting point of the glass former (silica derived from sand) through the incorporation of soda (Na2O) in the glass batch and the presence of Na+ in the silicate matrix. Interestingly, the relative soda contents of the samples distinguishes them in two groups, one with a high sodium content (11.8–20.7 wt% Na2O) and the other with relatively lower sodium (7.5–10.2 wt% Na2O), while there is one outlier with close to zero sodium and silica levels around 80 wt%, showing that the glass is highly weathered, altered and leached (Figure 2). The lower sodium samples are explained by high concentrations of lead (Pb) and comprise five beads and two decorative stripes. In Figure 2 we exhibit the reduced values of the low sodium group (with excluding the lead content removed and normalised to 100%), and we see that, in some cases, sodium is still rather lower compared to the other group of samples, whereas the silica content is rather constant between 65–75 wt%.
Slight differences are also noted in other major and minor elements, as seen in the box plots (Figure 3). In Figure 3 we can also note that the lead glass group exhibits a lower range in the minor oxides compared to the normal group, suggesting better control of the raw materials and different technological choices have been made-though smaller sample numbers in high lead glasses could also account for this. Thus, it can be said that these distinct levels may imply the use of different raw materials, or a restricted source, the latter also being evident in specific trace elements associated with the raw materials (Figure 4).
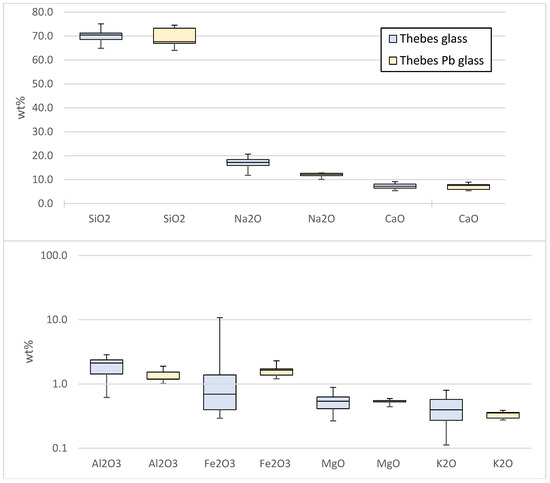
Figure 3.
Box plots of major and minor oxides for Theban samples comparing the two groups for the corresponding oxides. The Theban Pb glass data are normalized, excluding the Pb content. The whiskers show minimum and maximum values, while the line in the box represents the median values of the corresponding oxides.
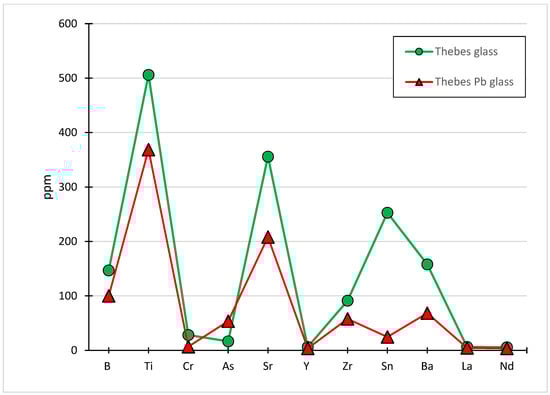
Figure 4.
Trace element concentrations of Theban glass. The Pb glass group has different trace element concentrations suggesting distinct patterns in the technological choices with respect to the selection of raw materials, as seen by the clear difference in the levels exhibited, and possibly different origin.
The group of five green opaque beads (TH8, TH9, TH13, TH14, TH15) mentioned earlier exhibits a different compositional pattern, since they show elevated values of PbO (av. PbO 29.1 wt%). Lead can be added to the glass batch as an opacifier, a stabilizer or a flux, to make lead glasses. It has been used continuously, but in relatively small quantities, as a component of strongly coloured glass across Europe, the Mediterranean and the Middle East since the emergence of glass, both to make glass beads and for glazes and enamel. A very unusual bead from the palace of Amenhotep III contains 76 wt%. PbO and only 19 wt% silica [21]. Soda–lime–lead glasses were used in Roman times and continued in later periods. From the 10th to 14th cent. AD, small quantities of lead glass were manufactured, with the lead for the glass considered either a waste product from extensive early silver production [22] produced by oxidising lead metal, or used in mineral form, as seems to be the case for Islamic and much medieval European high lead glass. The beads examined here yield a characteristic green opaque glass (Figure 5a). The high PbO levels can be attributed to the colouring technique used. A combination of lead oxide with antimony would secure the opacification of the beads rendering them yellow. The addition of cupric oxide would then yield the desired colouring effect, that of green: these samples exhibit elevated values of PbO, Sb2O3 and CuO (av. 25 wt%, 3 wt% and 2 wt% respectively). It is interesting to note that three of these samples were retrieved from the same tomb (Tomb 404) dating to the Classical era, whereas the other two were collected from a different tomb (51) dating to the Hellenistic period.
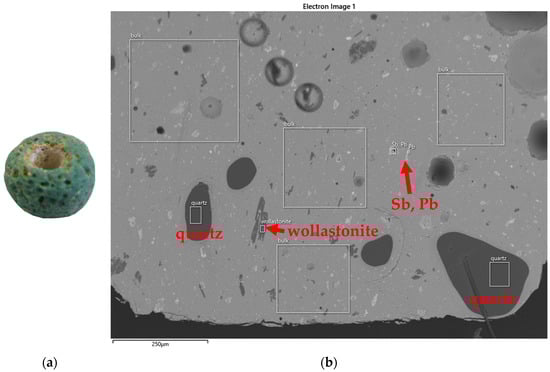
Figure 5.
(a) Digital image and (b) an SEM micrograph of bead TH13 (low Na high Pb bead). Various undissolved particles, mainly lead antimonate (Sb, Pb), rounded quartz particles and wollastonite can be seen in the SEM image.
The two opaque yellow glass decorative strips also exhibit high Pb contents (av. PbO 20.6 wt%). Furthermore, these two samples exhibit a high antimony concentrations (av. Sb2O3 2.9 wt%), showing that lead antimonate has been used as the colorant [23,24].
In recent decades, the identification of several broad compositional groups based on major and minor oxides as characteristic diagnostic elements has been the focus of research on glass dating from the mid- to late-first millennium CE. The main groups of first millennium glass can be easily distinguished in an Al2O3/SiO2 vs. TiO2/Al2O3 biplot, since these three oxides are incorporated in the glass with the sand. Therefore, their correlation can show potentially distinctive glassmaking traditions and regions by the use of different sands.
Even though they are of earlier periods, by plotting the Theban samples using these ratios, we can see that the majority of samples (27 out of 40) cluster in the low TiO2/Al2O3 region as indicated by the dashed line (Figure 6). In addition, there is a clear separation between the high Pb groups; the four beads form a group with a relatively high TiO2/Al2O3 ratio, while the two yellow decorative trails are closely clustered in an area having much lower TiO2/Al2O3 content. The lower TiO2/Al2O3 ratio, as indicated by the dashed line, has been attested in late antique glass assemblages, which were manufactured in the Levantine coast (for characteristic examples see [25,26]). These, however, were fabricated a few centuries later than the Theban glass, have a rather elevated Al2O3/SiO2 ratio mainly because of the generally higher concentrations of alumina compared to Theban samples. In particular, the Levantine glasses has Al2O3~3.2 wt%, while the Theban glasses have Al2O3~1.8 wt%.
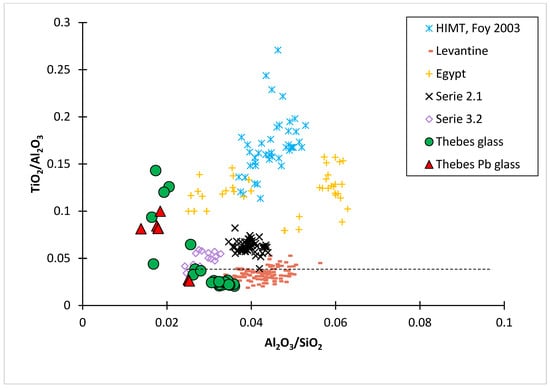
Figure 6.
The glass from Thebes can be distinguished in two groups as indicated by the dashed line. Both groups contain high and low soda samples, as seen in Figure 1. The samples with low TiO2/Al2O3 ratio may have a Levantine origin as they are in the same range as the Levantine I and II published by Freestone [25], whereas the rest of the Theban glasses are probably from an Egyptian origin. Published data: HIMT, Serie 2.1, Serie 3.2 [27]; Egypt [28].
These groupings can be also noted in the trace elements incorporated in the glass by sand. In particular, we tested the correlation between Y2O3 and ZrO2 (Figure 7) both of which can be indicative of a different origin, be it Egypt (high in ZrO2) or glass made in the Levant, which is proportionately richer in Y2O3 [29]. According to the plot, the majority of samples from Thebes correlate well with the “Levantine” area of low ZrO2 and high Y2O3, while the rest are scattered in the high ZrO2 area. There are three samples with higher ZrO2 content, and they do not correlate with any of the Egyptian samples. This might reflect different technological choices made which can be associated to the colorants used for this set of beads. We cannot exclude that the excess of ZrO2 might also reflect heavy contamination during the process of the raw material preparation [30]. Therefore, for the high ZrO2 Theban samples we may assume a different source, suggesting a separate glassmaking tradition. These samples are all of blue colour, with the exception of TH17, TH25, TH28 (black, amber, and colourless, respectively) and no obvious correlation between their coloration and trace element patterns can be seen. Interestingly, the high lead beads cluster very well (dashed ellipse in Figure 7), suggesting another manufacturing tradition and, hence, provenance, from the rest of the Theban glass. In this graph the two yellow decorative trails are separated but still have the same positive correlation as the Levantine cluster.
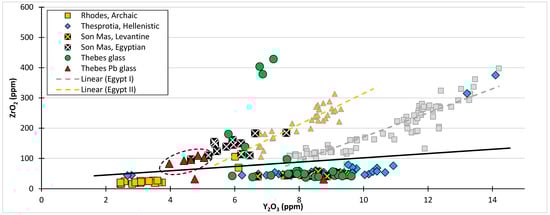
Figure 7.
ZrO2 vs. Y2O3. The Theban samples are well separated with one cluster showing similarities with Levantine glass (the low ZrO2), the second cluster having elevated ZrO2 suggesting a possible Egyptian origin, even though it does not correlate well with both Egypt I and II groups (dashed lines) and the third cluster consisting of three samples having very high ZrO2 possibly due to contamination factors. Plotted on the same graph are analyses from Archaic Rhodes and Son Mas (Classical to Roman). The black line represents the separation between Levantine and Egyptian glass compositions, as proposed by Gratuze [29].
Furthermore, we test the correlation between the Cr/La and Zr/Ti ratio (Figure 8). Both ratios have been used to identify provenance of plant ash LBA glass from Mesopotamia and Egypt [31]. However, the samples of this study and the published parallels from Son Mas (Spain) and Thesprotia (Greece) [32,33] compared in Figure 8 are natron glasses. In the current study we notice that all samples exhibit Cr/La values between 1.0 and 2.5 and Zr/Ti ratio ranging from slightly less than 100 to almost 300. We can distinguish a tight cluster of the majority of the samples, including the two high Pb yellow decorative trails and a second cluster with the high Pb beads. In addition, there is a cluster of three samples with the highest Zr/Ti ratio which may be interpreted as contamination (as discussed earlier) and a group of four correlated samples. The grouping distinguished in Figure 6 and Figure 7 is also seen in this case, suggesting that this comparison traditionally used for plant ash glasses may also prove effective in comparing natron glasses. However, this should be treated with caution at this stage in the absence of more analytical data.
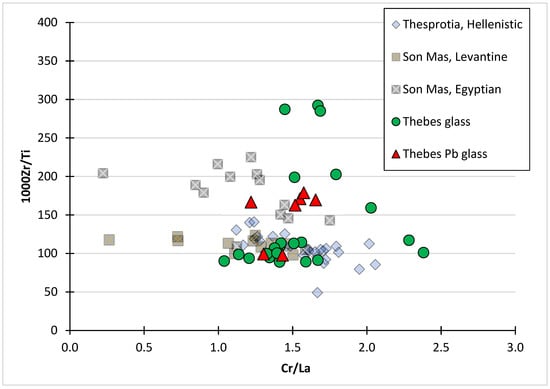
Figure 8.
A plot of Cr/La versus Zr/Ti ratio with the samples exhibiting low Cr/La values (1.0 < Cr/La < 2.5) and rather elevated Zr/Ti ratio. A tight cluster of the majority of glass, including the two decorative trails (red triangles) can be seen. This cluster has low values for both ratios, distinguishing them from the rest of the samples. The five high Pb beads are clustered together, as expected, while there are seven beads and a vessel with varying values of these ratios four of which are correlated.
A similar behaviour can be noted when the Ti/Nd and Zr/Hf ratios are plotted (Figure 9). These elements are associated with the sand and therefore can provide useful information regarding the use of different sand sources. In particular, the Nd in natron-based glass originates from the heavy or non-quartz mineral fraction of the silica raw material that is in most sand [34]. In addition, Ti is generally correlated with iron oxides [35] or with specific heavy minerals, such as rutile, ilmenite, titanite and chromite which can be present in sands as impurities [36]. Zr and Hf are two elements associated to each other and are accumulated in the heavy mineral zircon [37,38] which can be found in sands. There is a specific threshold regarding the amount of Hf in Egyptian and Levantine glass which can be interpreted by the movement/washing off of the sand, due to geological and environmental phenomena (rivers which drain inland to the Levantine coast or longshore transport from the Nile delta northwards up to the Levantine coast). Therefore, we may assume that Egyptian sands and, hence, glass made from them have rather elevated amounts of Hf in the order of few ppms (2–4 ppm), while, on the other hand, Levantine glass exhibits lower than 2 ppm of Hf [37].
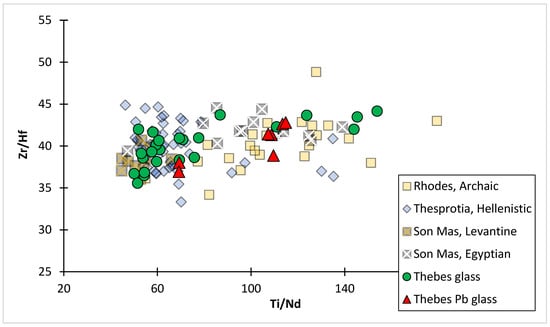
Figure 9.
Three groups are formed: one with low Ti/Nd ratio (50–87), one with moderate (100–124) and one with high (over 140). The Zr/Hf ratio is quite consistent for the three groups, varying between 35 and 45.
In Figure 9 we can distinguish two groups: one with low Ti/Nd ratio (50–87) and one with high (100–150). Interestingly the Zr/Hf ratio seems to be constant for the two groups between 35 and 45. According to Oikonomou [38], a low Ti/Nd (below 80) ratio corresponds to the Levantine provenance, while values above 90 to the Egyptian provenance. This can be justified through the special geochemistry of soils which in the Levantine coast have less titania than the Egyptian area [39,40,41]. The three glasses already mentioned in the previous graphs, having most likely a contamination factor, belonging to the second group exhibit the highest Ti/Nd ratio, setting them again apart from the rest of the assemblage. The five high lead beads are plotted in the centre of the graph, while the two yellow decorative trails are clustered with the majority of samples.
4. Discussion and Conclusions
Five glass beads (TH8, TH9, TH13, TH14, TH15) and two yellow decorative trails (TH23y, TH24y) yielded different chemical composition from the rest of the samples tested, exhibiting high lead oxide levels. These samples all date to Classical era contexts. The beads have been found to have a correlation with the Egyptian glass industry based on their trace element analysis. The high lead beads cluster very well, indicating a different manufacturing tradition and, possibly provenance, from the rest of the Theban glass. As for the yellow decorative trails, even though they exhibit high lead contents, they do not seem to be linked to the rest of the samples with high lead, since the base glass composition and the trace elements indicate a possible Levantine origin and, additionally, they correlate well with the majority of the Theban samples.
Therefore, based on the analytical data, most of the samples can be attributed to a likely Levantine origin. These are samples deriving from Archaic, Classical and Hellenistic contexts. The samples with higher zirconium do not correlate with any of the Egyptian samples and this can be interpreted as a contamination from the manufacturing process, although, a different origin is also a likely explanation.
The overall results suggest that different trade routes were used to supply glass in this period. It is interesting to note that the lead glasses, part of the assemblage attributed to a Levantine origin, and the high zirconium samples all date to Classical era contexts. The latter is hardly surprising if we take into account that during the late Classical and Early Hellenistic centuries, Boeotian cities within and sometimes outside the Confederacy (Koinon) reached their maximal size. Trade activity and inter-city connections were well established, and they would have secured the transfer of raw glass, as already conducted since the Late Bronze Age. Importantly, special permanent trading places, where merchants of different nationalities met to trade, sprang up in the East Mediterranean, for example, at Al Mina on the Orontes river (modern Turkey), Ischia–Pithekoussai (off the coast of modern Naples), Naucratis in Egypt, and Gravisca in Etruria [42], obviously facilitating routes and intra-state trade links. With Thebes maintaining trade links with Athens and Corinth, the latter could have also acted as mediators with other areas further away.
It is also well documented that from 600 BCE, trade was greatly facilitated by the construction of specialised merchant ships and the Diolkos haulway across the Isthmus of Corinth. The latter was actually a paved route which allowed for the ships to be moved overland avoiding the dangerous and time-consuming circumnavigation of the Peloponnese. It must have been a successful choice, since the haulway stayed in use at least until the first century BCE [43].
It cannot be deduced confidently whether glass was worked locally, or if these specific artifacts studied here reached Thebes as finished products. The types represented are rather widespread in the East Mediterranean and the Aegean. In the Archaic era, the inception of colonization took place, in which Boeotia did not participate actively, perhaps because the social upsets in its own dominion were not of high intensity to highlight the need for expansion and more space and thus, no further enhancement of the trade networks would have occurred. There were, though, many imported products, initially from Corinth and then from Attica and the cities that were members of the Koinon using a common numismatic, clearly facilitating movement of goods among them.
The end of the period is marked by the Persian wars, which signalled the temporary political downgrading of Thebes. The period was characterized by the rivalry between Athens and Sparta, as well as between Thebes and Athens. Thebes emerged weakened from the Persian Wars, but rapidly recovered and dominated the Koinon of the Boeotians and, almost a century after, it became the head of Greece as a whole (the Theban Hegemony). Despite the frequent military events, the classical period is characterized by the high quality of its art, as reflected in pottery, sculpture, and architecture. During the classical period, Boeotian pottery and terracotta figurines workshops were remarkable for their productivity. Strange as it may seem due to the political rivalry, the artistic influence of Athens was very strong, and there was no lack of imported Attic pottery, which was regarded as a luxury item [11].
We cannot assume that no local glass production took place in Thebes in these times; glass working is certainly a possibility, even if not proven. With numerous thriving workshops exploiting other pyrotechnologies and with glass being present for more than 1000 years, a certain level of expertise would have been acquired. The absence of industrial debris to date does not help towards clarifying this issue. Overall, based on the present data and the results of the current study, we can strongly suggest different trading routes were exploited by glass merchants from Classical Thebes, adding the glass to the already documented thriving trade networks in which Thebes participated during Classical times.
Author Contributions
Conceptualization, A.O. and M.K.; Formal analysis, A.O., V.S.Š., J.T.v.E. and S.C.; Investigation, A.O. and M.K.; Resources, M.K.; Data curation, V.S.Š., J.T.v.E. and S.C.; Writing—original draft, A.O. and M.K.; Writing—review & editing, A.O., M.K., J.T.v.E., N.Z., S.C. and J.H. All authors have read and agreed to the published version of the manuscript.
Funding
This research received no external funding.
Data Availability Statement
Not applicable.
Conflicts of Interest
The authors declare no conflict of interest.
References
- Kaparou, M.; Oikonomou, A. Mycenaean through Hellenistic glass in Greece: Where have we got to? Archaeol. Anthropol. Sci. 2022, 14, 12. [Google Scholar] [CrossRef]
- Weinberg, G. Glass Vessels in Ancient Greece, Their History Illustrated from the Collection of the National Archaeological Museum, Athens. In Publications of the Archaeologikon Deltion No. 47; Archaeological Receipts Fund, Ministry of Culture: Athens, Greece, 1992. [Google Scholar]
- Stern, E.M. Ancient Glass in Athenian Temple Treasures. J. Glass Stud. 1999, 41, 19–50. [Google Scholar]
- Ignatiadou, D. Glass in antiquity. In Glass Cosmos; Adam-Veleni, P., Ed.; Archaeological Museum of Thessaloniki no 6; Hellenic Ministry of Culture and Tourism: Athens, Greece, 2010; pp. 19–24. [Google Scholar]
- Barag, D.P. Socio-economic observations on the history of ancient glass. In Proceedings of the Annales du 17e Congrès de l’AIHV, Annales du 17e Congrès de l’Association Internationale pour l’Histoire du Verre, Antwerp, Belgium, 4–8 September 2006; University Press Antwerp: Brussels, Belgium, 2009; pp. 3–7. [Google Scholar]
- Henderson, J. Ancient Glass: An Interdisciplinary Exploration; Cambridge University Press: New York, NY, USA; Cambridge, UK, 2013; pp. 205–223. [Google Scholar]
- Rockwell, N. Thebes: A History, 1st ed.; Routledge: London, UK, 2017. [Google Scholar] [CrossRef]
- Buck, R.J. A History of Boeotia; University of Alberta Press: Edmonton, AB, Canada, 1979. [Google Scholar]
- Nikita, K.; Henderson, J. Glass Analyses from Mycenaean Thebes and Elateia: Compositional Evidence for a Mycenaean Glass Industry. J. Glass Stud. 2006, 48, 71–120. [Google Scholar]
- Aravantinos, V.L. The Archaeological Museum of Thebes; Olkos: Athens, Greece, 2010. [Google Scholar]
- Aravantinos, V.L. Thebes and Boeotia. In A Companion to the Archaeology of Early Greece and the Mediterranean; Lemos, I.S., Kotsonas, A., Eds.; Wiley Blackwell: Hoboken, NJ, USA, 2020; Volume 1, pp. 763–785. [Google Scholar]
- Morris, I.; Knodell, A. Greek Cities in the First Millennium BCE; Cambridge University Press: Cambridgeshire, UK, 2015. [Google Scholar] [CrossRef]
- Kõiv, M. Egalitarianism and hierarchies: Early Greek polis in the context of the Ancient Near Eastern and Mediterranean city-state cultures. Alter Orient Altes Testam. 2011, 390, 105–151. [Google Scholar]
- Hansen, M.H. Polis. An Introduction to the Ancient Greek Citystate; Oxford University Press: New York, NY, USA, 2006. [Google Scholar]
- Hölkeskamp, K.-J. The Polis and its Spaces: The Politics of Spatiality. Ordia Prima 2004, 3, 25–40. [Google Scholar]
- Manolova, T. The Mytho-Historical Topography of Thebes. Hirundo 2009, 8, 88–94. [Google Scholar]
- Bintliff, J. City-archaeology in Boeotia: Continuity and discontinuity, localism and globalisation. In La Béotie de L’archaïsme à L’époque Romaine. Frontières, Territoires, Paysages; Lucas, T., Muller, C., Oddon-Panissie, A.C., Eds.; Editions de Boccard: Paris, France, 2019; pp. 121–133. [Google Scholar]
- Bonanno-Aravantinos, M. New inscribed funerary monuments from Thebes. In The Epigraphy and History of Boeotia: New Finds, New Prospects; Papazarkadas, N., Ed.; Koninklijke Brill NV: Leiden, The Netherlands, 2014; pp. 254–310. [Google Scholar]
- Henderson, J.; Chenery, S.; Faber, E.; Kroger, J. The use of electron probe microanalysis and laser ablation-inductively coupled plasma-mass spectrometry for the investigation of 8th–14th century plant ash glasses from the Middle East. Microchem. J. 2016, 128, 134–152. [Google Scholar] [CrossRef]
- Van Elteren, J.T.; Tennent, N.H.; Šelih, V.S. Multi-element quantification of ancient/historic glasses by laser ablation inductively coupled plasma mass spectrometry using sum normalization calibration. Anal. Chim. Acta 2009, 644, 1–9. [Google Scholar] [CrossRef] [PubMed]
- Brill, R.H. Chemical Analyses of Early Glass, Vols I/II, The Catalogue/The Tables; The Corning Museum of Glass: Corning, NY, USA, 1999. [Google Scholar]
- Wedepohl, K.H.; Baumann, A. Isotope composition of medieval lead glasses reflecting early silver production in Central Europe. Miner. Depos. 1997, 32, 292–295. [Google Scholar] [CrossRef]
- Zacharias, N.; Karavassili, F.; Das, P.; Nicolopoulos, S.; Oikonomou, A.; Galanis, A.; Rauch, E.; Arenal, R.; Portillo, J.; Roque, J.; et al. A novelty for cultural heritage material analysis: Transmission Electron Microscope (TEM) 3D electron diffraction tomography applied to Roman glass tesserae. Microchem. J. 2018, 138, 19–25. [Google Scholar] [CrossRef]
- Nicolopoulos, S.; Das, P.; Bereciartua, P.J.; Karavasili, F.; Zacharias, N.; Pérez, A.G.; Galanis, A.S.; Rauch, E.F.; Arenal, R.; Portillo, J.; et al. Novel characterization techniques for cultural heritage using a TEM orientation imaging in combination with 3D precession diffraction tomography: A case study of green and white ancient Roman glass tesserae. Herit. Sci. 2018, 6, 64. [Google Scholar] [CrossRef]
- Freestone, I.C. The provenance of ancient glass through compositional analysis. In Material Issues in Art and Archaeology 7; Vandiver, P., Mass, J., Murray, A., Eds.; Materials Research Society Symposium Proceedings 852; Materials Research Society Symposium: Warrendale, PA, USA, 2005; pp. 195–208. [Google Scholar]
- Phelps, M.; Freestone, I.C.; Gorin-Rosen, Y.; Gratuze, B. Natron glass production and supply in the late antique and early medieval Near East: The effect of the Byzantine-Islamic transition. J. Archaeol. Sci. 2016, 75, 57–71. [Google Scholar] [CrossRef]
- Foy, D.; Picon, M.; Vichy, M.; Thirion-Merle, V. Caractérisation des verres de la fin de l’Antiquité en Méditerranée occidentale: L’émergence de nouveaux courants commerciaux. In Echangés et Commerce du Verre Dans le Monde Antique; Foy, D., Nenna, M.-D., Eds.; Instrumentum Monographies 24; Mergoil: Montagnac, France, 2003; pp. 41–85. [Google Scholar]
- Gratuze, B. Analyse Non Destructive D’objets en Verre par des Méthods Nucléaires. Application à L’étude des Estampilles et Poids Monétaires Islamiques. Unpublished. Unpublished Ph.D. Thesis, University of Orleans, Orléans, France, 1988. [Google Scholar]
- Gratuze, B. Glass characterisation using Laser Ablation Inductively Coupled Plasma Mass Spectrometry methods. In Modern Methods for Analysing Archaeological and Historical Glass; Janssens, K., Ed.; John Wiley & Sons Ltd.: Hoboken, NJ, USA, 2013; pp. 201–234. [Google Scholar]
- Rehren, T.; Pusch, E. Crushed rock and molten salt? Some aspects of the primary glass production at Qantir/Pi-Ramesse. In Vitreous Materials in the Late Bronze Age Aegean; Jackson, C.M., Wager, E.C., Eds.; Sheffield Studies in Aegean Archaeology; Oxbow: Oxford, UΚ, 2008; pp. 14–33. [Google Scholar]
- Shortland, A.; Rogers, N.; Eremin, K. Trace element discriminants between Egyptian and Mesopotamian Late Bronze Age glasses. J. Archaeol. Sci. 2007, 34, 781–789. [Google Scholar] [CrossRef]
- Van Strydonck, M.; Gratuze, B.; Rolland, J.; De Mulderd, G. An archaeometric study of some pre-Roman glass beads from Son Mas (Mallorca, Spain). J. Archaeol. Sci. Rep. 2018, 17, 491–499. [Google Scholar] [CrossRef]
- Oikonomou, A.; Henderson, J.; Chenery, S. Provenance and technology of fourth-second century BC glass from three sites in ancient Thesprotia, Greece. Archaeol. Anthropol. Sci. 2020, 12, 269. [Google Scholar] [CrossRef]
- Brems, D.; Ganio, M.; Degryse, P. The Sr-Nd isotopic fingerprint of sand raw materials. In Glass Making in the Greco-Roman World. Results of the ARCHGLASS Project; Degryse, P., Ed.; Leuven University Press: Leuven, Belgium, 2014; pp. 51–68. [Google Scholar]
- Wedepohl, K.H.; Simon, K.; Kronz, A. Data on 61 chemical elements for the characterization of three major glass compositions in Late Antiquity and the Middle Ages. Archaeometry 2011, 53, 81–102. [Google Scholar] [CrossRef]
- Brems, D.; Degryse, P. Trace elements in sand raw materials. In Glass Making in the Greco-Roman World. Results of the ARCHGLASS Project; Degryse, P., Ed.; Leuven University Press: Leuven, Belgium, 2014; pp. 69–85. [Google Scholar]
- Barfod, G.H.; Freestone, I.C.; Lesher, C.E.; Lichtenberger, A.; Raja, R. ‘Alexandrian’ glass confirmed by hafnium isotopes. Sci. Rep. 2020, 10, 11322. [Google Scholar] [CrossRef] [PubMed]
- Oikonomou, A. Hellenistic core formed glass from Epirus, Greece. A technological and provenance study. J. Archaeol. Sci. Rep. 2018, 22, 513–523. [Google Scholar] [CrossRef]
- Freestone, I.C.; Wolf, S.; Thirlwall, M. Isotopic Composition of Glass From The Levant and South-Eastern Mediterranean Region. In Isotopes in Vitreous Materials; Degryse, P., Henderson, J., Hodgins, G., Eds.; Leuven University Press: Leuven, Belgium, 2009; pp. 31–52. [Google Scholar]
- Brems, D.; Degryse, P. Trace Element Analysis in Provenancing Roman Glass-Making. Archaeometry 2014, 56, 116–136. [Google Scholar] [CrossRef]
- Freestone, I.C.; Degryse, P.; Lankton, J.; Gratuze, B.; Schneider, J. HIMT, glass composition and commodity branding in the primary glass industry. In Things That Travelled: Mediterranean Glass in the First Millennium AD; Rosenow, D., Phelps, M., Meek, A., Freestone, I., Eds.; UCL Press: London, UK, 2018; pp. 159–190. [Google Scholar]
- Cline, E. The Oxford Handbook of the Bronze Age Aegean; Oxford University Press: Oxford, UK, 2012. [Google Scholar]
- MacDonald, B.R. The Diolkos. J. Hell. Stud. 1986, 106, 191–195. [Google Scholar] [CrossRef]


Disclaimer/Publisher’s Note: The statements, opinions and data contained in all publications are solely those of the individual author(s) and contributor(s) and not of MDPI and/or the editor(s). MDPI and/or the editor(s) disclaim responsibility for any injury to people or property resulting from any ideas, methods, instructions or products referred to in the content. |
© 2023 by the authors. Licensee MDPI, Basel, Switzerland. This article is an open access article distributed under the terms and conditions of the Creative Commons Attribution (CC BY) license (https://creativecommons.org/licenses/by/4.0/).