

Toward Practical Spectral Imaging beyond a Laboratory Context

Abstract
1. Introduction
1.1. Spectral Imaging in a Laboratory Context
1.2. Toward Spectral Imaging in a Studio Workflow
- the elimination of the need for subjective visual editing in post-production,
- the expansion of archives beyond a single set of viewing, illuminating, and observer conditions (CIE illuminant D50 and 1931 standard observer for ICC color managed archives),
- the ability to re-render an image under any desired lighting condition to inform curation, exhibition, scholarship, and conservation, and
- the prevention of undesirable metameric matches of materials used in conservation treatments.
- a tutorial about the theory and practice of conventional color imaging versus the proposed two-light spectral imaging method,
- a demonstration of two-light imaging, showing how it can be carried out using mainly cameras and equipment that are commonly found in photography studios and are already familiar to cultural heritage imaging professionals, and
- discussion and questions around these activities.
1.3. Obstacles and Opportunities
2. Background
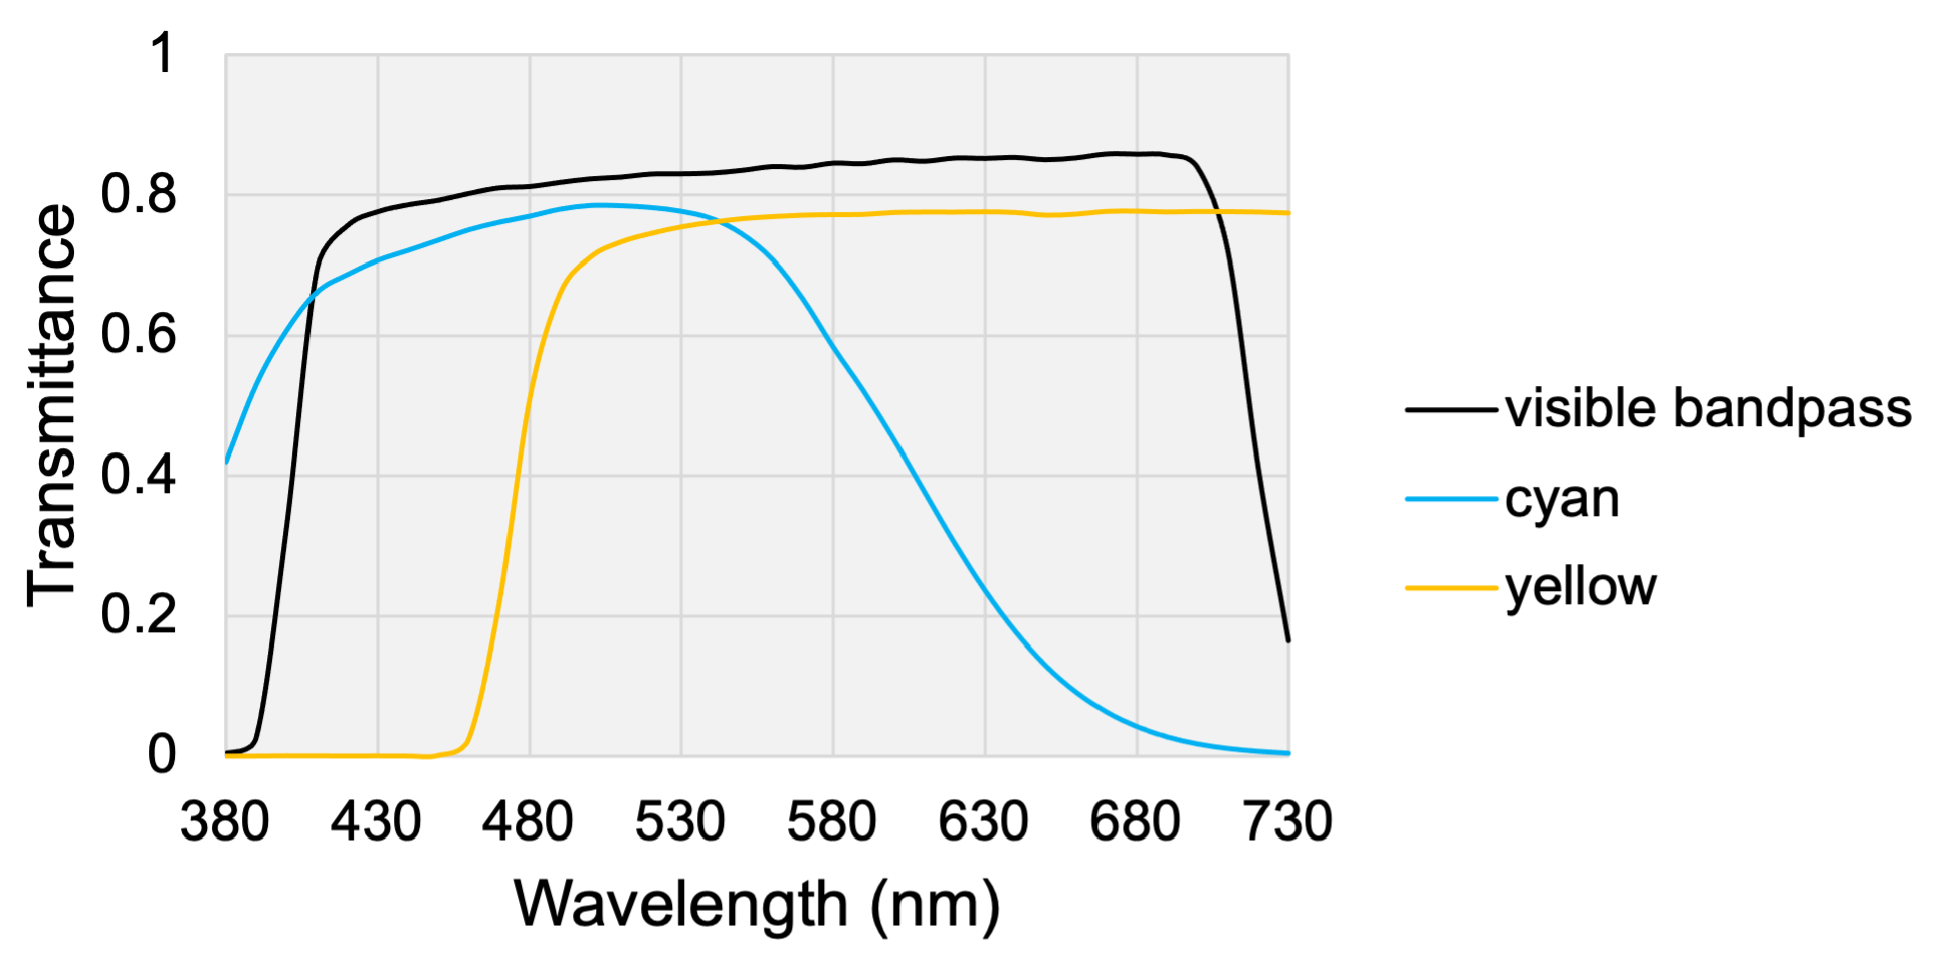
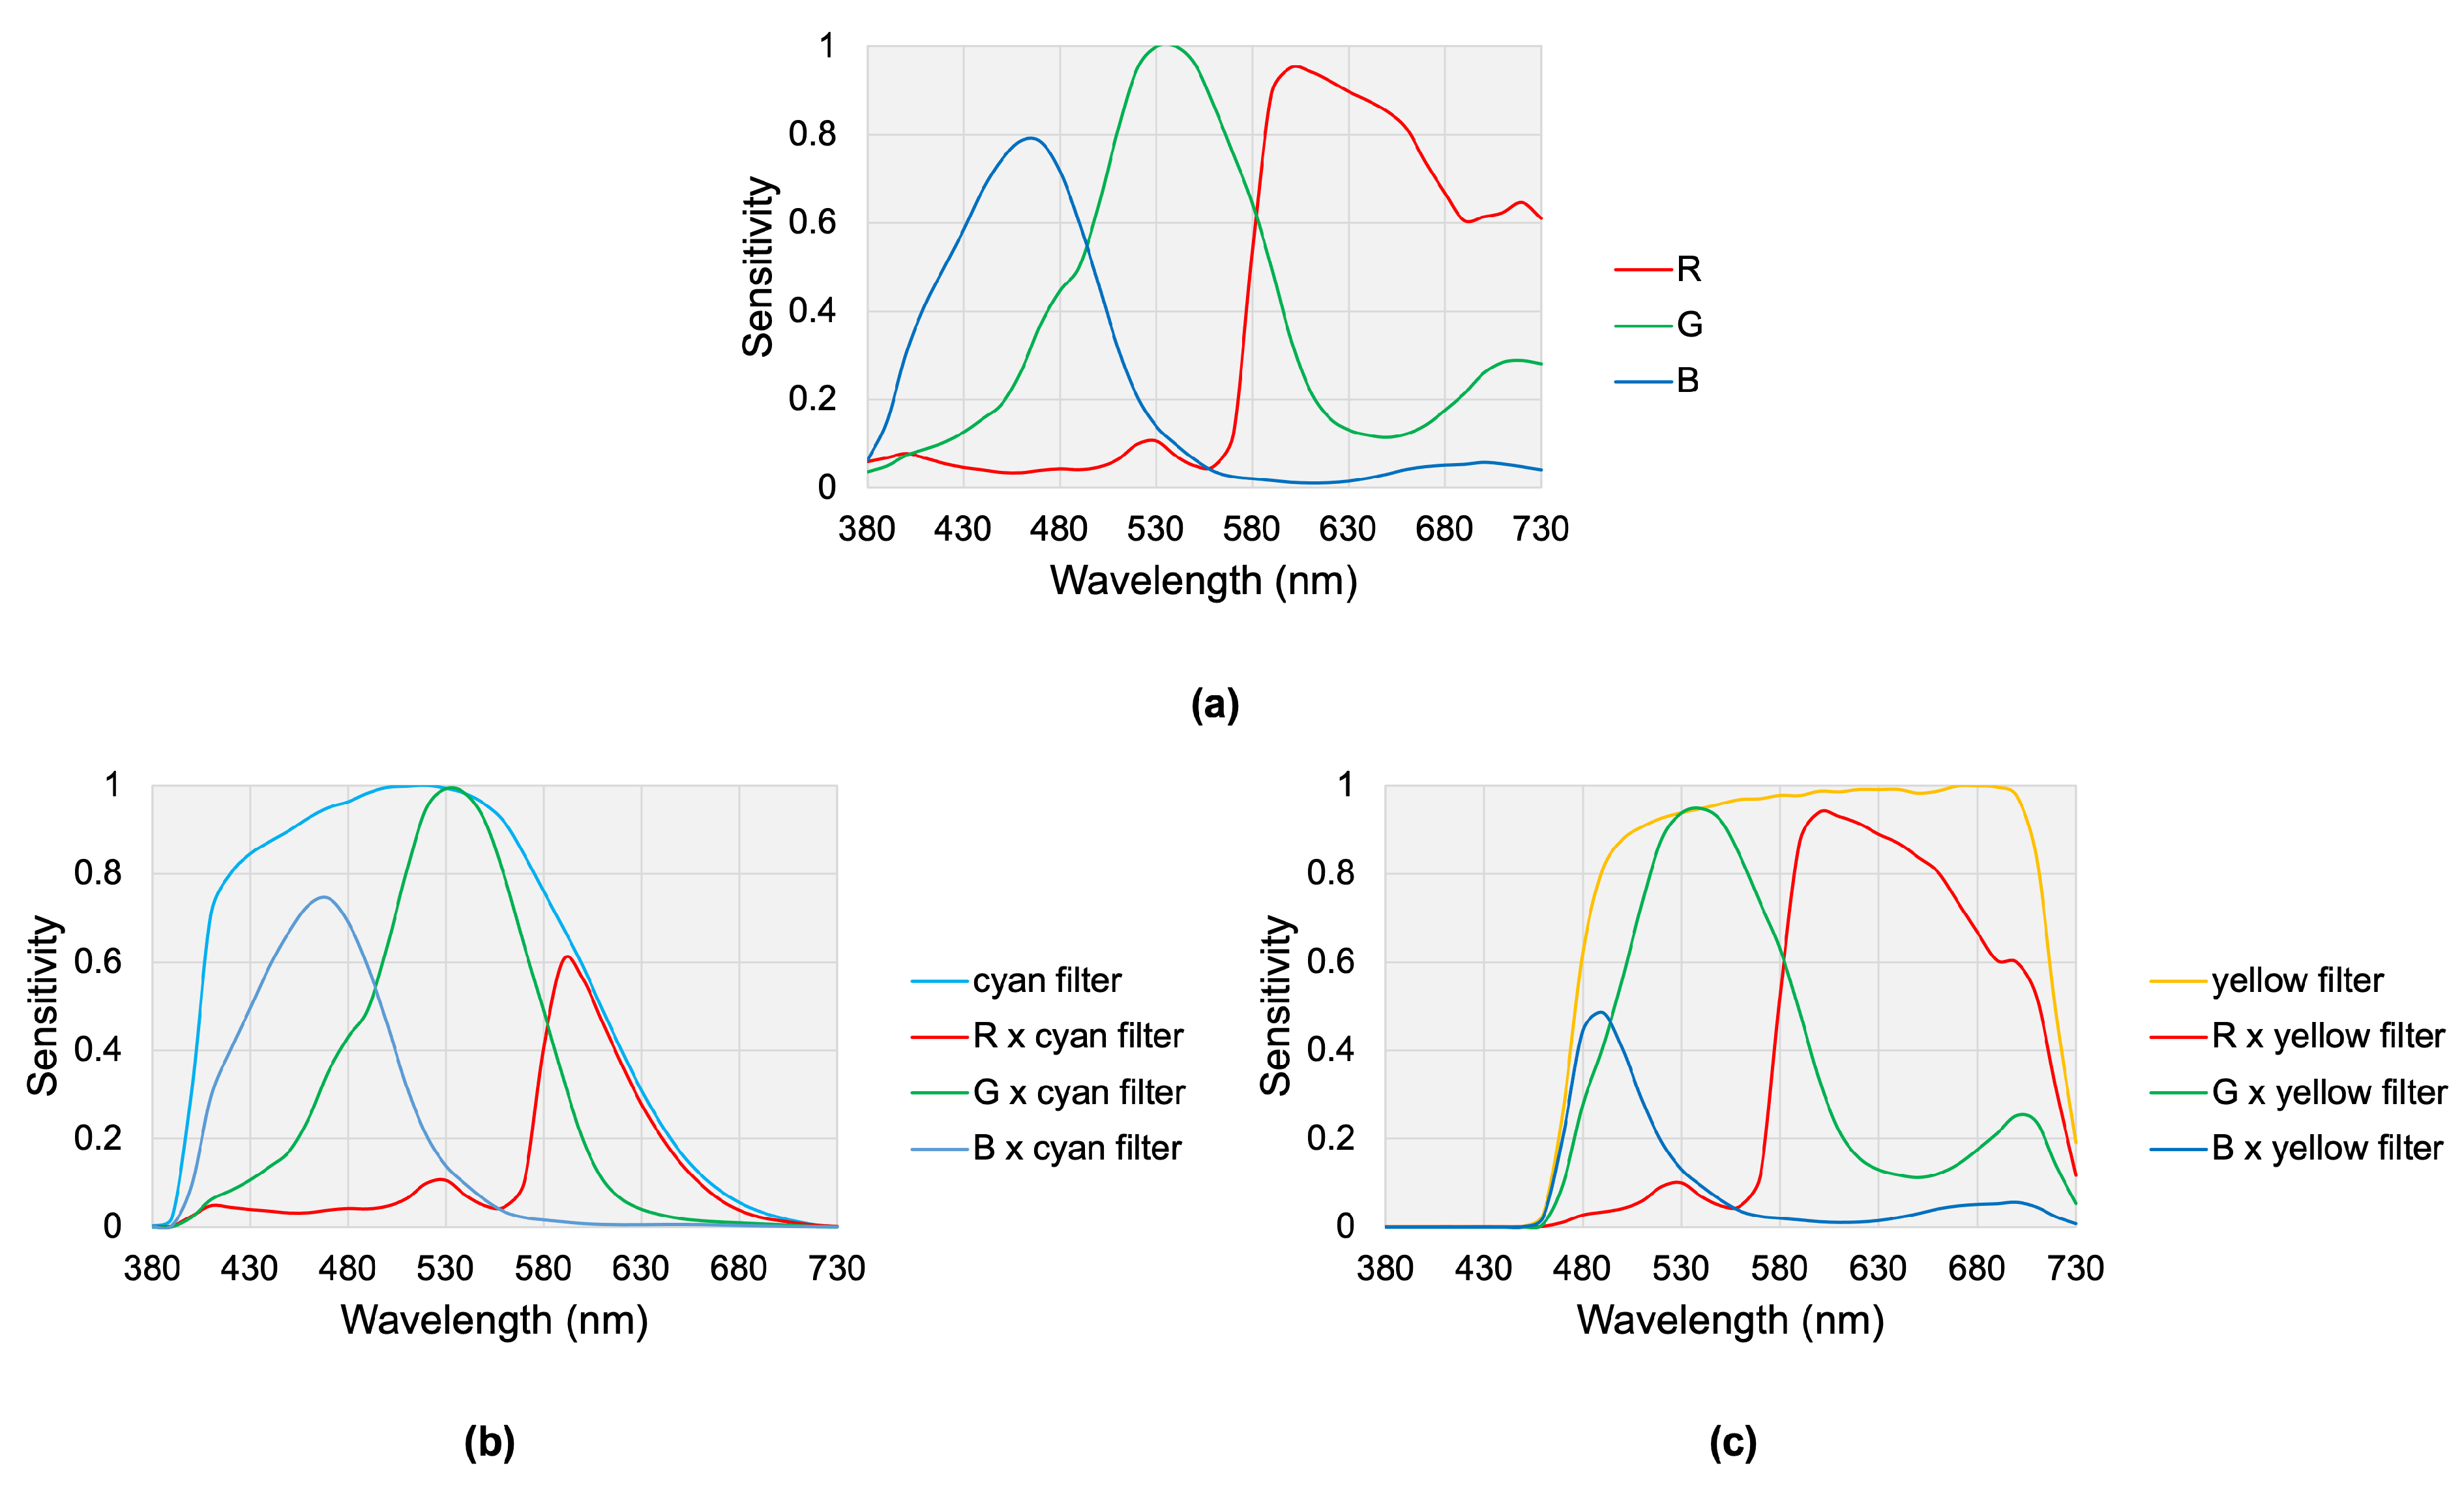
2.1. Dual-RGB Imaging
2.2. Two-Light Imaging
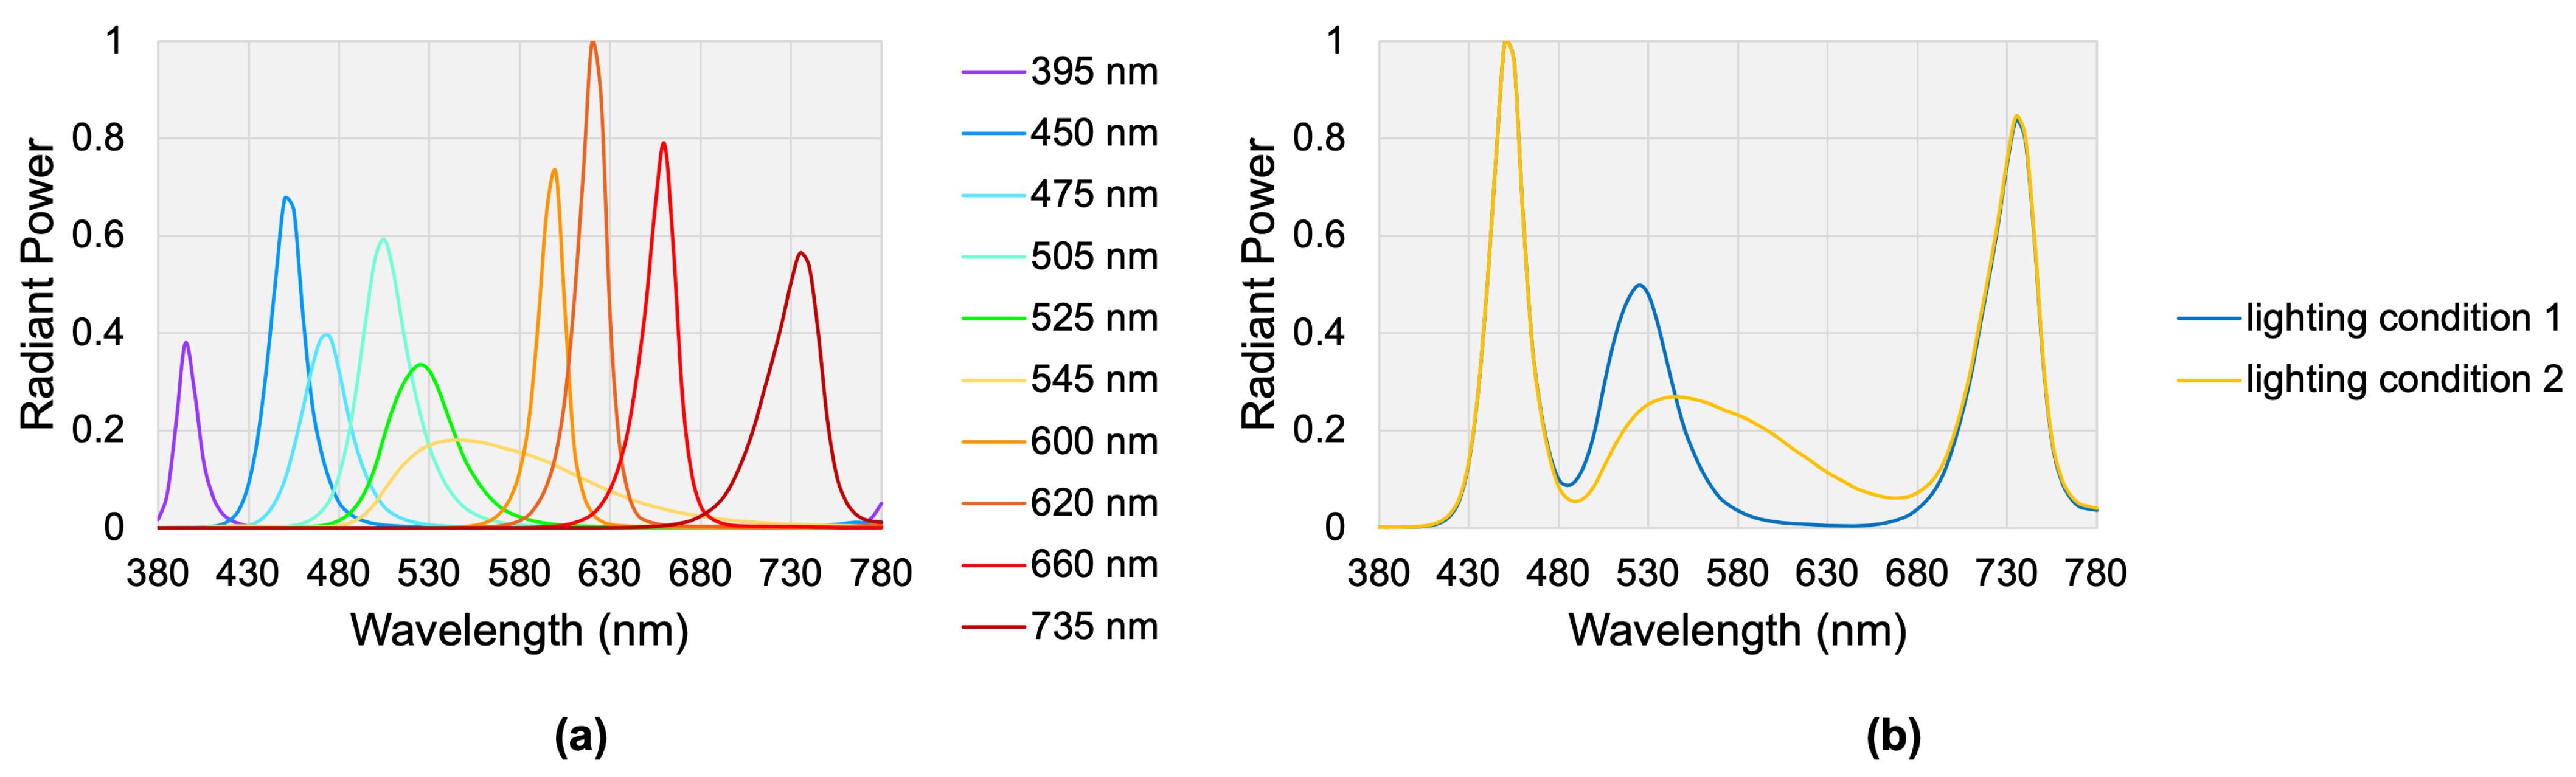
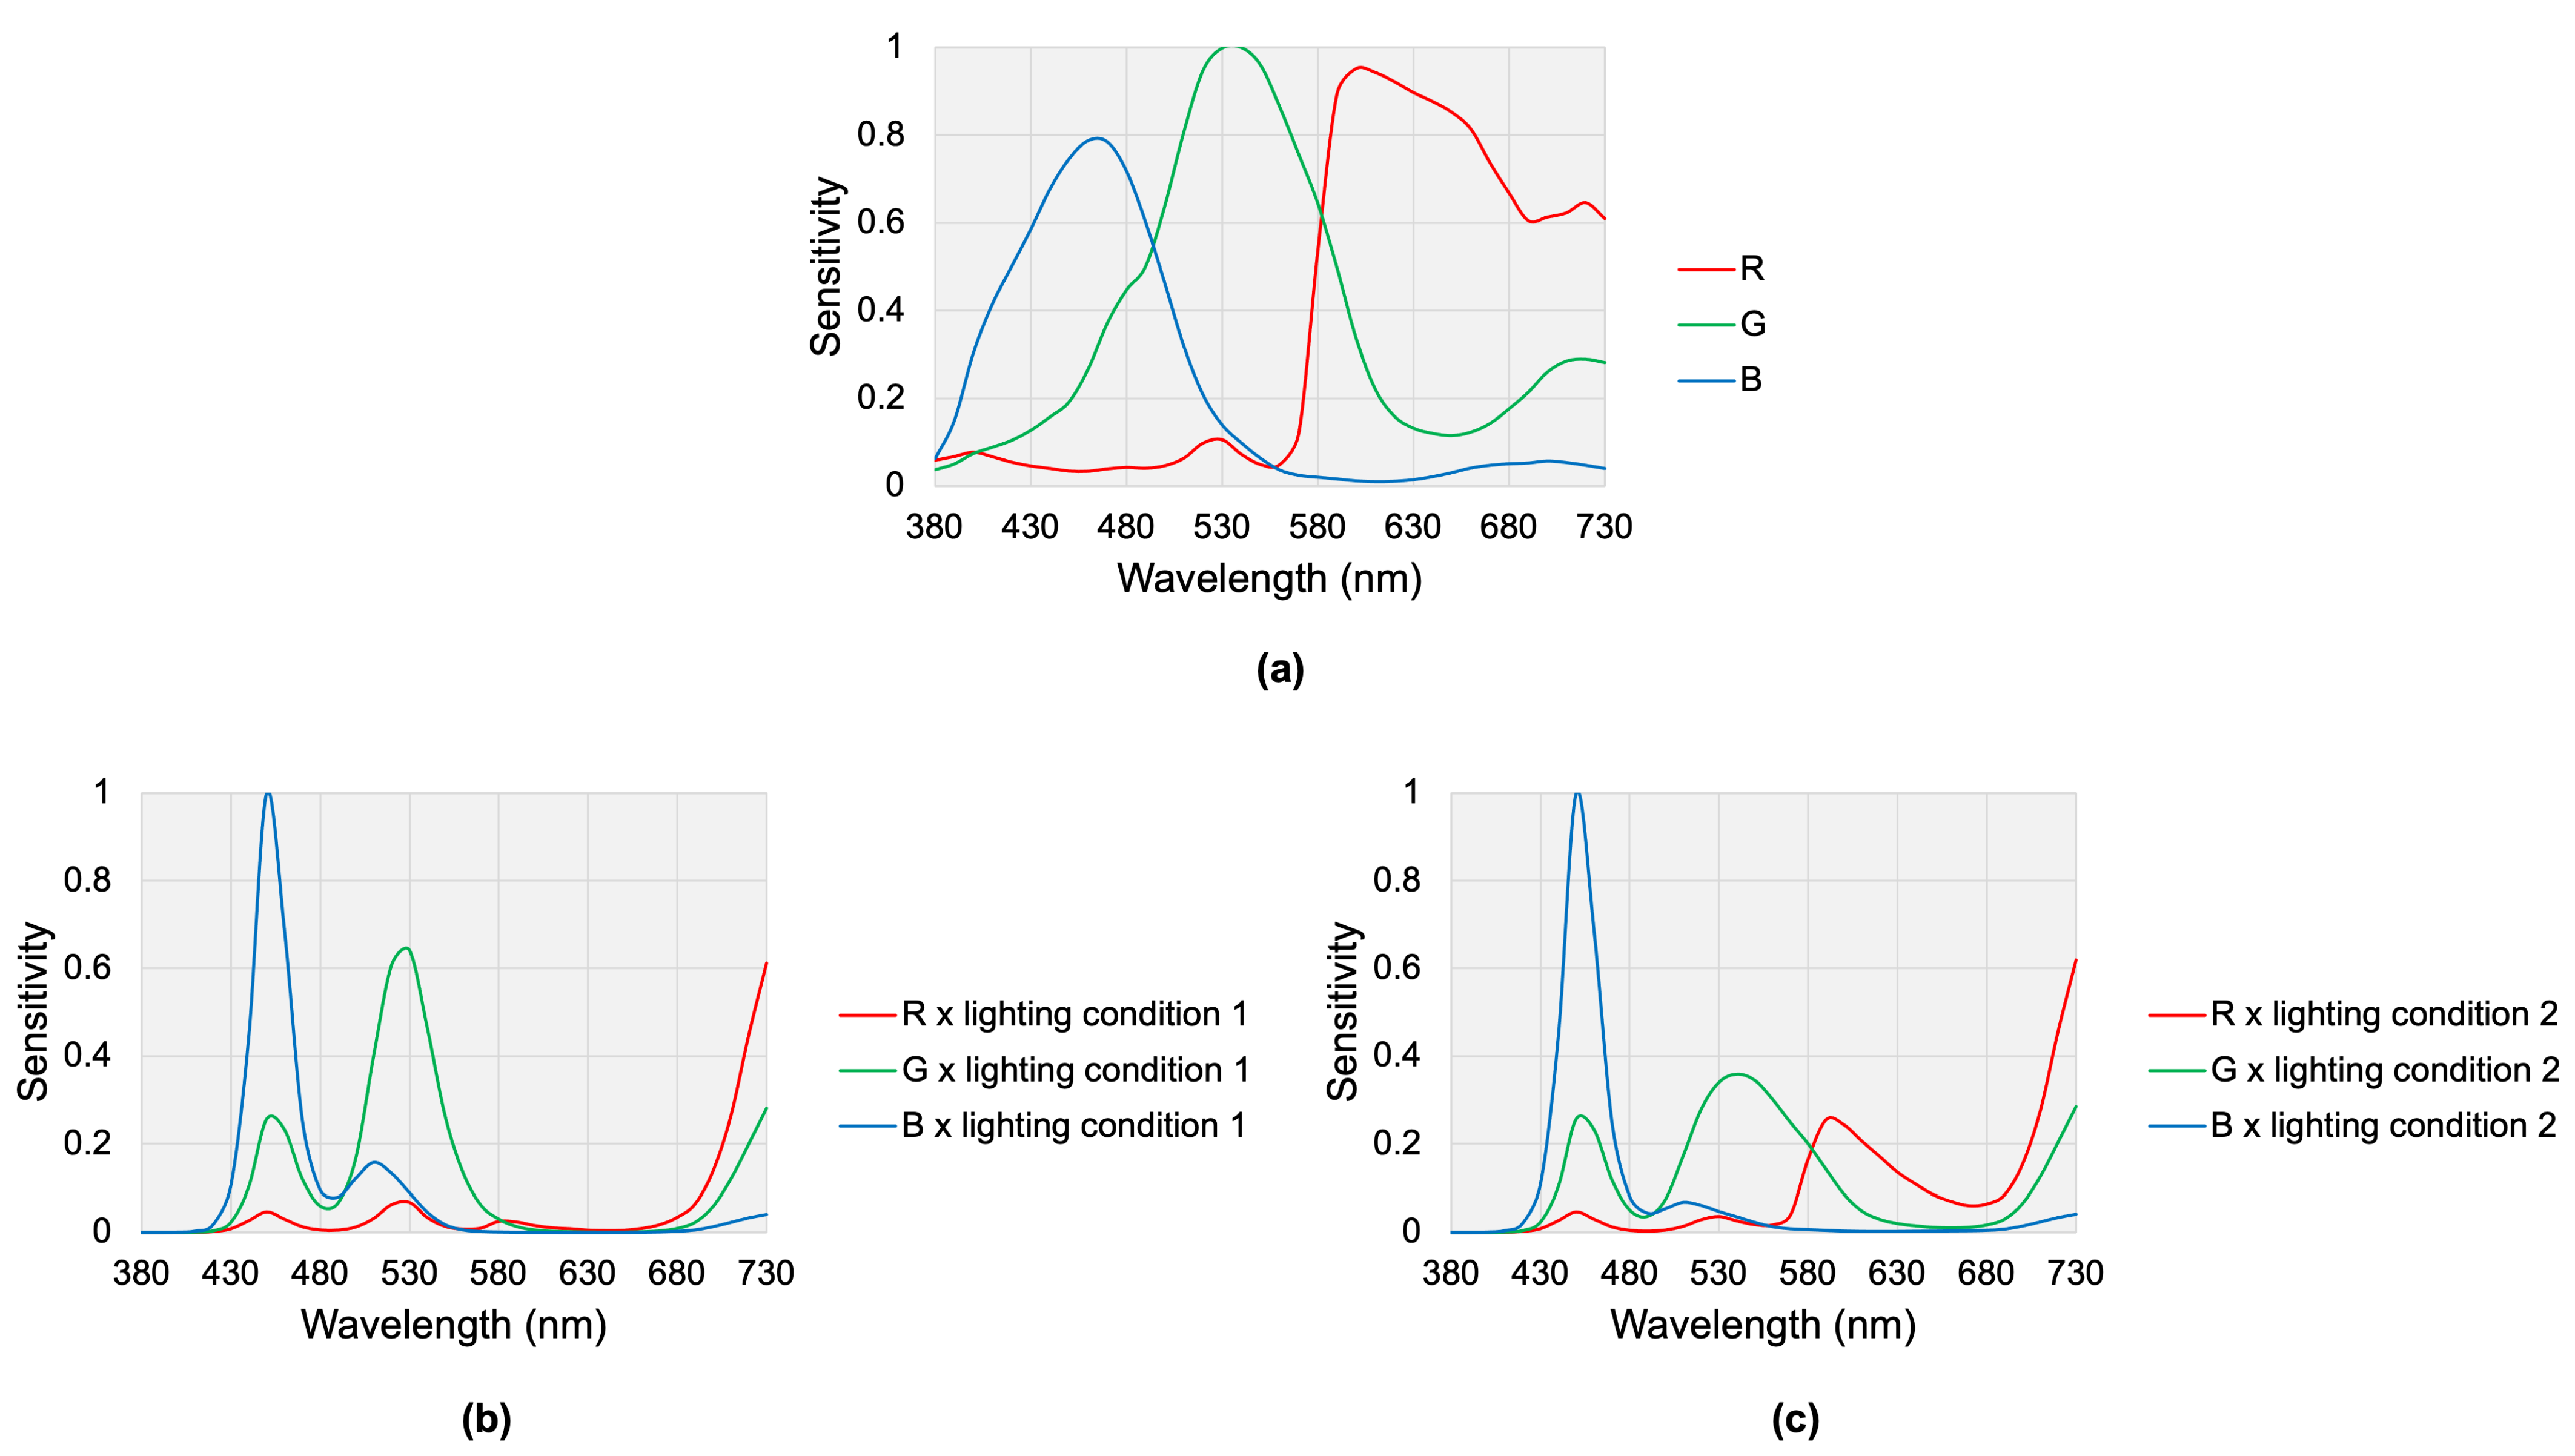
2.3. The Spectral Advantage
3. Capture and Image Processing Methods
3.1. Imaging System
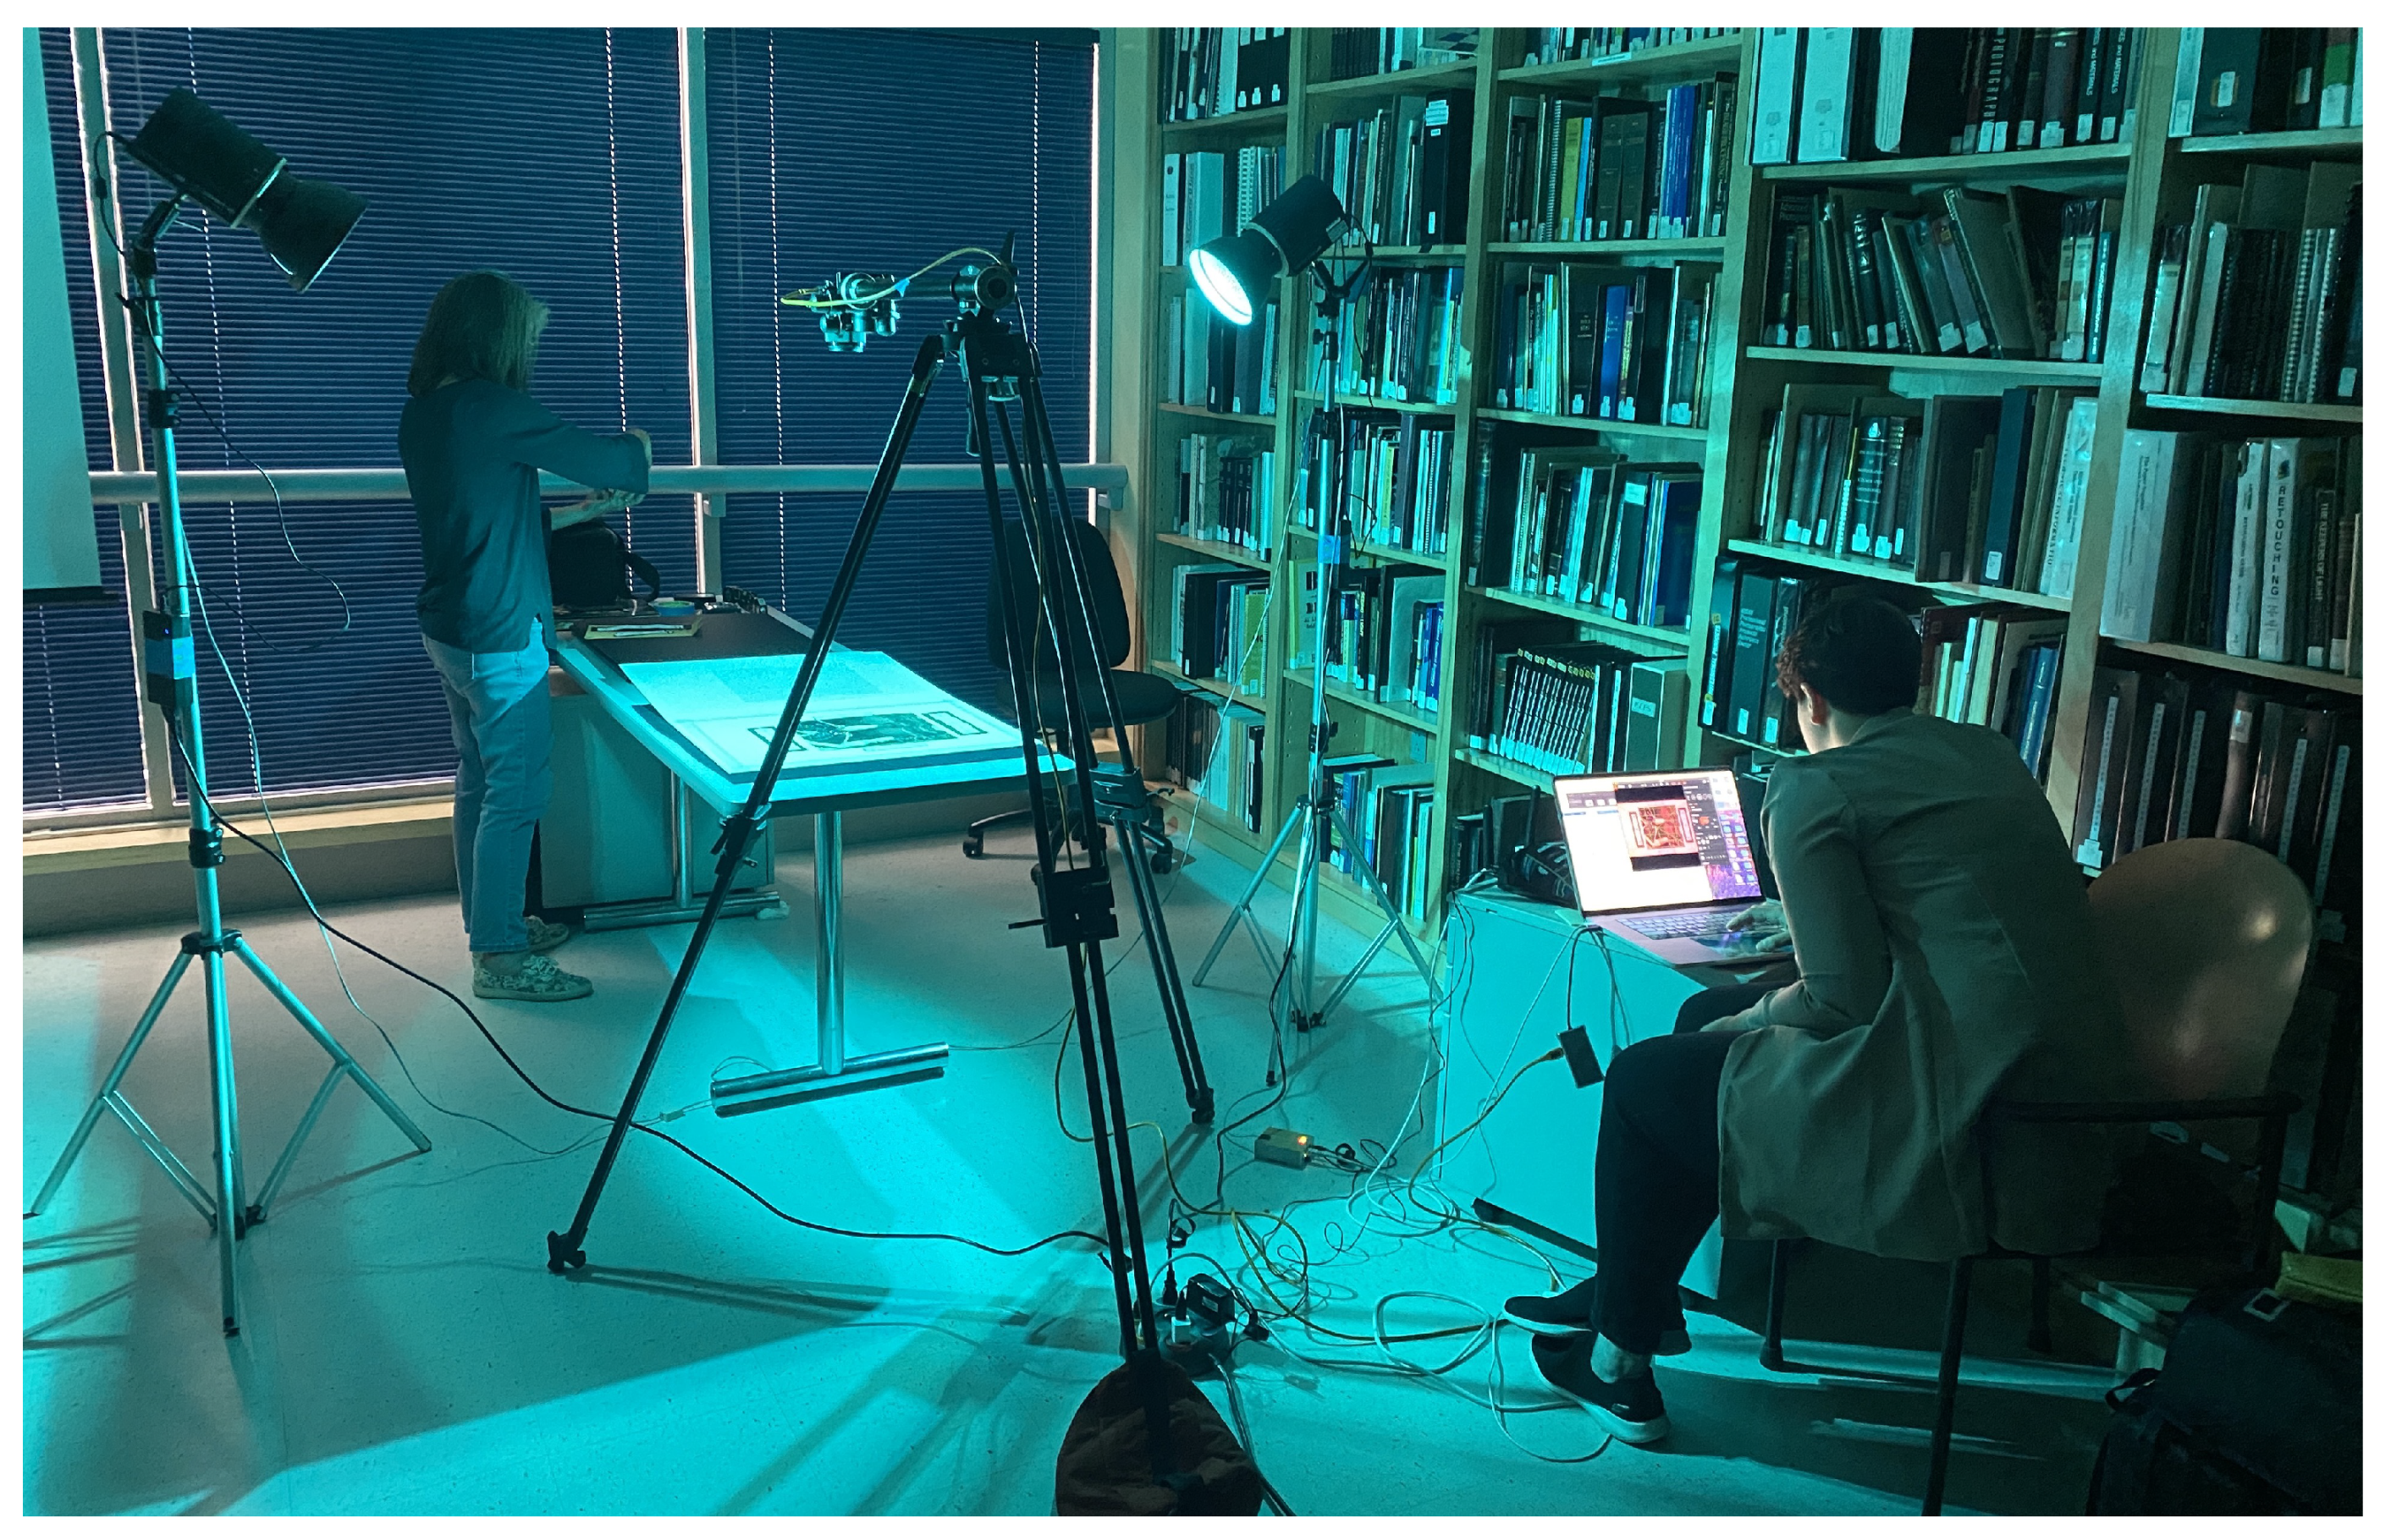
3.1.1. Equipment
3.1.2. Setup
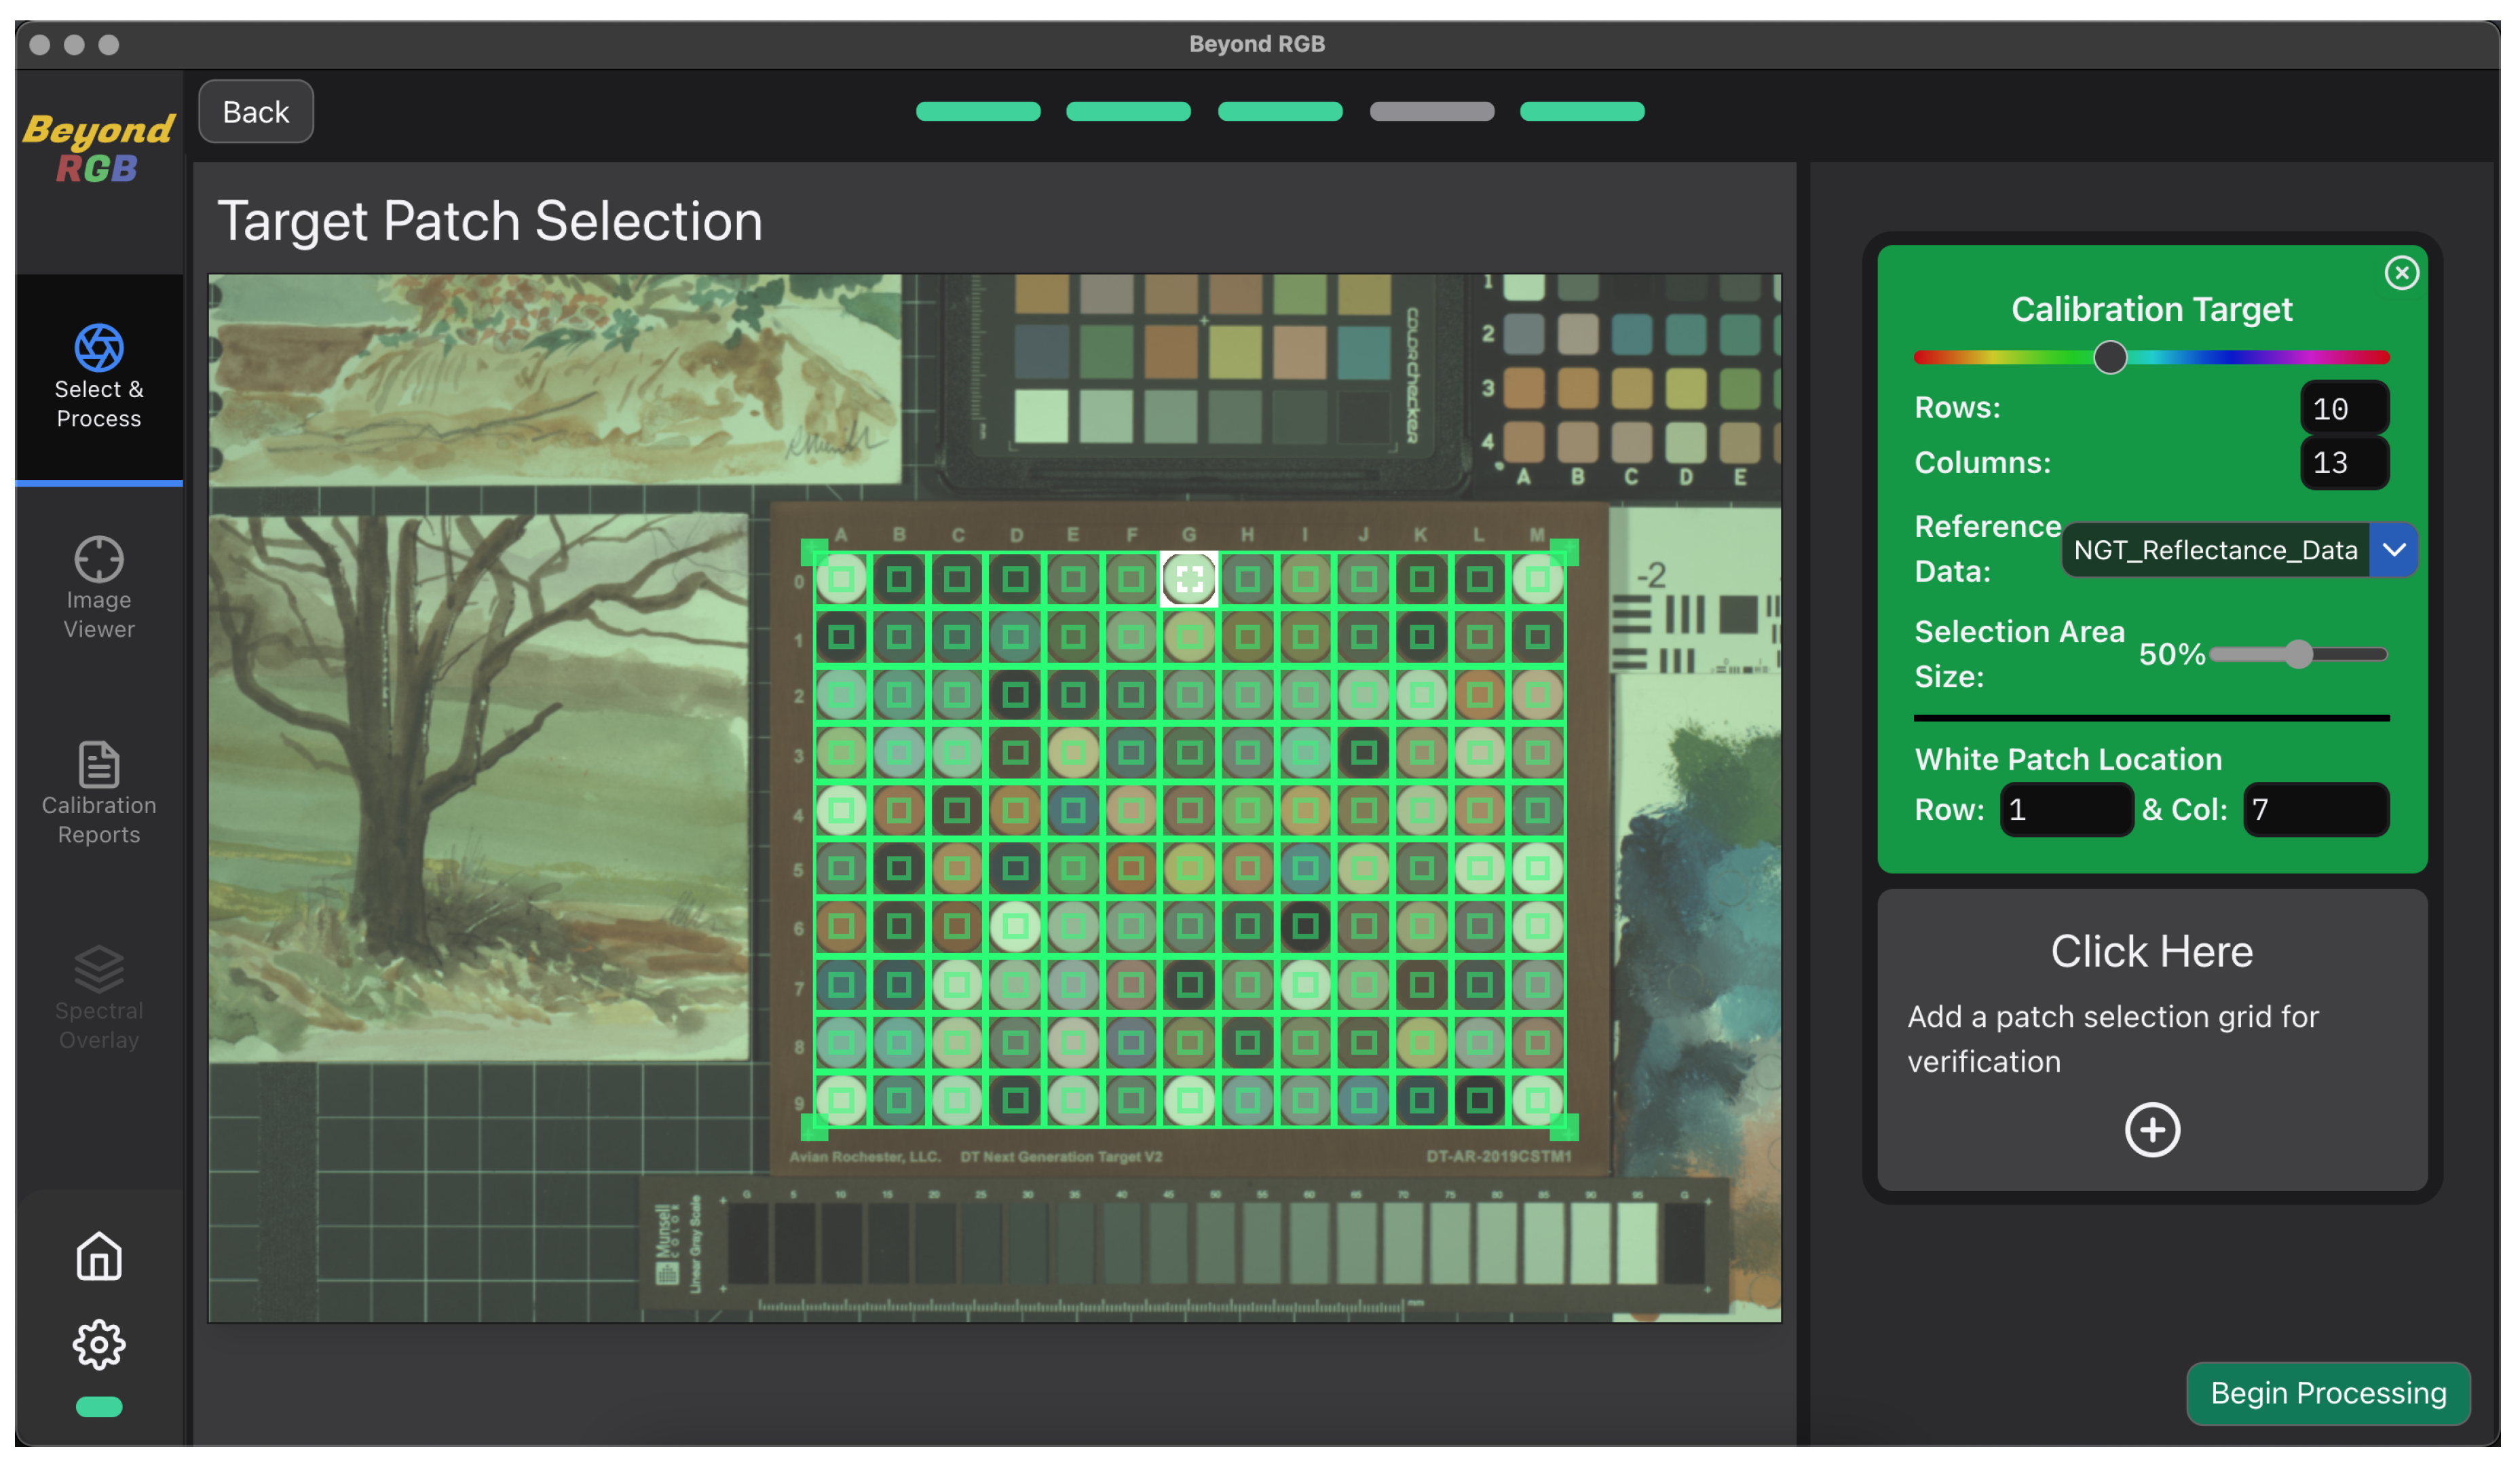
3.2. Image Processing Software: Beyond RGB
4. Results and Discussion
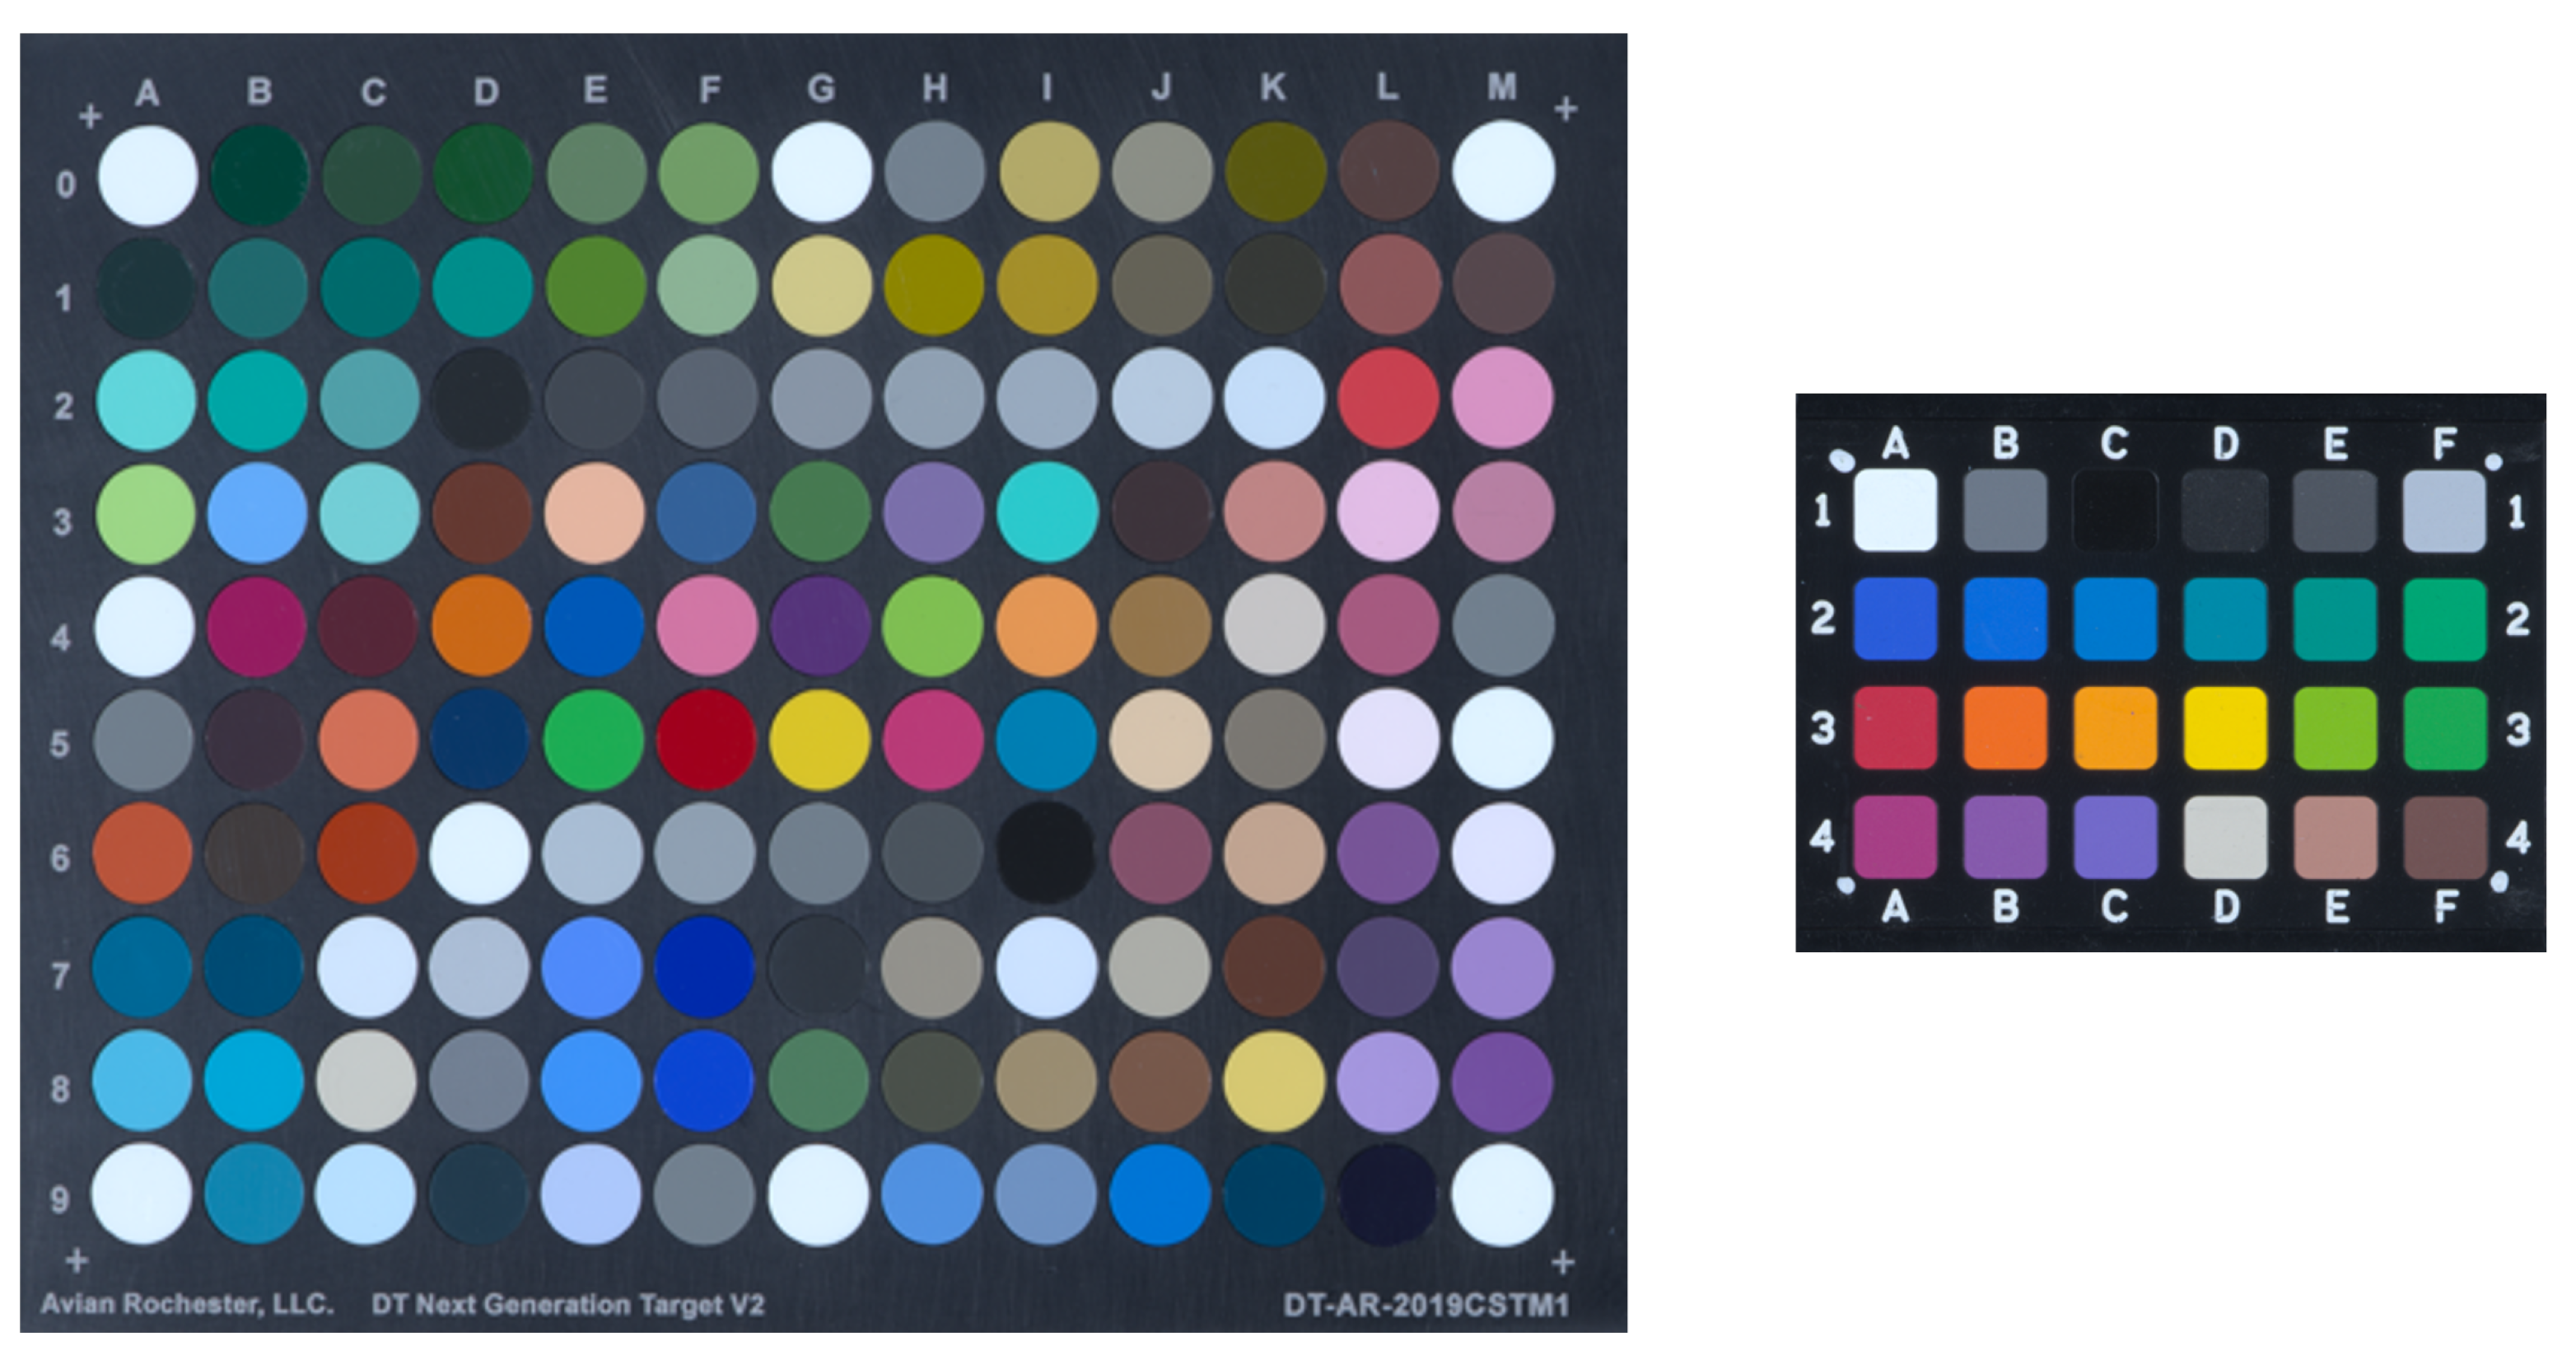
4.1. Institutions Visited
- the Cary Graphic Arts Collection at the RIT Libraries (Rochester, NY, USA),
- the National Cryptologic Museum (Annapolis Junction, MD, USA),
- the US Army Heritage and Education Center (Carlisle, PA, USA),
- the Museum of Modern Art (New York, NY, USA),
- the Art Conservation Department at Buffalo State College (Buffalo, NY, USA), and
- the George Eastman Museum (Rochester, NY, USA)
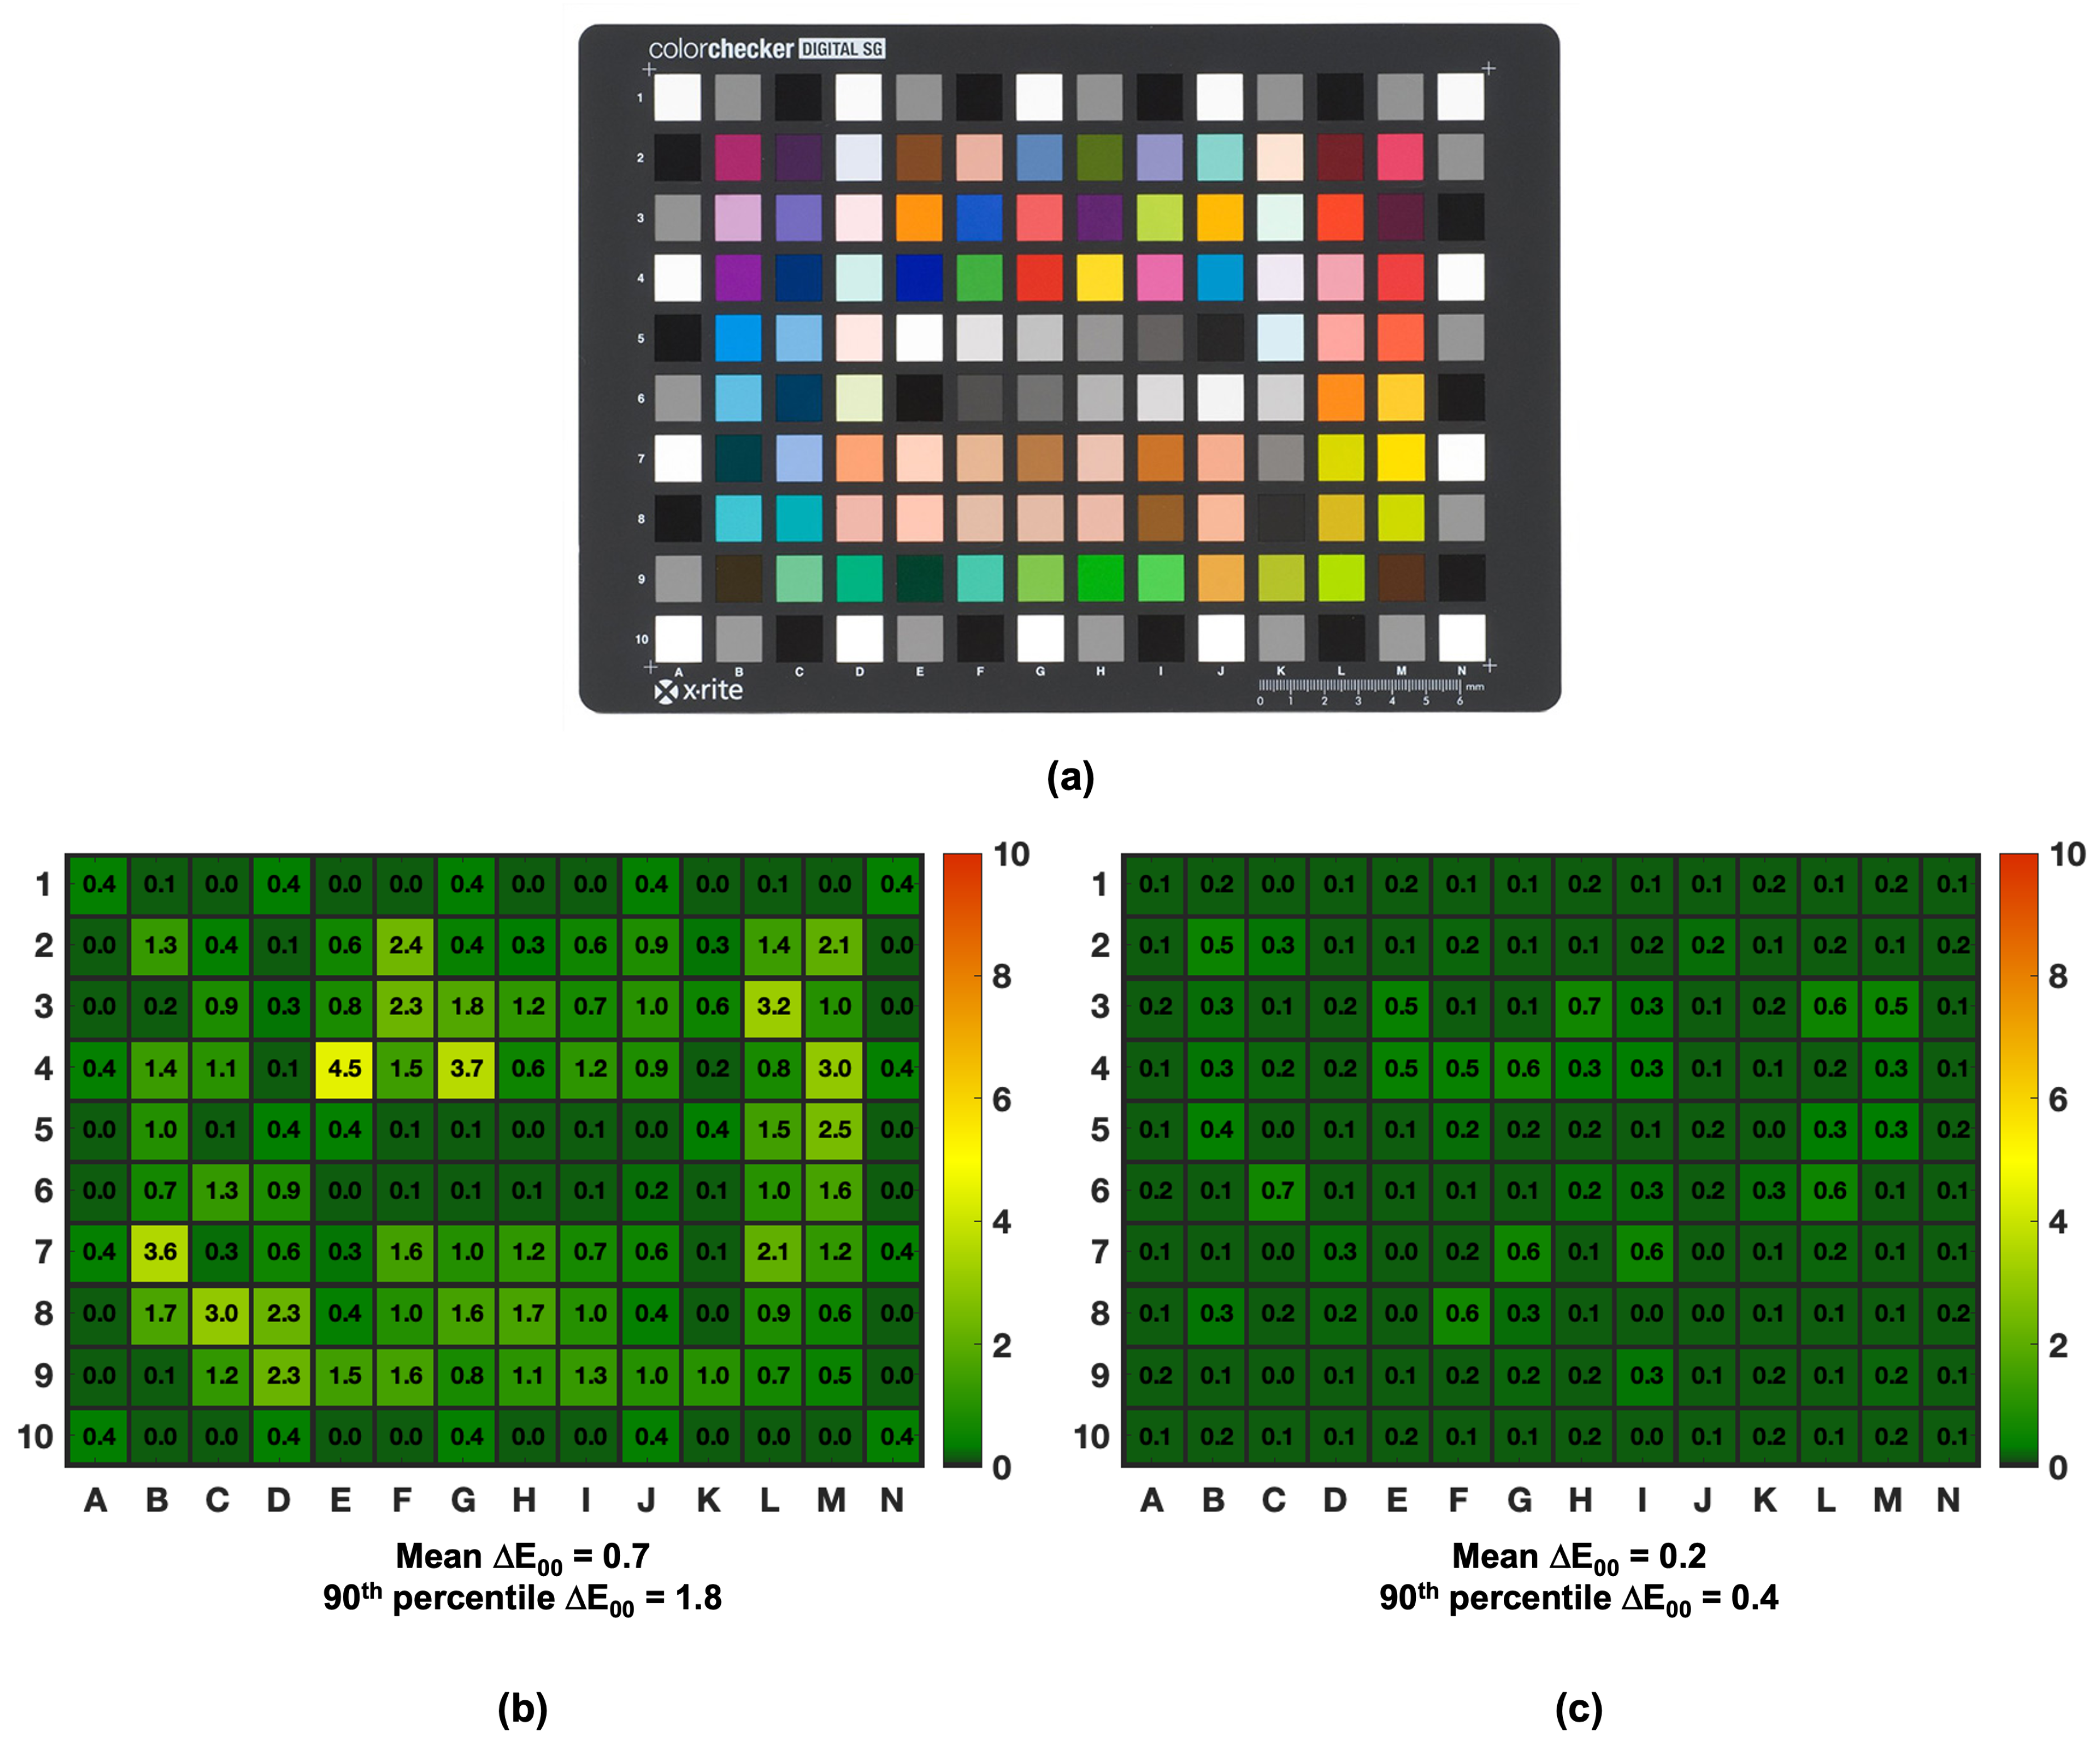
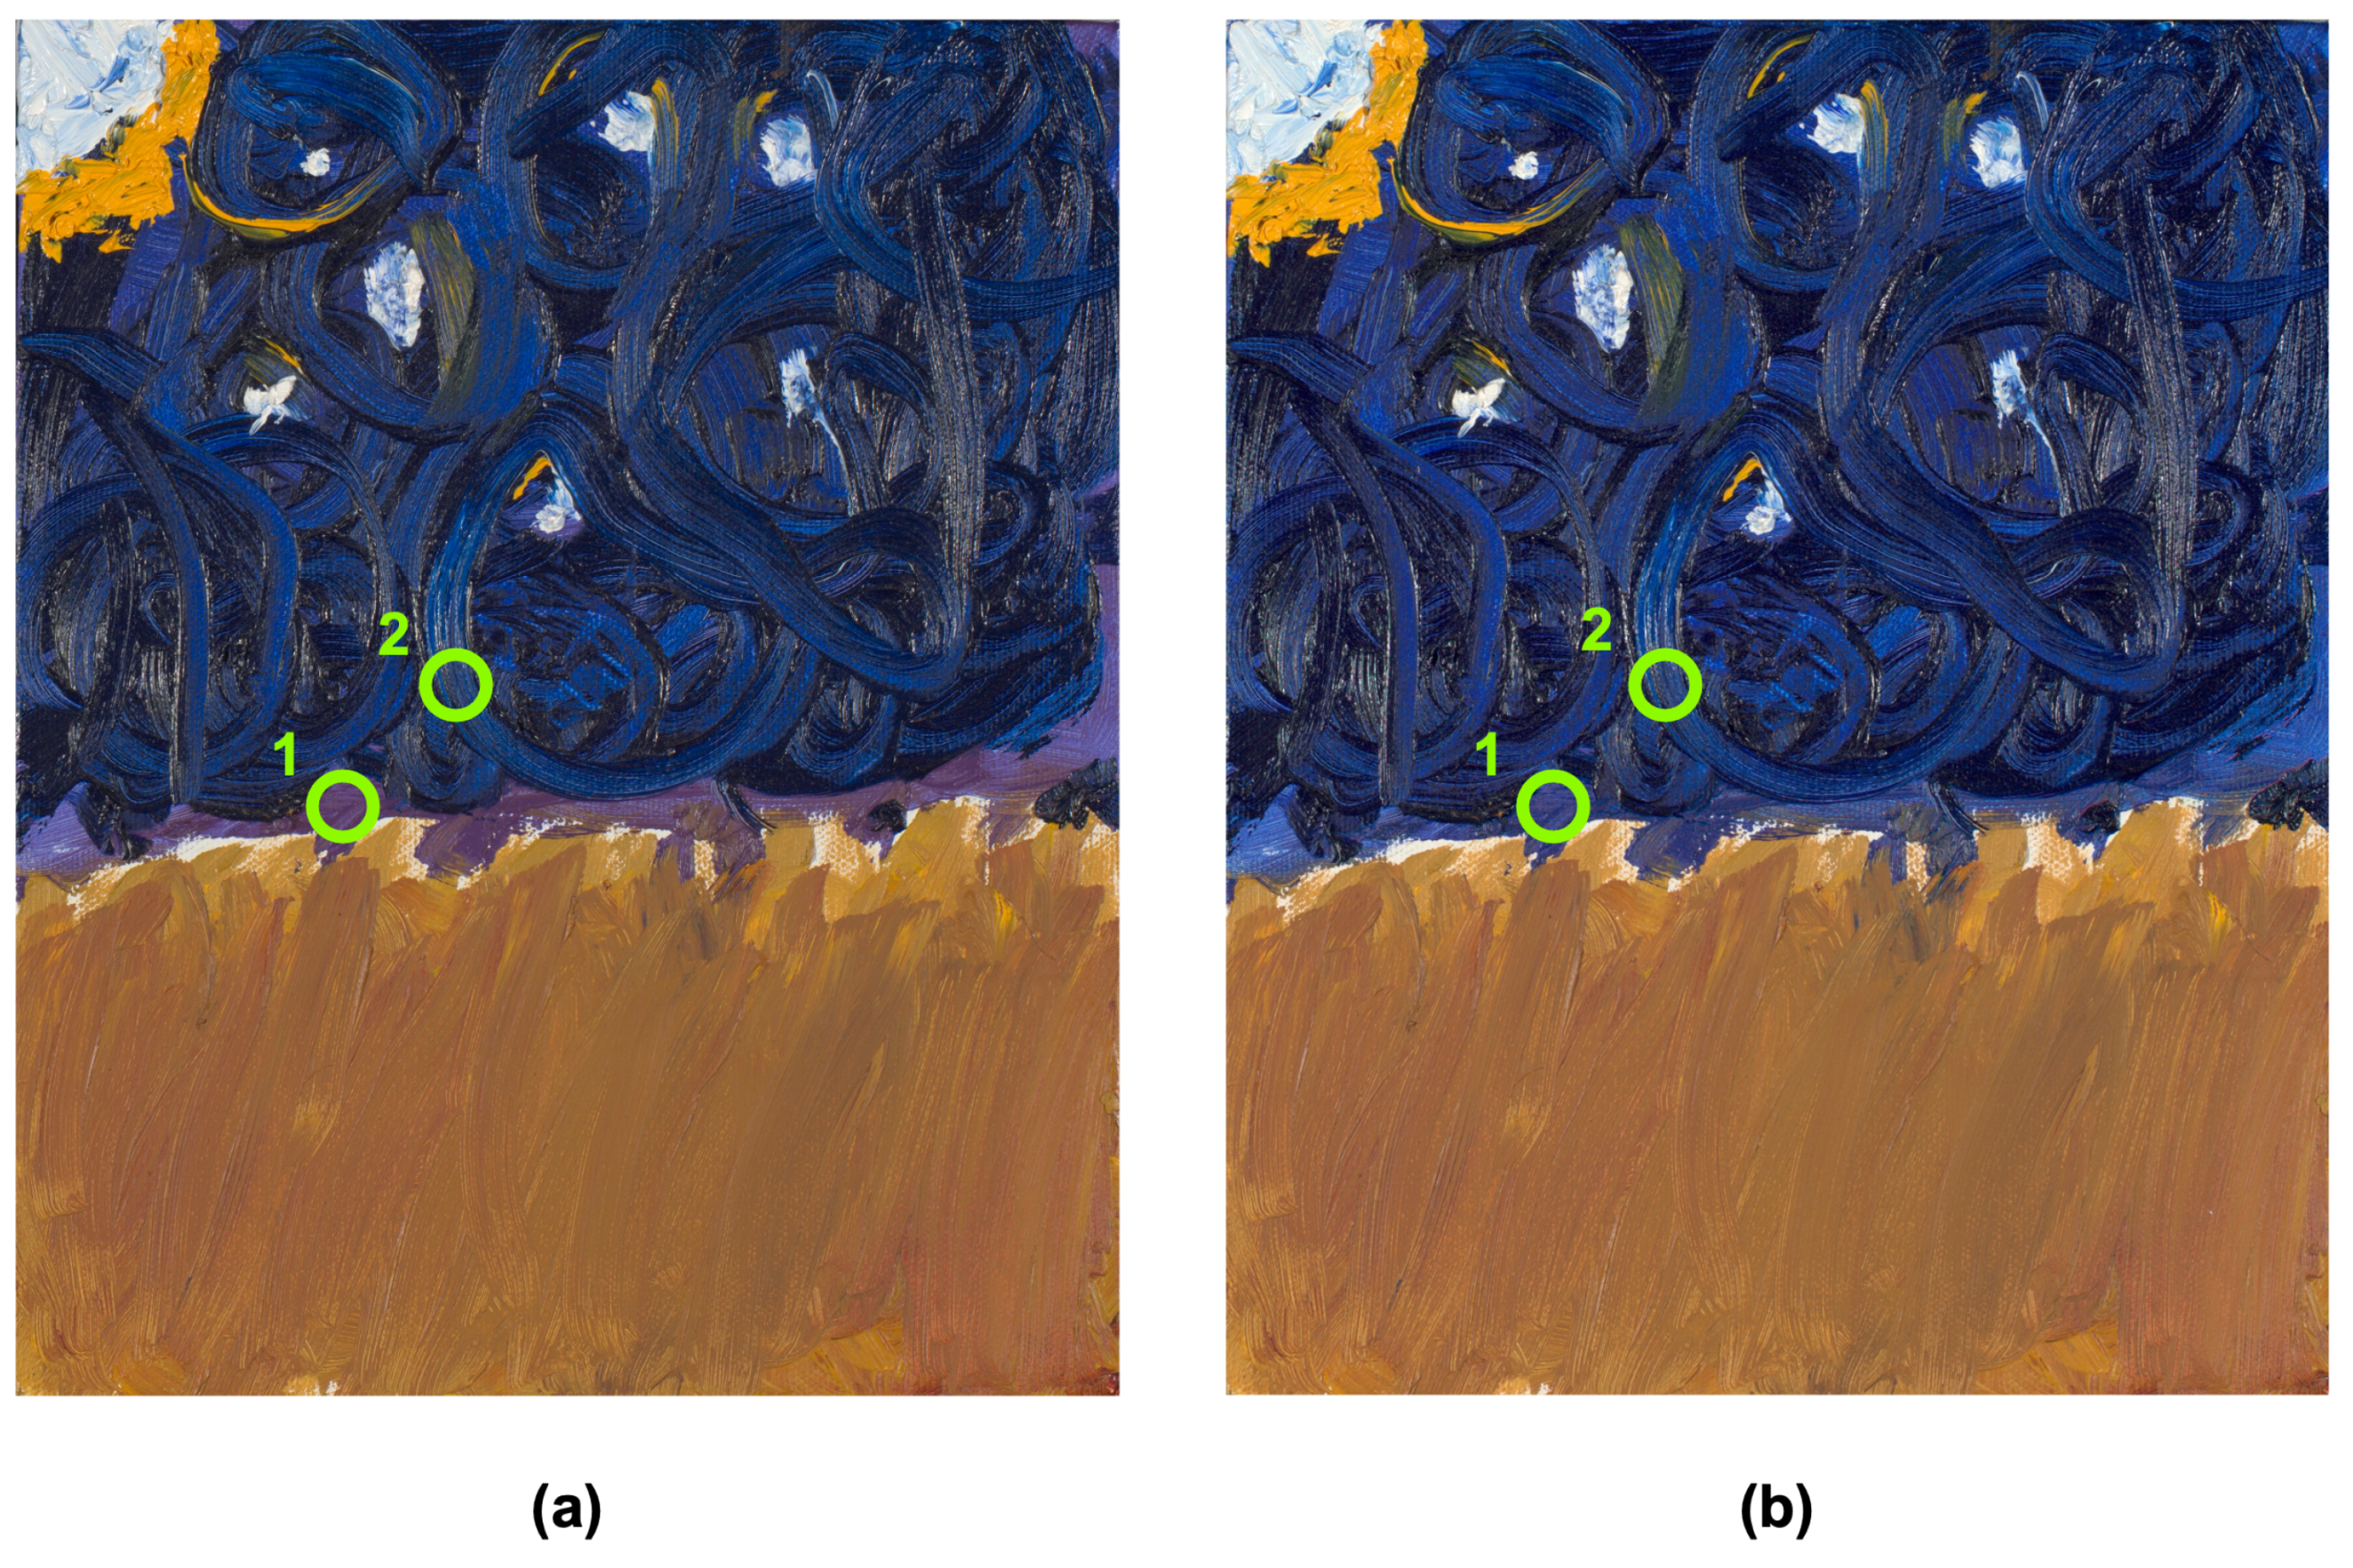
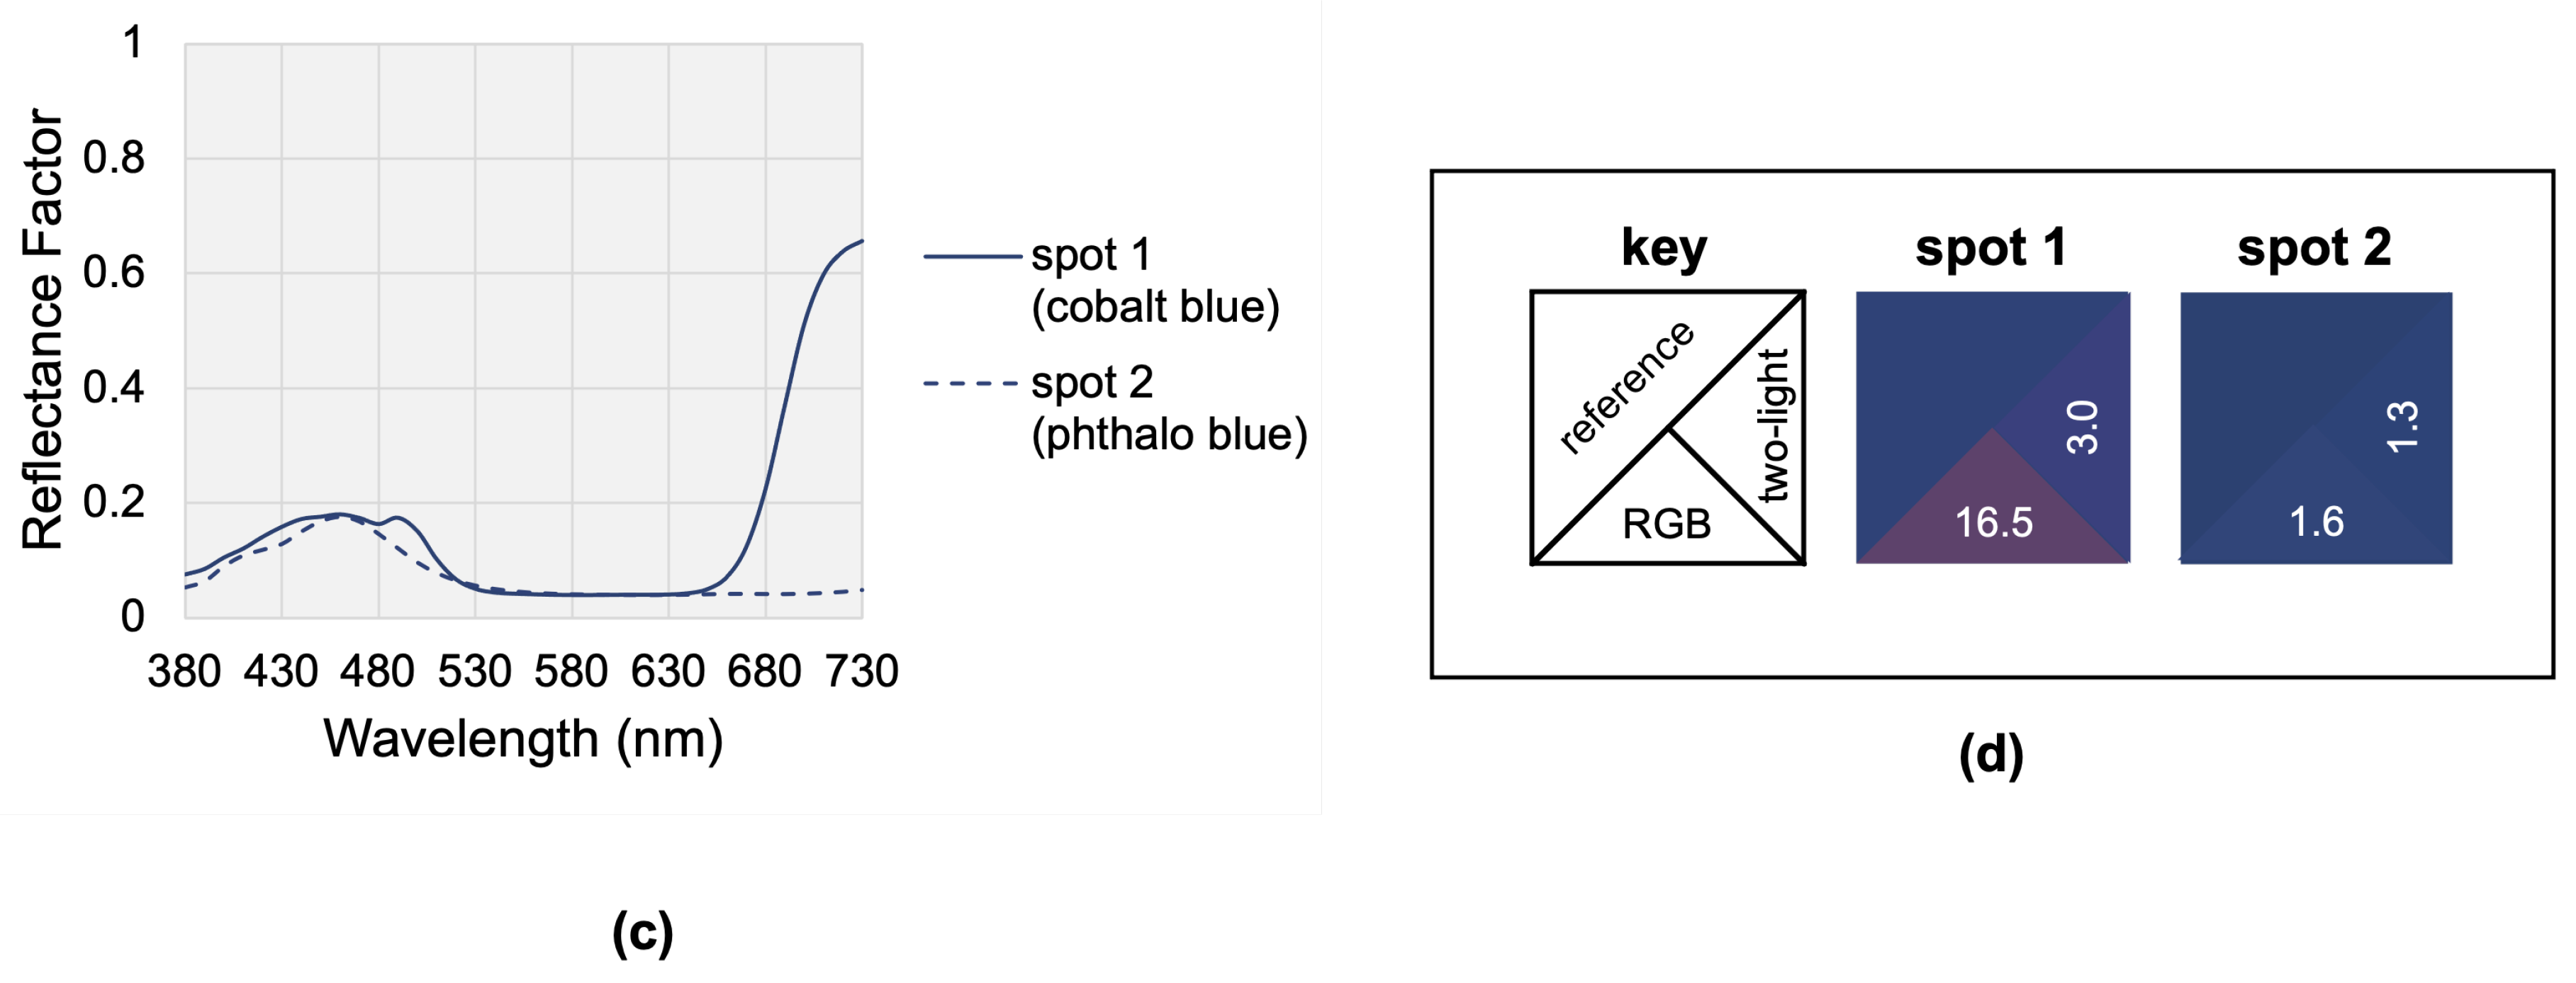
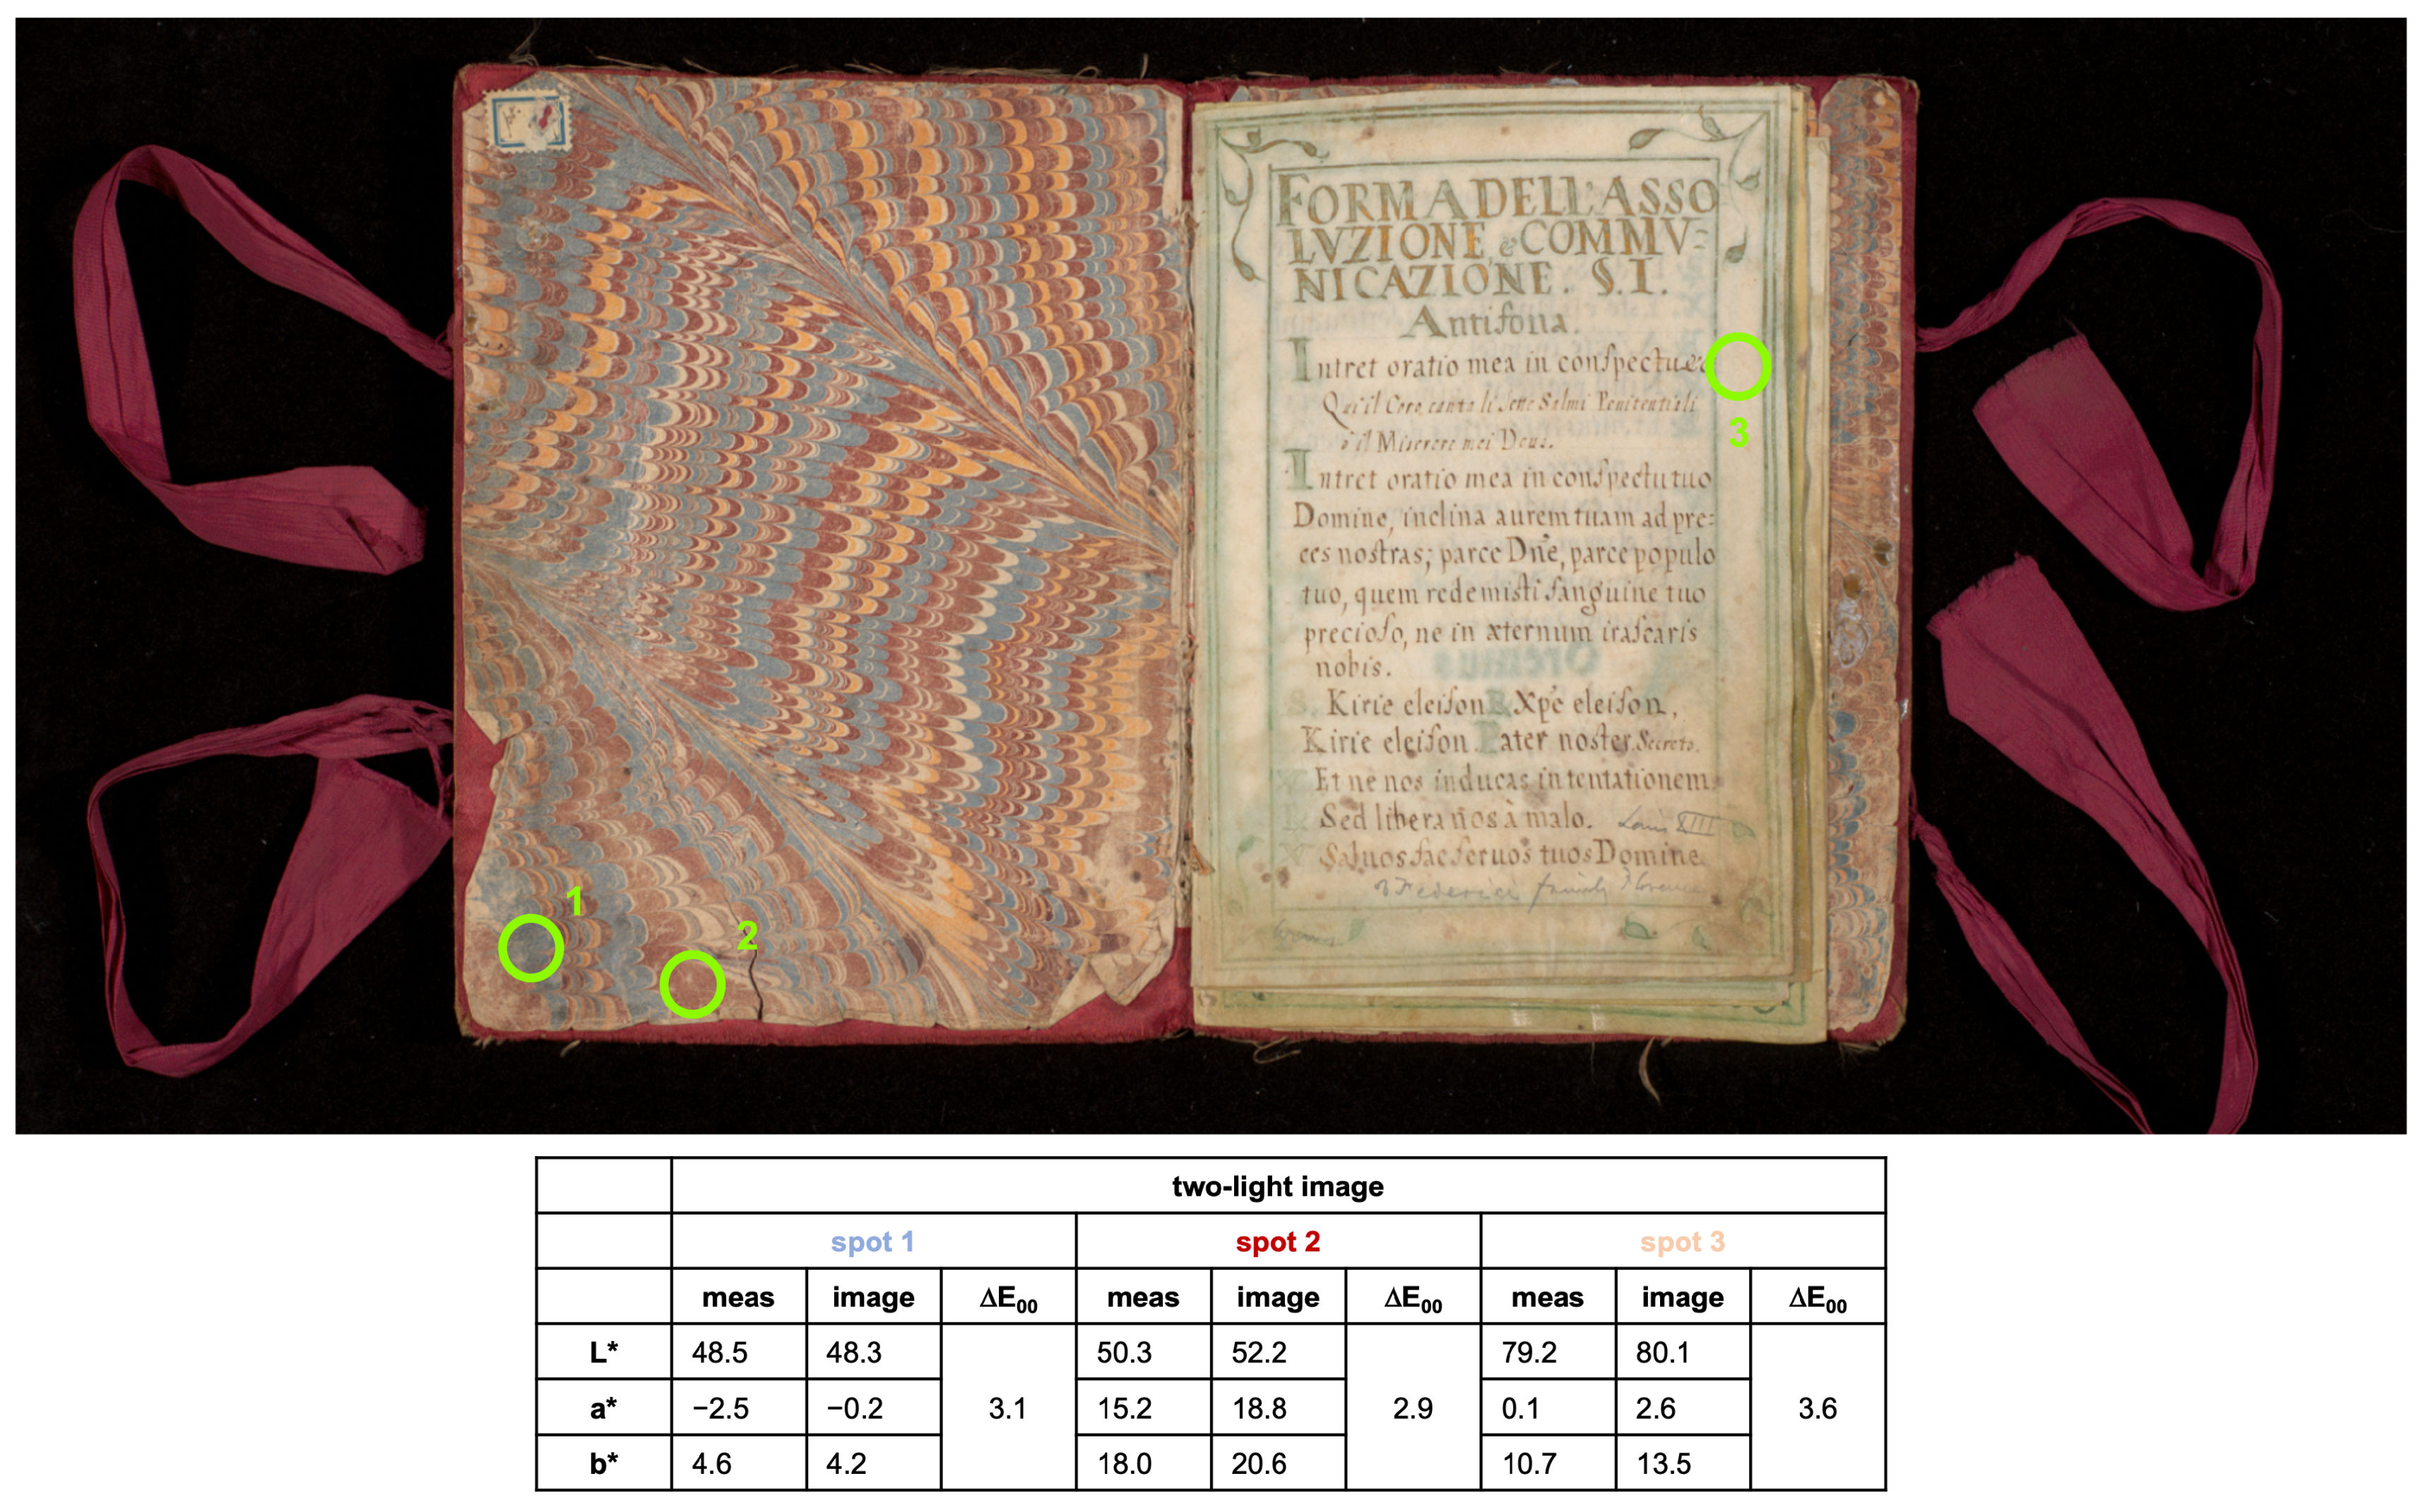
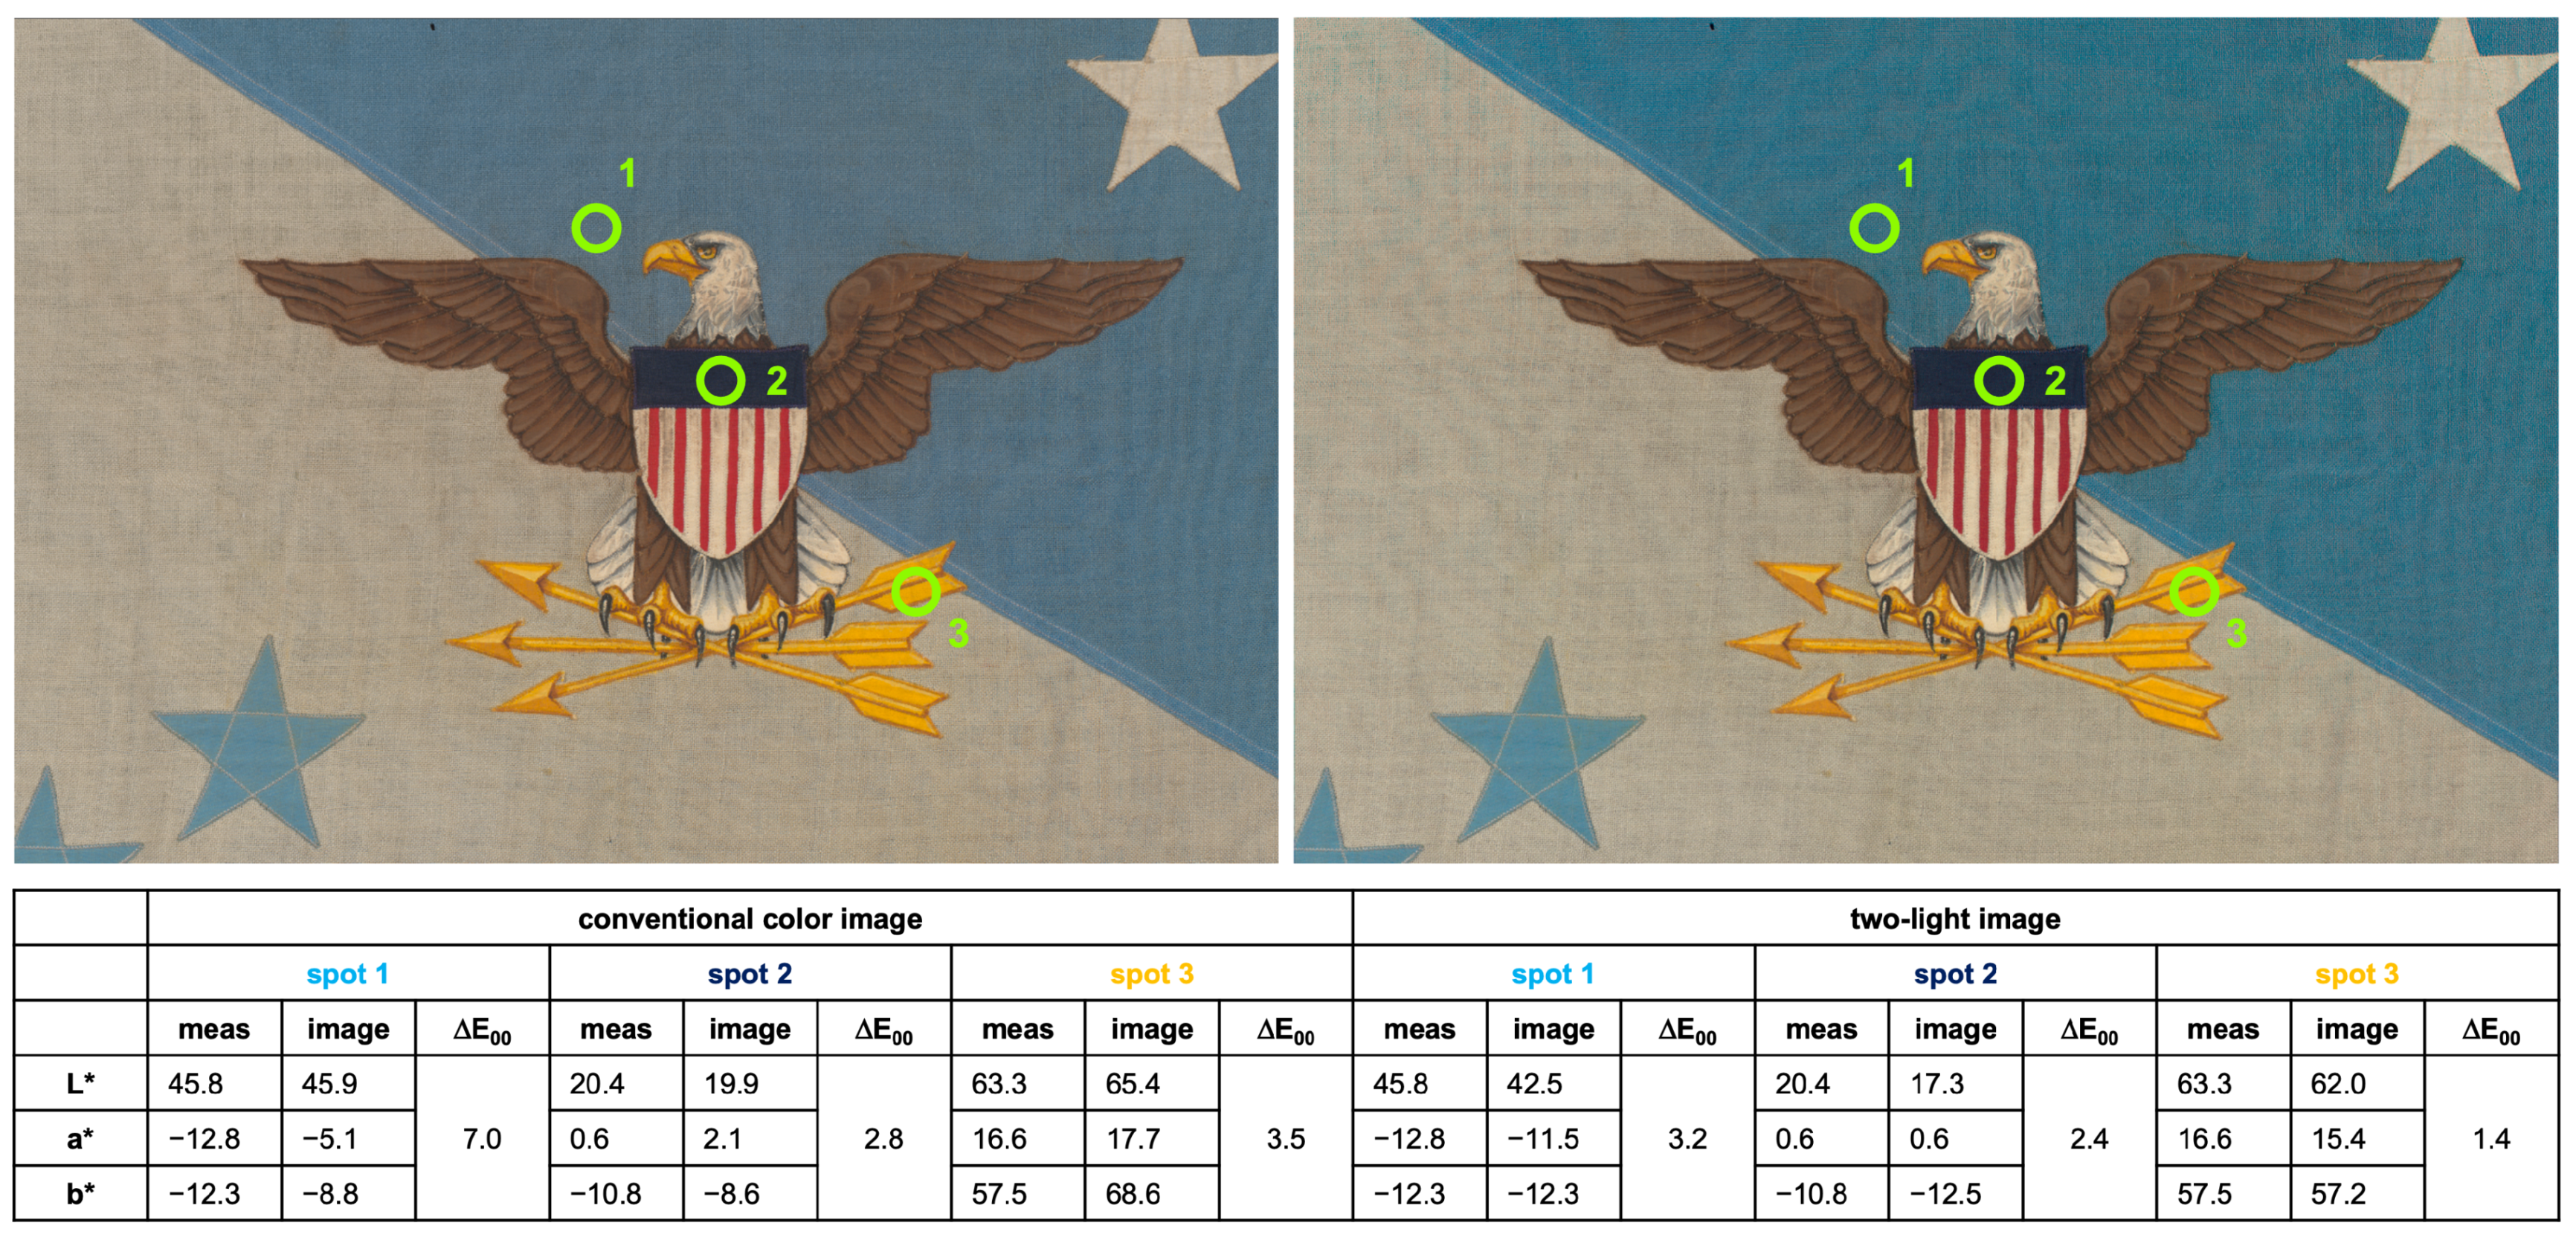
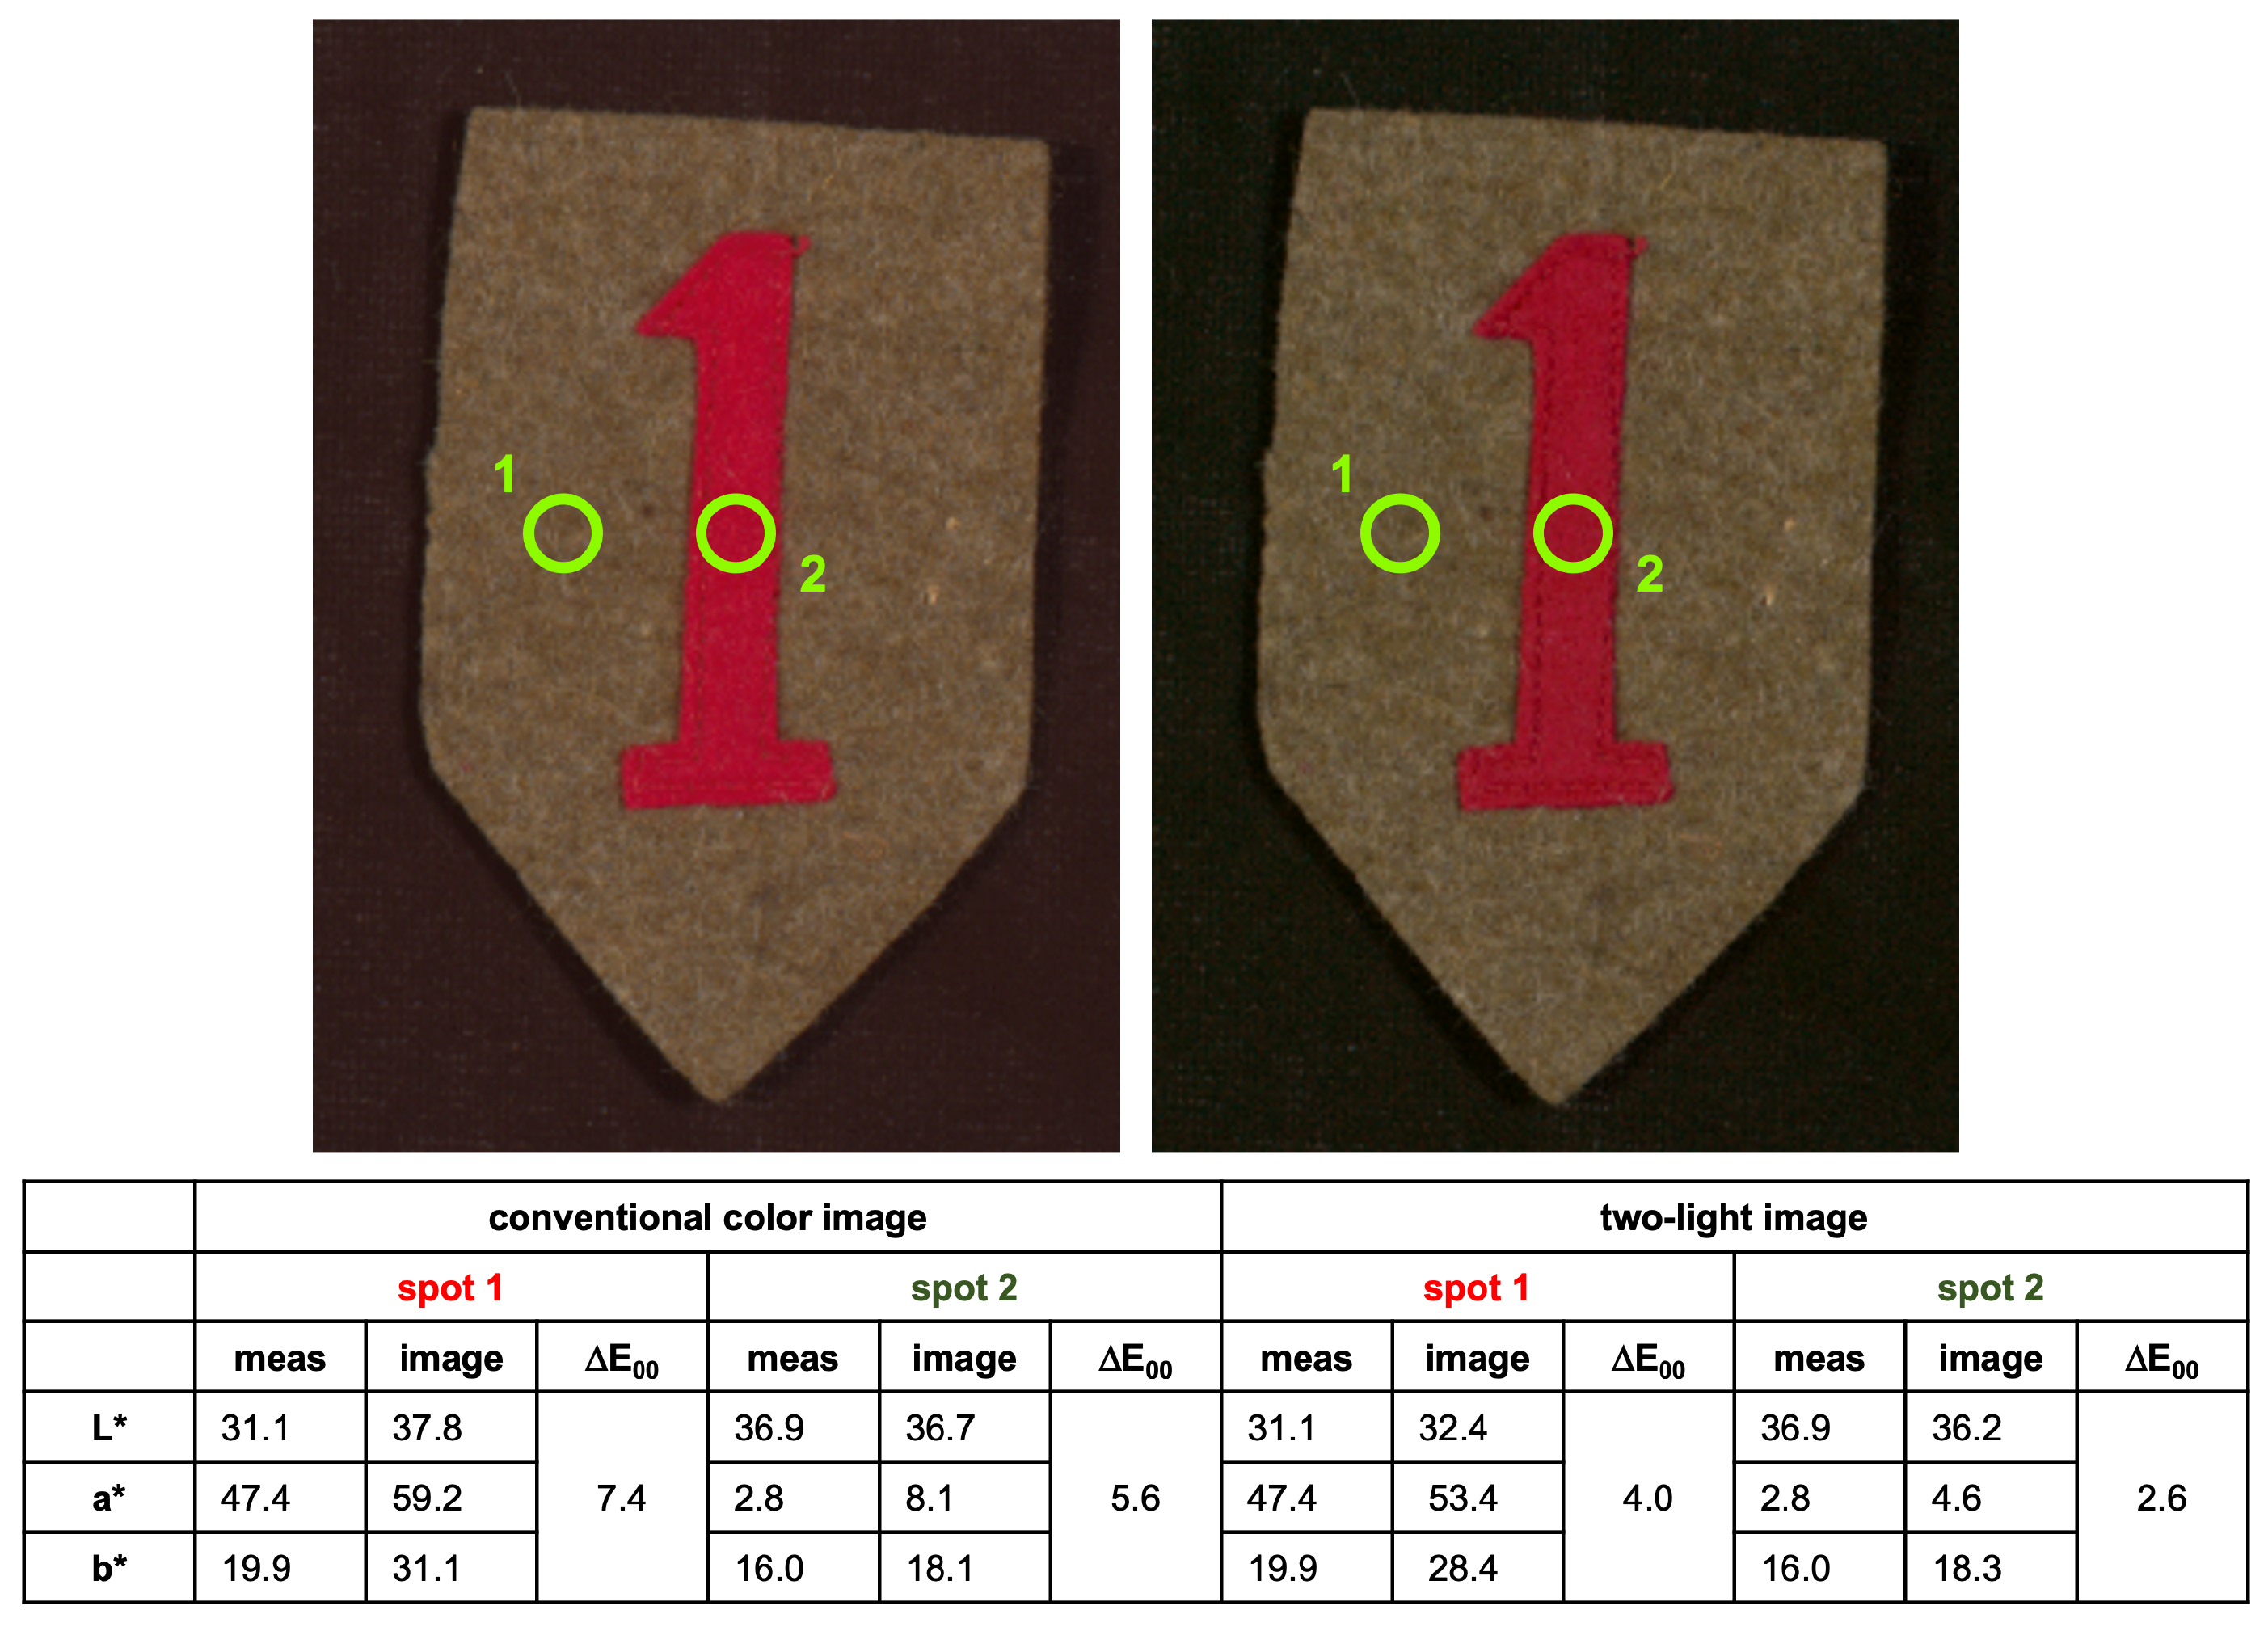
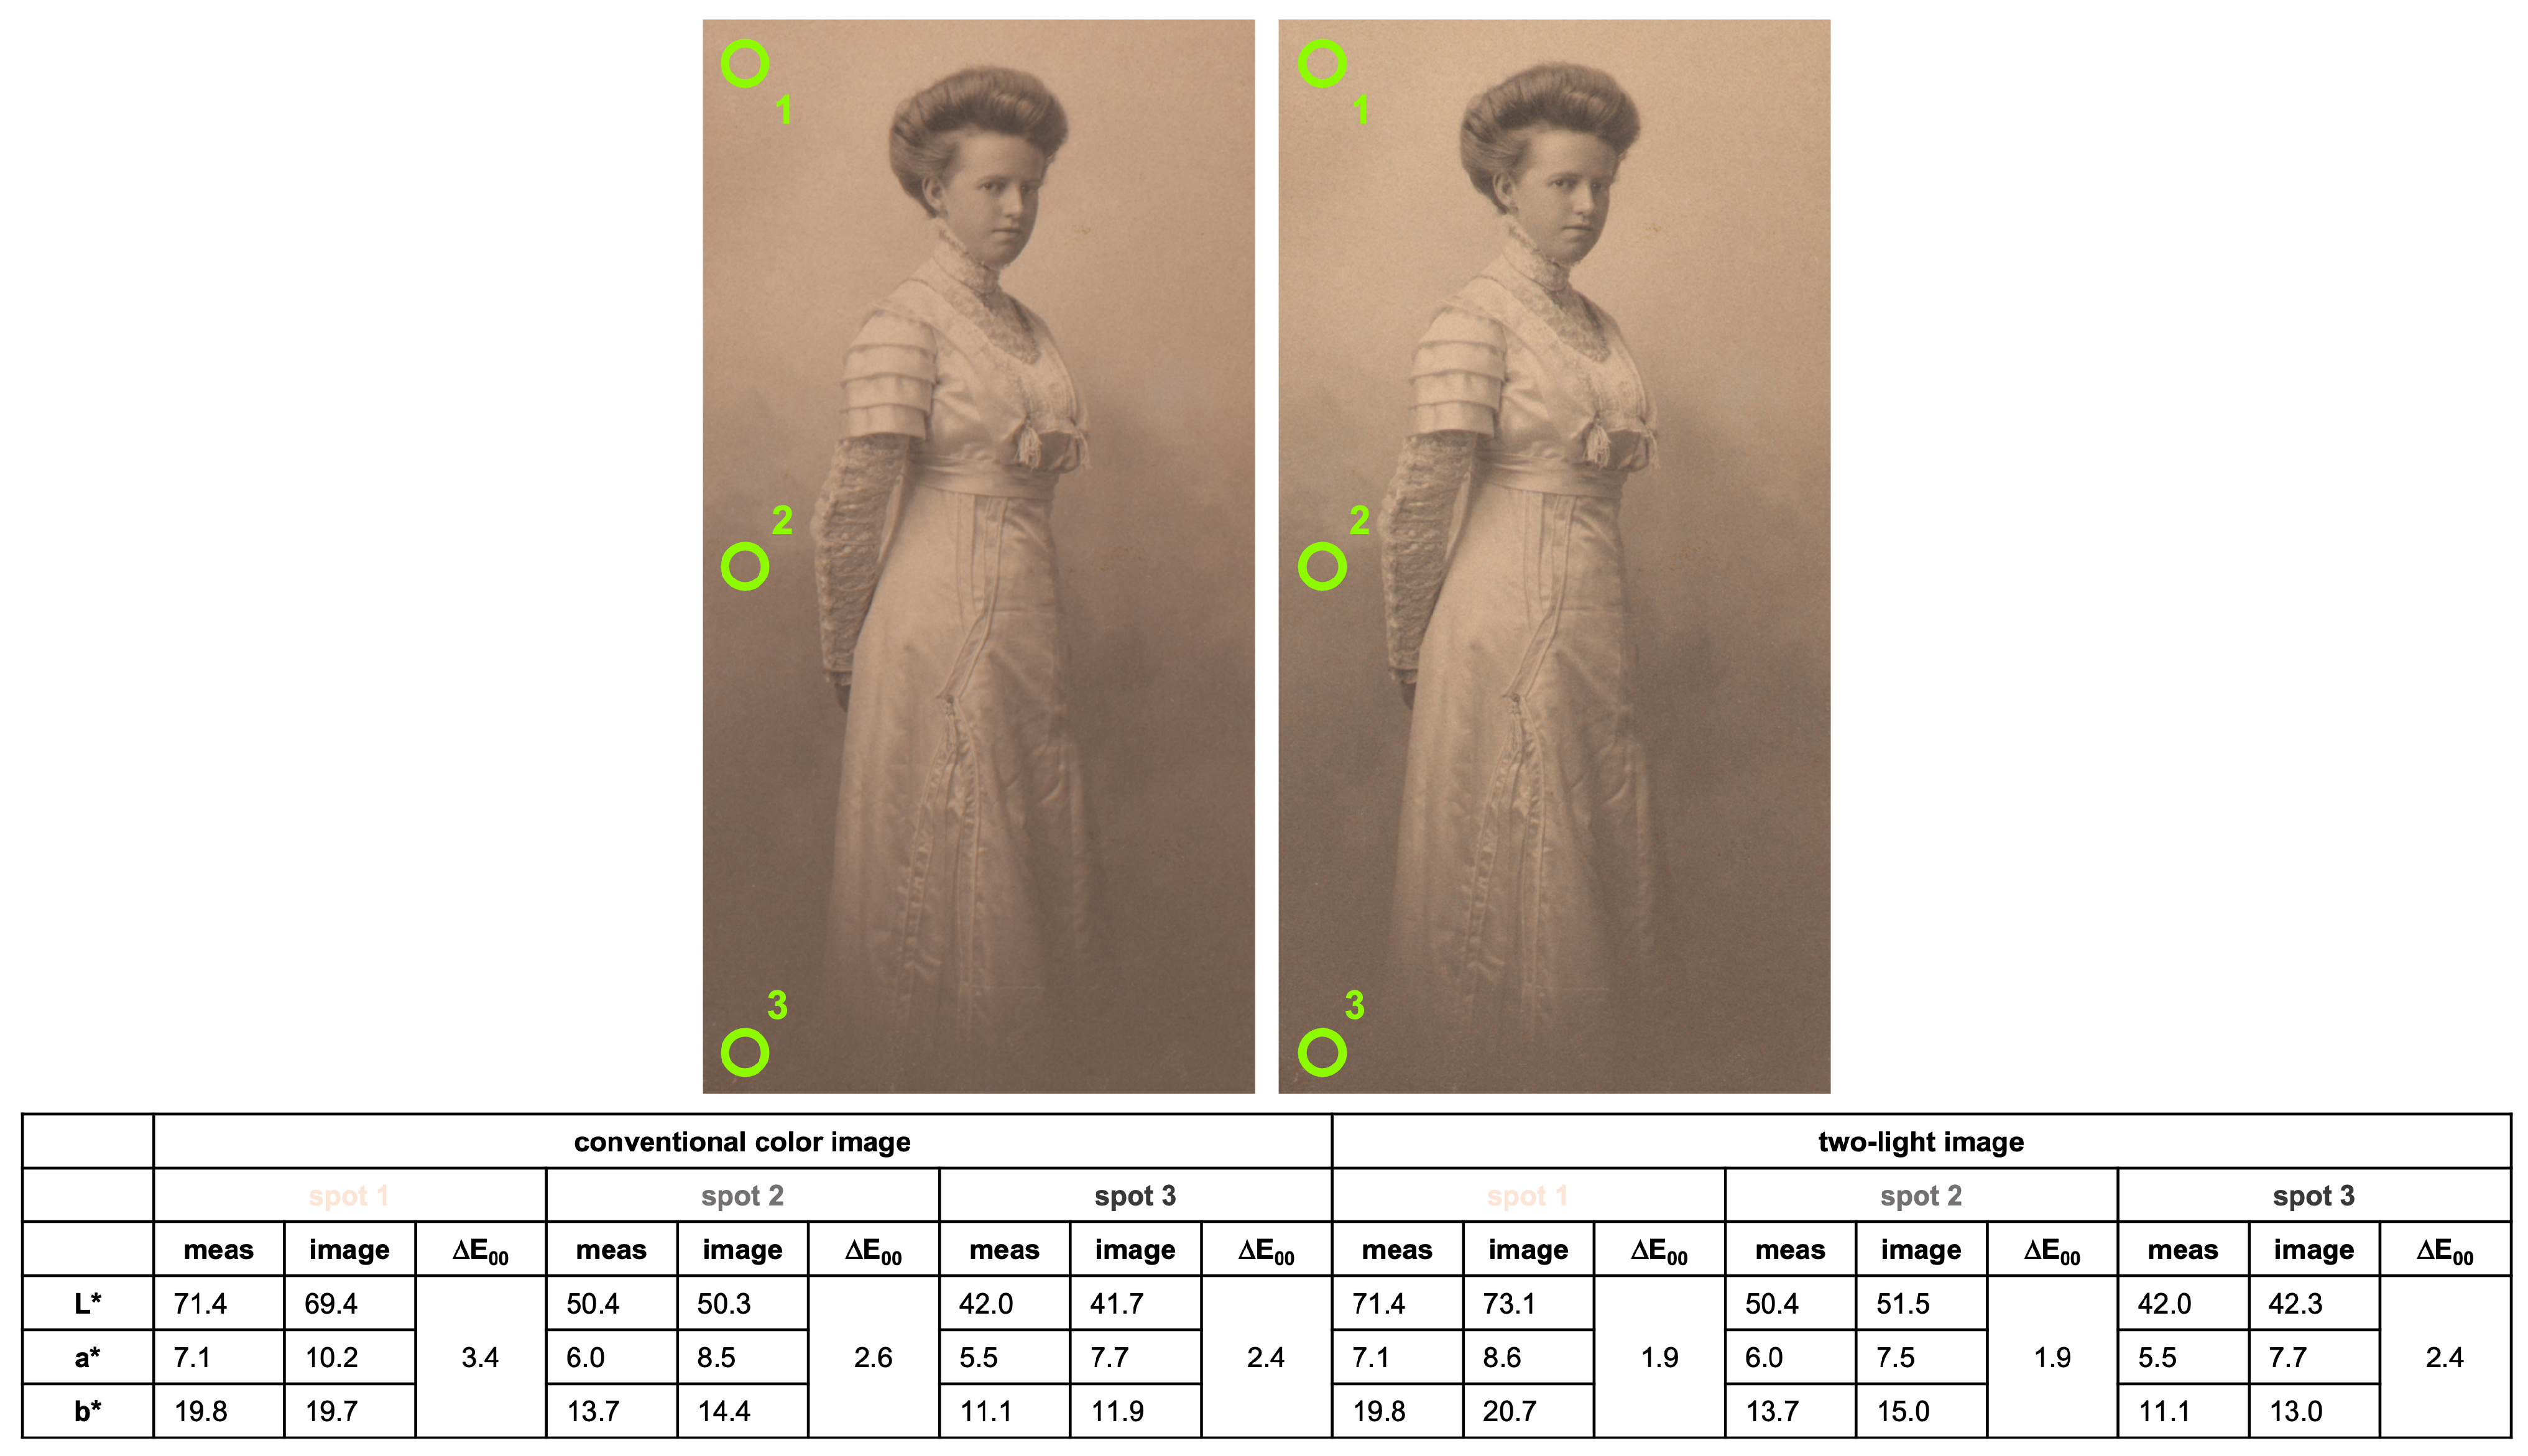
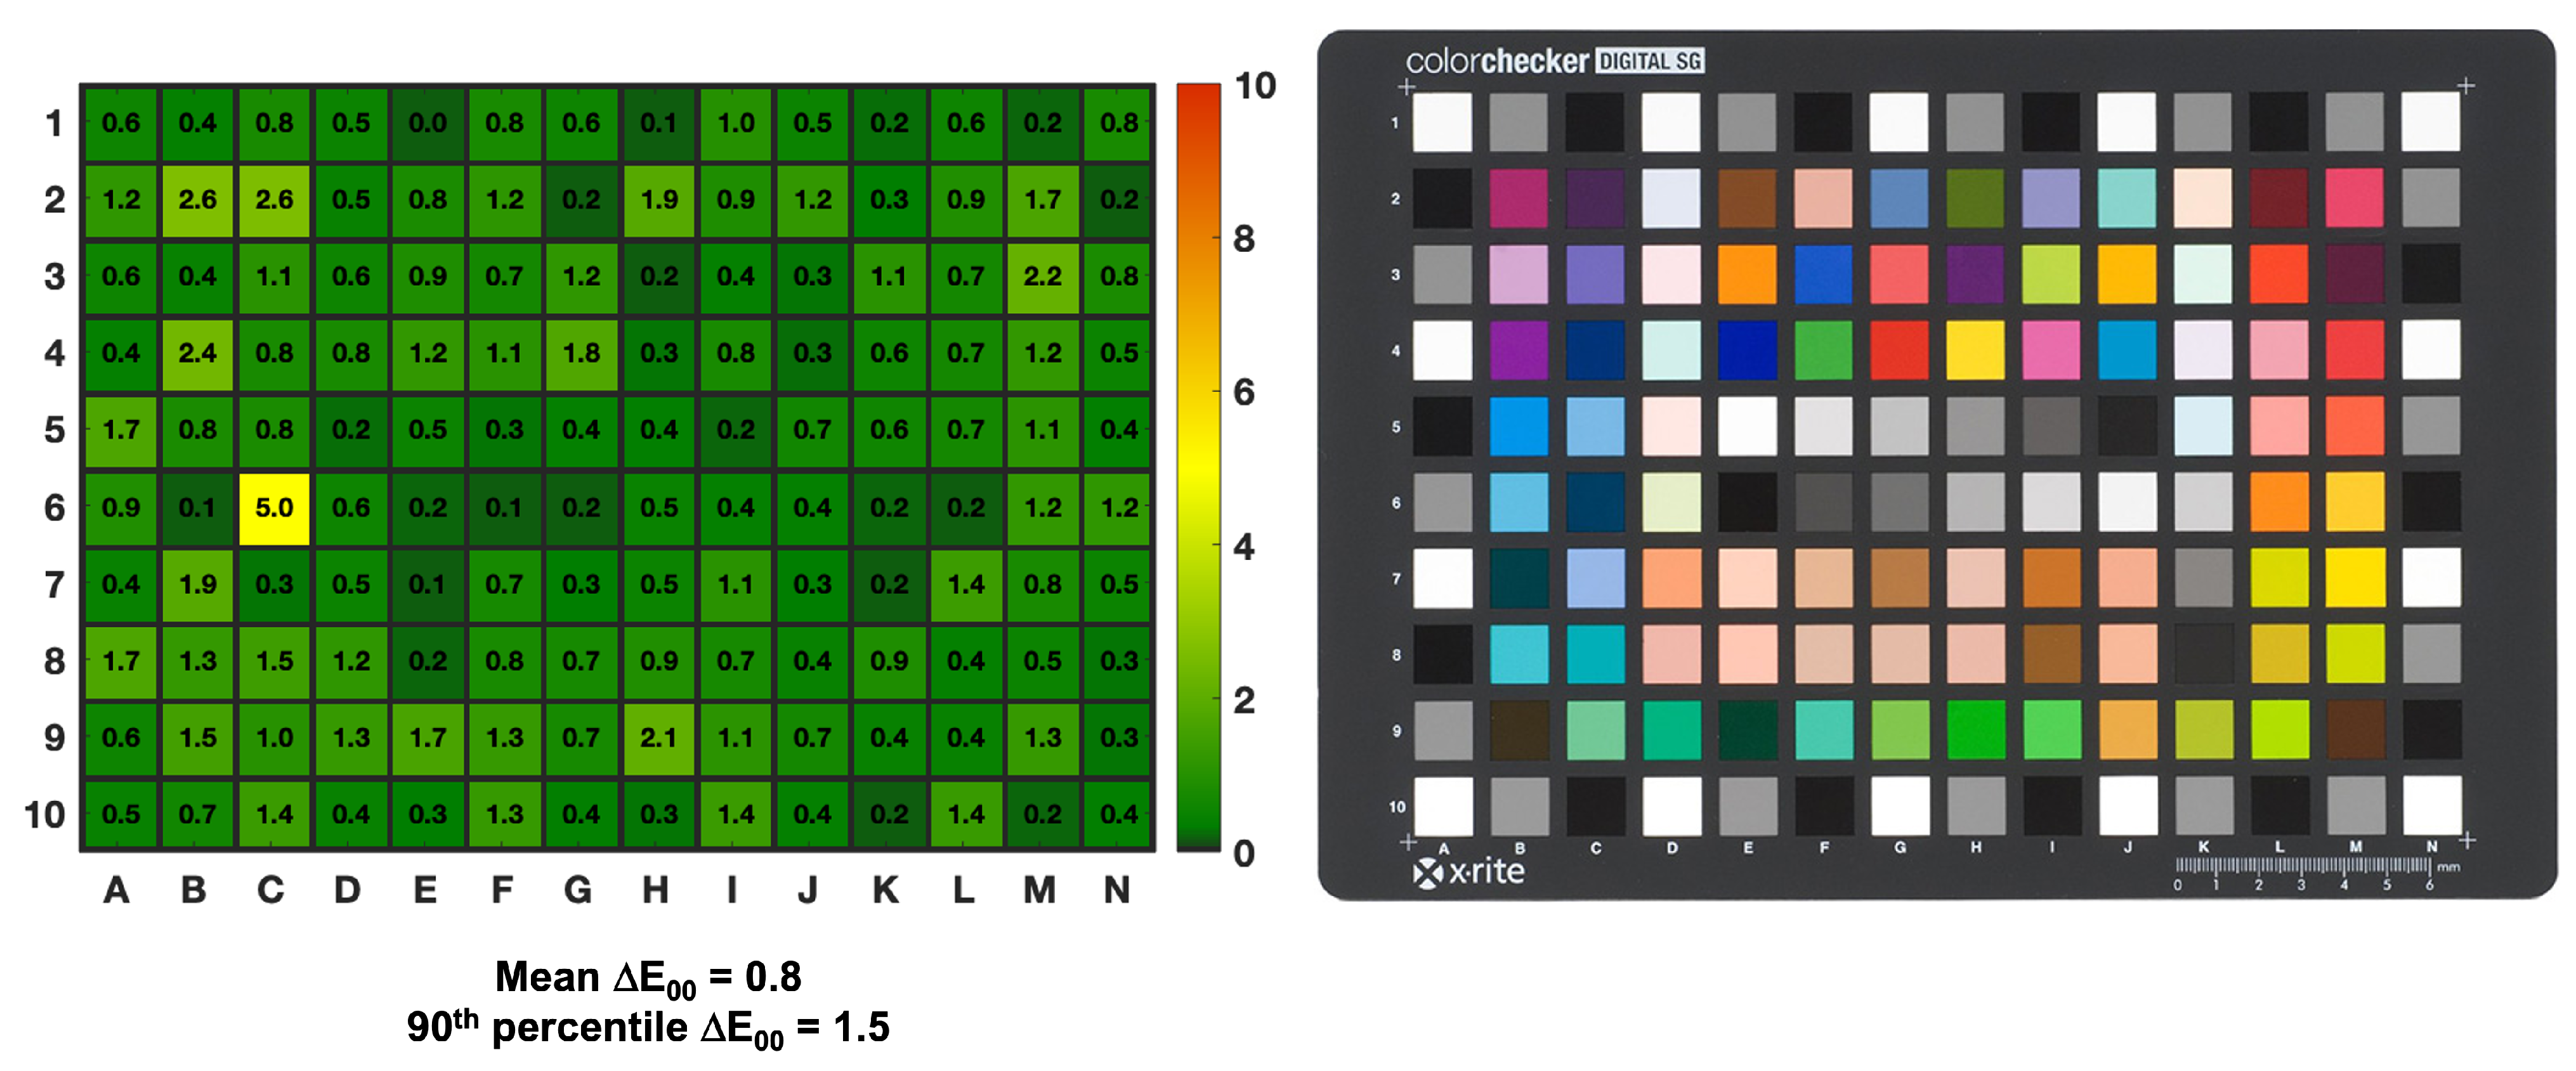
4.2. Example Results
4.3. Feedback and Future Work
- Batch processing. At present, a single calibration run of the software handles a single object image at a time, requiring time-consuming resetting of the calibration parameters for each run. Batch processing would enable the user to calibrate an entire set of images captured under the same calibration conditions much more efficiently.
- A project website. Currently, the project is hosted entirely on its GitHub repository. This can be difficult to navigate for novice users who only need access to the installation packages, Wiki, and user guide. These distributables would be better housed on a separate, dedicated website.
- An Adobe Camera Raw (ACR) RAW to TIFF workflow. The current version of Beyond RGB was tested with and supports Canon, Fujifilm, Nikon, and Sony RAW file formats. For cases where input images are not in one of these formats, it also supports uncompressed, unprocessed linear TIFFs created from RAW files. As ACR is a popular tool for working with RAW images, it was requested that specific guidelines for setting the correct parameters to obtain unprocessed TIFFs from RAWs using ACR be provided.
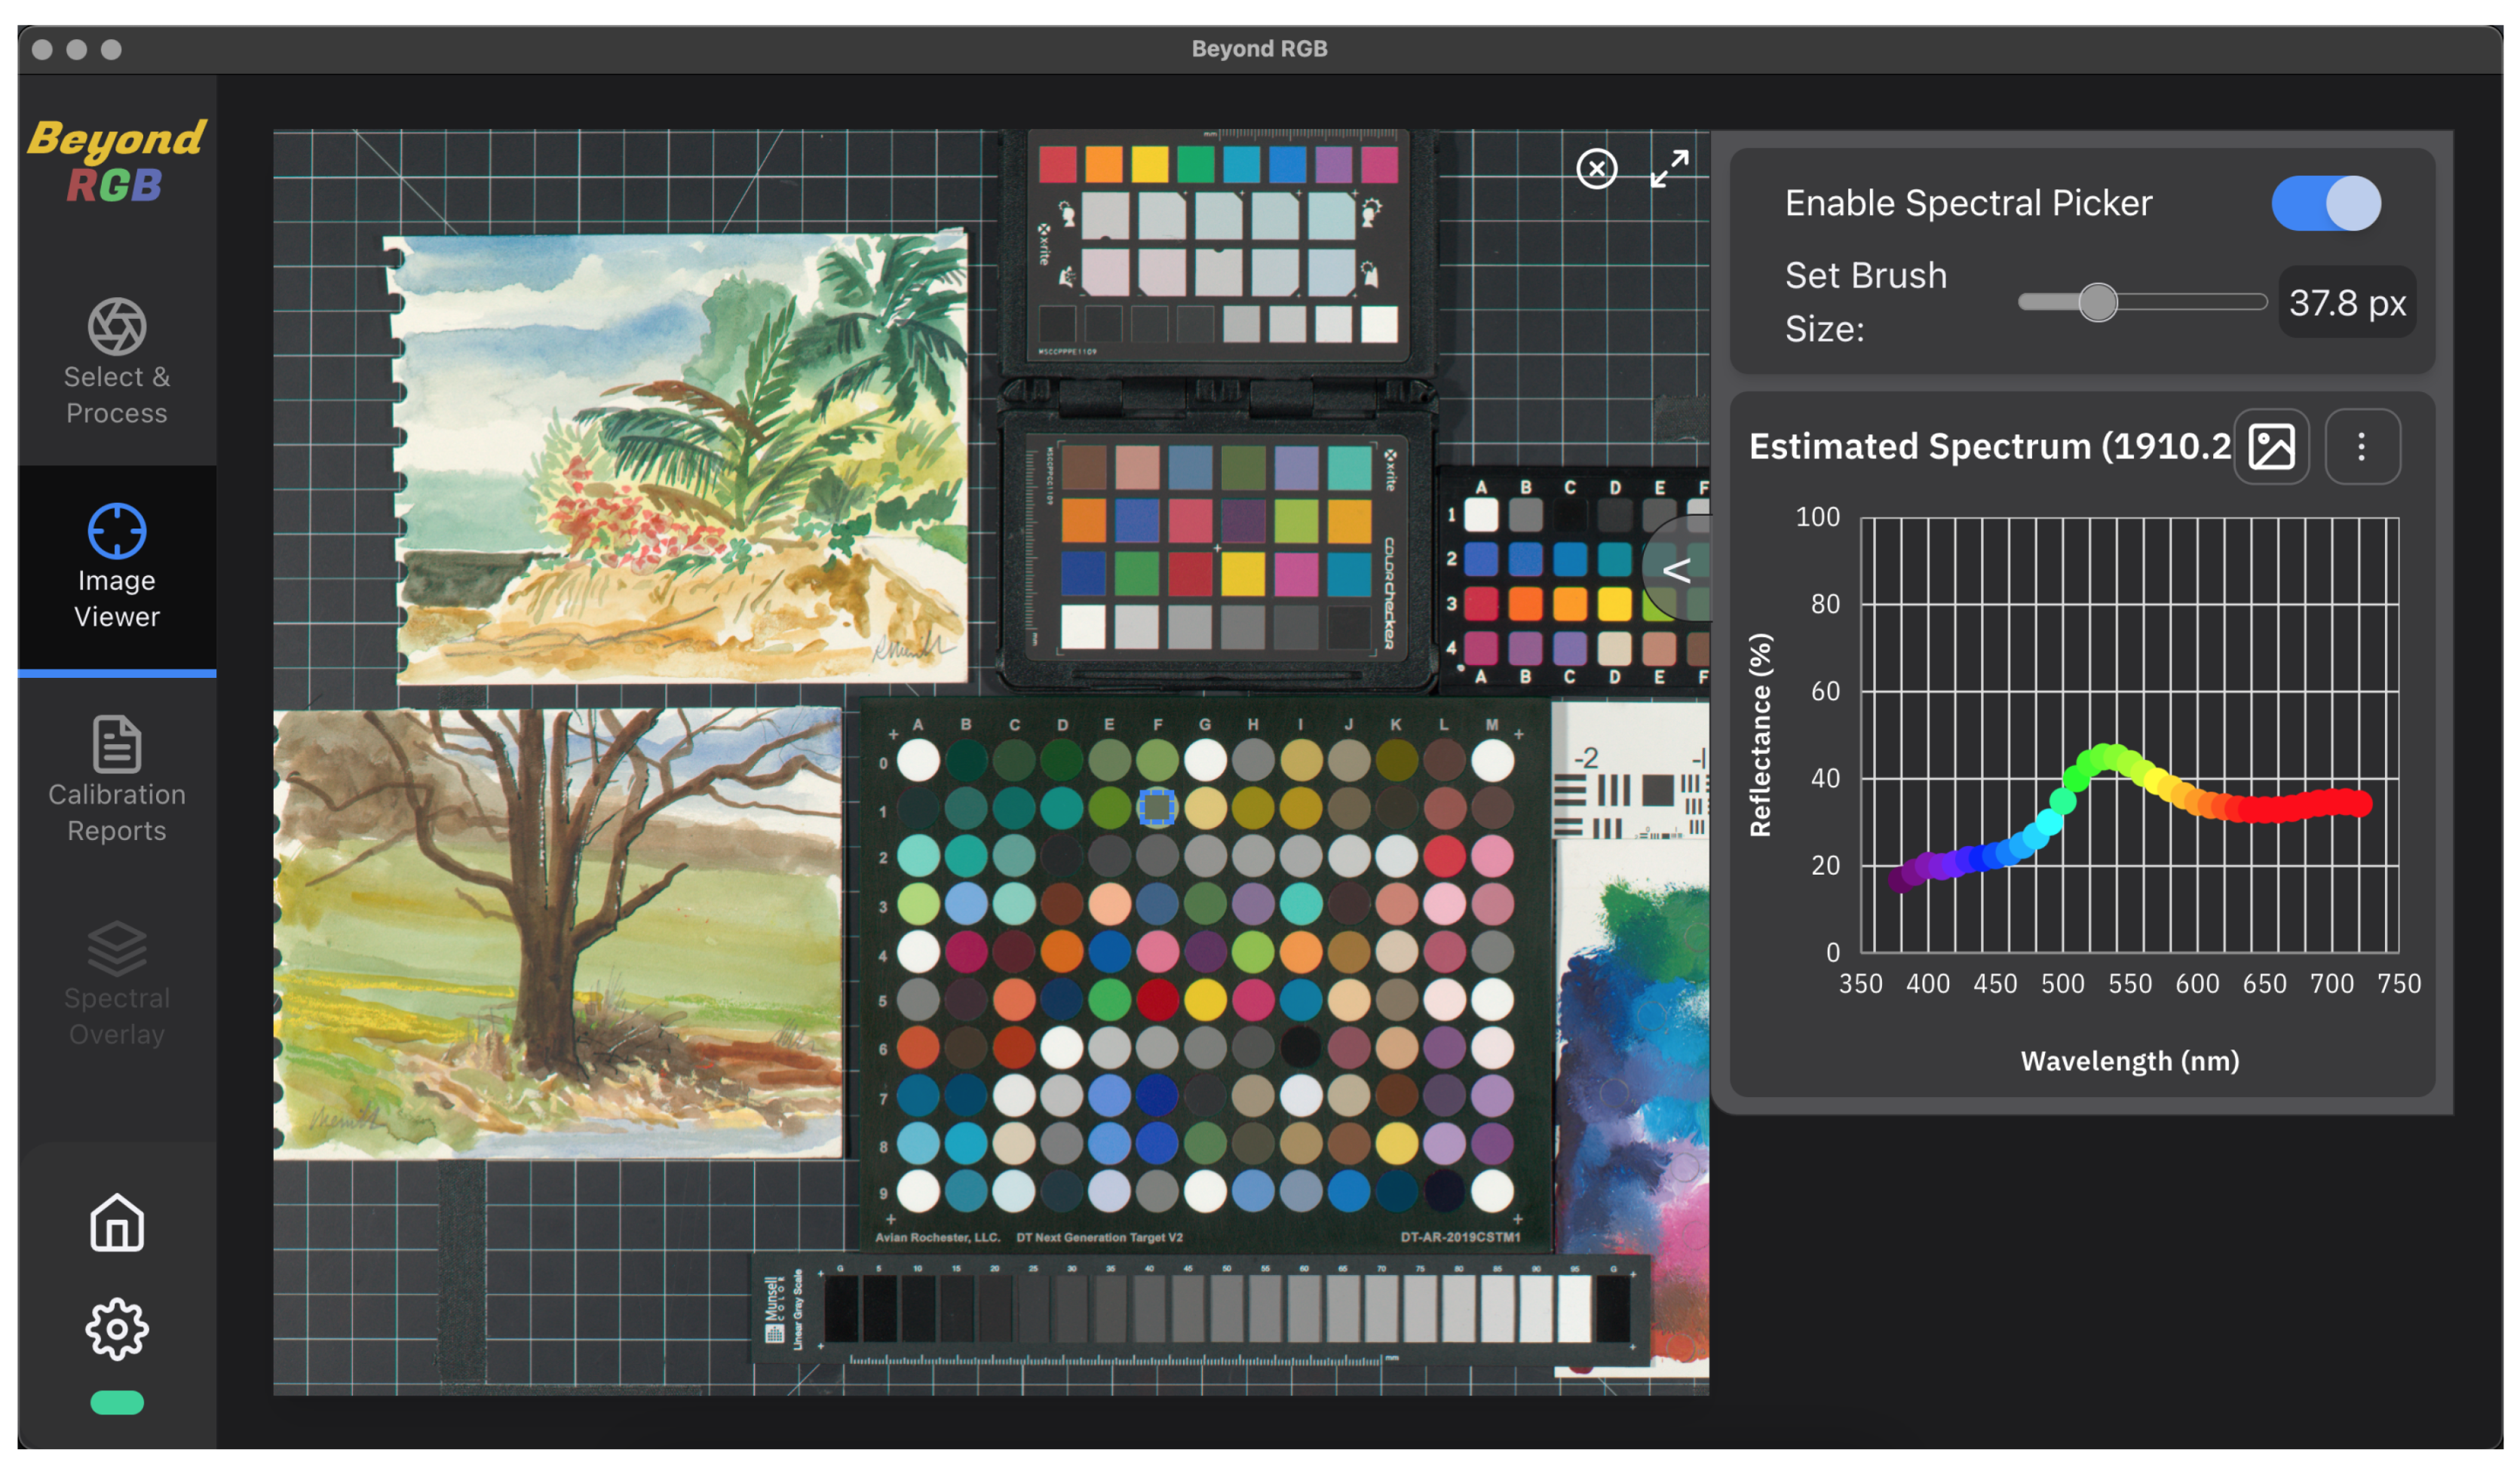
- Material mapping. The ability to estimate pixel-by-pixel reflectance spectra is a feature that already exists in Beyond RGB (Figure 10). Building in the capability to group and visualize the distribution of reflectance spectra having similar spectral features would be the first steps toward exploring the applicability of two-light imaging to the more typical tasks of spectral imaging, like pigment characterization and mapping.
5. Conclusions
Author Contributions
Funding
Institutional Review Board Statement
Data Availability Statement
Acknowledgments
Conflicts of Interest
References
- Saunders, D.; Cupitt, J. Image Processing at the National Gallery: The VASARI Project. Natl. Gallery Tech. Bull. 1993, 14, 72–85. [Google Scholar]
- Striova, J.; Dal Fovo, A.; Fontana, R. Reflectance imaging spectroscopy in heritage science. Riv. Del Nuovo Cim. 2020, 43, 515–566. [Google Scholar] [CrossRef]
- Jung, A. Hyperspectral Imaging. In Digital Techniques for Documenting and Preserving Cultural Heritage; Bentkowska-Kafel, A., MacDonald, L., Eds.; Arc Humanities Press: Leeds, UK, 2018; pp. 217–219. [Google Scholar]
- Delaney, J.K.; Dooley, K.A.; van Loon, A.; Vandivere, A. Mapping the pigment distribution of Vermeer’s Girl with a Pearl Earring. Herit. Sci. 2020, 8, 1–16. [Google Scholar] [CrossRef]
- Liang, H.; Lucian, A.; Lange, R.; Cheung, C.; Su, B. Remote spectral imaging with simultaneous extraction of 3D topography for historical wall paintings. ISPRS J. Photogramm. Remote Sens. 2014, 95, 13–22. [Google Scholar] [CrossRef]
- Cucci, C.; Delaney, J.K.; Picollo, M. Reflectance Hyperspectral Imaging for Investigation of Works of Art: Old Master Paintings and Illuminated Manuscripts. Accounts Chem. Res. 2016, 49, 2070–2079. [Google Scholar] [CrossRef] [PubMed]
- George, S.; Hardeberg, J.Y.; Linhares, J.; Macdonald, L.; Montagner, C.; Nascimento, S.; Picollo, M.; Pillay, R.; Vitorino, T.; Webb, E.K. A Study of Spectral Imaging Acquisition and Processing for Cultural Heritage. In Digital Techniques for Documenting and Preserving Cultural Heritage; Bentkowska-Kafel, A., MacDonald, L., Eds.; Arc Humanities Press: Leeds, UK, 2018; Chapter 8; pp. 141–158. [Google Scholar] [CrossRef]
- Martinez, K.; Cupitt, J.; Saunders, D.R. High-resolution colorimetric imaging of paintings. In Proceedings of the Cameras, Scanners, and Image Acquisition Systems Conference, San Jose, CA, USA, 31 January–5 February 1993; Volume 1901, pp. 25–36. [Google Scholar] [CrossRef]
- Ribés, A.; Schmitt, F.; Pillay, R.; Lahanier, C. Calibration and spectral reconstruction for CRISATEL: An art painting multispectral acquisition system. J. Imaging Sci. Technol. 2005, 49, 563–573. [Google Scholar]
- Berns, R.S. Color-Accurate Image Archives Using Spectral Imaging. In Scientific Examination of Art: Modern Techniques in Conservation and Analysis; The National Academies Press: Washington, DC, USA, 2005; Chapter 8; pp. 105–119. [Google Scholar]
- Wyble, D.R. Spectral Imaging: A Non-technical Introduction to What It Is, and Why You Should Care. In Proceedings of the Archiving 2021 Conference (Short Course Notes), Online, 8–24 June 2021. [Google Scholar]
- Kuzio, O.R.; Berns, R.S. Color and Material Appearance Imaging and Archiving Using a Sony Alpha a7R III Camera; Technical Report’; Rochester Institute of Technology: Rochester, NY, USA, 2018. [Google Scholar]
- Kuzio, O.; Farnand, S. Color Accuracy-Guided Data Reduction for Practical LED-based Multispectral Imaging. In Proceedings of the Archiving 2021 Conference, Online, 8–24 June 2021; pp. 65–70. [Google Scholar] [CrossRef]
- Kuzio, O.; Farnand, S. LED-based versus Filter-based Multispectral Imaging Methods for Museum Studio Photography. In Proceedings of the International Colour Association Conference 2021, Online, 30 August–3 September 2021; pp. 639–644. [Google Scholar]
- Kuzio, O.R.; Farnand, S.P. Beyond RGB: A spectral image processing software application for cultural heritage studio photography. In Proceedings of the Archiving 2022 Conference, Online, 7–10 June 2022; pp. 95–100. [Google Scholar] [CrossRef]
- Kuzio, O.R.; Farnand, S.P. Comparing Practical Spectral Imaging Methods for Cultural Heritage Studio Photography. J. Comput. Cult. Herit. 2022; just accepted. [Google Scholar] [CrossRef]
- Kuzio, O.; Farnand, S. Simulating the Effect of Camera and Lens Choice for Color Accurate Spectral Imaging of Cultural Heritage Materials. In Proceedings of the International Colour Association (AIC) Conference 2022, Online, 13–16 June 2022; p. TBD. [Google Scholar]
- Chen, T.; Berns, R.S. Measuring the Total Appearance of Paintings Using a Linear Source, Studio Strobes, and a Dual-RGB Camera; Technical Report; Rochester Institute of Technology: Rochester, NY, USA, 2012. [Google Scholar]
- Berns, R.S. Theory and Practice of Dual-RGB Imaging; Technical Report; Rochester Institute of Technology: Rochester, NY, USA, 2016. [Google Scholar]
- Imai, F.H.; Taplin, L.A.; Day, E.A. Comparative Study of Spectral Reflectance Estimation Based on Broad-Band Imaging Systems; Technical Report; Rochester Institute of Technology: Rochester, NY, USA, 2003. [Google Scholar]
- Berns, R.S.; Taplin, L.A.; Nezamabadi, M.; Zhao, Y. Modifications of a Sinarback 54 Digital Camera for Spectral and High-Accuracy Colorimetric Imaging: Simulations and Experiments; Technical Report; Rochester Institute of Technology: Rochester, NY, USA, 2004. [Google Scholar]
- Berns, R.S.; Taplin, L.A.; Nezamabadi, M.; Mohammadi, M.; Zhao, Y. Spectral imaging using a commercial colour-filter array digital camera. In Proceedings of the Fourteenth Triennial ICOM-CC Meeting, The Hague, The Netherlands, 12–16 September 2005; pp. 743–750. [Google Scholar]
- Sinar. Color To Match. Available online: https://sinar.swiss/products/cameras/ctm/ (accessed on 8 October 2022).
- Berns, R.S.; Taplin, L.A.; Imai, F.H.; Day, E.A.; Day, D.C. A Comparison of Small-Aperture and Image-Based Spectrophotometry of Paintings. Stud. Conserv. 2005, 50, 253–266. [Google Scholar] [CrossRef]
- Liang, H.; Saunders, D.; Cupitt, J. A New Multispectral Imaging System for Examining Paintings. J. Imaging Sci. Technol. 2005, 49, 551–562. [Google Scholar]
- Berns, R.S. Image Quality Degradation Caused by Color Transformations in Multispectral Imaging—A Practical Review. In Proceedings of the Archiving 2020 Conference, Online, 18–21 May 2020; pp. 60–68. [Google Scholar] [CrossRef]
- Sharma, G.; Wu, W.; Dalal, E.N. The CIEDE2000 color-difference formula: Implementation notes, supplementary test data, and mathematical observations. Color Res. Appl. 2005, 30, 21–30. [Google Scholar] [CrossRef]
- Christens-Barry, W.A.; Boydston, K.; France, F.G.; Knox, K.T.; Easton, R.L., Jr.; Toth, M.B. Camera system for multispectral imaging of documents. In Proceedings of the Sensors, Cameras, and Systems for Industrial/Scientific Applications Conference X, San Jose, CA, USA, 20–22 January 2009; Bodegom, E., Nguyen, V., Eds.; SPIE: Bellingham, WA, USA, 2009; Volume 7249, p. 724908. [Google Scholar] [CrossRef]
- France, F.G.; Toth, M.B.; Christens-Barry, W.A.; Boydston, K. Advanced Spectral Imaging for Microanalysis of Cultural Heritage. Microsc. Microanal. 2010, 16, 728–729. [Google Scholar] [CrossRef][Green Version]
- Gibson, A.; Piquette, K.E.; Bergmann, U.; Christens-Barry, W.; Davis, G.; Endrizzi, M.; Fan, S.; Farsiu, S.; Fitzgerald, A.; Griffiths, J.; et al. An assessment of multimodal imaging of subsurface text in mummy cartonnage using surrogate papyrus phantoms. Herit. Sci. 2018, 6, 7. [Google Scholar] [CrossRef]
- Paray, J.N. LED Selection for Spectral (Multispectral) Imaging. Master’s Thesis, Rochester Institute of Technology, Rochester, NY, USA, 2020. [Google Scholar]
- Berns, R.S. Digital color reconstructions of cultural heritage using color-managed imaging and small-aperture spectrophotometry. Color Res. Appl. 2019, 44, 531–546. [Google Scholar] [CrossRef]
- Shrestha, R.; Hardeberg, J.Y. An experimental study of fast multispectral imaging using LED illumination and an RGB camera. In Proceedings of the 23rd Color and Imaging Conference, Darmstadt, Germany, 19–23 December 2015; pp. 36–40. [Google Scholar]
- Shrestha, R.; Hardeberg, J.Y. Assessment of Two Fast Multispectral Systems for Imaging of a Cultural Heritage Artifact—A Russian Icon. In Proceedings of the 14th International Conference on Signal Image Technology and Internet-Based Systems, Las Palmas de Gran Canaria, Spain, 26–29 November 2018; pp. 645–650. [Google Scholar] [CrossRef]
- Fairchild, M.D.; Wyble, D.R.; Johnson, G.M. Matching image color from different cameras. In Proceedings of the Image Quality and System Performance Conference V, San Jose, CA, USA, 28–30 January 2008; Volume 6808. [Google Scholar] [CrossRef]
- Stokes, M.; Fairchild, M.D.; Berns, R.S. Precision Requirements for Digital Color Reproduction. ACM Trans. Graph. 1992, 11, 406–422. [Google Scholar] [CrossRef]
- Ledmotive Technologies. SPECTRA TUNE LAB: The Light Engine for Scientists. Available online: https://ledmotive.com/stlab/ (accessed on 23 February 2021).
- Wyble, D.R. Next generation camera calibration target for archiving. In Proceedings of the Archiving 2017 Conference, Riga, Latvia, 15–18 May 2017; pp. 127–132. [Google Scholar] [CrossRef]
- Berns, R.S. Artist Paint Target (APT): A Tool for Verifying Camera Performance; Technical Report; Rochester Institute of Technology: Rochester, NY, USA, 2014. [Google Scholar]
- Reichmann, M. Expose Right. 2003. Available online: https://luminous-landscape.com/expose-right/ (accessed on 8 October 2022).
- Studio for Scientific Imaging and Archiving of Cultural Heritage: Software. Available online: https://www.rit.edu/science/studio-scientific-imaging-and-archiving-cultural-heritage#software (accessed on 8 October 2022).
- Beyond RGB: Initial Releases. 2022. Available online: https://github.com/BeyondRGB/Imaging-Art-beyond-RGB/releases (accessed on 8 October 2022).
- Witwer, J.; Berns, R.S. Increasing the versatility of digitizations through post-camera flat-fielding. In Proceedings of the Archiving 2015 Conference, Los Angeles, CA, USA, 19–22 May 2015; pp. 110–113. [Google Scholar]
- Frey, F.S.; Farnand, S. Benchmarking Art Image Interchange Cycles; RIT School of Print Media: Rochester, NY, USA, 2011. [Google Scholar]
- Geffert, W.S. Transitioning to international imaging standards at the Metropolitan Museum of Art’s Photograph Studio: A case study. In Proceedings of the Archiving 2011 Conference, Salt Lake City, UT, USA, 16–19 May 2011; pp. 205–210. [Google Scholar]
- Cox, B.D.; Berns, R.S. Imaging artwork in a studio environment for computer graphics rendering. In Proceedings of the SPIE/IS&T Electronic Imaging Conference, San Francisco, CA, USA, 8–12 February 2015. [Google Scholar] [CrossRef]


Publisher’s Note: MDPI stays neutral with regard to jurisdictional claims in published maps and institutional affiliations. |
© 2022 by the authors. Licensee MDPI, Basel, Switzerland. This article is an open access article distributed under the terms and conditions of the Creative Commons Attribution (CC BY) license (https://creativecommons.org/licenses/by/4.0/).
Share and Cite
Kuzio, O.R.; Farnand, S.P. Toward Practical Spectral Imaging beyond a Laboratory Context. Heritage 2022, 5, 4140-4160. https://doi.org/10.3390/heritage5040214
Kuzio OR, Farnand SP. Toward Practical Spectral Imaging beyond a Laboratory Context. Heritage. 2022; 5(4):4140-4160. https://doi.org/10.3390/heritage5040214
Chicago/Turabian StyleKuzio, Olivia R., and Susan P. Farnand. 2022. "Toward Practical Spectral Imaging beyond a Laboratory Context" Heritage 5, no. 4: 4140-4160. https://doi.org/10.3390/heritage5040214
APA StyleKuzio, O. R., & Farnand, S. P. (2022). Toward Practical Spectral Imaging beyond a Laboratory Context. Heritage, 5(4), 4140-4160. https://doi.org/10.3390/heritage5040214