Article

Increased Imports of Colorants and Constituent Components during the 18th Century Reflects the Start of the Consumer Society in Norway

by
Margaret Aasness Knudtzon
Department of Archaeology, Conservation and History, Faculty of Humanities, University of Oslo, P.O. Box 1008, Blindern, 0315 Oslo, Norway
Heritage 2022, 5(4), 3705-3736; https://doi.org/10.3390/heritage5040193
Submission received: 14 October 2022 / Revised: 15 November 2022 / Accepted: 26 November 2022 / Published: 29 November 2022
(This article belongs to the Special Issue Dyes in History and Archaeology 41)

Abstract

:
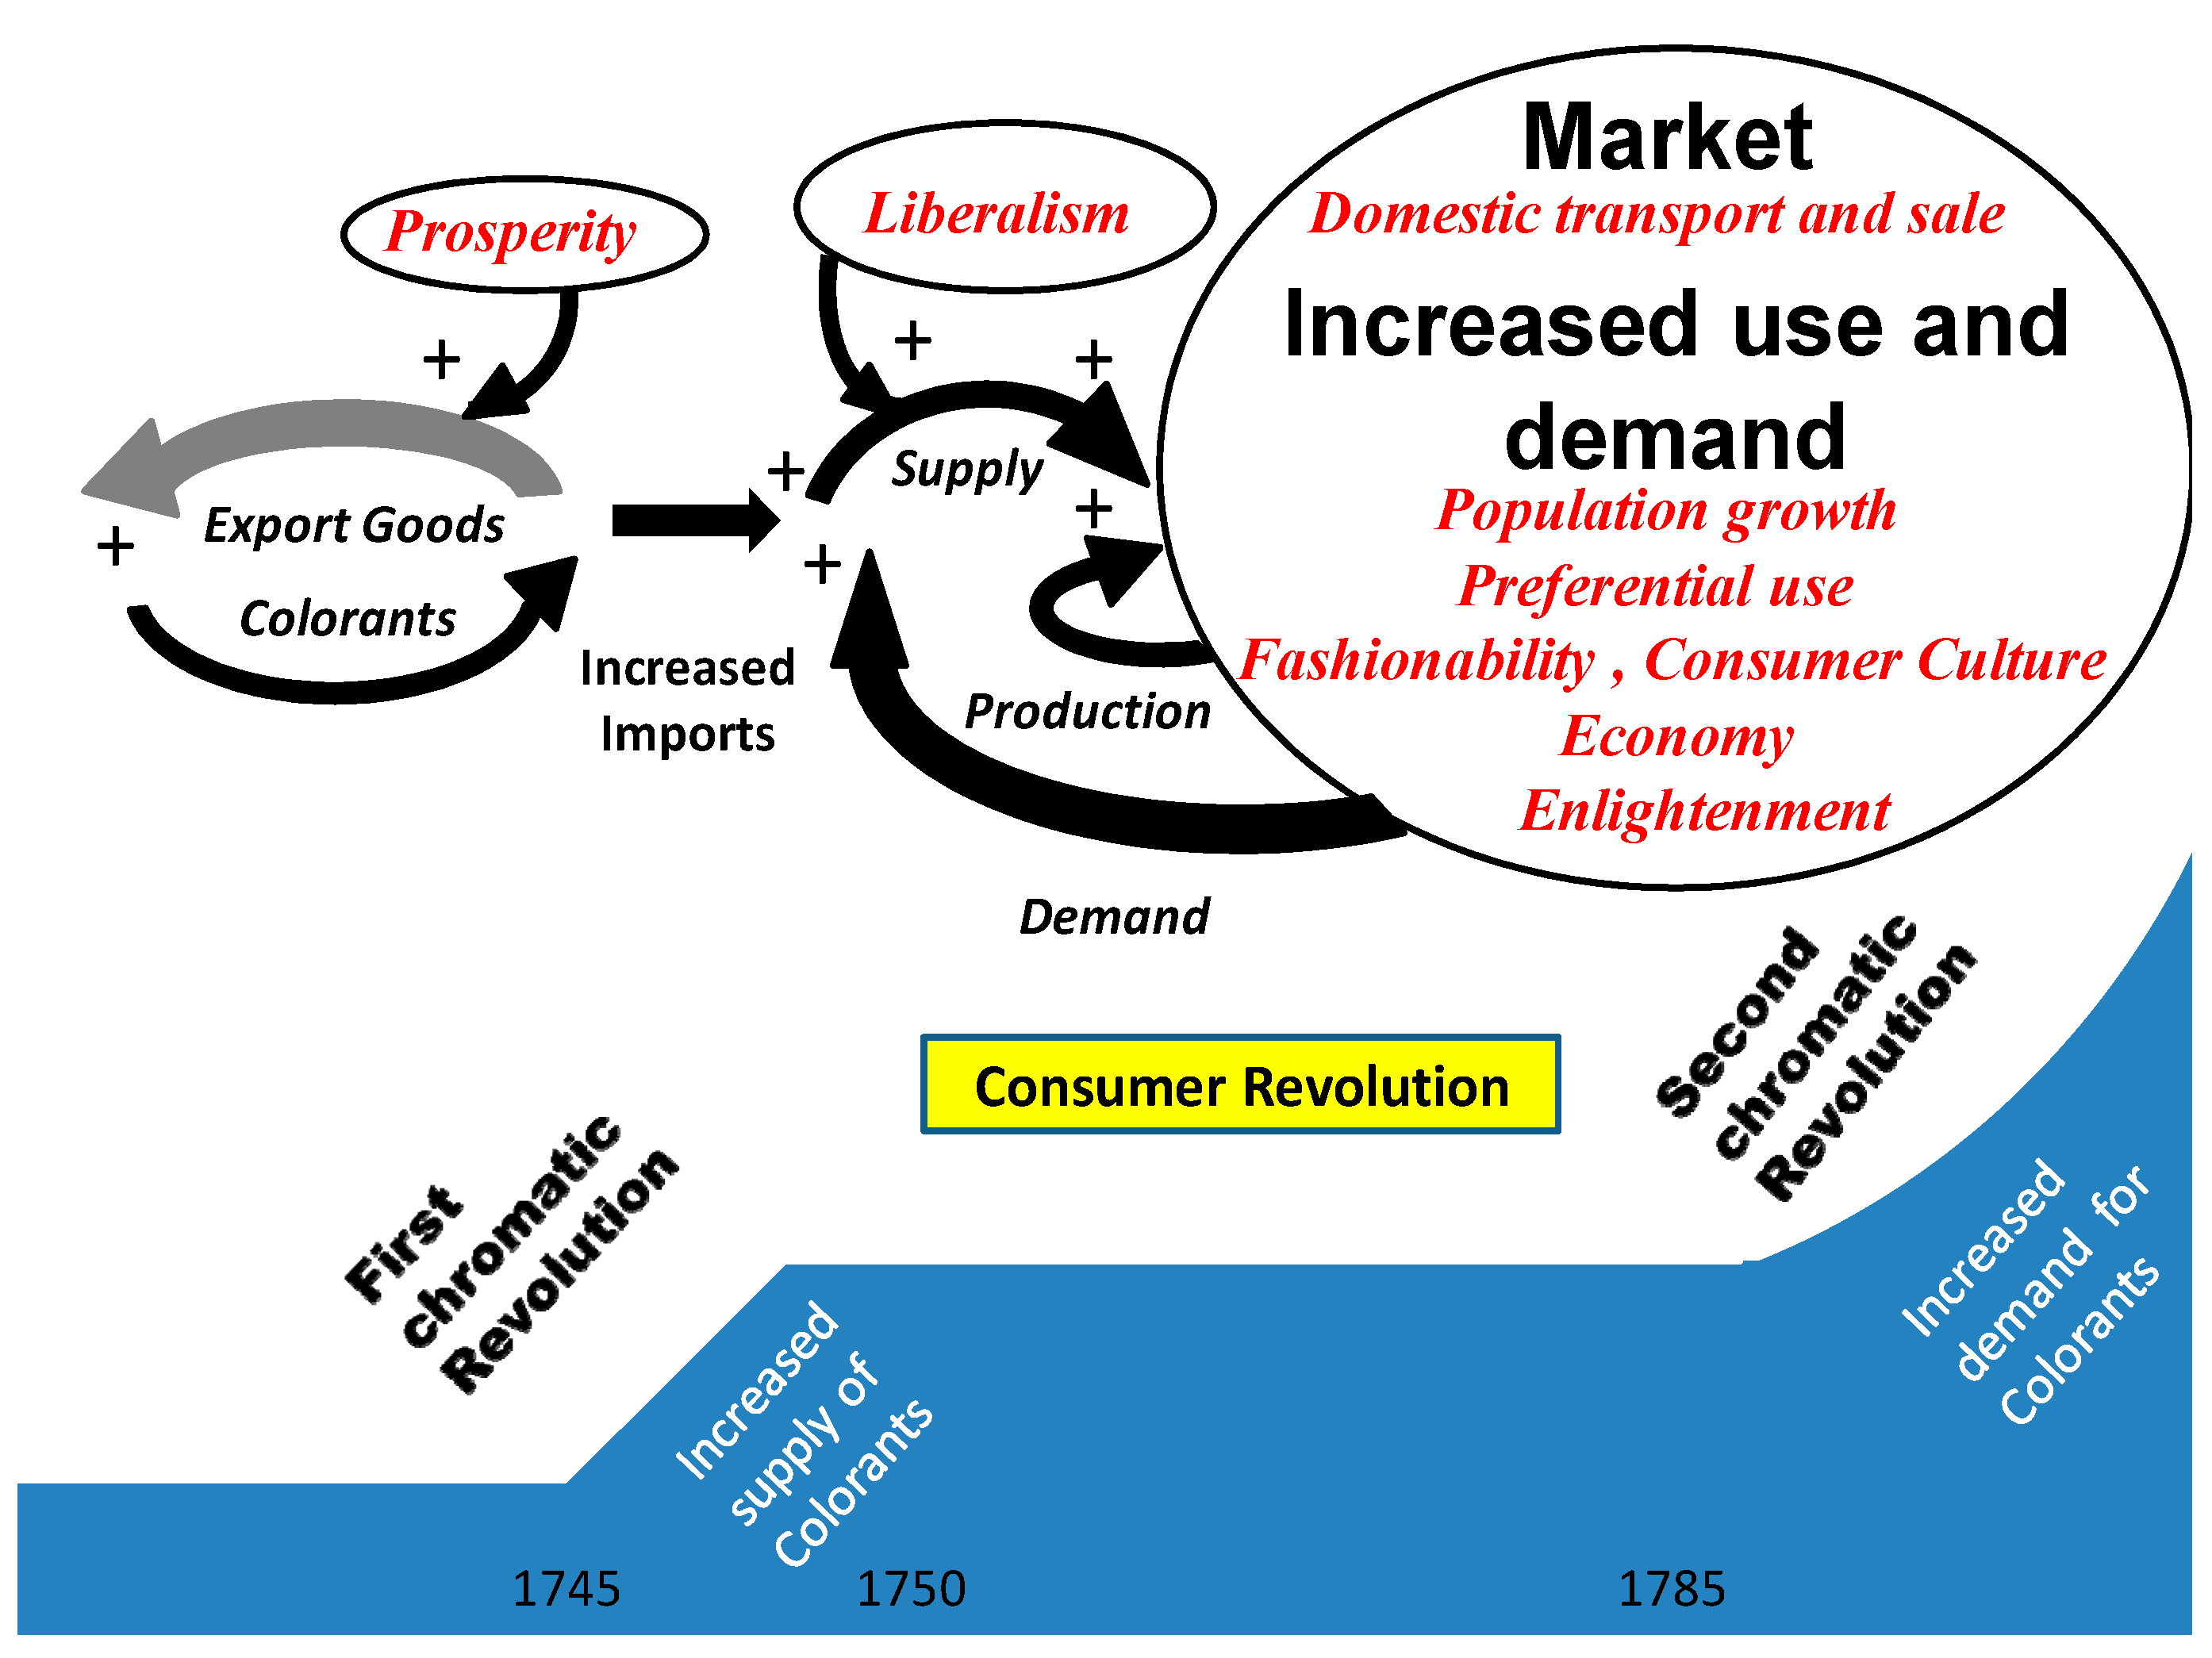
The start of the consumer society in Norway is examined by studying the increased imports of colorants and their constituents during the 18th century. Based on historical customs records, 82 imported pigments and dyes, 27 binders and additives and nine mordants and auxiliaries are presented. Imports increased significantly in the middle and at end of the century, representing two chromatic “revolutions”. This was especially evident for lead white and indigo; being the only particularly white and blue pigments used for painting and dyeing, respectively. Red dyes at different prices and properties (brazilwood, madder and cochineal) met the demands for red textile coloring in different social groups. The study presents a comprehensive overview of colorant imports and provides new insights in the development of consumption in Norway. Colorant imports were probably initiated by a supply-driven positive feed-back loop as a result of increased export trade. This was followed by a demand-driven loop, involving increased domestic trade, product preferences, “fashionability”, consumer culture, economic conditions and enlightenment. A model is presented that can contribute to a further understanding of the start of the consumer society in the second half of the 18th century in Norway.

1. Introduction

A consumer society is characterized by an increased use of new consumer goods. McKendrick, Brewer and Plumb showed in their 1982 book The Birth of a Consumer Society how the increased consumption of goods in England before the industrial revolution represented a consumer revolution [1]. Studies of probate records indicate that the increase in the number of clothing and household items in England started already in the 16th century and reached a peak around 1680–1720 [2]. Today, historians agree that a consumer society in Europe developed gradually over many years [3,4,5]. Some of the extensive historiography on the development of western consumer societies is summarized in Appendix A. In order to understand the development of the consumer society, emphasis has been placed on the importance of social and economic factors, and there has been a debate on the importance of supply and demand factors. As part of this debate, the present study has used colorant imports during the 18th century to analyze the development of the consumer society in Norway.
Colorants have been used as consumer and luxury goods for many centuries. Norwegian Vikings used an abundant amount of imported colorants both for decoration and dyeing [6,7]. Unn Plahter demonstrated the oldest known use of indigo in Norway on altar frontals from 1250–1350 [8]. Tropical indigo had already almost completely replaced the use of woad in Norway in the 17th century [9], which describes the close Norwegian trade relations with Europe. Norwegian export products such as timber, copper, klipfish and stockfish became important driving forces for European trade. The start of the Norwegian consumer society in the 18th century must be seen in the context of increased trade and the import of new consumer goods. During the 18th century, Norway experienced a color revolution when new imported colorants partly replaced the use of local produced pigments and dyes. Increased imports of colorants can therefore shed light on the start of the consumer society in the 18th century in Norway.
Based on digitized product lists from the Norwegian customs records, this survey provides an overview of color imports to Norway during the 18th century. This may be of interest within the disciplines of archaeology, building maintenance, conservation, ethnology and museology, as well as the disciplines of art, cultural, economics and textile history. Paint pigments and textile dyes have not previously been studied extensively with regard to the start of the consumer society. The present longitudinal study of imported colorants to Norway highlights that increased imports occurred in the middle of the 18th century, with a significant further increase in imports at the end of the century. Furthermore, factors and mechanisms are discussed which may partly clarify how a consumer society started in Norway in the 18th century [10].

2. Materials and Methods

The present study is based on imported goods declared at Norwegian customs offices and registered in customs records. Selected customs protocols have been transcribed from Gothic script and digitized as part of the project Historical customs and ship call lists [11]. The digitized product lists alle varer are available on the Internet, based on the protocols for 1685, 1686 and a selection of years during the 18th century, as well as digitized import data from trade statistics of 1835 [12]. Since only selected years have been digitized, the present study does not provide a complete evaluation of the annual imports throughout the 18th century. However, the results for a range of different colorants from these selected years provide a representative longitudinal picture of the flow of colorant items throughout the century.
From 1537 to 1814 Norway was part of the Kingdom Denmark-Norway. Goods registered in the customs records were mostly imported from European countries, and to a lesser extent from Denmark and other domestic customs ports. The colorants were imported to 25 different customs ports, mainly in Southern Norway. The largest custom ports of Bergen, Christiania (Oslo), Drammen and Trondheim contributed to most of the imported goods. Table 1 shows the years with the complete and “most” complete records for these ports (1686, 1731, 1733, 1754, 1756, 1786, 1788, 1790, 1792 and 1794) [12]. For five of these years data are missing or incomplete for Bergen, and for either Christiania, Drammen or Trondheim, data are missing for one of the years (Table 1). Additional information is available for Trondheim, where import data have been digitalized for several consecutive years. Dashed graph lines in the figures indicate a lack of data between the recorded years. When presenting the graphs, emphasis has been placed on the most complete registrations, but in cases where the imports for adjacent years show similar import quantities; these years have also been included. There are some sources of error with regard to the digitized product lists, including varying designations in units and under-reporting due to different names of the goods [13]. Smuggling, in particular, is a major under-reporting factor, which may have been as high as 20% [14]. However, the reported values are most likely comparable from year to year [15]. Colorant prices are stated in the customs records for only some years and goods. Most of the goods were weighed in pounds (Norwegian pund) of approximately 0.49 kg.
Some colorant items had multiple uses. Potash and sumac were imported in much larger quantities than other colorant items. Potash may have played a small role in dyeing to modify alkalinity, and sumac as a brown dye. However, they were probably mostly used in the glass industry and for tanning, respectively; in this study, they are therefore not included in calculations of colorant items. Other examples of agents with multiple uses were minium (red paint mostly used for ship-bottom paint), gallnuts (colorant, mordant but also used as ink), and saffron (the most expensive colorant at 8.6 daler/pound, probably almost exclusively used as a spice).
Historical descriptions have been studied with regard to the use of the colorants. During the first part of the 18th century, the best known Norwegian topographic descriptions in the broad sense are from 1743, based on responses to questions from the Danish Chancellery [16,17,18,19,20]. These descriptions provide a picture of Norwegian social conditions in the first part of the 18th century. In addition, local topographic descriptions, historical descriptions in travelogues and other historical literature throughout the century have been studied to provide information on the use of imported colorants. However, these descriptions are based on the reports of literate people and reflect mostly the view of civil servants.

3. Results

A total of 118 colorant items (Appendix B) were identified for paint and textile dyeing, of which 82 were pigments and dyes, 27 binders and additives (including constituents such as siccatives, diluents, resins and varnishes) and nine mordants and auxiliaries. As shown in the Appendix, some products were used for several purposes. In all, 29 colorant items were imported in 1685/1686, a further 69 during the 18th century, and 20 more in 1835. A total of 65 colorant items with more than 10 registrations are used to calculate the quantity of imports in the 18th century. Data on price were also recorded for 61 of the examples. For some colorants, such as verdigris, dyer’s buckthorn and Prussian blue, the distinction between pigment and dyes can be arbitrary. Cobalt, lichen and tar are mentioned as export goods and Danish red, alum and lime as domestic goods (Section 3.5).
The number of imported colorants and constituents increased throughout the 18th century, with a large increase between 1730 and 1760 (Figure 1a). Figure 1b shows the distribution percentage of imported amounts of pigments, dyes, mordants and binders. Measured in weight, about 50% more paint pigments (622,576 pounds, one Norwegian pund approximately 0.49 kg) than textile dyes (405,749 pounds) were imported. The amount of pigments for house painting (brown red, caput mortuum, carbon black, Danish red, earth pigment, English earth, lead white, minium, yellow ochre) was approximately 20 times larger than the pigments used for decorative art. Linseed oil is not included among the binders, because it was imported in original volume units (converted to liters [21]. Linseed oil was mostly produced in Norway. This may explain why the imported binders (113,700 pounds), which generally make up the largest volume in paint, accounted for less than 20% of the imported colorant items. Moreover, paints based on auxiliary agents (“emulsion paints”) were often used, and basic components such as water, lime, flour and eggs have not been included. The amount of imported mordants (337,216 pounds) was similar to the amount of imported dyes, which is consistent with the use of equivalent amounts of dyes and mordants in textile dyeing recipes.
Bergen accounted for the largest import quantities relative to the population. There is limited information on the foreign trading partners, but when specified, most of the trade was with the Netherlands, followed by Altona–Hamburg and England–Scotland–Ireland. There were also local differences in the use of dyes. With regard to red dyes, Bergen imported mostly madder, Trondheim mostly redwood, while Christiania imported both cochineal and redwood. Saw-wort was used in Bergen while annatto, imported both as orleans and uldrian (the name is derived from the Danish pronunciation of orleans), was the preferred yellow dye in Christiania and Trondheim.

3.1. Pigments, Binders and Other Additives

Figure 2a shows import graphs for pigments for house painting. Lead white was imported in the largest quantities. Red pigments for house painting consisted of iron oxide pigments (brown red, earth pigment, Danish red, English earth and caput mortuum) and minium. Imports increased in the middle and end of the 18th century. The only blue color suitable for painting was Prussian blue (see bellow), imported from 1733. This pigment was expensive (1.51 Norwegian daler/pound), imported in small quantities (1,537 pounds) and probably mostly used as a decorative pigment color. Yellow ochre (0.05 daler/pound) was imported in larger quantities (48,543 pounds) at the end of the century (Figure 1a). Umber (0.13 daler/pound) was imported in small amounts (1,038 pounds) and probably mostly used for decoration.
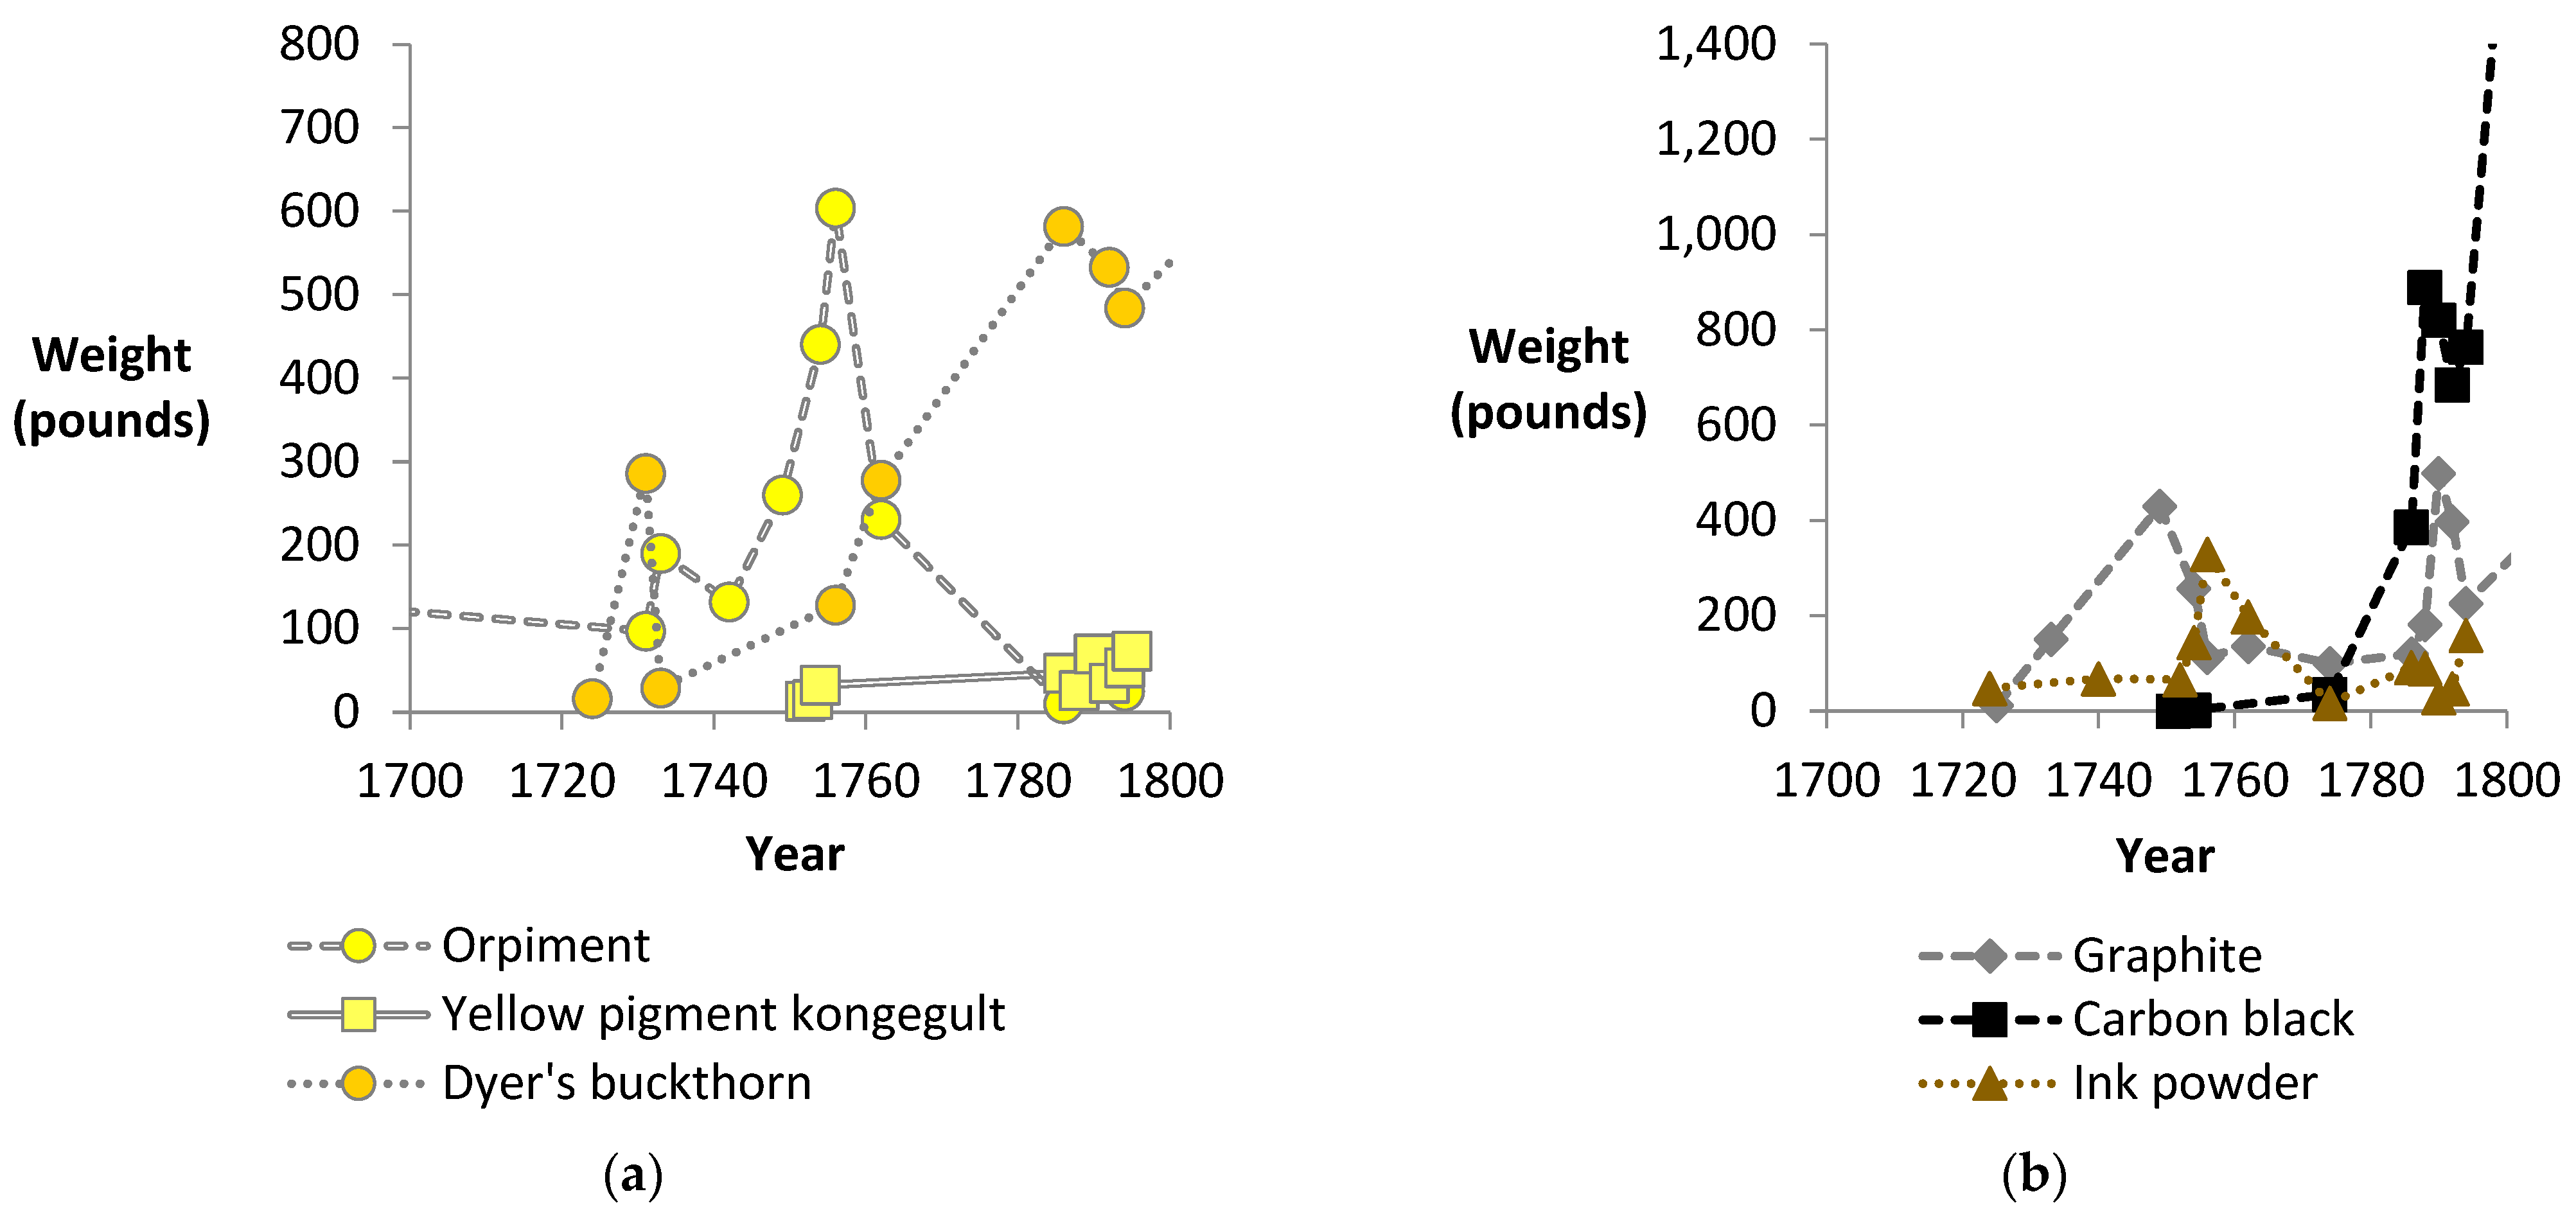
Figure 3 shows imports of yellow and black pigments, mostly used for decoration. Imports of toxic orpiment (also imported as rusgel) more or less ceased in the second half of the 18th century. It was probably replaced by dyer’s buckthorn lake pigment and an unspecified kongegult (transl. king’s yellow and probably synthetic orpiment). Graphite and ink powder were used in the middle of the 18th century, while imports of carbon black increased significantly at the end of the century. Tar had been used for centuries, but its use was reduced due to being a fire hazard.
Red lake pigments made of cochineal, redwood and madder (Florentine lake, kulelakk and kurlakk) were also imported in small amounts. Blue cobalt color was imported as smalt, smalt blausel and smalt blue, while cobalt was an export product. Verdigris was used both as a paint pigment and a textile dye. Some imported dyes, such as indigo, litmus, turmeric and dyer’s buckthorn, may also have been used for painting.
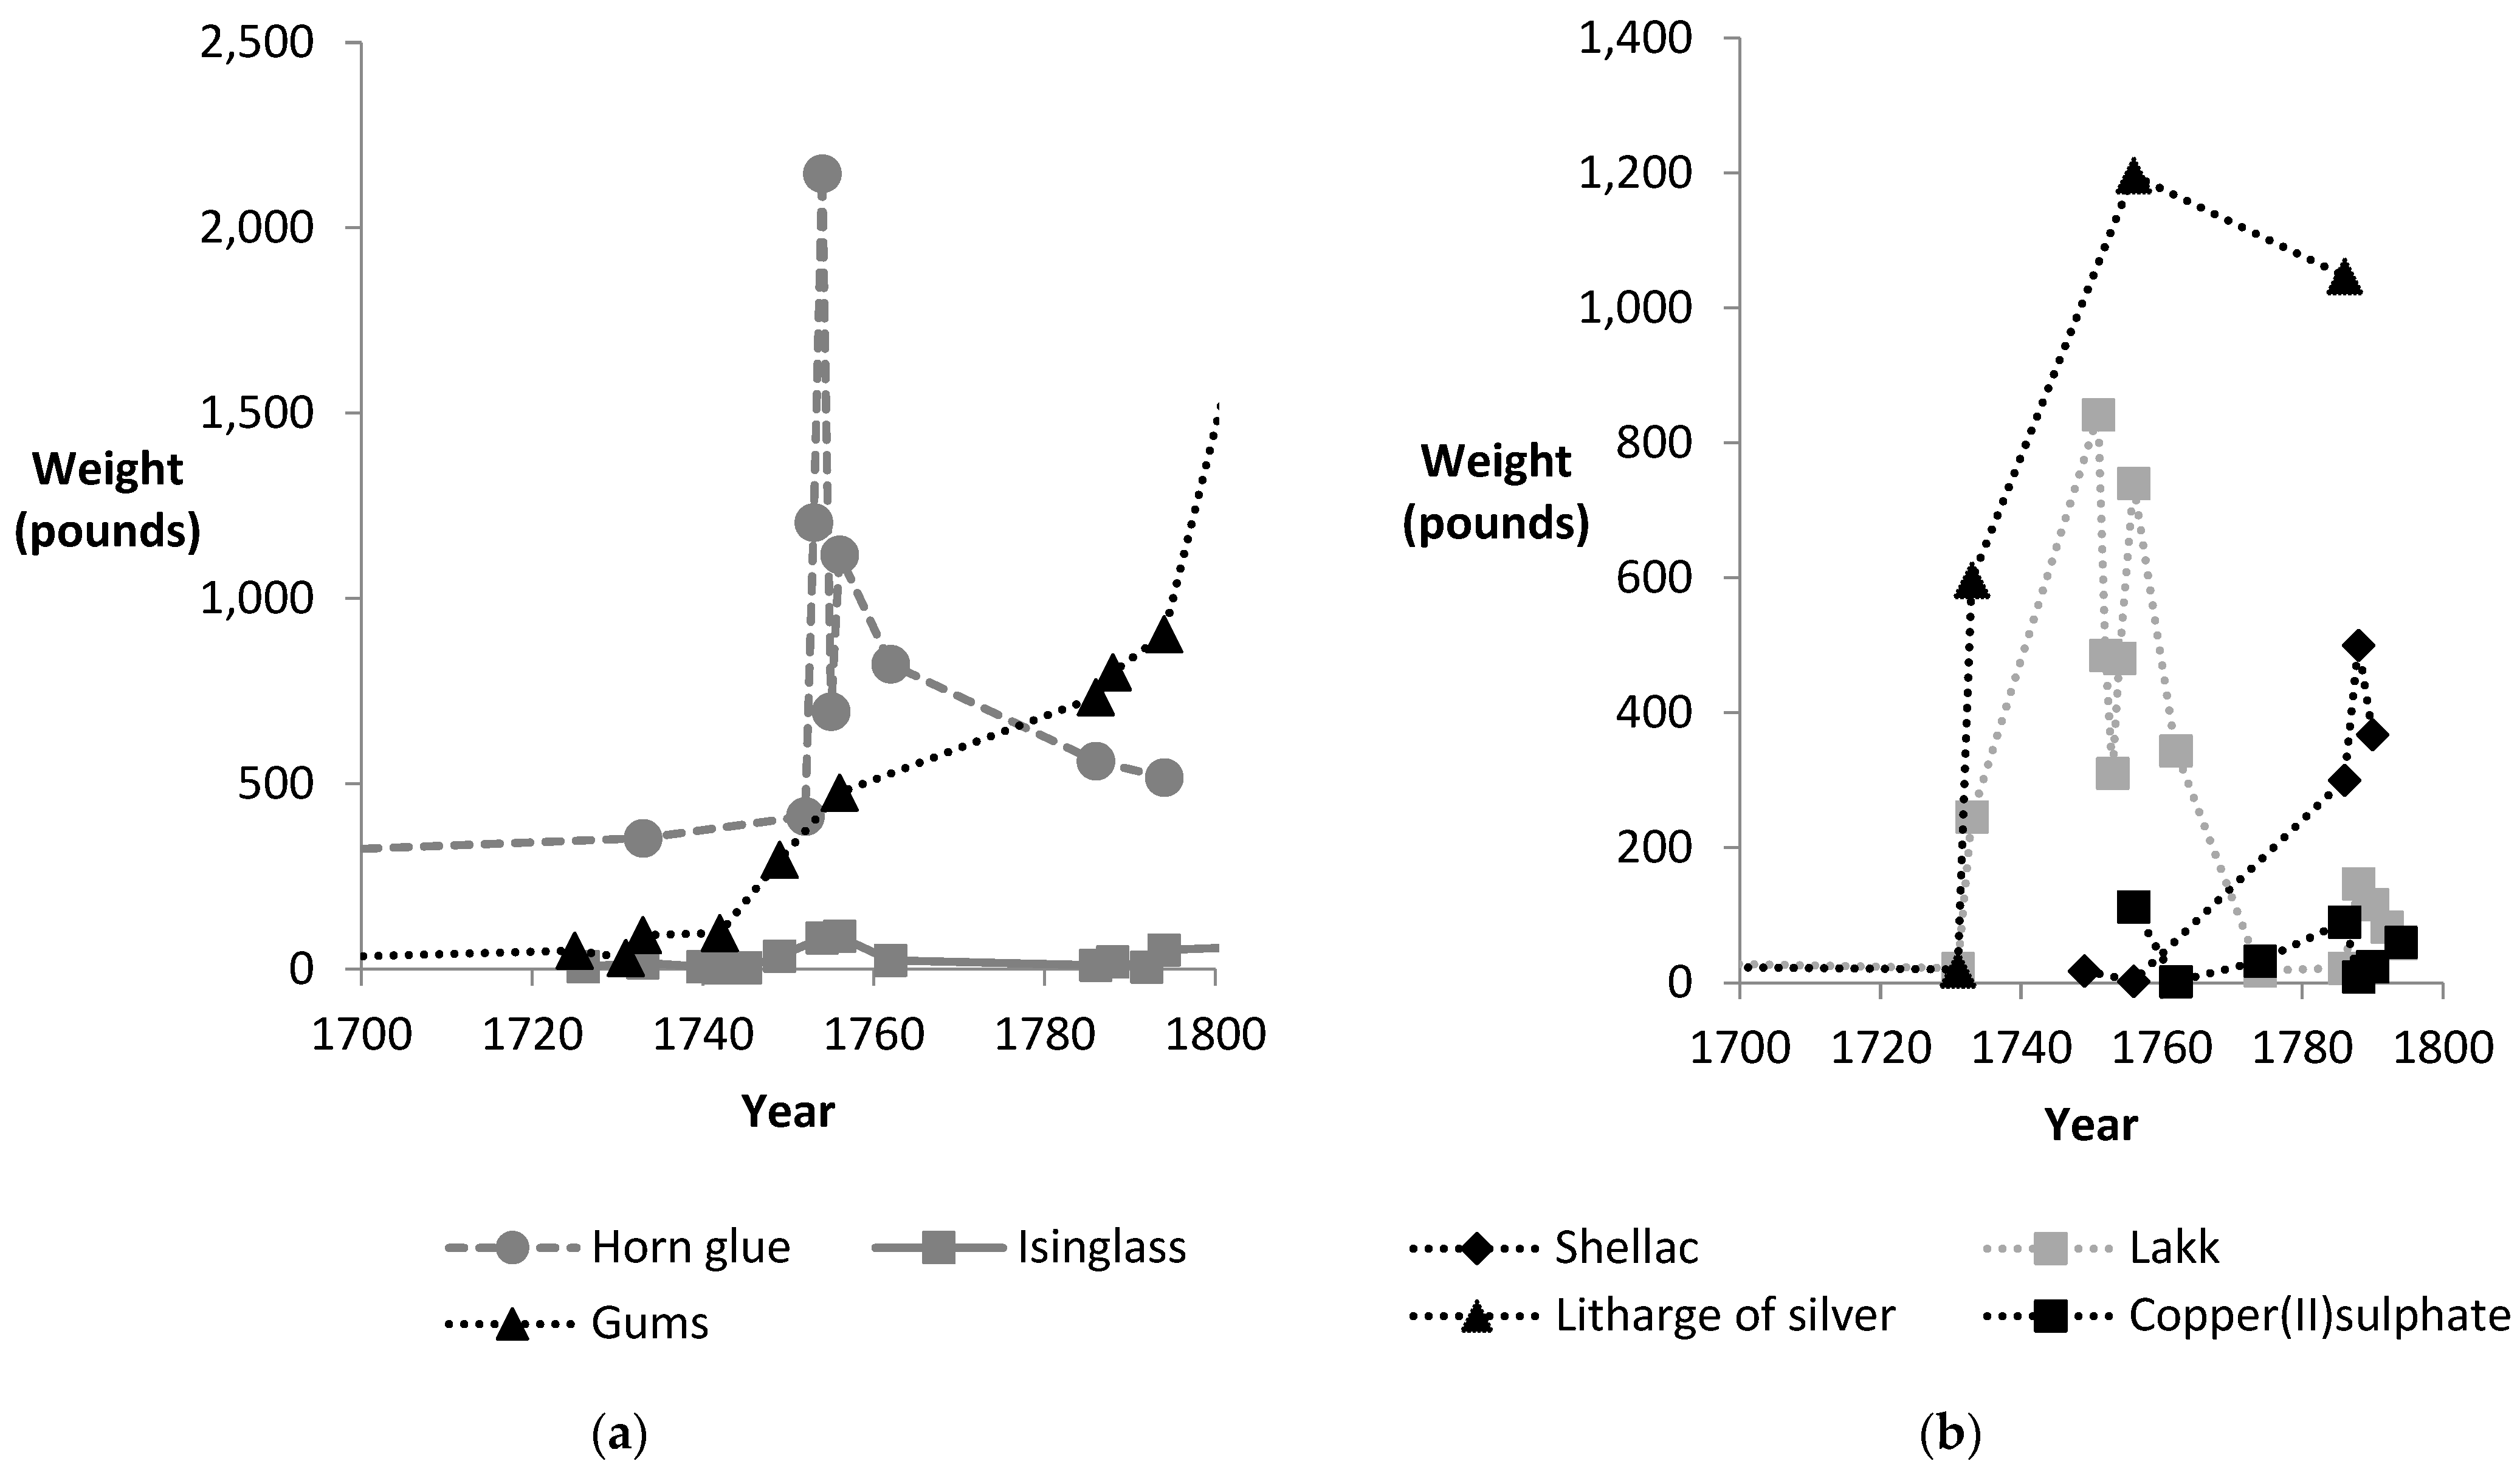
Figure 4 and Figure 5 show the import of binders and other additives. Local produced paints were initially often made with cod liver oil [22]. Water-soluble binders were mainly used at the beginning of the 18th century, either as emulsion or glue paints. Emulsion paints contained mixtures of different auxiliary agents (such as wheat flour, wheat bran and rye flour) and solutions (like milk, beer and herring oil) [23]. Glue was boiled on site from calfskin. Horn glue and small amounts of isinglass were imported as water-soluble binders, with decreasing amounts in the second half of the century (Figure 4a). Gums were used in increasing amounts (Figure 4a). Their use as water-soluble constituents was most likely reduced, but gums were also used to thicken paints, as mordants, and to starch clothing.
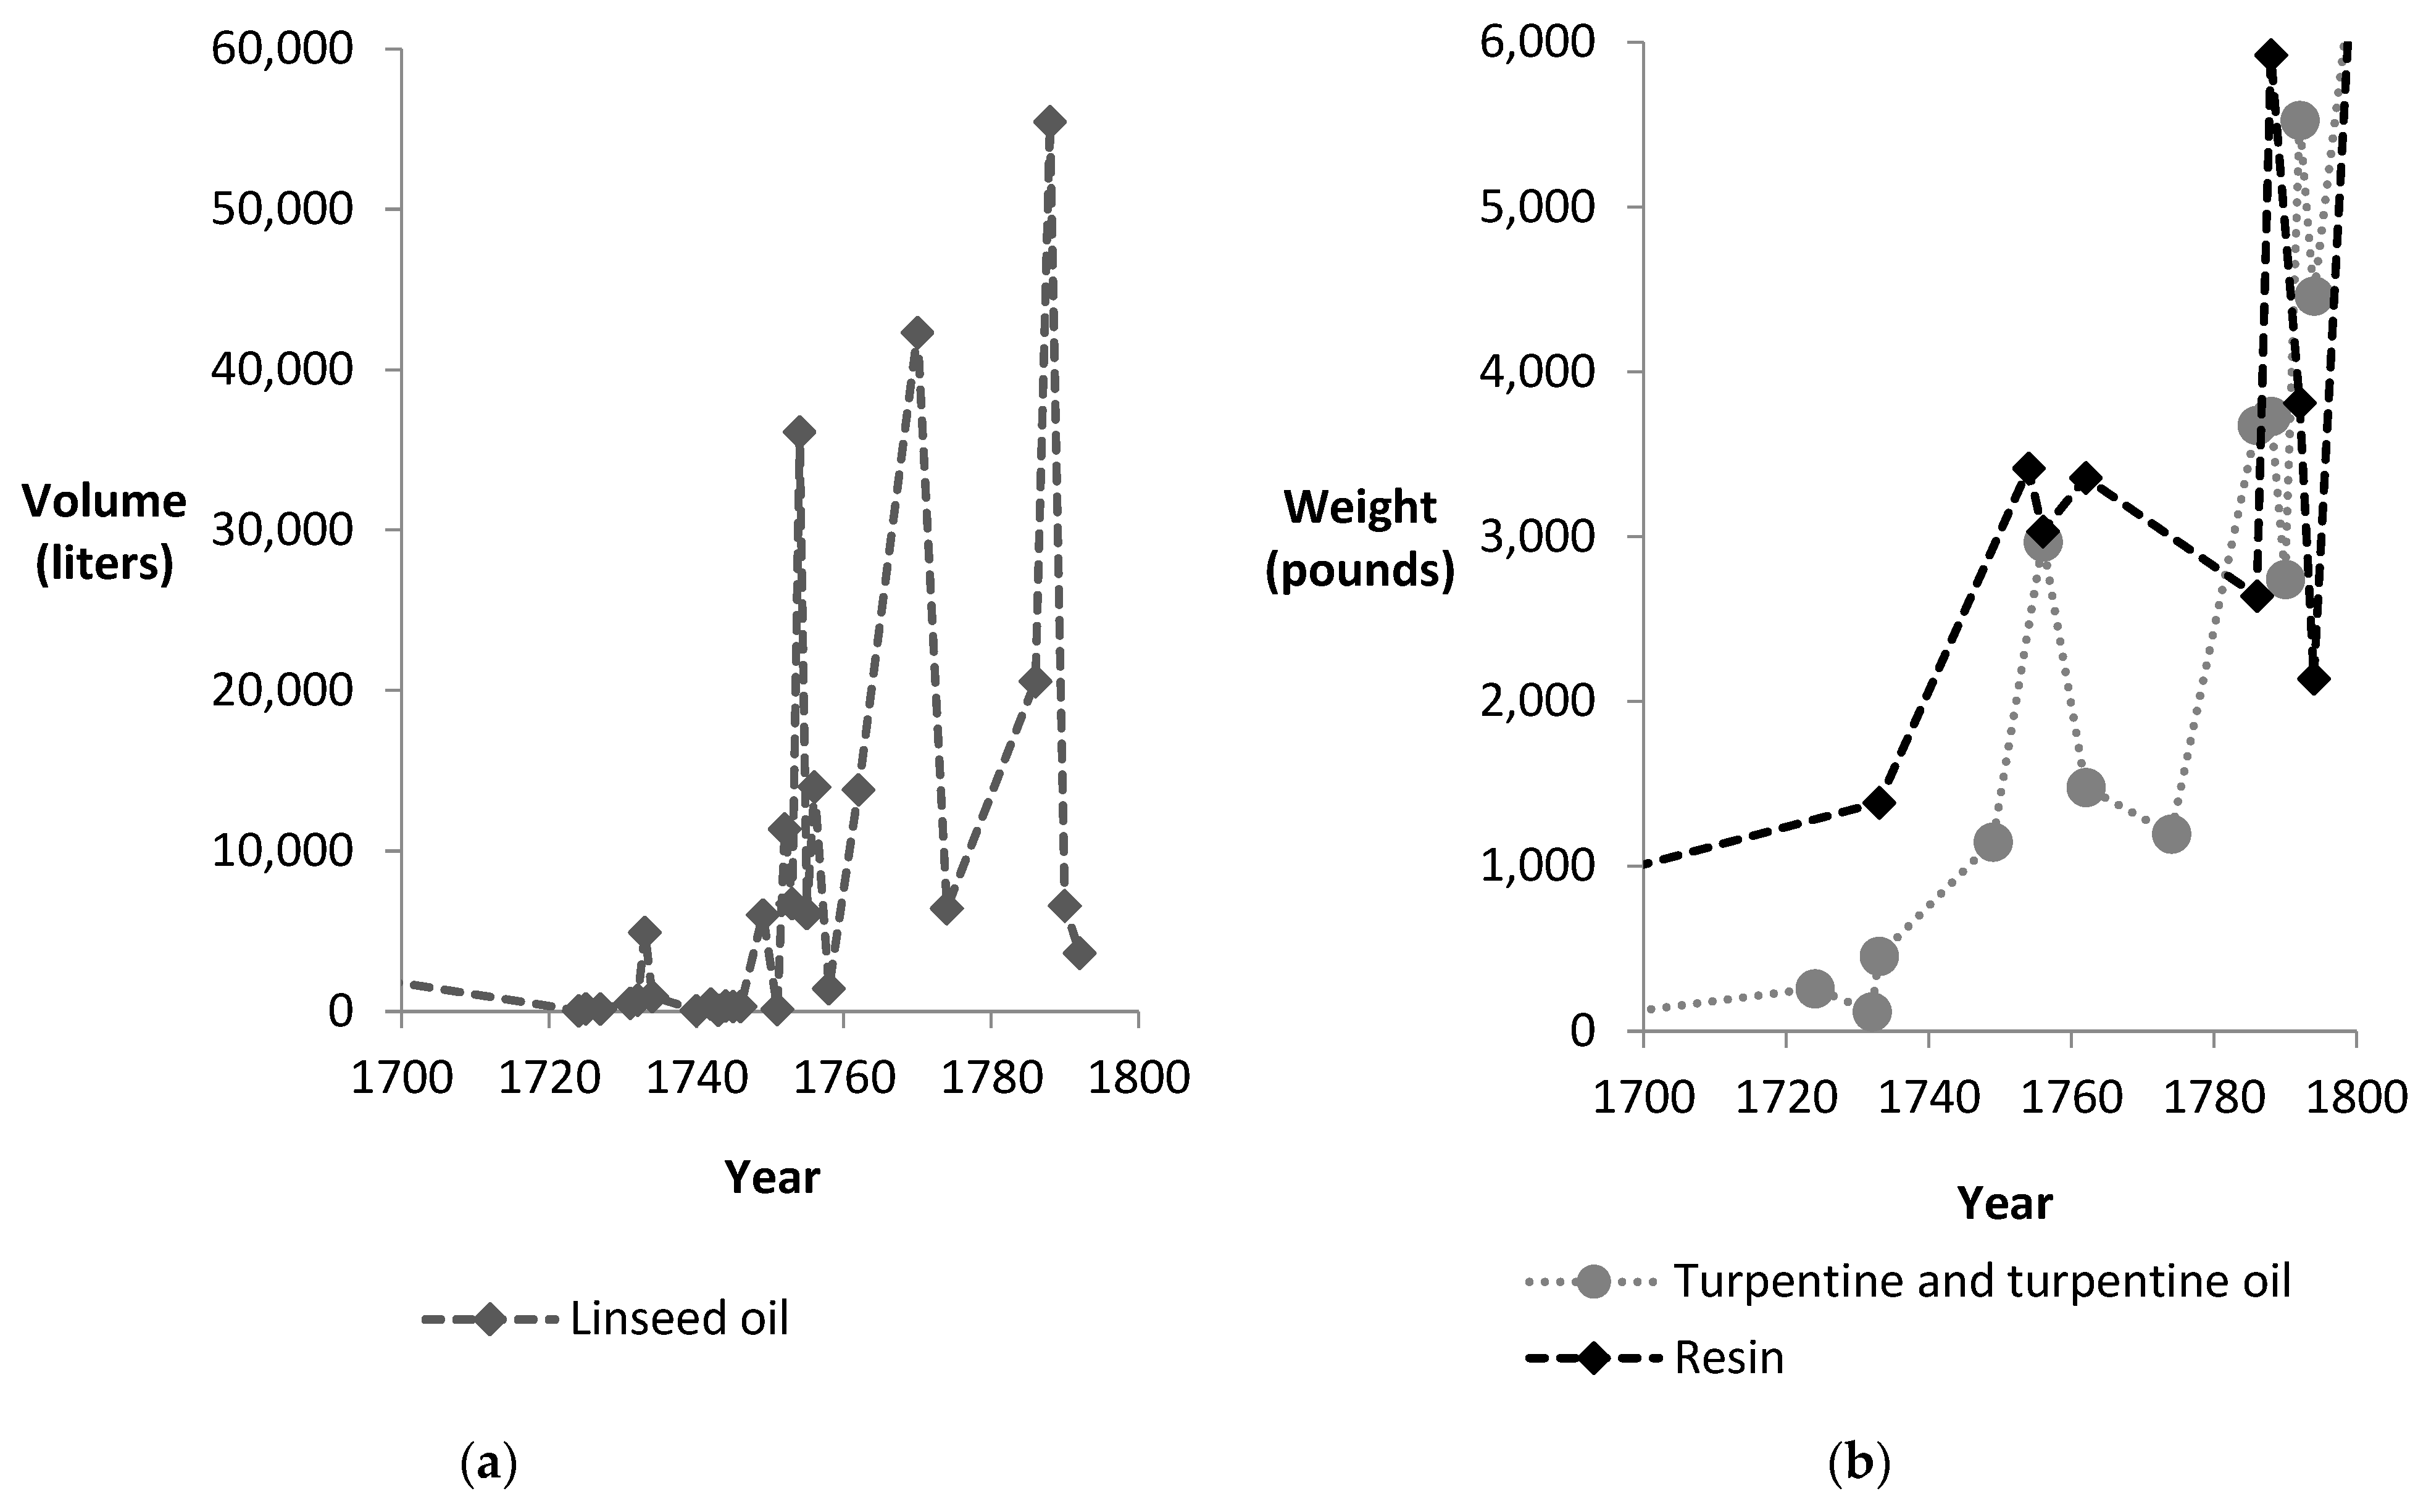
During the second half of the 18th century non-water soluble binders became more popular in use. Simplified, linseed oil (Figure 5a) became the typical binder for paint and turpentine oil (Figure 5b) the typical solvent. Siccatives (litharge of silver and copper(II)sulphate as kobberrøg and blåstein Figure 4b) functioned as drying agents. The varnishes increased the flexibility of the paint during application, were used as protective film and were also believed to harden the paint. The customs records include various varnishes, such as resin (harpiks, Figure 5b), shellac (Figure 4b, resin secreted by the Indian Kerra Lacca), lakk (Figure 4b, various forms of melted plant resins) and small amounts of unspecified ferniss. Based on Figure 4b, it seems as if shellac replaced the plant varnishes. Shellac was probably also used as a sealing wax and stamp varnish, as well as for polishing furniture. The quantities of imported turpentine and turpentine oil increased from the middle of the century (Figure 5b). Norway became largely self-sufficient with linseed oil, which explains the reduced import at the end of the century (Figure 5a) [24]. The price of linseed oil was as high as 0.16 daler/liter, and people continued to use cod liver or herring oil when painting houses.

3.2. Dyes, Mordants and Auxilliaries

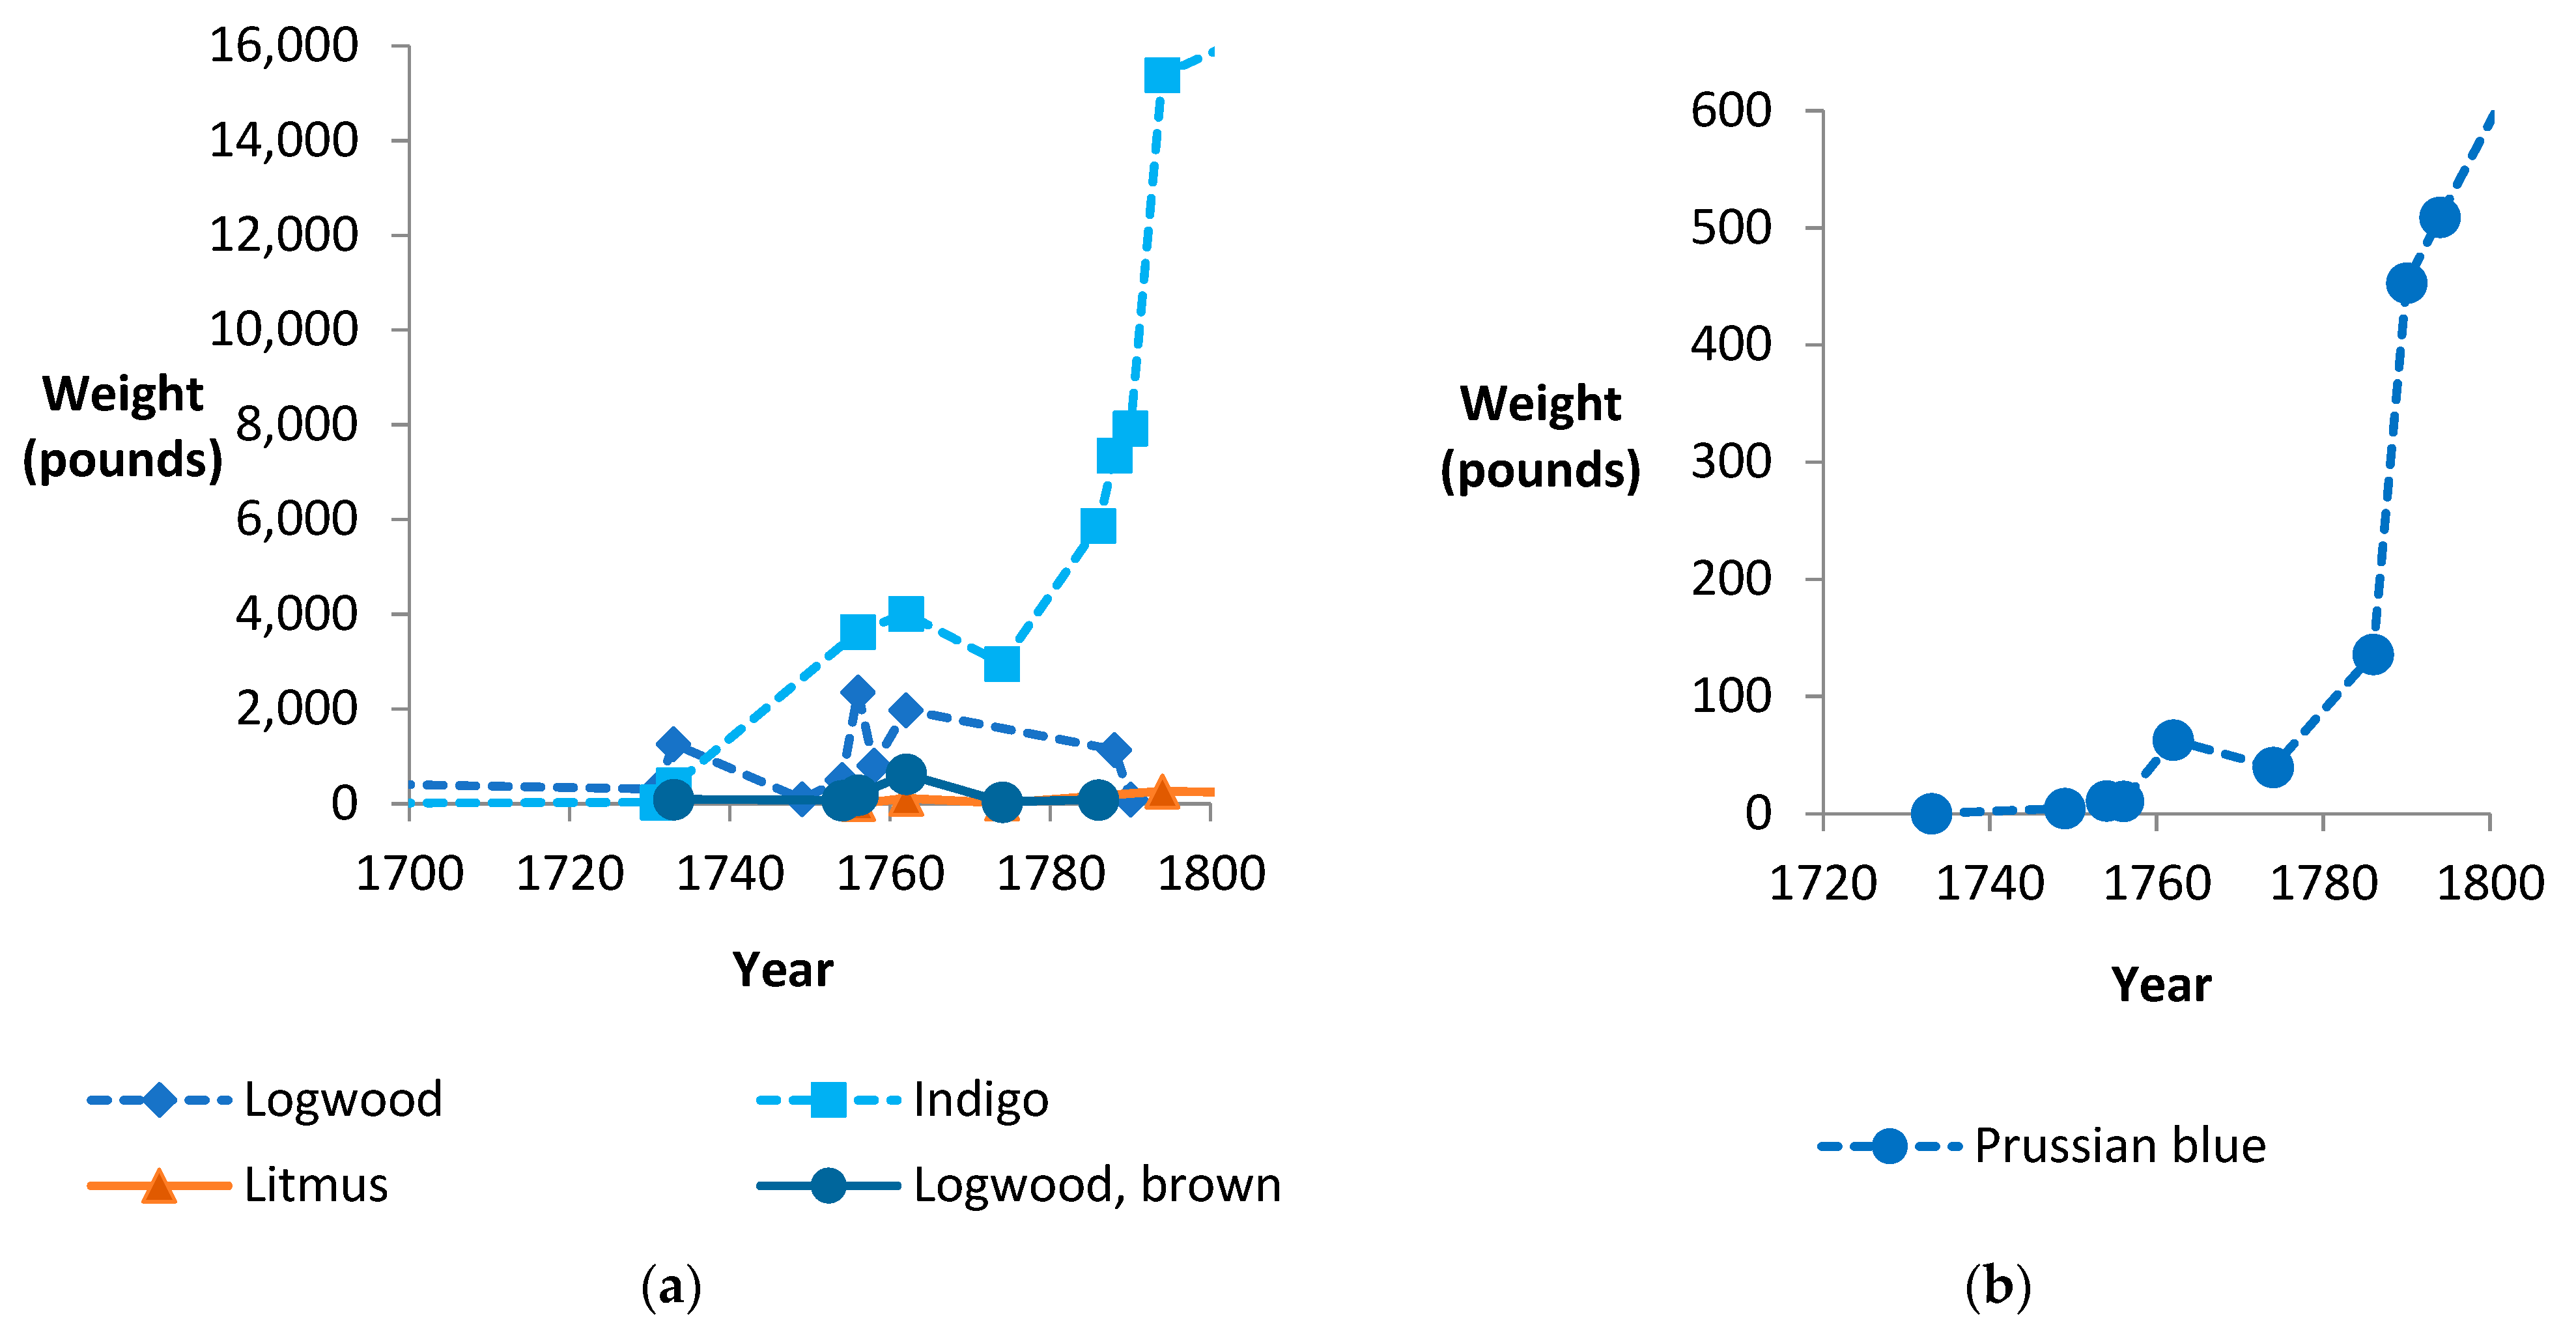
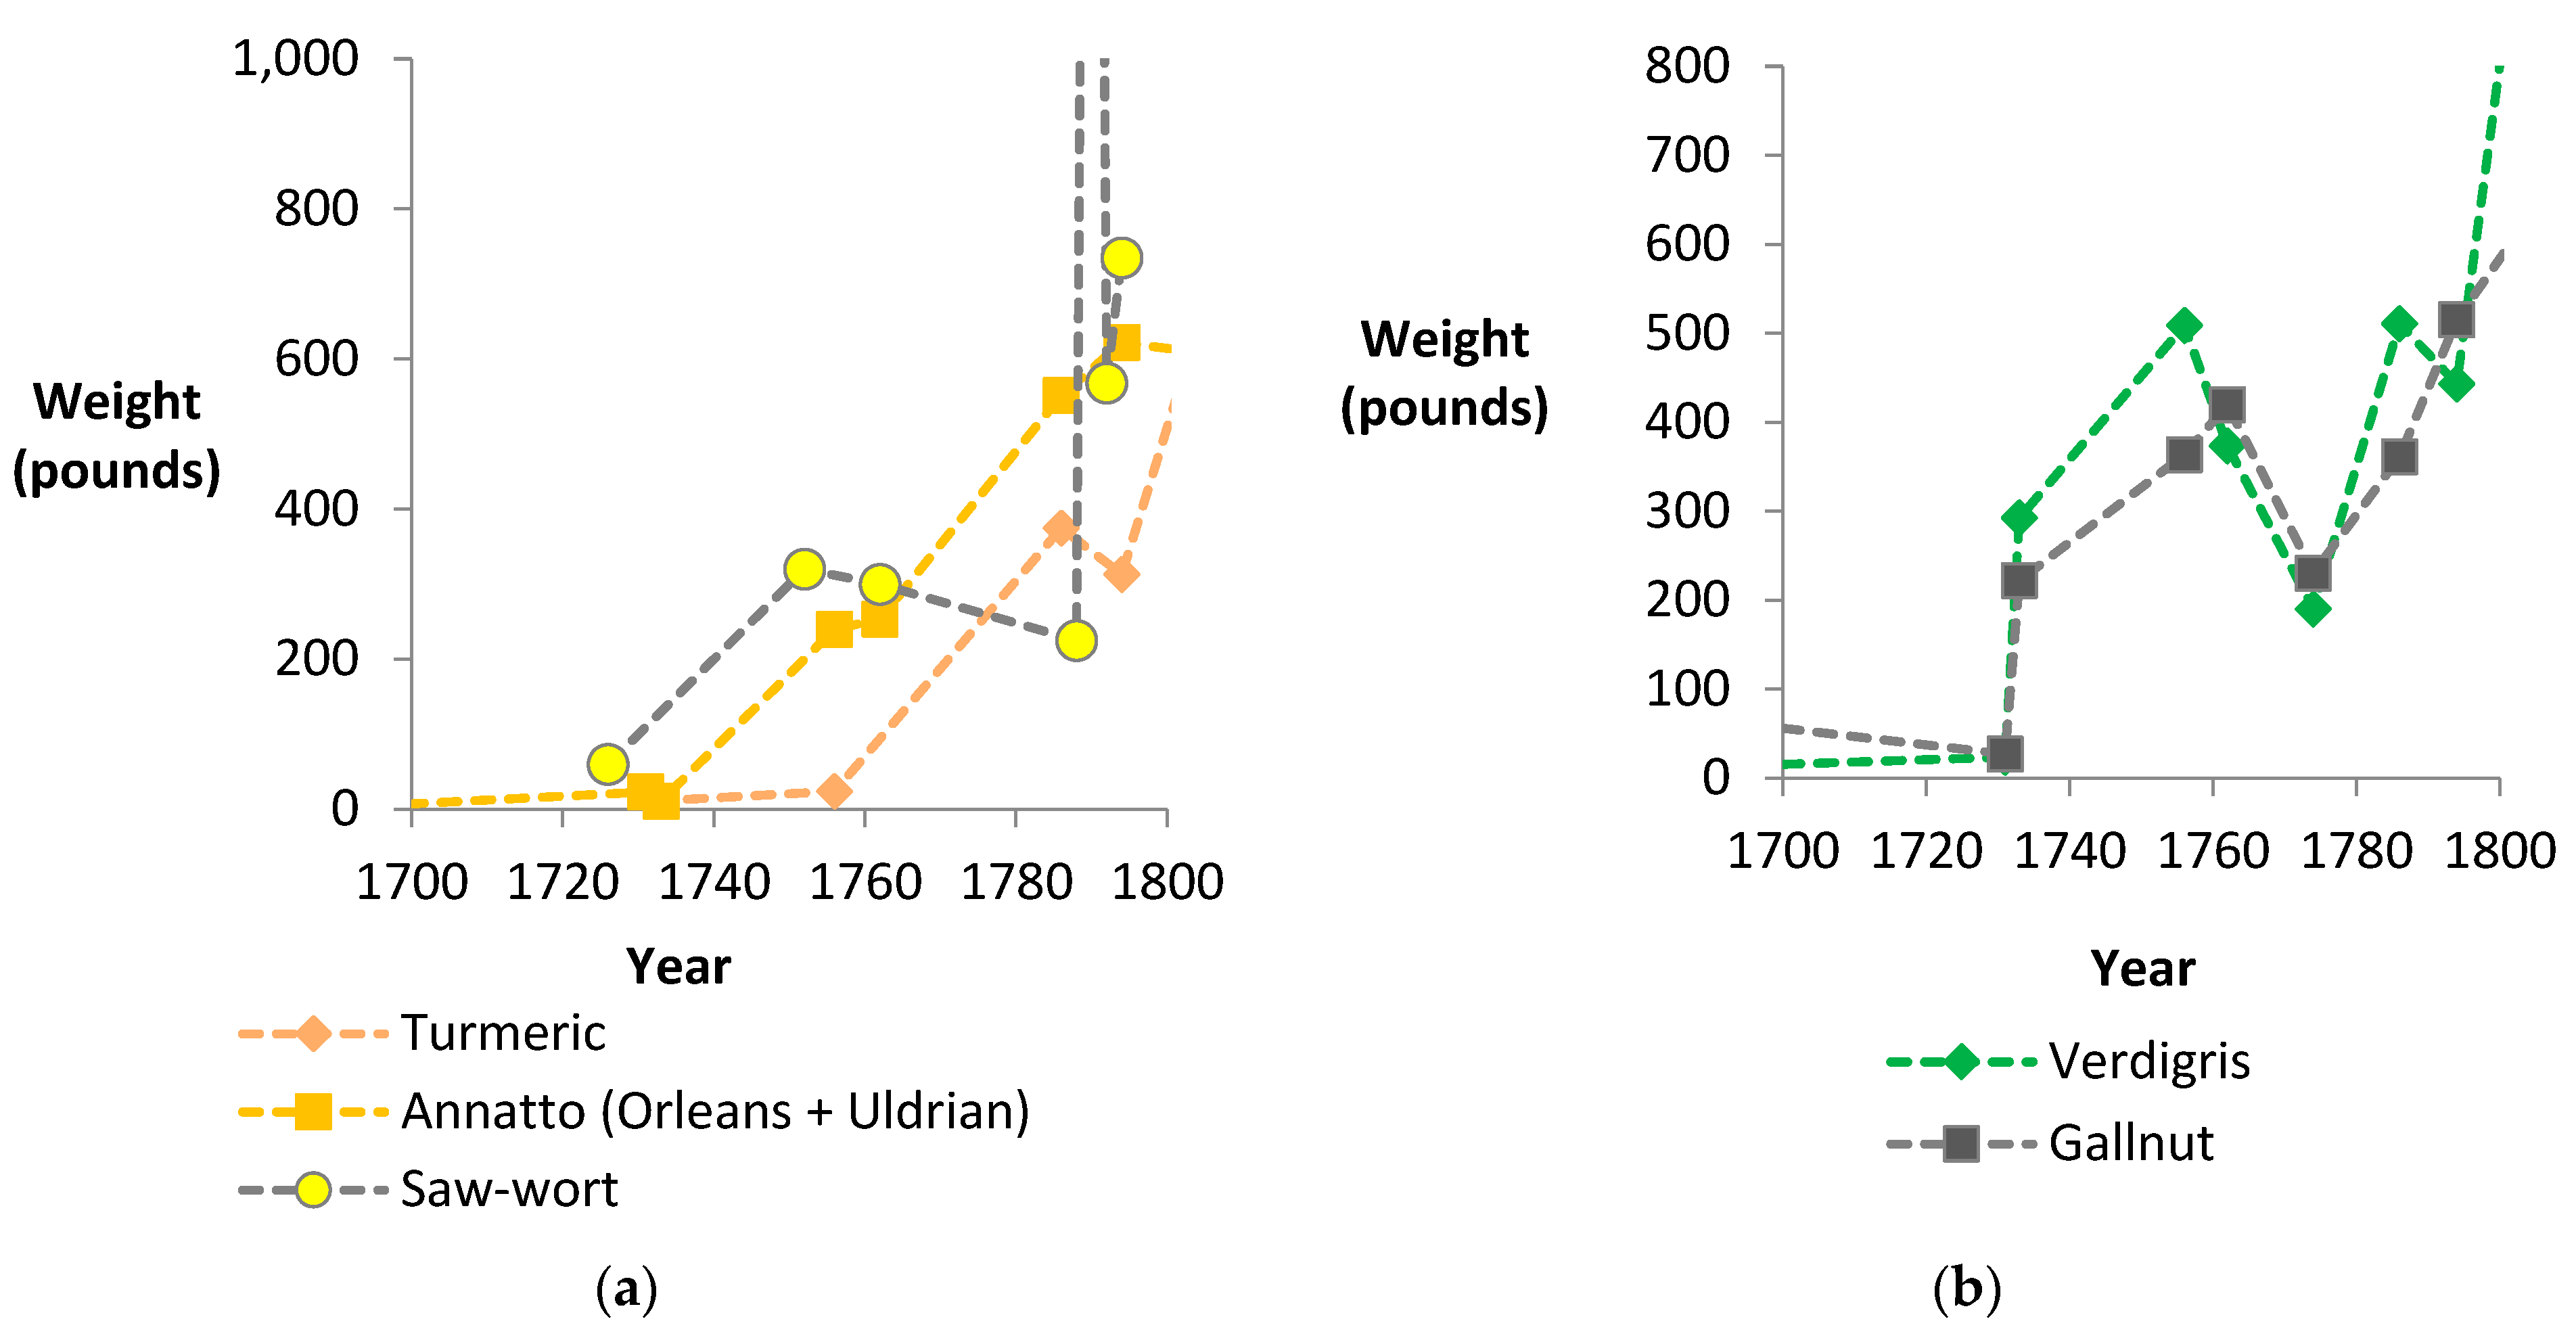
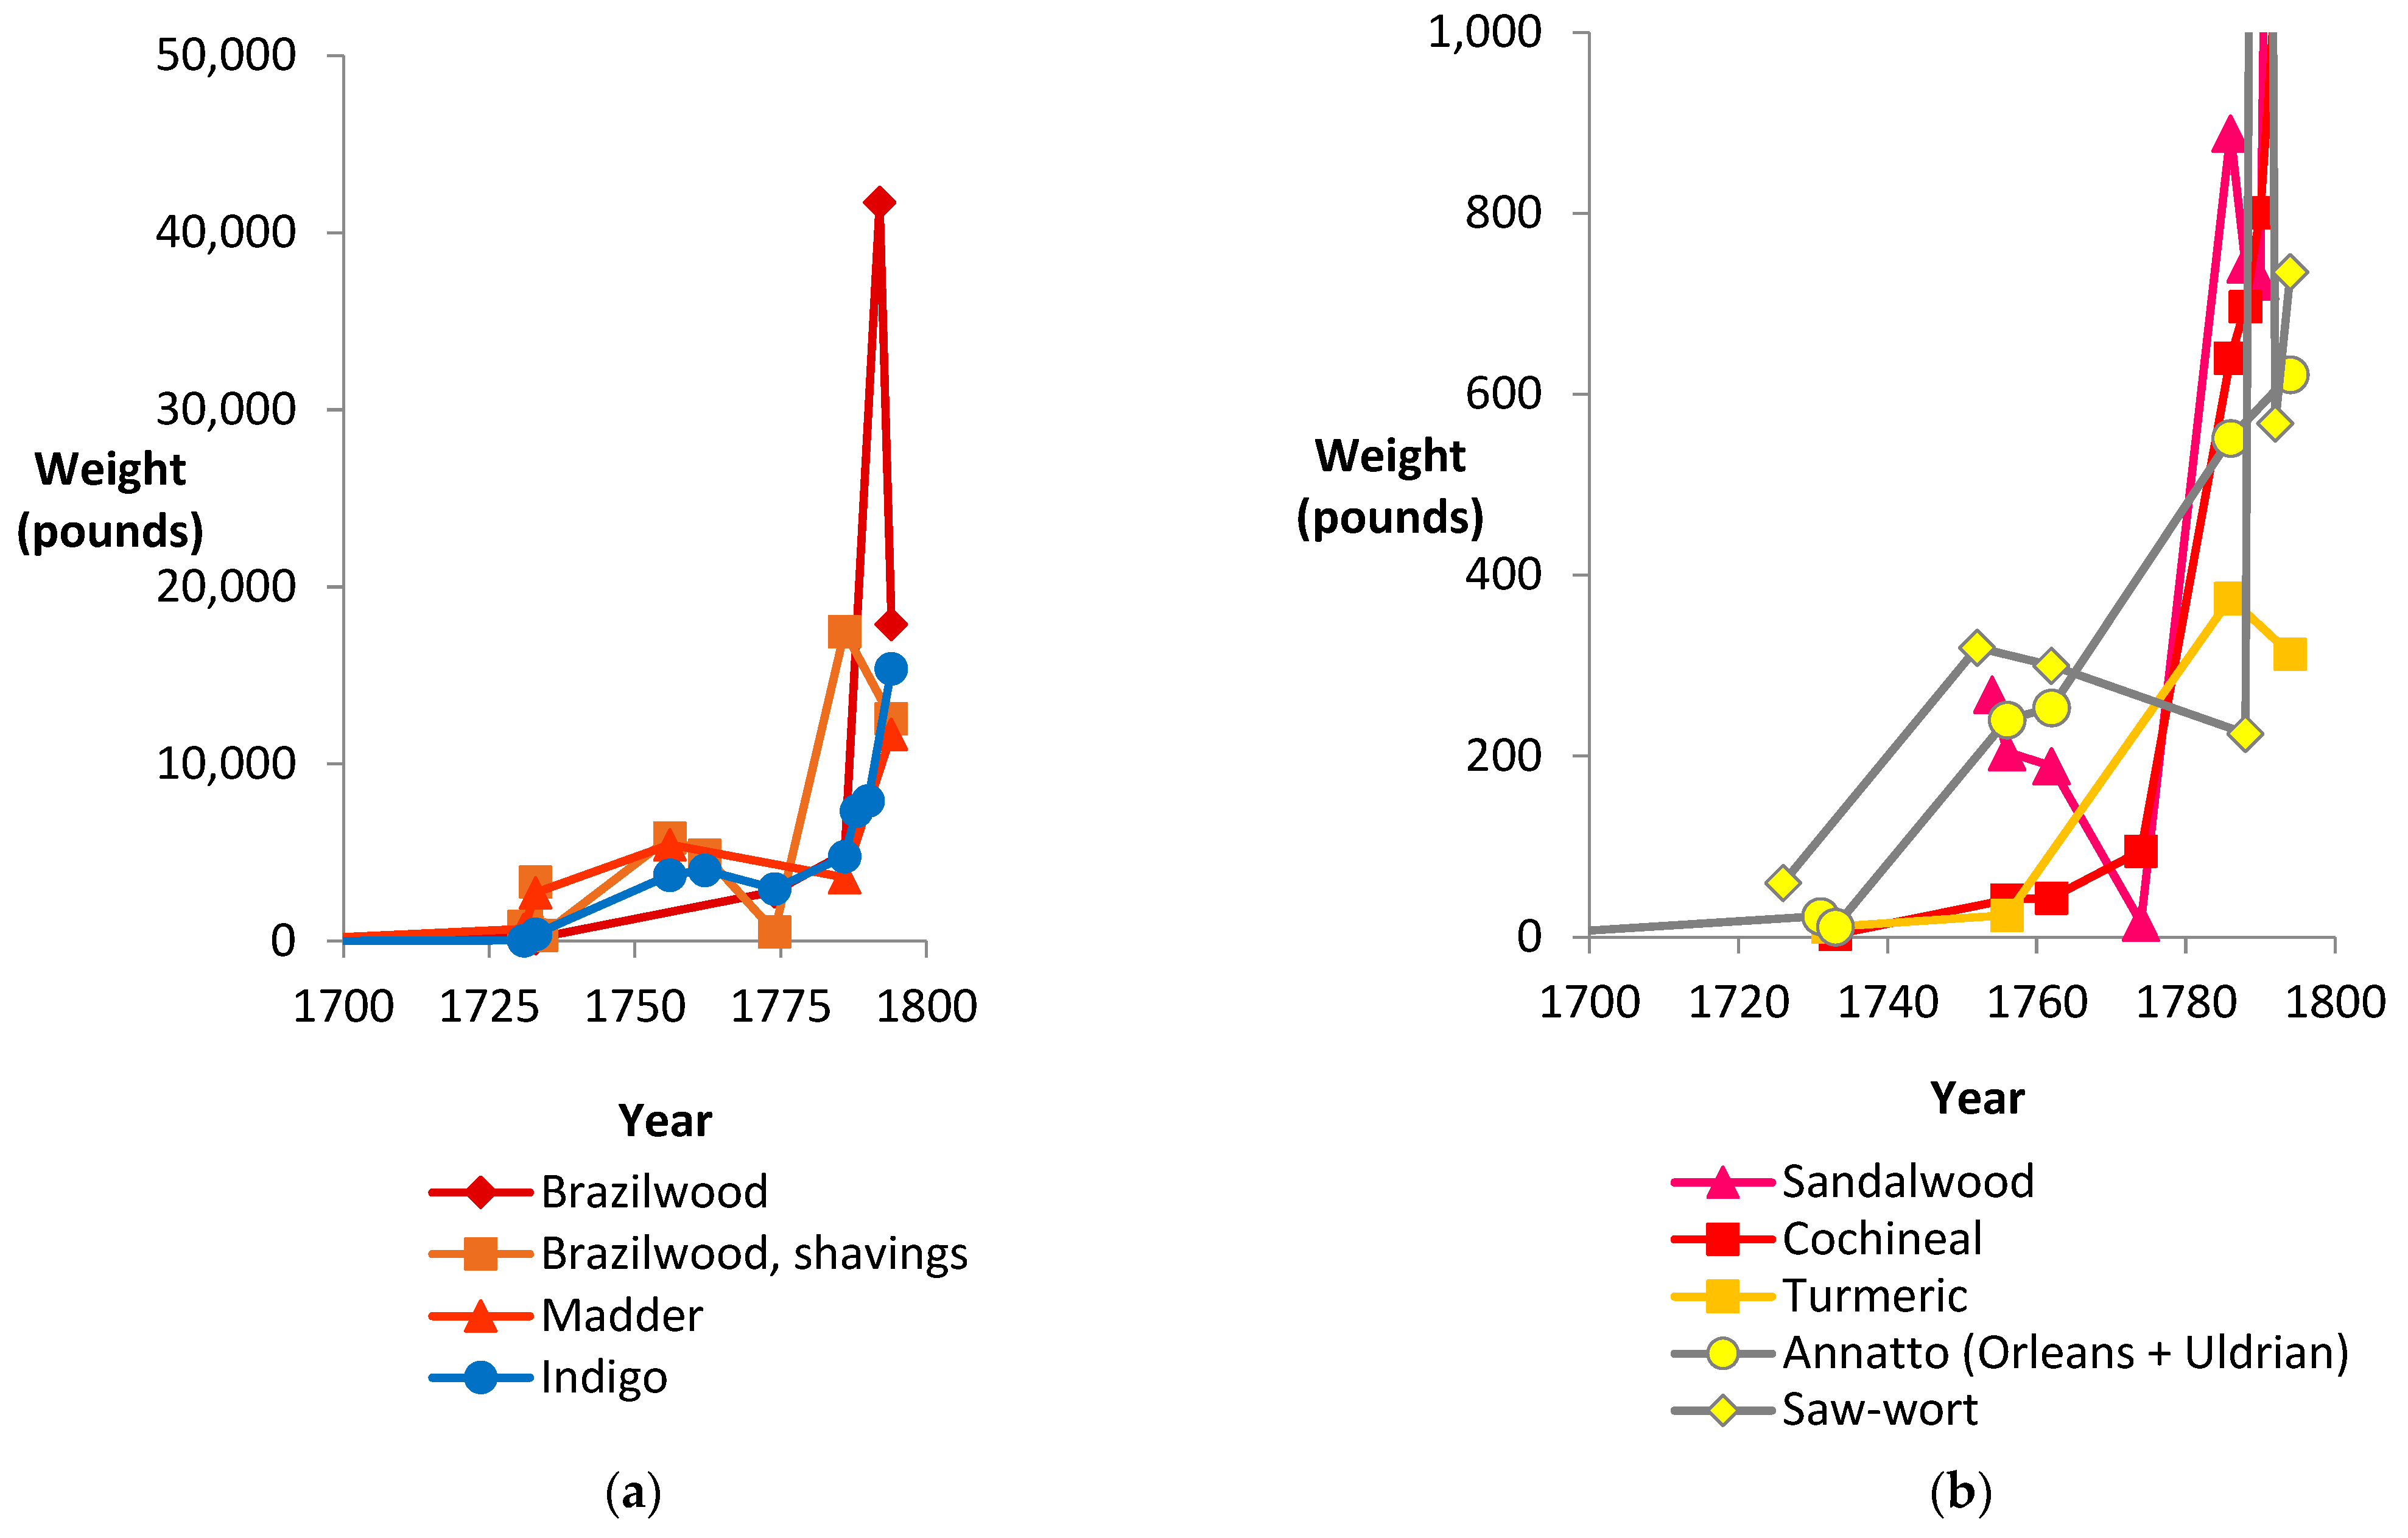
Brazilwood and rasped brazilwood were the red textile dyes that were imported in the largest quantities and especially at the end of the 18th century (Figure 6a). Madder was the second largest imported red dye. Other red dyewoods (sandalwood and the brazilwood pernambuco wood) and cochineal were imported in smaller quantities, and imports did not increase at the end of the 18th century (Figure 6b). Indigo was the blue dye imported in the largest quantities, with significantly increased imports at the end of the century (Figure 7a). Other imported blue dyes were logwood (called blauholt, campecheholt, and brissel). Together with litmus and brown logwood, they were imported in smaller quantities than indigo and without increased imports at the end of the century (Figure 7a). Logwood was used for coloring blues, mauves, grays and blacks, but according to the import data it was in limited use in Norway during the 18th century. Prussian blue (Figure 7b) was mostly used as a paint pigment, whereas its use as a dye became more popular in the 19th century. The increasing imports of yellow textile colors turmeric, annatto (orleans and uldrian) and saw-wort, are shown in Figure 8a. Turmeric was also used as a spice. Figure 8b shows import graphs for verdigris and gallnut. It can be noted that Figure 6, Figure 7 and Figure 8 show increased imports of dyes in the middle and late 18th century.
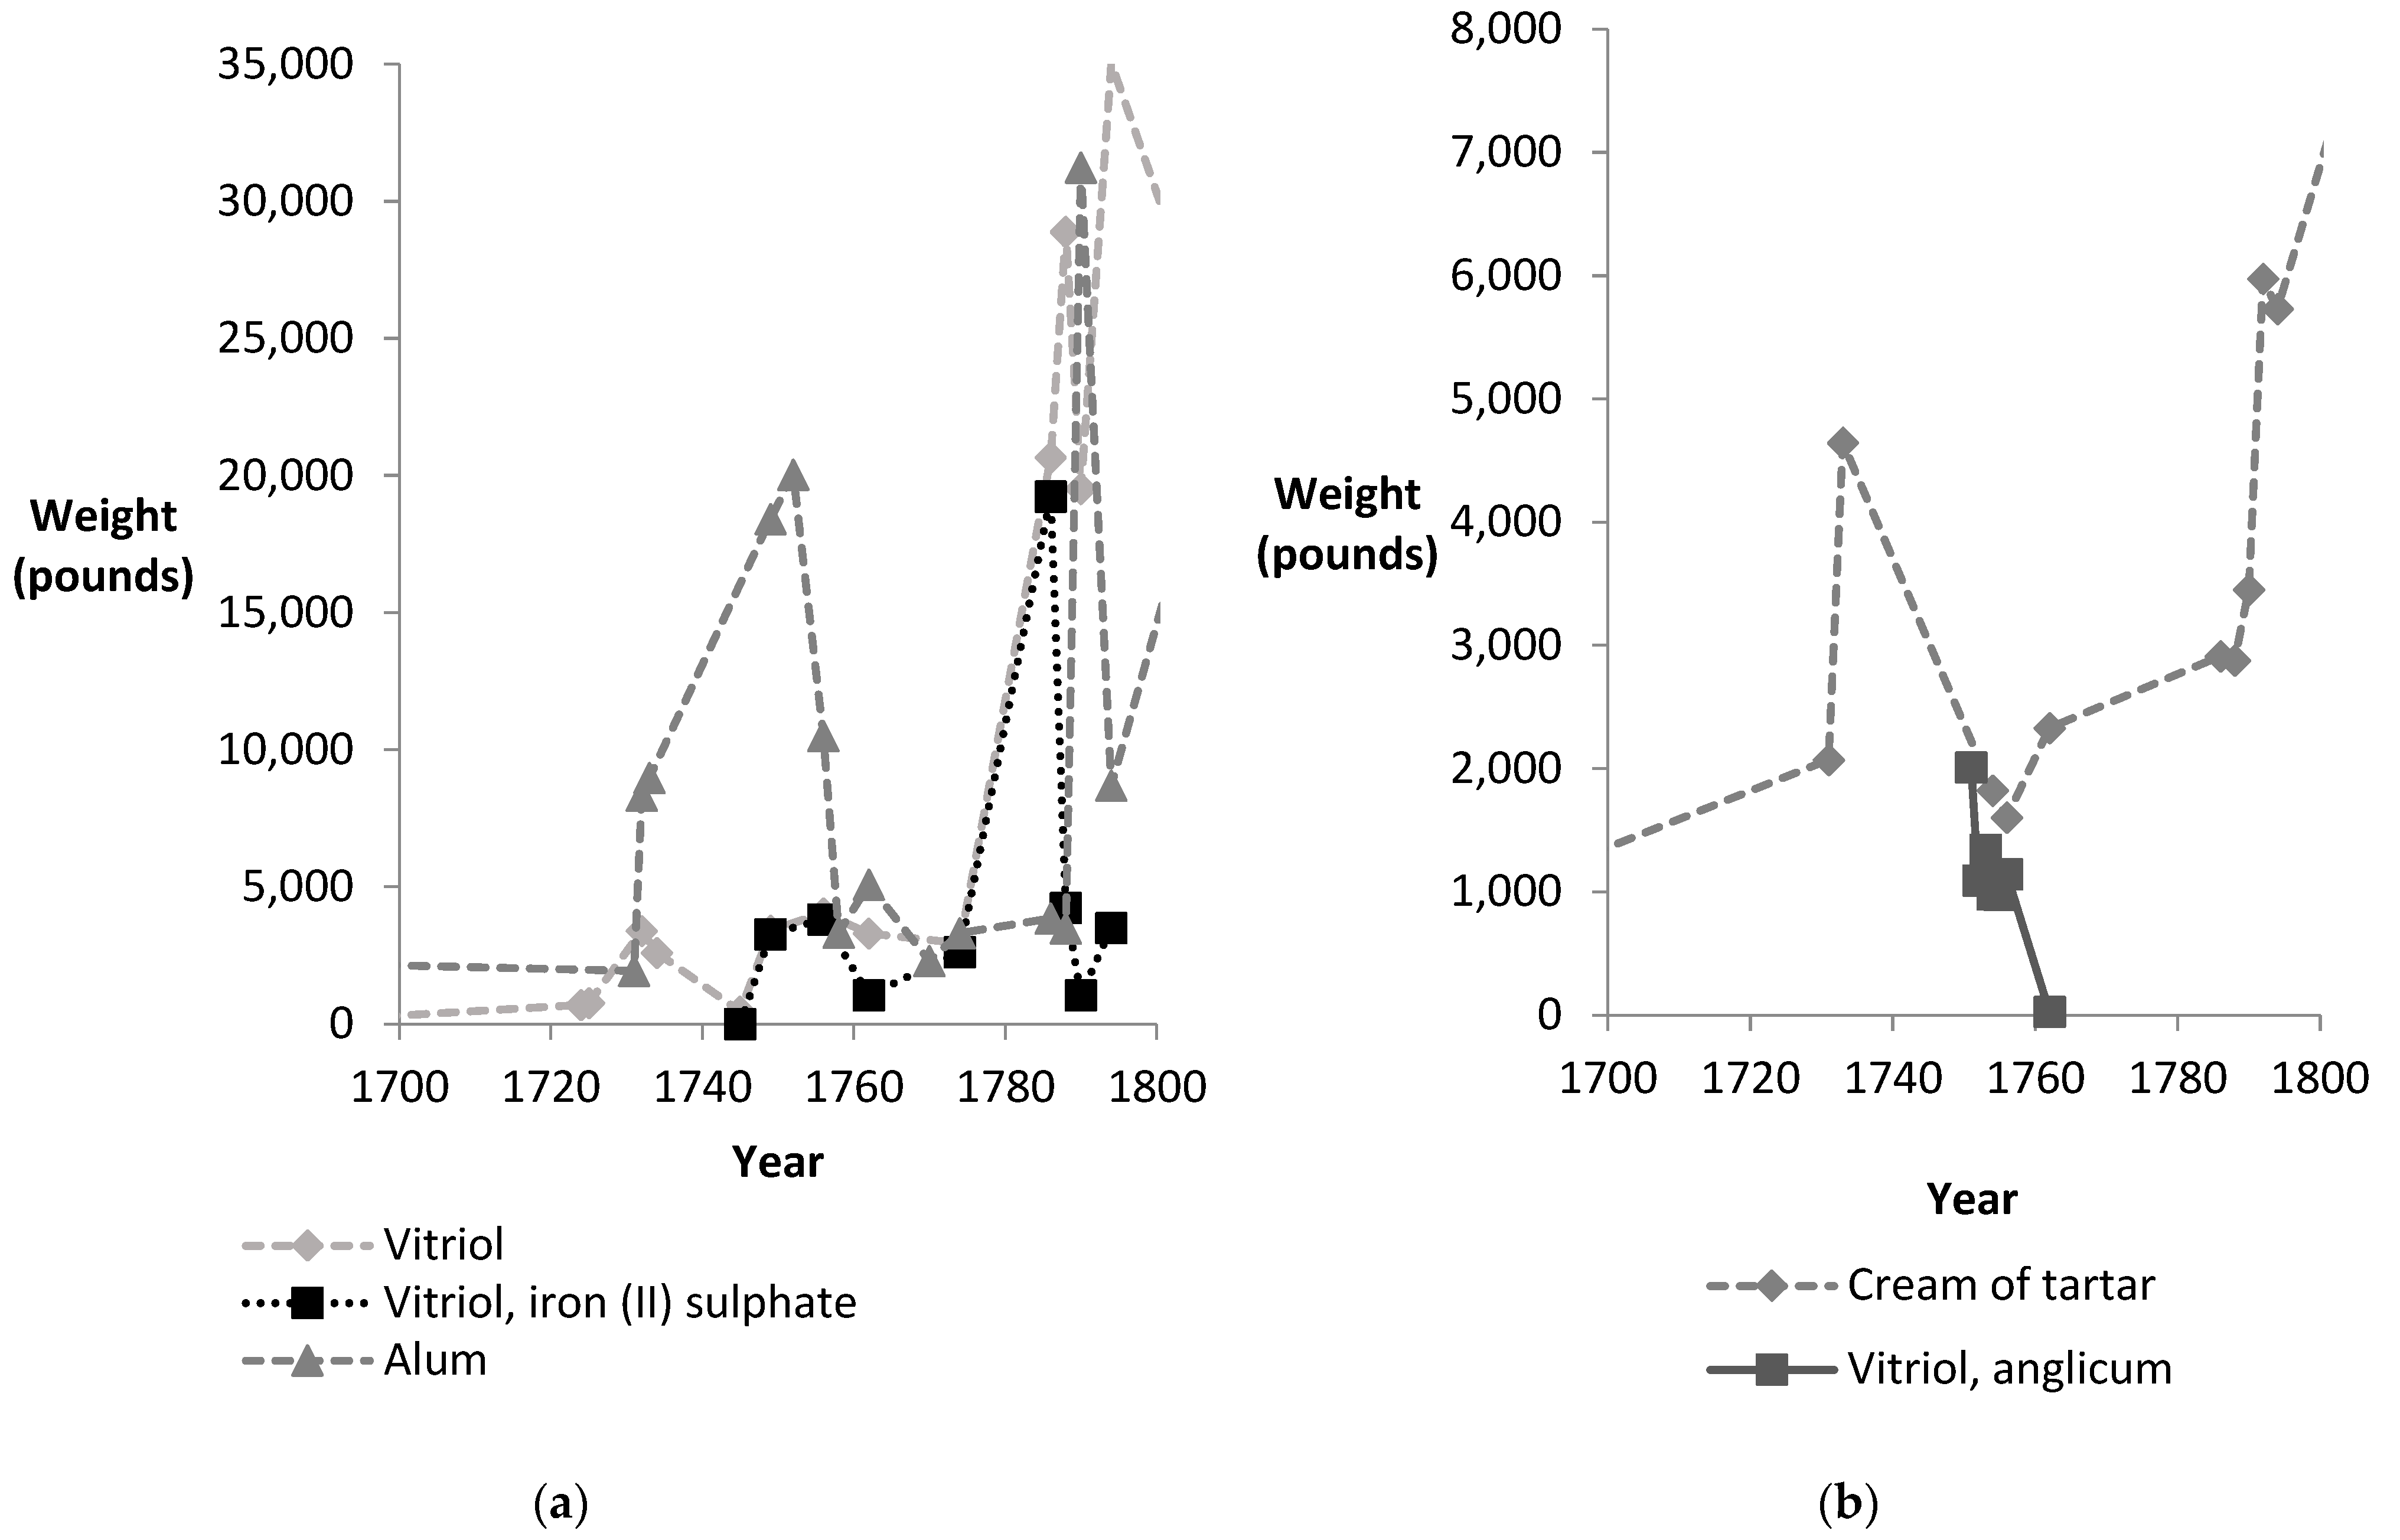
Dyes need mordants to bind to the textile fibers. Mordants are usually metal salts that form metal complexes with dyes. Textiles with cellulose fibers such as cotton, linen and hemp, also needed treatment with gallnuts or sumac in order for the mordants to adhere [25]. Among the highest amounts of imported mordants were alum, vitriol and the vitriol, kobberrøg (Figure 9a). The import of alum increased both in the middle and at the end of the 18th century at the same time as imports of dyes increased. The temporary decline in alum imports during the third quarter of the century was probably due to alum production in Christiania. Cream of tartar and vitriol anglicum were imported in smaller quantities (Figure 9b). Gums were used as auxiliary agents in the dyeing process. Lime played a minor role in vat dyeing with indigo to adjust alkalinity. The customs lists contain other goods which are added to the dyeing process, but which are not included in this study, like wheat bran, ash, urine, vinegar, chalk, nitric acid, ammonium chloride, bismuth, and lemon juice.

3.3. Prices

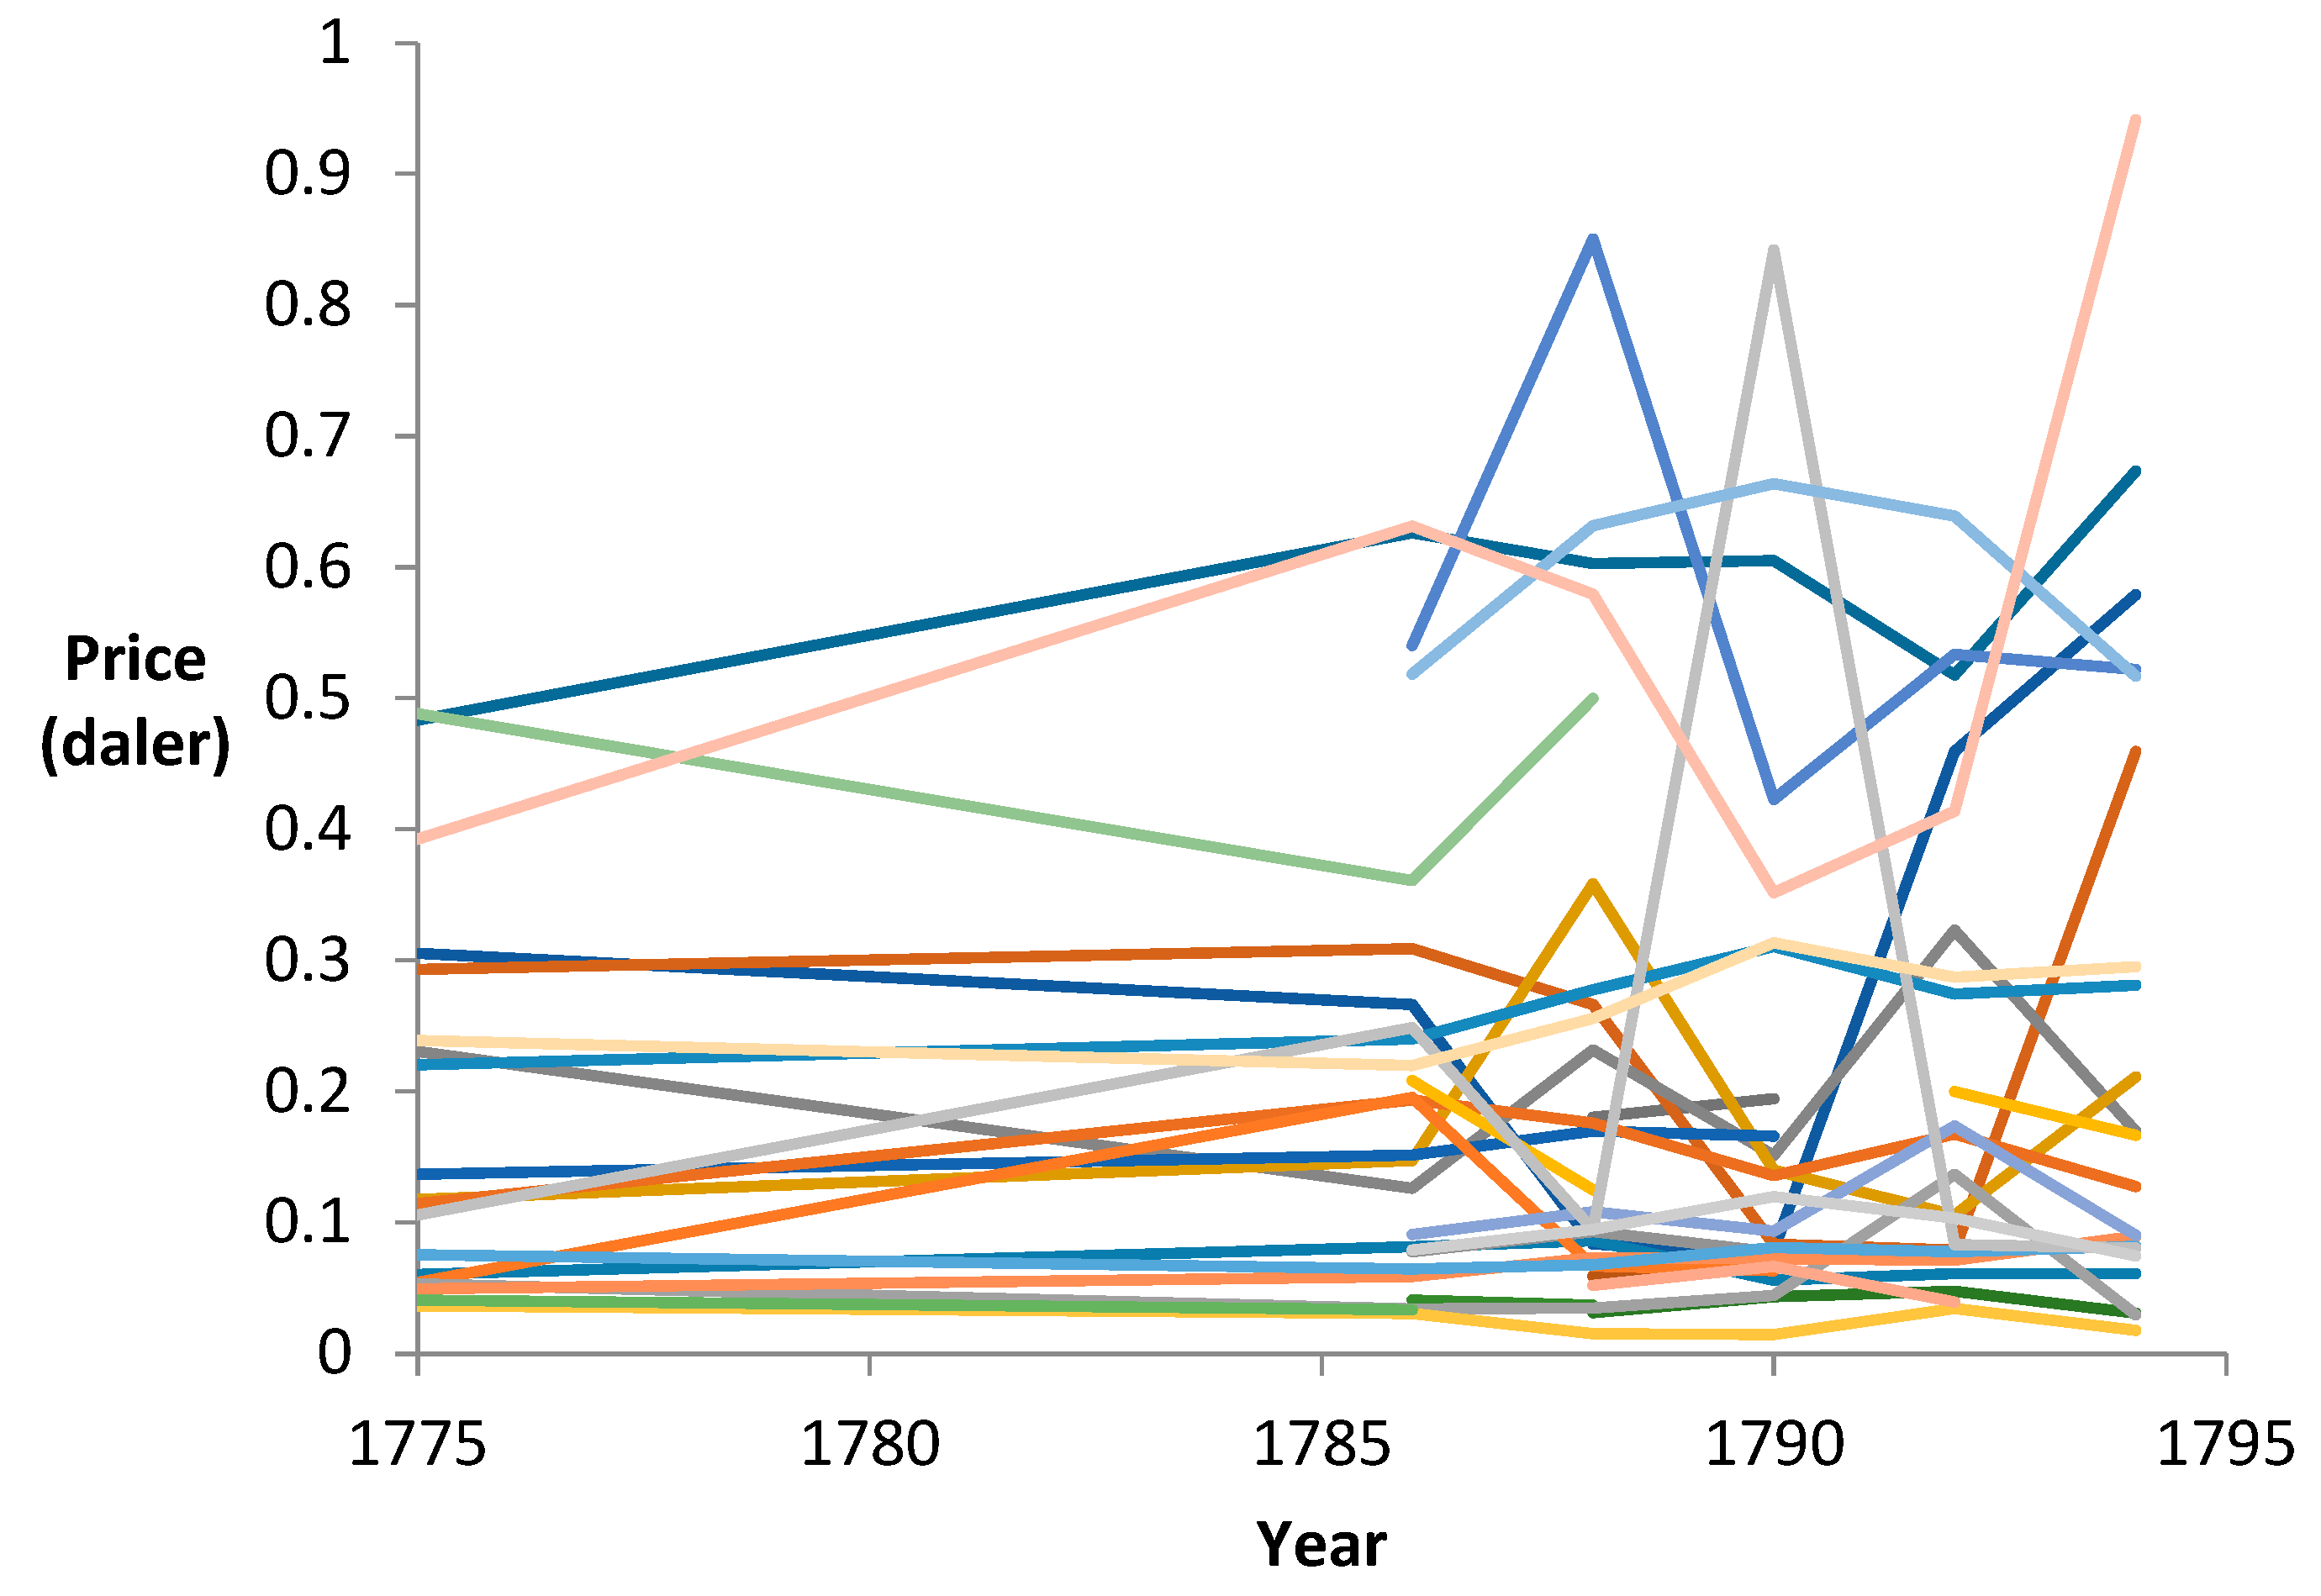
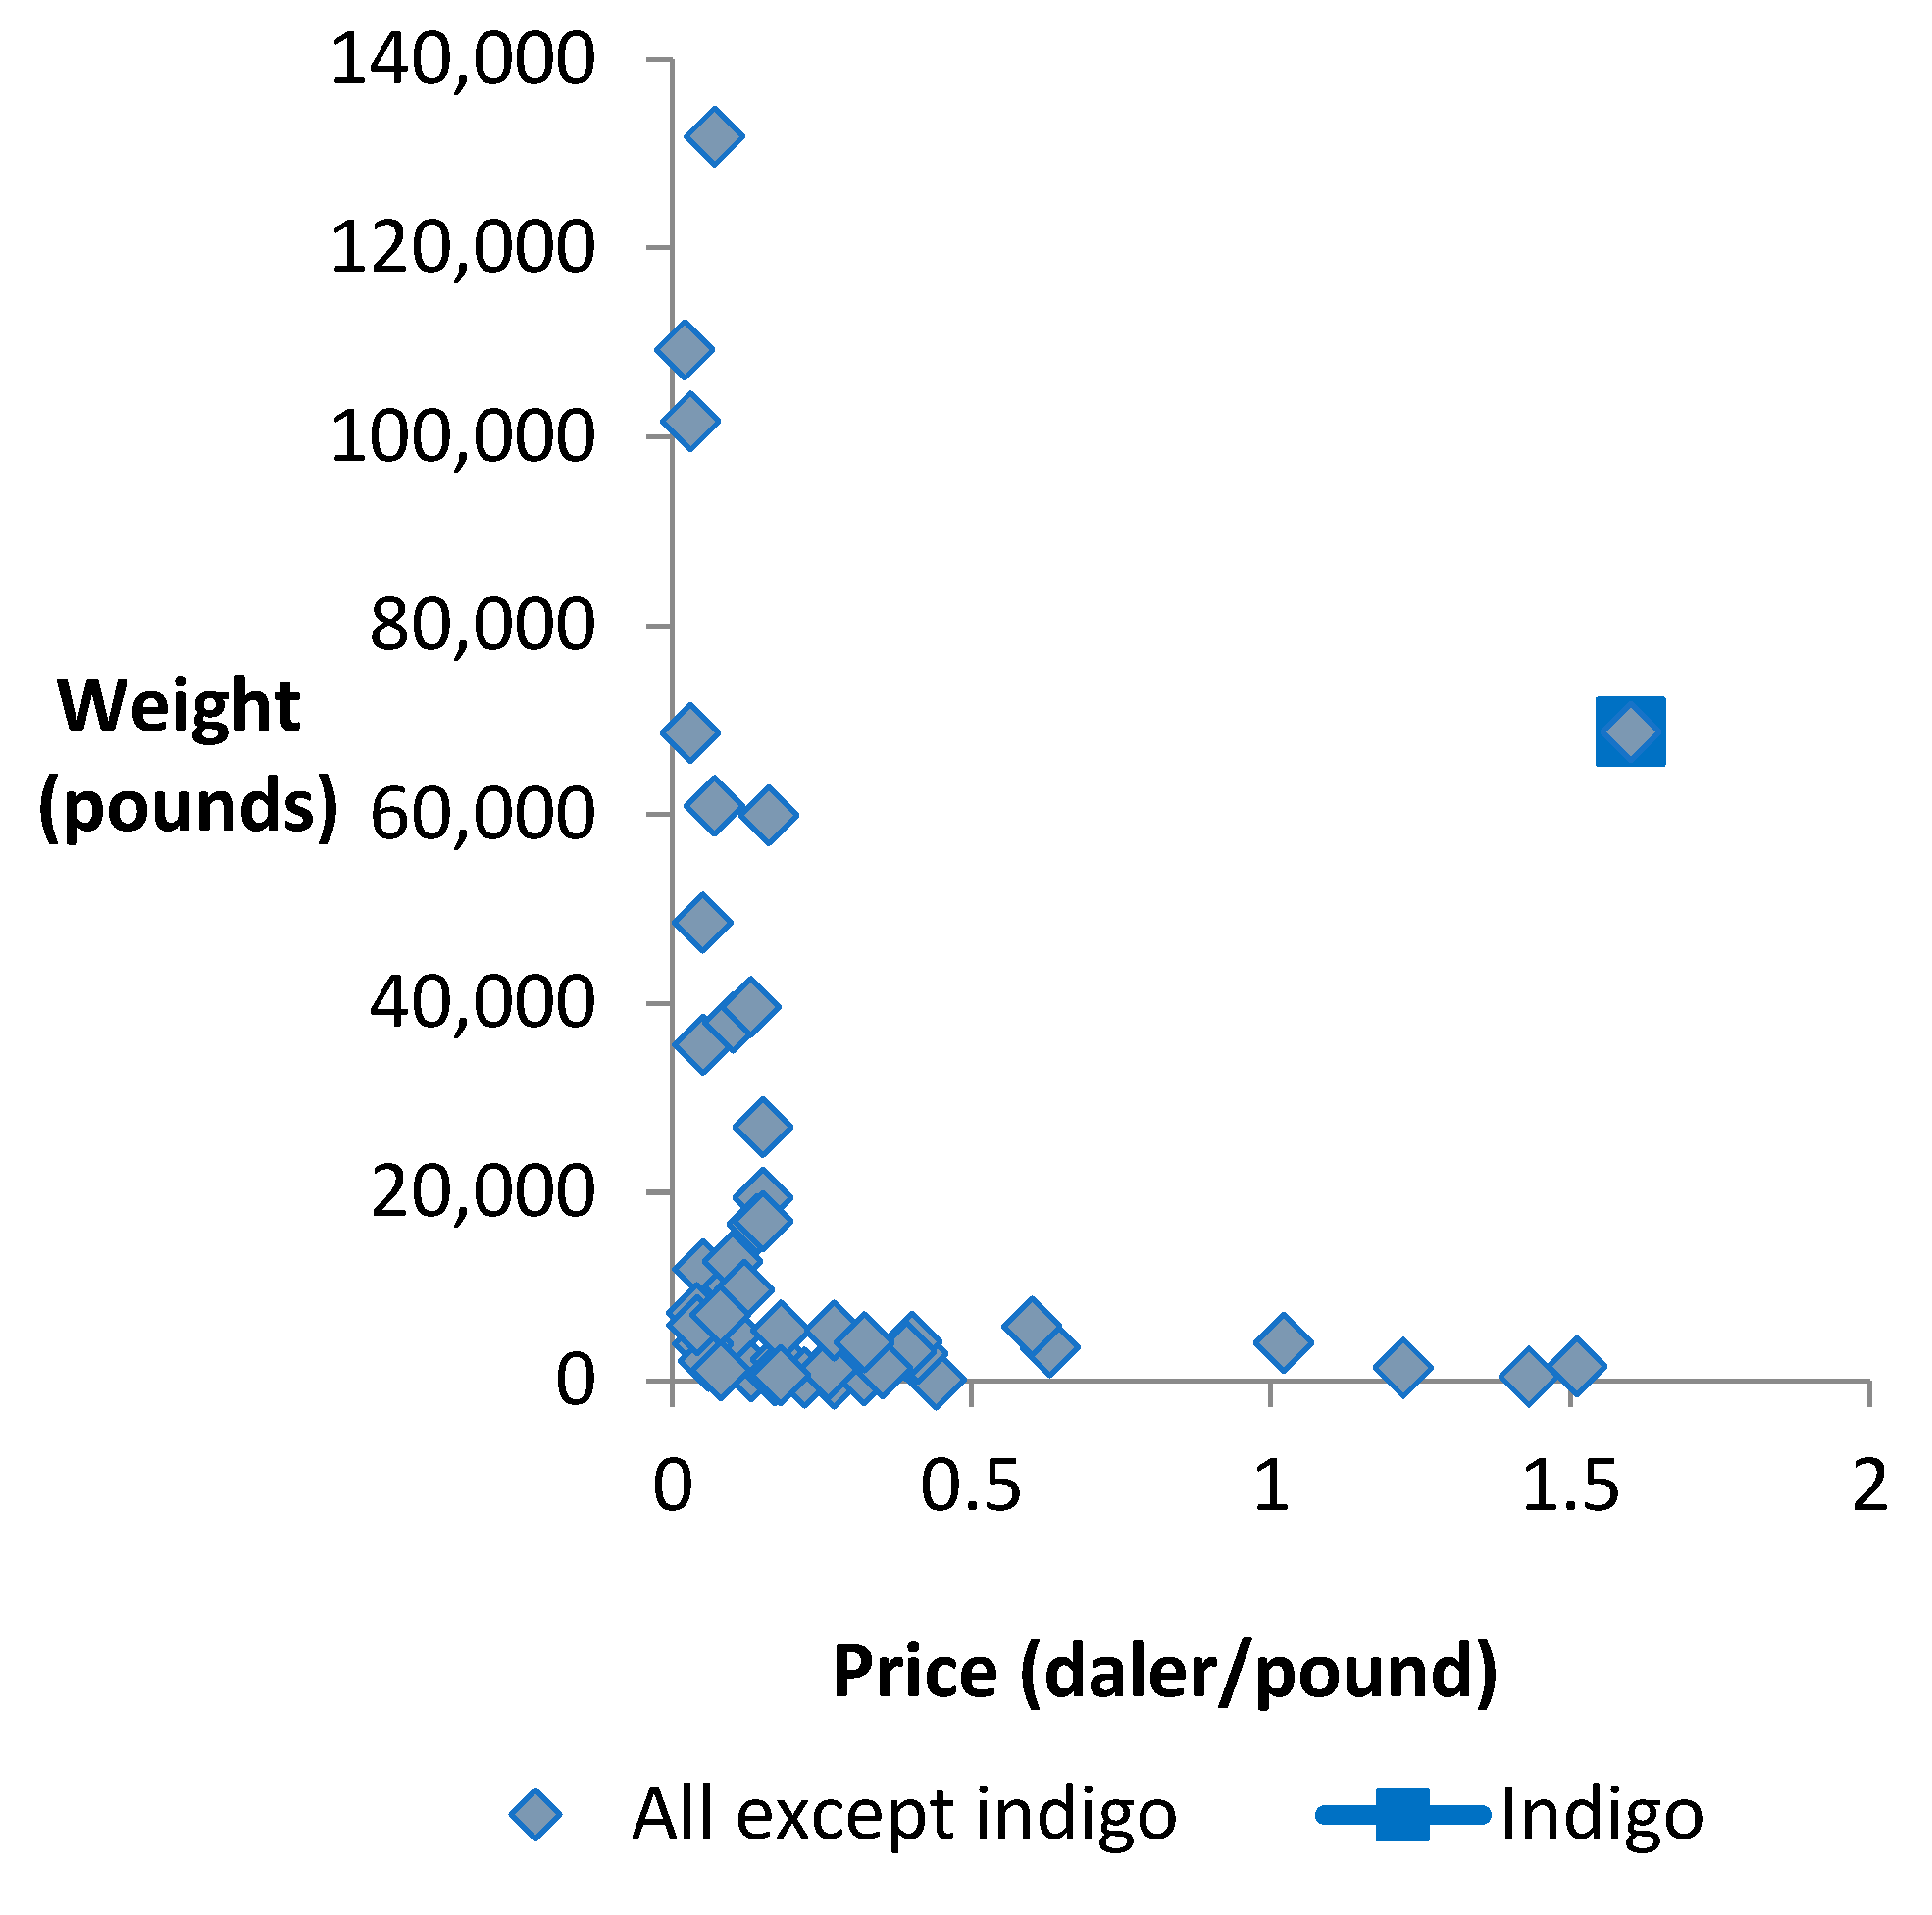
Figure 10 shows that there were no consistent changes in average prices of 31 colorants during the period 1774 to 1794, but with some variations at the end of the 18th century. The more expensive dyes were known as the greater dyes (grands or bons teints in French) since they gave more yield per unit and were more light-resistant. Imported red textile dyes had different prices. Cochineal (4.67 daler/pound) was the most expensive greater red dye followed by madder (0.16 daler/pound), while brazilwood (0.07 daler/pound) was called a lesser dye. Indigo (1.60 daler/pound), in spite of being an expensive greater dye, was the chosen imported blue dye in Norway during the 18th century. Logwood (0.06 daler/pound) was increasingly used only during the 19th century. Leadwhite as the only used white pigment (0.07 daler/pound) was somewhat more expensive than other imported pigments used for painting houses, such as yellow ochre (0.05 daler/pound) and brown red (0.02 daler/pound). Decorative pigments were more expensive such as vermilion (1.22 daler/pound), verdigris (0.60 daler/pound), orpiment (0.18 daler/pound) and umber (0.13 daler/pound). Other expensive pigments were Florentine lake (2.0 daler/pound) and Prussian blue (1.5 daler/pound). There is little information about the prices of local produced dyes and pigments, probably because these were to a lesser extent part of the colorant trade. According to a description from that time, a local dye was sold for 0.08 daler/pound, which is cheaper than most of the imported dyes [20]. Goods imported at the highest amounts during the 18th century were among the cheapest. Figure 11 shows that apart from indigo, all the colorants imported in greater quantities had prices below 0.2 daler/pound.
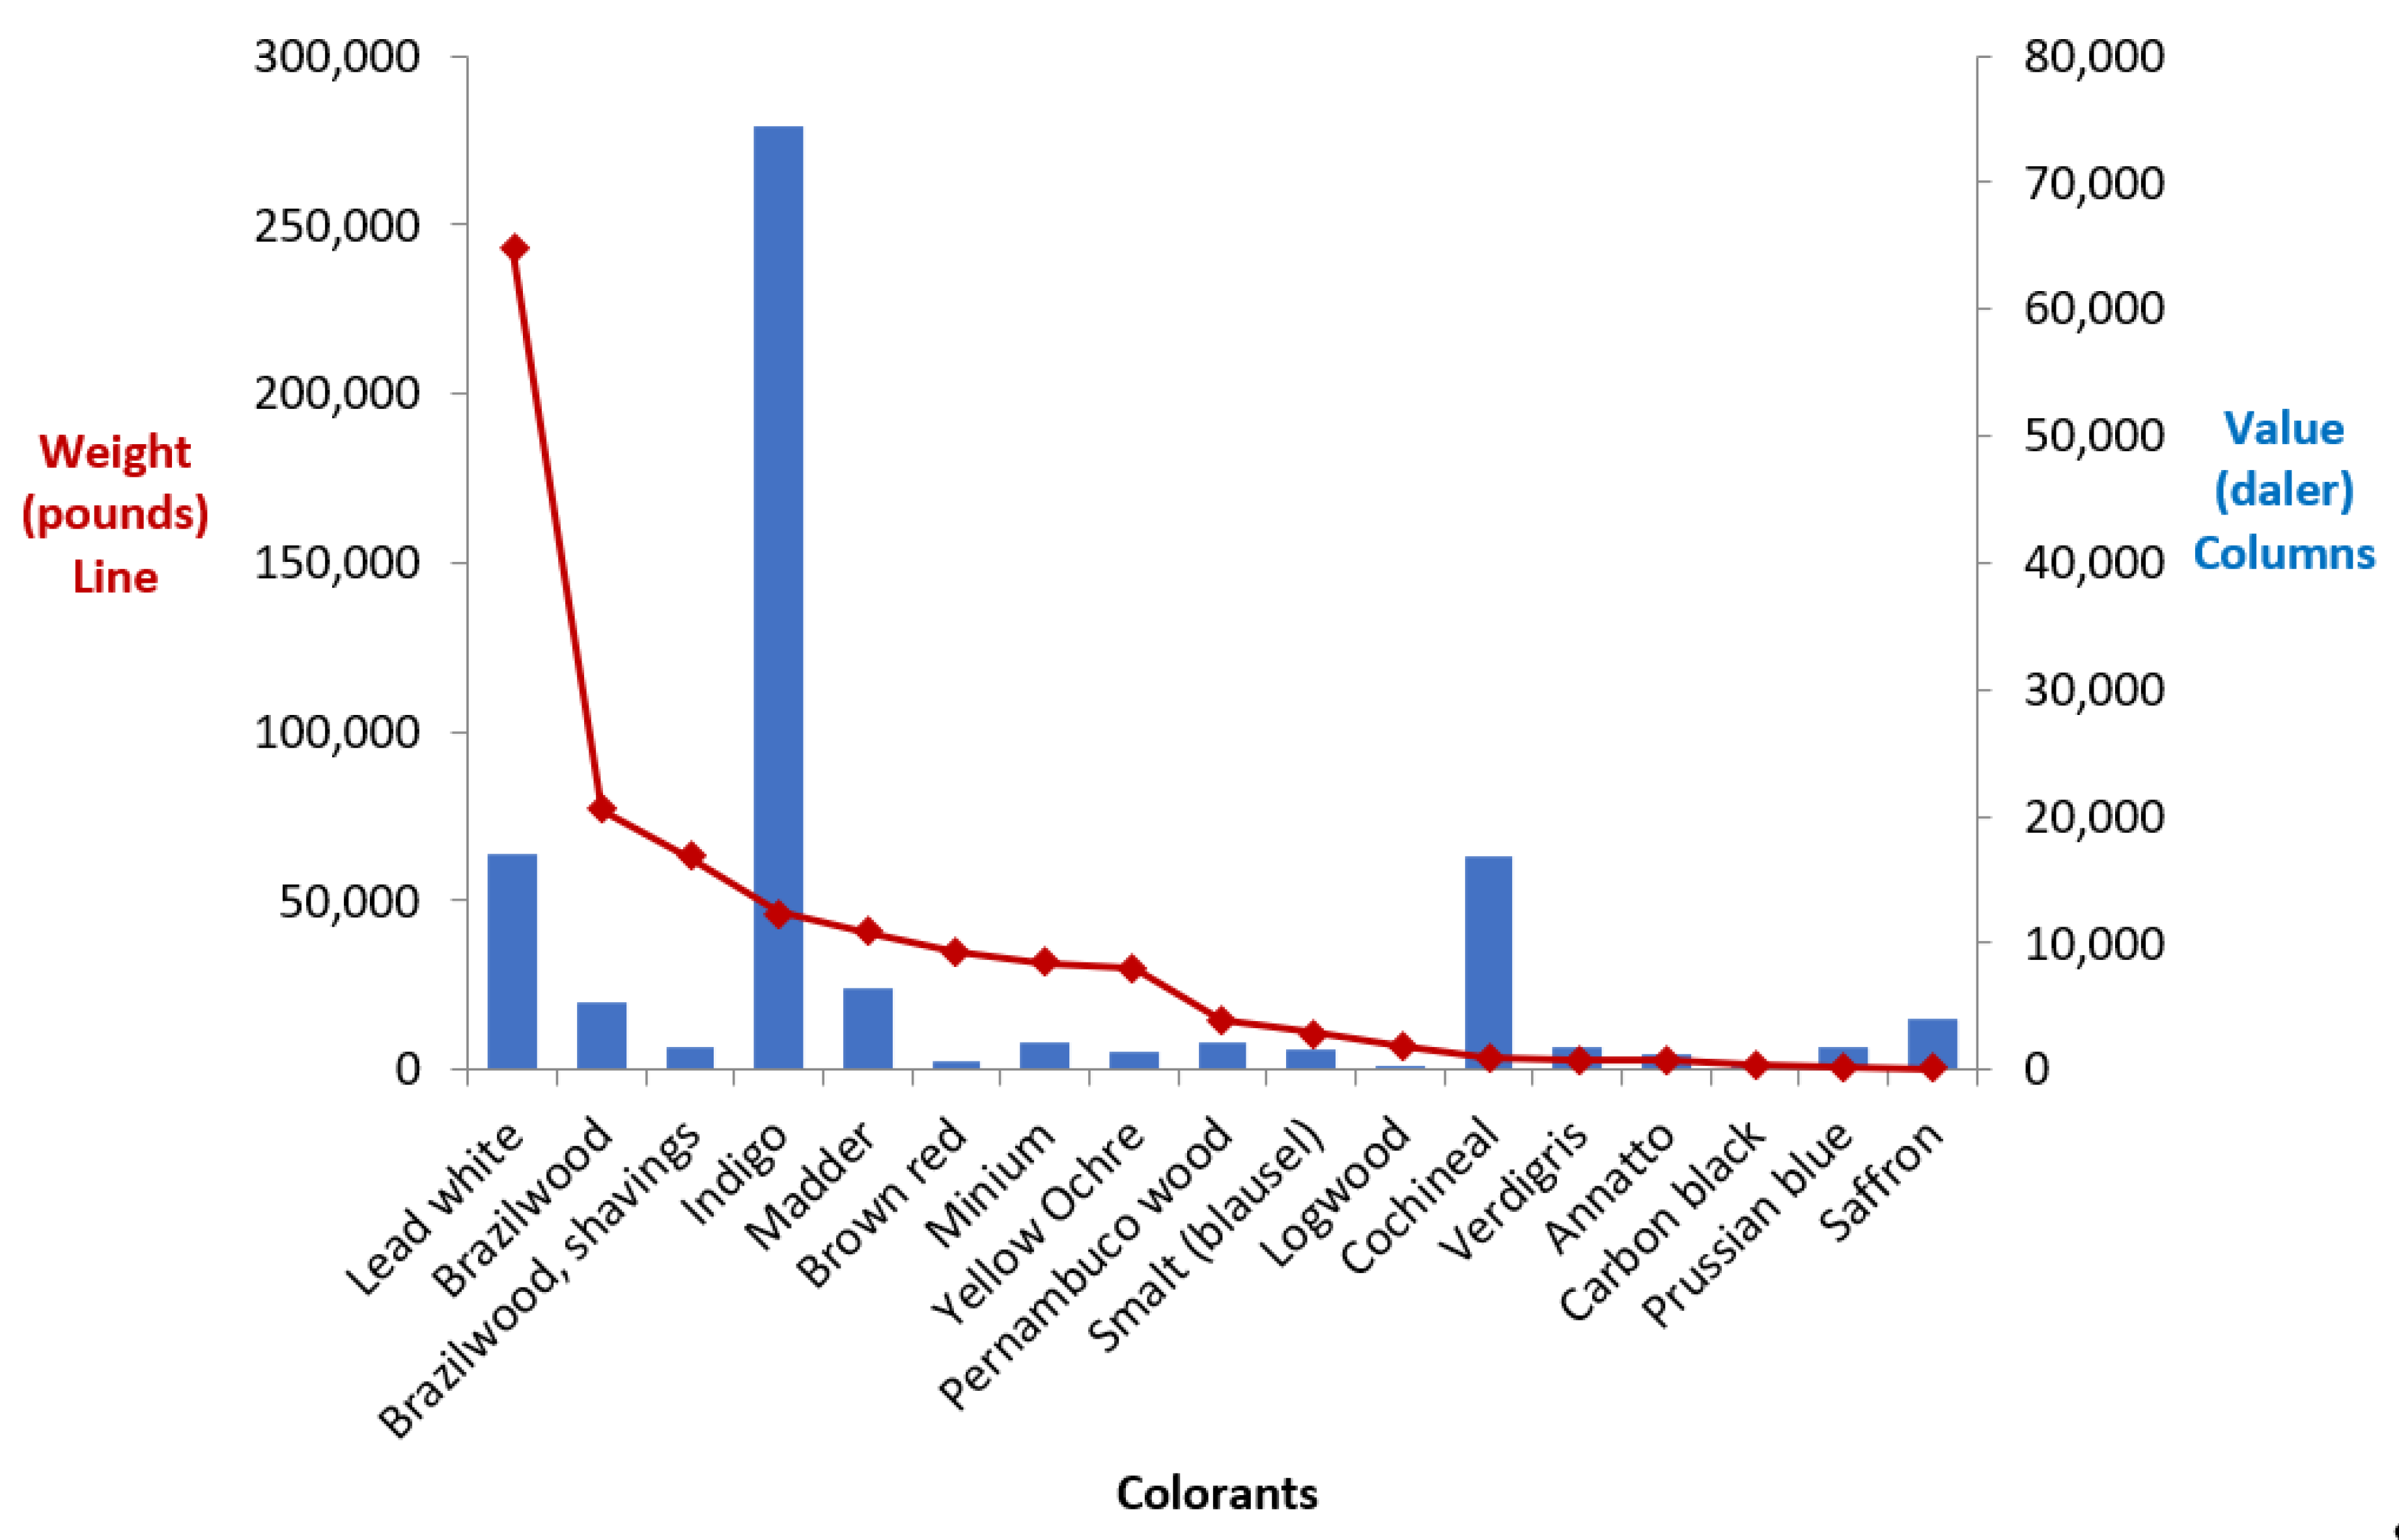
Figure 12 shows 17 imported pigments and dyes sorted by total weight, with their corresponding total values (quantity multiplied by price), as they are registered in the digitized product lists. Lead white, brazilwood, indigo and madder were the most imported colorants by weight (Figure 11, markers). The three colorants with the largest costs during the 18th century were indigo (110,019 daler; high price 1.6 daler/pound and high quantity 68,762 pounds), lead white (23,636 daler; low price 0.07 daler/pound but high quantity 337,661 pounds), and cochineal (19,810 daler; high price 4.67 daler/pound but low quantity (4242, Figure 11, columns).
In terms of weight, the import of pigments was slightly higher than dyes (see bellow). In terms of values the imported pigments and dyes were similar in 1733 (1397 and 1530 daler, respectively). However, in 1790 the values of the imported textile dyes (21,541 daler) were five times higher than the values of the paint pigments (4343 daler). Consequently, more money was spent on dyeing clothes than painting houses, and the increased use of dyeing is even more evident since smaller amounts of dyes were used on textiles compared with pigments used on the larger areas of buildings.

3.4. Imports of other Consumer Goods

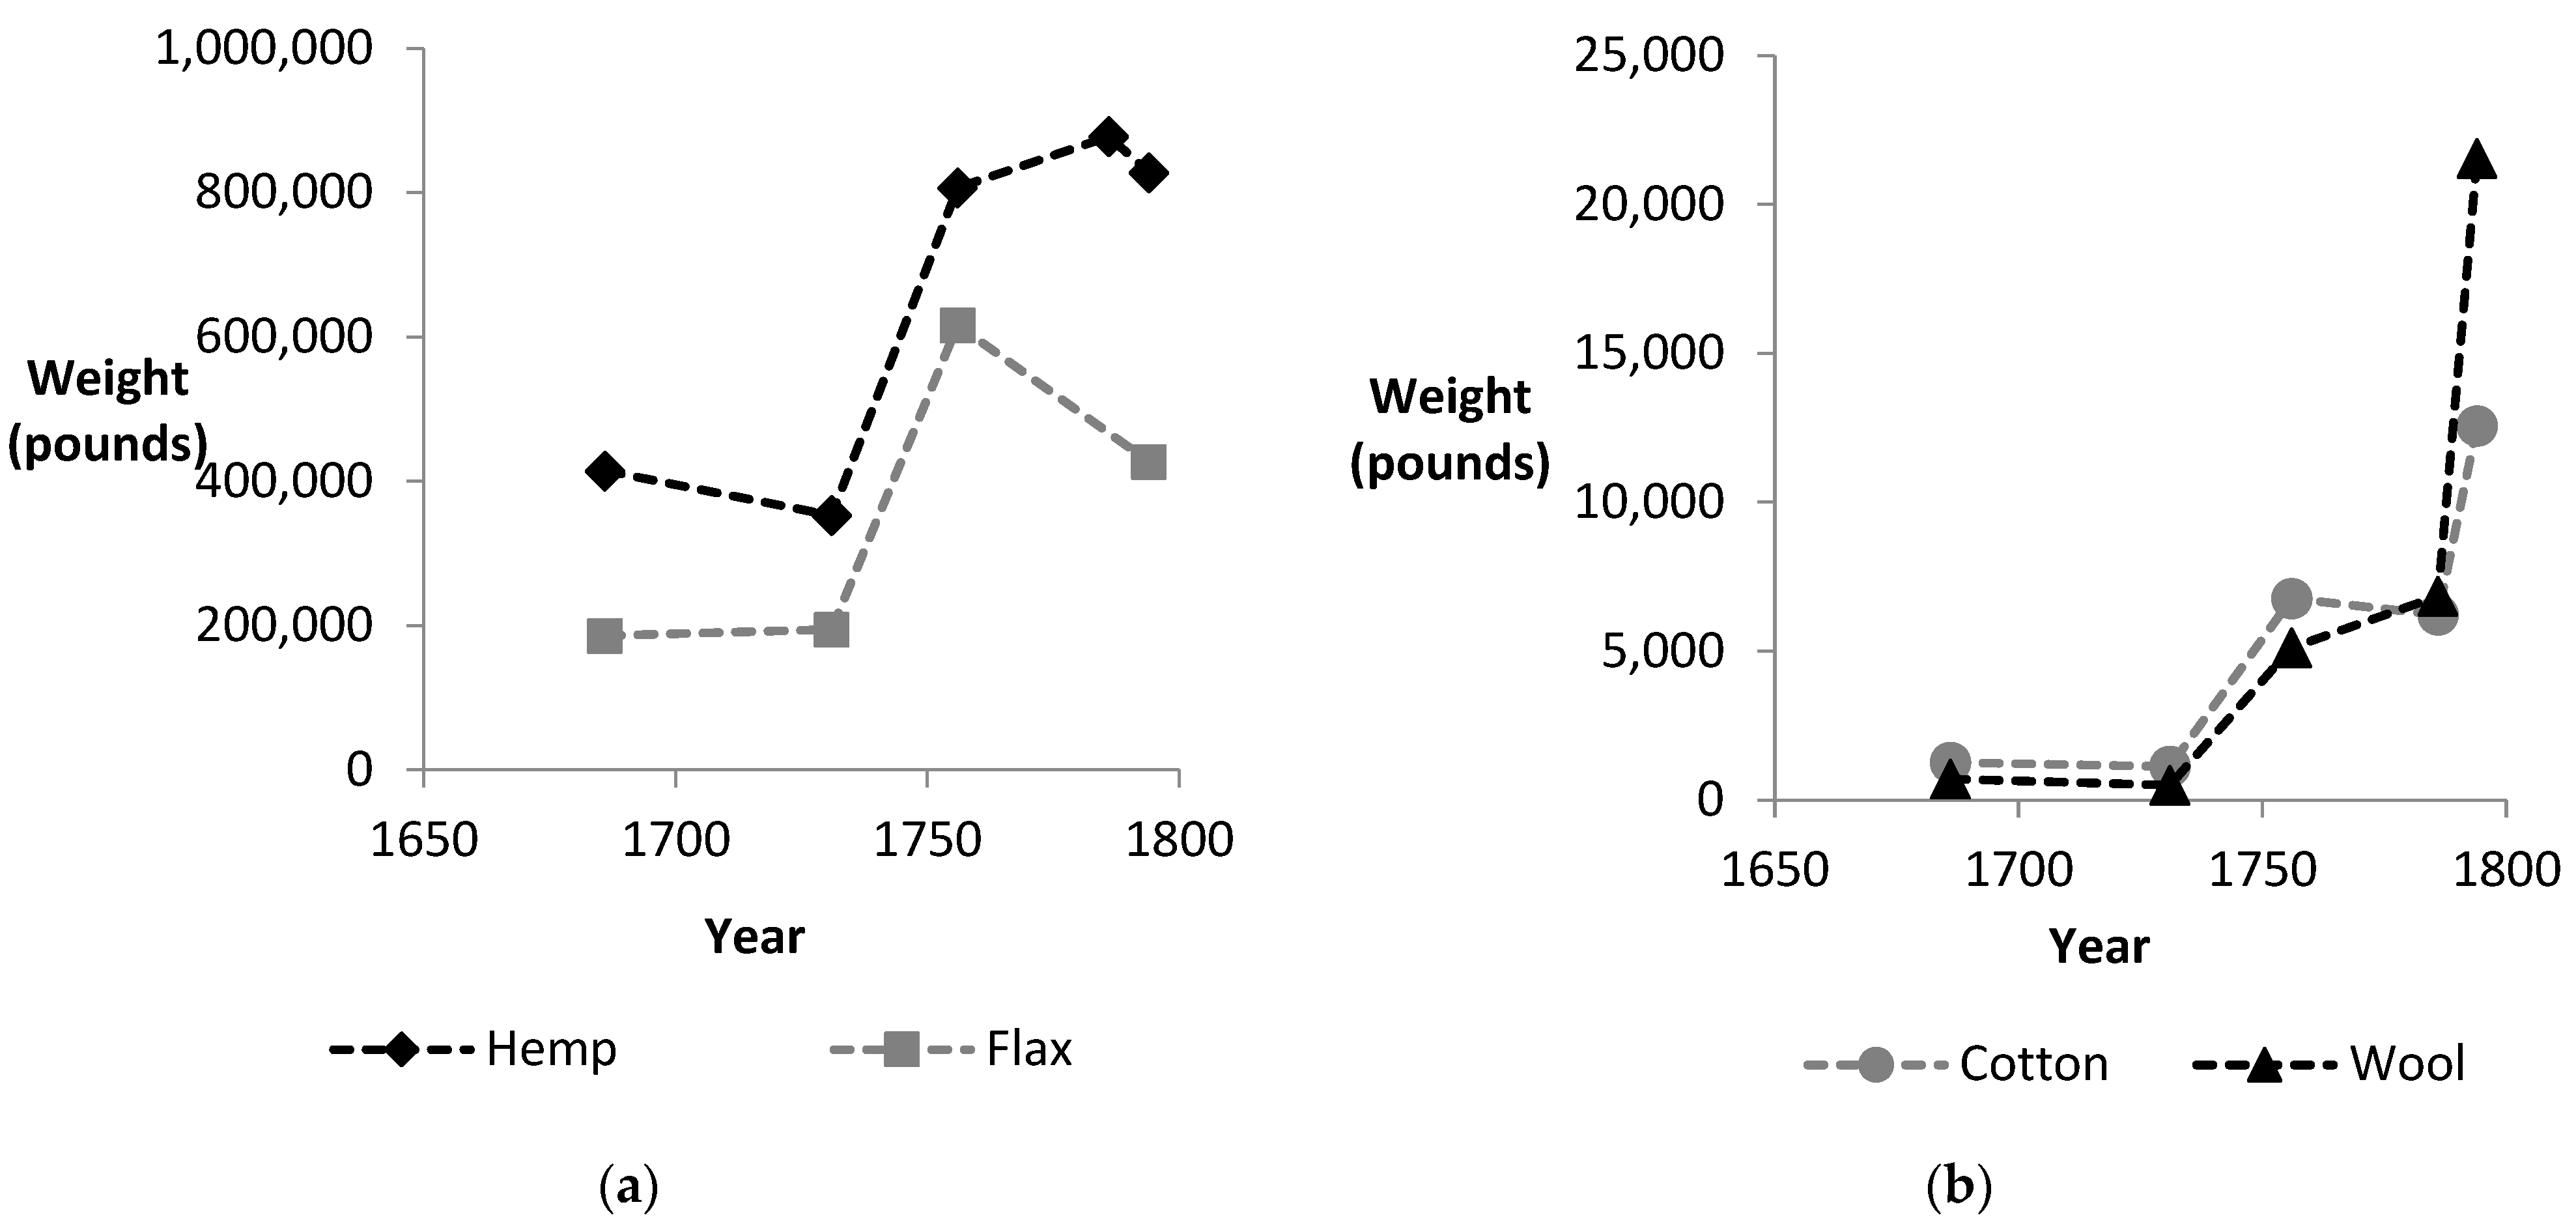
Textile fibers, including wool, were not produced in sufficient quantities in Norway. Figure 13a shows that a significant amount of hemp and flax were imported during the first part of the 18th century, and considerably less cotton and wool. In the middle of the century imports increased for all four fibers. Subsequently, imports of flax and hemp did not increase further, whereas cotton and wool imports increased considerably (Figure 13b). This clearly indicates a change in the use of raw material for clothing.
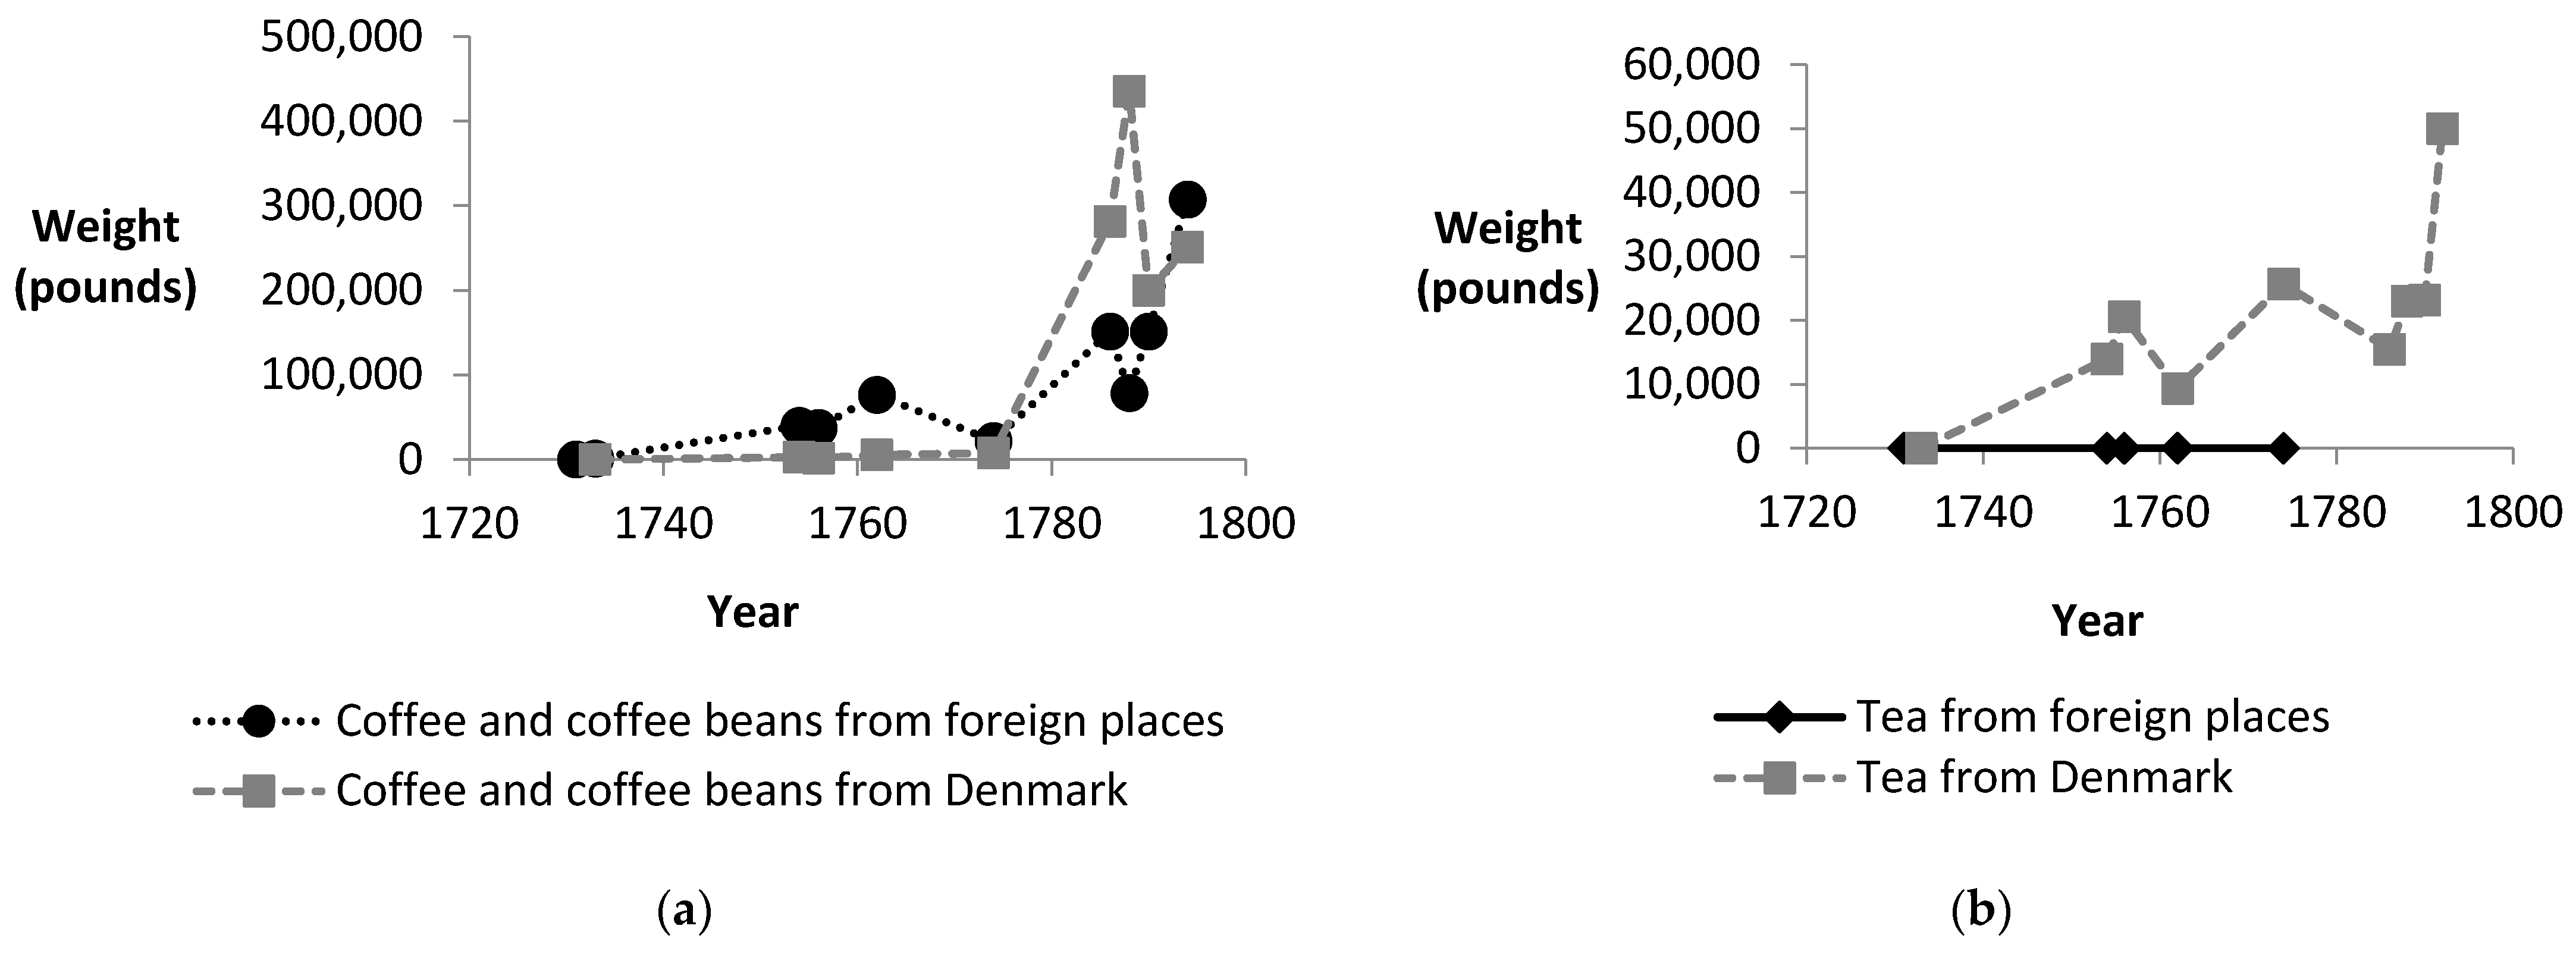
Figure 14 and Figure 15 show imports of goods that traditionally have been considered as typical consumer goods. Like the rest of Europe, pepper was an important import product in the 17th century with significant quantities imported in 1686 (2186 pounds) and 1733 (2432 pounds). During the 18th century, increasing quantities of pepper were imported both from foreign places and from Denmark (Figure 14a). The increased imports of sugar exceeded the other products in weight, and also became part of Danish trade (Figure 14b). While tea and coffee imports into England increased steadily throughout the 18th century [26], tea and coffee imports into Norway only increased during the second half of the century, and again predominately from Denmark (Figure 15). These figures show that imports of traditional consumer goods also increased at the end of the 18th century in Norway.

3.5. Export and Domestic Trade in the 18th Century and Imports in 1835

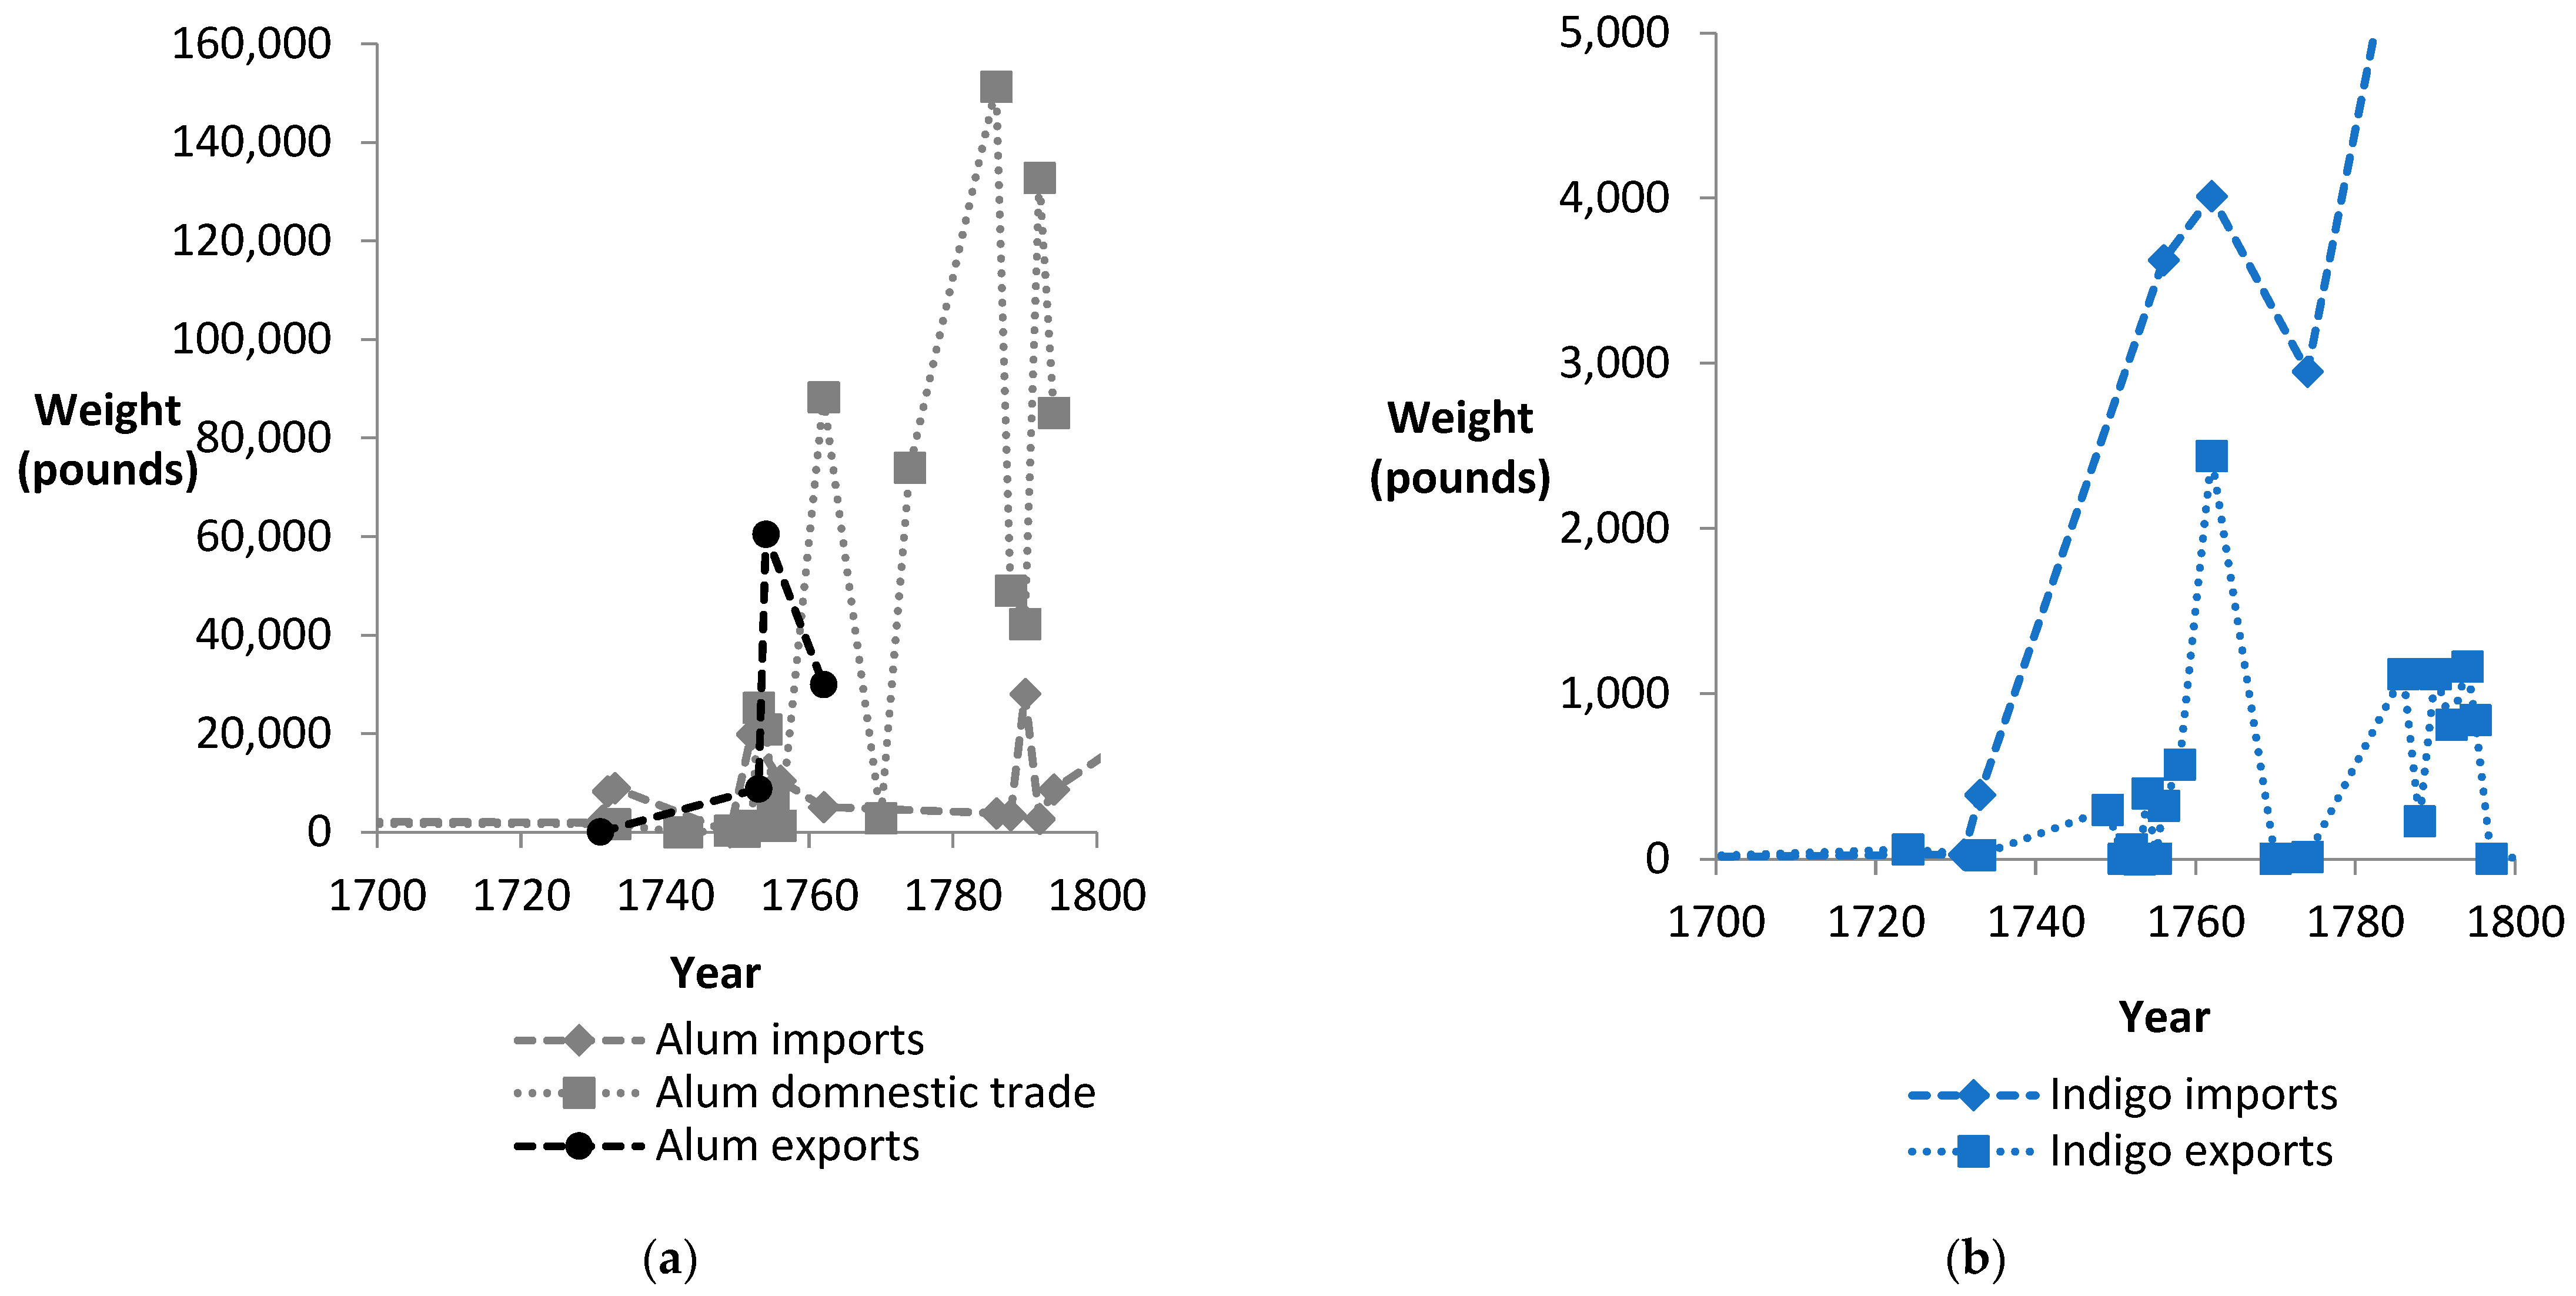
The quantities of tar exported exceeded the quantities of tar, which were imported or sold domestically. Exports of cobalt and lichen were also larger than imports. Tar, cobalt and lichen may therefore be classified as export products. Brown red was partly an imported and partly a domestic color from Denmark. Danish red, however, was a pure domestic color from Denmark, used for a short period during the 1750s. Alum and lime were produced in Norway. The domestic trade of alum was considerable, mostly shipped from Norway to Denmark (Figure 16a). Indigo was imported in large quantities during the 18th century (Figure 7a) and was also exported for a few years during the second half of the 18th century (Figure 16b).
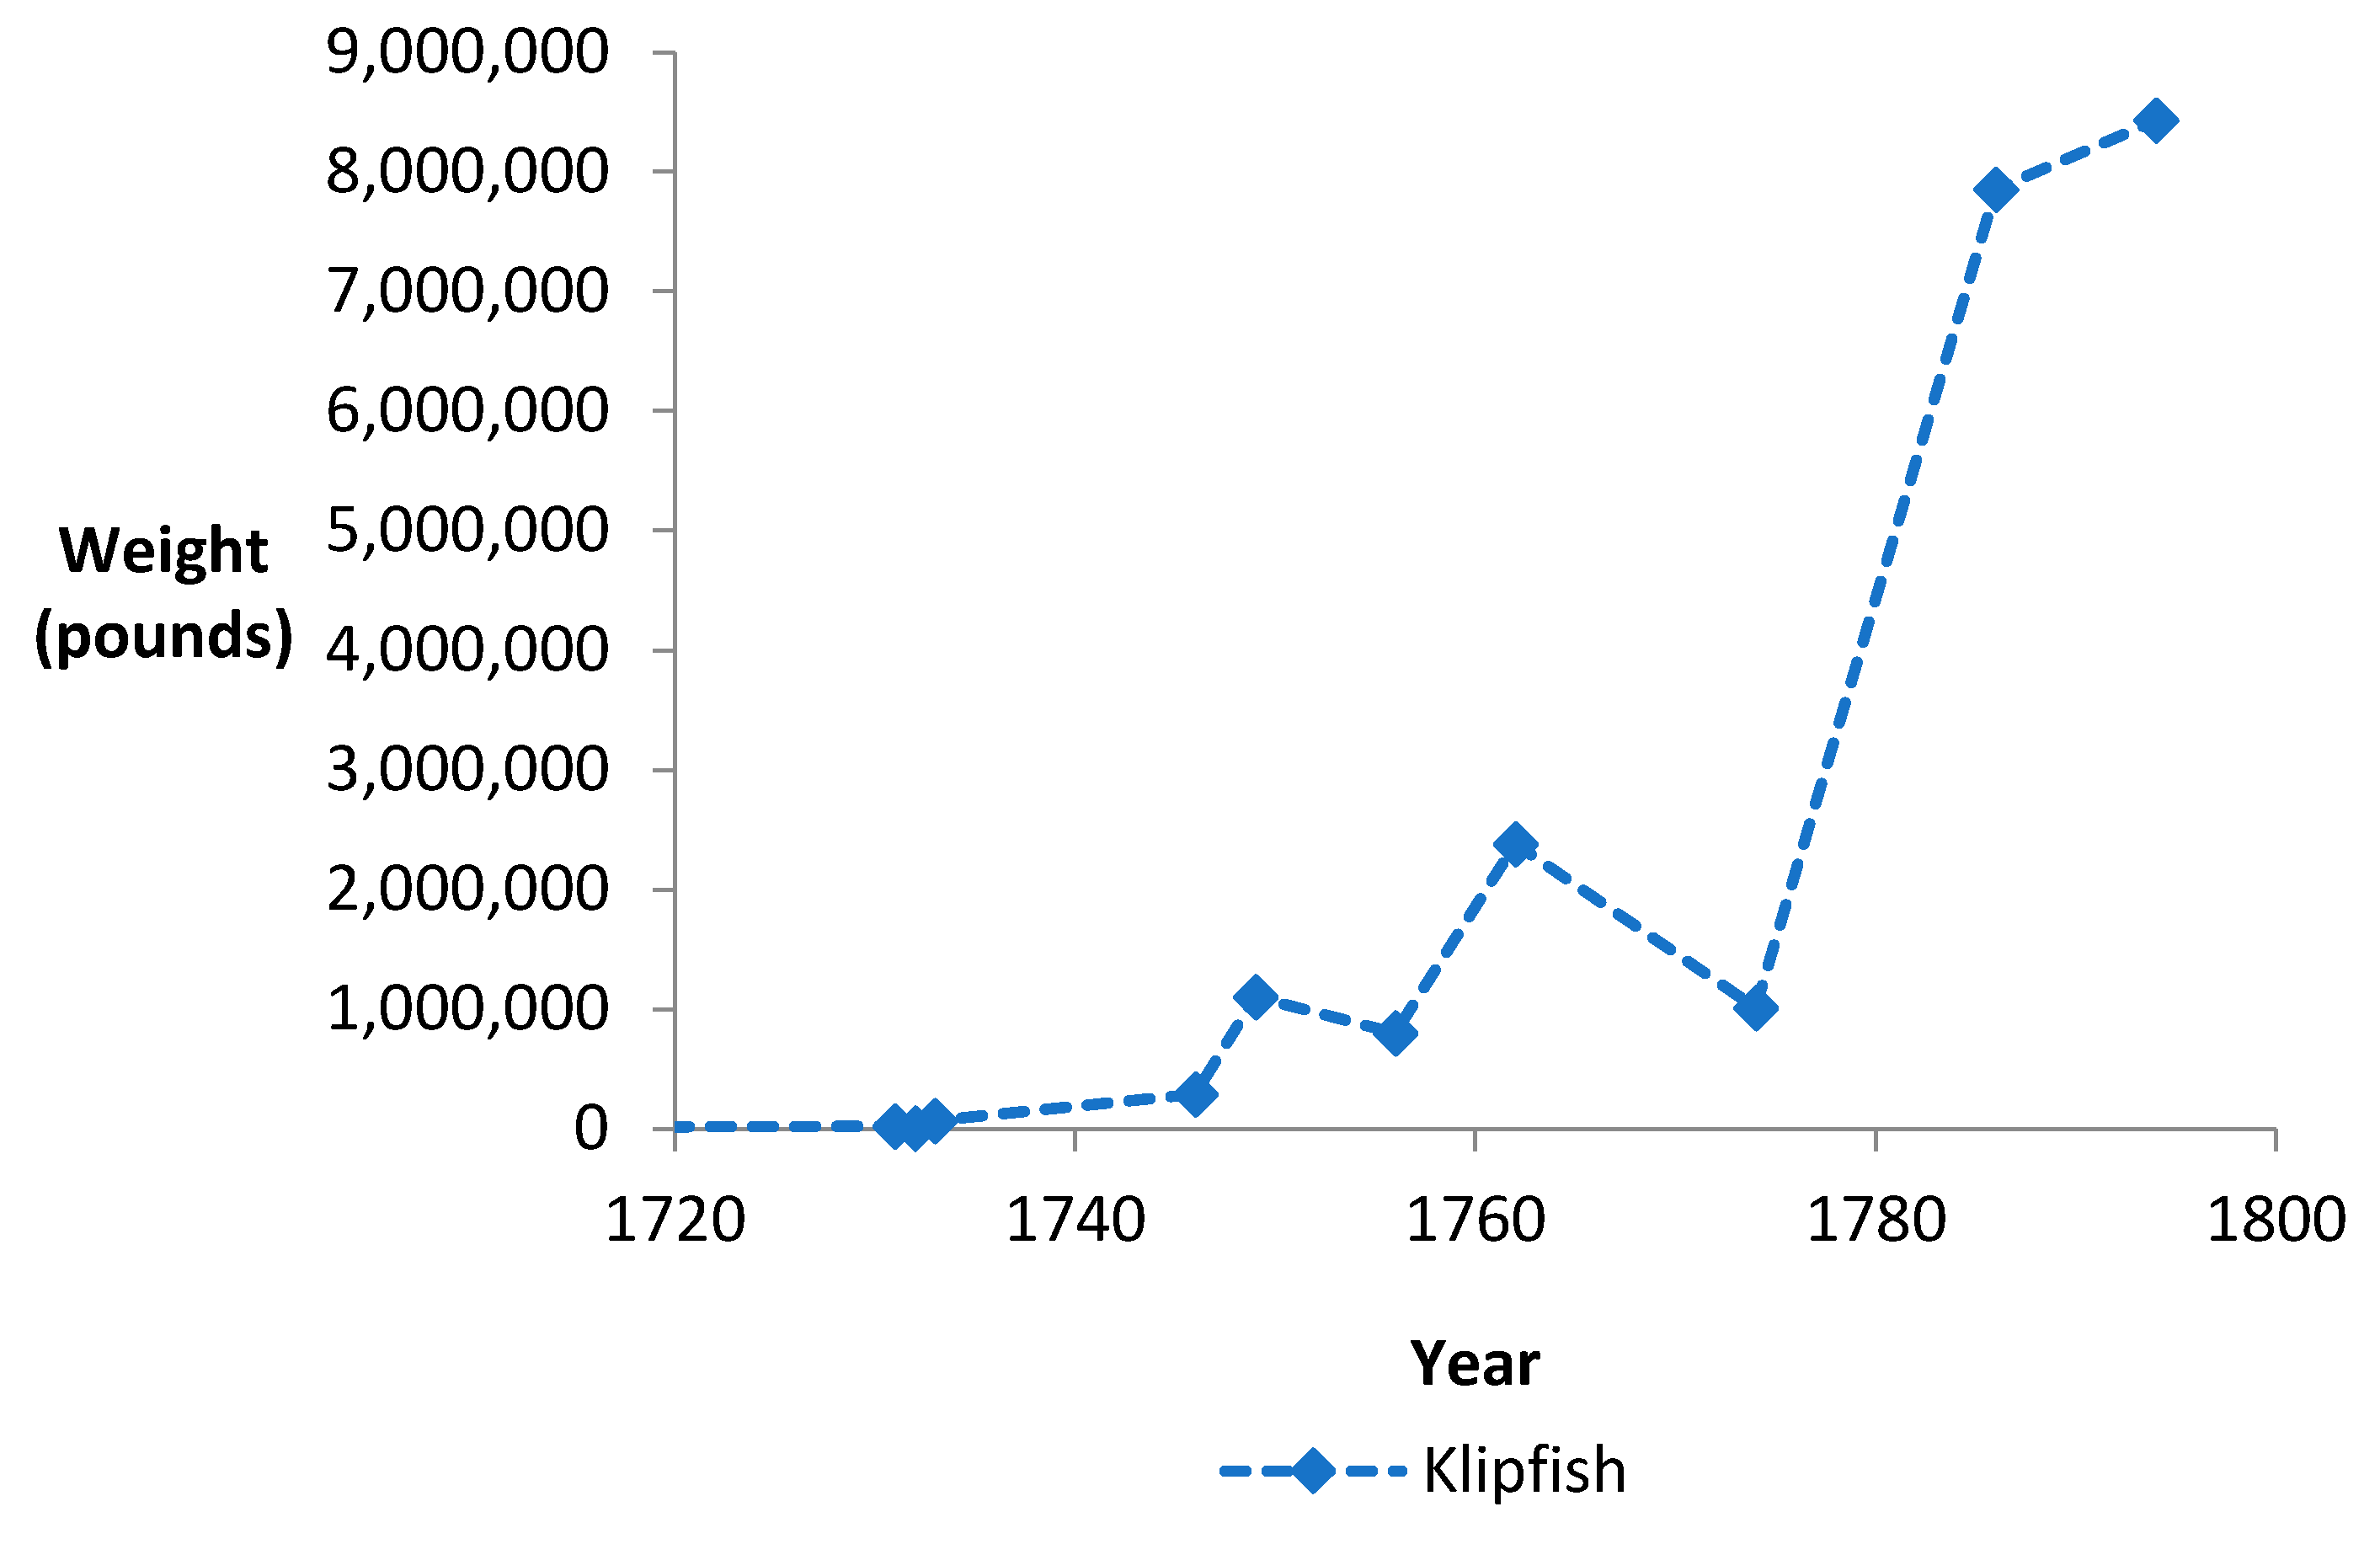
The most important Norwegian export products were timber, copper, klipfish and stockfish. Export graphs are difficult to present for timber and stockfish exports, since the digitized product lists from the Norwegian customs records do not contain sufficient data with uniform units. Export data for copper from Trondheim show an increase from 283, 434 and 618 ton for the periods 1721–1730, 1741–1765 and 1771–1790, respectively [27]. Similarly, Figure 17 shows that the amount of klipfish exported increased especially from the middle of the 18th century.
A total of 20 new colorants were registered in the trade statistics from 1835. Quercitron and sappanwood were examples of a new yellow and red dye for textile dyeing. Brunswick green and chrome yellow were new paint pigments, and ultramarine was imported as an expensive paint pigment known for centuries. The increased dyes from 1794 to 1835 (559,135 pounds) was significantly greater than the increase in paint pigments (88,238 pounds), indicating that textile dyeing constituted a considerable larger proportion of the colorant imports than those used for painting and decoration. Imports of toxic arsenic pigment (orpiment, rusgel) continued to decrease, but toxic lead-containing pigments (lead white, minium, chrome yellow and chrome red) were still imported in 1835. Similarly, toxic arsenic compounds were also used for make-up: lead to give a pale complexion and vermilion was used as rouge [28].

3.6. Two Periods of Increased Colorant Imports

Imported pigments have been divided into pigments used for painting houses (brown red, caput mortuum, carbon black, Danish red, earth pigment, English earth, lead white, minium, yellow ochre) and other pigments that were mainly used for decoration. Figure 18a shows import graphs for pigments for house painting, binders, dyes and mordants for the years 1733, 1756, 1786 and 1794with “most” complete records available. There was an increase in imports somewhere between 1733 and 1756, and a considerable further increase from 1786 to 1794. Figure 18b shows similar import graphs for the years 1731, 1733, 1756, 1762, 1774, 1786, 1788, 1790, and 1794 with “most” complete registrations. The figure shows a temporary decrease in imports in 1774, which will be discussed in Section 4.2. The increase in imported paint pigments and textile dyes in the 18th century was significant. The amount of imported dyestuffs increased from 1733 to 1756, 1786, and 1794 with factors of 4.5, 6.3, and 14.9, respectively, and the corresponding figures from 1731 were significantly higher 23.1, 32.4, and 76.6, respectively. Colorants with especially large increases in imports at the end of the century were brazilwood, indigo, cochineal, lead white, madder and sandalwood. As shown in Figure 1a, the number of new pigments and dyes also increased significantly. Figure 19 showing import graphs for selected dyes that were imported in larger quantities, further illustrates the increasing imports in the middle of the 18th century and significant additional increases at the end of the century.
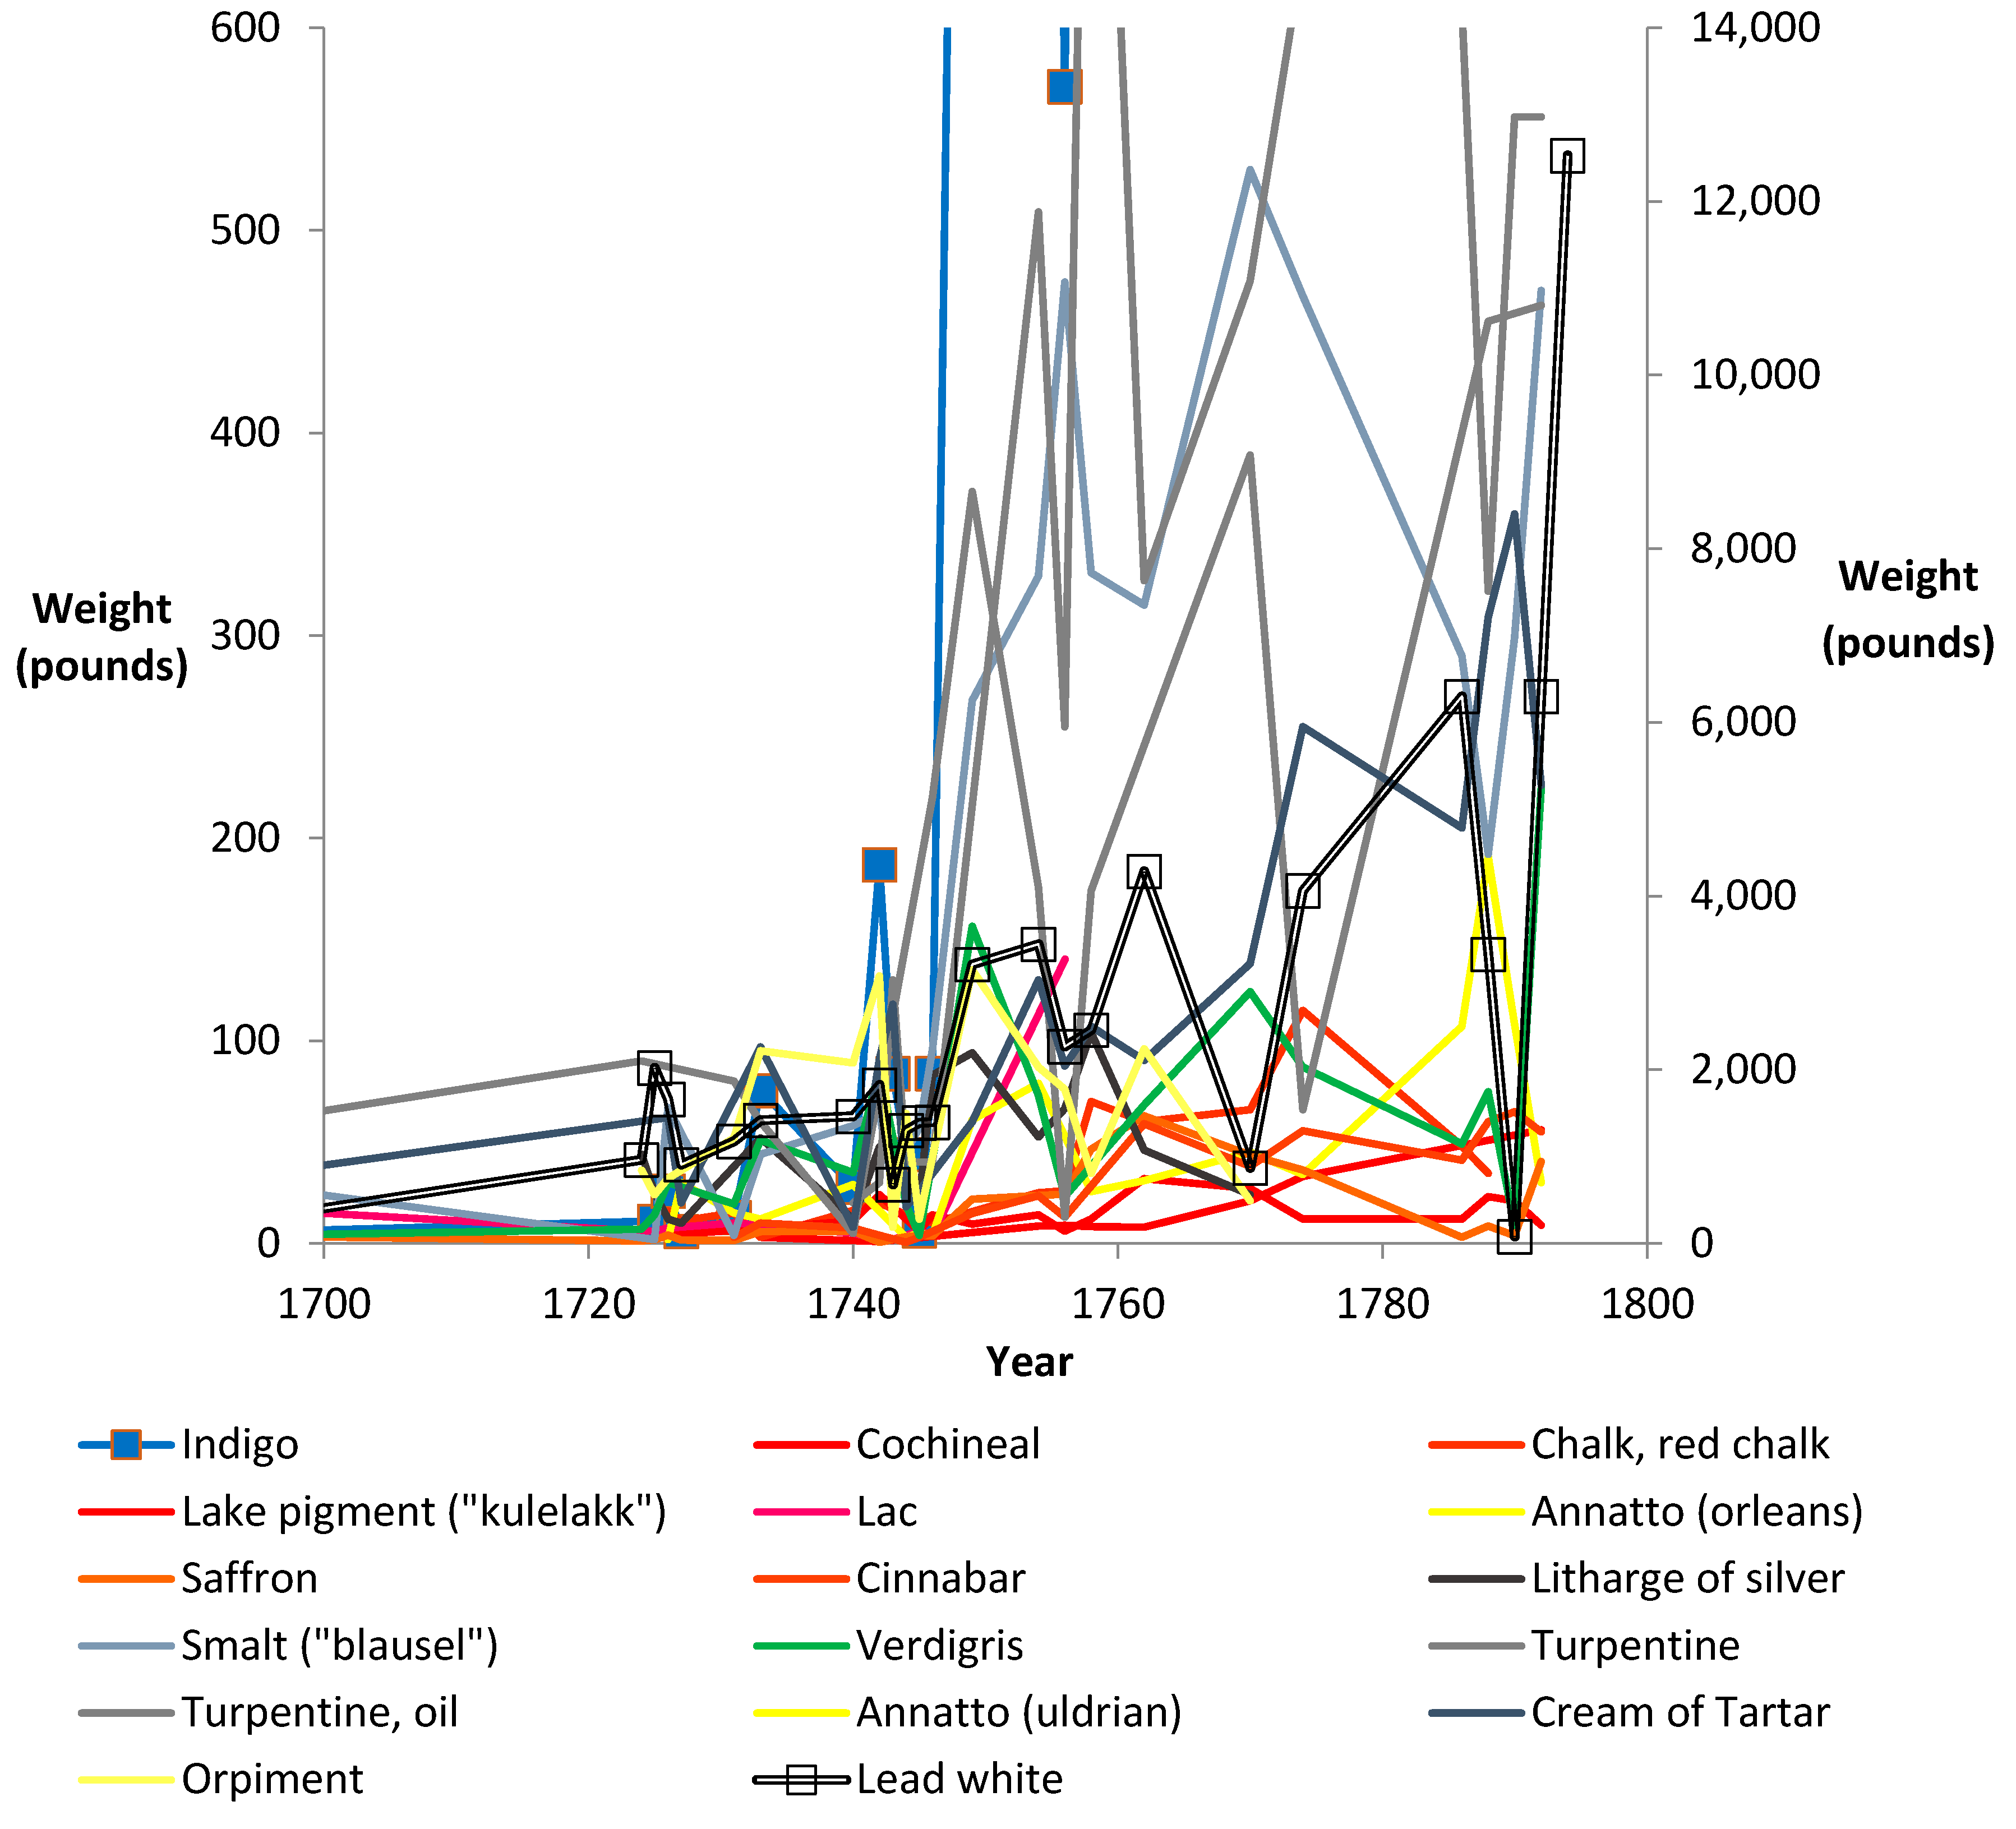
The digitized product lists from the Norwegian customs records include particularly frequent import registrations for the city of Trondheim in the mid-18th century. Figure 20 shows that imports of many dyes were low in the first part of the 18th century, and increased considerably during a short period 1745–1750. The increased dye import was maintained during the second part of the 18th century. A further increase of imports at the end of the century was most pronounced for lead white and indigo, as shown for the whole country in Figure 2a and Figure 7a.

3.7. Imports by Color

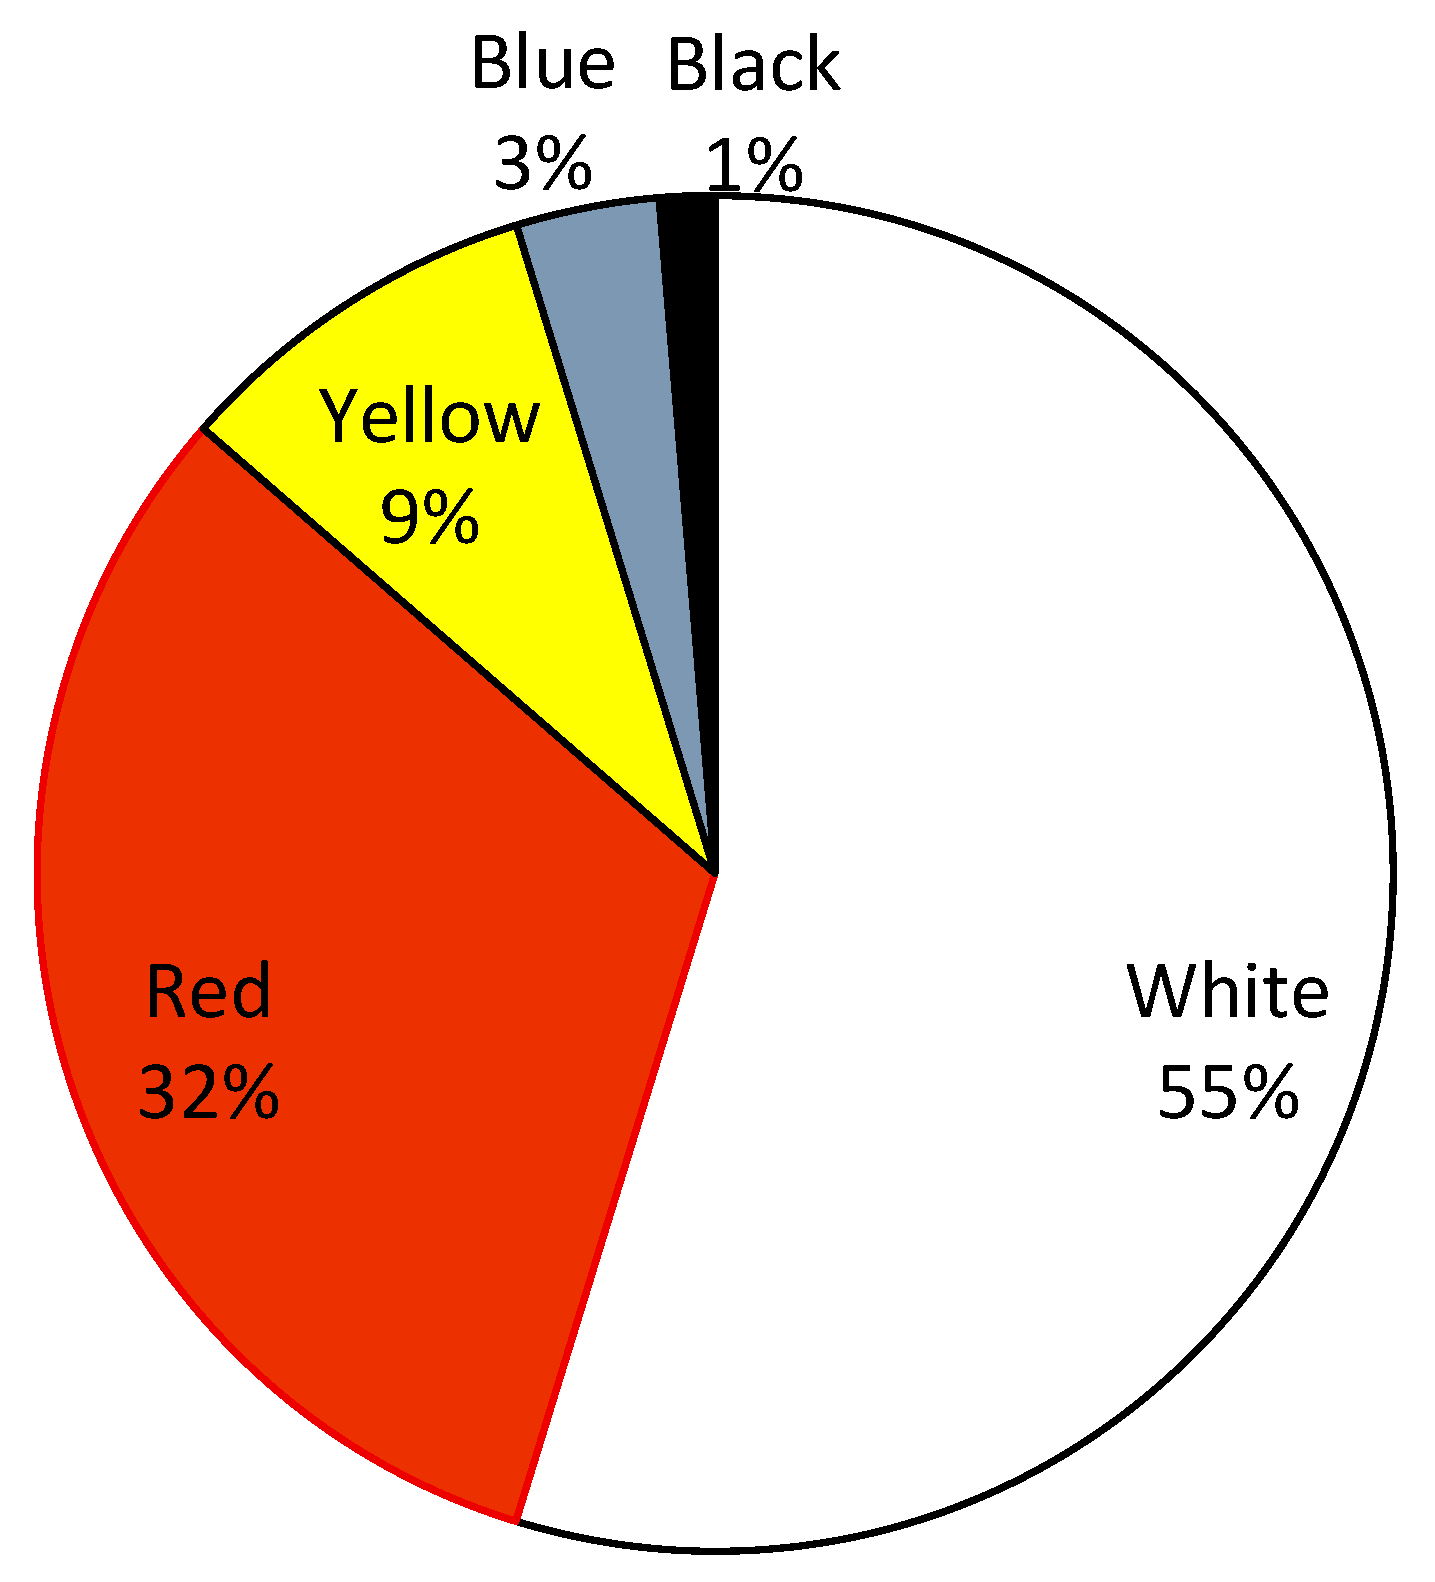
Figure 21 shows the total import of pigments over the century, with lead white, red and yellow colors accounting for 96% of the weight of imported colors used. Figure 22 shows that red dyes made up the majority (approx. 3/4) of the imported dyes. The imported red dyes showed the greatest increase, as largely represented by brazilwood. Imports of indigo (20%) and yellow dyes (9%) also increased in the late 18th century. Blue and red became popular colors during the century, indigo due to its high color yield per unit was also used in large amounts, and yellow, green (2%) and black (1%) colors contributed to an increased color range.

4. Discussion

In 18th century Britain, people spent more money on clothes and textiles than on any other consumer goods [26]. Dyes determined much of their attractiveness. Together with painted houses and objects, dyes represented an increased splendor of color as a visible part of the consumer society. In the previous Section, increased imports of colorants in Norway during the 18th century are presented, representing the increased supply of imported colorants especially during the second part of the century. This Section discusses how increased imports of colorants as consumer goods can shed light on the beginnings of the consumer society. Factors to be discussed include the increased imports reflecting two chromatic revolutions, how increased export trade may have stimulated increased colorant imports and domestic trade, and how different factors may have stimulated the use and demand for colors. All these elements may be compiled in a model to visualize processes, which may have contributed to the development of the early consumer society.

4.1. Colorants as Consumer Goods

Goods from the colonies accounted for 10% of the value of English imports in the mid-16th century and increased to 36% in 1770 [29]. From 1664–1679 to 1731–1740, the share of pepper among imported goods had fallen from 20% to 4.3%, with increasing amounts of other imported consumer goods such as tea, coffee, sugar, and tobacco [26,29]. Figure 14 and Figure 15 show a similar increased import of these consumer goods to Norway. While the traditional luxury often was associated with high costs and a lack of moral scruples, increased trade in consumer goods gave rise to a new luxury that was more closely linked to utility, comfort and pleasure. It became more accepted as an expression of wealth, and changed people’s living habits and consumption culture [30]. The rise of the consumer society in England has largely been studied through the import of the classical new products from the colonies, such as pepper, coffee, tea, sugar and tobacco [31]. Other new consumer products, such as porcelain and textiles, had high quality and aesthetic values. Traditionally, paint pigments and textile dyes have not been highlighted as typical luxury and consumer goods, but they have many similarities. The imported colorants competed with the domestically produced earth pigments and plant dyes, and formed a heterogeneous group in terms of both price and characteristics, used by a large part of the population. Like tobacco, coffee and sugar, they provided increased pleasure and well-being. They did not increase comfort or simplify daily life, but as semi-finished products the imported dyes were easier in use than local plant dyes. For all these reasons, colorant imports are particularly suitable for studying the start of the consumer society.

4.2. Two Chromatic Revolutions

The countries around the North Sea were the most important Norwegian trading partners, and only 17% of the colorants came as domestic trade from Denmark. The imported colorants were produced in Europe (such as lead white, madder and verdigris) or had been transported from the colonies. After the Great Nordic War (1709–1719), Denmark-Norway experienced a long period of peace. It started with economic depression, where also pietism prevailed. However, after a period with low climate temperatures from 1741 to 1743, prosperity increased. During The War of the Austrian Succession (1740–1748), Denmark-Norway increased its trading activity. There was a significant increase in European demand for the Norwegian export products during the 18th century, which is reflected by an increased export of timber, copper and fish to Europe. Increased exports of klipfish (Figure 17) may serve as an example of the increased Norwegian export trade from the middle of the 18th century, which opened the way for a new type of import trade with luxury and consumer goods, including new colorants.
Lead white and indigo imports are of particular interest, since these colorants were exclusively imported and were the only white pigment and blue dye in use. There is no evidence that colorants were stored in large quantities in Norway. Therefore, import graphs of lead white (Figure 2a) and indigo (Figure 7a) may be representative for the use of imported colorants during the 18th century, characterized by increased imports during the middle and at the end of the century. Import graphs for the different dyes (Figure 19) clearly show increased imports in the middle and at the end of the 18th century. Similar graphs for pigments as a group are not presented for several reasons. Firstly, the largest amounts of pigments were used for house paintings, which followed periods of different styles. Secondly, with the exception of lead white, the amounts of imported pigments do not reflect their total use, since there was an abundant local production as well [32,33]. Finally, pigments for decoration represented a heterogeneous group imported in smaller quantities. However, individual import graphs for pigments basically not related to style show the same tendency towards increased imports during the second part of the 18th century, such as lead white (Figure 2a), Prussian blue (Figure 7b), dyer’s buckthorn (Figure 3a), carbon black (Figure 3b), verdigris (Figure 8b), gums (Figure 4a), turpentine and turpentine oil (Figure 5b).
Correspondingly, imports graphs showing the total amounts of pigments for house painting, dyes, mordants and binders (Figure 18), and colorant items to the city of Trondheim (Figure 20), show the same import patterns. Imports of pigments for decoration did not show significant increases at the end of the 18th century, presumably because there were more of them and each pigment was used to a lesser extent. The data for 1774 Figure 18b may be misleading due to incomplete data from Bergen and Christiania. Complete import data from Trondheim, however, do not show a similar significant decrease in colorant imports in 1774 (Figure 20). It is however noteworthy that the graphs indicate a transient stagnation in colorant imports from the middle of the 18th century. The slight increase in export trade of indigo in this period (Figure 16a) may indicate saturation of the domestic colorant market, possibly as part of mercantilist politics with customs and law restrictions. Moreover, the early 1770s were designated as crisis years due to unsuccessful grain crops and due to negative impacts of the Seven Years’ War (1756–1763) when Denmark-Norway had to mobilize the navy to protect their neutral merchant ships. Limited transport, sales and production opportunities may also transiently have hampered a steady increase in the use of colorants during the 1770s. Import graphs for the textile dyes sorted by color show that the sum of the blue and red dyes also followed the two chromatic revolutions (Figure 22b). Similar increases are apparent for the yellow, green and black textile dyes, when the scale for the Y-axis is enlarged. The 18th century has been called the century of revolutions, and the author has designated the two periods of increased colorant import in the middle and late 18th century as the first and second Norwegian chromatic revolutions, respectively.
Colorants with particularly large increases in imports at the end of the century were brazilwood, indigo, cochineal, lead white, madder and sandalwood. However, although most colorant items followed similar import patterns corresponding to the two chromatic revolutions, each of the colorants also had individual factors influencing their import. Some colorants such as cochineal (Figure 6a) and Prussian blue (Figure 7b) were new and expensive and their import increased later in the century. Imports of orpiment (Figure 3a) declined due to toxicity, and pernambuco wood (Figure 6a) due to deforestation in America. Increased local production can explain periods of reduced imports of alum (Figure 9a), iron oxides (Figure 9b), yellow ochre (Figure 2a), earth pigments and linseed oil (Figure 5a). Increased imports of annatto, turmeric and saw-wort (Figure 8a) suggest that yellow dyes also became popular. The increased import of turpentine and resin (Figure 5b) follows the increased use of oil-based additives. The heterogeneous import graphs of the colorants reflect the differentiated use of the imported colorants, but there was an overall tendency towards increased imports following the two chromatic revolutions.

4.3. Domestic Market

Many of the imported dyes in the 18th century were previously known, and had also been registered in the customs records of 1685 and 1686. The imported colorants were part of increasing amounts of other consumer goods that were imported and distributed within the domestic market. The domestic market of colorants also consisted of a large amount of local produced pigments and dyes, which had been used for centuries. These included many different local lichen, plants, soil colors and iron oxides [32,34,35]. There was little textile industry, and imports of ready-dyed textiles were significant already in the 17th century. During the 18th century, increasing amounts of pre-dyed materials and cloths were also imported. This widespread production and use of the local colorants and imports of colored textiles is not part of the present study, but must be born in mind as part of the overall picture of the increased use of colorants in the 18th century.
Imported colorants ended up in final products, such as painted houses, decorated objects, paintings, colored textiles and clothing. At the start of the 18th century, imported colorants could mostly be purchased only in cities [19]. Like other European countries, they were initially sold in pharmacies, but for larger projects colorants were also imported by merchants or brought to the country by foreign craftsmen. Increased transport, distribution, the expansion of trade networks and increased sales of imported colorants throughout the country can serve as an example of the widespread changes that took place in Norwegian society during the 18th century [36]. As semi-finished products, the imported dyes were part of a commodity trade with supply chains that processed them into final products. These commodity chains included a network of specialized labor (sellers, transporters, marketplaces, grocers, painters, dyers, and some dye houses) and production processes (painting, spinning, weaving, and dyeing). The degree of specialization among sellers, painters, artists and dyers and the formation of guilds were, however, limited in Norway. The final products (painted houses, painted objects and dyed textiles) were used by consumers in all social levels. Social development also included increased enlightenment with information and advertising from newspapers and books, including recipe books. Thus, changes in the infrastructure in Norway during the 18th century gave an important premise to the development of the consumer society. Domestic trade, transport and sales increased following specialization, and development of a more efficient domestic transport and sales apparatus.

4.4. Increased Use

At the start of the 18th century, the value of the workers’ wardrobe in Paris was 9% of the value of that of the nobility, while by 1789, the figure had dropped to 1.4% [37]. The final consumers of the more expensive imported colorants in Norway were probably also the wealthiest. However, descriptions from that time show that an increasing portion of the lower social groups also afforded ownership of more colored textiles and some decorated objects. The costs of the colorants may be compared with the cost of a cup of coffee. Assuming a price of 0.21 daler/pound for a cup of 12 g coffee [38,39], the total value of imported textile dyes in 1762, 1786 and 1794 represented not more than 4.4, 5.8 and 15.6 cups of coffee per inhabitant, respectively (all ages included). For comparison, based on coffee imports the consumption of cups of coffee annually in the population these years were on average 15.9, 125.2 and 112, respectively. The consumption of 125 coffee cups on average per year in 1786 corresponded to an expenditure of 62.5 shillings/years, while the value of the textile dyes constituted 2.9 shillings/year. Consequently, the costs of imported dyes were considerably lower than coffee, but still coffee became relatively more popular than imported textile dyes during the 18th century. The main consumers of both coffee and colorants were the wealthier part of the population. This part of the population increased proportionally during the century and led to increased social divergence [40].

4.4.1. Increased Use of Imported Pigments

Originally, houses were not painted. Churches were usually tarred with red iron oxides, but tar treatment of other buildings was limited due to the risk of fire. Houses were painted to a greater extent as they were paneled. During the 18th century, tar was replaced by paint, log houses became more frequently paneled, brick buildings appeared in the cities and linseed oil replaced earlier glues and composition paints. Pigments for house painting accounted for a large part of the consumption of paint pigments. The import graph for lead white (Figure 2a), which was the only white paint pigment in use, reflects the increasing amount of house painting during the 18th century. However, the colors of houses also followed the styles. The temporary increased import of iron oxides (Figure 2b) and yellow ochre (Figure 3a) in the middle and the end of the 18th century indicates that houses were painted red and yellow at the end of the Norwegian Baroque and Rococo periods [41,42]. However, these pigments were also largely produced locally. The increase in the import of lead white in the late 18th century may indicate the start of Classicism. Houses became more decorated using other colors as well. Lamp black was imported as black color. Verdigris (Figure 8b) dominated as an imported green color, both for painting and dyeing. Prussian blue was a new synthesized paint pigment, while indigo was used for both dyeing textiles and for painting. The use of house painting was still limited to the wealthiest. The façade of the house could be painted with lead white, while the walls facing the backyard were unpainted or painted in cheaper colors. Painted houses in the countryside were less common than in the cities, and still most houses in Norway during the 18th century remained unpainted.
As houses acquired windows, and wood burning stoves in the middle of the room were replaced with iron stoves, interior decoration became more common. The period of the first chromatic revolution marks the beginning of increased use of imported pigments for the decoration of objects. Traditional Norwegian decorative floral painting (rosemaling) increased from the middle of the 18th century, and easel painting became more common at the end of the century. An anonymous person published a painting book in 1794 with an overview of pigments used for easel painting and decoration in Denmark-Norway. Almost all the pigments mentioned can be found in the digitized product lists from the Norwegian customs records [43]. The imported pigments include red pigments (earth pigments and various types of iron oxide presumably of finer grades, bolus, vermilion, red chalk and red lake pigments), blue pigments (indigo, Prussian blue, litmus, mountain blue, smalt blue), yellow pigments (dyer’s buckthorn, orpiment, turmeric, yellow ochre) and lead white, including the finer and more expensive form skiferhvit. In 1794, 59,059 pounds of lead white were imported, which was equivalent to 19,686 L of white paint (3 pounds of lead white per liter paint) and about 0.02 L of lead white paint per inhabitant. Compared to the figures of approximately 1 L white paint per inhabitant sold in Norway today, 50 times more white paint is sold in Norway today compared with 1794. In short, few houses were painted, and only by the wealthy.

4.4.2. Increased Use of Imported Dyes

The 17th century was somberly dominated by black, gray and brown clothing, and colored cloths were used mainly by the wealthy. The 18th century became increasingly colorful, with colored clothing used by all social levels. The new color fashion was evident with the increasing use of red and blue colors [44]. This reflects the increased imports of brazilwood, madder, cochineal, and indigo, following the two chromatic revolutions. The use of the textile dyes was largely determined by color choice (fashion), prices, the dye’s properties and availability compared to locally produced plant dyes. Cochineal and madder were the more expensive and light-resistant (grand teint) red dyes. The cheaper brazilwood was imported in the largest quantities and used by a larger part of the population. The imported indigo, yellow, green, brown, and black dyes contributed to a varied color range. Increased wool and cotton imports (Figure 13b) harmonize with increased use of imported dyes.
Studies of epitaphs and probate records show that clothing became more colorful [45]. Before the 18th century, it is stated that around 60% of the garments were black, while the proportion had dropped to 40% in the 1720s [46]. From 1730, there was a tendency towards increased use of lighter colors as well as checks and stripes in clothing [47]. Brighter reds, blues, pastels and whites were popular [46,48]. From around 1760, probate surveys estimate that it was mostly elderly and poor women who wore black [47]. The use of the imported dyes is described in detail in two Danish dye books from 1768 and in a number of handwritten “black books” (magic books), which also dealt with recipes for dyeing [49,50,51]. These dye books show that local plant dyes were still in use. Compared to the topographical descriptions from 1743, where imported dyes are only barely mentioned, the two Danish-Norwegian dye books 25 years later show many recipes with imported dyes. The imported dyes largely reflect the use of the dyes abroad, but some foreign dyes were rare in Norway, such as kermes, Polish cochineal, logwood, woad, weld, yellow wood (old fustic) and turnsole. Other dyes were imported to a small extent, such as Reseda luteola, weld (1732) and safflower (1756).
Table 2 shows total values of imported indigo, cochineal, madder, brazilwood, indigo, logwood and annatto, based on the prices and quantities of imported dyes. When it comes to the costs of textile dyeing, however, one must also take into account what Engel has called the color yield per unit, which determines the material cost of a dye [52]. A calculation based on Engel’s values for color yield per unit for six dyes, shows that indigo, brazilwood, madder, cochineal, logwood and annatto accounted for 67%, 17%, 8%, 3%, 3% and 2% of the colored textiles, respectively. There seems to be a difference between Norway, where indigo was almost exclusively used, and England, where logwood was used for a range of colors. In other words, indigo with a high color yield per unit was responsible for most of the textiles dyed with imported colorants. Moreover, despite lower import quantities of cochineal and madder, these dyes with high color yields per unit contributed significantly compared to larger quantities of imported brazilwood with lower color yield per unit. In Table 2 (column 9) the material costs in daler/pound are calculated converted to £/ton based on the assumption that 1£=4 dalers [53], and compared with corresponding material costs £/ton reported for England for the period 1760–1789 (Table 2, column 10) [52]. The material costs according to the Norwegian customs records were roughly the same as in England.

4.5. Increased Demand

The use of indigo and cochineal in Norway was less than 0.08% of total imports of these colors to Europe [54,55]. Therefore, changes in the European availability of colorants can hardly explain any changes of colorant imports into Norway. The first chromatic revolution was most likely the result of increased supply of imported colorants following increased Norwegian exports and trade with Europe. The merchant fleet returned with many different consumer goods. Pigments and dyes were particularly suitable as return goods, as they were valuable in relation to their weight and very popular in the population. The capacity to transport colorants was good. Assuming a cargo capacity of 80 tons per ship, an estimated total import of 6800 tons colorants during the 18th century would require no more than 85 ships. Colorants were initially available in the cities and custom ports, and could only be afforded by wealthy people. However, their use was noted by the rest of the population. With increased supply following increased imports, increased desire for the goods sparked increased demand.

4.5.1. Preferential Use

Local produced colorants from plants and soil were probably commercially available to a very limited extent. Moreover, imported colorants were ready to use and replaced the laborious and time-consuming preparation of local colorants. The imported colorants met a variety of tastes, preferences and expectations for the users. Depending on the price, they had better color properties and qualities with regard to color yield per unit, light stability, washing fastness and color intensity. Widespread use of indigo back to the 17th century and increasing imports of the more expensive colorants such as cochineal, indigo, Prussian blue and lead white during the 18th century, show that their color preferences were highly valued by those consumers who had the financial means to buy them. The imported colorants with different properties and qualities and with versatile uses represented a significant change in the material culture of colorants during the 18th century. As luxury and consumer goods, the imported pigments and dyes represented many forms of value. Their economic value represented a wide range of different prices. They had their material value in terms of their preferential use. They had aesthetic and psychological values in their ability to please, to decorate and to promote styles, trends and fashion [31,56]. The visual dependence of colors should not be underestimated. Although not as addictive as tobacco and coffee, colors contribute to beauty and well-being that can stimulate body endorphins. The cultural value of colorants varied in different social groups. Their use had political, economic and social implications that affected norms and values in society [2]. The colors, like many other consumer products, stimulated a heterogeneous society, and contributed to a mental shift towards a consumer society. The imported colorants also maintained and developed further socio-cultural class distinctions and traditions, which influenced their preferential use in different parts of society.

4.5.2. Fashionability and Consumer Culture

The start of the consumer society was characterized both by changes in individual desires, and consumer behavior determined by taste, fashion and style and changes in consumer culture. Consumption was not only driven by a desire to show off, but also represented an expression of identity and became part of the social codes. Inspired by Parthasarathi and Riello, I will use the broad term, fashionability, to describe the many factors that may have improved personal appearance, satisfaction, comfort and ownership through material goods in the 18th century [57]. Fashionability covered the characteristics of consumer products, consumers, consumption itself, and the society in which the products were used [57]. The concept of fashionability included many different terms and qualities, such as trends, aesthetics, beauty, performance, pleasure, inspiration, desire, preferences, expectations, education, excitement, purchase, novelty, ownership and use. Fashionability in the 18th century thus became a broad term that influenced social, economic and cultural standards and norms in society [58]. Colorants constitute a complex group of products, where fashionability not only included color and color combinations, but also the use of different colorants, textiles, patterns, cuts and styles. The preferences for imported colorants and their fashionability became a self-reinforcing part of positive feedback loops. The use of colorants increased fashionability and consumer culture, which in turn increased their consumption. The business elite were trendsetters in Norway. They introduced the population to the new European fashion and style, and conveyed new standards for fashionability. Various theories have been discussed to explain social influences, including emulation, imitation, conspicuous consumption, inconspicuous consumption and the trickledown theory (Appendix A). These factors may have been part of the concept of fashionability, and may also have played a role in Norway.

4.5.3. Economy

There has been an extensive historical and economic debate to explain the economic ability of the population to acquire and use an increasing amount of consumer products. Adam Smith (1723–1790) considered luxury products an expression of personal vanity, but they contributed to providing work. Simplified, increased consumption requires increased financial means, which can be linked to a financial reserve, increased income and reprioritization, reduced expenses or increased debt. The present study cannot clarify how the population in Norway could afford to acquire increasing amounts of consumer goods, including the increased import of colorants. The population in Norway was generally not that poor during the 18th century, since natural resources provided export trade with increased income for those who participated in the production chains. The standard of living for the lower social groups was above the subsistence minimum [59]. Parts of the population had increased income potential through seasonal work from several sources (pluri-activity) [36]. The motivation for increased income may have had elements of investment and/or consumption. This may correspond to de Vries’ theory of the industrious revolution, where the population of the Netherlands increased their purchasing power for consumer goods through increased paid work [60,61,62]. Increased income potential for farmers through pluri-activity covered necessary expenses, improved housing standards and ensured future investments. The surplus was also used to achieve increased purchasing power for a better way of life and to acquire luxury goods and status symbols [63]. The population’s desire for consumer goods may have been a driving force for increased income.

4.5.4. Enlightenment

More than 90% of the population in Norway lived in the countryside, and shopping played only a minor part in the spread of fashion and knowledge compared to larger European countries. However, the population was exposed to the increased amounts of imported colorants through increased domestic trade, and the increased use of the preferred imported colorants had its own inherent effects on fashionability. In addition to the previously mentioned black books and dye books, newspapers became important sources for the dissemination of knowledge that had an impact on increased demand for pigments and dyes. The effect of enlightenment on increased use of colorants became an important part of the positive feedback loops, where increased demand stimulated increased trade.

4.6. Colorant Imports and the Start of the Consumer Society

During many decades of the18th century, colorant imports were subject to mercantilist restrictions and customs regulations. At the end of the 18th century, most of these restrictions, as well as sumptuary laws, were removed; society developed in a direction of a more liberal ideology with a greater degree of free trade. As shown in Figure 10, stable prices despite increased colorant imports indicate that prices were not driven by market economic principles through the laws of supply and demand. Instead, price-independent market principles, such as an increase in supply and/or demand, may have explained the increased colorant imports.
Jack Homer has looked at the industrial revolution from a feedback perspective in a system dynamic model [64]. Similar positive feedback causal loops may be postulated to explain the growing consumer society following increased imports of consumer goods. Increased exports stimulated increased imports and thereby an increased supply of colorants. When these consumer goods gradually became more available, there was an additionally stimulated increase in demand. These positive feedback loops form the basis of a model that may contribute to understanding the development of the consumer society, illustrated by the increase colorant imports (Figure 23). The population showed a linear doubling during the 18th century. Consequently, the multifold increase in colorant imports with the two chromatic revolutions cannot be explained by an increase in population, only. I will elaborate on some of the factors that may have contributed to increasing the demand for the imported colorants during the second part of the 18th century. The factors are summarized in Figure 23. This figure presents a proposed explanatory model to illustrated increased colorant imports to Norway during the 18th century, based on increased supply and demand for new colorants. Increased imports of colorants during the first and second chromatic revolutions led to an increased supply and use of imported colorants. As previously discussed, increased imports during the first chromatic revolution in the middle of the 18th century may have been the result of increased export trade. In periods of prosperity, this would induce a positive feedback supply loop, which also was stimulated by the changes in society towards liberalism. At the same time, as there was an increased supply of imported colorants, significant changes occurred in the domestic market with increased transportations and sales. In the previous Sections, factors have been discussed that could explain increased demand for imported colorants, which thereby initiated and stimulated positive feedback demand loops with further increased colorant imports. The increased production of consumer goods may also represent a positive feedback loop for increased demand. With respect to the increased use of colorants in Norway, this may be exemplified by increased production of alum, chalk, cobalt, lichen and tar. Based on colorant imports as a motif or exemplary model, Figure 23 may also be applicable as a more general model to summarize factors that facilitated the increased use of other consumer goods contributing to the development of the early consumer society. The color revolution, illustrated by the two chromatic revolutions, was part of the general consumer revolution, which in Norway started approximately in the middle of the 18th century.
Unaltered imports during the first half of the 18th century indicate that the supply of foreign consumer goods was largely adapted to the demand. From a traditional society stage 1, the first half of the 18th century may represent the end of Rostow’s stage 2 in the development of the modern consumer society [65]. Preconditions for economic growth were laid in this phase, prior to the take-off of stage 3 of increased colorant imports (the Norwegian chromatic revolutions) that started in the middle of the 18th century. In the mid-1700s, Norwegian society was “sensitized” to an increased amount of the consumer goods. A change in consumer culture and economic opportunities made it acceptable and possible for a consumer society to develop during the second half of the 18th century.
The start of the consumer society includes increased availability of new consumer goods. The colonial powers had a large intercontinental trade network that included their own colonies. Denmark-Norway had a few colonies (Danish West Indies and Tranquebar), from which the Danes imported colonial goods directly to Copenhagen. Norway had no significant part in this trade. Denmark also imported calico fabrics from India, and Denmark had its own production of colored and printed cotton textiles, which were re-exported. This separate textile “revolution” coincided in time with the Norwegian chromatic revolutions and contributed to the Danish consumer revolution [66]. Sweden had no colonies. The Swedes exported iron and timber, and used silver as a trade commodity to import Chinese silk and tea, which were also re-exported to Europe [29]. The Norwegian export products were the driving forces for the Norwegian trade within Europe. Norway had about half a million inhabitants, approximately the same number of inhabitants living in London. The rise of the consumer society in Norway, from the middle of the 18th century, can largely be attributed to a long period of peace. Prosperity developed to a certain extent, there was an increased domestic trade, which resulted in a flourishing use of consumer goods, including imported colorants. The start of a consumer society from the middle of the 18th century was not a smooth one-way process. It included a number of factors and mechanisms that contributed to a kind of exponential development driven by positive feedback loops.
Sara Pennell has advocated that the explanation for the development of a consumer society must be sought through interdisciplinary approaches, with emphasis on consumer mentality, motivation for increased consumption, qualitative features of possession, and the social and cultural capital that consumer goods can entail [67]. The present model for the development of the consumer society, in Figure 23, is highly simplified and by no means exhaustive, but it takes into account heterogeneous mechanisms and some of the qualitative factors that Pennell refers to.

5. Conclusions

In this study, the increased imports of a variety of colorants have been described, based on registrations from Norwegian customs records during the18th century. These pigments and dyes were used in increasing quantities throughout the country for house painting, decoration and textile dyeing. The imported lead white and tropical indigo comprised the main white and blue pigments used for painting and dyeing, respectively. Imports of red iron oxides and yellow earth pigments were supplements to the similar locally produced pigments. The imported colorants represented examples of both luxury and consumer goods, which together with increased imports and use of other consumer goods reflected a change in consumer culture. It marked the beginning of the consumer society in Norway from the middle of the 18th century. The increased imports were most probably a consequence of the increased Norwegian export trade. A significant further increase at the end of the 18th century seemingly expresses a substantial increased demand for consumer goods. A model for the development of the early start of the consumer society is presented, based on the increased imports of colorants, which takes into account many factors which may have contributed to the increased flow of consumer goods during the second part of the 18th century.

Funding

This research received no external funding.

Data Availability Statement

Data available on the internet [12].

Acknowledgments

The author wants to thank Kristine Bruland, Jon Brænne, Finn-Einar Eliassen, Tine Frøysaker, Ragnhild Hutchison, Klaus Nathaus and Hilde Sandvik for their pertinent advices and valuable support during this study.

Conflicts of Interest

The author declares no conflict of interest.

Appendix A

Chronological overview of the histiography of the development of consumer society in Western countries.
YearAuthorDescriptions and Theories
1714Bernard Mandeville [56]Humans are self-absorbed, pleasure-seeking and vain, who sought luxury to fulfill these needs.
1776Adam Smith [68]Consumption was the sole purpose of all production.
1899Thorstein Veblen [69]Conspicuous consumption and pecuniary emulation.
1904Georg Simmel [70]Trickledown effect, mutual influence between social layers.
1932ElizabethGilboy [71]Supply and demand were equal driving forces.
1972Franklin Mendels [72]Proto-industrialization.
1977Joel Mokyr [73]Industrialization was mostly supply-driven. Increased demand requires increased income, falling prices or a change in preferences.
1982Neil McKendrick [1]Consumer revolution. Importance of emulation.
1988Lorna Weatherill [5]Consumption was promoted as part of a separate middle-class culture, semi-luxury goods.
1990Carol Shammas [74]Changes in households with increased demand.
1991Maxine Berg [75]Globalization and increased consumption of luxury products, cheaper products.
1991Beverly Lemire [76]Fashion was a driving force for the demand and distribution of cotton clothing, spread vertically and horizontally.
1993Cissy Fairchilds [77]Nation of shoppers, Dress fashion, populuxe goods.
1994John Brewer [78]The importance of demand and consumption.
1994Jan de Vries [61]Industrious revolution.
2006Jonathan White [79]Access to new goods in the 18th century led to increased consumption.
2009Joel Mokyr [80]Importance of enlightenment.
2011Rene Girard [81]Mimetic desire.
2016Joel Mokyr [82]Importance of consumer culture.

Appendix B

Summary of the colorant items, sorted by name, product type and color, first recorded import year, average price and import quantities.
NameProductFirst Import (year)Price (daler/
pound)
Quantity Imported during the 18th
Century (pound)
Quantity Imported 1685 and/or 1686 (pound)
AlumMordant for dyeing16850.09140,4382,410
AmberAdditive (resin for painting)1740
Annatto (orleans and uldrian)Yellow dye17240.384,637
AsphaltBrown pigment1756
Berberis rootsYellow dye1835
BitgelrødtRed pigment1733
BoleRed pigment1732
Bone blackBlack pigment1835
Bone brownBrown pigment1749
BrazilwoodRed dye and pigment16860.07131,808247
Brazilwood, raspedRed dye and pigment17240.0368,664
Brown redRed pigment16850.02109,22380
Brunswick greenGreen pigment1835
Burnt SiennaBrown pigment1756
Caput mortuumReddish purple pigment17490.14,993
Carbon blackBlack pigment17510.633,583
Chalk, red chalkRed pigment16860.192,06017
Chrome yellowYellow pigment1835
Ciginie redRed pigment1794
CochinealRed dye and pigment17244.674,242
Cologne earthBrown pigment1756
ColophonyAdditive (varnish for painting)1731
Copper(II)sulphate (blåstein)Additive (siccative for painting) and auxillary agent for dyeing17620.18609
Copper(II)sulphate (kobberrøg)Additive (siccative for painting) and auxillary agent for dyeing17560.22331
Cream of TartarAuxiliary agent for dyeing16850.137,9521,063
Danish redRed pigment1754 Domestic
Dyer’s buckthornYellow pigment and dye17240.412,894
Earth pigmentRed pigment17300.053,904
English earthRed pigment17320.0511,813
Florentine lakeRed pigment1742212
GallnutBlack dye and mordant16860.275,32269
GlueBinder for painting16860.0711,906736
GraphiteBlack pigment17250.12,198
GumAdditive (dyeing and painting)16850.44,14238
Gum arabicAdditive (dyeing and painting)1770
Gum copalAdditive (dyeing and painting)1835
Gum elemhAdditive (dyeing and painting)1835
Gum from BurseraceaeAdditive (dyeing and painting)1724
Gum tragacanthAdditive (dyeing and painting)1749
Gum, ordinaryAdditive (dyeing and painting)17700.272,063
Horn glueBinder for painting16850.110,815490
IndigoBlue dye and pigment16861.668,76212
Ink powderBlack pigment17240.261,311
IsinglassBinder for painting17261.43432
King’s yellow (kongegult)Yellow pigment17520.56292
Lake pigment (kulelakk)Red pigment17250.59645
Lake pigment (kurlakk)Red pigment17240.44115
LakkAdditive (varnish for painting)16851.024,03053
Lead whiteWhite pigment16850.07337,66180
Lead white (skiferhvitt)White pigment17330.1977
LichenDye, different colors1786
Lichen, blackDye, different colors1835
Lichen, color lichenDye, different colors1835
Lichen, Island lichenDye, different colors1786
Lichen, mountain lichenDye, different colors1794
Lichen, stone lichenDye, different colors1835
Lichen, whiteDye, different colors1794
Linseed oilBinder for painting16850.16217,4166,606
Litharge of silverAdditive (siccative for painting)16860.129,64524
LitmusBlue dye and pigment17490.17585
Logwood (blauholt)Dye, different colors17490.062,111
Logwood (brissel)Dye, different colors16850.047,194610
Logwood (brown brissel)Dye, different colors17330.081,105
Logwood (campecheholt)Dye, different colors1732 3,989
Logwood, redRed dye and pigment1733
MadderRed dye and pigment16860.1659,92030
MasticAdditive (varnish for painting)1725 43
Mineral blueBlue pigment1835
Mineral greenGreen pigment1749
Mineral yellowYellow pigment1835
Minium, red leadRed pigment16850.0760,485424
Montain blueBlue pigment1762
Naples yellowYellow pigment1749
Ochre, brownBrown pigment1733
Ochre, yellowYellow pigment16850.0548,543170
Old fustic or dyer’s mulberryYellow dye1774
Orpiment (orpiment and rusgel)Yellow pigment16860.182,19751
Paris greenGreen pigment1835
Parrot greenGreen pigment1835
Peach-stone blackBlack pigment1835
Pernambuco woodRed dye, Brazilwood17240.1526,896
PotashMordant for dyeing17620.18766,431
Prussian blueBlue pigment17331.511,537
QuercitronYellow dye1835
Reseda luteola, weld, (vav)Yellow dye1732
ResinAdditive (resin for painting)16860.0535,602852
Rye oilBinder for painting1754
SafflowerRed/Yellow dye1756
SaffronYellow pigment16858.6189512
SandalwoodRed dye and pigment17320.086,989
SandaracAdditive (dyeing and painting)1742
SappanwoodRed dye1835
Saw-wortYellow dye17260.045,894
ShellacAdditive (varnish for painting, polishing agent)17490.261,189
Sky blueBlue pigment1685
Smalt (blausel )Blue pigment16850.1519,522130
Smalt (oljeblått)Blue pigment1749
Smalt blueBlue pigment1762
Spike oilAdditive (diluent for painting)1727
SumacBrown dye17310.1378,379
TarBlack pigment1685
TurmericYellow dye and pigment17240.251,890
TurpentineAdditive (diluent for painting)16850.1416,589100
Turpentine, oilAdditive (diluent for painting)17320.1516,913
Turpentine, venetianAdditive (resin for painting)1762
UltramarineBlue pigment1835
UmberBrown pigment16860.131,03836
VarnishAdditive (varnish for painting)1733
VerdigrisGreen dye and pigment16860.65,74112
VermilionRed pigment16861.221,41022
VitriolAuxiliary agent for dyeing16850.03101,615170
Vitriol, anglicumAuxiliary agent for dyeing1751 7,571
Vitriol, blueAuxiliary agent for dyeing and additive (siccative for painting)1835
Vitriol, greenAuxiliary agent for dyeing1835
Vitriol, IronI(II)sulfateAuxiliary agent for dyeing17490.1339,629
Vitriol, whiteAuxiliary agent for dyeing1835
WoadBlue dye1724
Yellow pigment (blekgult)Yellow pigment1762

References

  1. McKendrick, N.; Brewer, J.; Plumb, J.H. The Birth of a Consumer Society: The Commercialization of Eighteenth-Century England; Indiana University Press: Bloomington, IN, USA, 1982. [Google Scholar]
  2. Sassatelli, R. Consumer Culture: History, Theory and Politics; SAGE Publications Ltd.: London, UK, 2007. [Google Scholar]
  3. Berg, M. The Age of Manufactures 1700–1820. Industry, Innovation and Work in Britain; Routledge: London, UK, 2005. [Google Scholar]
  4. Roach, B.; Goodwin, N.; Nelson, J. Consumption and the Consumer Society; Tufts University, Somerville Campus: Medford, MA, USA, 2019. [Google Scholar]
  5. Weatherill, L. Consumer Behavior and Material Culture in Britain, 1660–1760; Routledge: London, UK, 1988. [Google Scholar]
  6. Walton, P. Dyes of the Viking Age: A summary of recent work. Dyes Hist. Archaeol. 1988, 7, 14–20. [Google Scholar]
  7. Nordeide, S.W. Den gylne middelalder. Spor–Fortidsnytt Fra Midt-Nor. 1991, 1, 19–21. [Google Scholar]
  8. Plahter, U. Painted Altar Frontals of Norway 1250–1350, Illustations and Drawings; Archetype Publications: London, UK, 2004; Volume 3. [Google Scholar]
  9. Knudtzon, M.A. Økt Import og Bruk av Indigo på 1700-Tallet, Fire Indigoperioder Satt i en Forbrukerhistorisk Kontekst. Master’s Thesis, Universitetet i Oslo, Oslo, Norway, 2020. [Google Scholar]
  10. Knudtzon, M.A. Økt Fargeimport og Fremveksten av Forbrukersamfunnet i Norge. To Kromatiske “Revolusjoner’’ og 1700-Tallets Forbrukerhamskifte. Ph.D. Thesis, University of Oslo, Oslo, Norway, 2023. to be submitted. [Google Scholar]
  11. Forside: Historiske toll- og Skipsanløpslister. Available online: https://lokalhistoriewiki.no/wiki/Forside:Historiske_toll-_og_skipsanl%C3%B8pslister (accessed on 18 September 2022).
  12. Transkriberte Historisk Norske Tollister, Alle Varer. Available online: https://tidvis.no/historiske_databaser/varelister/ (accessed on 18 September 2022).
  13. Teige, O. Det Store Tollsviket og Inkvisisjonskommisjonen i Christiania 1705–09; Hovedoppgave; Universitetet i Oslo: Oslo, Norway, 2001. [Google Scholar]
  14. Jørgensen, H.J. Det Norske Tollvesens Historie. Fra Middelalderen til 1814; Tolldirektoratet: Oslo, Norway, 1969.
  15. Holmsen, A. Den økonomiske bakgrunnen for Kristiania-patrisiatet. In Studier i Norsk Historie 1537-ca. 1800; Imsen, S., Supphellen, S., Kjelland, A., Eds.; Universitetsforlaget: Oslo, Norway, 1983; pp. 334–335. [Google Scholar]
  16. Røgeberg, K.M. Norge i 1743,Innberetninger Som Svar på 43 Spørsmål fra Danske Kanselli, Akershus Stift og Amt, Østfold og Akershus; Bind 1; Solum Forlag: Oslo, Norway, 2003. [Google Scholar]
  17. Røgeberg, K.M. Norge i 1743,Innberetninger Som Svar på 43 Spørsmål fra Danske Kanselli, Akershus Stift, Hedemark, Oppland; Bind 2; Solum Forlag: Oslo, Norway, 2004. [Google Scholar]
  18. Røgeberg, K.M. Norge i 1743,Innberetninger Som Svar på 43 spørsmål fra Danske Kanselli, Akershus Stiftamt, Buskerud, Vestfold, Telemark; Bind 3; Solum Forlag: Oslo, Norway, 2005. [Google Scholar]
  19. Løyland, M. Norge i 1743, Innberetninger Som Svar på 43 Spørsmål fra Danske Kanselli, Aust-Agder, Vest-Agder, Rogaland, Hordaland, Sogn og Fjordane; Bind 4; Solum Forlag: Oslo, Norway, 2006. [Google Scholar]
  20. Mordt, G. Norge i 1743,Innberetninger Som Svar på 43 Spørsmål fra Danske Kanselli, Møre og Romsdal, Sør-Trøndelag, Nord-Trøndelag, Nordland, Troms; Bind 5; Solum Forlag: Oslo, Norway, 2008. [Google Scholar]
  21. Store Norske Leksikon. Fat. Available online: https://snl.no/fat_-_eldre_norsk_m%C3%A5l (accessed on 21 June 2021).
  22. Olstad, T.M. Bryggens farger. Fortidsminneforen. Årbok 2006, 160, 67–73. [Google Scholar]
  23. Sellæg, J. Drammen By i Utvikling Gjennom 400 år; Brakar AS: Drammen, Norway, 2010. [Google Scholar]
  24. Johansen, T.A. Trangen til Læsning stiger, selv oppe i ultima Thule. Aviser, ekspansjon og teknologisk endring ca 1763–1880. Pressehistoriske Skr. 2006, 7, 33. [Google Scholar]
  25. Smesrud, I. Sluttrapport Plantefarging av lin og Hamp. Inspirert av Susanna Johanna Pihl, 22–23. Available online: https://handverksinstituttet.no/prosjekter/rapport-om-plantefarging-av-lin-og-hamp (accessed on 11 March 2022).
  26. Berg, M. Consumption in eighteenth- and early nineteenth-century Britain. In The Cambridge Economic History of Modern Britain. Volume 1: Industrialisation, 1700–1860; Floud, R., Johnson, P., Eds.; Cambridge University Press: Cambridge, UK, 2004; pp. 357–387. [Google Scholar]
  27. Hutchison, R. Det norske kobberet i Europa og verden på 1700-tallet. In Skandinavisk Kobber: Lokale Forhold og Globale Sammenhenger i Det Lange 1700-Tallet; Ranestad, K., Bruland, K., Eds.; Cappelen Damm Akademisk: Oslo, Norway, 2020; pp. 111–127. [Google Scholar]
  28. Grist, K. Dangerous Beauty: Hazardous Chemicals and Poisons in Historic Cosmetics. Available online: https://www.sciencemuseumgroup.org.uk/blog/dangerous-beauty-hazardous-chemicals-and-poisons-in-historic-cosmetics/ (accessed on 12 November 2022).
  29. Müller, L. Kolonialprodukter i Sveriges handel och konsumtionskultur, 1700–1800. Hist. Tidsskr. 2004, 124, 225–248. [Google Scholar]
  30. Odile-Bernez, M. Comfort, the Acceptable Face of Luxury: An Eighteenth-Century Cultural Etymology. J. Early Mod. Cult. Stud. 2014, 14, 3–21. [Google Scholar] [CrossRef]
  31. Berg, M. Luxury and Pleasure in the Eighteenth-Century Britain; Oxford University Press: Oxford, UK, 2005. [Google Scholar]
  32. Brænne, J. Dekorasjonsmaling. Marmorering, Ådring, Lasering, Patinering, Sjablondekor, Strukturmaling; Teknologisk Forlag: Oslo, Norway, 1998. [Google Scholar]
  33. Ellingsgard, N. Norsk Rosemåling. Dekorativ Måling i Folkekunsten; Det Norske Samlaget: Oslo, Norway, 1999. [Google Scholar]
  34. Engelstad, H. Plantefarvingens historie i Norge. In Norsk Billedvev 1550–1800; Kielland, T.B., Ed.; Gyldendals Forlag: Oslo, Norway, 1953; Volume I. [Google Scholar]
  35. Sverdrup, S. Using Plants for Dyeing in Norway. Handb. Dyes Plants Dye. 1964, 20, 66–69. [Google Scholar]
  36. Bull, I. Lokalsamfunnet i Verden, Norske Lokalsamfunns Plass i den Første Globaliseringen på 1600- til 1800-Tallet; Novus forlag: Oslo, Norway, 2020. [Google Scholar]
  37. Margairaz, D. City and Country: Home, Possessions, and Diet, Western Europe 1600–1800. In The History of Consumption; Trentmann, F., Ed.; University Press: Oxford, UK, 2012; pp. 194–210. [Google Scholar]
  38. Hutchison, R. Toll-Lister og 1700-Tallet: Skal det Være en Kopp Kaffe? Available online: https://blogg.forskning.no/ragnhild-hutchisons-blogg/toll-lister-og-1700-tallet-skal-det-vaere-en-kopp-kaffe/1100548 (accessed on 6 September 2021).
  39. Hagset, M. Kaffeimport til Norge, 1733–1794. Bachelor’s Thesis, Universitetet i Oslo, Oslo, Norway, 2016. [Google Scholar]
  40. Hutchison, R. In the Doorway to Development. An Enquiry into Market Oriented Structural Changes in Norway ca. 1750–1830. Ph.D. Thesis, Brill, Leiden, The Netherlands, 2012. [Google Scholar]
  41. Drange, T.; Aanensen, H.O.; Brænne, J. Gamle Trehus; Universitetsforlaget: Oslo, Norway, 1994. [Google Scholar]
  42. Valderaune, M.O. Praktisk Fargesetting av Historiske Interiør en Fortelling, en Introduksjon, et Verktøy. Diploma Thesis, Universitet i Trondheim, Trondheim, Norway, 2015. [Google Scholar]
  43. Anonymous. Nye- og Fuldstændig Maler- og Forgylder-Bog; B.M. Liunges Forlag: København, Denmark, 1794. [Google Scholar]
  44. Kvaal, I.M. Klededrakt på Romeriksbygdene ca 1600–1850; Akershus Trykkeri: Lillestrøm, Norway, 1942. [Google Scholar]
  45. Dahl, C.L. Klædt i Rigets Borgerdragt. Stand, Status og National Identitet Udtrykt i Borgerskabets Dragt i Reformationstidens Danmark-Norge og Sverige; Norsk Folkemuseum: Oslo, Norway, 2015. [Google Scholar]
  46. Røgeberg, K.M. Av saliges gangklær, Klær og klesskikk i og rundt Kristiania omkring år 1700. Arkivmagasinet 2008, 3, 15–17. [Google Scholar]
  47. Røgeberg, K.M. Av Saliges Gangklær, en Skifteanalyse, Aker Fogderi og Christiania 1656–1780. Ph.D. Thesis, Universitetet i Oslo, Oslo, Norway, 1989. [Google Scholar]
  48. Hutchison, R. Fargeeksplosjonen på 1700-Tallet. Norgeshistorie. Available online: https://www.norgeshistorie.no/enevelde/1243-fargeeksplosjonen-pa-1700-tallet.html (accessed on 18 September 2022).
  49. En Dansk Farve-Bog til Almindelig Nytte eller Kort Underretning om at farve Ulden, Silke og Linned, tilligemed Opskrift paa Nogle Slags Blæk, saa og om at aftage alle Slags Plætter paa Tøy; I.F. Heineck Mumme og Faber: København, Denmark, 1768.
  50. Fuldstændig Fruentimmer-Farve-Bog, Eller Tydelig Underviisning om Farve-Kunsten, Hvorledes Man Kan Farve Alle Slags Uldent, Linnet, Silke og Bomulds-Tøy og Garn etc., Samlet og Uddraget af Hellots, Lindners og Andres Trykte Underretninger og Skrevne Opskrifter, Saavel til Tieneste for Farvere Som og Især for Fruentimmer paa Landet, Tilligemed en Tilføyet Plette- og Kunst-bog, Samt om Læder- og Skind-Farvingen; A. H. Godiche: København, Denmark, 1768.
  51. Tangen, H.A.P. En Svartebok; 1779. A-100027-Dokumentsamlingen-Statsarkivet i Bergen. https://www.arkivportalen.no/entity/no-a1450-07000000099760, Not available online.
  52. Engel, A. Colouring markets: The industrial transformation of the dyestuff business revisited. Bus. Hist. 2012, 54, 10–29. [Google Scholar] [CrossRef]
  53. Leksikon: Veksel. Available online: https://lokalhistoriewiki.no/wiki/Leksikon:Veksel (accessed on 18 September 2022).
  54. Nash, R.C. South Carolina indigo, European textiles, and the British Atlantic economy in the eighteenth century. Econ. Hist. Rev. New Ser. 2010, 63, 362–392. [Google Scholar] [CrossRef]
  55. Kirby, J. Painting in a wider world: Developments in the trade in painters’ material. In Trading Paintings and Painters’ Materials 1550–1800; Christensen, A.H., Jager, A., Eds.; CATS Proceedings, IV; Archetype Publications Ltd.: Copenhagen, Denmark, 2018. [Google Scholar]
  56. Mandeville, B. Fable of the Bees; Clarendon Press: London, UK, 1724. [Google Scholar]
  57. Parthasarathi, P.; Riello, G. From India to the World: Cotton and fashionability. In The History of Consumption, Trentmann, F. Ed.; University Press: Oxford, UK, 2012; pp. 144–170. [Google Scholar]
  58. Pedersen, M.V. At the Nordic Fringe of Global Consumption: A Copenhagen bourgeois’ home and the use of new goods in the mid-18th century. In Fashionable Encounters, Perspectives and Trends in Textile and Dress in the Early Modern Nordic World; Mathiassen, T.E., Nosch, M.L., Ringgaard, M., Toftegaard, K., Pedersen, M.V., Eds.; Oxbow Books: Oxford, UK, 2014; pp. 141–157. [Google Scholar]
  59. Tveite, S. Hovudliner 1500–1850. In Norsk Økonomisk Historie, Band 1, 1500–1850; Dyrvik, S., Fossen, A.B., Grønlie, T., Hovland, E., Nordvik, H., Tveite, S., Eds.; Universitetsforlaget: Bergen, Norway, 1990; pp. 237–252. [Google Scholar]
  60. Hutchison, R. An industrious revolution in Norway? A Norwegian road to the modern market economy? Scand. J. Hist. 2014, 39, 1–23. [Google Scholar] [CrossRef]
  61. De Vries, J. The Industrious Revolution, Consumer Behavior and the Houshold Economy, 1650 to the Present; Cambridge University Press: Cambridge, UK, 2008. [Google Scholar]
  62. De Vries, J. The industrial revolution and the industrious revolution. J. Econ. Hist. 1994, 52, 249–270. [Google Scholar] [CrossRef] [Green Version]
  63. Tranberg, A. Marketsorienterte bondenæringer i Norge på 1700-tallet. Bonde og Market i 1700-tallet. Bol Og By. Landbohistorisk Tidsskr. 1997, 13, 106–127. [Google Scholar]
  64. Homer, J. Theories of the Industrial Revolution: A Feedback Perspective. DYNAMICA 1982, 8, 30–35. [Google Scholar]
  65. Rostow, W.W. The Stages of Economic Growth. Econ. Hist. Rev. New Ser. 1959, 12, 1–16. [Google Scholar] [CrossRef]
  66. Martens, V.M. Indian Textiles in the Seventeenth- and Eighteenth Century Denmark. Trade and the Rise of Global ConsumerCulture. Ph.D Thesis, European University Institute, Department of History and Civilization, Florence, Italy, 2017. [Google Scholar]
  67. Pennell, S. Consumption and consumerism in early modern England. Hist. J. 1999, 42, 549–564. [Google Scholar] [CrossRef]
  68. Smith, A. An Inquiry into the Nature and Causes of the The Wealth of Nations; MetaLibri: Amsterdam, The Netherlands, 2007. [Google Scholar]
  69. Veblen, T. The Theory of the Leisure Class. Available online: https://www.gutenberg.org/ebooks/833 (accessed on 18 September 2022).
  70. Simmel, G. Fashion. Am. J. Sociol. 1957, 6, 541–558. [Google Scholar] [CrossRef]
  71. Gilboy, E.W. Demand as a Factor in the Industrial Revolution. In Facts and Factors in Economic History; Cole, A.H., Ed.; Harvard University Press: Cambridge, MA, USA; London, UK, 1932; pp. 620–639. [Google Scholar]
  72. Mendels, F.F. Proto-Industrialization: The First Phase of the Industrialization Process. J. Econ. Hist. 1972, 32, 241–261. [Google Scholar] [CrossRef]
  73. Mokyr, J. Demand vs. Supply in the Industrial Revolution. J. Econ. Hist. 1977, 37, 981–1008. [Google Scholar] [CrossRef]
  74. Shammas, C. The Pre-Industrial Consumer in England and America; Clarendon Press: Oxford, UK, 1990. [Google Scholar]
  75. Berg, M. Markets, Trade and European Manufacture. In Markets and Manufacture in Early Industrial Europe; Berg, M., Ed.; Routledge: London, UK, 1991; pp. 3–23. [Google Scholar]
  76. Lemire, B. Fashion’s Favourite: The Cotton Trade and the Consumer in Britain, 1660–1800; Oxford University Press: New York, NY, USA, 1991. [Google Scholar]
  77. Fairchilds, C. Consumption in Early Modern Europe. Comp. Stud. Soc. Hist. 1993, 35, 850–858. [Google Scholar] [CrossRef]
  78. Brewer, J.; Porter, R. Consumption and the World of Goods; Routledge: London, UK, 1994. [Google Scholar]
  79. White, J. A world of goods? The “Consumption Turn” and Eighteenth-Century British History. Cult. Soc. Hist. 2006, 3, 93–104. [Google Scholar] [CrossRef]
  80. Mokyr, J. The Enlightened Economy: An Economic History of Britain, 1700–1850; Yale University Press: New Haven, CT, USA, 2009. [Google Scholar]
  81. Girard, R. Mimesis and Theory: Essays on Literature and Criticism, 1953–2005; Stanford University Press: Stanford, CA, USA, 2011. [Google Scholar]
  82. Mokyr, J. ACulture of Growth. The Origins of the Modern Economy; Princeton University Press: Princeton, NJ, USA, 2016. [Google Scholar]
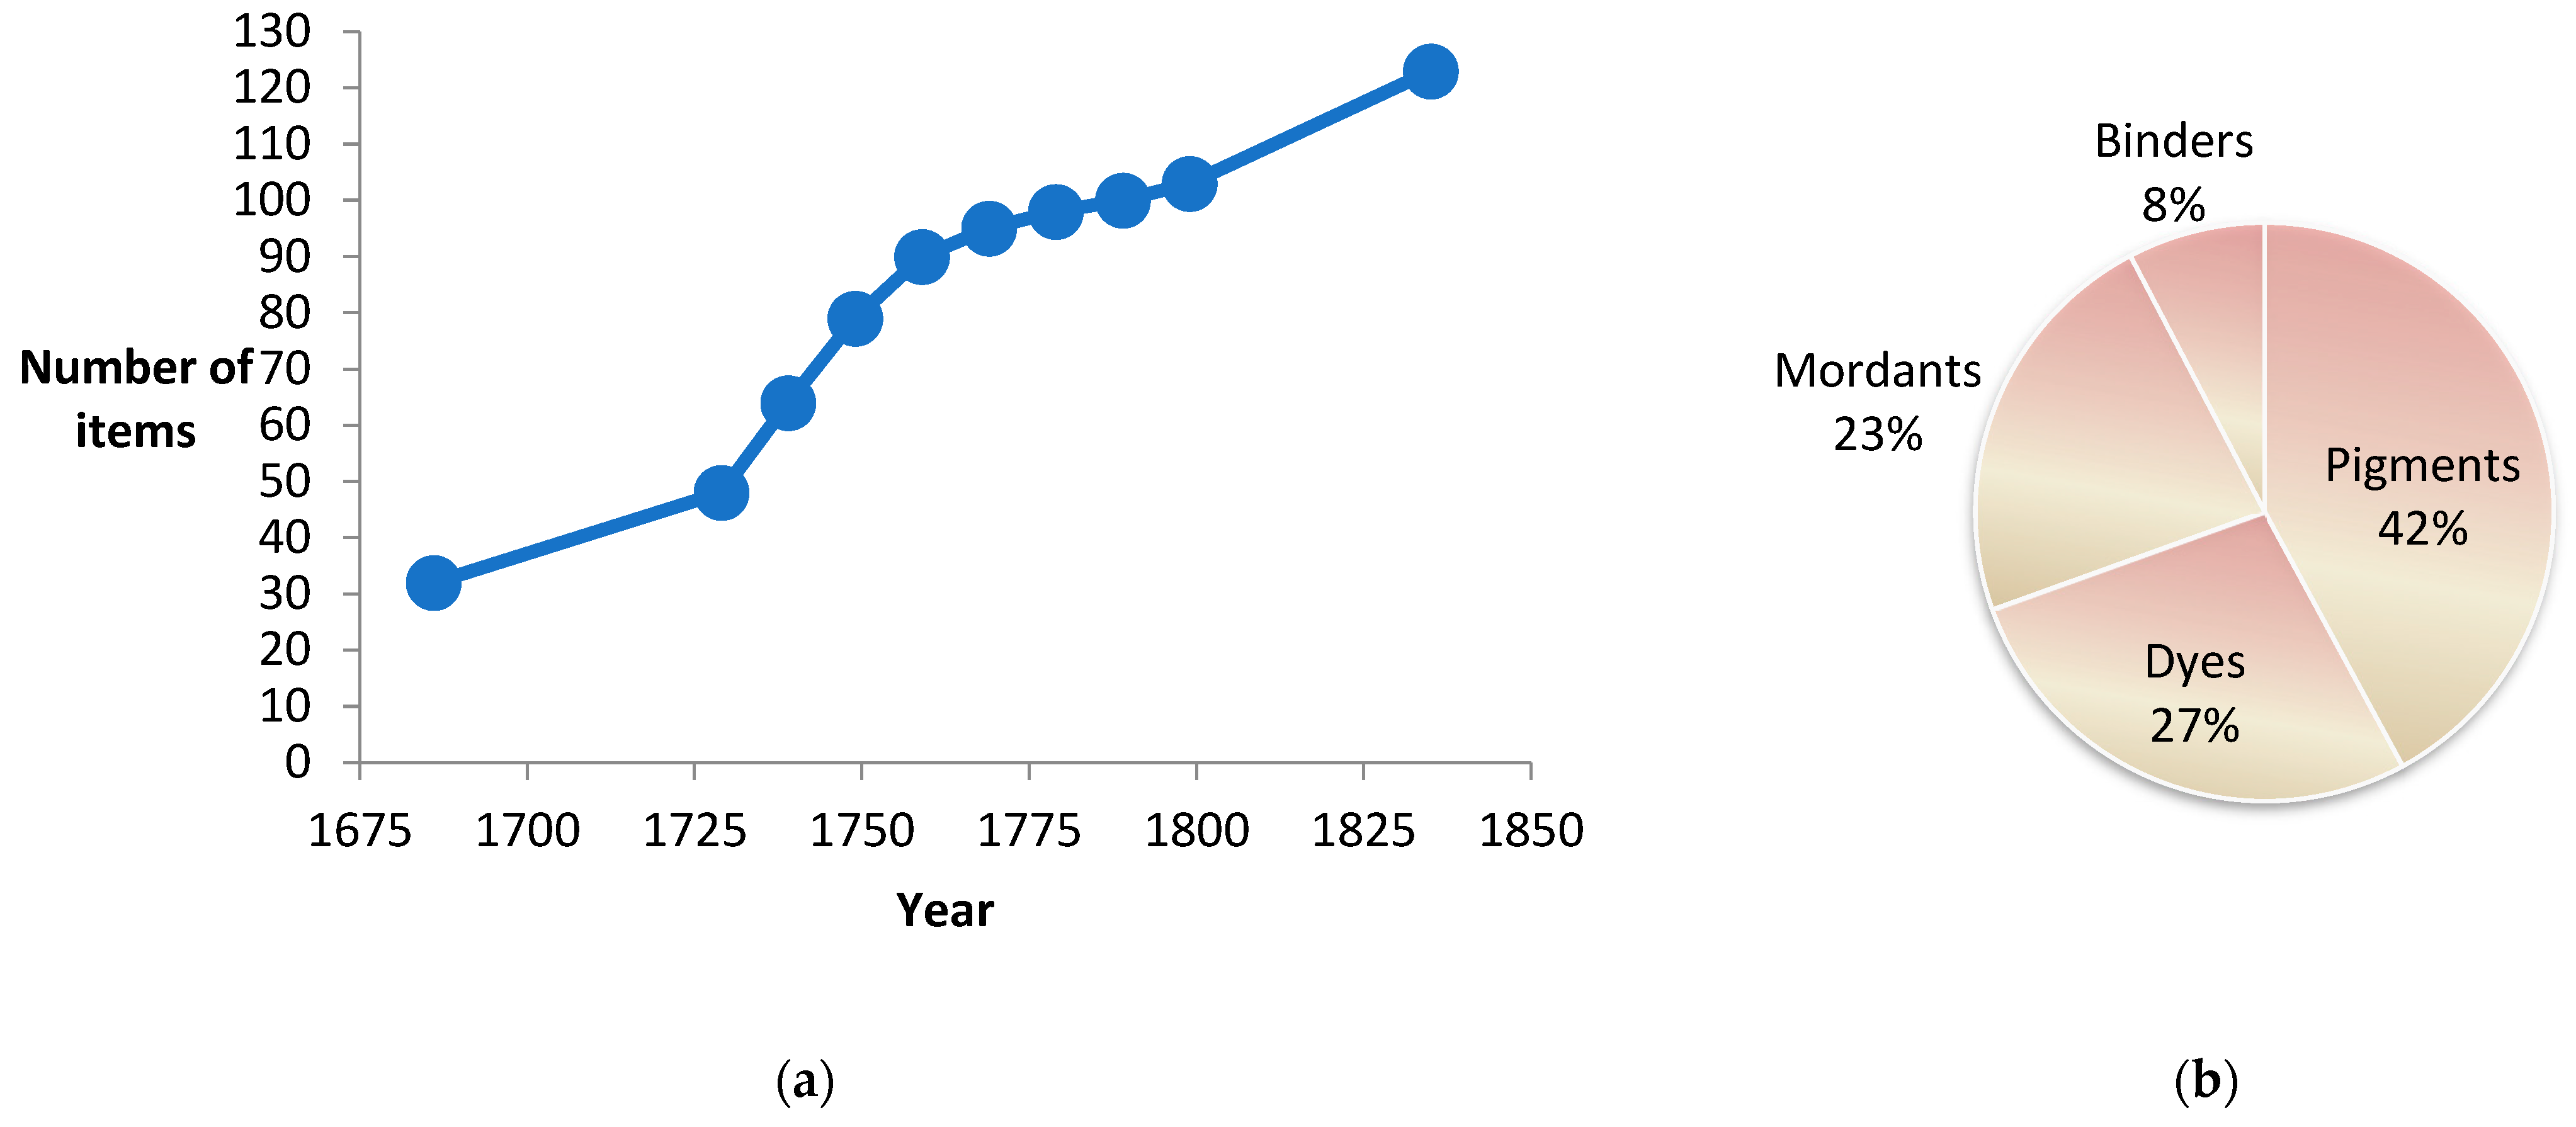
Figure 1. (a) The graph shows the cumulative number of colorant items imported from 1685/1686, in 10-year periods from 1720–1800, and in 1835; (b) percentage distribution of imported quantities of pigments, dyes, mordants (and auxiliaries) and binders (and additives) as they appear in the digitized customs records.
Heritage 05 00193 g001
Figure 2. (a) Import graphs for white, red and yellow pigments for house painting; (b) import graphs for the individual red paint pigments consisting of iron oxide pigments (brown red, earth pigment, Danish red, English earth and caput mortuum) and minium. Markers refer to years 1731, 1732, 1733, 1749, 1754, 1756, 1762, 1774, 1786, 1788, and 1794. Dashed graph lines indicate a lack of data between the recorded years.
Heritage 05 00193 g002
Figure 3. Import graphs for (a) yellow decorative pigments orpiment (including rusgel), kongegult and dyer’s buckthorn; (b) and graphite, carbon black and ink powder. Markers refer to years 1724, 1725, 1731, 1733, 1740, 1742, 1749, 1751, 1752, 1753, 1754, 1756, 1762, 1786, 1788, 1792, and 1794. Dashed graph lines indicate a lack of data between the recorded years.
Heritage 05 00193 g003
Figure 4. Import graphs for (a) the water soluble binders horn glue, isinglass and gums; (b) and non-water soluble shellac, lakk, litharge of silver and copper (II)sulphate. Markers refer to years 1725, 1726, 1731, 1733, 1740, 1742, 1744, 1745, 1749, 1751, 1752, 1753, 1754, 1755, 1756, 1762, 1774, 1786, 1788, 1792, and 1794. Dashed graph lines indicate a lack of data between the recorded years.
Heritage 05 00193 g004
Figure 5. Import graph for non-water soluble binders:(a) linseed oil (imported in volume units and converted to liters), Markers refer to all the years linseed oil has been registered in the digitized customs records; (b) and resin (harpiks), turpentine and turpentine oil. Markers refer to years 1724, 1732,1733, 1749, 1754, 1756, 1762, 1774, 1786, 1788, 1790, 1792, and 1794. Dashed graph lines indicate a lack of data between the recorded years.
Heritage 05 00193 g005
Figure 6. Import graphs:(a) for red textile dyes brazilwood, rasped brazilwood, madder, cochineal sandalwood, and pernambuco wood for the entire century; (b) and same graph but with enlarged y-axis. Markers refer to years 1731, 1732, 1733, 1734, 1754, 1756, 1758, 1762, 1774, 1786, 1788, 1790, 1792, and 1794. Dashed graph lines indicate a lack of data between the recorded years. The graphs overlap each other but clearly show the increased imports in the middle and at the end of the 18th century.
Heritage 05 00193 g006
Figure 7. Import graphs for:(a) logwood (brissel, campecheholt, and blauholt), indigo, litmus, and logwood, brown; and(b)Prussian blue. Markers refer to years 1731, 1733, 1749, 1754, 1756, 1758, 1762, 1774, 1786, 1788, 1790, and 1794. Dashed graph lines indicate a lack of data between the recorded years.
Heritage 05 00193 g007
Figure 8. Import graphs for:(a) yellow textile dyes turmeric, annatto (orleans and uldrian), and saw-wort; and (b) verdigris and gallnut. Markers refer to years 1726, 1731, 1732, 1733, 1752, 1756, 1762, 1774, 1786, 1788, 1790, 1792, and 1794. Dashed graph lines indicate a lack of data between the recorded years.
Heritage 05 00193 g008
Figure 9. Import graphs for mordants: (a) alum, vitriol, and vitriol, kobberrøg (alum was measured both as pounds and barrels; barrels are converted to pounds based on the price of pounds and barrels.) Markers refer to all the years linseed oil has been registered in the digitized customs records; and (b) cream of tartar and vitriol, anglicum. Markers refer to years 1724, 1725, 1731, 1732, 1733, 1734, 1745, 1749, 1751, 1752, 1753, 1754, 1755, 1756, 1758, 1762, 1770, 1774, 1786, 1788, 1790, 1792, and 1794. Dashed graph lines indicate a lack of data between the recorded years.
Heritage 05 00193 g009
Figure 10. Average prices for the period 1774 to 1794 for 31 colorant items, with prices below 1 daler/pound (annatto (orleans and uldrian), brazilwood, brazilwood shavings, brown red, caput mortuum, carbon black, red chalk, dyer’s buckthorn, earth pigment, English earth, gallnut, graphite, ink powder, king’s yellow, lake pigments kulelakk and kurlakk, lead white and skiferhvit, litmus, logwood, logwood brown, madder, minium, pernambuco wood, sappanwood, saw-wort, smalt, turmeric, umber, verdigris, and yellow ochre). The colorants are not specified on the graphs, since the message is to show that the prices were mostly stable.
Heritage 05 00193 g010
Figure 11. Prices versus import quantities. Values for two dyes with prices above 2 daler/pound are not included: saffron (8.6 daler/pound) and cochineal (4.67 daler/pound), both with low import quantities of 895 and 4, 242 pounds, respectively. Indigo (square marker) had a high price and high import quantity.
Heritage 05 00193 g011
Figure 12. Total imported quantities (red, line) and the total values (quantity multiplied by price, blue columns) of imported pigments and dyes.
Heritage 05 00193 g012
Figure 13. Import graphs for unprocessed:(a) hemp, flax; and (b) cotton and wool. Markers refer to years 1686, 1731, 1756, 1786, and 1794. Dashed graph lines indicate a lack of data between the recorded years.
Heritage 05 00193 g013
Figure 14. Import graphs for: (a) pepper; and (b) sugar. Markers refer to years 1686, 1731, 1733, 1756, 1762, 1774, 1786, 1788, 1790, and 1794. Dashed graph lines indicate a lack of data between the recorded years.
Heritage 05 00193 g014
Figure 15. Import graphs for: (a) coffee; and (b) tea. Markers refer to years 1731, 1733, 1754, 1756, 1762, 1774, 1786, 1788, 1790, 1792, and 1794. Dashed graph lines indicate a lack of data between the recorded years.
Heritage 05 00193 g015
Figure 16. Import, domestic and export graphs for:(a) alum; and (b) indigo. Markers refer to the years where data for the items have been registered in the digitized customs records. Dashed graph lines indicate a lack of data between the recorded years.
Heritage 05 00193 g016
Figure 17. Export graph for klipfish during the 18th century. Markers refer to years 1731, 1732, 1733, 1746, 1749, 1756, 1762, 1774, 1786, and 1794. Dashed graph lines indicate a lack of data between the recorded years.
Heritage 05 00193 g017
Figure 18. Graphs for imported colorant items (pigments for house painting and decoration, binders, dyes and mordants) for: (a) 1733, 1756, 1786, and 1794; and (b) 1731, 1733, 1756, 1762, 1774, 1786, 1788, 1790, and 1794. In (a), the graphs are dashed between 1833 and 1786 because of the long time interval, while 1774 is included in (b). The graphs show increased imports in the middle and at the end of the 18th century, increases which the author has called the first and second Norwegian chromatic revolutions. According to the 1774 registrations imports were temporarily reduced before similar import levels as 1756 were reached in 1786, with further increases at the end of the century.
Heritage 05 00193 g018
Figure 19. Import graphs for dyes imported in high quantities: (a) dyes imported in smaller quantities; and (b) show how imports of dyes increased in the middle and at end of the 18th century. Markers refer to years 1726, 1731, 1732, 1733, 1734, 1749, 1752, 1756, 1762, 1774, 1786, 1788, 1790, 1792, and 1794.
Heritage 05 00193 g019
Figure 20. Imports of colorant items to Trondheim during the 18th century. The secondary right y-axis relates to indigo and lead white which were imported in considerable larger quantities. The graphs overlap each other but clearly show that import of many colorant items increased during the period 1745–1750. This increased colorant import was maintained during the second part of the 18th century.
Heritage 05 00193 g020
Figure 21. Percentage distribution of the colors of imported paint pigments as they appear in the digitized customs records.
Heritage 05 00193 g021
Figure 22. Import graphs for the textile dyes shown by color. Markers refer to years 1731, 1733, 1756, 1786, and 1794. Dashed graph lines indicate a lack of data between the recorded years, and missing graphs between 1733 and 1756 indicate a lack of these data concerning the start of the first chromatic revolution.
Heritage 05 00193 g022
Figure 23. Model for the increased colorant imports into Norway. It also illustrates events that may have contributed to the development of the consumer society from the middle of the 18th century in Norway. This schematic representation includes to the left a positive feed-back supply loop, stimulated by prosperity with increased transnational export trade and import of colorants as return products. The first chromatic “evolution in the middle of the 18th century may represent a “supply (import)-driven increased consumption” for colorants. To the right a positive feed-back demand loop is driven by liberal politics, development of the internal market and factors that increase the demands for colorants, as well as production of consumer goods. This “demand-driven increased consumption” developed during the second part of the 18th century, which culminated in the second chromatic revolution at the end of the century.
Heritage 05 00193 g023
Table 1. The table gives an overview of the years with digitized product lists from the customs records for the largest custom ports Bergen, Christiania (Oslo), Drammen and Trondheim. The dark fields show customs records transcribed completely, the light fields show partially transcribed customs records and the white fields show customs lists that are missing.
Town168617311733175417561762177417861788179017921794
Bergen
Christiania
Drammen
Trondheim
Table 2. Comparison of dye cost between Norway and England. The table shows amounts of imported dye (based on the digitized product lists from the Norwegian customs records), mutual weight in percentage (of the registered amounts), color yield per unit [52] of textile dyeing, coloring ability measured as weight multiplied with color yield per unit, mutual coloring ability in percent, price as stated in the customs records for the period 1774–1794, material cost and calculated material cost in Norway and England.
Weight
(pounds)
Weight
(%)
Color Yield per unitWeight * Color Yield per unit
(pounds)
Weight*Color Yield per unit
(%)
Price
(daler)
Dye Cost
(daler/pound)
Dye Cost Norway
(£/ton)
Dye Cost England [52]
(£/ton)
A BA*B CD=C/BD
Indigo68,7622717.81,223,964671.600.0944.940.3
Cochineal4,242214.561,50934.670.32161.0115.3
Annatto4,63729.242,66020.380.0420.715.7
Logwood13,29453.951,84730.040.015.11.9
Brazilwood102,549403.0307,647170.070.0211.76.8
Madder59,920242.3137,81680.160.0734.832.5
Publisher’s Note: MDPI stays neutral with regard to jurisdictional claims in published maps and institutional affiliations.