Article

Microclimate and Weathering in Cultural Heritage: Design of a Monitoring Apparatus for Field Exposure Tests

1
Department of Geosciences, University of Padova, Via Gradenigo 6, 35131 Padova, Italy
2
Vestfold and Telemark County Council, Svend Foynsgate 9, 3126 Tønsberg, Norway
*
Author to whom correspondence should be addressed.
Heritage 2022, 5(4), 3211-3219; https://doi.org/10.3390/heritage5040165
Submission received: 29 September 2022 / Revised: 19 October 2022 / Accepted: 24 October 2022 / Published: 27 October 2022
(This article belongs to the Special Issue Advances in Italian Research Applied to Cultural Heritage)

Abstract

:
An innovative experimental method for the long-term monitoring of outdoor microclimate and material decay at cultural heritage sites was developed to aid the formulation of new damage functions and models for climate-change risk assessment. To that end, an apparatus for field exposure tests was designed to monitor a variety of historical building materials in different environmental settings. The data series acquired, i.e., surface temperature and moisture, are compared with the corresponding meteorological datasets on a local and regional scale. The apparatus is designed for supporting also the monitoring of the physical and chemical changes caused by weathering. This novel method is expected to provide insights into the interaction between historical materials and the environment, which can be exploited for the protection and conservation of cultural heritage.

1. Introduction

Understanding the interaction between cultural heritage and the environment is a key factor for assessing the vulnerability of the materials used in historical assets and adapting the protection and conservation measures. Damage functions and models based on climate parameters are essential for reconstructing the relevant weathering processes that have occurred in the past or are expected in the future on a large scale [1,2]; however, they may be less reliable when dealing with individual cultural sites and landscapes, due to variability in the microenvironments or the properties of the different materials used. Therefore, simulations often require validation by experimental data on material deterioration and high-resolution climate and air pollution records. In this regard, laboratory programs of accelerated aging tests may give precious information [3,4]. However, more straightforward indications are provided by long-term monitoring programs, including so-called field exposure tests, which are expressly designed for tracking the natural aging of materials [5,6,7,8], with pioneering experiments dating back to over 70 years ago [9]. The inputs provided by those studies are extremely valuable, although some may have flaws in the approach adopted. Some tests are focused on few materials and single exposure conditions, although including detailed environmental monitoring programs. Others involve a large variety of materials, but lack in addressing the microclimate variability and its direct link with weathering. Still others neglect the quantification of surface recession, which is expected to be a primary deterioration process enhanced by climate change [10].
This paper describes the research work for the original design and development of an innovative method for the long-term monitoring of outdoor microclimate at different heritage sites and the weathering of the main component materials through a program of field exposure tests in urban environments in Italy and Norway. This experimental approach lays the foundation for investigating the microclimate at different scales of observation and quantifying the systematic differences among the relevant datasets. Moreover, it aims at assessing the influence of an array of material properties on the deterioration trends. Statistically significant datasets are expected to be acquired in the next years.

2. Materials and Methods

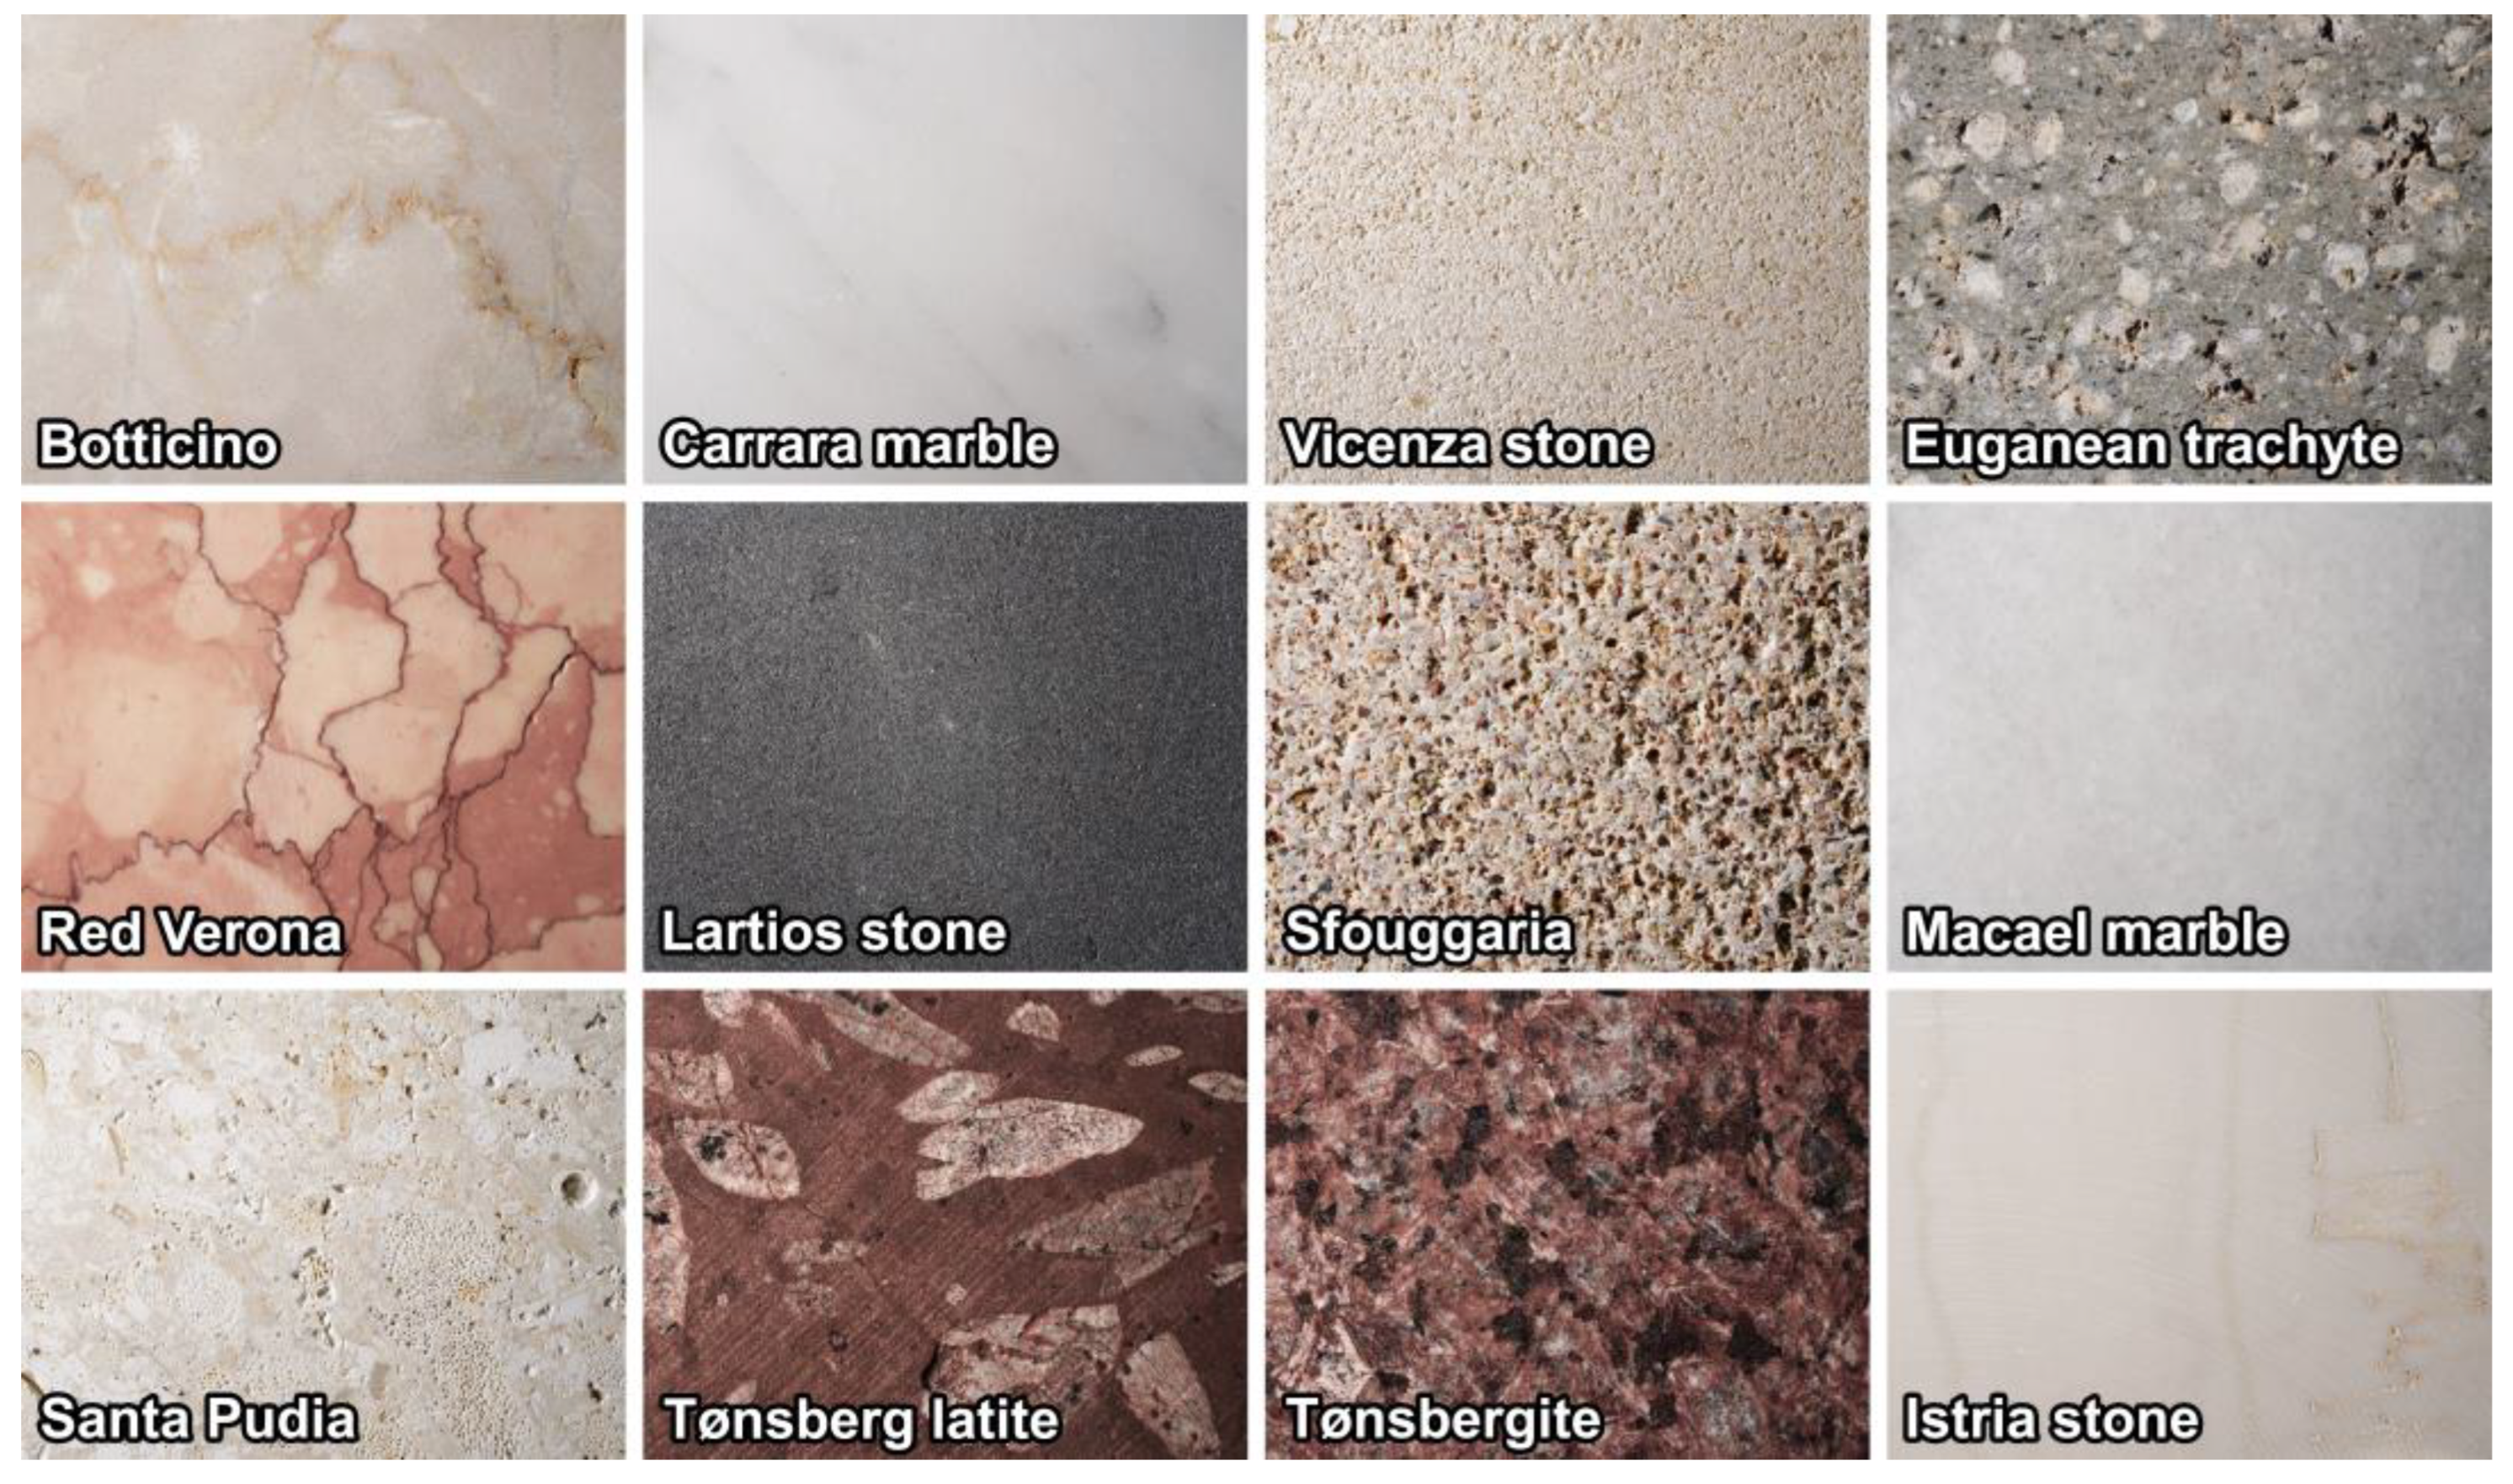
2.1. Selection of Materials

The materials selected for the field tests are different stone and wood types used in cultural heritage as building materials from different European countries. The selection covers a range of diverse characteristics of composition, texture, and color, in order to set a reference to which other similar materials can be compared.
The twelve stone materials selected are extracted in Italy, Greece, Spain, Norway, and Croatia, and are known as Botticino, Carrara marble, Vicenza stone, Euganean trachyte, Red Verona, Lartios stone, Sfouggaria, Macael marble, Santa Pudia, Tønsberg latite, Tønsbergite, and Istria stone (Figure 1). Most are carbonate rocks, in particular limestone and marble, but the collection also includes a trachyte, a sandstone, a latite, and a monzonite. The samples to expose were prepared as 70 × 70 × 20 mm tiles. For requirements of the planned laboratory analyses, an AISI-304 stainless steel cylinder was glued into each sample with a two-component epoxy resin—Kömmerling Körapox 439. Finally, the surface was leveled and polished roughly with 60-grit sandpaper.
The four wood materials selected are different types of pine and spruce with different densities from the forest of Vikersund in Modum, Norway. The samples to expose were cut into 600 × 102 × 23 mm specimens, hand-leveled on three sides, and air-dried to a 10–13% water content. The upper half of each specimen was left without finish. The lower half was treated with a linseed oil paint with the addition of a red pigment composed of iron and zinc oxides. Finally, a zinc flashing was mounted on the top of the samples to prevent water penetration into the end grain.

2.2. Apparatus

2.2.1. Hardware Components

The monitoring apparatus for the field tests has four main hardware components. Some are commercial parts, others are original design, i.e., they were specifically developed, tested, and finally assembled. A complete technical description of the four main components follows.
(1)
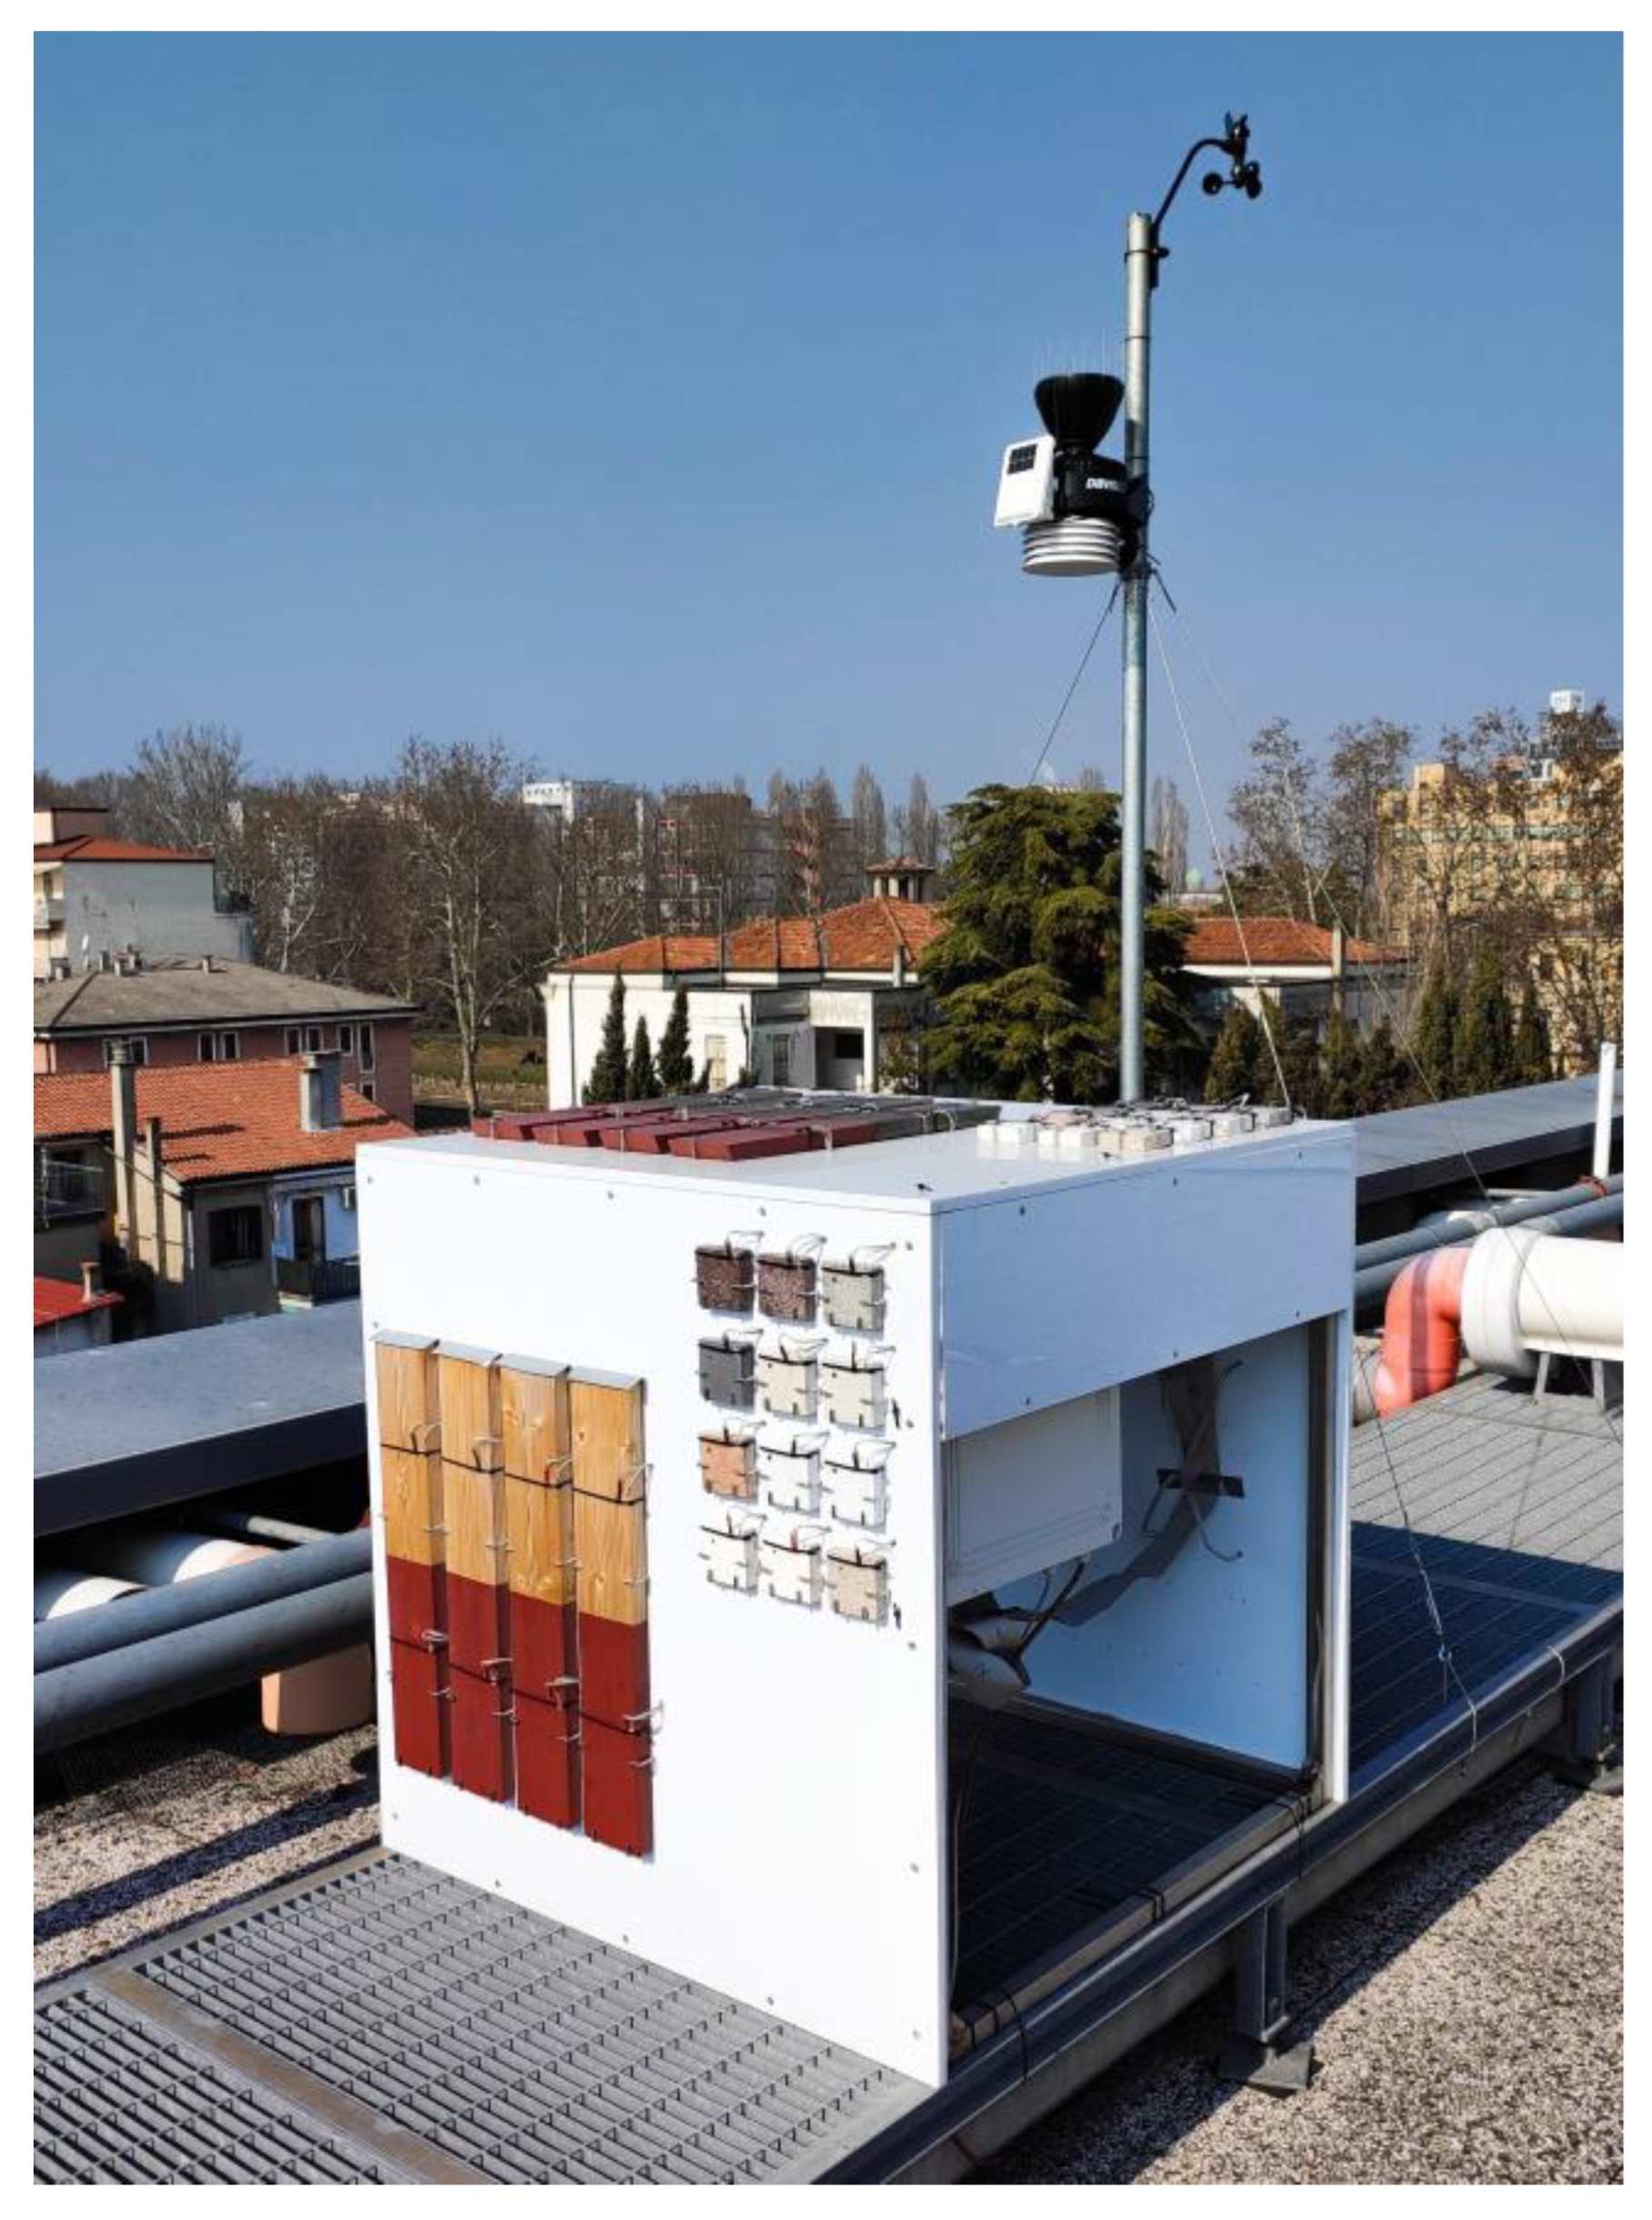
Stand: it is a cube-shaped structure composed of white PVC panels reinforced with a stainless steel frame and with AISI-304 stainless steel L-hooks for holding the stone and wood samples in place. Each side is 100 cm or 50 cm long, depending on the requirements for the final installation and the number of samples.
(2)
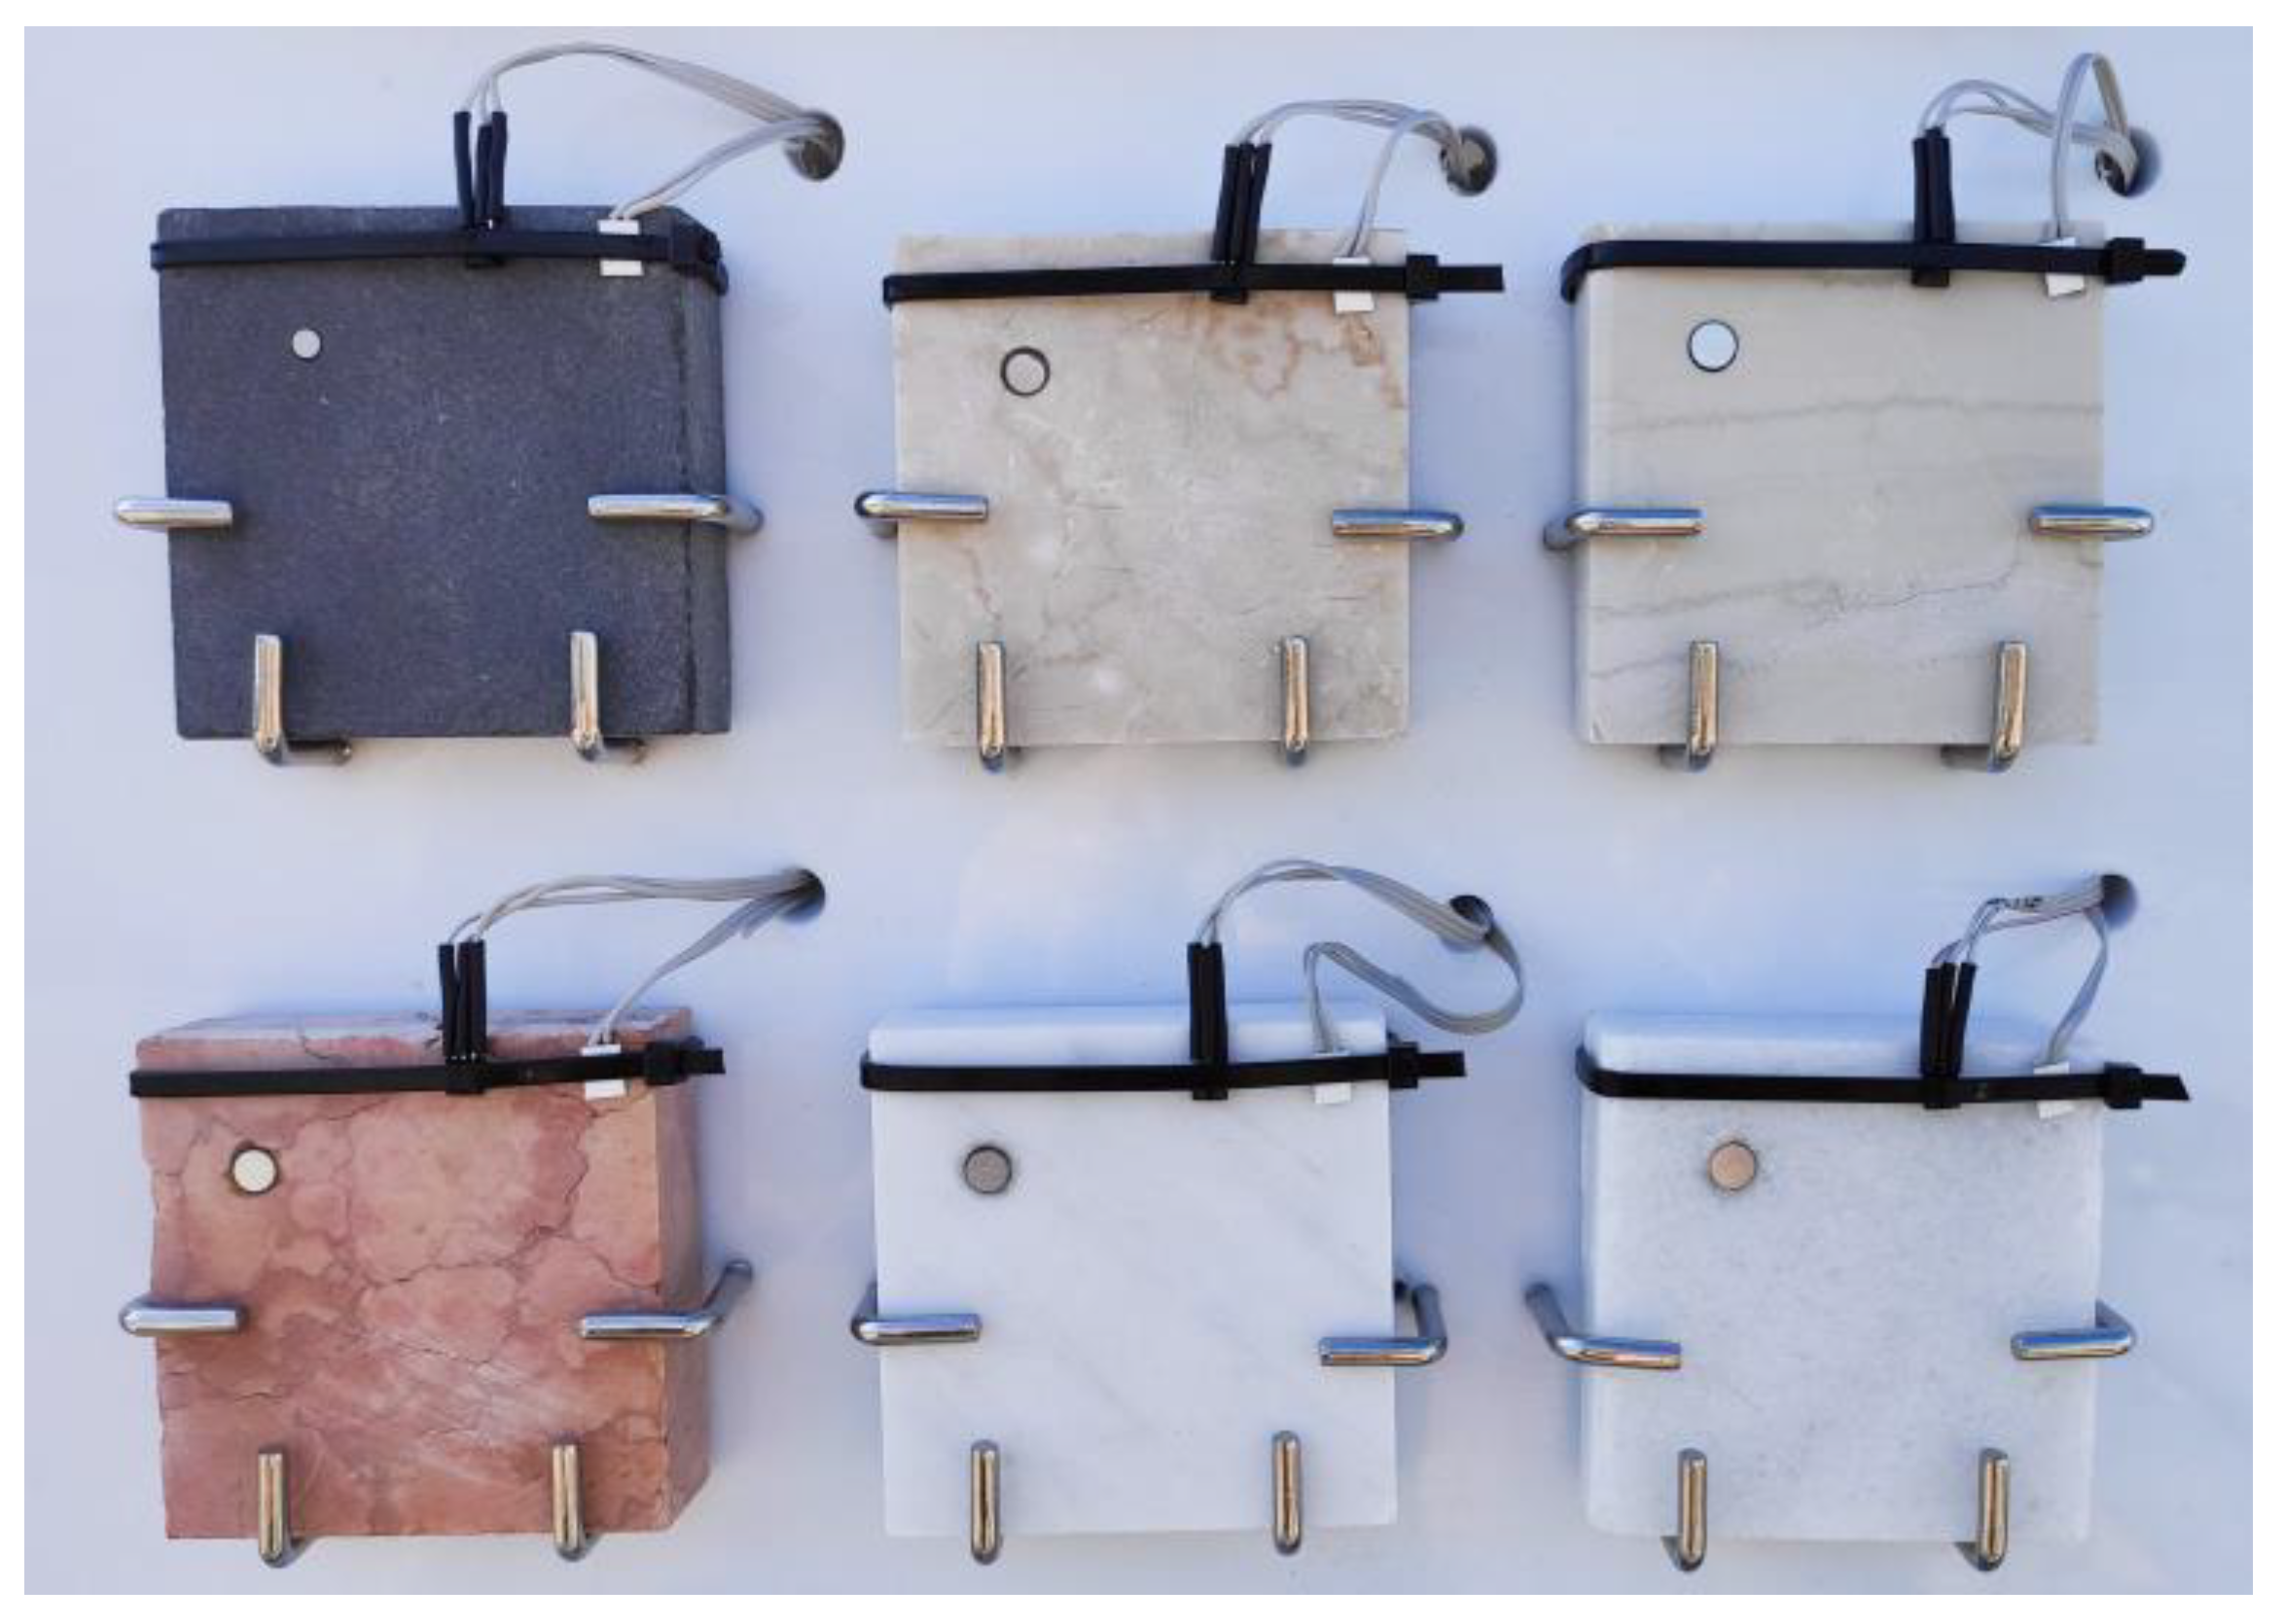
Sensor bundle: it includes two types of microclimate sensors for measuring surface temperature and moisture of each sample. The temperature sensor is the Texas Instruments LM60B. It is analogue bipolar and operates in a −25 °C to 125 °C range, with an accuracy of ±2 °C at room temperature and ±3 °C over the full range. Its output voltage is linearly proportional to temperature (6.25 mV/°C), with a DC offset and a nonlinearity of ±0.6 °C. The moisture/dew sensor is the Samyoung SY-DS-1. It is analogue resistive and operates in the range 0–60 °C and 0–100% relative humidity (RH). Its electrical resistance increases sharply in wet conditions (with maxima of 10 kΩ, 100 kΩ, and 200 kΩ at 80%, 93%, and 98% RH); therefore, it is used as a binary dry/wet sensor. The two sensors are fastened to each sample using UV-resistant nylon-66 cable ties (Figure 2).
(3)
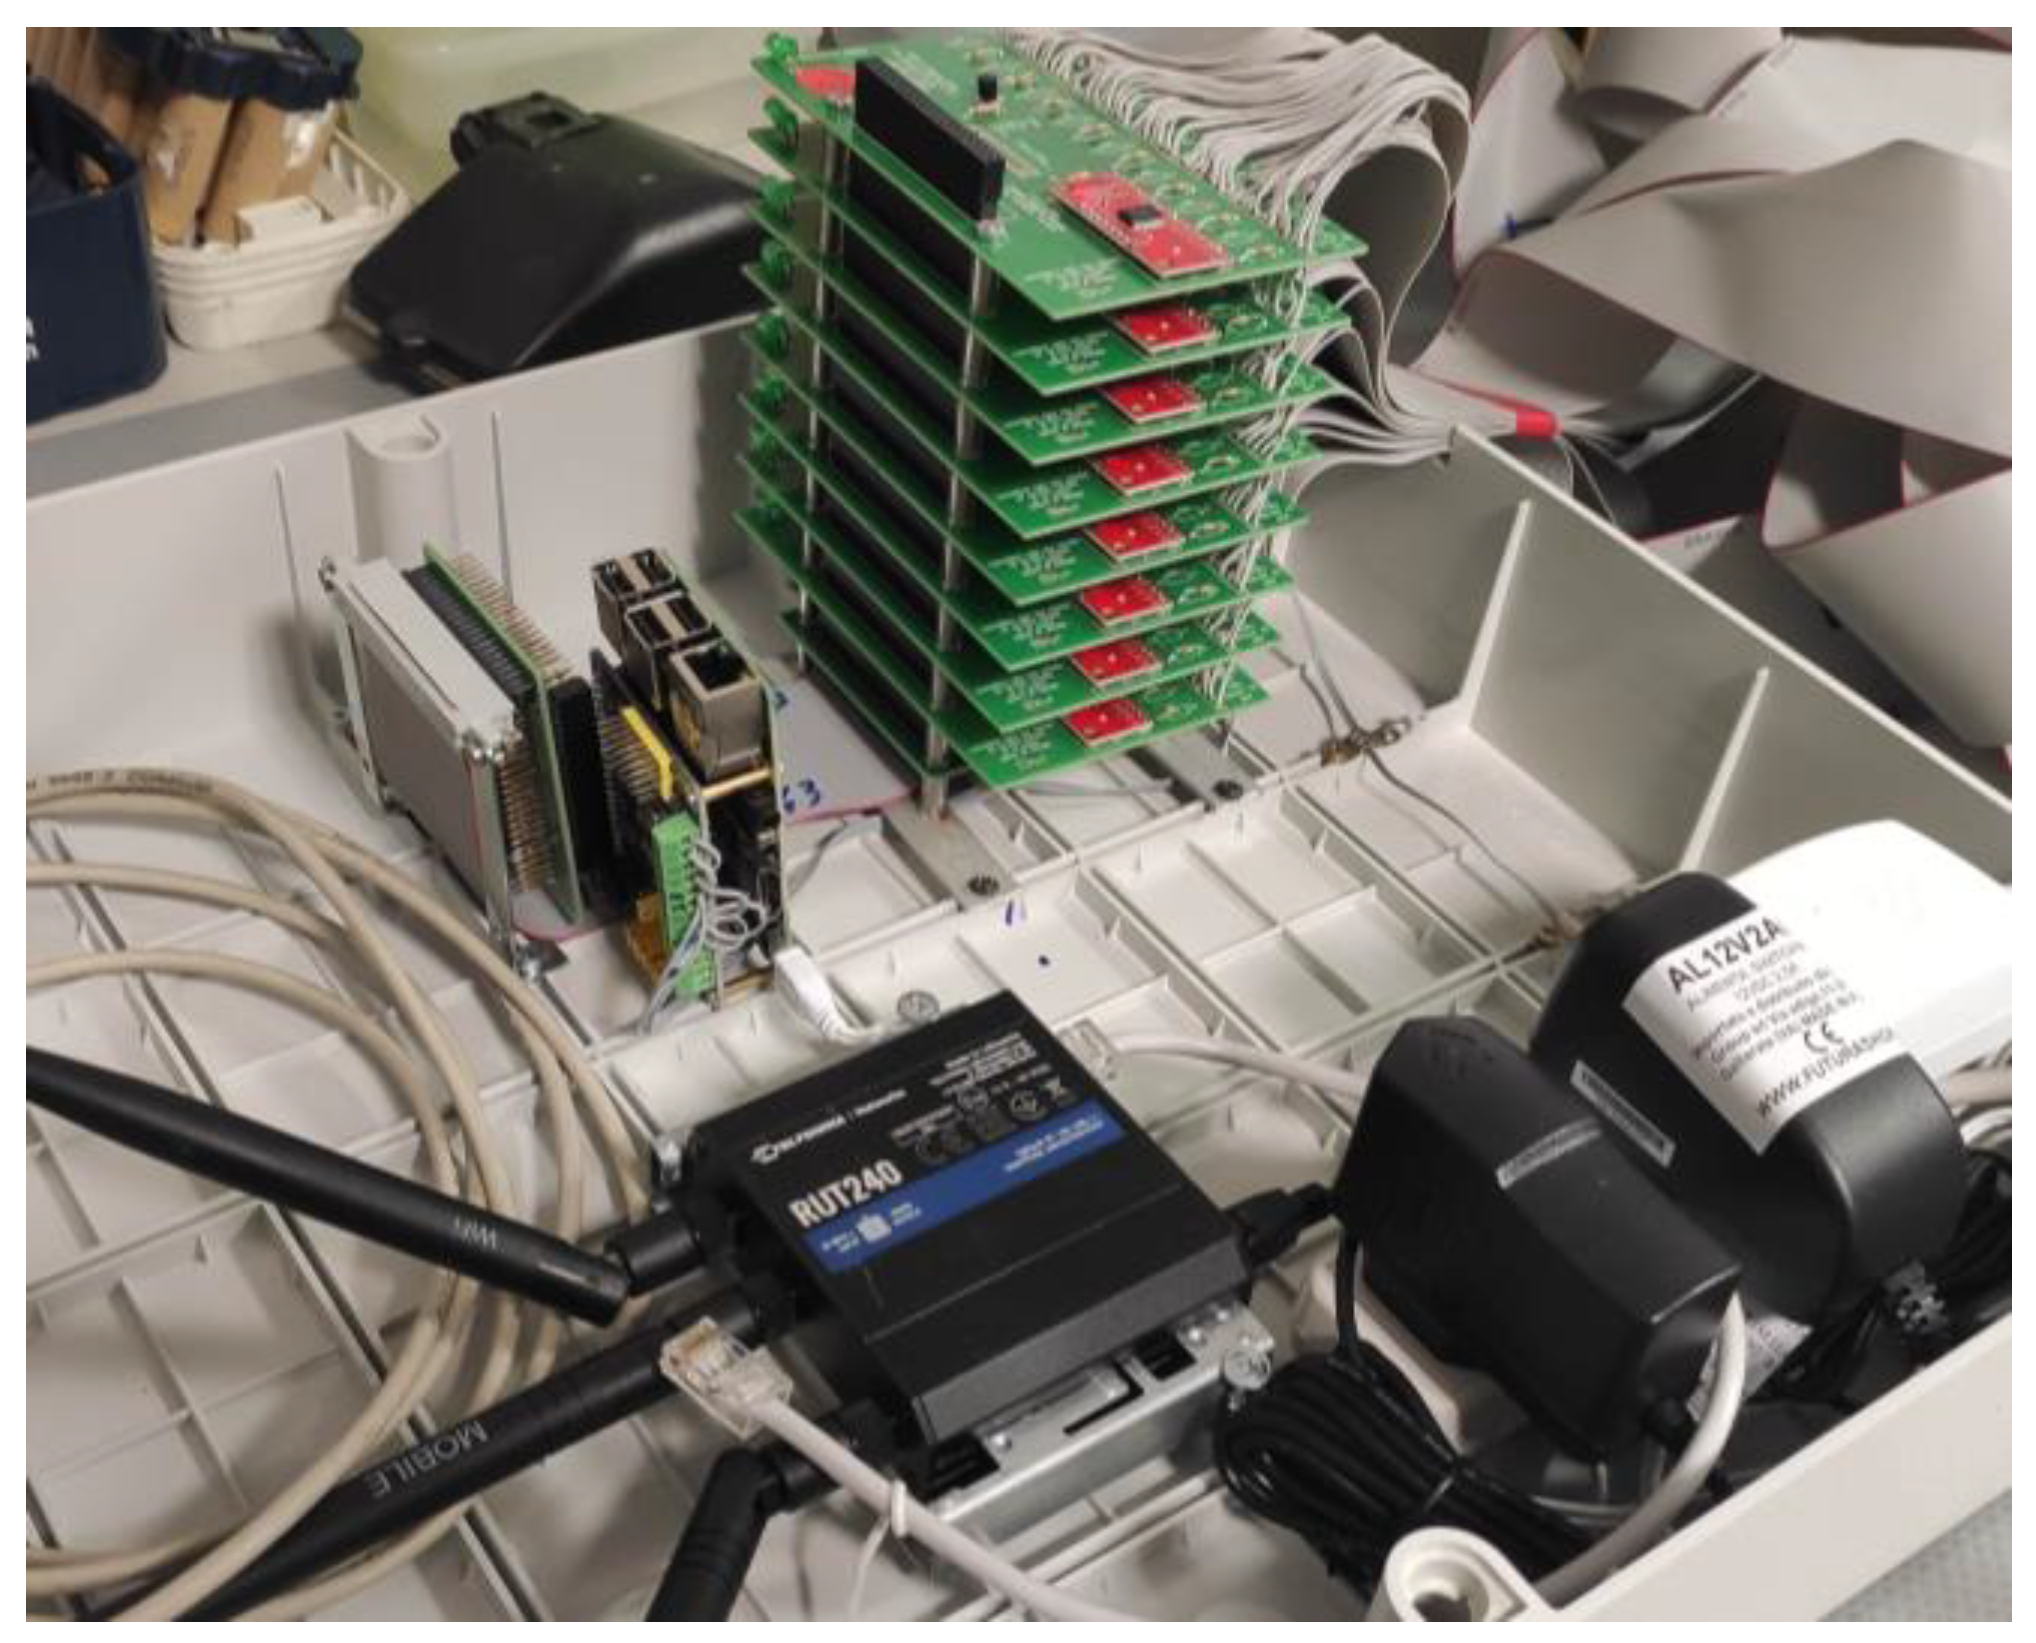
Control unit: it includes the electronics for acquiring, processing, storing, and transferring the microclimate data. It consists of a mux/demux system, an analogue-to-digital converter, and a single-board computer. The analogue signals from the sensors travel through ribbon cables and are processed by a stack of mux/demux boards controlled by a master board. The system runs 128 channels (when 8 mux/demux boards are used) or 80 channels (with 5 boards), each channel corresponding to one temperature or moisture sensor. The second component in the chain is a Waveshare high-precision AD/DA board, which converts the analogue signals into digital signals. Finally, these are transferred to the single-board computer, a Raspberry Pi 3 Model B, which uses a 64-bit Broadcom BCM2837B0 Armv7 processor and a Linux Debian Buster operating system with Raspberry Pi Desktop, with 1 GB RAM. The data are saved on an 8 GB microSD and uploaded daily online using an Ethernet connection to the local network or to a Wi-Fi 4G/LTE router Teltonika RUT240 with a data SIM card (Figure 3). This configuration allows for long and low-energy monitoring campaigns: one month of data takes less than 6 MB of storage space, and the power consumption is mostly due to the single-board computer, requiring just 260 mA (idle)/480 mA (under load).
(4)
Weather station: it provides time series of common meteorological parameters, including air temperature, RH, precipitation, wind speed and direction, solar radiation, pressure, etc. measured locally. The instrument used is an integrated monitoring system developed by AGENSO, called Ardeusi.gr. Where needed, a commercial weather station—Davis Vantage Pro2—was used instead.

2.2.2. Software Components

Thorough research or original development was undertaken also for the software packages allowing the user to interface with the monitoring apparatus, i.e., to establish an online connection, control and monitor the acquisition of the microclimate data, and transfer, aggregate, view, convert, and save them. The data acquisition involves the logging of the surface temperature and moisture from all the samples all day every 30 min.
The software packages allowing the communication via TCP/IP with the monitoring apparatus and the control on data acquisition and storage are original designs, including their graphical user interfaces. They were created in C programming language using the compilers GNU C for Linux and Borland C++ 5 for Microsoft Windows. Besides the original software, the platform is completed by two freeware programs: VNC Viewer by RealVNC® Ltd. (Cambridge, UK) and WinSCP by Martin Přikryl.

2.3. Installation

The monitoring apparatus was built in different units, which were then installed in three locations, on the top of the following buildings:
  • Clock Tower in St. Mark’s Square, Venice, Italy (45°26′05.2″ N, 12°20′20.2″ E). This is the only pilot site requiring the installation of the undersized apparatus (with a 50 cm stand and 80 channels), without the wood samples.
  • Department of Geosciences of the University of Padova, Padova, Italy (45°24′31.8″ N, 11°53′36.4″ E).
  • Vestfold and Telemark County Council, Tønsberg, Norway (59°15′55.9″ N, 10°24′57.6″ E).
Venice and Tønsberg were selected because of their environmental differences in terms of climate and air pollution, and for the presence of important heritage sites nearby. A further “control point” was added in Padova, which gives the possibility of longer-term monitoring and easier maintenance. Overall, the installation procedures had to consider practical factors such as space availability, exposure, elevation, presence of electricity and internet connection, accessibility for maintenance, inaccessibility to visitors, etc.
A total of 108 stone samples (36 in each site) and 24 wood samples (12 in Padova and 12 in Tønsberg) were mounted on the monitoring units, with every test panel oriented differently, i.e., one facing north, one south, and one horizontal. In that way, different samples of the same material are exposed in different cardinal directions. This applies to all the stone and wood varieties (Figure 4).

3. Results and Discussion

The first months of the field exposure tests allowed for verifying the operation of the monitoring apparatus running outdoors and the proper acquisition of the microclimate and climate data.

3.1. Scales of Observation

Three scales of observation were (and will be) considered for data interpretation:
(1)
Material scale: data from the surface sensors.
(2)
Local scale: data from the weather station.
(3)
Regional/urban scale: data freely available from the official regional agencies of environmental monitoring. In the cases of Venice and Padova, the data published by the ARPAV (Regional Agency for the Environmental Prevention and Protection of Veneto) are considered [11]. ARPAV collects records of air temperature, RH, precipitation, wind speed and direction, and solar radiation, with one weather station in each city. Moreover, ARPAV measures the concentration of air pollutants, including CO, NOx, SO2, O3, and PM10. There are two monitoring stations in the historical district of Venice and three in Padova, and they are differentiated based on their location (urban traffic, industrial, or background). For Tønsberg, the data source is the Norsk Klimaservicesenter (Norwegian Center for Climate Services) instead [12]. The center provides time series of air temperature, RH, precipitation, wind speed and direction, and solar radiation. There are eight weather stations in Tønsberg logging temperature and precipitation data, whereas the other parameters can be retrieved from the records of nearby stations (e.g., Melsom and Ramnes).

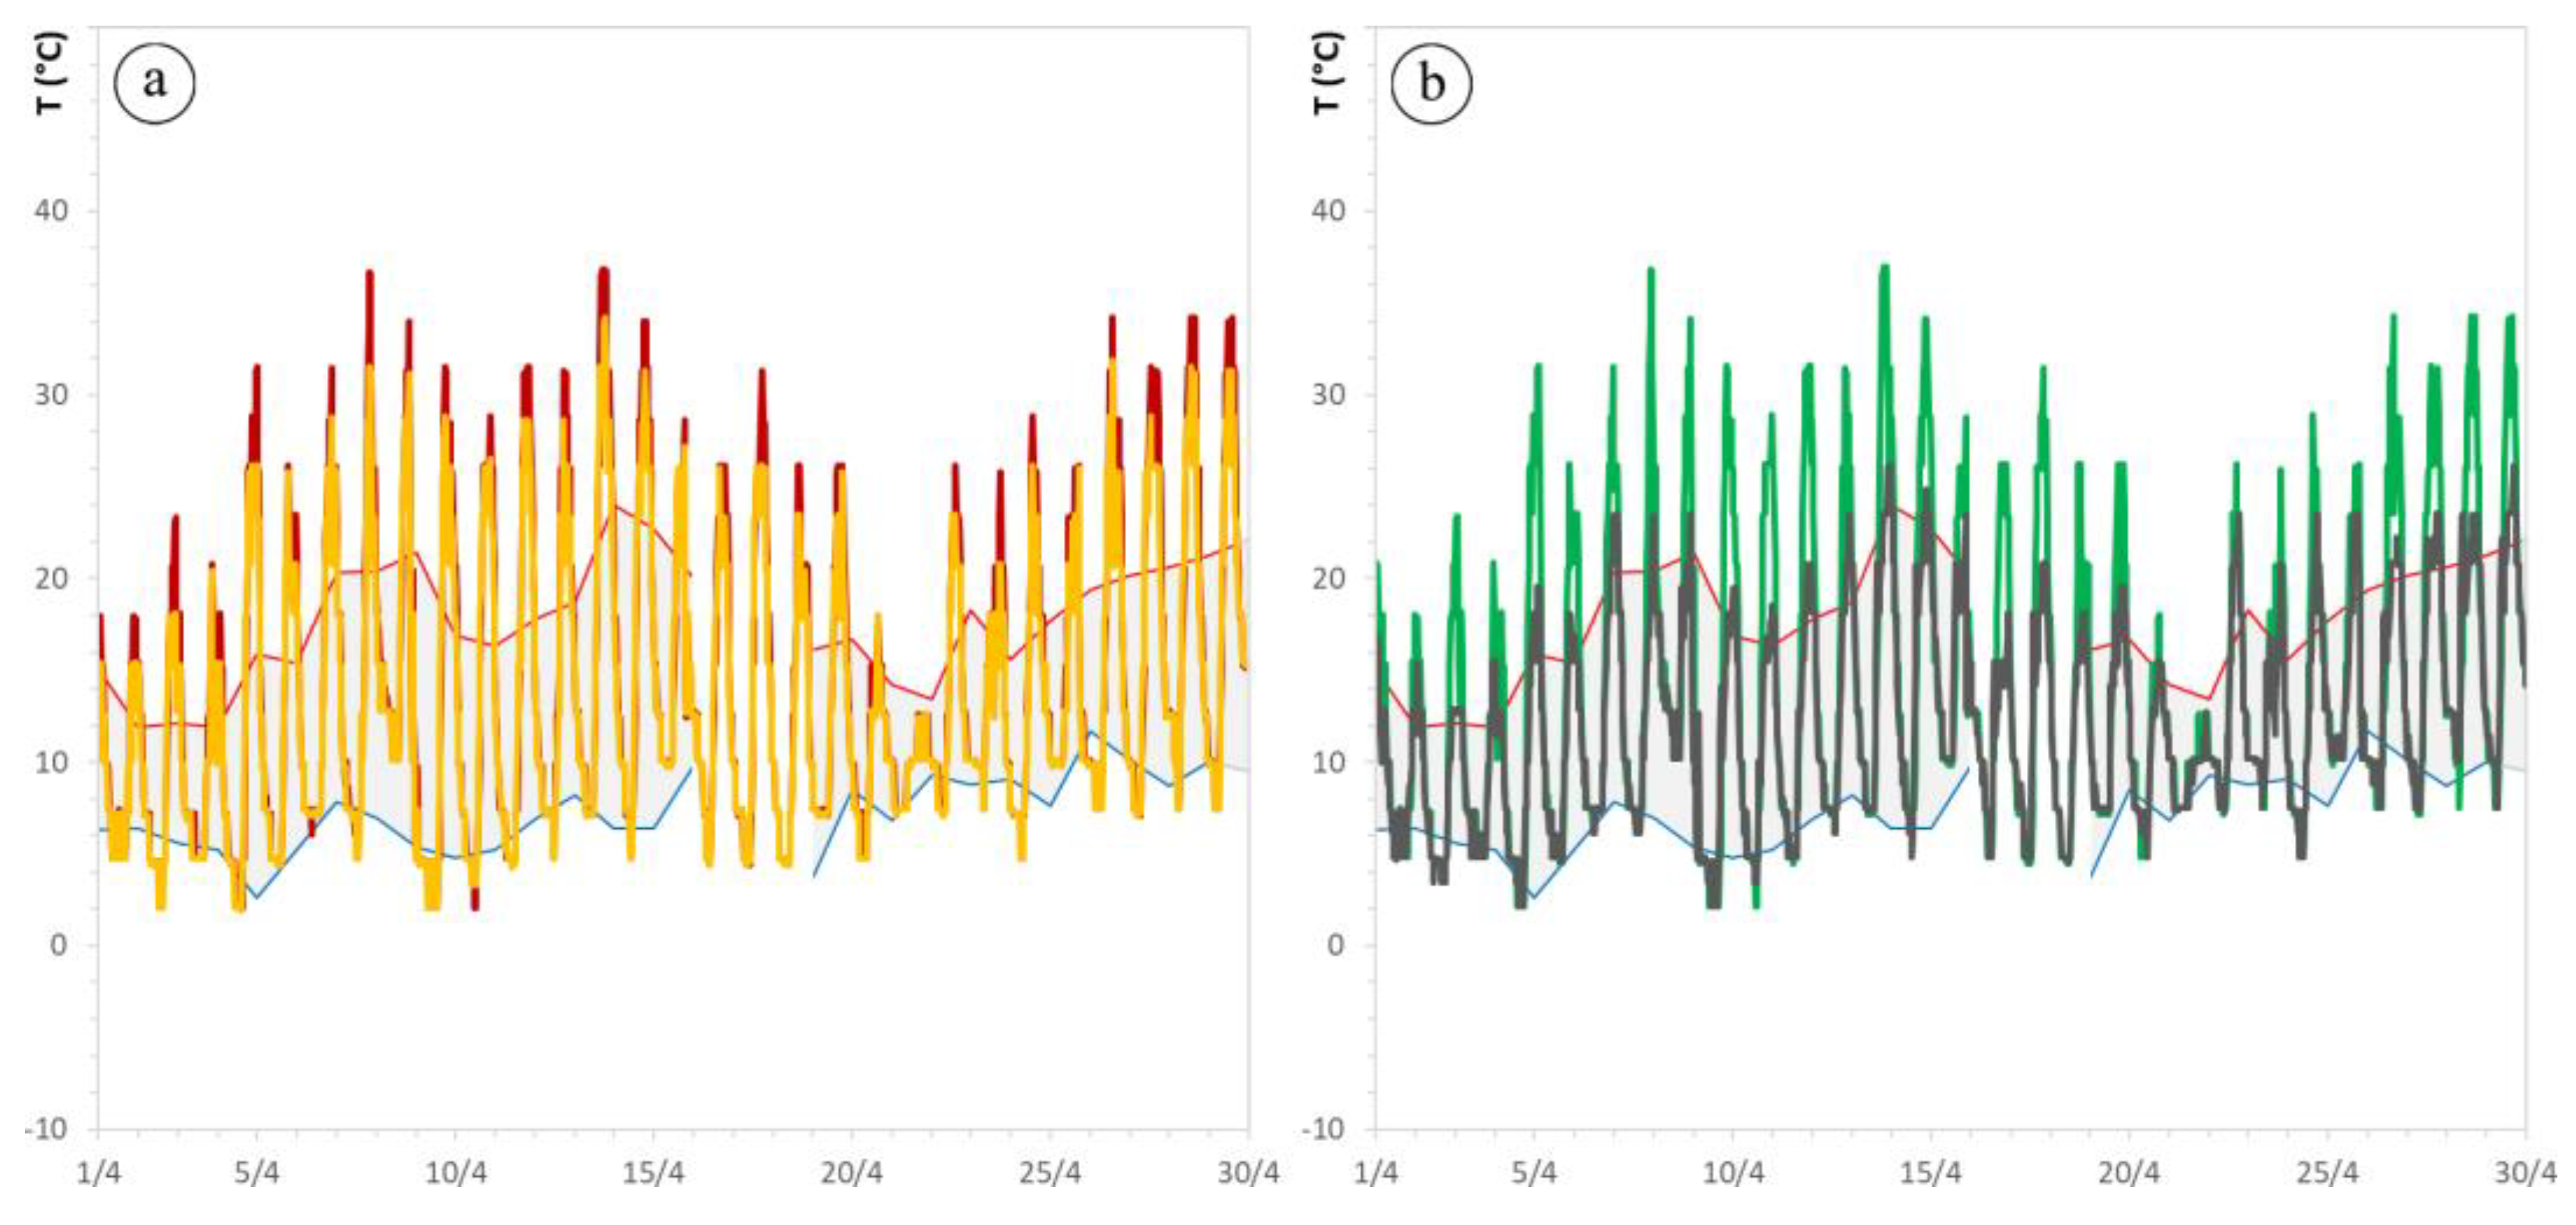
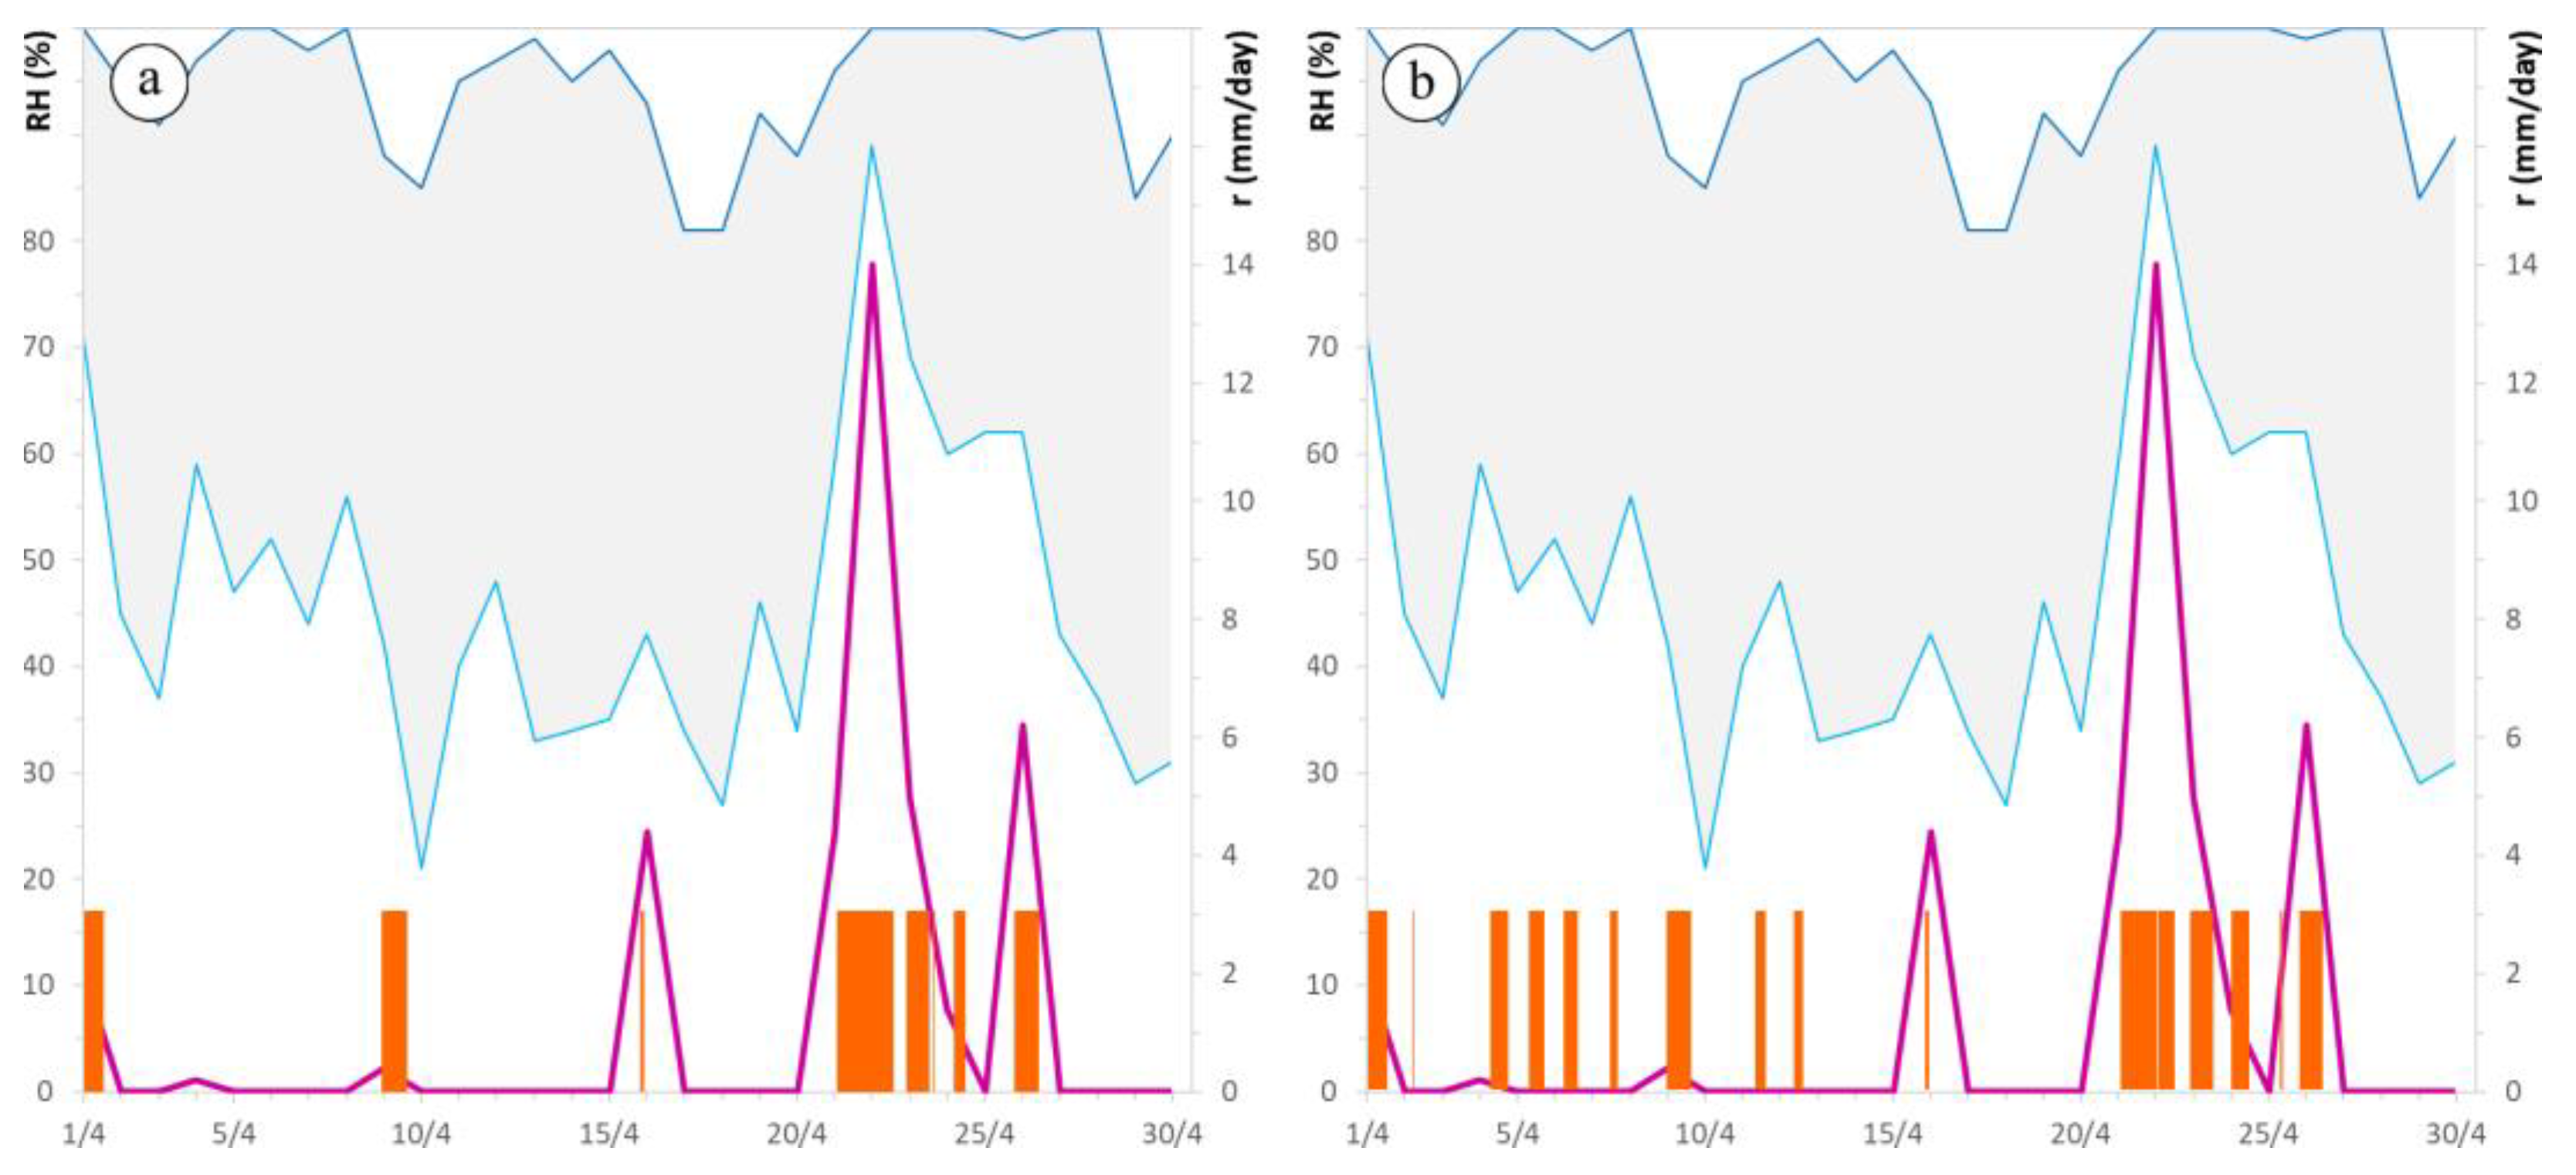
3.2. Preliminary Data Series

This paper discusses just one example extracted from the preliminary datasets acquired during the initial field-testing phase of the apparatus. The example refers to the microclimate and climate data measured during April 2022 in Padova, focusing on the temperature- and moisture-related parameters.
Considering the ARPAV records as reference, good correspondence was registered with the data series of temperature, RH, and precipitation measured by the weather station integrated in the apparatus and installed at the pilot site. Some slight differences need to be reported, though. The project’s own weather station sometimes records higher temperature minima and lower RH maxima. These might be dependent on the different resolutions of the two datasets or the microenvironment where the measurements are taken. The continuation of the research and longer time series will reveal if that deviation is constant. In that case, the damage models used in heritage studies would need to be fine-tuned when dealing with, for example, freeze–thaw deterioration, condensation phenomena, RH stability ranges, quantification of the time of wetness, etc.
On the other hand, when comparing the ARPAV records with the data of surface temperature and moisture measured on the stone and wood samples exposed, the differences are striking.
The surface temperature maxima of the materials reach ~50 °C, whereas the air temperature is ~20 °C in the same sampling period. The large deviation between the two datasets is constant all through the month of observation, and is explained by the specific physical properties of the exposed materials and their cardinal orientation. Figure 5a compares the surface temperature trends of two south-exposed stone materials: a black sandstone (Lartios) and a white marble (Macael). Both have maxima consistently much higher than air temperature, but the dark-colored stone’s maxima are systematically ~2 to 4 °C higher than the light-colored’s. Figure 5b shows the surface temperature trends measured on the same material (Lartios stone) but at different exposures, i.e., facing south and north: the south-exposed samples record temperature up to ~15 °C higher than the values obtained at north. In general, the temperature variations among different orientations, different materials, and between them and the air become smaller when solar radiation decreases due to cloud cover.
With regard to the humidity and moisture data, Figure 6 shows a comparison between the RH and precipitation values published by the ARPAV and the surface moisture signals indicating the wetness events. These refer to the same wood sample, but from different areas, i.e., from the unfinished surface and the finished surface treated with the oil paint. The unfinished surface of the wood virtually gets wet every time a rain event occurs. On the other hand, the finished surface records longer times of wetness: the paint creates a water-repellent barrier, so that the inner layers of the wood absorb only a negligible amount of rainwater, which remains longer on the surface instead. For that reason, the sensor signals indicate a wet surface even during short wetting events, e.g., during the early hours of the day, when water vapor may condense on the surfaces more frequently.
Establishing a direct correlation between the results of these field exposure tests and observations on the weathering of the actual component materials of historical buildings and their microclimate context is also part of the project. The classification of stone and wood materials in the pilot sites (i.e., the Clock Tower in Venice and the Bentegården, Fadum storehouse, Heierstad loft, and the Western Tower in Tønsberg) has been carried out and their deterioration categorized, mapped, or predicted from future climate-change scenarios (e.g., [13]). Moreover, autonomous, power-efficient, and NB-IoT-connected climate monitoring devices were designed and installed in the same sites, recording data on air temperature, RH, dew point, and dry–wet cycles in proximity to different external and internal walls [14]. Longer monitoring periods will add further elements to a comprehensive perspective on the interaction between cultural heritage, deterioration processes, environmental setting, and its variability. Combining this information with finite-element analyses applied on 3D models and digital twins of historical structures may support future conservation programs and targeted measures of protection and prevention [15].

4. Conclusions

Since the early field-testing stage, the datasets acquired by the monitoring apparatus have already provided interesting insights into the possibly systematic variances noticeable when comparing different scales of observation of climate. They also highlight the different responses of the different materials to the microclimate fluctuations, which can be traced back to the specific thermal properties, surface color, texture, etc. These deviations from the simplified theoretical behavior, if confirmed in the research’s continuation, might encourage the correction of the existing damage functions and models or the formulation of new ones.
That might support more reliable vulnerability predictions and risk assessments to be implemented in the activities and decision-making protocols of the stakeholders involved in the protection and conservation of cultural heritage. In fact, in the framework of the Hyperion project, the integration among environmental and structural analysis and monitoring of heritage sites, assessment of material properties and damage, historical and projected data series, and simulations under a so-called holistic resilience assessment platform is expected to increase public awareness and participation of communities [16].
The scope of this paper is to introduce the complex phase of design and creation of the monitoring apparatus and the development of the field exposure tests. The data presented here are illustrative and prove that the system is up and running. However, the experimentation will not stop, and the monitoring campaign will continue in the following years, in order to get information on a time span as long as possible.
Further laboratory investigations are also planned. The exposed samples will be periodically removed from the stands at regular intervals and analyzed in the laboratory to monitor changes in surface recession, topography, chemical composition, and color, always applying the same techniques. This approach will help in quantifying the kinetics and trends of deterioration of all the building materials investigated (and possibly of other similar historical materials too), constrained by their properties and microenvironmental context.

Author Contributions

Conceptualization, L.M. and C.M.; methodology, L.G., C.C. and C.M.; software, N.P.; validation, L.G., G.G., N.P. and C.M.; formal analysis, L.G.; investigation, L.G., G.G., N.P., J.S. and C.M.; resources, J.S. and C.M.; data curation, L.G. and N.P.; writing—original draft preparation, L.G.; writing—review and editing, L.G., C.C., L.M., R.S. and C.M.; visualization, L.G.; supervision, C.M.; project administration, C.M.; funding acquisition, C.M. All authors have read and agreed to the published version of the manuscript.

Funding

The Hyperion project has received funding from the European Union’s Horizon 2020 research and innovation program under grant agreement 821054.

Institutional Review Board Statement

Not applicable.

Informed Consent Statement

Not applicable.

Data Availability Statement

The data presented in this study are available on request from the corresponding author.

Acknowledgments

The authors thank Fondazione Musei Civici di Venezia, Giuseppe Cultrone (University of Granada), Nordexplò s.r.l., Ruggero Munarin (Comune di Venezia), SapiSelco s.r.l., Sotiris Patatoukos (Ephorate of Antiquities of the Dodecanese), and Stefano Castelli (University of Padova) for kindly supporting the research implementation.

Conflicts of Interest

The authors declare no conflict of interest.

References

  1. Sabbioni, C.; Brimblecombe, P.; Cassar, M. The Atlas of Climate Change Impact on European Cultural Heritage; Anthem Press: London, UK, 2010. [Google Scholar]
  2. Sardella, A.; Palazzi, E.; von Hardenberg, J.; del Grande, C.; de Nuntiis, P.; Sabbioni, C.; Bonazza, A. Risk mapping for the sustainable protection of cultural heritage in extreme changing environments. Atmosphere 2020, 11, 700. [Google Scholar] [CrossRef]
  3. Germinario, L.; Andriani, G.F.; Laviano, R. Decay of calcareous building stone under the combined action of thermoclastism and cryoclastism: A laboratory simulation. Constr. Build. Mater. 2015, 75, 385–394. [Google Scholar] [CrossRef]
  4. Salvini, S.; Bertoncello, R.; Coletti, C.; Germinario, L.; Maritan, L.; Massironi, M.; Pozzobon, R.; Mazzoli, C. Recession rate of carbonate rocks used in cultural heritage: Textural control assessed by accelerated ageing tests. J. Cult. Herit. 2022, 57, 154–164. [Google Scholar] [CrossRef]
  5. Ghedini, N.; Ozga, I.; Bonazza, A.; Dilillo, M.; Cachier, H.; Sabbioni, C. Atmospheric aerosol monitoring as a strategy for the preventive conservation of urban monumental heritage: The Florence Baptistery. Atmos. Environ. 2011, 45, 5979–5987. [Google Scholar] [CrossRef]
  6. Roots, O.O.; Roose, A.; Eerme, K. Remote sensing of climate change, long-term monitoring of air pollution and stone material corrosion in Estonia. Int. J. Remote Sens. 2011, 32, 9691–9705. [Google Scholar] [CrossRef]
  7. Daly, C. The design of a legacy indicator tool for measuring climate change related impacts on built heritage. Herit. Sci. 2016, 4, 19. [Google Scholar] [CrossRef] [Green Version]
  8. Haugen, A.; Bertolin, C.; Leijonhufvud, G.; Olstad, T.; Broström, T. A methodology for long-term monitoring of climate change impacts on historic buildings. Geosciences 2018, 8, 370. [Google Scholar] [CrossRef] [Green Version]
  9. Kessler, D.W.; Anderson, R.E. Stone Exposure Test Wall; Building Materials and Structures Report 125; United States Department of Commerce: Washington, DC, USA, 1951. [Google Scholar]
  10. Bonazza, A.; Messina, P.; Sabbioni, C.; Grossi, C.M.; Brimblecombe, P. Mapping the impact of climate change on surface recession of carbonate buildings in Europe. Sci. Total Environ. 2009, 407, 2039–2050. [Google Scholar] [CrossRef] [PubMed]
  11. ARPAV. Agenzia Regionale Prevenzione Protezione Ambientale Veneto. Available online: https://www.arpa.veneto.it (accessed on 22 June 2022).
  12. Norsk Klimaservicesenter. Norwegian Center for Climate Services. Available online: https://klimaservicesenter.no (accessed on 22 June 2022).
  13. Choidis, P.; Kraniotis, D.; Lehtonen, I.; Hellum, B. A modelling approach for the assessment of climate change impact on the fungal colonization of historic timber structures. Forests 2021, 12, 819. [Google Scholar] [CrossRef]
  14. Mitro, N.; Krommyda, M.; Amditis, A. Smart Tags: IoT sensors for monitoring the micro-climate of cultural heritage monuments. Appl. Sci. 2022, 12, 2315. [Google Scholar] [CrossRef]
  15. Shabani, A.; Skamantzari, M.; Tapinaki, S.; Georgopoulos, A.; Plevris, V.; Kioumarsi, M. 3D simulation models for developing digital twins of heritage structures: Challenges and strategies. Procedia Struct. Integr. 2022, 37, 314–320. [Google Scholar] [CrossRef]
  16. Hyperion. Hyperion Project. Available online: https://www.hyperion-project.eu (accessed on 18 September 2022).
Figure 1. The stone materials selected (the short side of each photo is 4 cm).
Heritage 05 00165 g001
Figure 2. The surface sensors mounted on the samples.
Heritage 05 00165 g002
Figure 3. The control unit box with the electronics.
Heritage 05 00165 g003
Figure 4. The monitoring apparatus installed in Padova.
Heritage 05 00165 g004
Figure 5. Air temperature (gray range with maxima in light red and minima in blue) vs. stone surface temperature, measured in the pilot site of Padova in April 2022; (a) trends of two different materials (dark red: Lartios stone; orange: Macael marble); (b) the same material (Lartios stone) at different orientations (dark gray: N exposure; green: S exposure).
Heritage 05 00165 g005
Figure 6. RH (gray area with maxima in dark blue and minima in light blue), daily precipitation r (purple), and surface moisture of a spruce sample (orange bars), with (a) unfinished and (b) finished surface, measured in the pilot site of Padova in April 2022. NB: the moisture data are dimensionless and binary; the bar indicates every time the material surface is wet.
Heritage 05 00165 g006
Publisher’s Note: MDPI stays neutral with regard to jurisdictional claims in published maps and institutional affiliations.

