
Urban Morphometrics and the Intangible Uniqueness of Tangible Heritage. An Evidence-Based Generative Design Experiment in Historical Kochi (IN)

 ,
, 
 ,
,  ,
,  ,
, 
Abstract
:1. Introduction
2. Methodology
2.1. Morphometric Taxonomy and Profiling of Urban Types
2.2. From Morphometric Profile to Figure-Grounds
- Selection of the sample site. This is usually a brownfield, or an area designated by local authorities as developable, within specified design constraints to be integrated in this workflow. The iterative testing carried out by the UNICITI designers showed that the method works well at the meso-scale, that is, an area comprising a few blocks (at least 100 buildings), considering smaller areas would mean that intervals with small distribution percentages would not be represented. Having selected the site, this step requires the computation of its area (A) in m2.
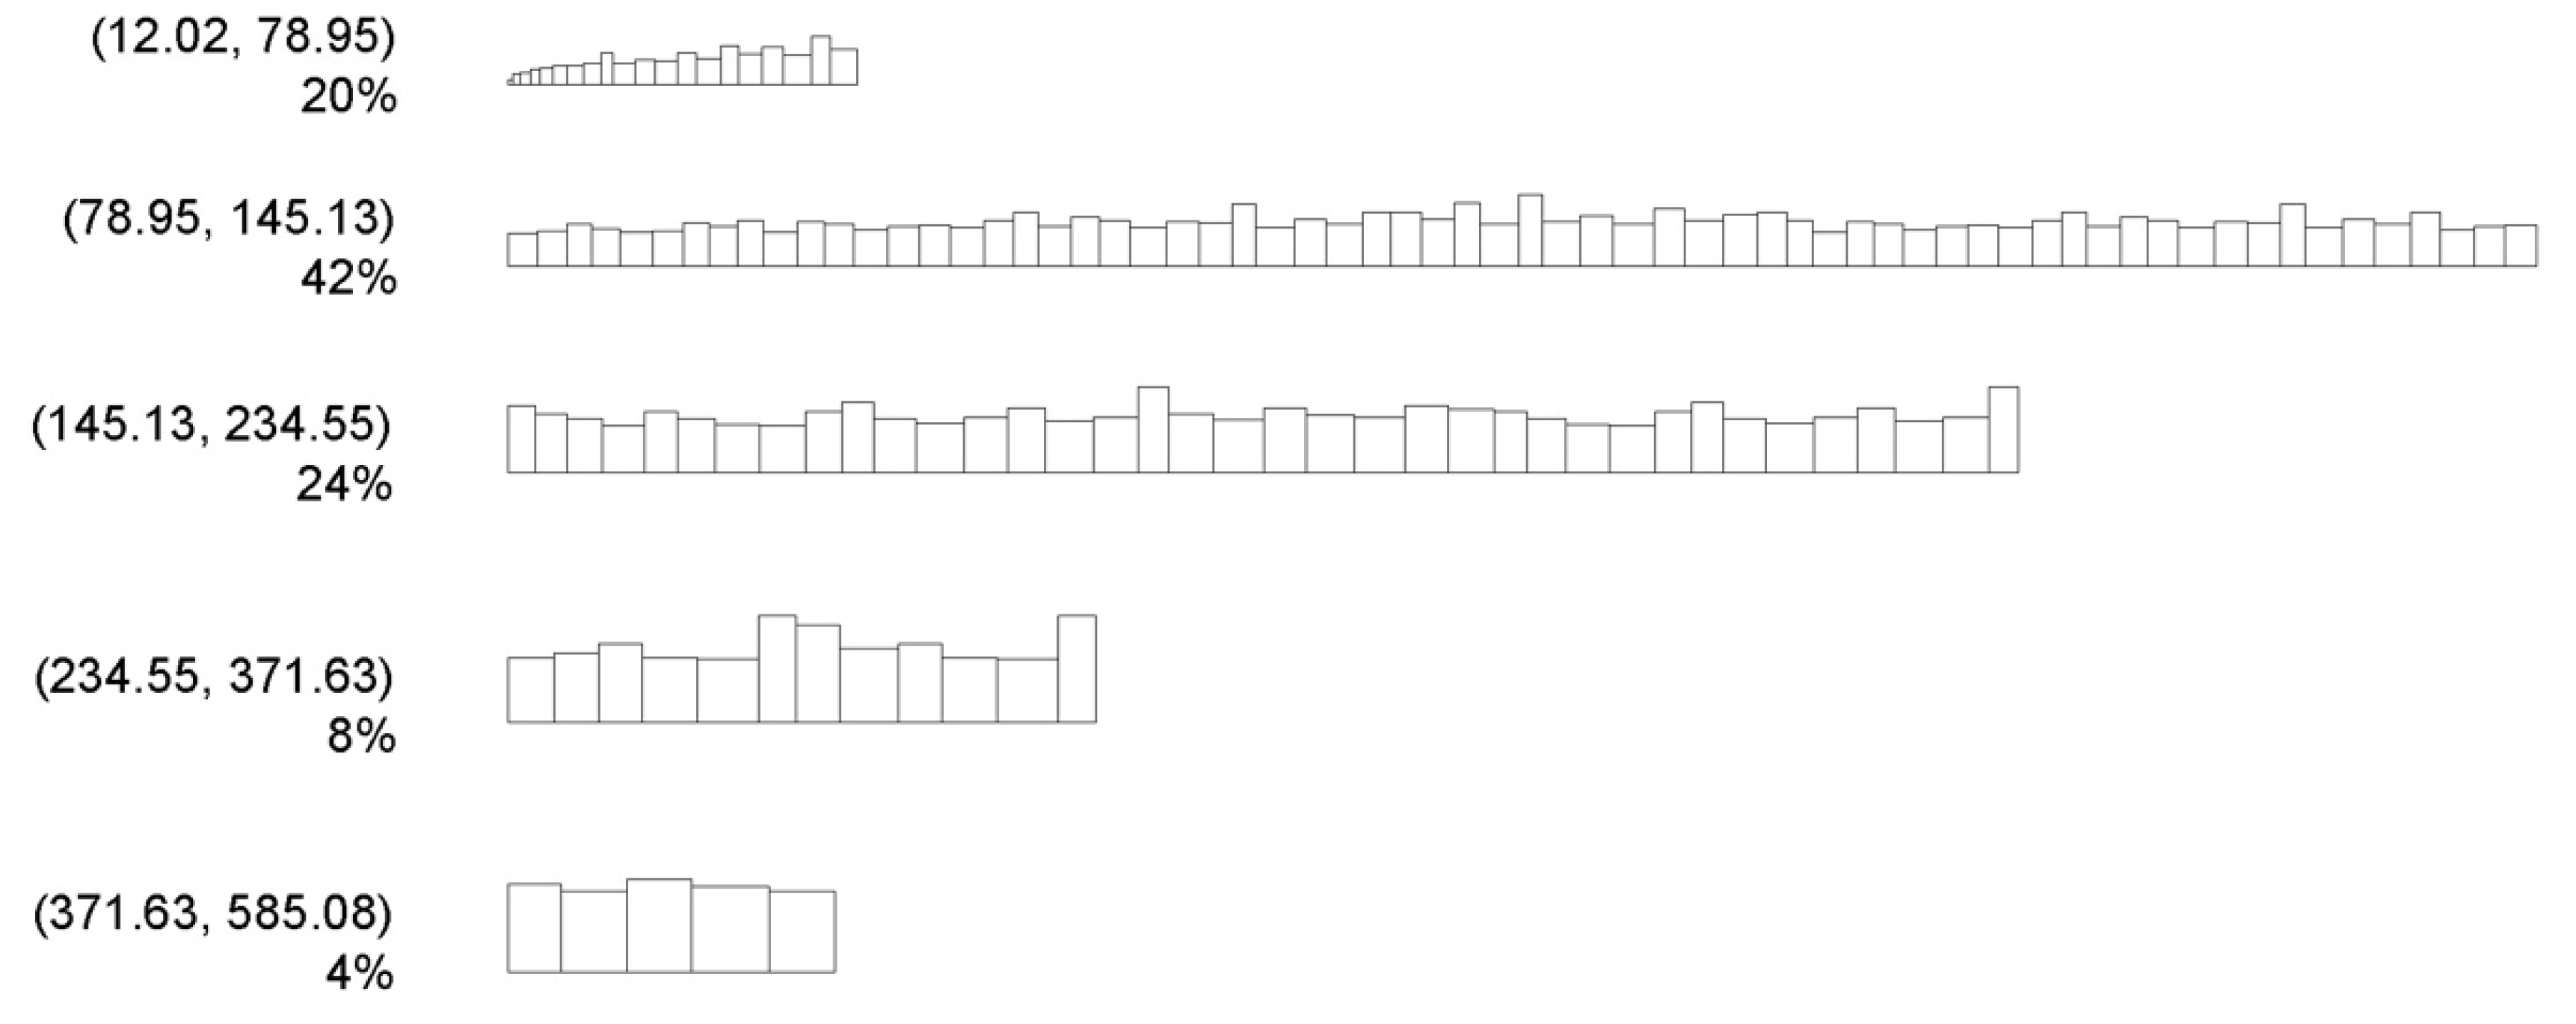
- Computation of number of buildings (for the sample site and intervals of the six primary characters). Using the cell area (CA) intervals and distribution in the morphometric profile, the total cell areas per interval (TCA) is calculated by multiplying the median value of each interval (M) by the corresponding distribution percentage. The total number of buildings for the sample site is computed by multiplying the site area (A) by 100 (the total of all intervals) and dividing this value by the sum of TCAs. The number of buildings in each interval, for each primary character, is computed by multiplying the distribution percentages for each interval by N and dividing this value by 100.
- Generation of the building envelopes. To avoid uniformity in figure-grounds, a random set of x values, where x is the number of buildings in each interval computed at the previous step, is generated for each interval for BF and BE. The generated building footprints and elongation values are then randomly matched. Both operations of random number generation can be achieved in Excel via the RAND function, or through ad hoc websites (for example, https://pinetools.com/random-number-generator, accessed on 31 August 2021). The longer dimension (LD) of each building is computed by calculating the square root of the ratio between BF and BE. The shorter dimension (SD) is calculated by dividing BF by LD.
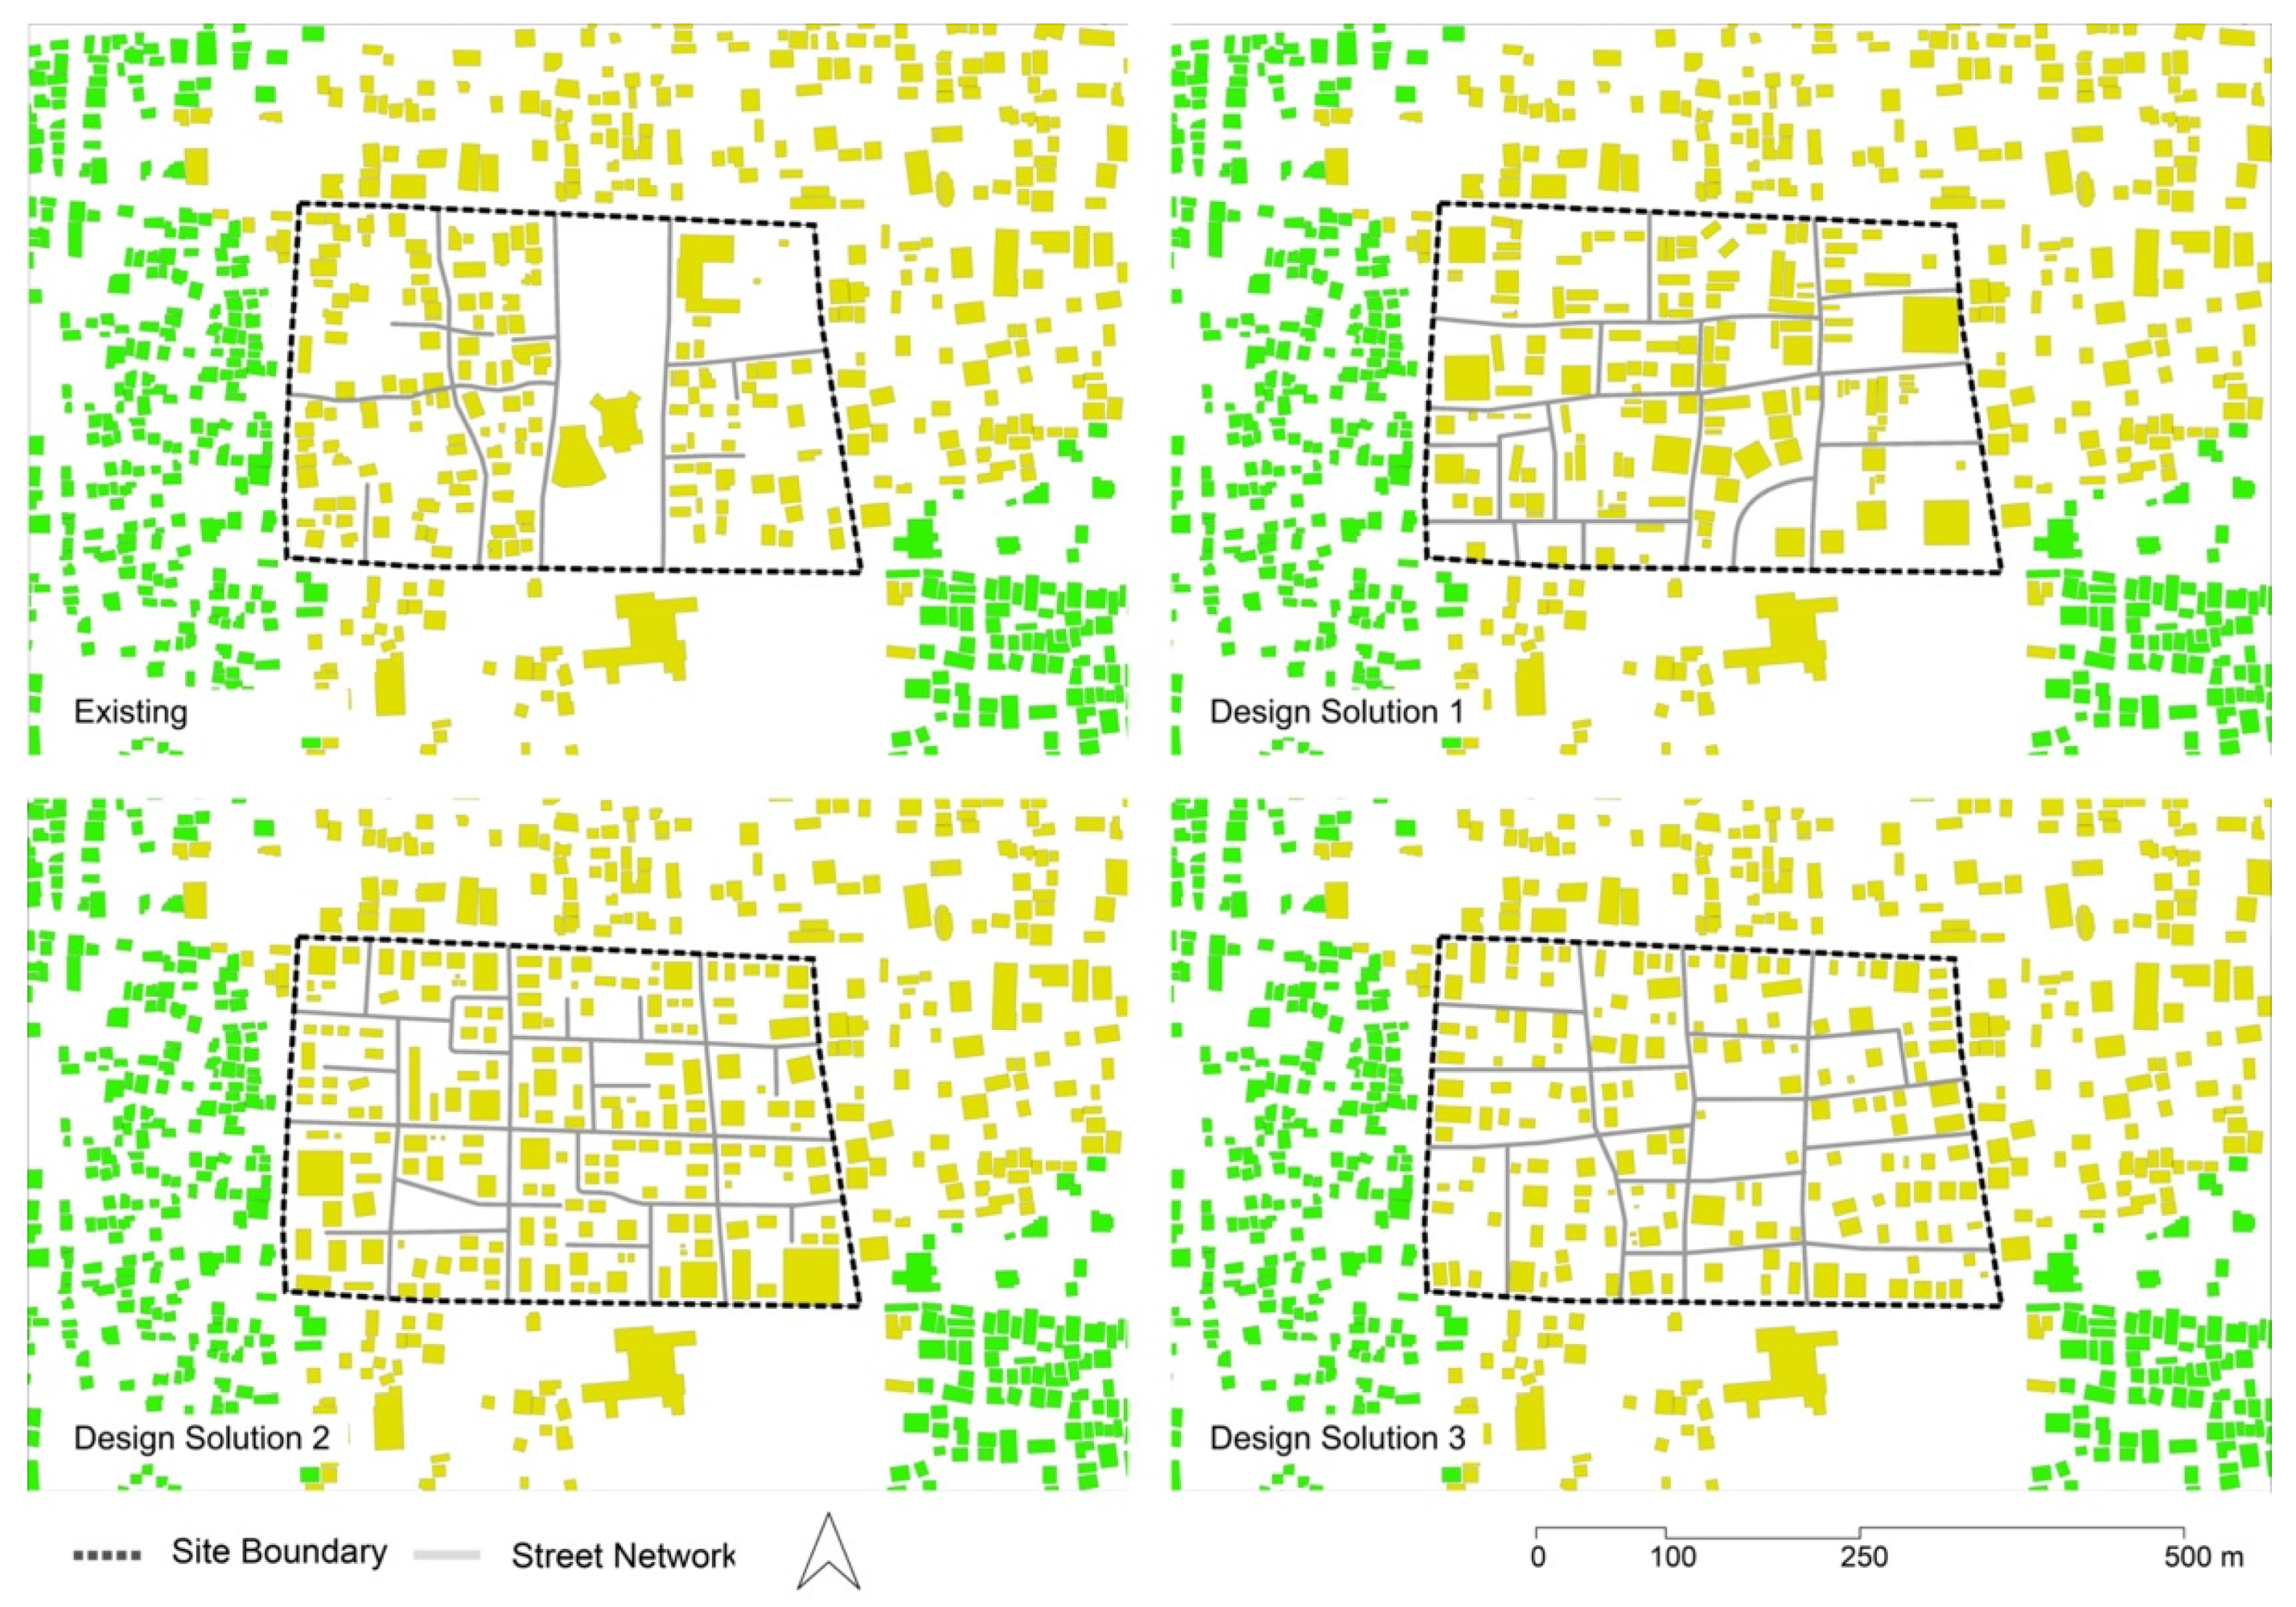
- Design considerations. Several considerations must be made on the UT around the sample site before laying the buildings on the ground: (i) function and spatial distribution of buildings (i.e., clustered or sparse) and their relations with open spaces; (ii) whether buildings tend to abut on the streets with their short or long sides; (iii) whether the street network tends more to a grid or a tree-like structure. Such considerations are purely qualitative and are made from remote via a quick visual inspection of commonly available map repositories.
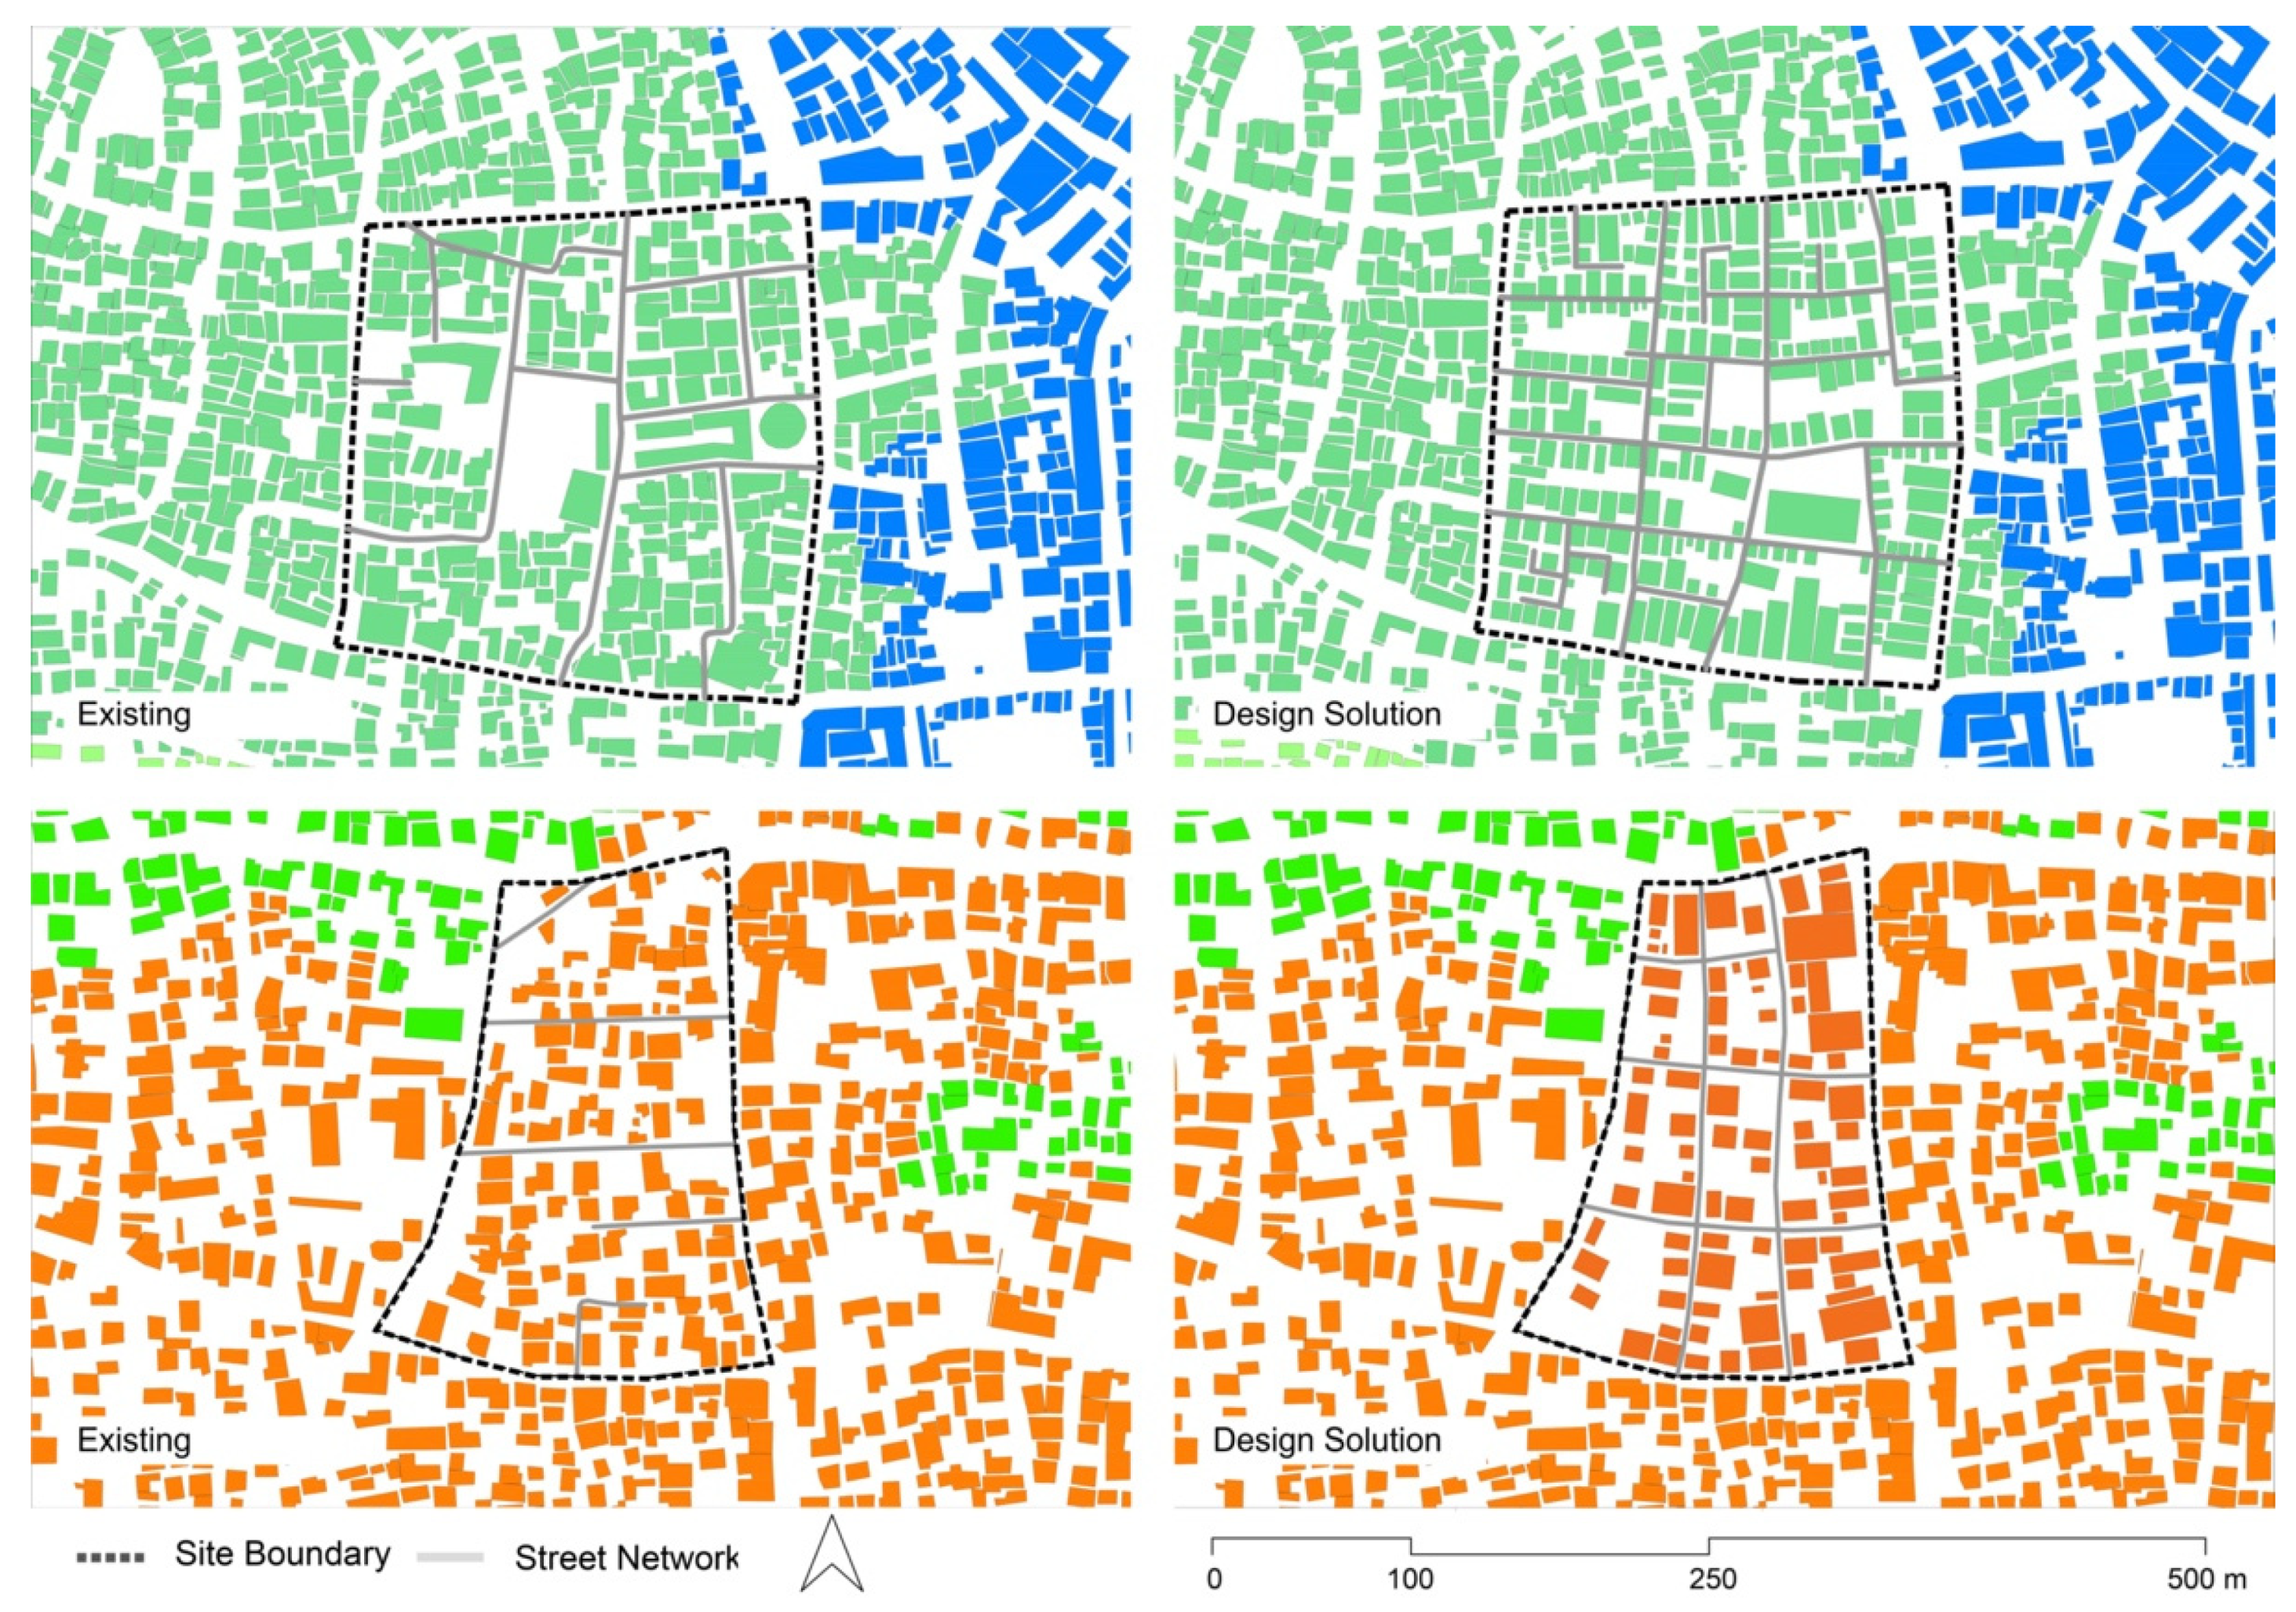
- Generation of the figure-ground. This is a four step process: (i) in order to maintain and foster the internal connectivity of the sample site as well as that between the sample site and its surroundings, lay down the main street network by continuing the major roads surrounding the site; (ii) start distributing the building envelopes from one side of the site by following the considerations formulated at the previous point; (iii) if necessary, add secondary streets to make each building in the site accessible; (iv) verify whether alignments and distances between buildings correspond to the values of ASB and MDBB.
3. Kochi
4. Dataset, Primary, and Contextual Characters
5. Results
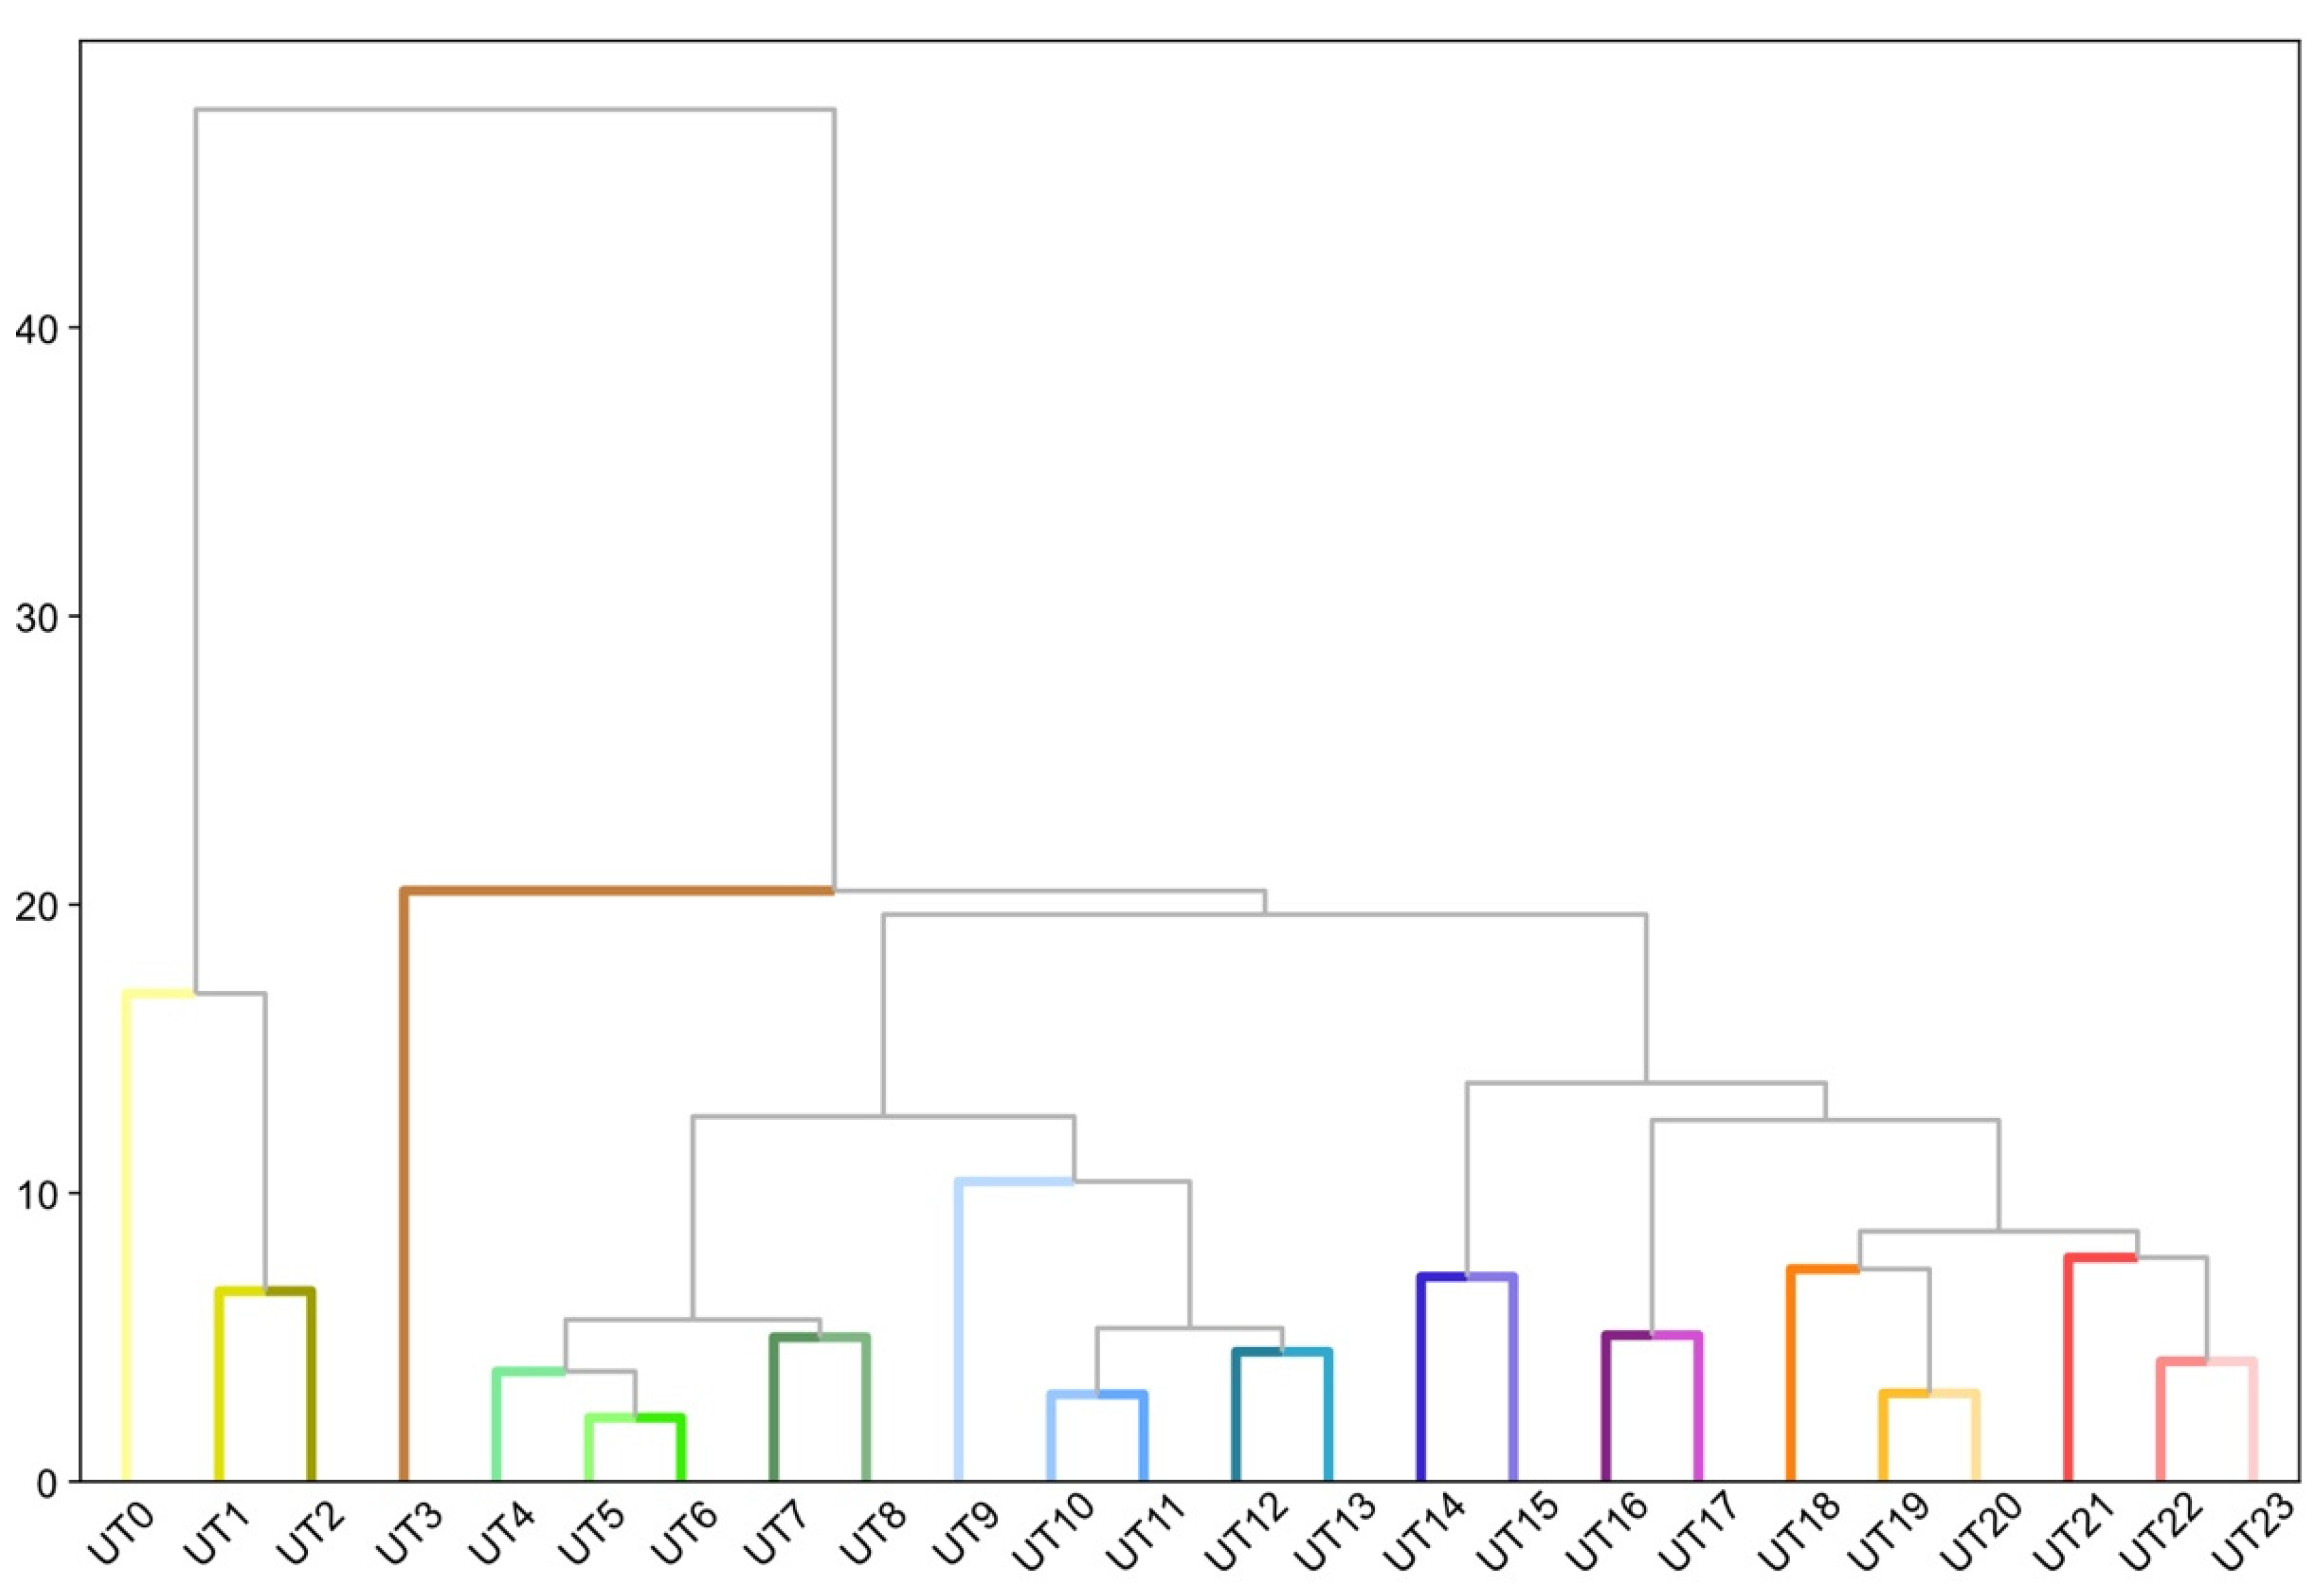
5.1. The Morphometric Taxonomy of Kochi
5.2. Morphometric Profiles of Urban Types in the Historical District of Kochi
5.3. Producing Figure-Grounds in Sample Sites
6. Discussion
7. Conclusions
Author Contributions
Funding
Conflicts of Interest
Appendix A

| Primary Character | Element | Formula | Contextual Character | Median |
|---|---|---|---|---|
| Footprint | Building | ablg | mean | 124.1678 |
| range | 93.3752 | |||
| Theil index | 0.0868 | |||
| Simpson index | 0.4644 | |||
| Perimeter | Building | pblg | mean | 46.1862 |
| range | 18.5704 | |||
| Theil index | 0.0251 | |||
| Simpson index | 0.4094 | |||
| Courtyard area | Building | ablgc | mean | 0.0000 |
| range | 0.0000 | |||
| Theil index | 0.0000 | |||
| Simpson index | 1.0000 | |||
| Cardinal orientation | Building | Oriblg = |OblgB − 45| | mean | 12.2051 |
| range | 6.4277 | |||
| Theil index | 0.0489 | |||
| Simpson index | 0.2978 | |||
| Cell alignment | Building | mean | 6.4250 | |
| range | 9.7176 | |||
| Theil index | 0.2585 | |||
| Simpson index | 0.5192 | |||
| Circular compactness | Building | mean | 0.5561 | |
| range | 0.0996 | |||
| Theil index | 0.0049 | |||
| Simpson index | 0.2056 | |||
| Corners | Building | mean | 4.0000 | |
| range | 0.5000 | |||
| Theil index | 0.0171 | |||
| Simpson index | 0.5946 | |||
| Squareness | Building | mean | 3.3104 | |
| range | 3.4466 | |||
| Theil index | 0.1722 | |||
| Simpson index | 0.6333 | |||
| Equivalent rectangular index | Building | mean | 0.9959 | |
| range | 0.0168 | |||
| Theil index | 0.0003 | |||
| Simpson index | 0.6307 | |||
| Elongation | Building | mean | 0.7162 | |
| range | 0.2668 | |||
| Theil index | 0.0180 | |||
| Simpson index | 0.1834 | |||
| Centroid-corner distance deviation | Building | mean | 0.2971 | |
| range | 0.6086 | |||
| Theil index | 0.4551 | |||
| Simpson index | 0.5749 | |||
| Centroid-corner mean distance | Building | mean | 7.9237 | |
| range | 2.9362 | |||
| Theil index | 0.0207 | |||
| Simpson index | 0.3981 | |||
| Area | Cell | acell | mean | 457.3075 |
| range | 403.0552 | |||
| Theil index | 0.1043 | |||
| Simpson index | 0.7593 | |||
| Cardinal orientation | Cell | mean | 15.8594 | |
| range | 13.9275 | |||
| Theil index | 0.1125 | |||
| Simpson index | 0.2255 | |||
| Weighted neighbours | Cell | mean | 0.0685 | |
| range | 0.0254 | |||
| Theil index | 0.0179 | |||
| Simpson index | 0.4150 | |||
| Coverage ratio | Cell | mean | 0.3127 | |
| range | 0.1811 | |||
| Theil index | 0.0464 | |||
| Simpson index | 0.2180 | |||
| Circular compactness | Cell | mean | 0.5232 | |
| range | 0.1452 | |||
| Theil index | 0.0104 | |||
| Simpson index | 0.1742 | |||
| Equivalent rectangular index | Cell | mean | 0.9890 | |
| range | 0.0660 | |||
| Theil index | 0.0006 | |||
| Simpson index | 0.4214 | |||
| Perimeter wall length | Adjacent buildings | mean | 47.1169 | |
| range | 19.6771 | |||
| Theil index | 0.0283 | |||
| Simpson index | 0.4360 | |||
| Shared walls’ ratio | Adjacent buildings | mean | 0.0000 | |
| range | 0.0000 | |||
| Theil index | 2.0809 | |||
| Simpson index | 1.0000 | |||
| Number of courtyards | Adjacent buildings | mean | 0.0000 | |
| range | 0.0000 | |||
| Theil index | 0.0000 | |||
| Simpson index | 1.0000 | |||
| Alignment | Neighbouring buildings | mean | 4.0671 | |
| range | 2.6006 | |||
| Theil index | 0.0541 | |||
| Simpson index | 0.5052 | |||
| Mean distance | Neighbouring buildings | mean | 9.3790 | |
| range | 7.0551 | |||
| Theil index | 0.0729 | |||
| Simpson index | 0.6777 | |||
| Mean inter-building distance | Neighbouring buildings | mean | 11.1417 | |
| range | 2.5860 | |||
| Theil index | 0.0074 | |||
| Simpson index | 1.0000 | |||
| Building adjacency | Neighbouring buildings | mean | 1.0000 | |
| range | 0.0000 | |||
| Theil index | 0.0000 | |||
| Simpson index | 0.6859 | |||
| Area covered | Neighbouring cells | mean | 3917.0594 | |
| range | 2540.8757 | |||
| Theil index | 0.0556 | |||
| Simpson index | 0.7752 |
Appendix B
| CA Intervals | % Cells | CR Intervals | % Cells | BF Intervals | % Buildings | BE Intervals | % Buildings | ASB Intervals | % Buildings | MDBB Intervals | % Buildings |
|---|---|---|---|---|---|---|---|---|---|---|---|
| (24.60, 336.09) | 29.70 | (0.01, 0.06) | 1.26 | (12.02, 78.95) | 20.15 | (0.07, 0.20) | 0.59 | (0.00, 1.43) | 40.59 | (0.82, 3.67) | 4.30 |
| (336.09, 650.88) | 36.59 | (0.06, 0.11) | 5.63 | (78.95, 145.13) | 42.00 | (0.20, 0.31) | 1.93 | (1.43, 2.31) | 20.59 | (3.67, 5.95) | 12.81 |
| (650.88, 1080.39) | 20.22 | (0.11, 0.16) | 11.63 | (145.13, 234.55) | 24.07 | (0.31, 0.39) | 3.78 | (2.31, 3.12) | 12.07 | (5.95, 8.33) | 17.04 |
| (1080.39, 1677.60) | 9.33 | (0.16, 0.20) | 12.30 | (234.55, 371.63) | 8.30 | (0.39, 0.46) | 5.33 | (3.12, 3.95) | 8.15 | (8.33, 10.96) | 17.85 |
| (1677.60, 2515.36) | 2.89 | (0.20, 0.25) | 10.89 | (371.63, 585.08) | 3.56 | (0.46, 0.52) | 5.33 | (3.95, 4.83) | 5.70 | (10.96, 13.91) | 17.11 |
| (2515.36, 3689.55) | 0.59 | (0.25, 0.29) | 12.37 | (585.08, 910.02) | 0.59 | (0.52, 0.57) | 8.52 | (4.83, 5.78) | 4.74 | (13.91, 17.34) | 10.96 |
| (3689.55, 5266.39) | 0.37 | (0.29, 0.33) | 11.70 | (910.02, 1430.61) | 0.81 | (0.57, 0.62) | 6.59 | (5.78, 6.84) | 2.44 | (17.34, 21.52) | 9.56 |
| (5266.39, 7385.03) | 0.07 | (0.33, 0.38) | 9.56 | (1430.61, 2212.47) | 0.30 | (0.62, 0.66) | 6.81 | (6.84, 8.06) | 1.93 | (21.52, 26.72) | 6.59 |
| (7385.03, 10,282.65) | 0.07 | (0.38, 0.42) | 8.74 | (2212.47, 3423.68) | 0.07 | (0.66, 0.71) | 7.11 | (8.06, 9.53) | 1.41 | (26.72, 33.26) | 2.30 |
| (10,282.65, 14,106.60) | 0.00 | (0.42, 0.47) | 5.85 | (3423.68, 5308.78) | 0.07 | (0.71, 0.75) | 8.37 | (9.53, 11.39) | 0.89 | (33.26, 41.53) | 1.04 |
| (14,106.60, 19,523.60) | 0.15 | (0.47, 0.51) | 4.00 | (5308.78, 7792.22) | 0.07 | (0.75, 0.80) | 7.63 | (11.39, 13.81) | 0.59 | (41.53, 52.31) | 0.30 |
| (19,523.60, 26,922.44) | 0.00 | (0.51, 0.56) | 3.48 | (7792.22, 10,715.89) | 0.00 | (0.80, 0.85) | 7.56 | (13.81, 17.03) | 0.37 | (52.31, 67.13) | 0.07 |
| (26,922.4, 35,608.03) | 0.00 | (0.56, 0.63) | 1.56 | (10,715.8, 14,611.60) | 0.00 | (0.85, 0.90) | 9.85 | (17.03, 21.37) | 0.22 | (67.13, 87.98) | 0.07 |
| (35,608.0, 48,659.49) | 0.00 | (0.63, 0.71) | 0.89 | (14,611.6, 26,037.39) | 0.00 | (0.90, 0.95) | 10.07 | (21.37, 27.66) | 0.15 | (87.98, 118.10) | 0.00 |
| (48,659.4, 67,909.16) | 0.00 | (0.71, 1.34) | 0.15 | (26,037.3, 34,898.16) | 0.00 | (0.95, 1.00) | 10.52 | (27.66, 40.37) | 0.15 | (118.10, 199.79) | 0.00 |
| CA Intervals | % Cells | CR Intervals | % Cells | BF Intervals | % Buildings | BE Intervals | % Buildings | ASB Intervals | % Buildings | MDBB Intervals | % Buildings |
|---|---|---|---|---|---|---|---|---|---|---|---|
| (24.60, 336.09) | 89.54 | (0.02, 0.06) | 0.45 | (12.02, 78.95) | 61.39 | (0.09, 0.20) | 0.76 | (0.27, 1.43) | 8.46 | (0.11, 3.67) | 45.90 |
| (336.09, 650.88) | 9.14 | (0.06, 0.11) | 1.36 | (78.95, 145.13) | 29.35 | (0.20, 0.31) | 2.64 | (1.43, 2.31) | 19.38 | (3.67, 5.95) | 27.01 |
| (650.88, 1080.39) | 0.91 | (0.11, 0.16) | 2.38 | (145.13, 234.55) | 7.03 | (0.31, 0.39) | 5.89 | (2.31, 3.12) | 18.47 | (5.95, 8.33) | 15.49 |
| (1080.39, 1677.60) | 0.26 | (0.16, 0.20) | 3.48 | (234.55, 371.63) | 1.51 | (0.39, 0.46) | 7.67 | (3.12, 3.95) | 15.64 | (8.33, 10.96) | 6.35 |
| (1677.60, 2515.36) | 0.11 | (0.20, 0.25) | 4.38 | (371.63, 585.08) | 0.45 | (0.46, 0.52) | 7.40 | (3.95, 4.83) | 10.43 | (10.96, 13.91) | 3.02 |
| (2515.36, 3689.55) | 0.04 | (0.25, 0.29) | 6.16 | (585.08, 910.02) | 0.19 | (0.52, 0.57) | 7.67 | (4.83, 5.78) | 8.08 | (13.91, 17.34) | 1.32 |
| (3689.55, 5266.39) | 0.00 | (0.29, 0.33) | 7.22 | (910.02, 1430.61) | 0.08 | (0.57, 0.62) | 7.74 | (5.78, 6.84) | 6.23 | (17.34, 21.52) | 0.76 |
| (5266.39, 7385.03) | 0.00 | (0.33, 0.38) | 7.44 | (1430.61, 2212.47) | 0.00 | (0.62, 0.66) | 8.88 | (6.84, 8.06) | 4.57 | (21.52, 26.72) | 0.11 |
| (7385.03, 10,282.65) | 0.00 | (0.38, 0.42) | 10.09 | (2212.47, 3423.68) | 0.00 | (0.66, 0.71) | 7.78 | (8.06, 9.53) | 3.97 | (26.72, 33.26) | 0.04 |
| (10,282.6, 14,106.60) | 0.00 | (0.42, 0.47) | 10.05 | (3423.68, 5308.78) | 0.00 | (0.71, 0.75) | 7.56 | (9.53, 11.39) | 2.61 | (33.26, 41.53) | 0.00 |
| (14,106.6, 19,523.60) | 0.00 | (0.47, 0.51) | 10.80 | (5308.78, 7792.22) | 0.00 | (0.75, 0.80) | 6.91 | (11.39, 13.81) | 0.94 | (41.53, 52.31) | 0.00 |
| (19,523.6, 26,922.44) | 0.00 | (0.51, 0.56) | 11.41 | (7792.22, 10,715.89) | 0.00 | (0.80, 0.85) | 6.72 | (13.81, 17.03) | 0.72 | (52.31, 67.13) | 0.00 |
| (26,922.4, 35,608.03) | 0.00 | (0.56, 0.63) | 12.05 | (10,715.8, 14,611.60) | 0.00 | (0.85, 0.90) | 8.20 | (17.03, 21.37) | 0.23 | (67.13, 87.98) | 0.00 |
| (35,608.0, 48,659.49) | 0.00 | (0.63, 0.71) | 9.52 | (14,611.6, 26,037.39) | 0.00 | (0.90, 0.95) | 7.40 | (21.37, 27.66) | 0.19 | (87.98, 118.10) | 0.00 |
| (48,659.4, 67,909.16) | 0.00 | (0.71, 1.34) | 3.21 | (26,037.3, 34,898.16) | 0.00 | (0.95, 1.00) | 6.76 | (27.66, 40.37) | 0.08 | (118.10, 199.79) | 0.00 |
| CA Intervals | % Cells | CR Intervals | % Cells | BF Intervals | % Buildings | BE Intervals | % Buildings | ASB Intervals | % Buildings | MDBB Intervals | % Buildings |
|---|---|---|---|---|---|---|---|---|---|---|---|
| (41.18, 336.09) | 51.15 | (0.05, 0.06) | 0.27 | (12.02, 78.95) | 27.21 | (0.05, 0.20) | 0.35 | (0.49, 1.43) | 8.57 | (0.80, 3.67) | 12.28 |
| (336.09, 650.88) | 33.66 | (0.06, 0.11) | 1.15 | (78.95, 145.13) | 39.75 | (0.20, 0.31) | 1.06 | (1.43, 2.31) | 20.49 | (3.67, 5.95) | 22.70 |
| (650.88, 1080.39) | 11.66 | (0.11, 0.16) | 2.92 | (145.13, 234.55) | 20.14 | (0.31, 0.39) | 3.89 | (2.31, 3.12) | 20.76 | (5.95, 8.33) | 27.03 |
| (1080.39, 1677.60) | 2.65 | (0.16, 0.20) | 6.45 | (234.55, 371.63) | 9.63 | (0.39, 0.46) | 6.01 | (3.12, 3.95) | 15.72 | (8.33, 10.96) | 18.64 |
| (1677.60, 2515.36) | 0.71 | (0.20, 0.25) | 7.51 | (371.63, 585.08) | 2.56 | (0.46, 0.52) | 7.07 | (3.95, 4.83) | 11.57 | (10.96, 13.91) | 11.57 |
| (2515.36, 3689.55) | 0.09 | (0.25, 0.29) | 9.36 | (585.08, 910.02) | 0.62 | (0.52, 0.57) | 6.80 | (4.83, 5.78) | 6.27 | (13.91, 17.34) | 4.33 |
| (3689.55, 5266.39) | 0.09 | (0.29, 0.33) | 14.84 | (910.02, 1430.61) | 0.09 | (0.57, 0.62) | 6.71 | (5.78, 6.84) | 5.48 | (17.34, 21.52) | 2.03 |
| (5266.39, 7385.03) | 0.00 | (0.33, 0.38) | 14.22 | (1430.61, 2212.47) | 0.00 | (0.62, 0.66) | 8.83 | (6.84, 8.06) | 3.89 | (21.52, 26.72) | 0.97 |
| (7385.03, 10,282.65) | 0.00 | (0.38, 0.42) | 12.54 | (2212.47, 3423.68) | 0.00 | (0.66, 0.71) | 9.10 | (8.06, 9.53) | 3.36 | (26.72, 33.26) | 0.18 |
| (10,282.65, 14,106.60) | 0.00 | (0.42, 0.47) | 11.57 | (3423.68, 5308.78) | 0.00 | (0.71, 0.75) | 9.01 | (9.53, 11.39) | 1.41 | (33.26, 41.53) | 0.09 |
| (14,106.60, 19,523.60) | 0.00 | (0.47, 0.51) | 8.92 | (5308.78, 7792.22) | 0.00 | (0.75, 0.80) | 9.63 | (11.39, 13.81) | 0.71 | (41.53, 52.31) | 0.09 |
| (19,523.60, 26,922.44) | 0.00 | (0.51, 0.56) | 4.59 | (7792.22, 10,715.89) | 0.00 | (0.80, 0.85) | 7.42 | (13.81, 17.03) | 0.62 | (52.31, 67.13) | 0.09 |
| (26,922.44, 35,608.03) | 0.00 | (0.56, 0.63) | 3.18 | (10,715.89, 14,611.60) | 0.00 | (0.85, 0.90) | 8.48 | (17.03, 21.37) | 0.27 | (67.13, 87.98) | 0.00 |
| (35,608.03, 48,659.49) | 0.00 | (0.63, 0.71) | 1.77 | (14,611.60, 26,037.39) | 0.00 | (0.90, 0.95) | 7.69 | (21.37, 27.66) | 0.44 | (87.98, 118.10) | 0.00 |
| (48,659.49, 67,909.16) | 0.00 | (0.71, 1.34) | 0.71 | (26,037.39, 34,898.16) | 0.00 | (0.95, 1.00) | 7.95 | (27.66, 40.37) | 0.44 | (118.10, 199.79) | 0.00 |
References
- 2020 E-Handbook of Statistics. Total and Urban Population. Available online: https://stats.unctad.org/handbook/Population/Total.html (accessed on 31 August 2021).
- United Nations (UN). The Sustainable Development Goals Report 2021; United Nations (UN): New York, NY, USA, 2021; p. 48. [Google Scholar]
- TERI; Development Alternatives; GIZ. Material Consumption Patterns in India: A Baseline Study of the Automotive and Construction Sectors; Deutsche Gesellschaft für Internationale Zusammenarbeit (GIZ): New Delhi, India, 2016. [Google Scholar]
- Global Infrastructure Basel Summit. Available online: https://www.gn-sec.net/news/global-infrastructure-basel-summit (accessed on 31 August 2021).
- Chepelianskaia, O. Why Should Asia Build Unique Cities? In Beyond the Metropolis, Proceedings of the 55th ISOCARP World Planning Congress 2019, Jakarta, Indonesia, 9–13 September 2019; Juvara, M., Ledwon, S., Eds.; ISOCARP: The Hague, The Netherlands, 2019. [Google Scholar]
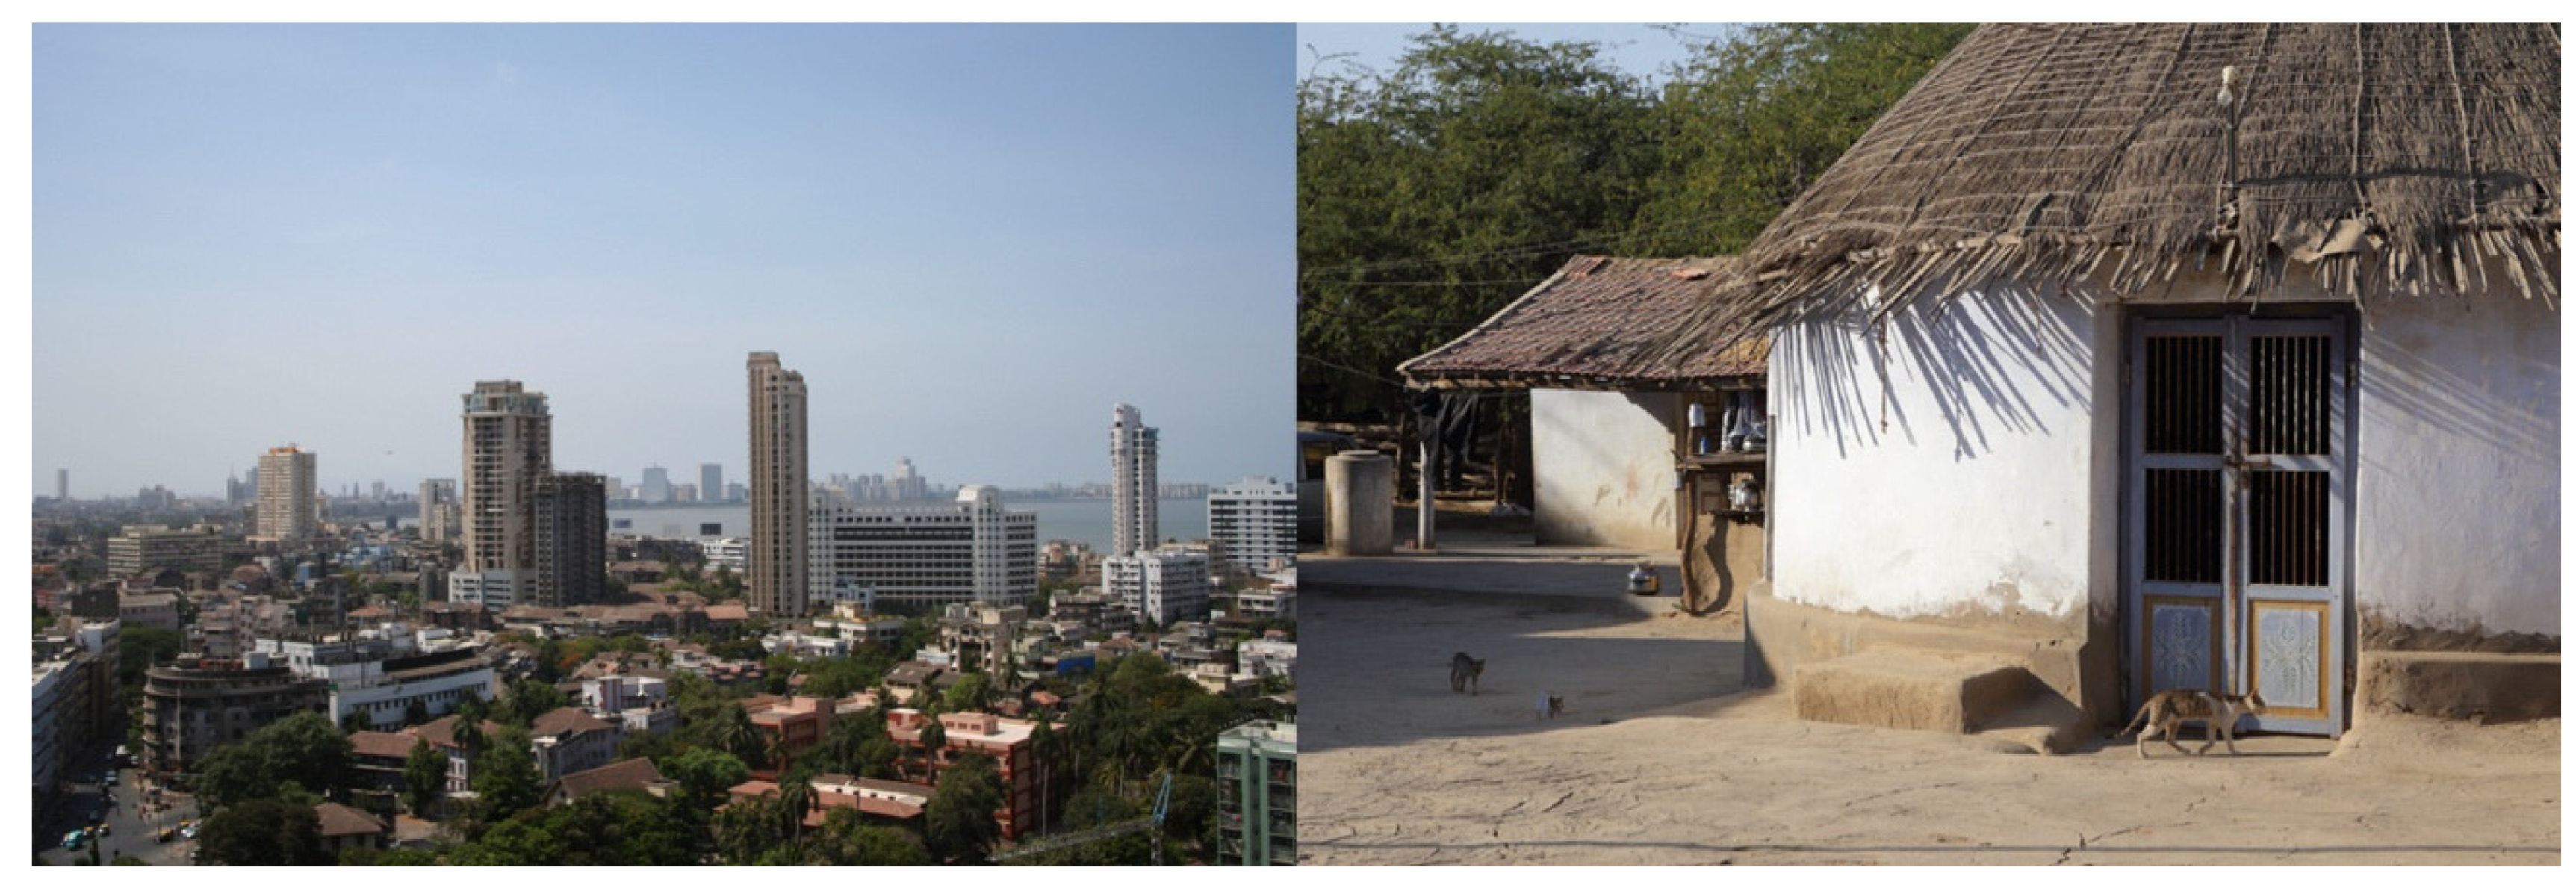
- Downtown from Nana Chowk. Aam422, CC BY-SA 3.0. Available online: https://commons.wikimedia.org/wiki/Mumbai#/media/File:Bombay1.jpg (accessed on 17 November 2021).
- Zaveri, N. Trespassers, Dhordo. CC BY 2.0. Available online: https://flic.kr/p/TZYX22 (accessed on 17 November 2021).
- Christensen, J.M.; Olhoff, A. Emissions Gap Report 2019; United Nations Environment Programme (UNEP): Gigiri Nairobi, Kenya, 2019. [Google Scholar]
- NESEA Blog. The All-Glass Building. Is Energy Efficiency Possible? Available online: https://nesea.org/conversation/masters-blog/all-glass-building (accessed on 31 August 2021).
- The Life Expectancy of Buildings. Available online: https://brandondonnelly.com/2015/09/06/the-life-expectancy-of-buildings/ (accessed on 31 August 2021).
- Clark, G.; Moonen, T.; Couturier, T. Globalisation and Competition: The New World of Cities; Cities Research Center: Chicaco, IL, USA, 2015. [Google Scholar]
- The Economist Intelligence Unit. The Global Liveability Index 2021. How the COVID-19 Pandemic Affected Liveability Worldwide; The Economist: London, UK, 2021; p. 4. [Google Scholar]
- Fleischmann, M.; Feliciotti, A.; Romice, O.; Porta, S. Methodological Foundation of a Numerical Taxonomy of Urban Form. arXiv 2021, arXiv:2104.14956. [Google Scholar]
- Legendre, P. Spatial autocorrelation: Trouble or new paradigm? Ecology 1993, 74, 1659–1673. [Google Scholar] [CrossRef]
- Nubani, L.; Wineman, J. The role of Space Syntax in identifying the relationship between space and crime. In Proceedings of the 5th Space Syntax symposium on Space Syntax, Delft, The Netherlands, 13–17 June 2005. [Google Scholar]
- Omer, I.; Goldblatt, R. Spatial patterns of retail activity and street network structure in new and traditional Israeli cities. Urban Geogr. 2016, 37, 629–649. [Google Scholar] [CrossRef]
- Fleischmann, M.; Romice, O.; Porta, S. Measuring urban form: Overcoming terminological inconsistencies for a quantitative and comprehensive morphologic analysis of cities. Environ. Plan. B Urban Anal. City Sci. 2020, 48, 2133–2150. [Google Scholar] [CrossRef] [Green Version]
- Fleischmann, M.; Feliciotti, A.; Romice, O.; Porta, S. Morphological tessellation as a way of partitioning space: Improving consistency in urban morphology at the plot scale. Comput. Environ. Urban Syst. 2020, 80, 101441. [Google Scholar] [CrossRef]
- Rokach, L.; Maimon, O. Clustering methods. In Data Mining and Knowledge Discovery Handbook; Maimon, O., Rokach, L., Eds.; Springer: Boston, MA, USA, 2005; pp. 321–352. [Google Scholar]
- Rousseeuw, P.J. Silhouettes: A graphical aid to the interpretation and validation of cluster analysis. J. Comput. Appl. Math. 1987, 20, 53–65. [Google Scholar] [CrossRef] [Green Version]
- Ministry of Housing, Communities and Local Government. National Model Design Code; Crown: London, UK, 2021. [Google Scholar]
- Directorate of Census Operations of Kerala. District Census Handbook Ernakulam: Village and Town Wise Primary Census Abstract (PCA); Government of India: New Dehli, India, 2011. [Google Scholar]
- Ministry of Housing and Urban Affairs. Smart Cities; Government of India: New Delhi, India, 2021. [Google Scholar]
- Menon, K.P.P. Kochi Rajya Charithram; Mathrubhumi Books: Thiruvananthapuram, India, 1989. [Google Scholar]
- Logan, W. Malabar Manual; Asian Educational Services: New Delhi, India, 2000. [Google Scholar]
- Kuriakose, P.N.; Philip, S. City profile: Kochi, city region-Planning measures to make Kochi smart and creative. Cities 2021, 118, 103307. [Google Scholar] [CrossRef]
- Iyer, K.C.; Nanyam, V.P.S.N. Technical efficiency analysis of container terminals in India. Asian J. Shipp. Logist. 2021, 37, 61–72. [Google Scholar] [CrossRef]
- Department of Town and Country Planning. Development Plan for Kochi City Region 2031: Study and Analysis; Government of Kerala: Thiruvananthapuram, India, 2010. [Google Scholar]
- Liveable Urbanism. Liveable Urbanism Kochi: 2020–2021 Group Handbook; Cardiff University: Cardiff, UK, 2021. [Google Scholar]
- Alexander, C. The Nature of Order: An Essay on the Art of Building and the Nature of the Universe; Center for Environmental Structure: Berkeley, CA, USA, 2002–2005; Volumes 1–4. [Google Scholar]
- Alexander, C.; Neis, H.J.; Moore-Alexander, M. The Battle for the Life and Beauty of the Earth: A Struggle between Two World-Systems; Oxford University Press: New York, NY, USA, 2012. [Google Scholar]


| CA Intervals | % Cells | Median (M) | Total Cell Areas (TCA) |
|---|---|---|---|
| (24.60, 336.09) | 29.70 | 180.35 | 5356.91 |
| (336.09, 650.88) | 36.59 | 493.49 | 18,057.90 |
| (650.88, 1080.39) | 20.22 | 865.64 | 17,505.06 |
| (1080.39, 1677.60) | 9.33 | 1379.00 | 12,870.62 |
| (1677.60, 2515.36) | 2.89 | 2096.48 | 6056.50 |
| (2515.36, 3689.55) | 0.59 | 3102.46 | 1838.49 |
| (3689.55, 5266.39) | 0.37 | 4477.97 | 1658.51 |
| (5266.39, 7385.03) | 0.07 | 6325.71 | 468.57 |
| (7385.03, 10,282.65) | 0.07 | 8833.84 | 654.36 |
| (10,282.65, 14,106.60) | 0 | 12,194.63 | 0.00 |
| (14,106.60, 19,523.60) | 0.15 | 16,815.10 | 2491.13 |
| (19,523.60, 26,922.44) | 0 | 23,223.02 | 0.00 |
| (26,922.44, 35,608.03) | 0 | 31,265.24 | 0.00 |
| (35,608.03, 48,659.49) | 0 | 42,133.76 | 0.00 |
| (48,659.49, 67,909.16) | 0 | 58,284.33 | 0.00 |
| Sum: 66,958.05 |
| BF Intervals | % Buildings | No. of Buildings |
|---|---|---|
| (12.02, 78.95) | 20.15 | 34 |
| (78.95, 145.13) | 42.00 | 72 |
| (145.13, 234.55) | 24.07 | 41 |
| (234.55, 371.63) | 8.30 | 14 |
| (371.63, 585.08) | 3.56 | 6 |
| (585.08, 910.02) | 0.59 | 1 |
| (910.02, 1430.61) | 0.81 | 1 |
| (1430.61, 2212.47) | 0.30 | 1 |
| (2212.47, 3423.68) | 0.07 | 0 |
| (3423.68, 5308.78) | 0.07 | 0 |
| (5308.78, 7792.22) | 0.07 | 0 |
| (7792.22, 10,715.89) | 0 | 0 |
| (10,715.89, 14,611.60) | 0 | 0 |
| (14,611.60, 26,037.39) | 0 | 0 |
| (26,037.39, 34,898.16) | 0 | 0 |
Publisher’s Note: MDPI stays neutral with regard to jurisdictional claims in published maps and institutional affiliations. |
© 2021 by the authors. Licensee MDPI, Basel, Switzerland. This article is an open access article distributed under the terms and conditions of the Creative Commons Attribution (CC BY) license (https://creativecommons.org/licenses/by/4.0/).
Share and Cite
Venerandi, A.; Romice, O.; Chepelianskaia, O.; Kalyan, K.; Bhardwaj, N.; Viese, V.; Ugás, S.; Raman, S.; Porta, S. Urban Morphometrics and the Intangible Uniqueness of Tangible Heritage. An Evidence-Based Generative Design Experiment in Historical Kochi (IN). Heritage 2021, 4, 4399-4420. https://doi.org/10.3390/heritage4040243
Venerandi A, Romice O, Chepelianskaia O, Kalyan K, Bhardwaj N, Viese V, Ugás S, Raman S, Porta S. Urban Morphometrics and the Intangible Uniqueness of Tangible Heritage. An Evidence-Based Generative Design Experiment in Historical Kochi (IN). Heritage. 2021; 4(4):4399-4420. https://doi.org/10.3390/heritage4040243
Chicago/Turabian StyleVenerandi, Alessandro, Ombretta Romice, Olga Chepelianskaia, Kavya Kalyan, Nitin Bhardwaj, Vija Viese, Sebastián Ugás, Shibu Raman, and Sergio Porta. 2021. "Urban Morphometrics and the Intangible Uniqueness of Tangible Heritage. An Evidence-Based Generative Design Experiment in Historical Kochi (IN)" Heritage 4, no. 4: 4399-4420. https://doi.org/10.3390/heritage4040243
APA StyleVenerandi, A., Romice, O., Chepelianskaia, O., Kalyan, K., Bhardwaj, N., Viese, V., Ugás, S., Raman, S., & Porta, S. (2021). Urban Morphometrics and the Intangible Uniqueness of Tangible Heritage. An Evidence-Based Generative Design Experiment in Historical Kochi (IN). Heritage, 4(4), 4399-4420. https://doi.org/10.3390/heritage4040243