1. Introduction
Climate change challenges and the need for energy renovations and improved energy efficiency in the building sector have set the agenda for the work aimed at meeting national climate and energy goals. Sweden has a goal to become a net-zero greenhouse gas emission country by 2045 according to the climate policy framework for Sweden [
1]. Buildings account for a large share of total energy use in Sweden (as is the case with the rest of Europe). Reducing energy demand in buildings as well as improving energy efficiency is vital in order to reach the goal according to the climate policy action plan [
2]. National targets are set in line with the EU Directive 2018/844 (amending the Energy performance of buildings directive 2010/31) and the Energy efficiency directive 2012/27 which aim to establish national renovation strategies in all member countries. In the Swedish national renovation strategy, it is stated that a large part of the existing building stock is designated with heritage values, which should be taken into account when energy renovations are planned [
3]. Heritage values include the following aspects; technical, historical, cultural-historical, environmental and artistic values that can be assigned to a building. It is a collective concept that relates to the national (Swedish) planning and building legislation [
4].
The historic building stock is heterogeneous and consists of buildings from different time periods, constructed in different ways with different materials, and also follows different architectural ideals. This situation implies that there is a need for differentiated energy renovation strategies and targeted policies for energy efficiency in historic buildings in order to balance energy and building conservation. This in turn requires better knowledge about the historic building stock in relation to the building stock as a whole.
Previous research has highlighted the need to develop methods for the analysis of large building stocks with regard to energy performance and heritage values [
5,
6]. In order to achieve this, there is a need to link information on heritage values provided by heritage institutions with building data from register databases, such as the Swedish Land Survey’s property register and the database for energy performance certificates (EPC) provided by the Swedish National Board of Housing, Building and Planning. With this study, we present a new methodological approach within the combined field of building conservation and spatial extract, transform and load (ETL) technology. With two selected historic building stocks as a starting point, we aim to illustrate the relationship between energy performance, year of construction and heritage classification within each building stock. The intention is to be able to provide local, regional and national authorities with a better understanding and deeper knowledge of the above mentioned relationships in order to develop targeted and differentiated energy renovation strategies.
According to current national regulations in the Planning and Building act (PBL) and the Building regulations (BBR) all buildings must be altered with caution so heritage values are not adversely affected. If a building is heritage designated, it must not be distorted with regard to its heritage values. If a measure causes a distortion, it depends how on the measure changes the character of the building or damages the aspects of heritage values. The balance between achieving energy saving and preserving heritage values is recognised as a dilemma in the national renovation strategy. If energy and heritage conservation are to be soundly balanced, a better understanding of the potential for energy efficiency in designated historic buildings is needed. At present, there is no uniform and comprehensive collection of data at the national level about buildings with heritage values. There is no legal obligation to carry out heritage surveys of building stocks. The Swedish National Board of Housing, Building and Planning does however recommend that municipalities identify buildings with heritage values in order to help facilitate the protection of these buildings.
This study is based on data about heritage-classified and designated multifamily buildings in the municipality of Stockholm and in the county of Halland. The motive for choosing these two case studies is based on the following: energy performance certificates are registered for most multifamily buildings, and for these two building stocks, there is also information available about the buildings’ heritage classification. The heritage assessment and classification work for these two case studies has been conducted by conservation professionals at the Stockholm City Museum, and the county museum of Halland.
Building stocks designated with heritage values are identified here as historic building stocks using the definition of historic buildings in the European standard ‘Conservation of cultural heritage—Guidelines for improving the energy performance of historic buildings’ (EN 16883).
A historic building is a building with heritage values that does not necessarily need to be listed with formal protection. A historic building stock is thus a building stock with heritage values.
The aim of the research is to contribute to improved energy renovation strategies for the heritage-designated building stock by developing and testing a new methodology to visualise and analyse building data aggregated to the building stock level. The following research questions are addressed:
How can building stock data for heritage classified buildings be integrated with other building, property and demographics data, and what are the suitable units of analysis?
What differences are detectable within and between the heritage-classified and -designated multifamily building stocks?
How can the building stock analysis benefit the development of differentiated energy renovation strategies?
2. Energy Efficiency in Historic Building Stocks
Previous research in the field of energy efficiency in historic building stocks covers either building stock analysis, energy efficiency in historic buildings or the potential for improving energy efficiency whilst protecting heritage values. There has been an overall increase in published scientific papers within this field, which has been highlighted in recent review papers. Martinez-Molina et al. [
7] identifies a research focus on individual historic buildings. Webb [
8] observes a shift in the view of how energy efficiency can contribute to the preservation of historic buildings instead of being regarded as a threat. Lidelöw et al. [
9] discusses the lack of a more in-depth and integrated approach to heritage values in historic buildings in relation to energy efficiency. The following is an overview of the different approaches to understanding the energy saving potential of larger building stocks that have been developed and tested in previous research projects.
A method for understanding the energy efficiency potential of a multifamily building stock with heritage values was developed by using typical historic buildings from different decades in Australia. The selected buildings served as starting points for modelling the effect of various energy efficiency measures in relation to the national building code. Among the difficulties that arose were the lack of information about the historic buildings as well as the difficulties in obtaining access to buildings in order to conduct field investigations [
10]. Another approach to addressing these matters at a building stock level is to identify the typical examples of buildings where the problems are first studied in-depth using a case study methodology in order to generalise the results at a later stage. This method was used for understanding how house owner perspectives influenced decisions about energy efficiency measures in a study of traditional 19th century heritage buildings in the UK [
11].
Archetype buildings were used in order to understand the building stock in the world heritage city of Visby. The prerequisite for this study was the amount of detailed data available about each building. The building information was required as a basis for developing a method for categorising the building stock [
12]. Six main archetype buildings were identified as a result of the categorisation. The archetype buildings represented different parts of the building stock, both single family buildings as well as multifamily buildings. These archetypes were used for optimising life cycle costs and energy use in order to create a knowledge base for developing differentiated energy strategies for the city [
13]. In Italy, a score-driven method aimed at improved energy planning processes for historic building stocks has been developed. In this work, a sample building of a very specific building category (buildings for war invalids) was used to illustrate the method where the parameters of energy savings, economic savings and protection of the buildings were combined [
14]. Using the method requires a high level of knowledge of the buildings being considered for energy improvement measures. The project Tabula and the follow-up project Episcope were aimed at creating typologies of the European housing stock to make the energy efficiency processes in this stock transparent across national borders [
15]. The typology approach was further developed and tested in two areas of Italy in order to propose energy strategies on urban level. The first step in this approach was to define reference buildings, based on age classes, which are used for simulating different renovation scenarios [
16].
When it is not possible to carry out in-depth studies of a large number of individual buildings or when there is a lack of detailed and aggregated data on buildings, there is a need for approaches that combine different data sets of building information in order to find relationships between different aspects of buildings. Building age, in terms of year of construction, was tested as an indicator of energy consumption in the city of Basel. The study was performed using large data sets of building information combined with statistical methods. The results showed that buildings built before 1921 performed better than buildings constructed after this year. This was shown to be related to the compactness of these buildings [
5]. In a regional study of a residential building stock in Umbria, Italy, energy performance certificates were used in order to understand the potential for energy and CO
2 savings in different age segments. The heritage building as a concept was used for defining the older segments of the building stock [
17]. In order to develop a methodology for residential urban building stocks, different building-specific data were used as inputs to identify trends and tendencies in energy performance in a selected building stock in the city of Gothenburg [
18]. Seven different building types were identified based on dominant construction material and form. Age was also a factor that was considered in this bottom-up study.
Johansson et al. [
19] developed an energy renovation atlas of multifamily buildings in Sweden, visualising and analysing energy use and renovation demands. The atlas was used to visualise the renovation status of multifamily buildings and the energy use of individual buildings and aggregated data for municipality, county and demographic areas. However, the energy atlas did not include any information regarding the historic buildings in the maps or in the evaluated scenarios. The energy atlas was created using the extract, transform and load (ETL) technology in order to aggregate data on energy performance, renovation status, building ownership and socio-economic status of the inhabitants. ETL technology is used in data warehousing for business intelligence and is suitable for creating repeatable automated processes to extract and transform data from several heterogeneous data sources [
20,
21]. The transformation steps contain various cleansing activities and processing by filters, sorters, etc., organised in a workflow loading the transformed data to the target applications [
22].
The potential for how big data sets on energy performance in historic buildings can be used in combination with information about a year of construction in order to analyse relationships has also been studied in six major cities in the US. In order to measure the energy performance in designated buildings, the city of New York was used as a case study. The results indicated weak relationships between the year of construction and energy performance for the designated buildings. Building type was a stronger indicator for energy than heritage designation [
6]. Building stock analyses have been made in a number of different geographic areas to estimate the renovation situation in relation to energy in the existing building stock, but there is a lack of studies where historic building stocks are part of the work.
3. Methods and Material
By using methods developed for the energy renovation atlas, we add a study on the segment of heritage-designated historic multifamily buildings. A multidisciplinary methodological approach was used, characterised by the integration of different disciplines to gain knowledge about heritage-designated building stocks and thereby contribute with new perspectives useful for future energy renovation strategies for historic building stocks.
In this study, the extract, transform and load (ETL) technology process was developed in order to integrate energy performance certificates (EPC) data with built heritage data, as well as building and property information. ETL technologies is used in other disciplines such as business intelligence, medicine and information technology to manage big datasets from different sources. ETL technology is generally used to establish repeatable processes in order to extract data from multiple heterogeneous sources. The data are transformed and loaded to a specified structure. The ETL data integration process is shown in
Figure 1, which is an extended version of a process described by Johansson et al. [
19] and Johansson et al. [
23] where built heritage data were used to create a new aggregated national database.
The extracted data for this study include the EPC database from The Swedish National Board of Housing, Building and Planning (Boverket). The EPC database contains around 90% of the Swedish multifamily buildings [
19]. This is equal to approximately 150,000 individual buildings. The certificates include information on energy use, heated areas, service systems and suggestions for energy saving measures and contains around 200 different attributes [
23]. Building categories, municipality and county codes attribute were used to filter the data and energy performance (kWh) and energy use (kWh), and the year of construction attribute was used for data aggregation. A large proportion of the multifamily buildings have recently renewed their EPC which makes the energy data for the buildings up-to-date [
24].
The Real Property Register, which is collected from the Swedish mapping, cadastral and land registration authority (Lantmäteriet), contains building data, property data, ownership and property names as well as multifamily buildings taxation tables. It also provides maps and height models. The local heritage did not contain any national building ID and was therefore spatially joined with national building centre coordinates (Origin: Real Property Register) and building footprints (Origin: Property Map). Stockholm used national building coordinates because heritage footprints existed, and Halland used the national building footprints because only building coordinates were available.
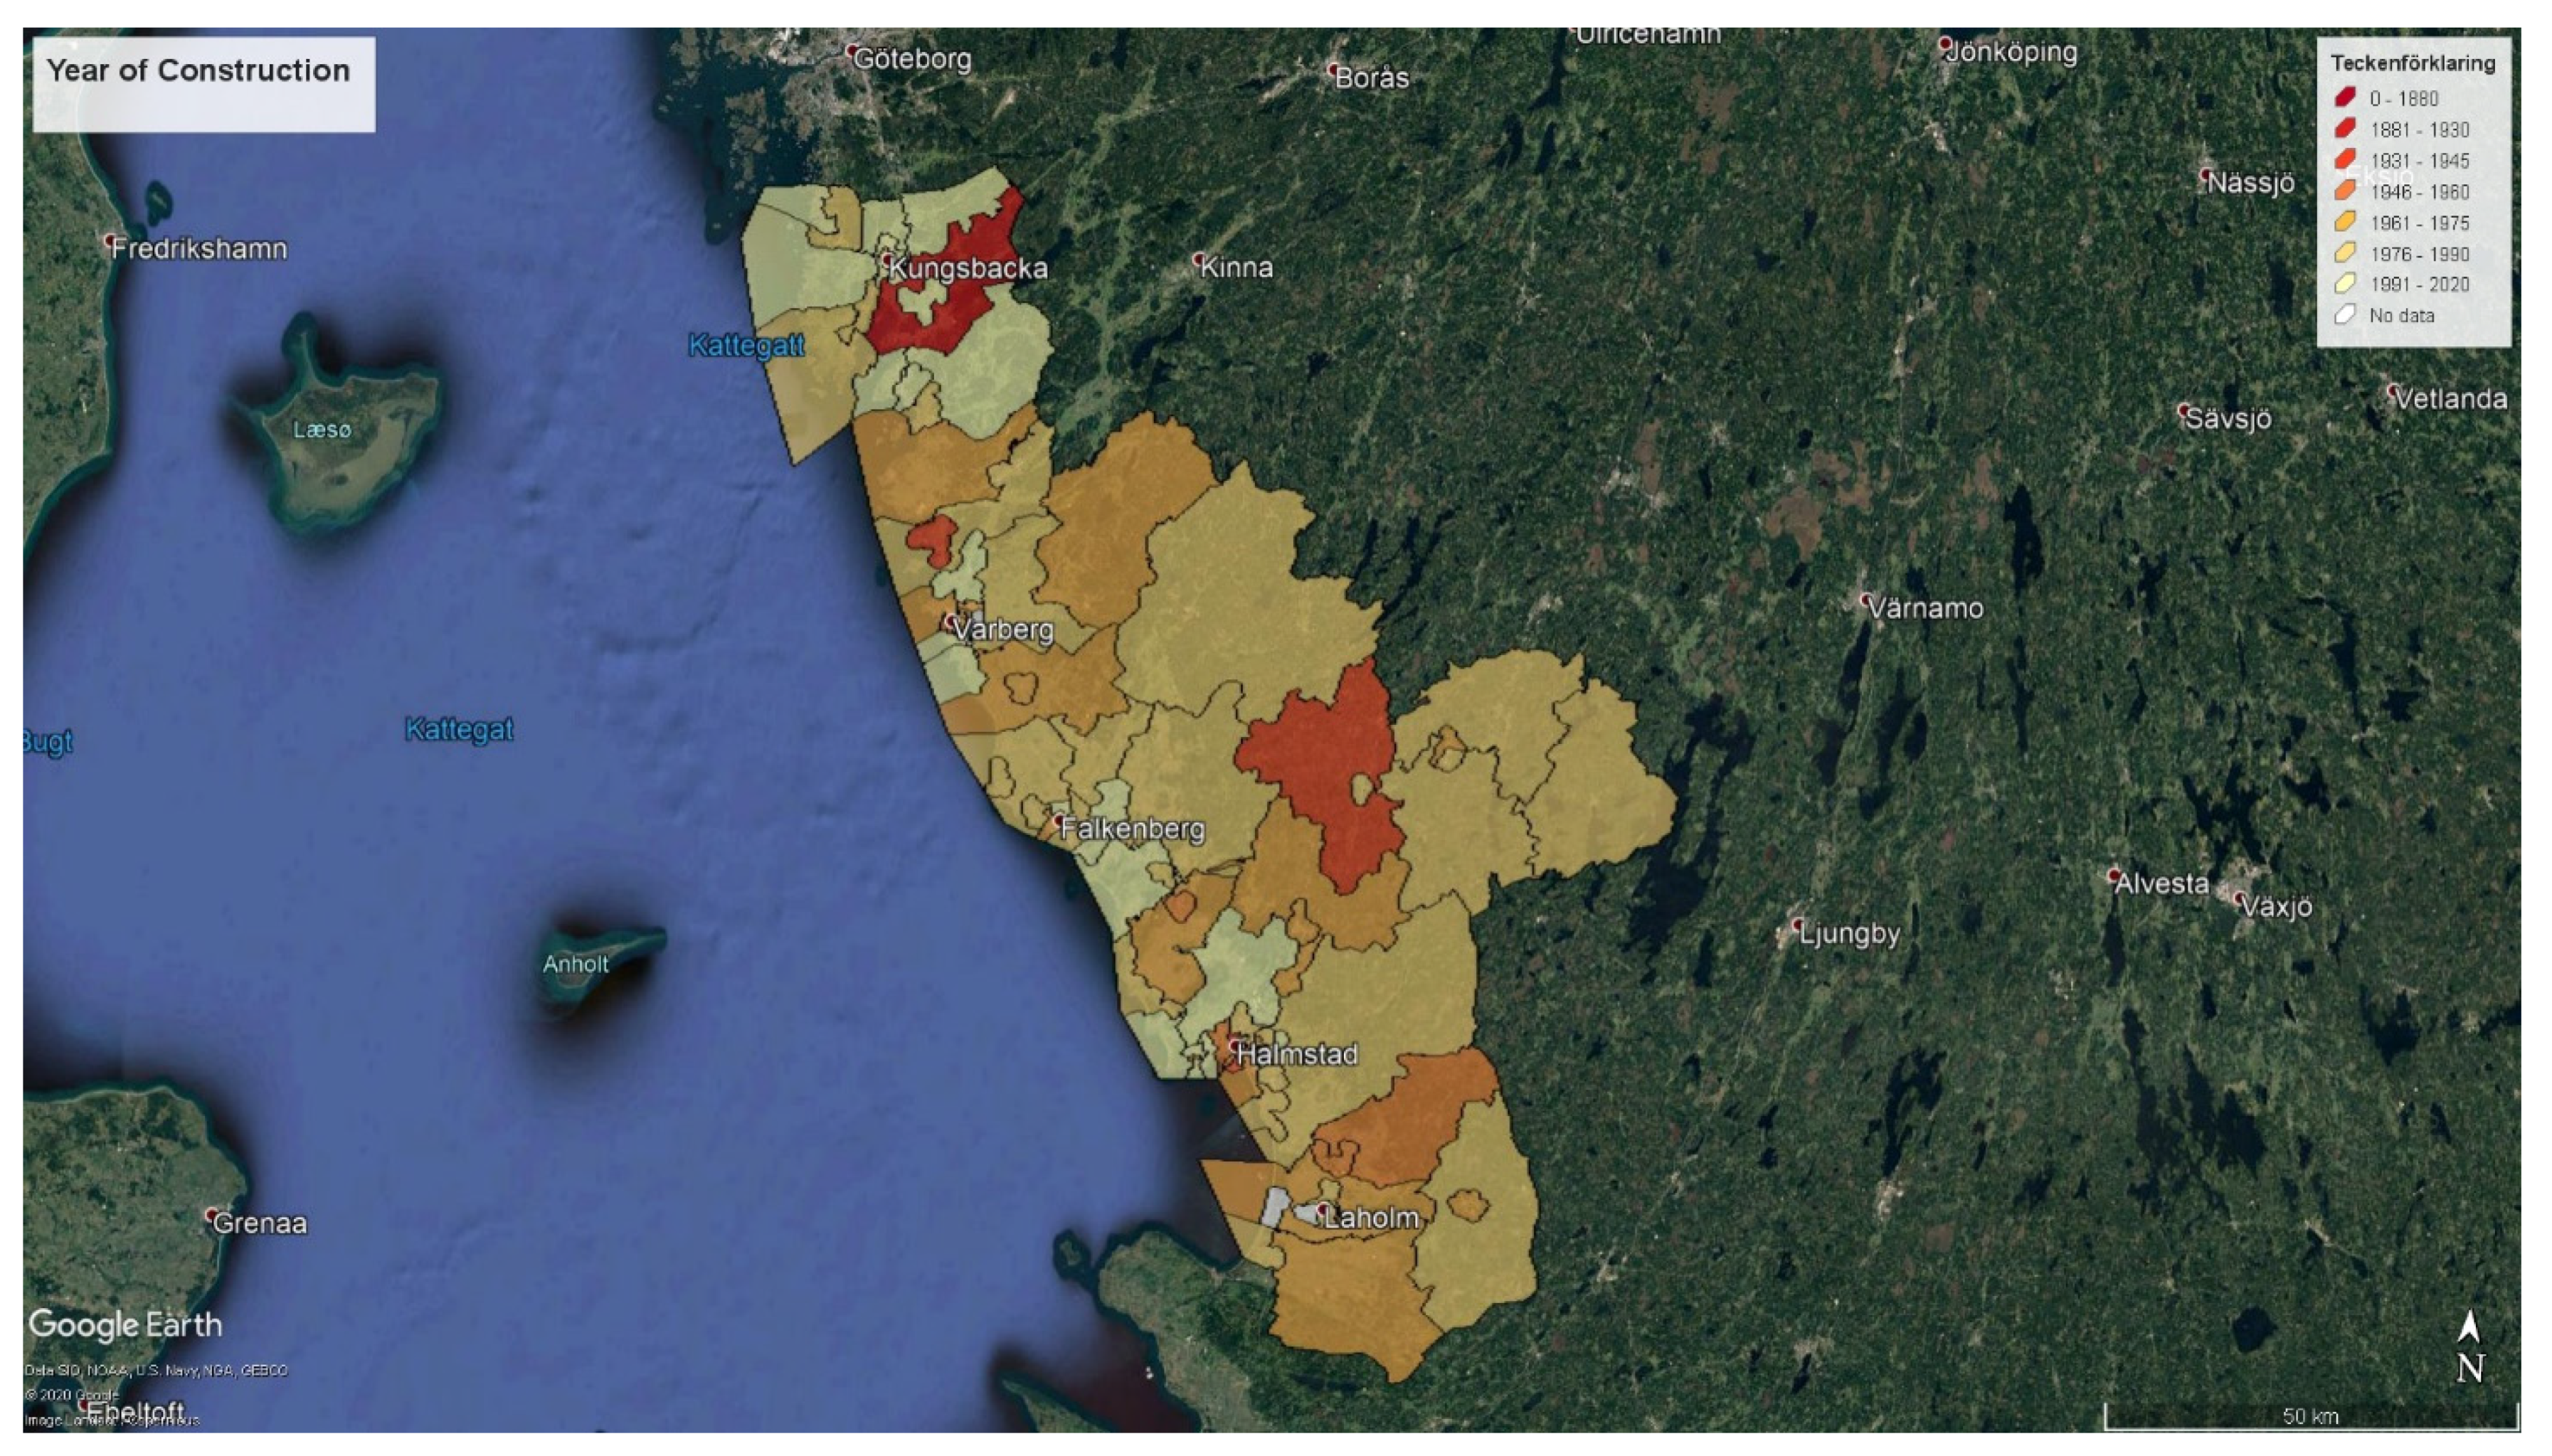
From Statistics Sweden (SCB), demographics zones (DESO), which are based on population (700–2700 inhabitants) and follow municipality and county borders, are adapted to roads, waterways and electoral districts, and these data were used to analyse heritage classified buildings in different zones in the case studies. The built heritage data were collected from the Swedish National Heritage Board (Riksantikvarieämbetet) and local built heritage data from the municipality of Stockholm and the County of Halland. The database of built heritage (Bebyggelseregistret) contains around 100,000 buildings. Around 20% of the buildings in the register have a heritage classification (see
Table 1 for the total numbers as well as
Figure 2 for the spatial distribution in Sweden).
In the staging process that is the second step of the process, unique building ID’s for each data source were created. Building data were spatially amalgamated with DESO data in order to create aggregations based on geographical zones later on in the transformations process. Finally, the data were loaded into a common database.
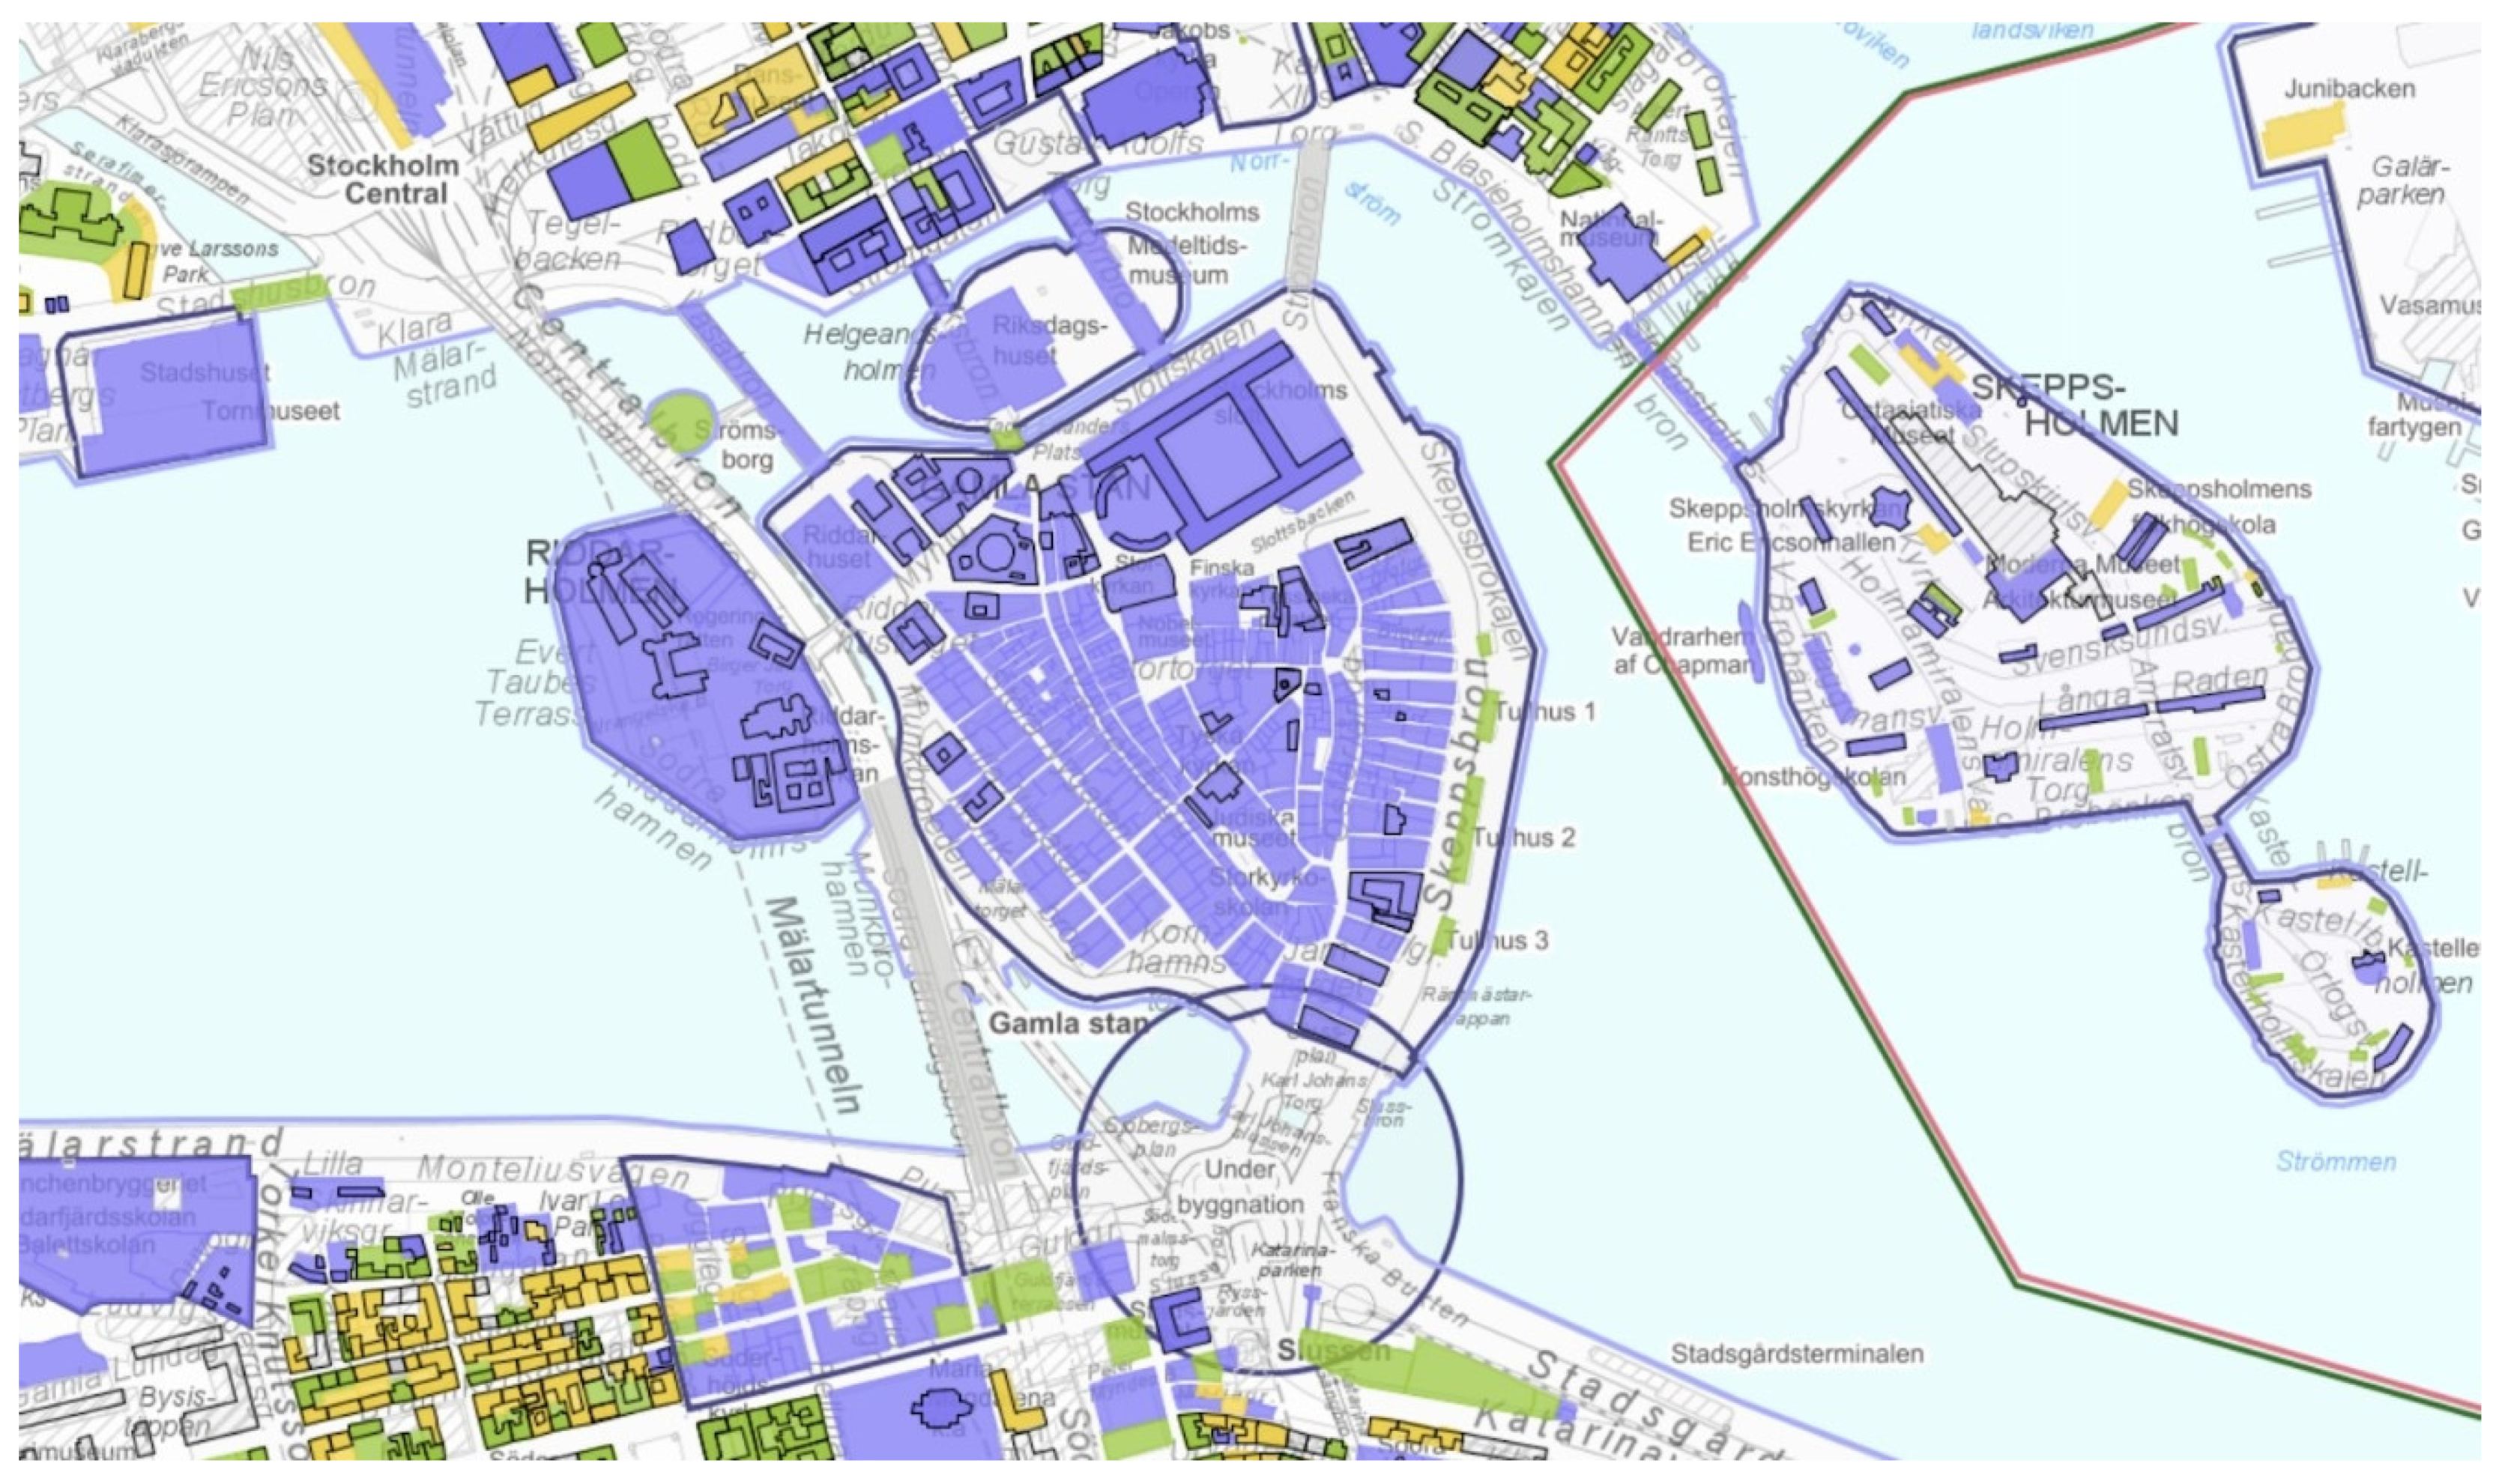
In the transformation step, the data were integrated into a common building table. The built heritage data were amalgamated with building and energy data using the unique building ID that was created in the earlier step. Local heritage data were amalgamated spatially joined with the national database since no unique ID’s existed for that group. Combining local built heritage data with national built heritage data gave the most complete output for the buildings in Halland. For Stockholm, the heritage classification web map (see
Figure 3) was used together with building information from Lantmäteriet in the process.
The data preparation and aggregation began with creating new attributes from existing data. This included heritage classification and year of construction groups. The following aggregations were then created:
The total number of buildings grouped by year of construction.
The specific energy use (normal year corrected) grouped by heritage classification and year of construction.
Mean and median energy performance grouped by heritage classification and year of construction.
Finally, the aggregated data were exported to excel files and maps for further analyses. One of the maps was created based on the demographic DESO areas and showed the median year of construction (see
Figure 4 and
Figure 5 in the next section).
4. Results from the Case Studies
The data aggregation described above was applied to the county of Halland and the municipality of Stockholm. Stockholm is the capital of Sweden, with an urban building stock that has developed since the medieval ages until today. Halland is a region situated in the southeast part of Sweden and is characterised by its rural areas mixed with smaller cities. These are two geographical areas where buildings have been designated as important and valuable from a building historical, technical, aesthetic and/or environmental perspective by heritage authorities. In addition, comprehensive data relating to the designated buildings within each building stock is available.
4.1. Aggregation on Year of Construction
The building stock of Halland and Stockholm was aggregated into groups by year of construction. The intervals were based on the main building construction and materials used during each period. This was based on studies conducted by the (now defunct) Swedish Building Research Council [
25] as well as architecture and house building literature [
26]. Up until 1880, the main type of building construction was load-bearing walls in stone, mainly brick. This is also the case for buildings constructed in the period 1881–1930. These groups that seem to be similar to each other are separated depending partly on the differences in architectural styles and partly in order to be able to separate the very oldest building stock, as it often constitutes a small part, from the total building stock. From 1931 onwards, lightweight concrete blocks were starting to be used in building constructions, and load-bearing walls are still dominating. From 1946, lightweight concrete blocks became the dominant construction material. Load-bearing walls are the most common construction in multifamily buildings until the 1960s. From 1961 and onwards, load-bearing wall gables with a mix of materials used in the exterior walls were introduced and became the most common construction type. Within the building conservation profession, architectural character is assessed through concepts such as “the stone city”, “the garden city”, “buildings of the welfare state”, “the million programme”, etc. These concepts are wholly or partly in accordance with the temporal division used in this study.
4.2. Aggregation on Heritage Classification in Stockholm and Halland
The first building stock examined was the heritage-classified multifamily buildings in the municipality of Stockholm. Around 10% of the entire nation’s stock of multifamily buildings are located in this area, which covers the city centre of Stockholm. Looking at the age distribution, 25% of the multifamily buildings built before 1945 are located in this area.
Since the 1920s, the city museum of Stockholm has worked on surveying the buildings within the city. The buildings have been registered and heritage classified by using a primarily three-graded scale. The scale has been colour coded and presented on a map which today is part of the GIS planning tool for the city of Stockholm. The highest classified buildings are marked with the colour blue on the classification map, the second highest classification group are in green, and yellow is used for the lowest classification group. The two highest classes (blue and green) indicate that the buildings are of such (heritage) value that they should be protected against distorting measures. The third classification grade (yellow) means that the buildings should be handled with caution when making changes to the building.
The other building stock examined in this paper is the designated multifamily buildings within the county of Halland. Only 3% of the multifamily buildings in Sweden are located in this region. The distribution of multifamily buildings here is similar to the distribution that is representative of the whole country. In total, 14% of the multifamily buildings in Halland were built before 1945.
During 2005–2009, the entire building stock in Halland was surveyed by the county museum (Kulturmiljö Halland) on behalf of the regional heritage authority at the regional county administrative board (Länsstyrelsen Halland). The goal was to identify and classify buildings with heritage values. This resulted in a database which was intended to support decision making for the municipalities within the region. The inventory comprises 10% of the total number of buildings in the region. The heritage classification was conducted using a three-graded scale using the letters A–C. The highest class (A) is buildings of national interest. These are buildings with very high heritage values. They are usually well preserved externally, and sometimes, they also have preserved interiors. Class B indicates regional interest. The buildings with regional interest have such high heritage values that they should be protected by designation in the municipalities’ planning tools. Class C indicates local interest. The buildings with local interest are above all typical of their time with some characteristic expressions still preserved.
4.3. Heritage Classification Related to Year of Construction
In the first step of the analysis, data were aggregated to obtain a picture of the distribution of buildings divided by construction year and classification group, which is presented in the previous
Section 4.1 and
Section 4.2. In
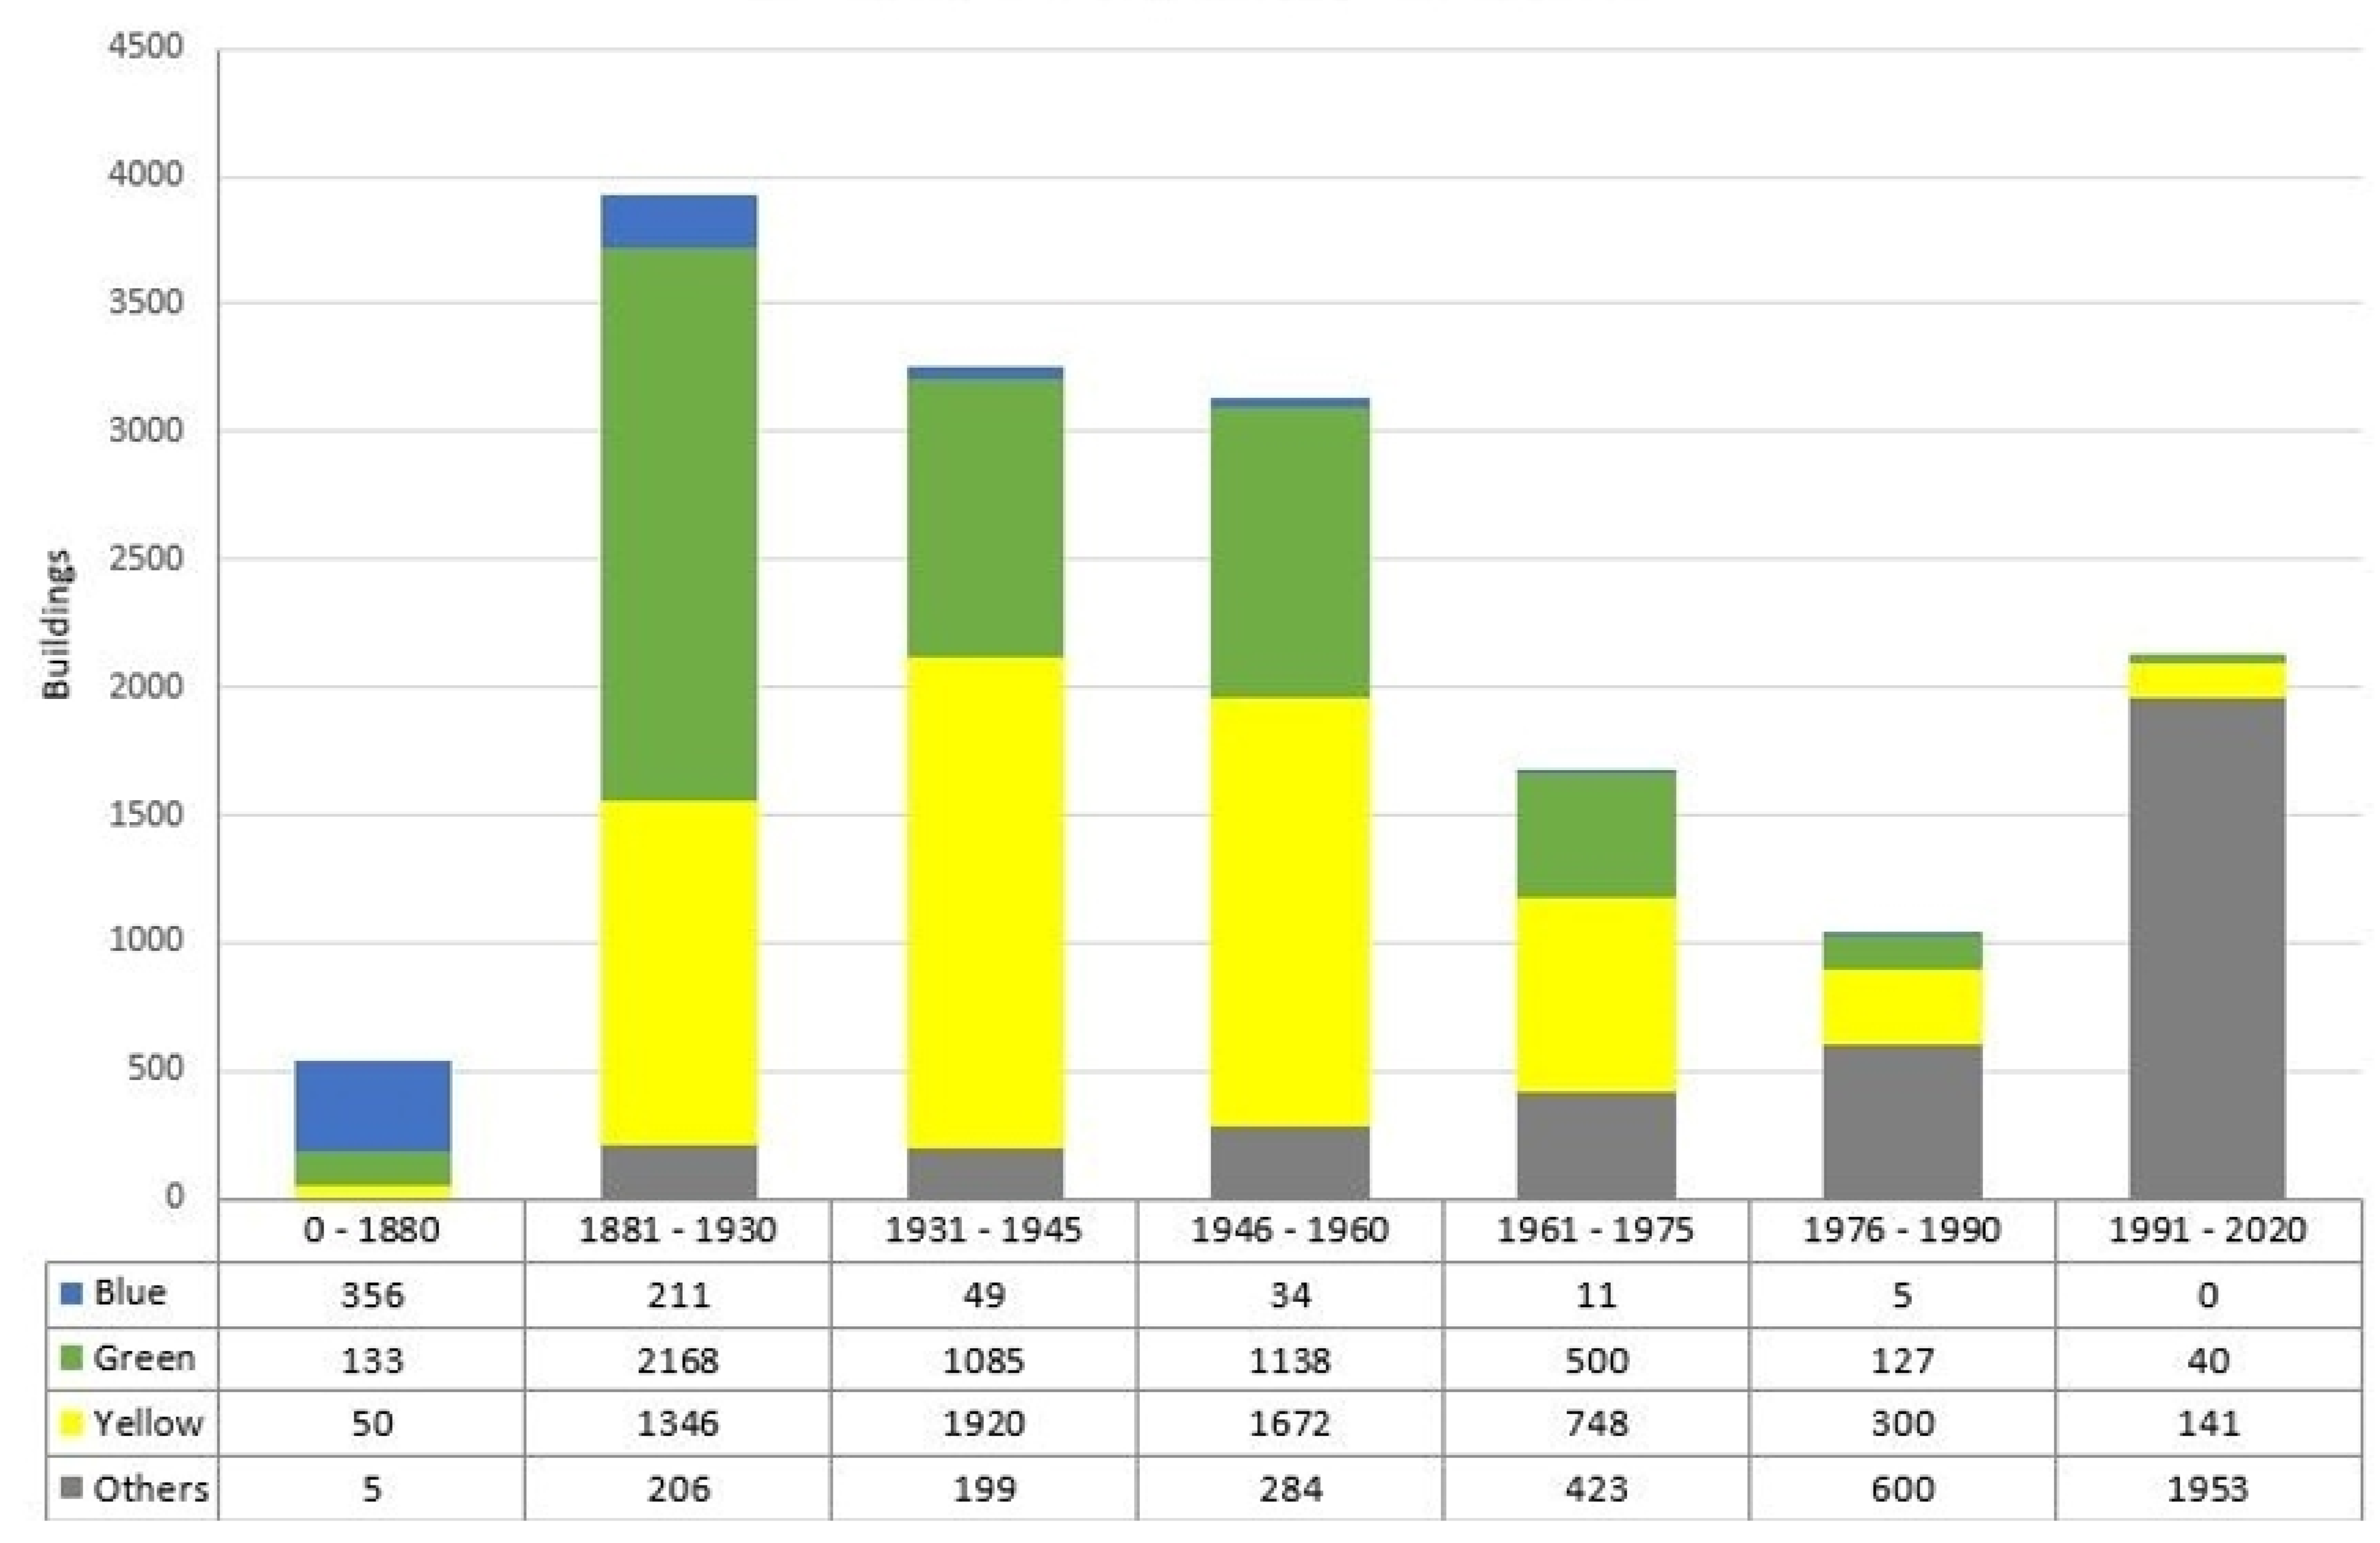
Figure 6, the result of this first step is demonstrated.
In Stockholm, a large part, 76%, of the multifamily buildings are heritage classified. The blue-classified buildings make up 4% of the building stock, while green-classified buildings comprise 32%, and the yellow-classified buildings make up the remaining 40% of the stock. As expected, older buildings are more likely to be designated as buildings with heritage values. Within each age group, the distribution between the classifications looks different. The largest group of classified buildings is found in the older age ranges. In the group of buildings constructed up until 1880, the biggest share of blue-classified buildings is found. The largest age group is the buildings constructed in the period 1881–1930. Here, too, the vast majority of the buildings are heritage classified, mostly in the second highest class—green. The number of multifamily buildings built per building year interval decreases until 1990 and then increases drastically from 1991. The group of buildings constructed from 1991 and onwards has the biggest amount of nonclassified buildings.
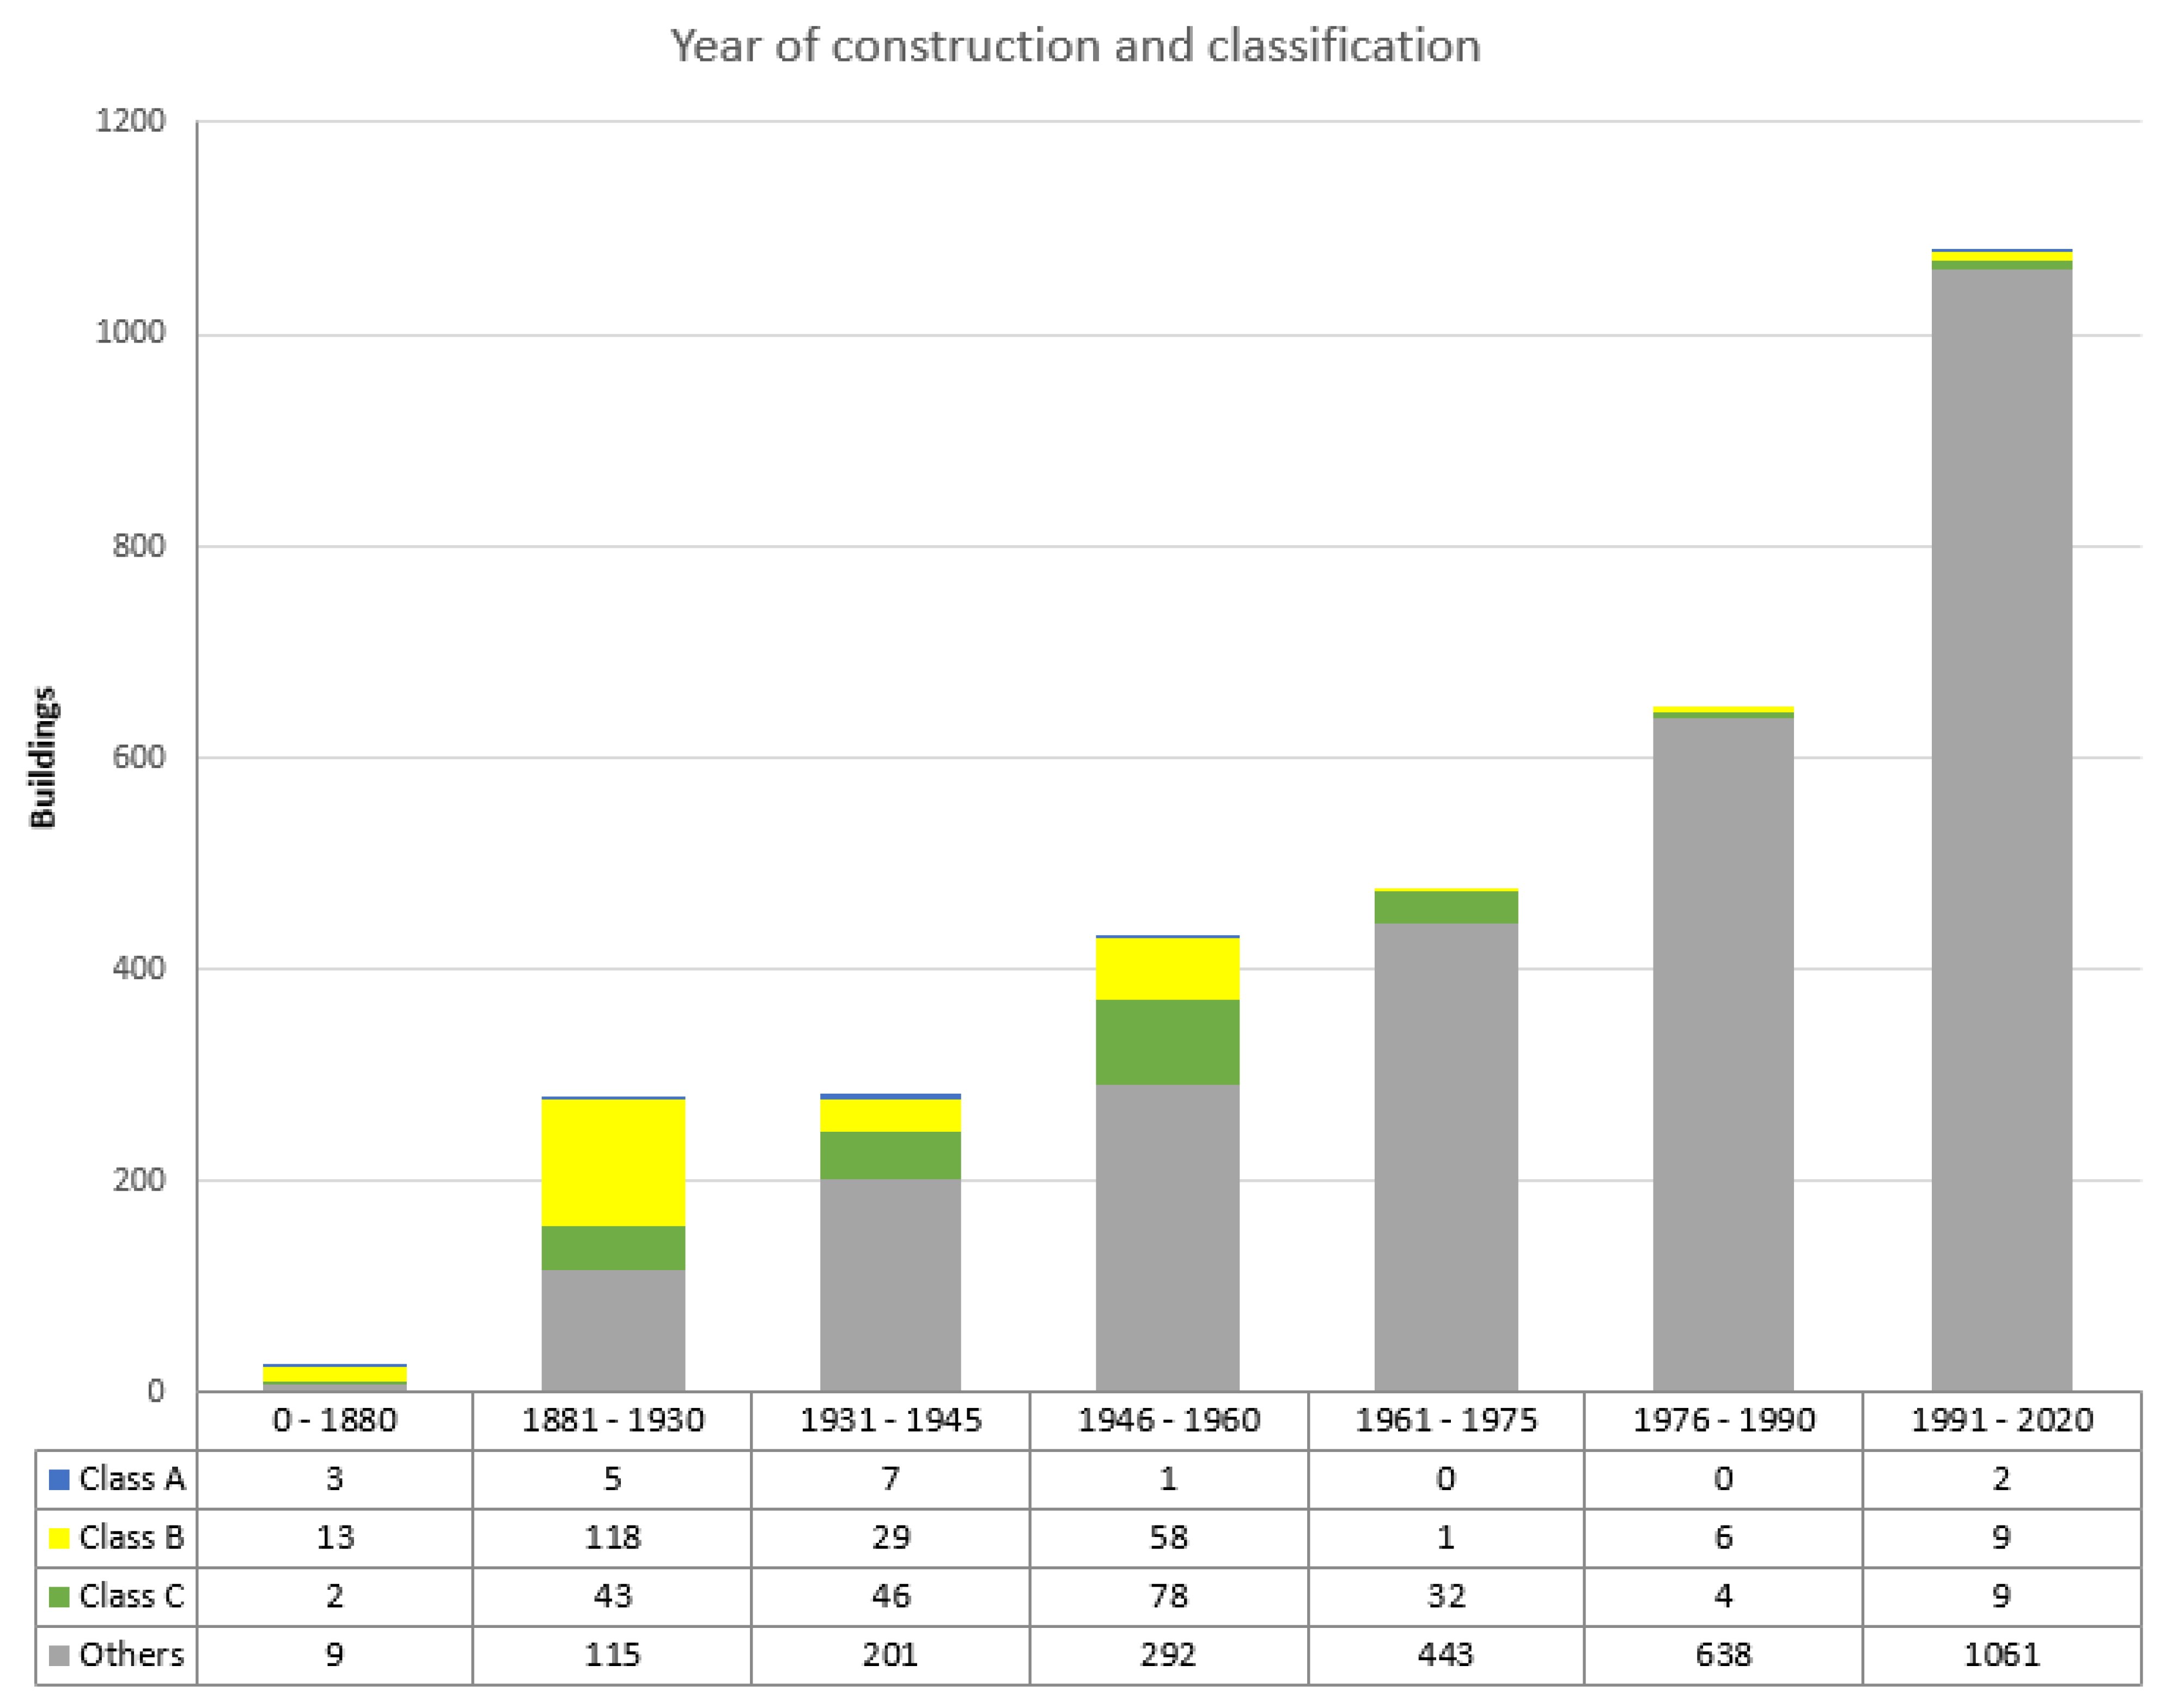
In Halland region, 16% of the total building stock of multifamily buildings have been heritage designated and marked with one of the three classifications A, B or C (see
Figure 7). The highest classification covers only 1% of the total building stock of multifamily buildings, whilst 6% of this building stock is classified in class B and 9% in class C. When looking more closely at the different age ranges, the building stock of multifamily buildings constructed before 1880 is very small and consists of only 16 buildings—most of which are designated with heritage interest. More than half (61%), of the buildings constructed between 1881 and 1930 are designated with heritage values. This is also the age range with the highest proportion of designated buildings. Most of these buildings have been classified in class B. No buildings constructed between 1946 and 1991 have been classified with the highest classification—A. The number of multifamily buildings built is constantly increasing, apart from the age interval 1881–1930 and 1931–1945 where a slight decrease is showed.
The multifamily building stocks in Stockholm and Halland are different from each other regarding both age distribution and the distribution of classified buildings within each stock. An explanation for this is that the stock of multifamily buildings in Stockholm is situated within a city, while the stock of multifamily buildings in Halland is scattered over a geographical region with several smaller cities and communities.
4.4. Energy Use in Relation to Heritage Classification and Year of Construction
The second step in analysing the results from the aggregated data is to look at the relationship between year of construction, heritage classification and energy use.
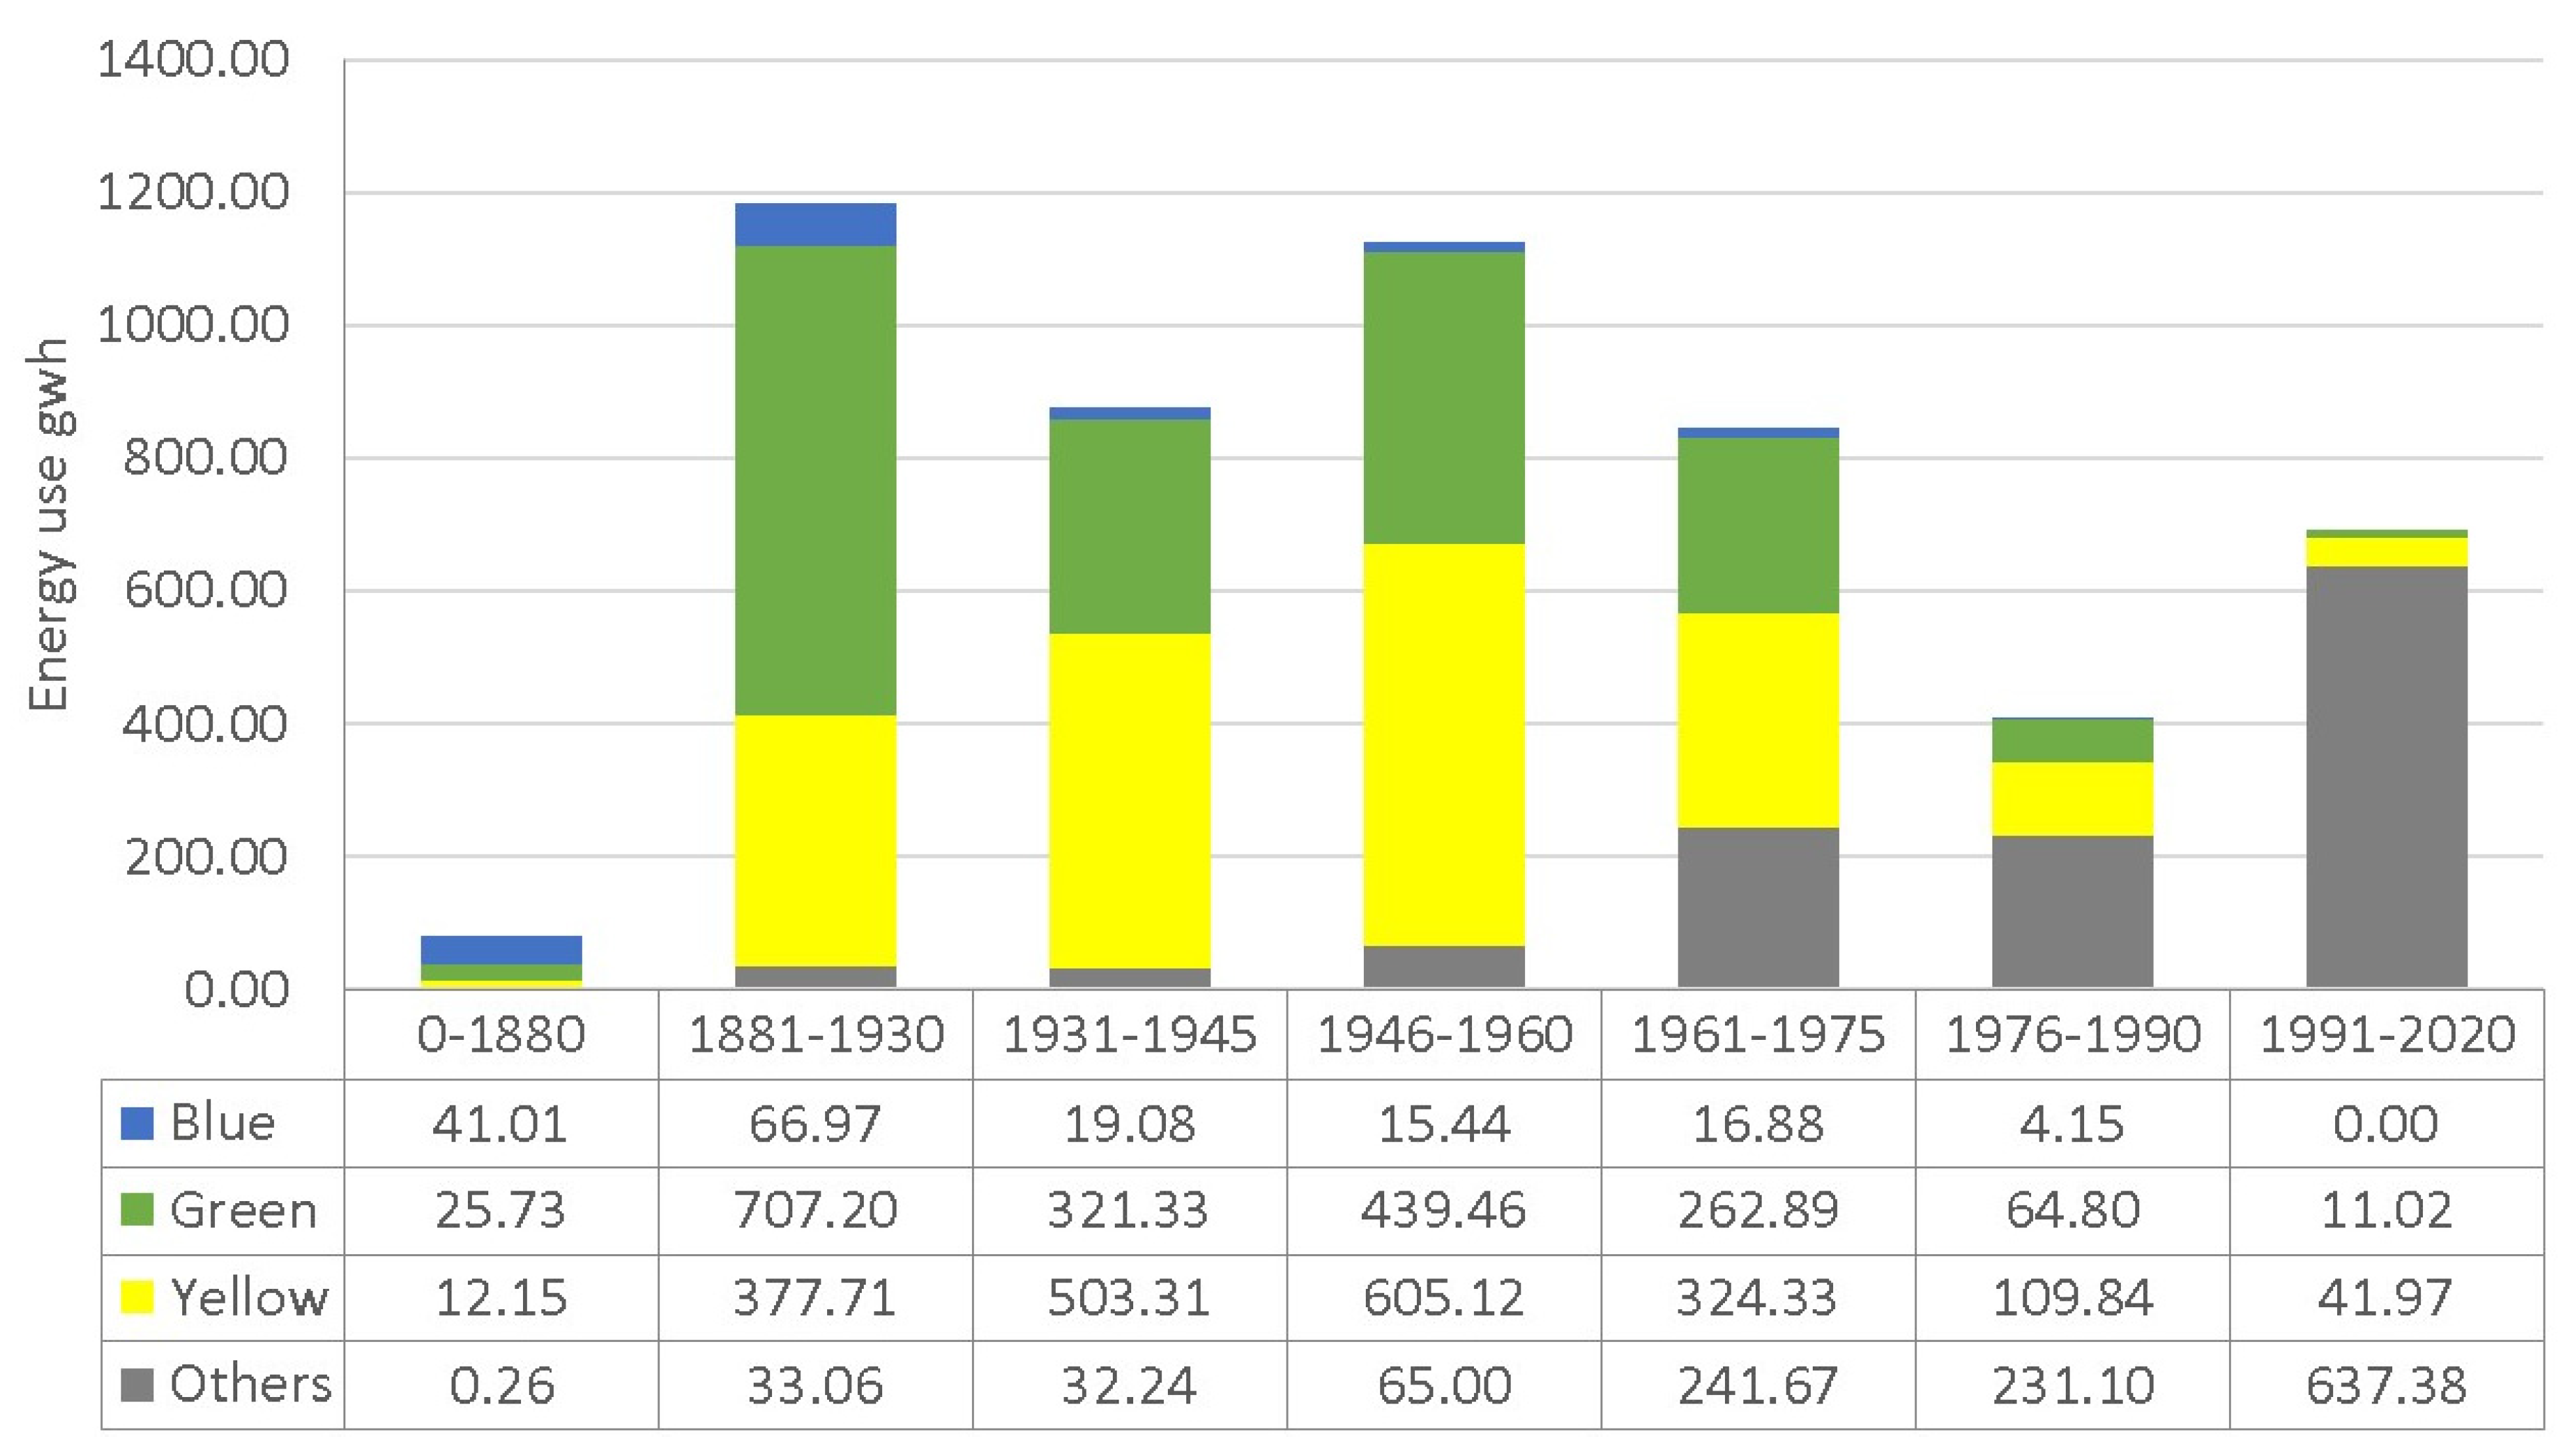
In Stockholm (see
Figure 8), energy use in the heritage classified part of the building stock is significant for the multifamily buildings due to the high number of classified buildings. In total, 3% of the energy is used in buildings within the highest classification category. For those buildings classified in the green and yellow categories, the figures are, respectively, 34% and 38% of the total energy use in the whole stock of multifamily buildings. The buildings constructed before 1880 consume just 1.6% of the total energy use. The high number of buildings constructed between 1881 and 1960 is also reflected in the amount of total energy used in this part of the building stock.
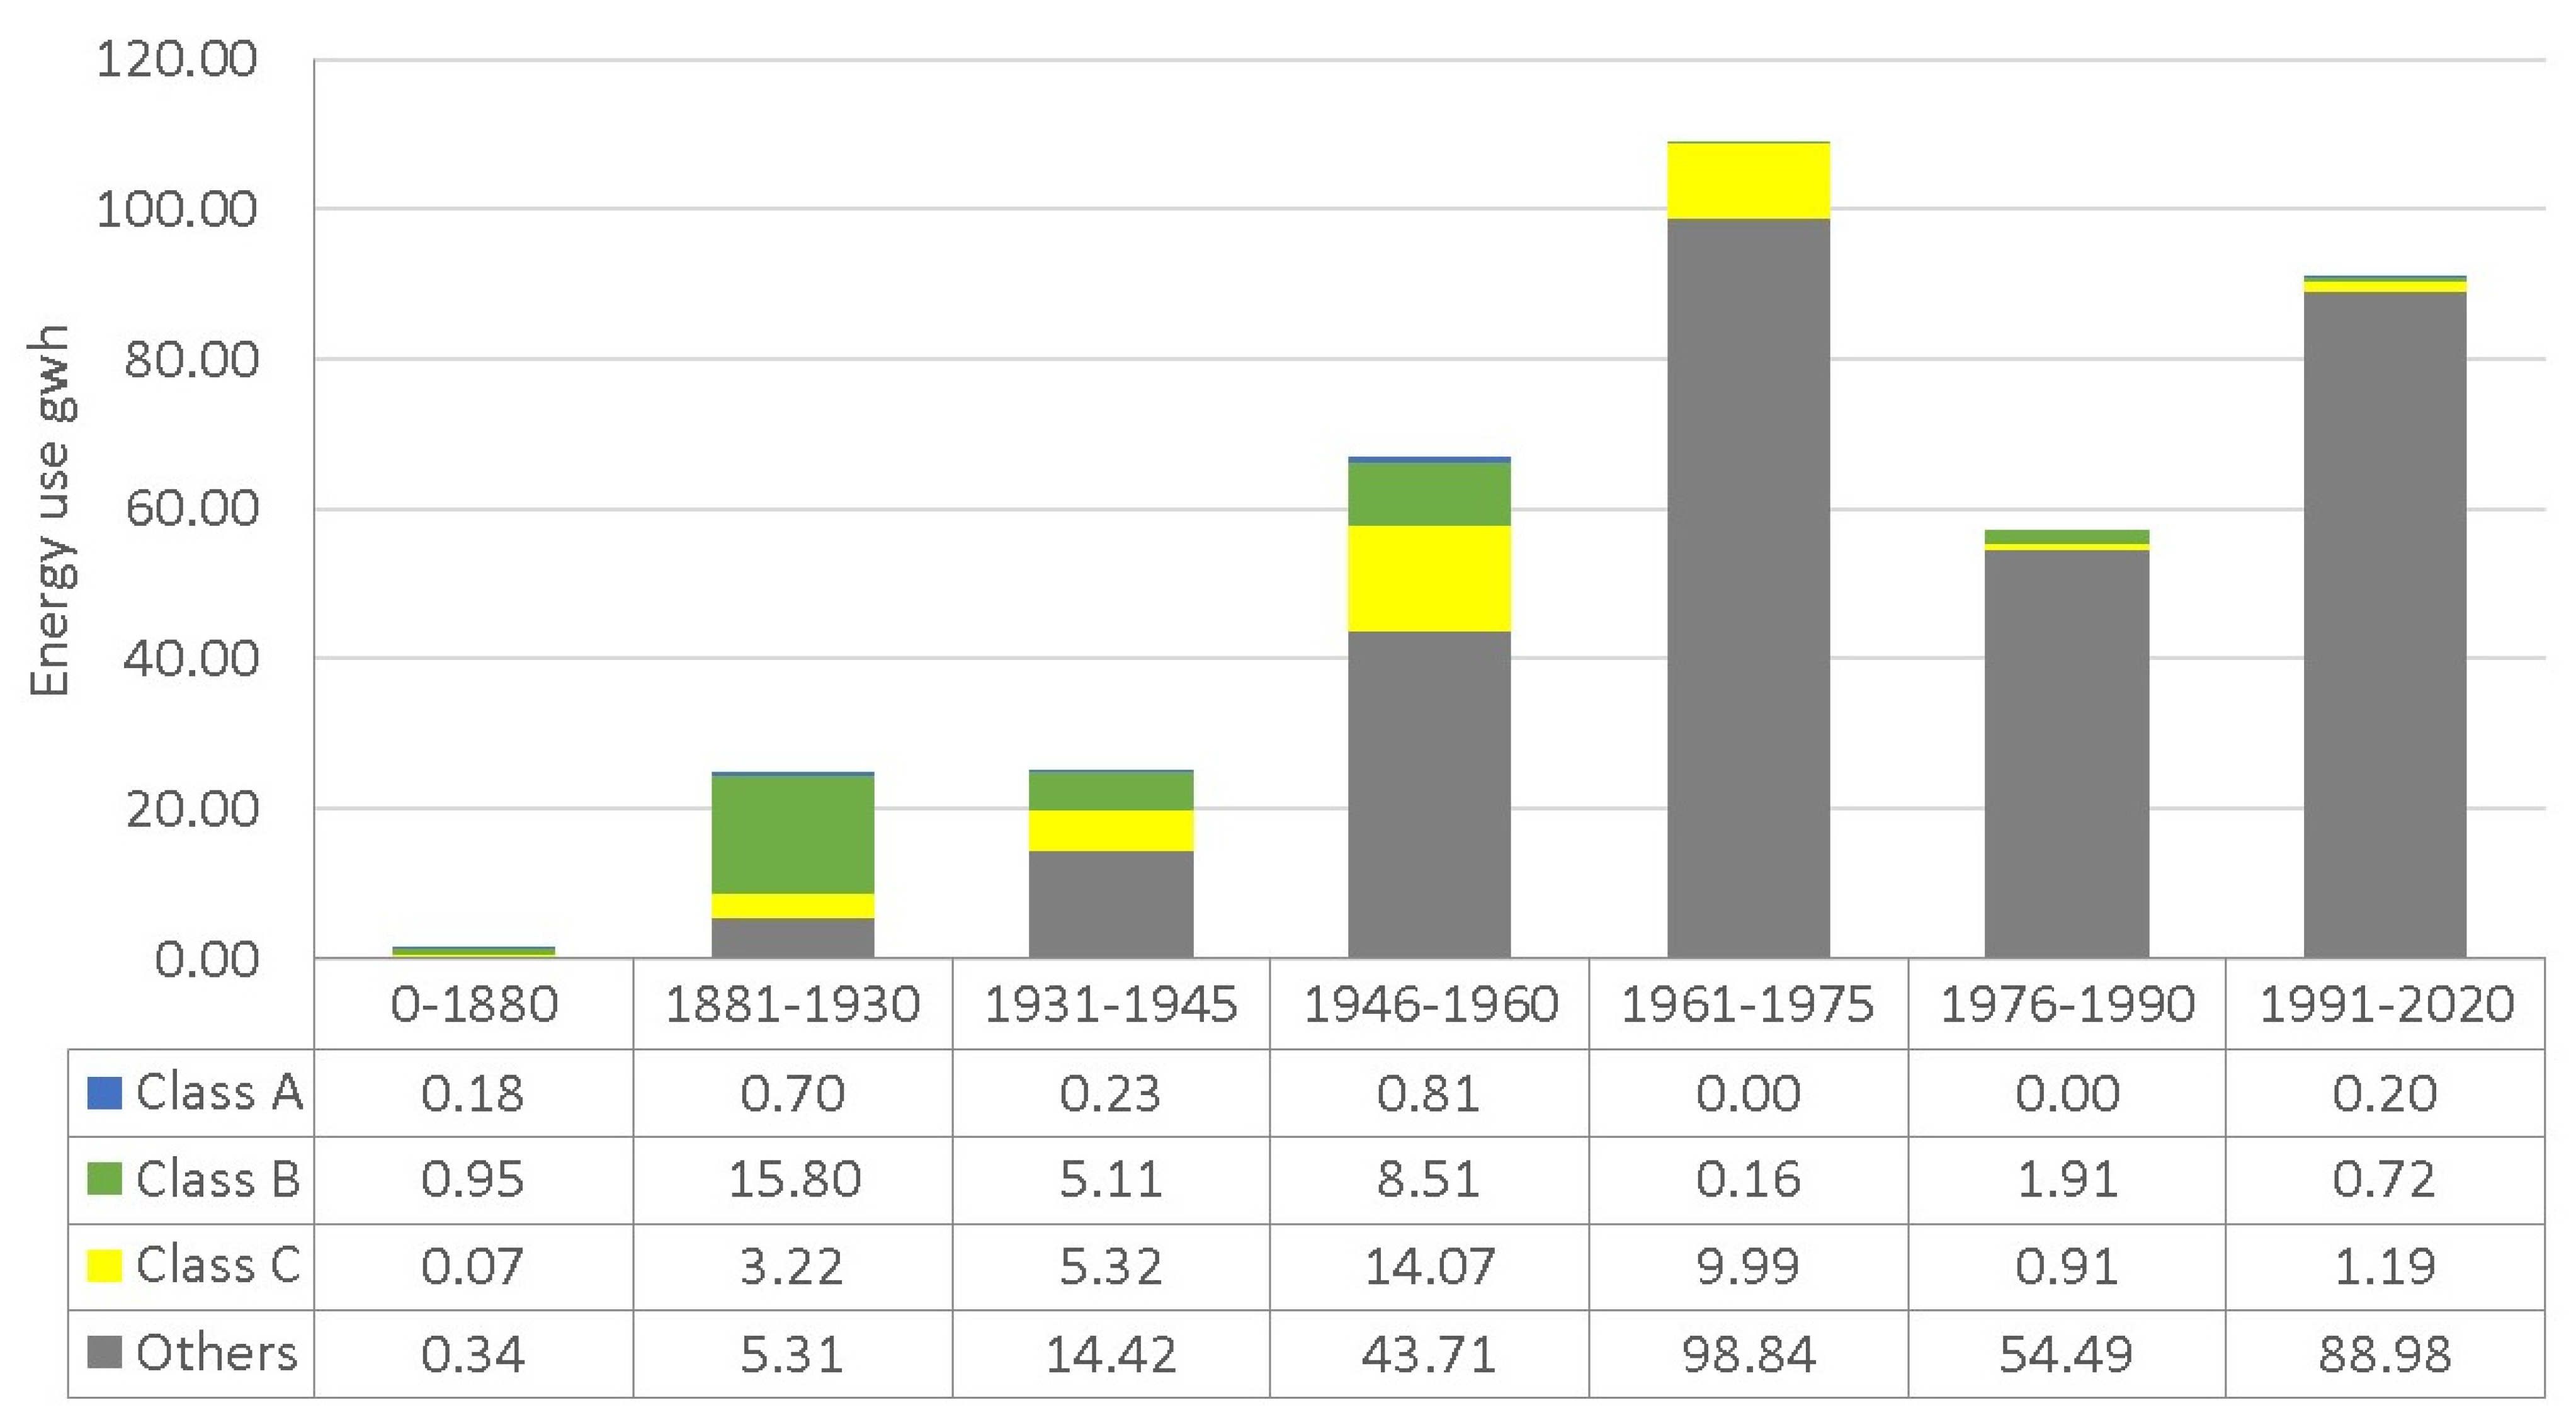
In Halland (see
Figure 9), the energy use in the designated building stock accounts for 21% of the total energy use in the region. The most valuable classified buildings account for 0.3% of energy use and buildings built before 1880 account for 0.2%. The designated and classified buildings in category B account for 8% and category C for 13% of the energy used in multifamily buildings in Halland. Buildings constructed between the years 1881 and 1930 and between 1931 and 1945 uses 5% each of the total energy used by the building stock. Buildings built between the years 1961 and 1975 consume the highest amount of energy in this particular building stock accounting for 35% of the total energy use of 532 GWh.
4.5. Energy Performance in Relation to Heritage Classification and Year of Construction
In this section, energy performance (kWh/m2) is shown in relation to the different age ranges and classification groups.
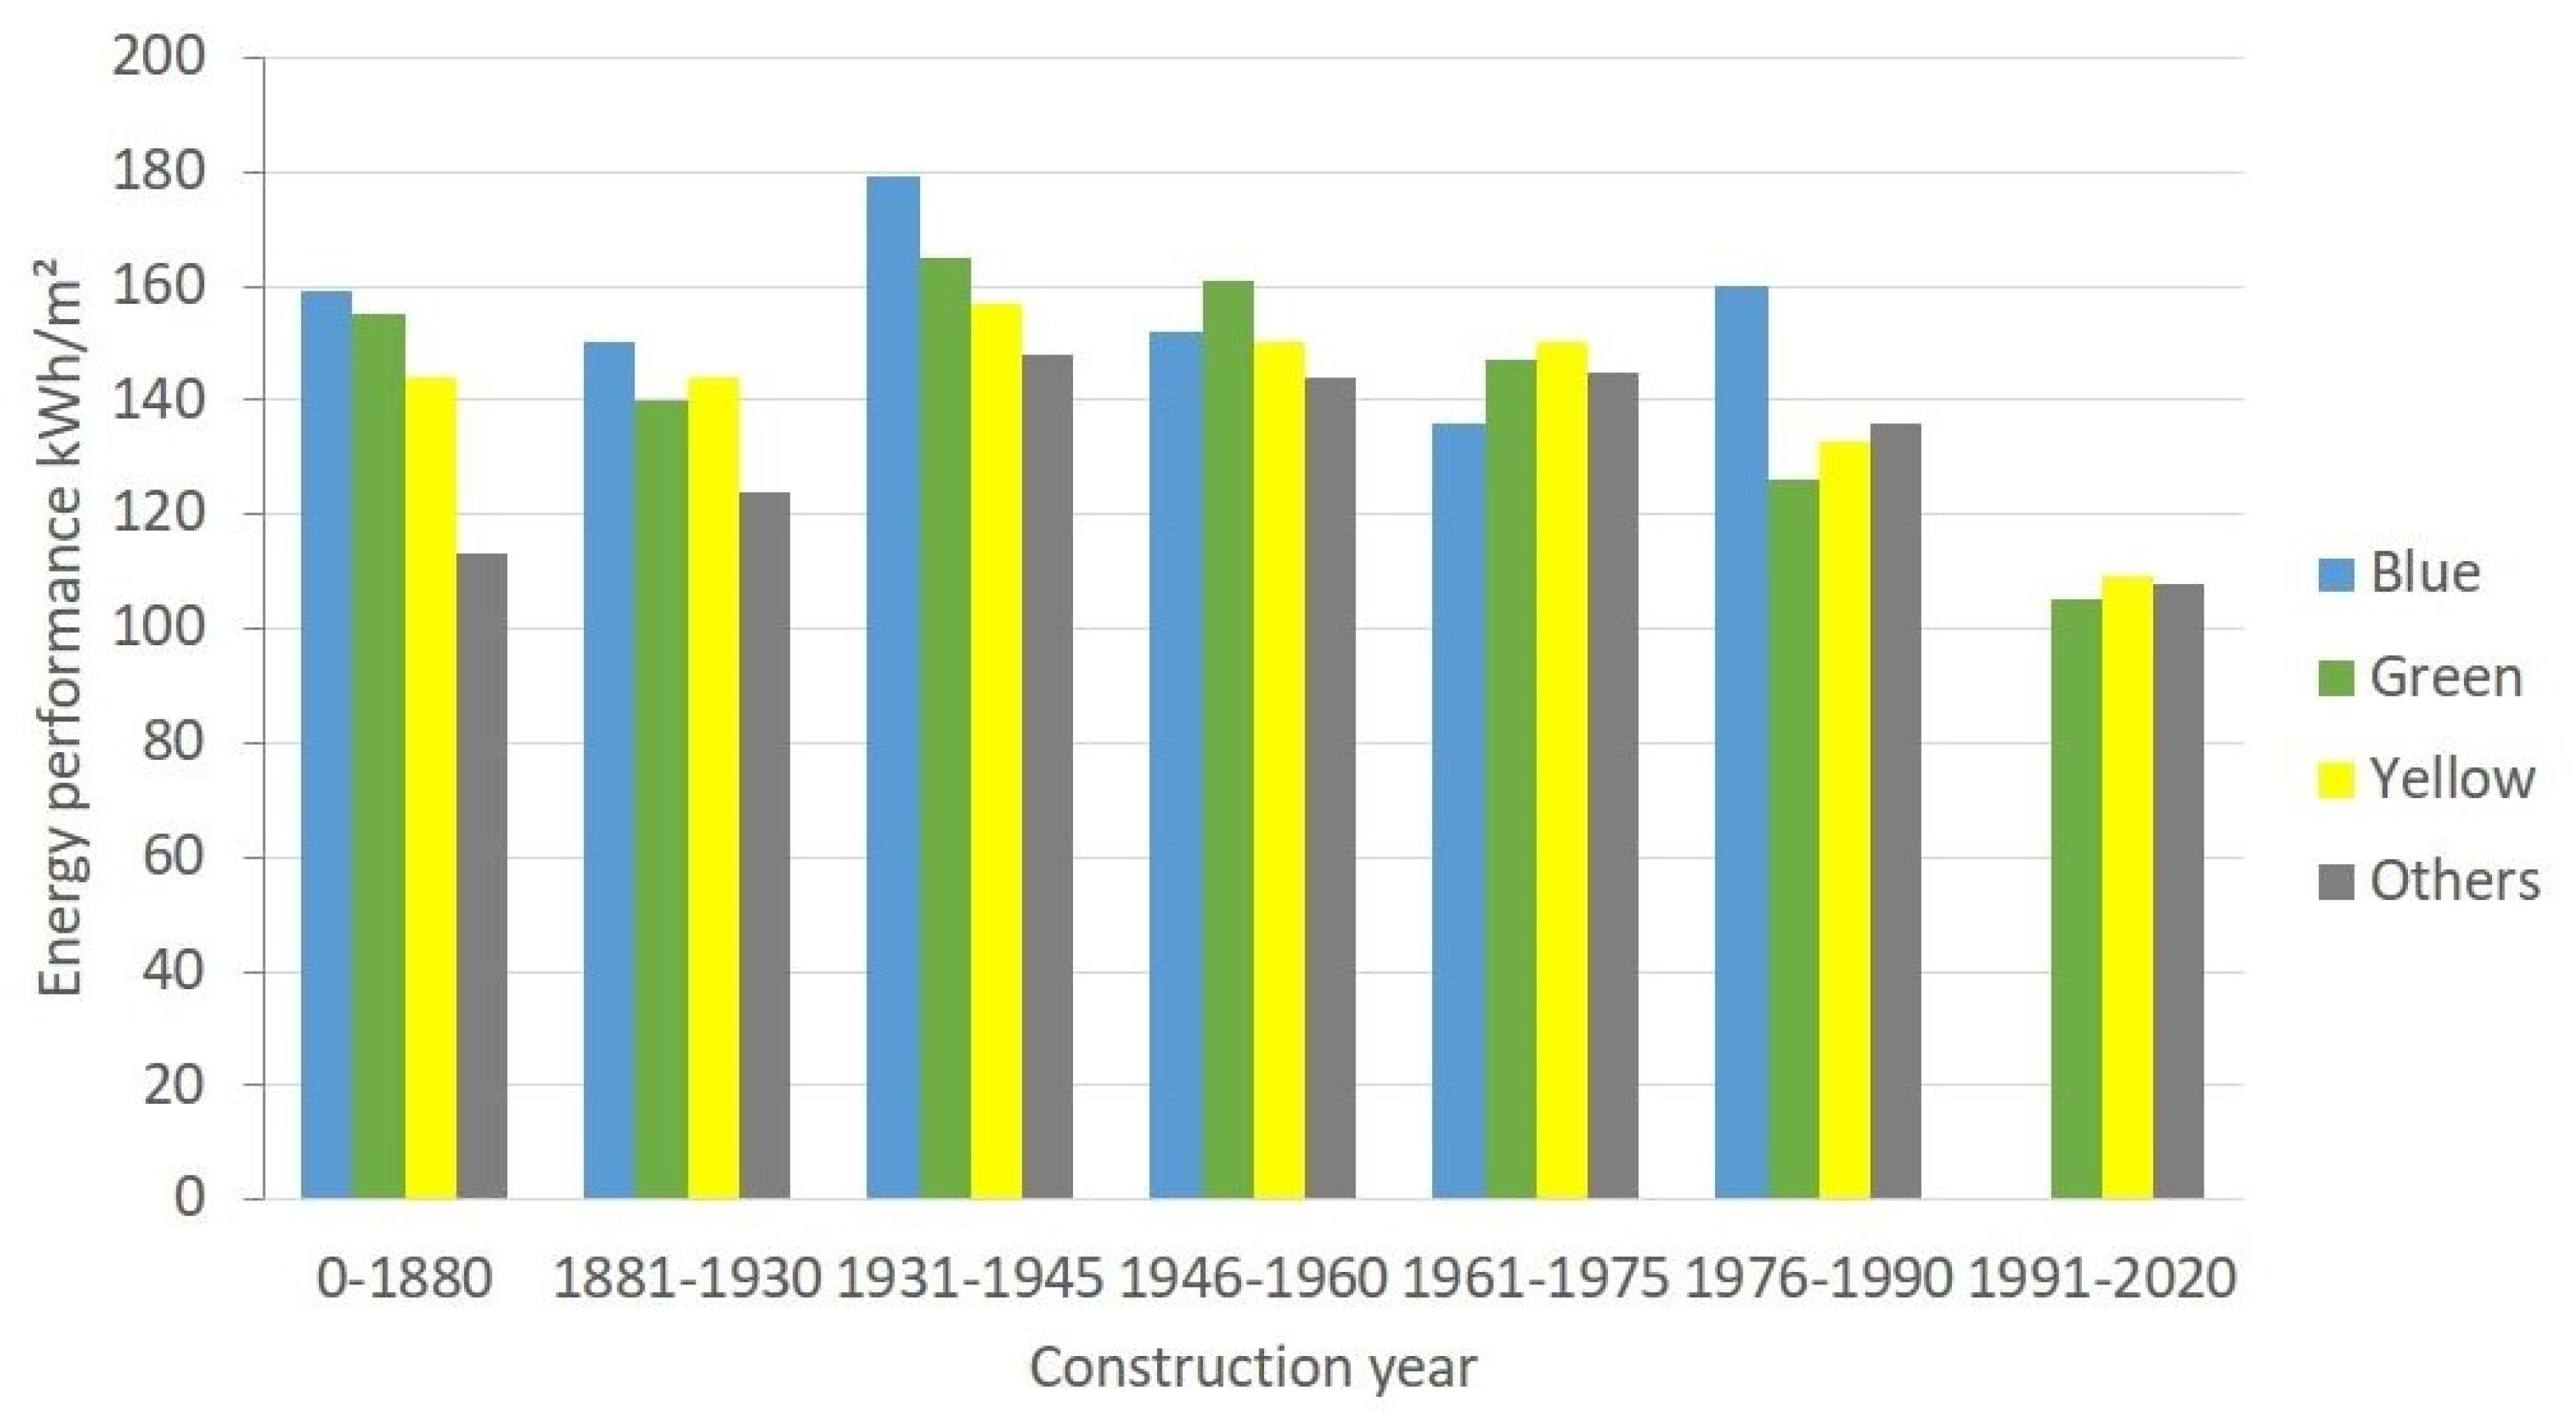
In Stockholm (see
Figure 10), the year of construction has limited significance until the 1990s, whilst heritage classification has a greater impact on energy performance. Until 1946, there is a connection between classification and energy performance: the higher a building is heritage classified, the worse it performs. However, the oldest buildings perform better than buildings constructed during the period 1931–1945. These buildings have the highest energy use as a group as well as within each heritage class. Unclassified buildings perform slightly better than classified buildings until 1961. In the buildings constructed between 1946–1960 and 1961–1975, the most valuable buildings from a heritage perspective perform better than the other buildings.
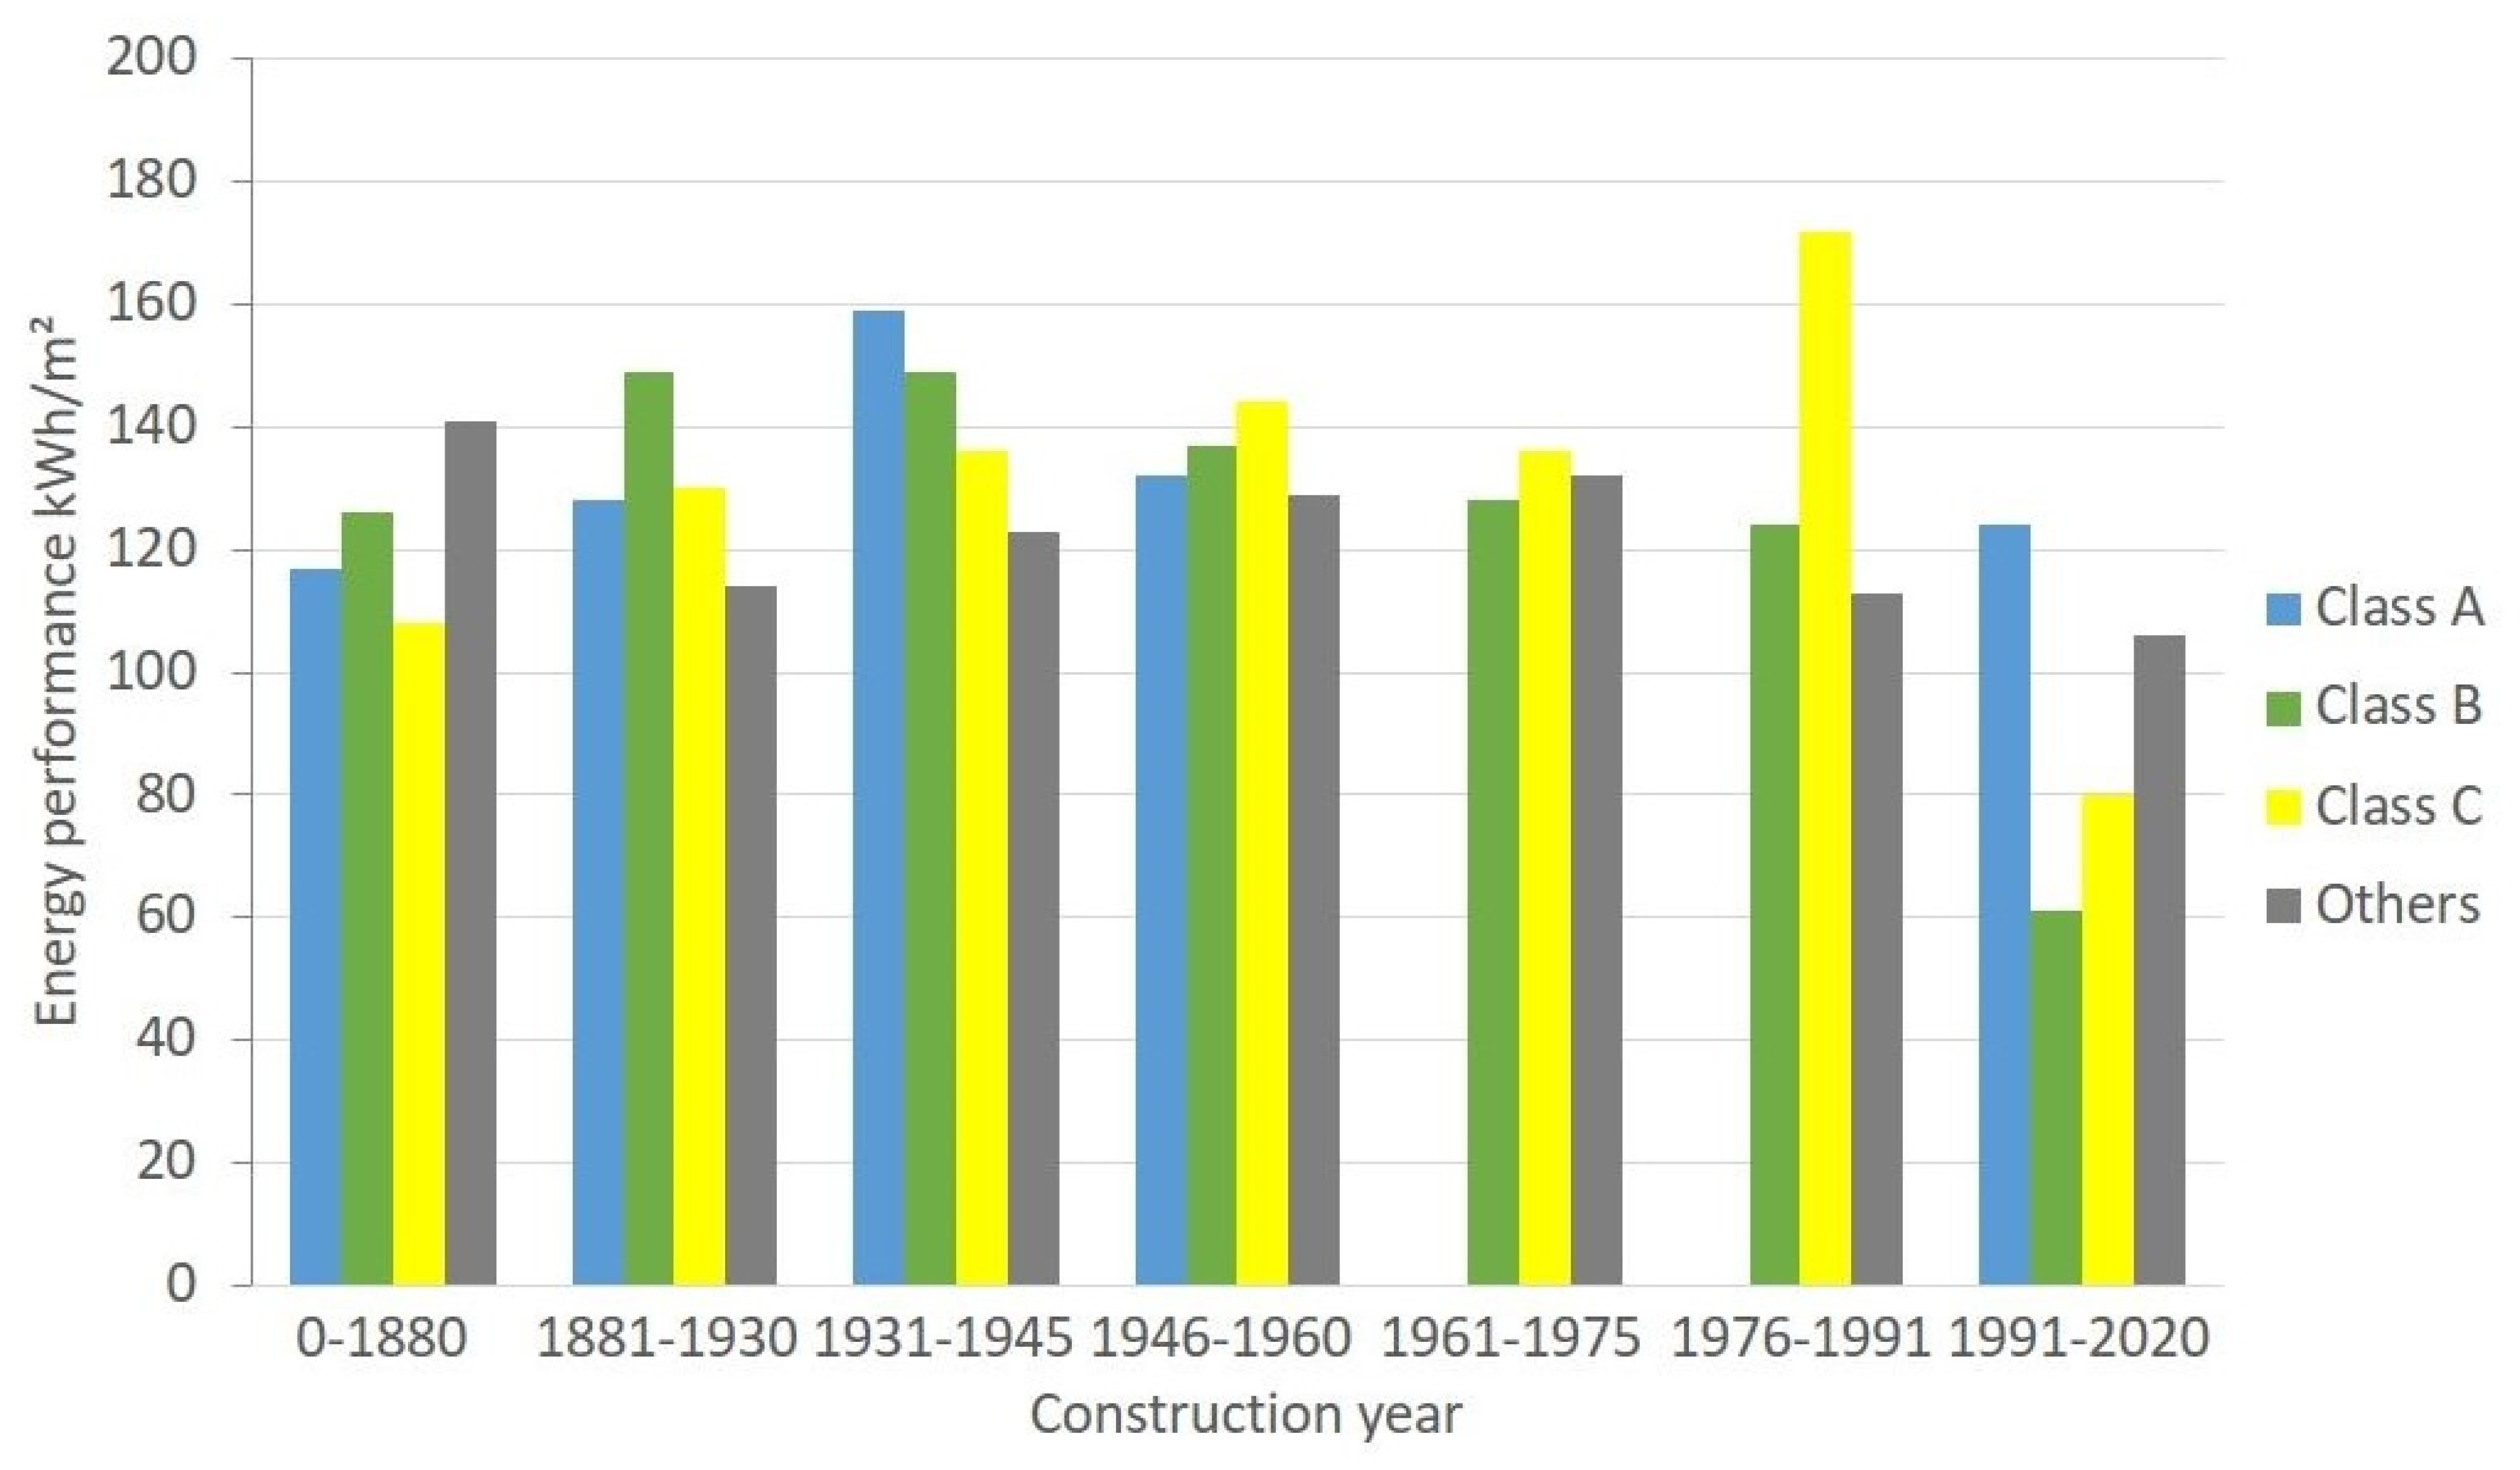
In Halland (see
Figure 11), age has only a small significance when it comes to energy performance. The oldest buildings (i.e., those built before 1880) perform slightly better than younger buildings, especially when looking at the highest classification of heritage classified buildings. The highest classified buildings (A) perform worse only in the age groups 1931–1945 and 1991–2020. The relationship between classification and energy performance is not clear in this case. The only buildings reaching the energy performance standard set by the national building regulations are the heritage B and C classified buildings built between 1991 and 2020.
5. Discussion
By combining information from different building data sources, we can provide new information as input for the development of differentiated energy renovation strategies that take into account the diversity between and within the historic building stocks. The two case studies, one urban (Stockholm) and one rural (Halland), reflect the heterogeneity of the Swedish Building stock. The differences between the two areas requires differentiated national strategies for energy renovations. Furthermore, we show how the differences within each building stock indicate a need for differentiated energy renovation strategies than is common in present practice.
For Stockholm, an energy renovation strategy should take into account the large amount of buildings designated with heritage values. Furthermore, differentiated energy goals and proposed measures should be adapted to the circumstances of the different classification categories, construction year periods and architectural styles. The buildings designated with the highest heritage classification (blue) and all buildings erected before 1881 represent a very small part of the total energy use. They are not a priority in order to reach national and regional energy targets, and energy improvements should consist only of measures that do not change the material and visual characteristics of the buildings. The buildings in Stockholm with either green or yellow classification represent a significant part of the total energy use and should not be exempted from energy improvement measures. Buildings built between the year 1881 and 1931 and designated with the second highest classification (green) should have their energy performance improved using only measures that do not distort the material and visual characteristics of the buildings. Buildings with the lowest classification (yellow) should have their energy performance improved as far as possible, whilst having regard to protecting the character defining elements of the buildings.
For the building stock in Halland, an energy renovation strategy should take into account the small number of buildings identified with heritage values. In contrast to Stockholm, the improvement of the historic buildings is not central to reaching general national and regional targets. Buildings with the highest heritage classification (1), and all buildings built before 1931 should as far as possible undergo energy improvements without changing the visual or material character of the buildings. Buildings with the second highest heritage classification (2) and buildings built between 1931 and 1945 should as far as possible have energy improvements measures that do not distort the material and visual character of the buildings. Buildings with the lowest classification (3) should be improved as far as possible but with regard paid to protecting the character defining elements of the buildings.
Large parts of the energy used by buildings in Stockholm can be attributed to the heritage classified building stock while the opposite is the case for Halland. The challenge in Stockholm will be how to manage the buildings with the second highest (green) and the lowest (yellow) classification. Halland has a completely different structure to its building stock as a whole with a significantly smaller share of total building energy use being in the classified building stock. The biggest challenge here is the buildings that are classified in the second category (B) and were built before 1930.
The results show that without proper information about the building stock, general targets and strategies can become blunt tools that can cause more damage than benefits if applied in the same way to all buildings, since buildings as well as building stocks differ depending on age, building technology, heritage designation and geographical location. We have brought forward new knowledge about the studied building stocks by linking different sources of building data. By doing this, we show that there is a need for aggregated data about the building stock at national, regional and local level including both cadastral and technical information, and information about heritage-designated buildings. This is necessary in order to facilitate the development of differentiated and adapted policies and guidelines for the historic building stock as part of the ambition to reach not only the climate goals but also the national environmental goal of a “good built environment”. We propose that data about designated historic buildings on a national level should be systematically aggregated with other national databases. This would benefit not only the preservation of the built heritage but also the implementation of the national energy renovation strategy.
6. Conclusions
We have shown a way to develop the knowledge base for historic building stocks by aggregating building specific data and thus making visible relationships that had not previously been recognisable. This method has been implemented on two building stocks. The results from these case studies show how energy use in historic buildings depends on age and heritage classification within the selected districts. It also indicates differences between the two building stocks.
Based on the results we would argue that, both national and regionally, it is necessary to develop differentiated energy renovation strategies for historic building stocks. The differentiation should be based on the year of construction as well as on heritage classification. The strategies should also take into account the geographical diversity of the national buildings stock. This means that the national renovation strategy should acknowledge the differences that exist in historic buildings stocks whether they are urban or rural.
Further research should delve further into the similarities and differences in buildings within the historic building stocks in order to develop targeted energy renovation strategies. As observed above, one important area of further development is to provide comprehensive building information through systematised data collection and centralised national database storing.


