
Patterns of the Expanding City: An Algorithmic Interpretation of Otto Wagner’s Work


Abstract
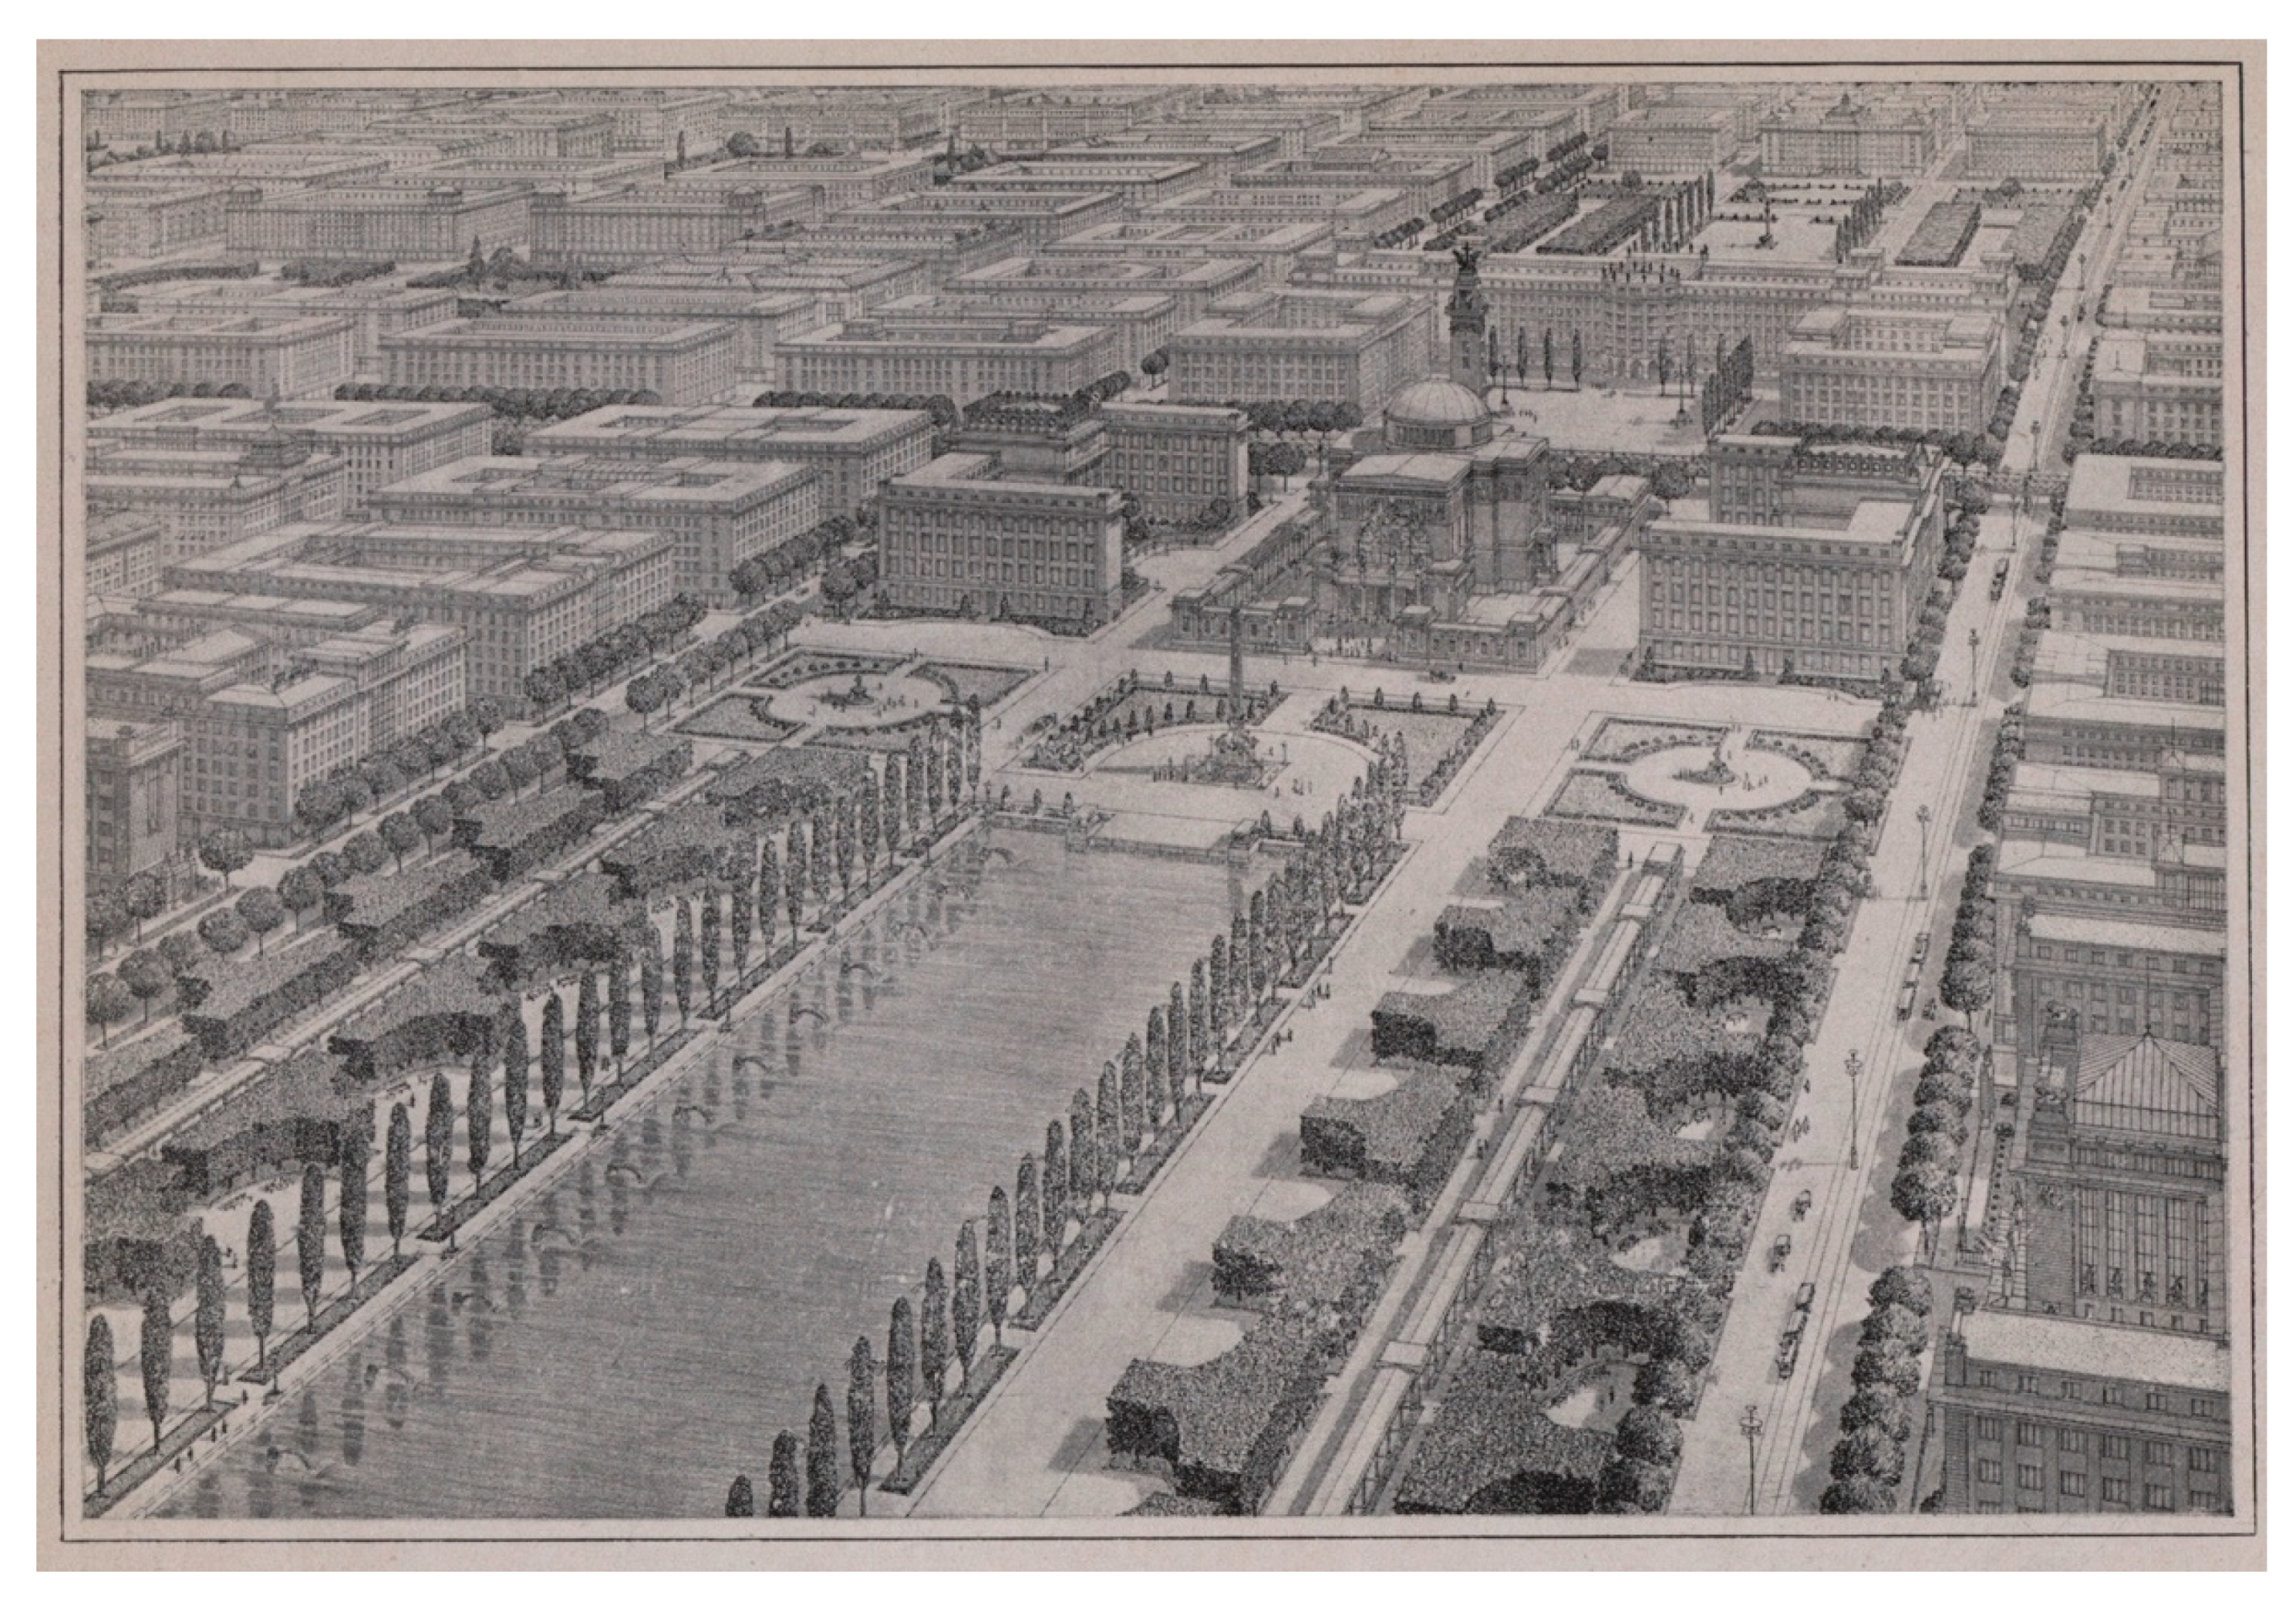
:1. Introduction: Otto Wagner’s Urban Planning Perspectives
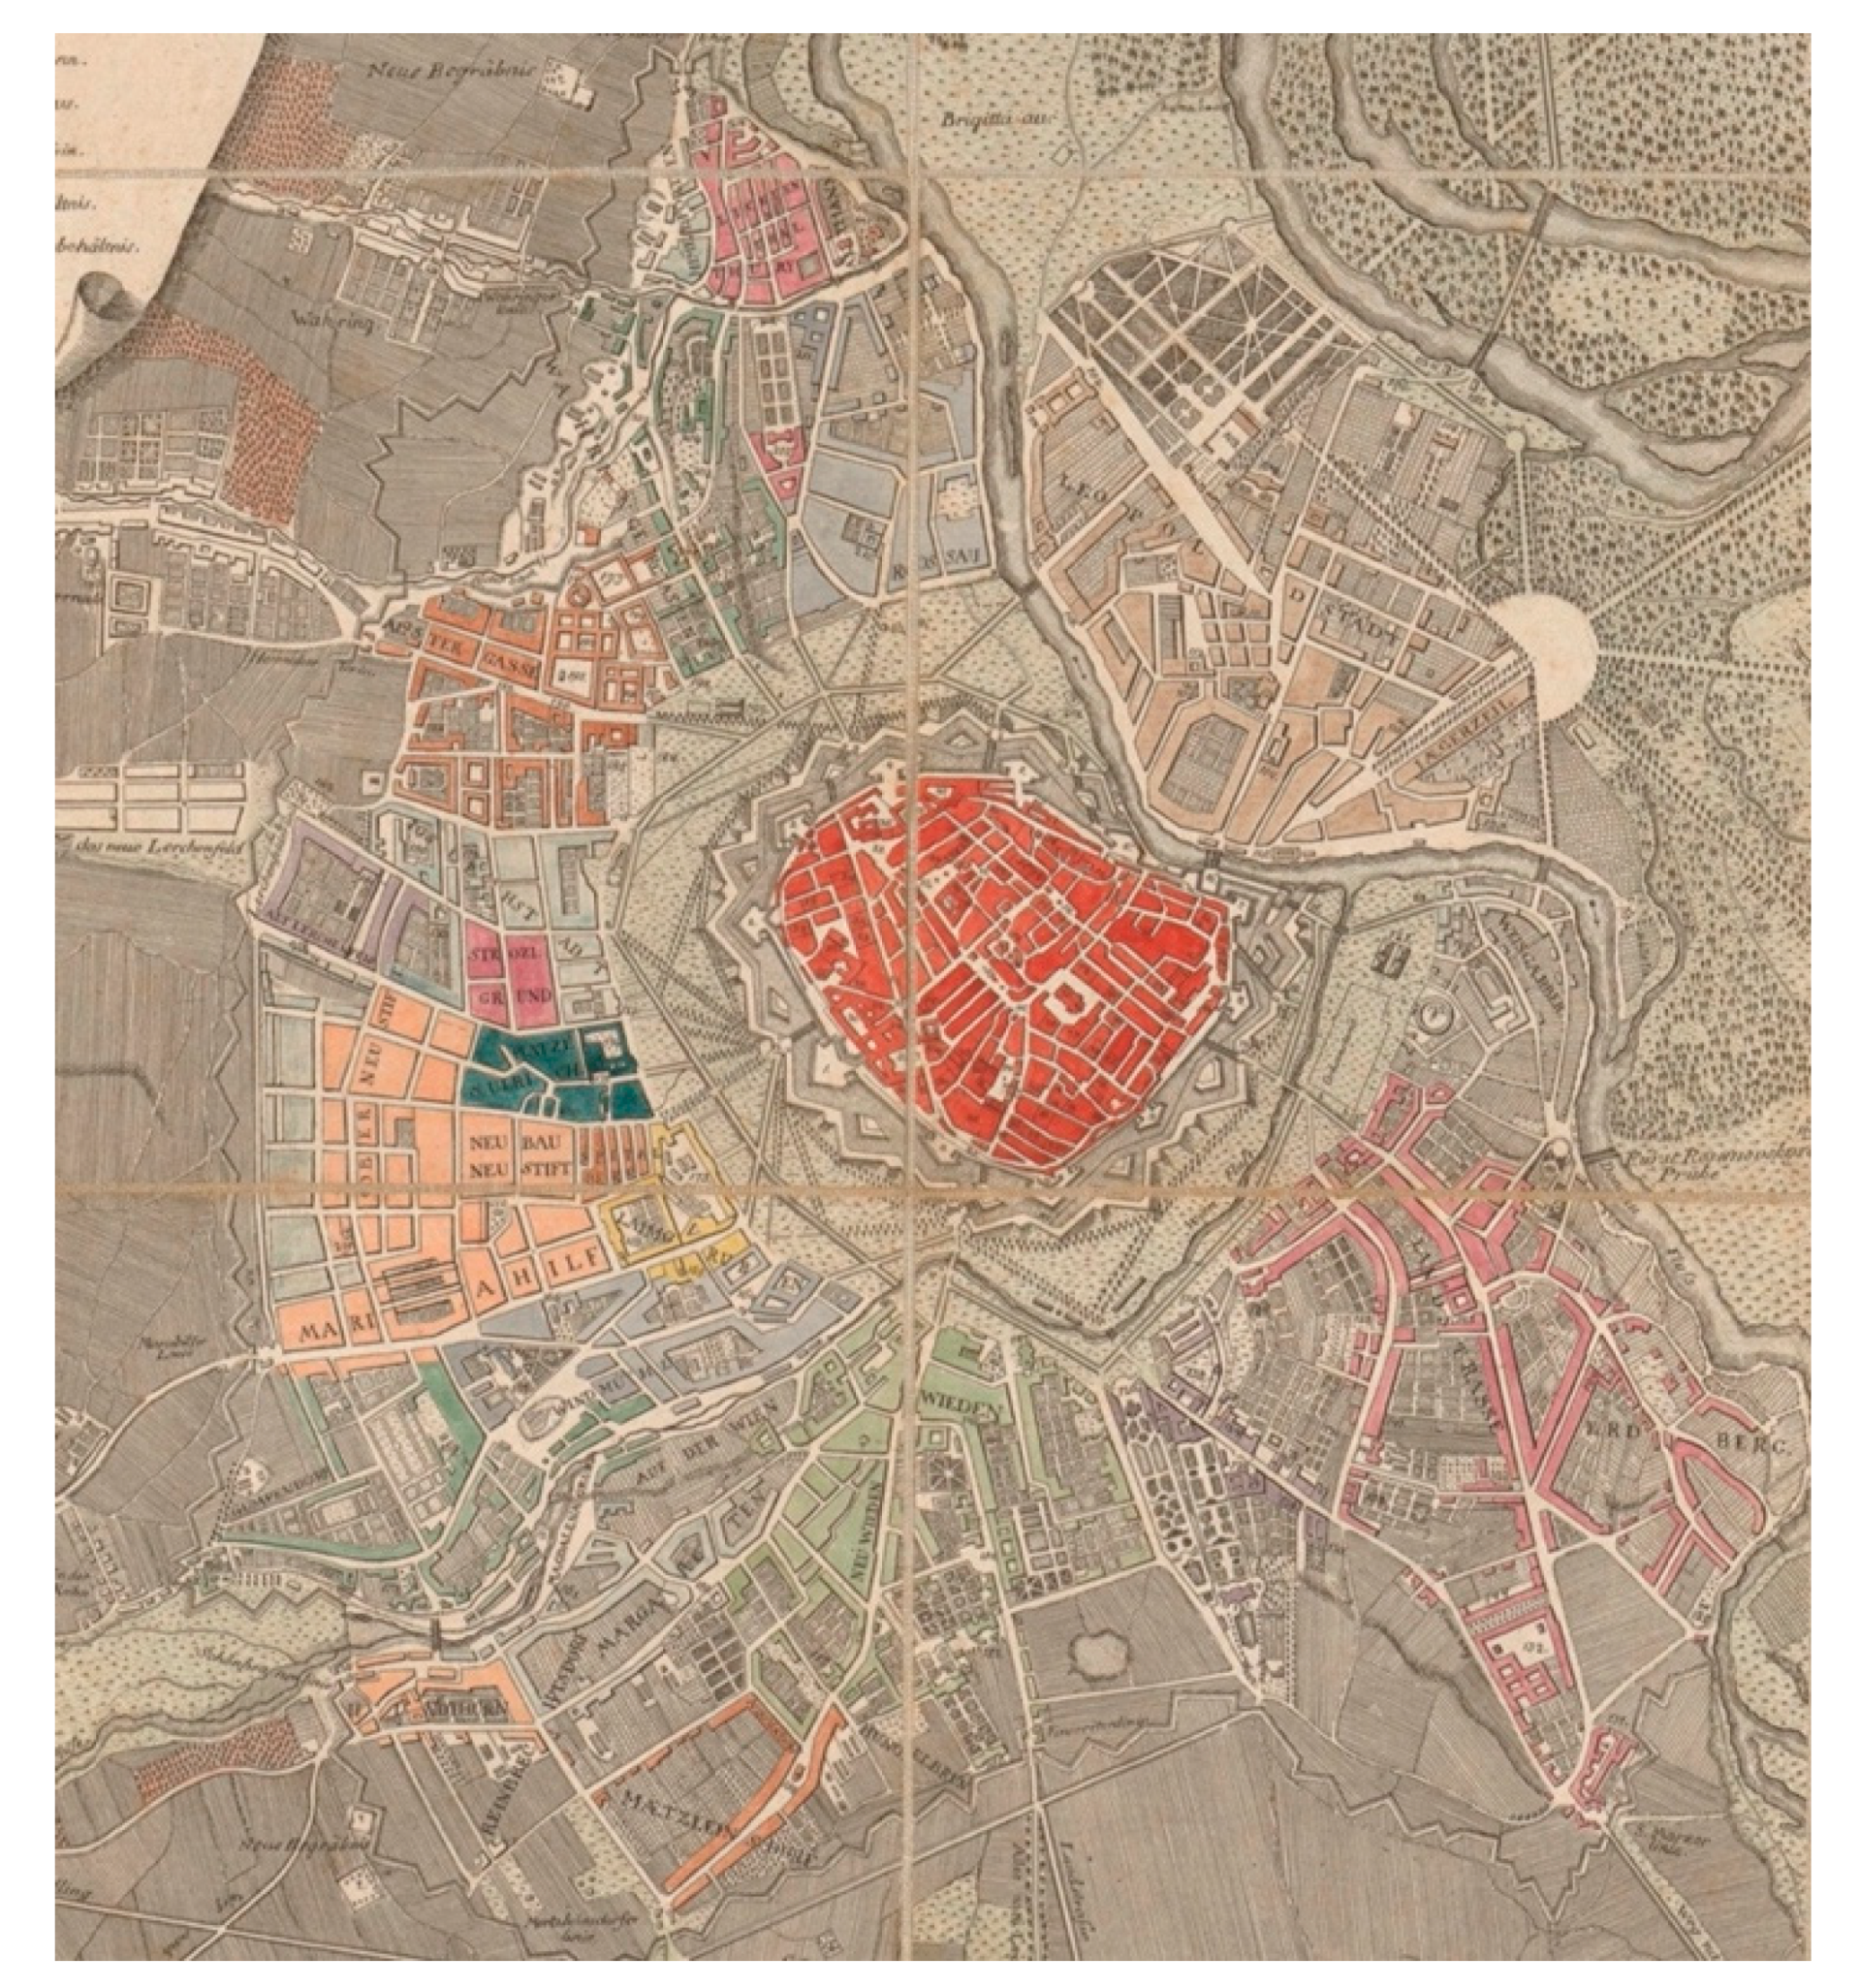
The Roots of Otto Wagner’s Principles and Their Contemporary Context
2. Materials and Methods
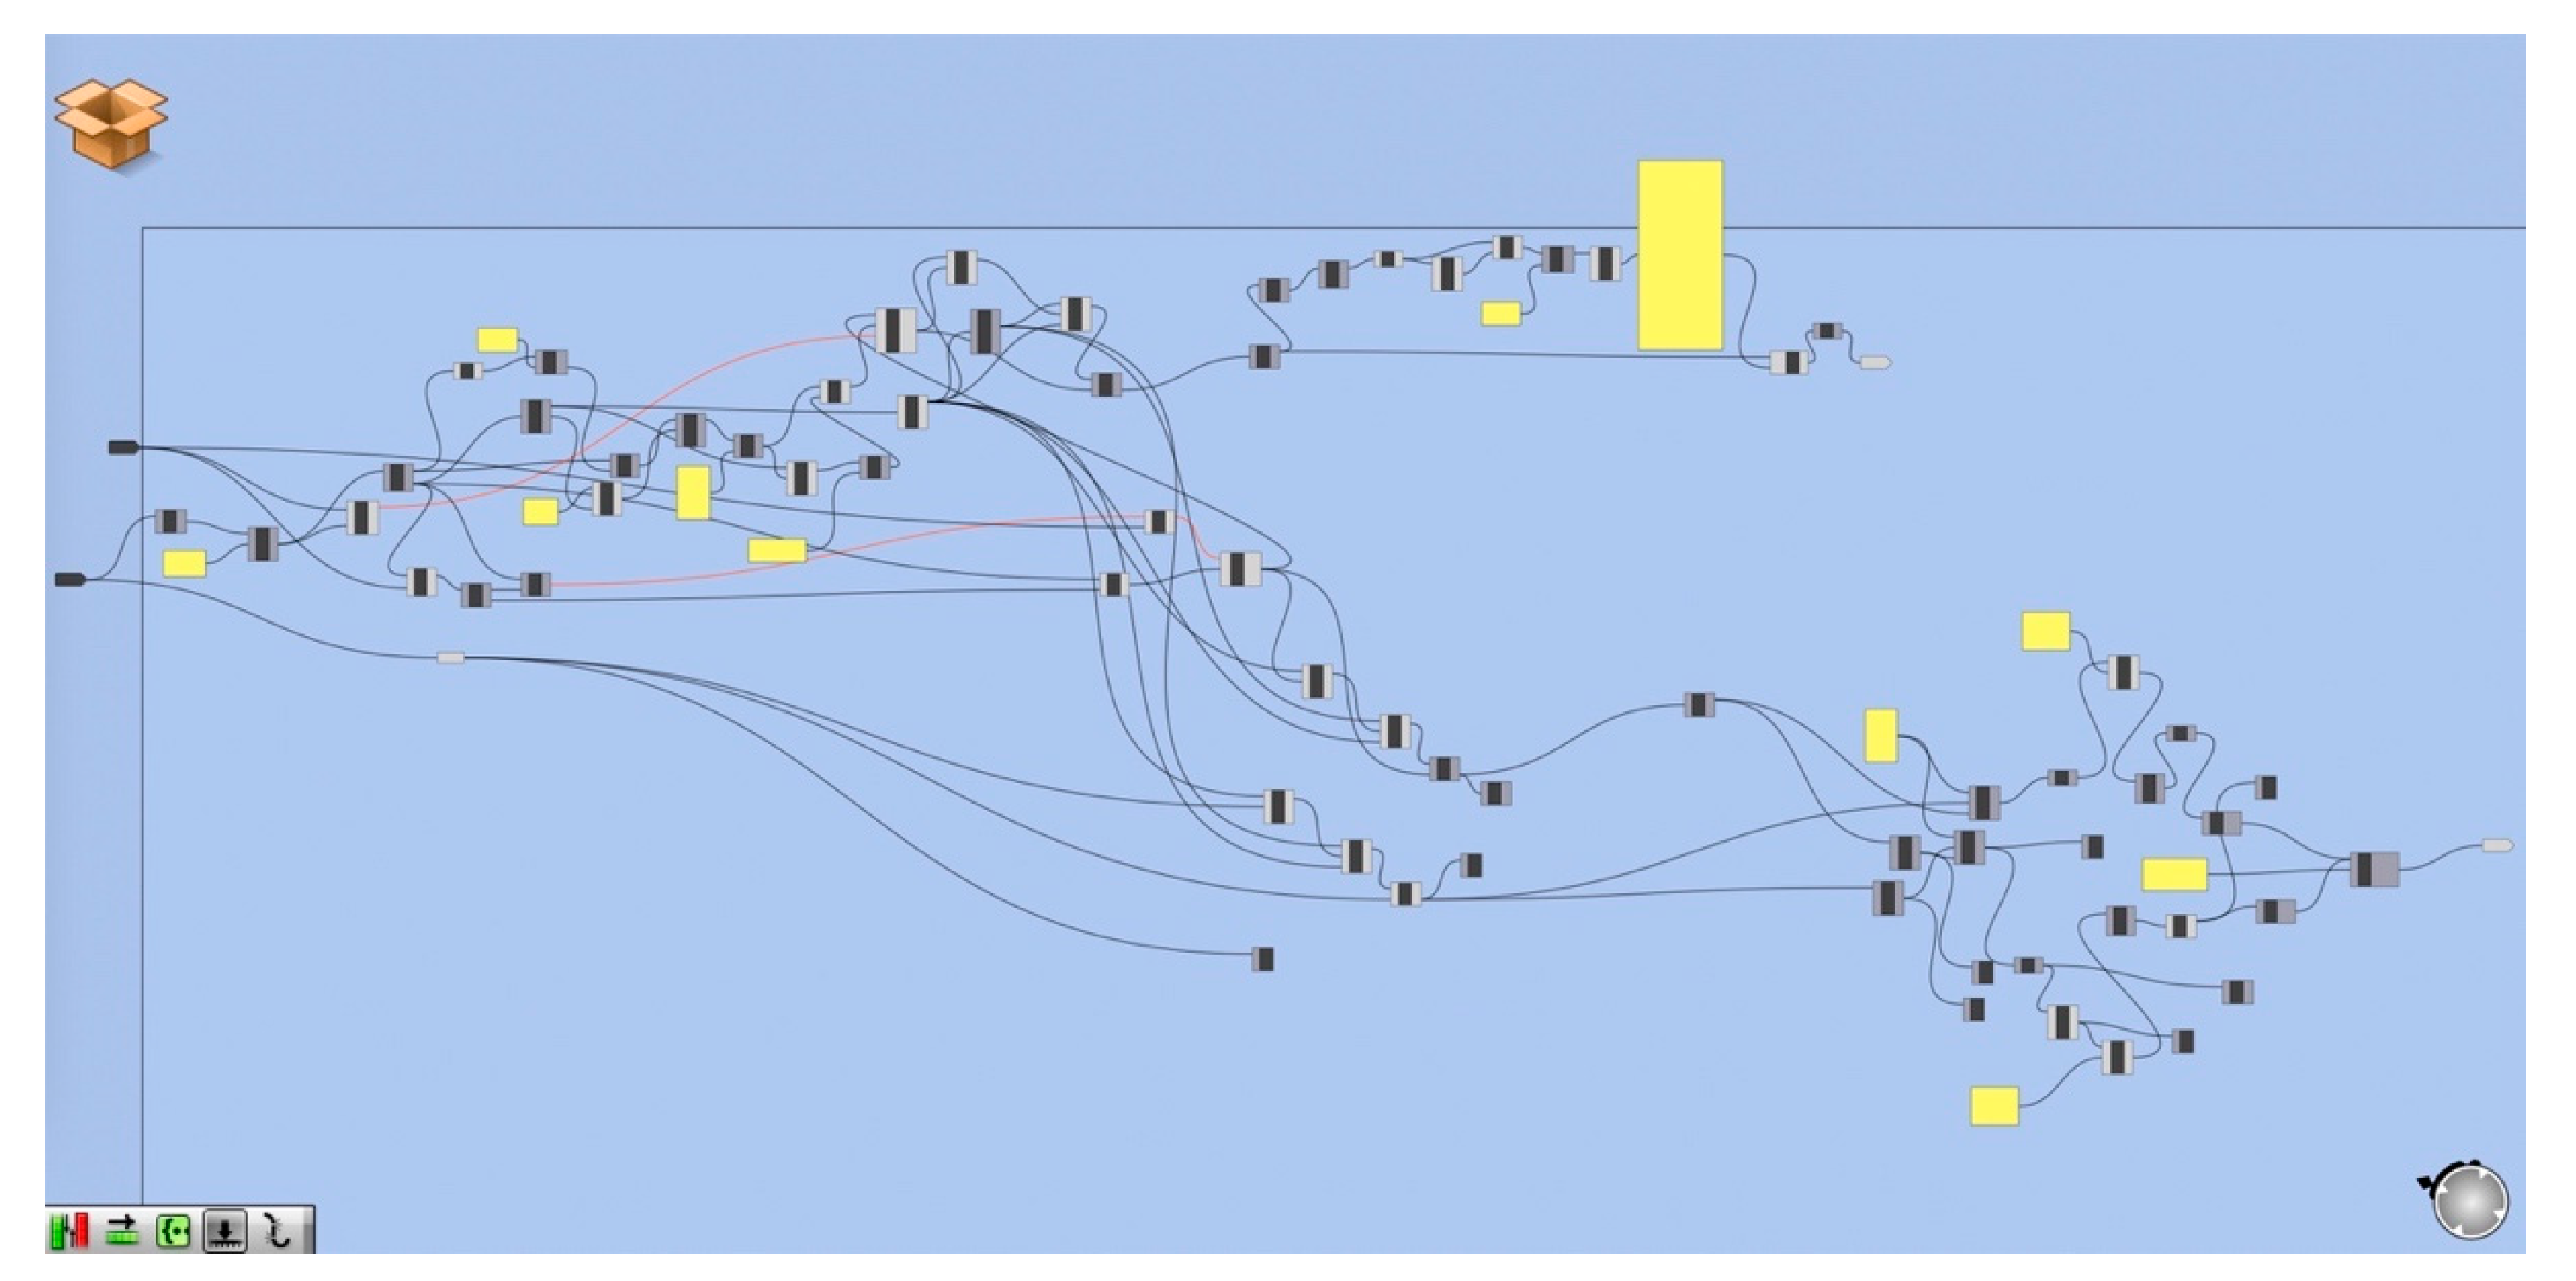
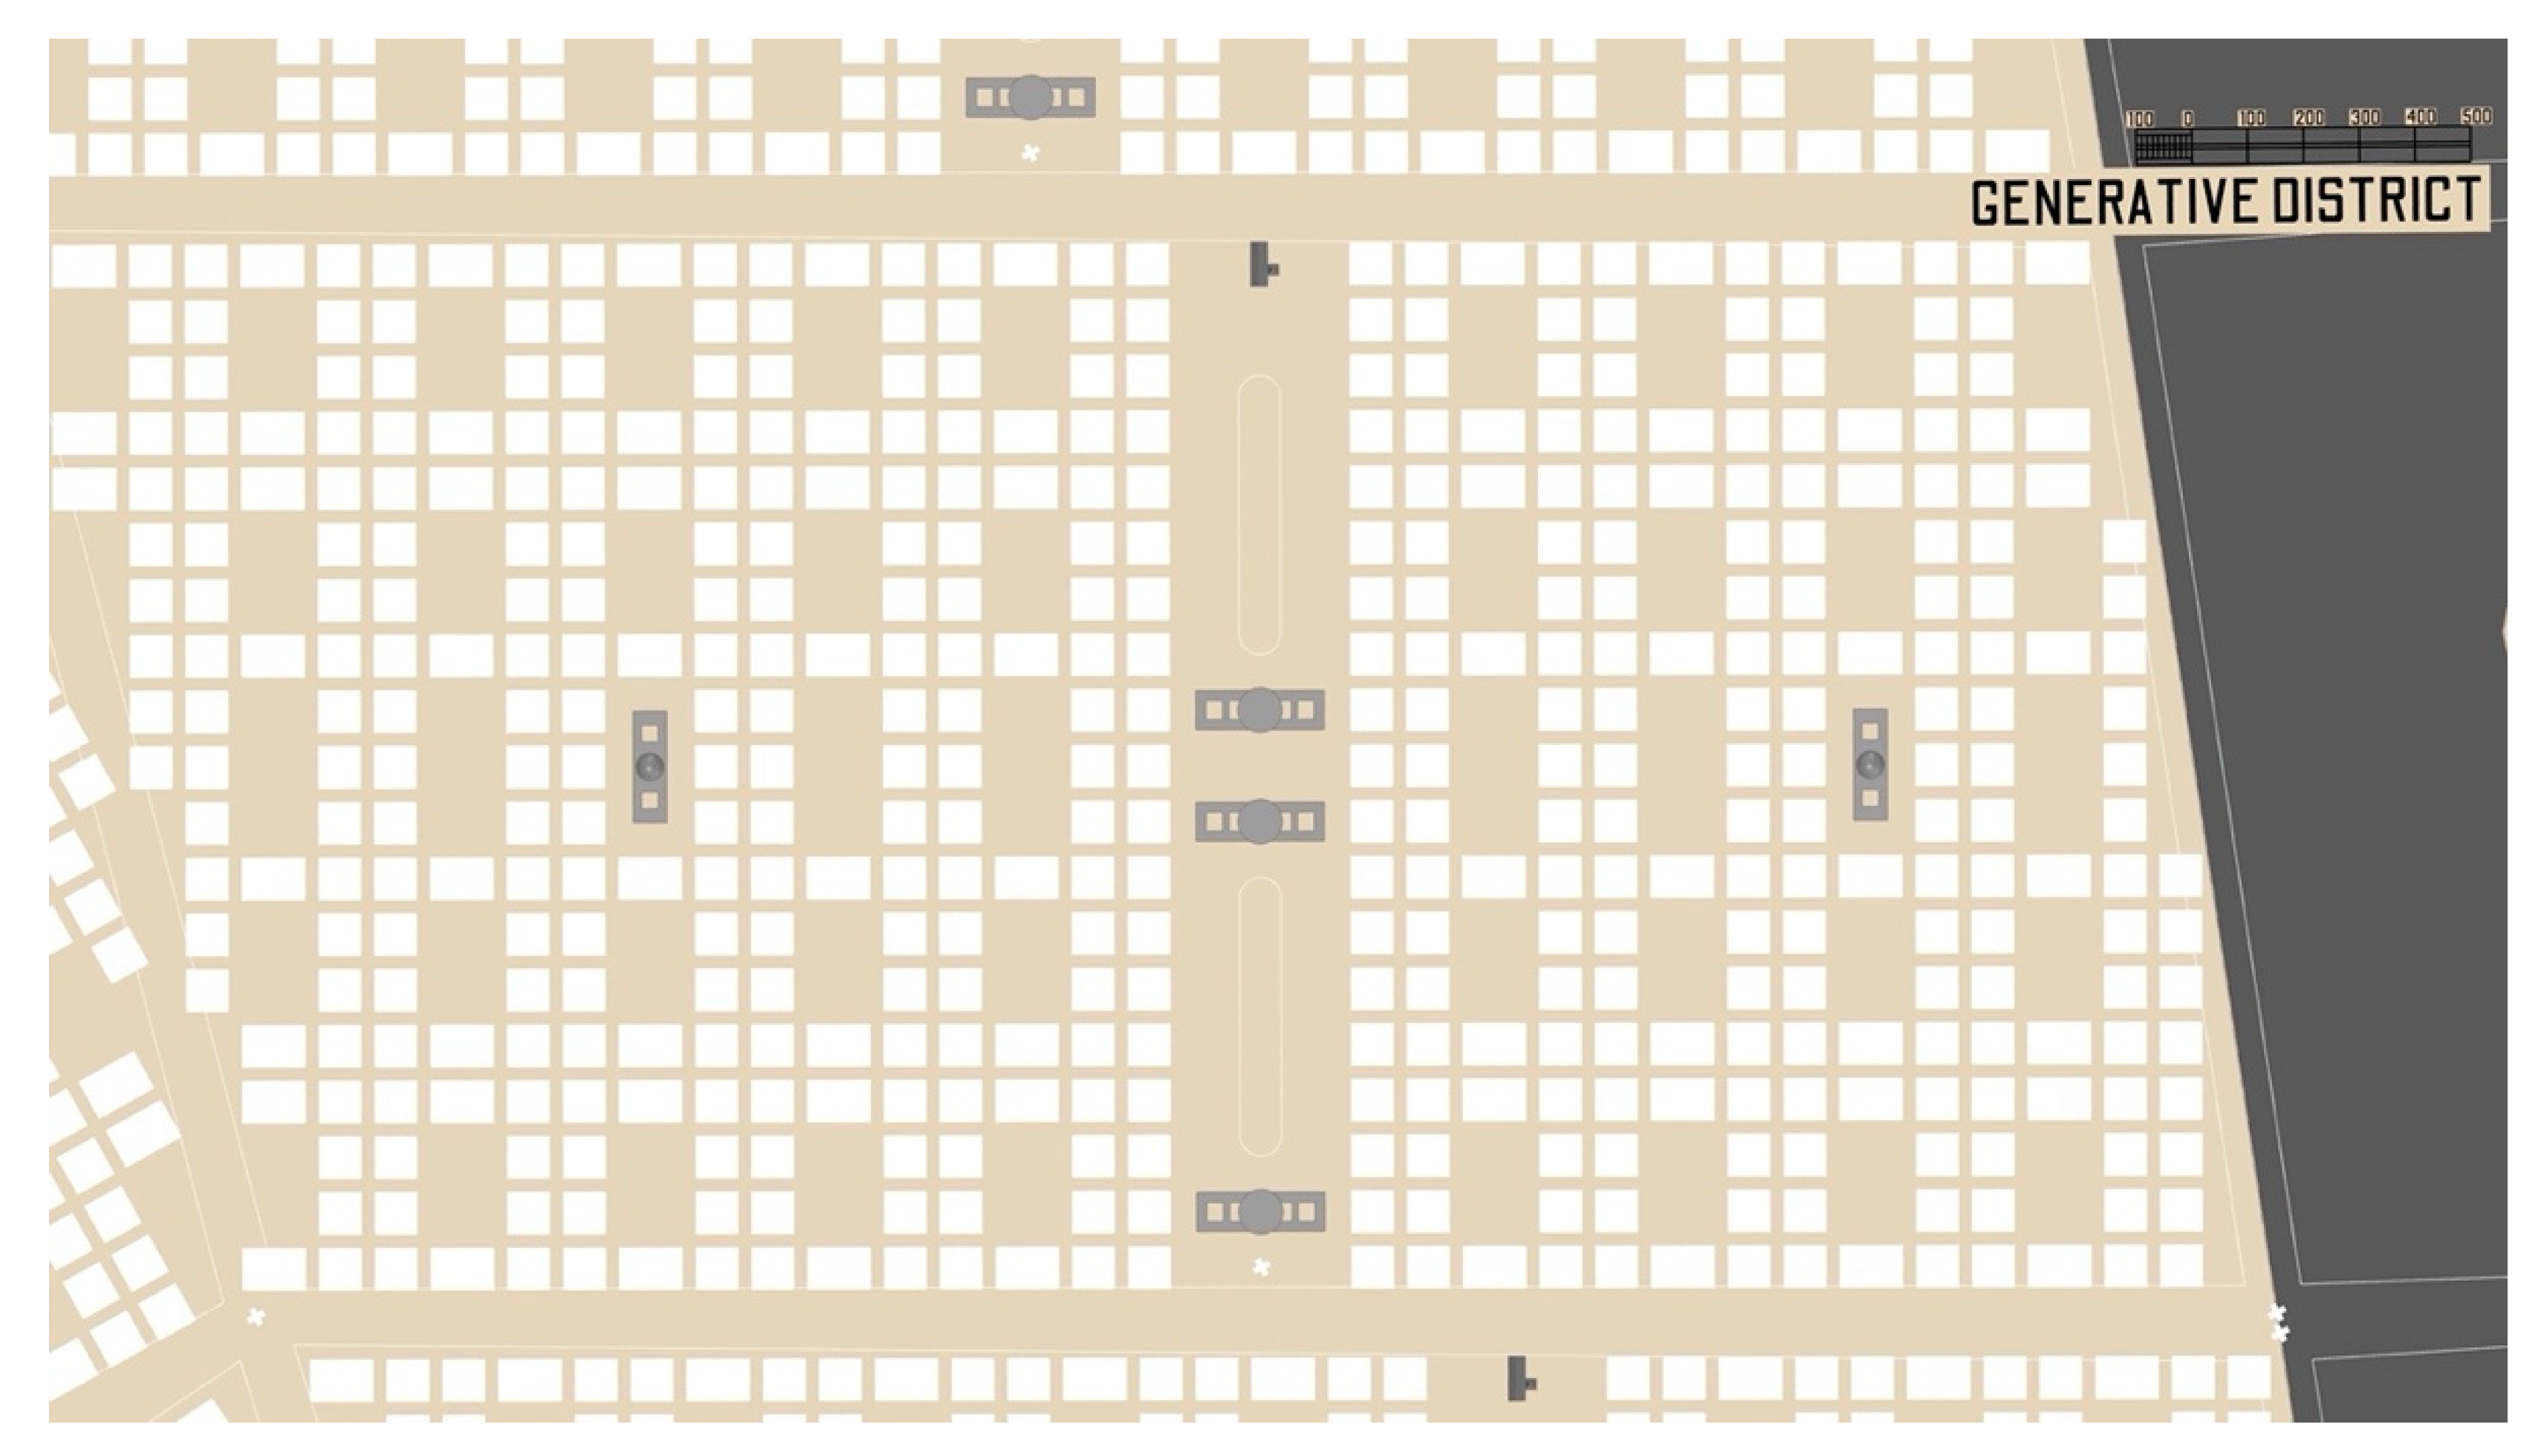
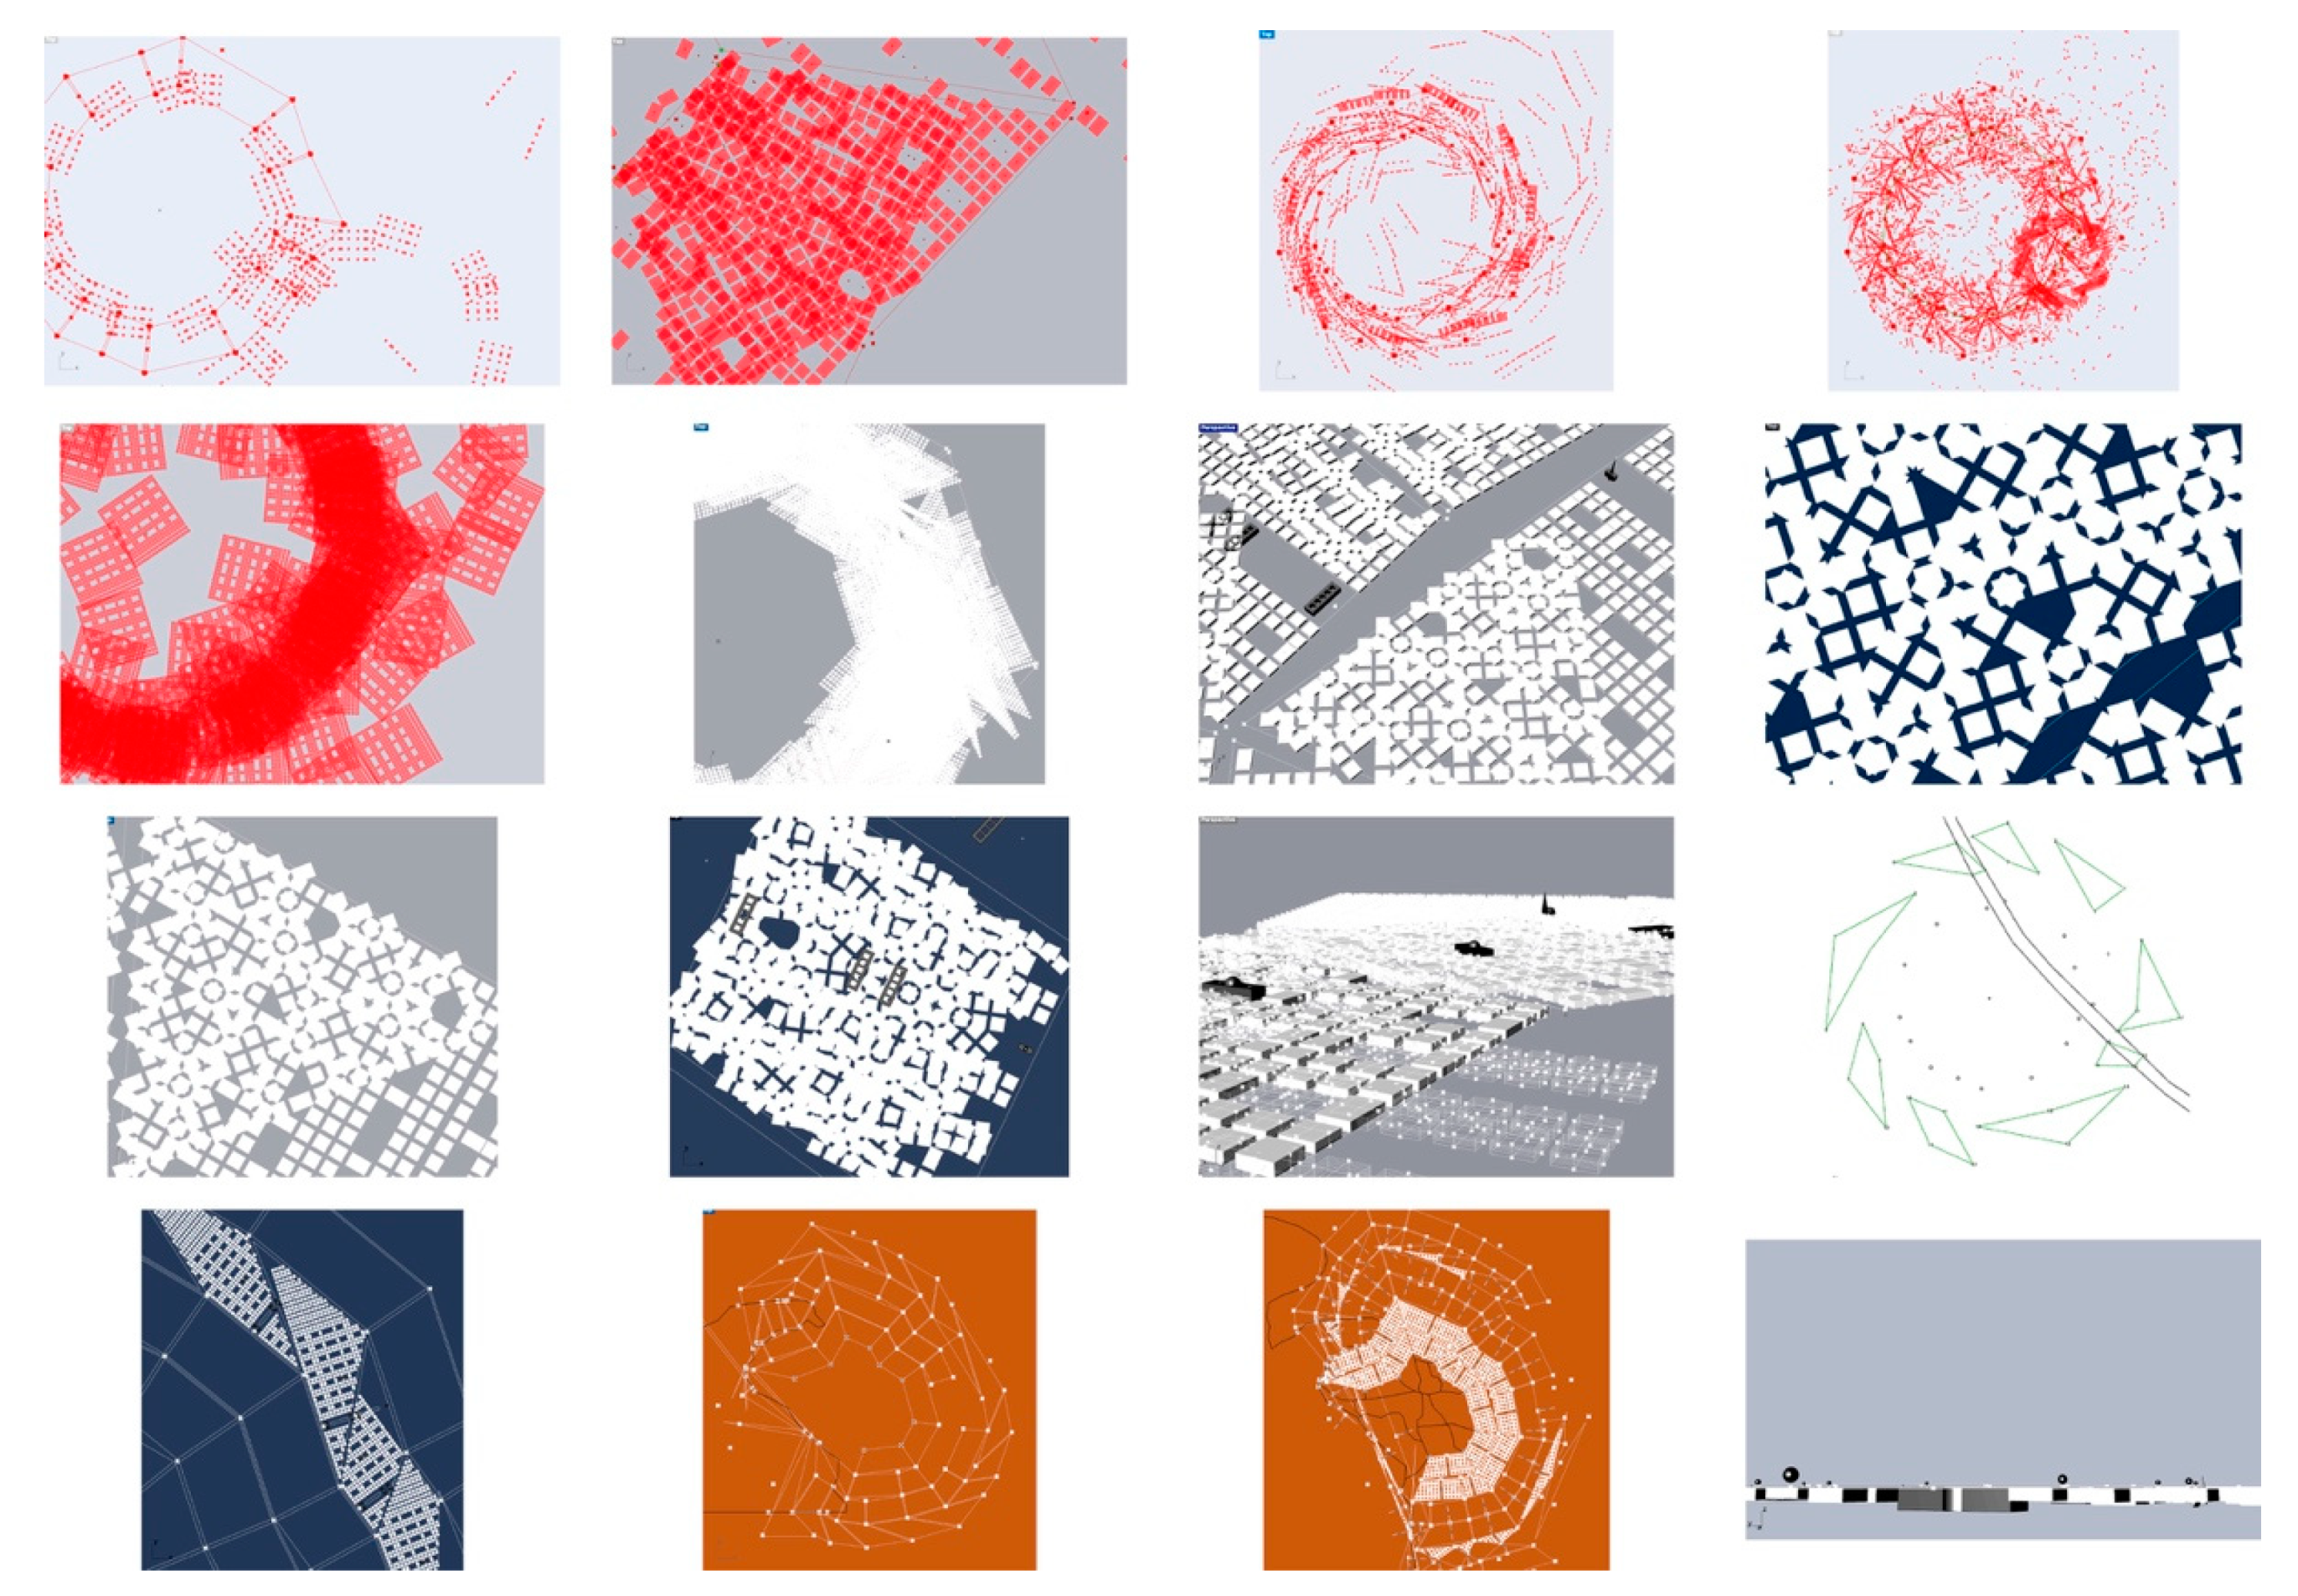
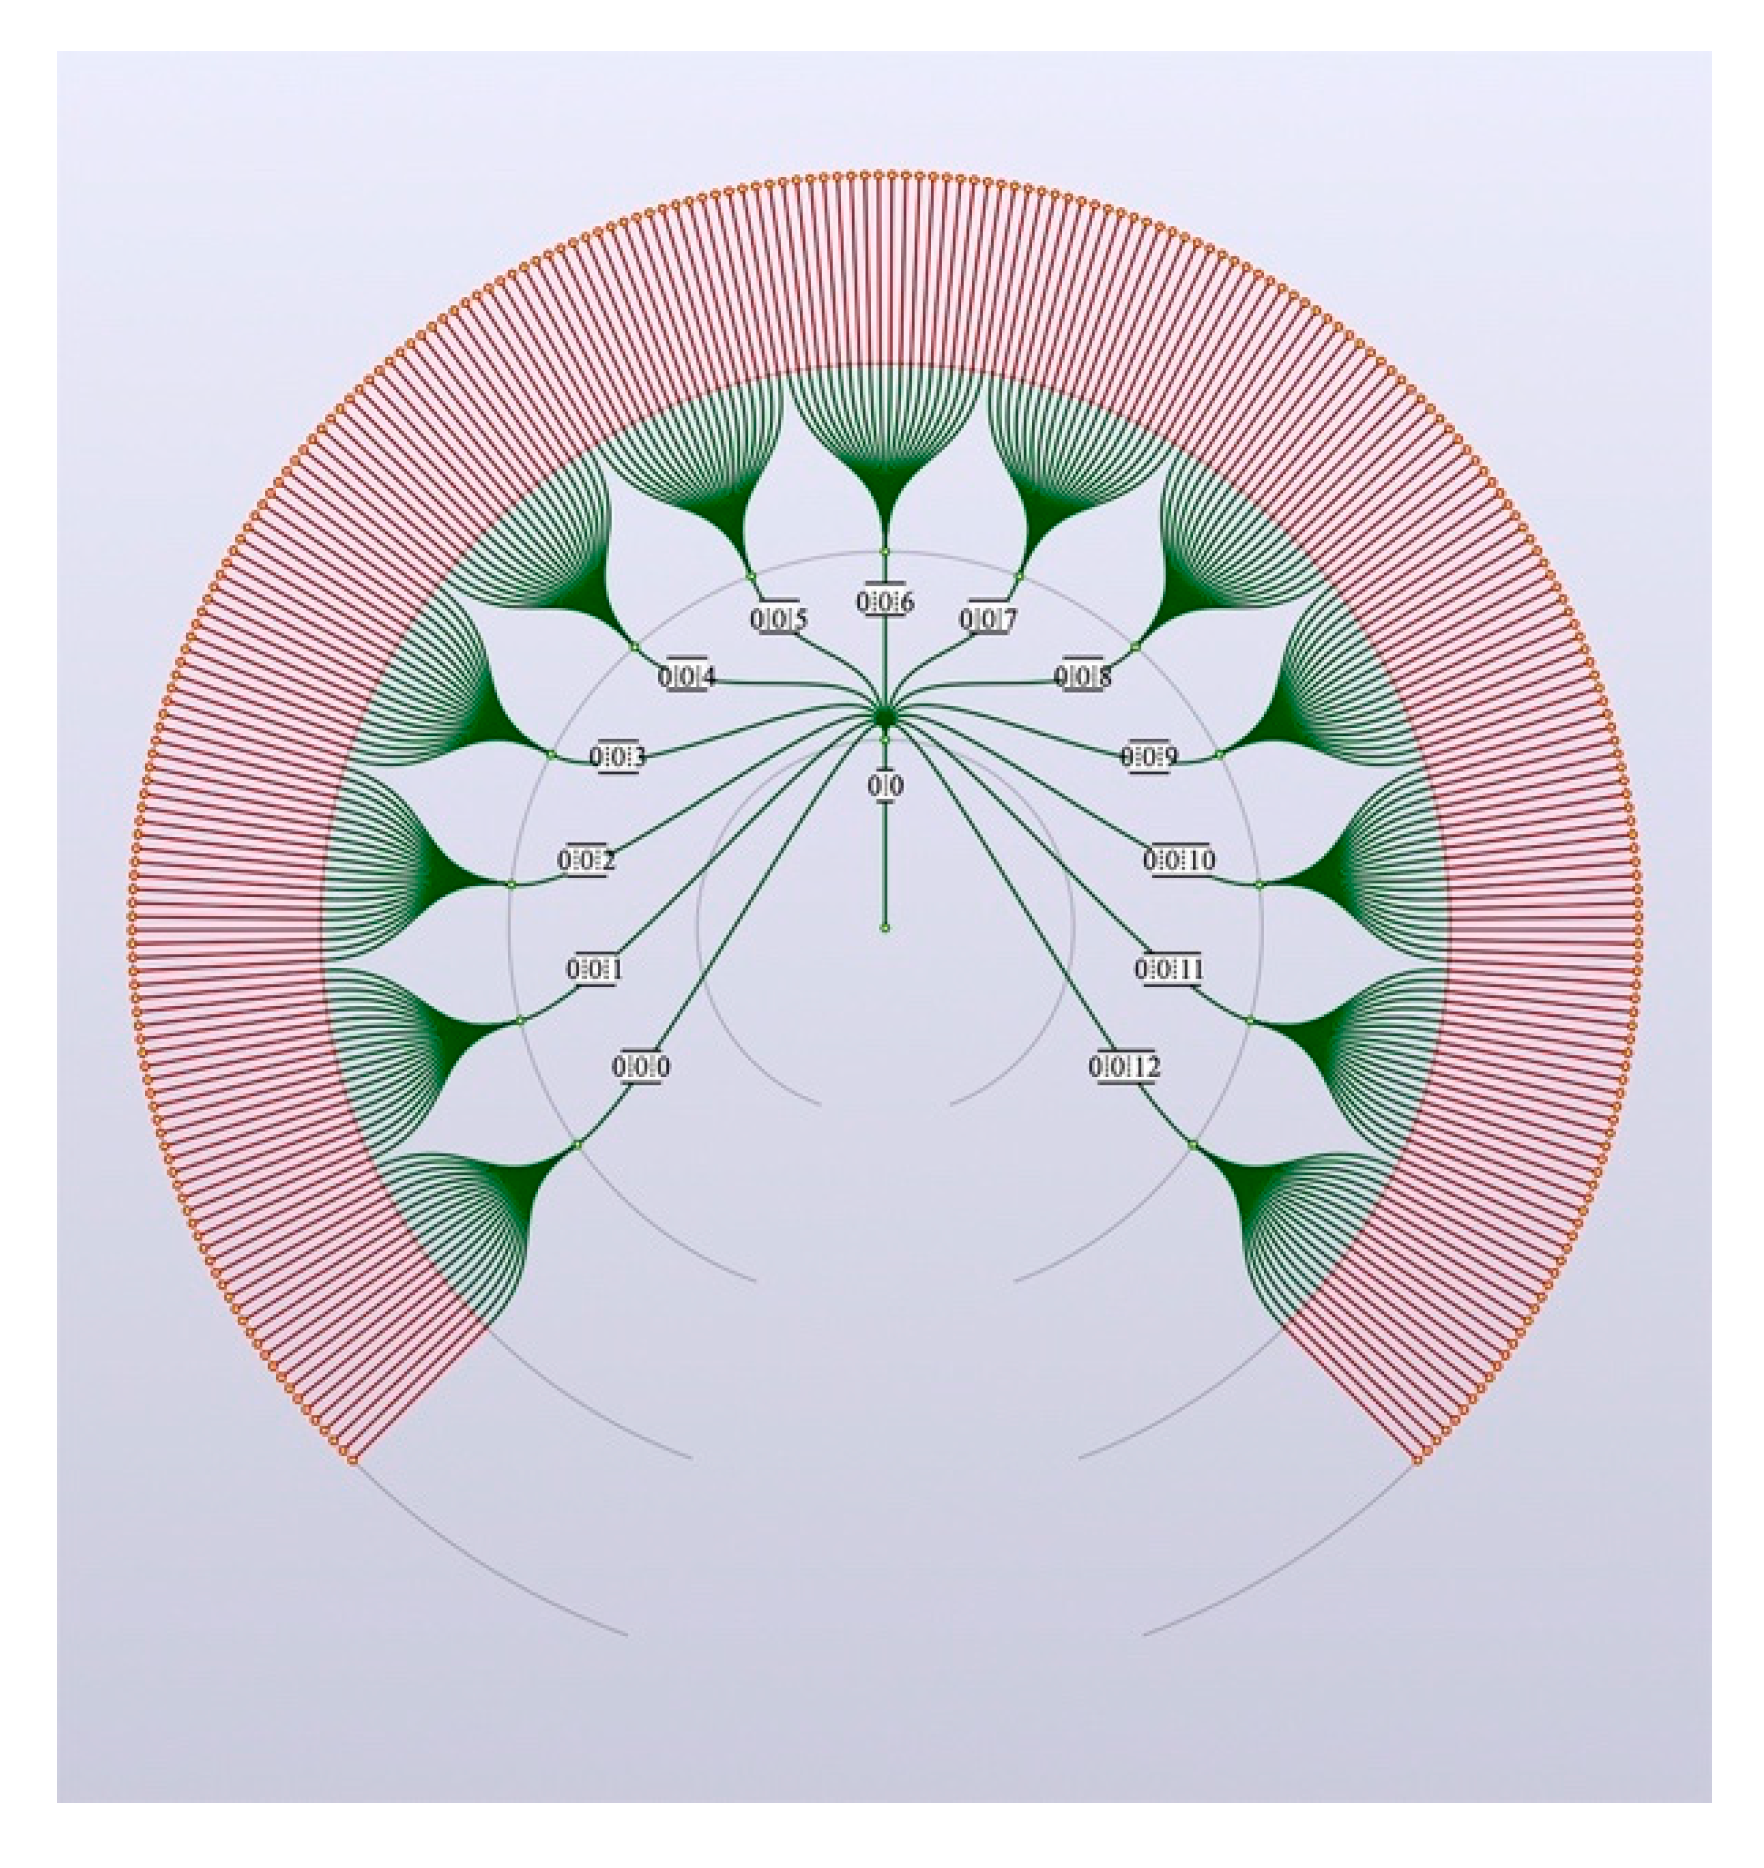
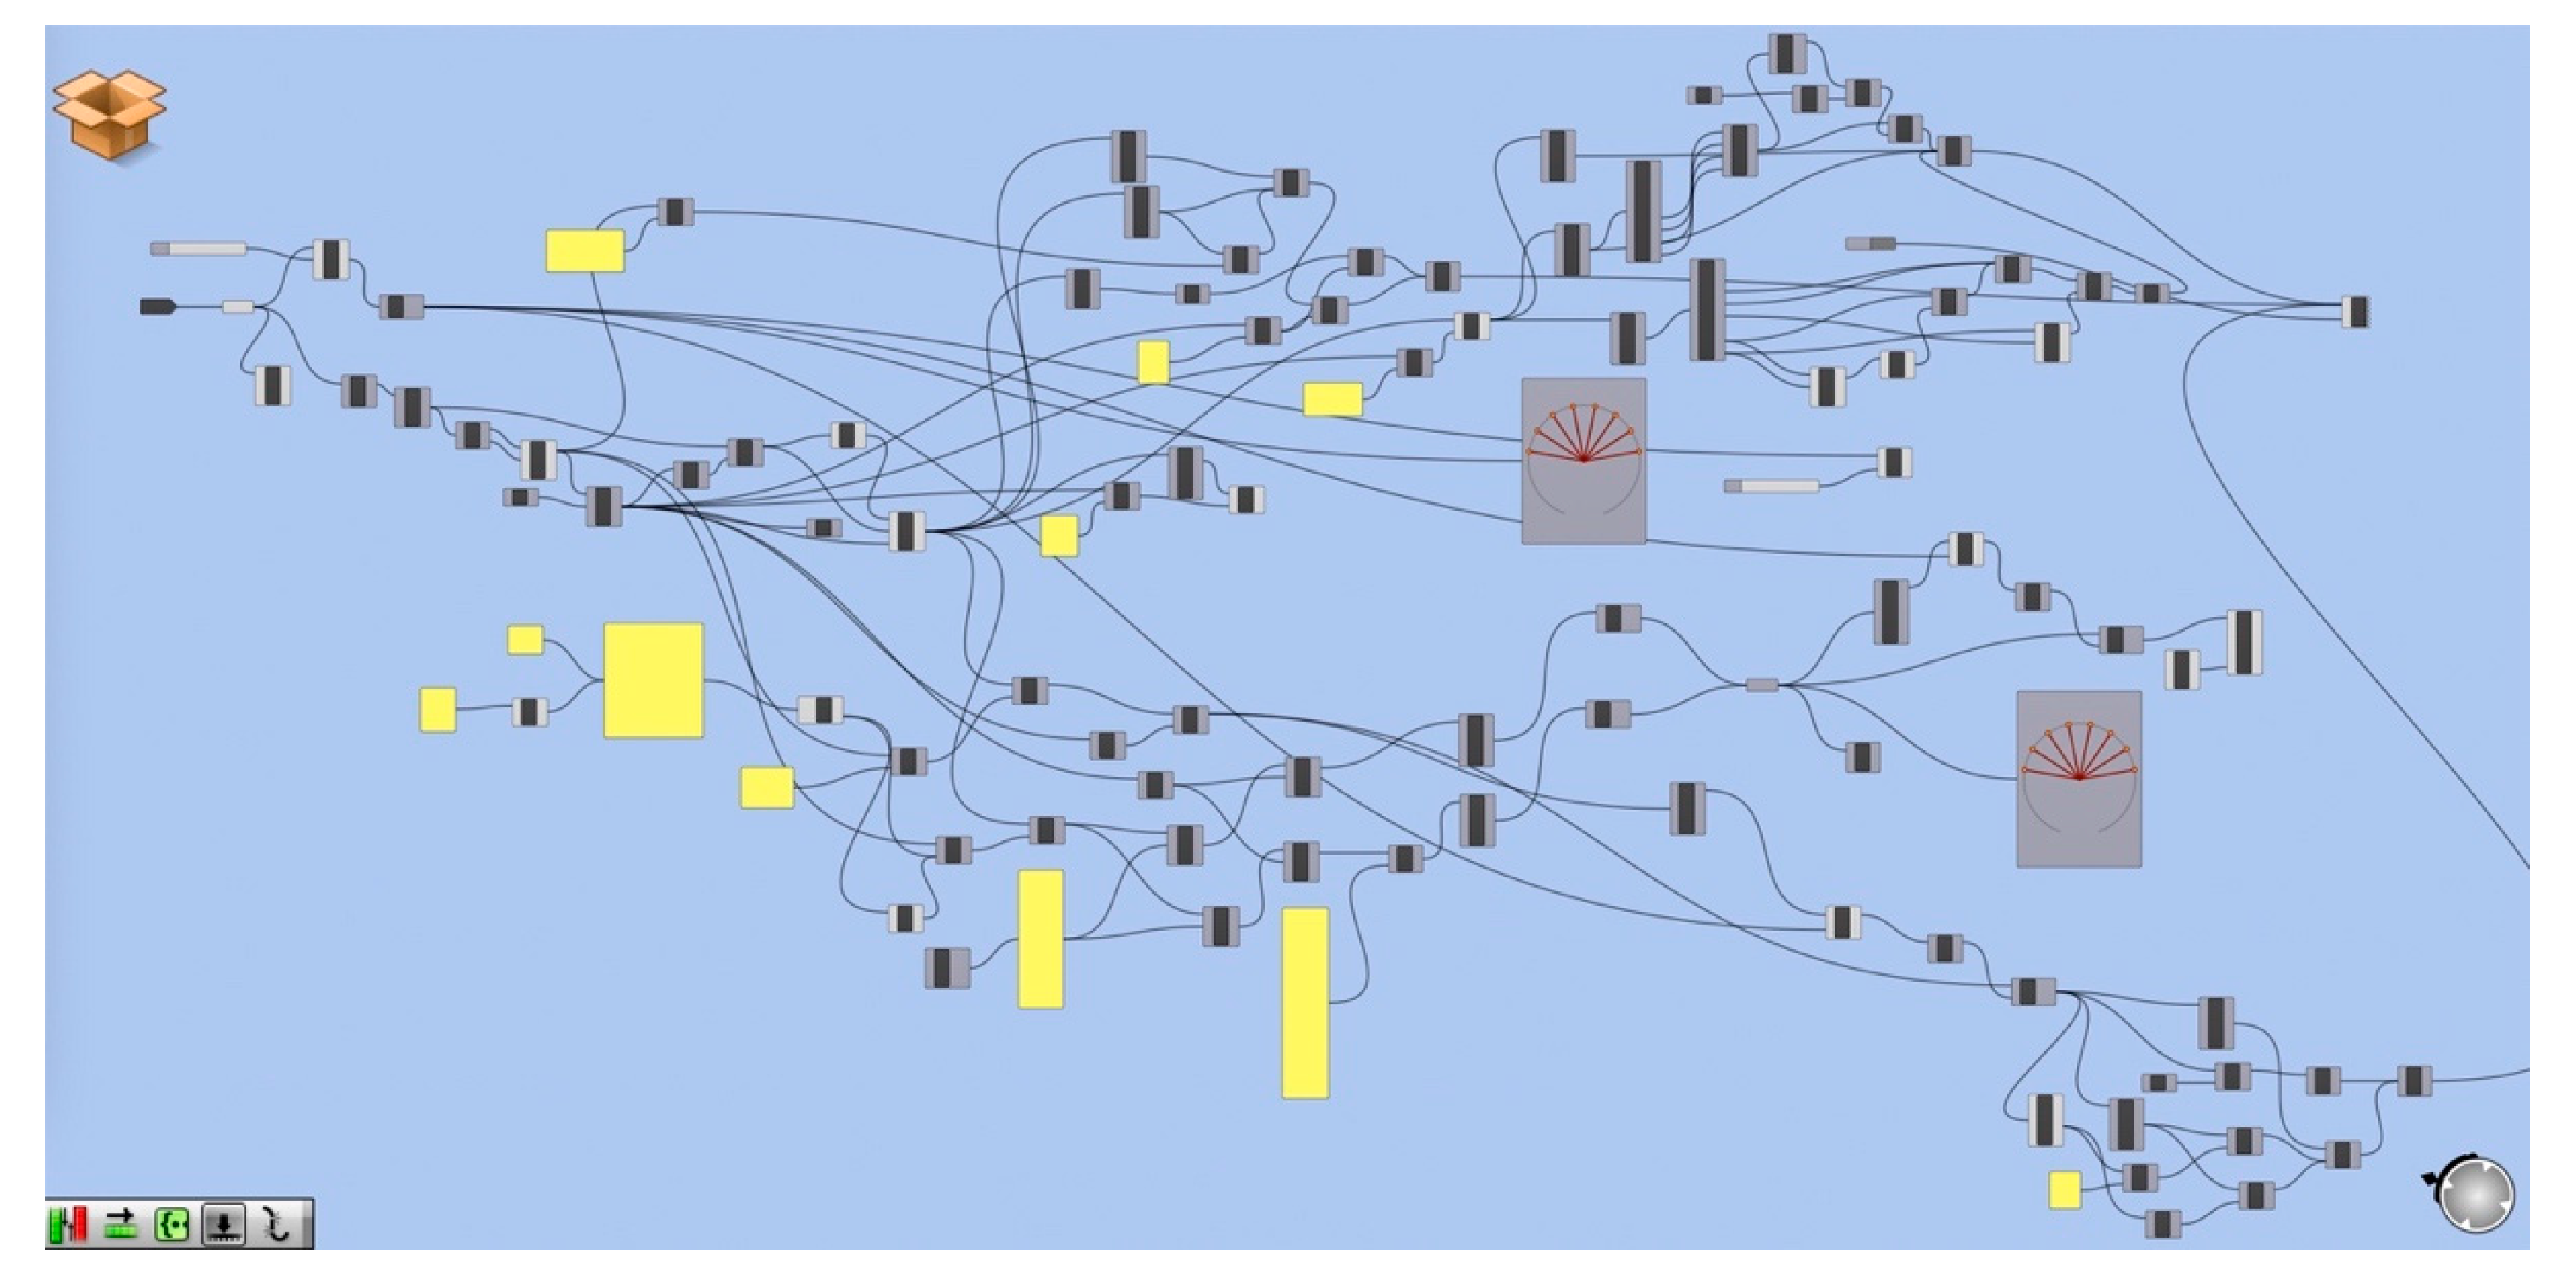
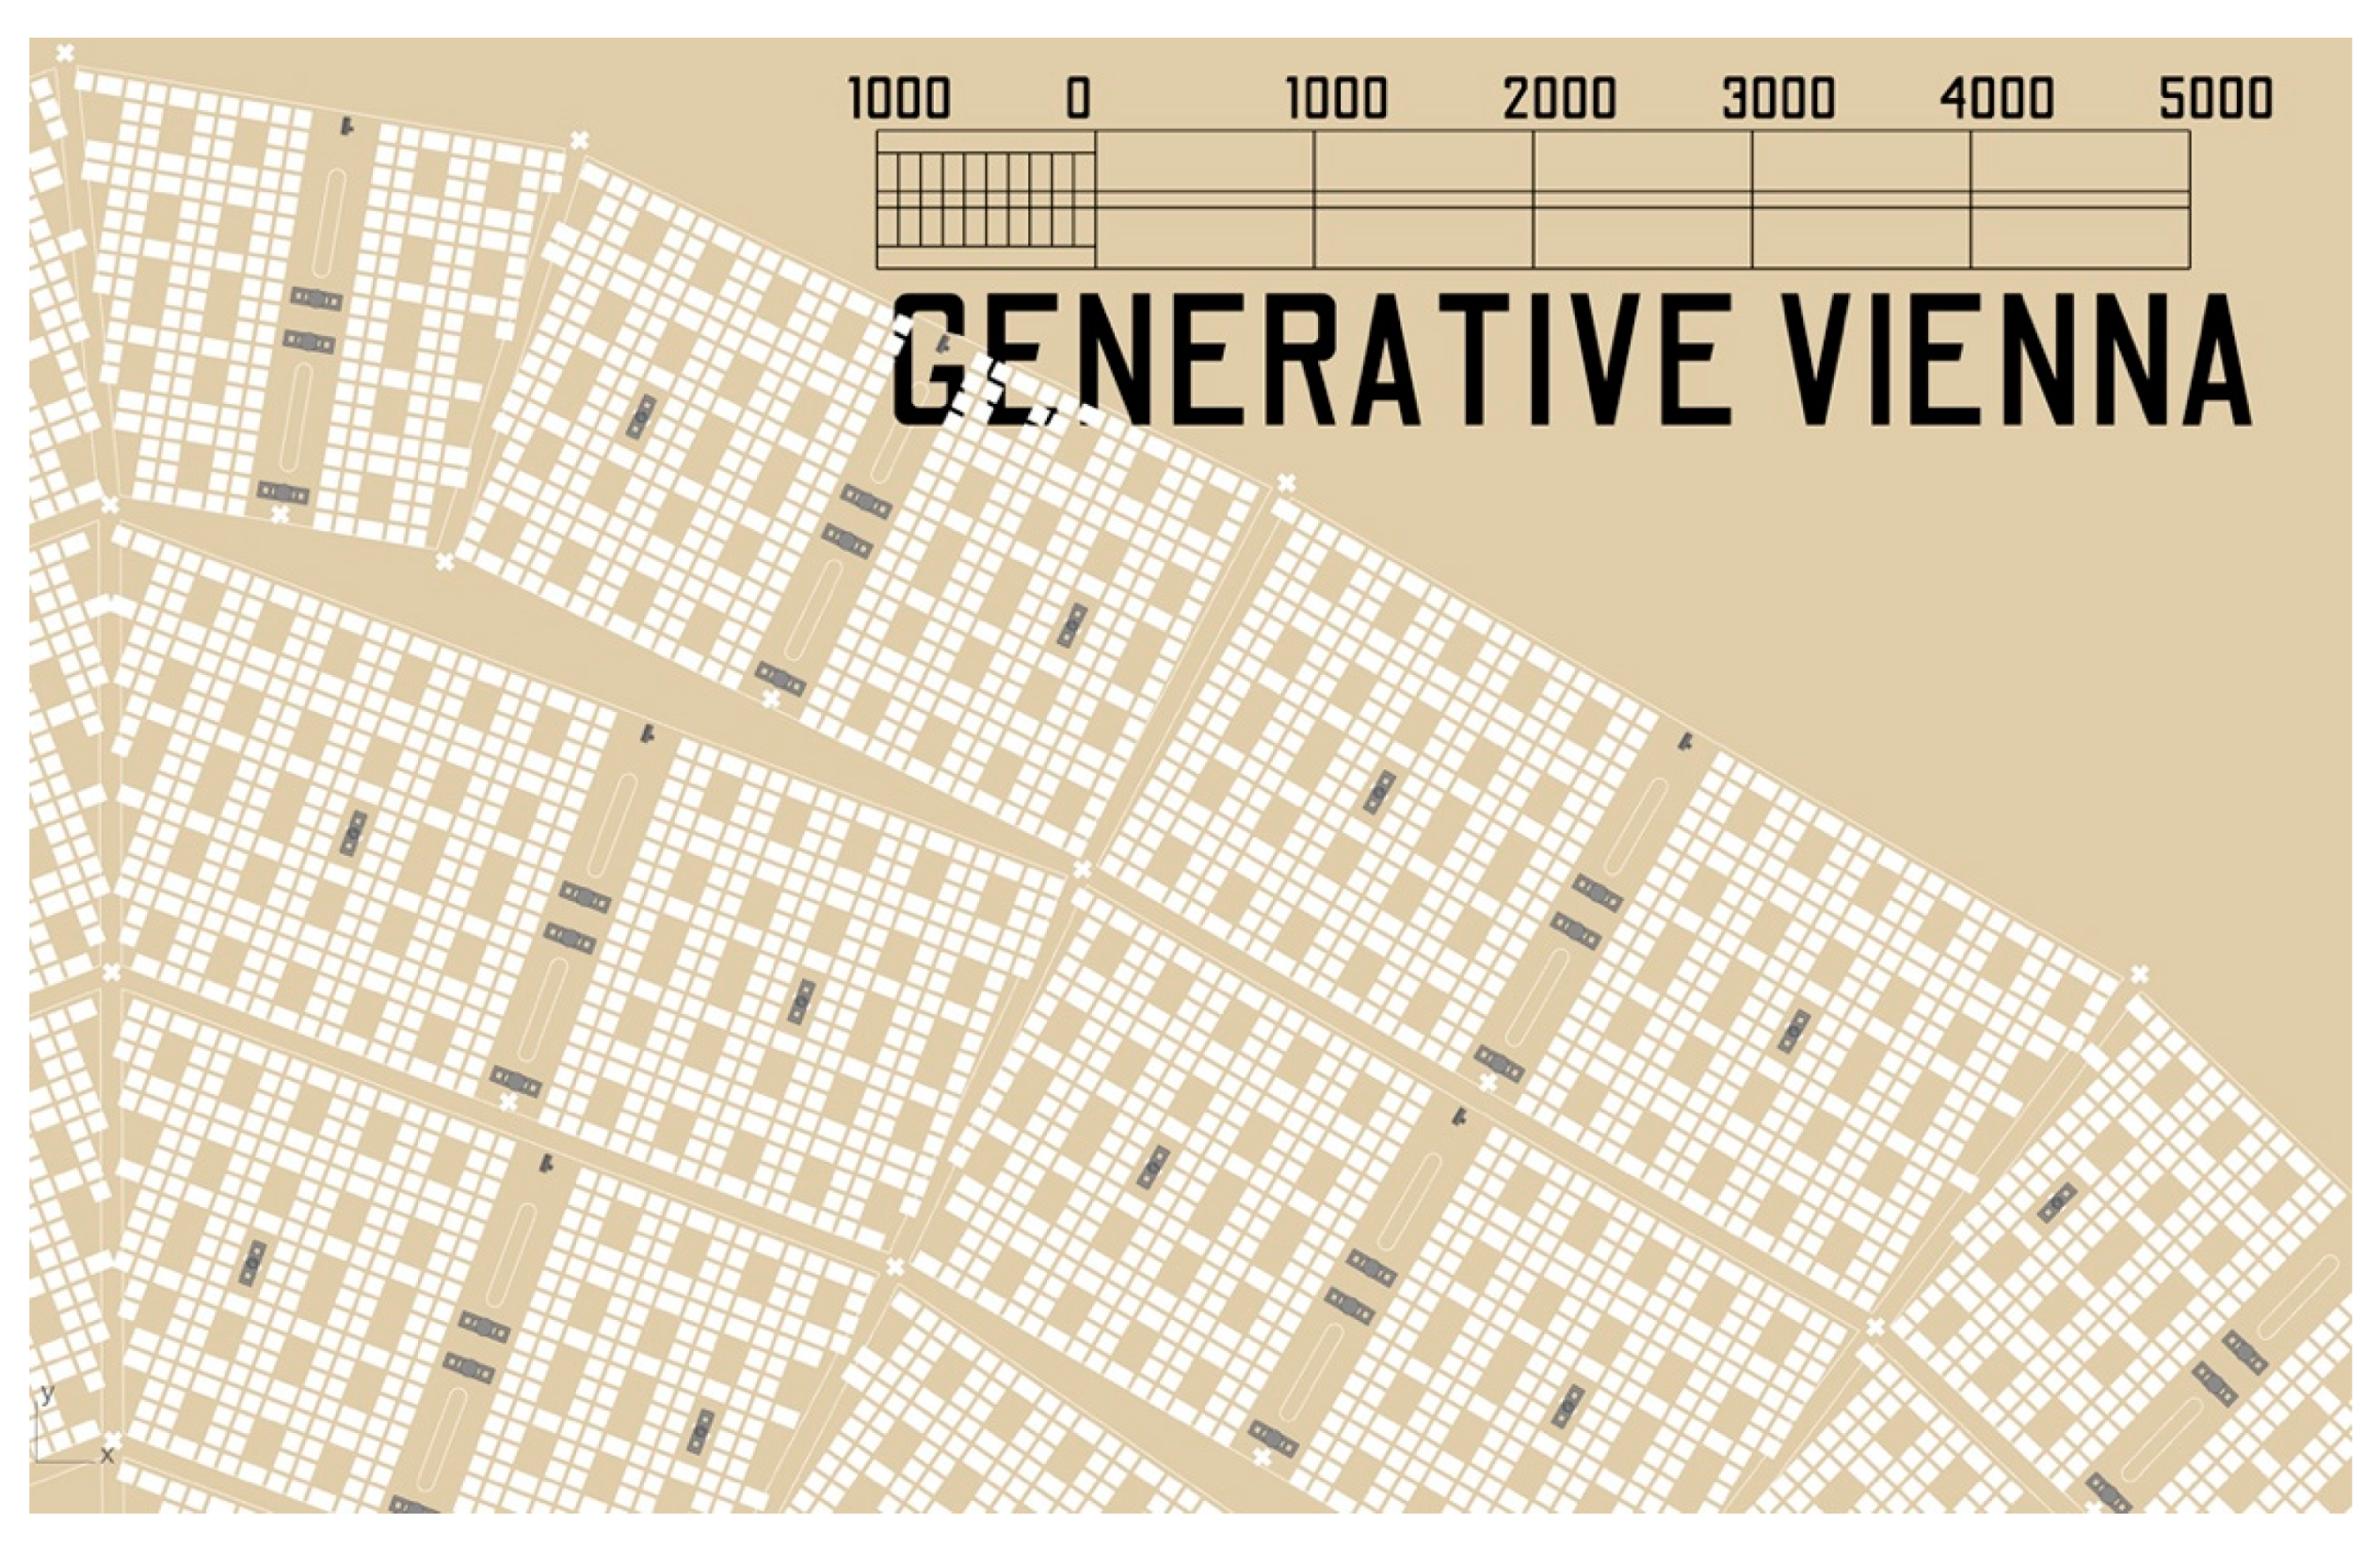
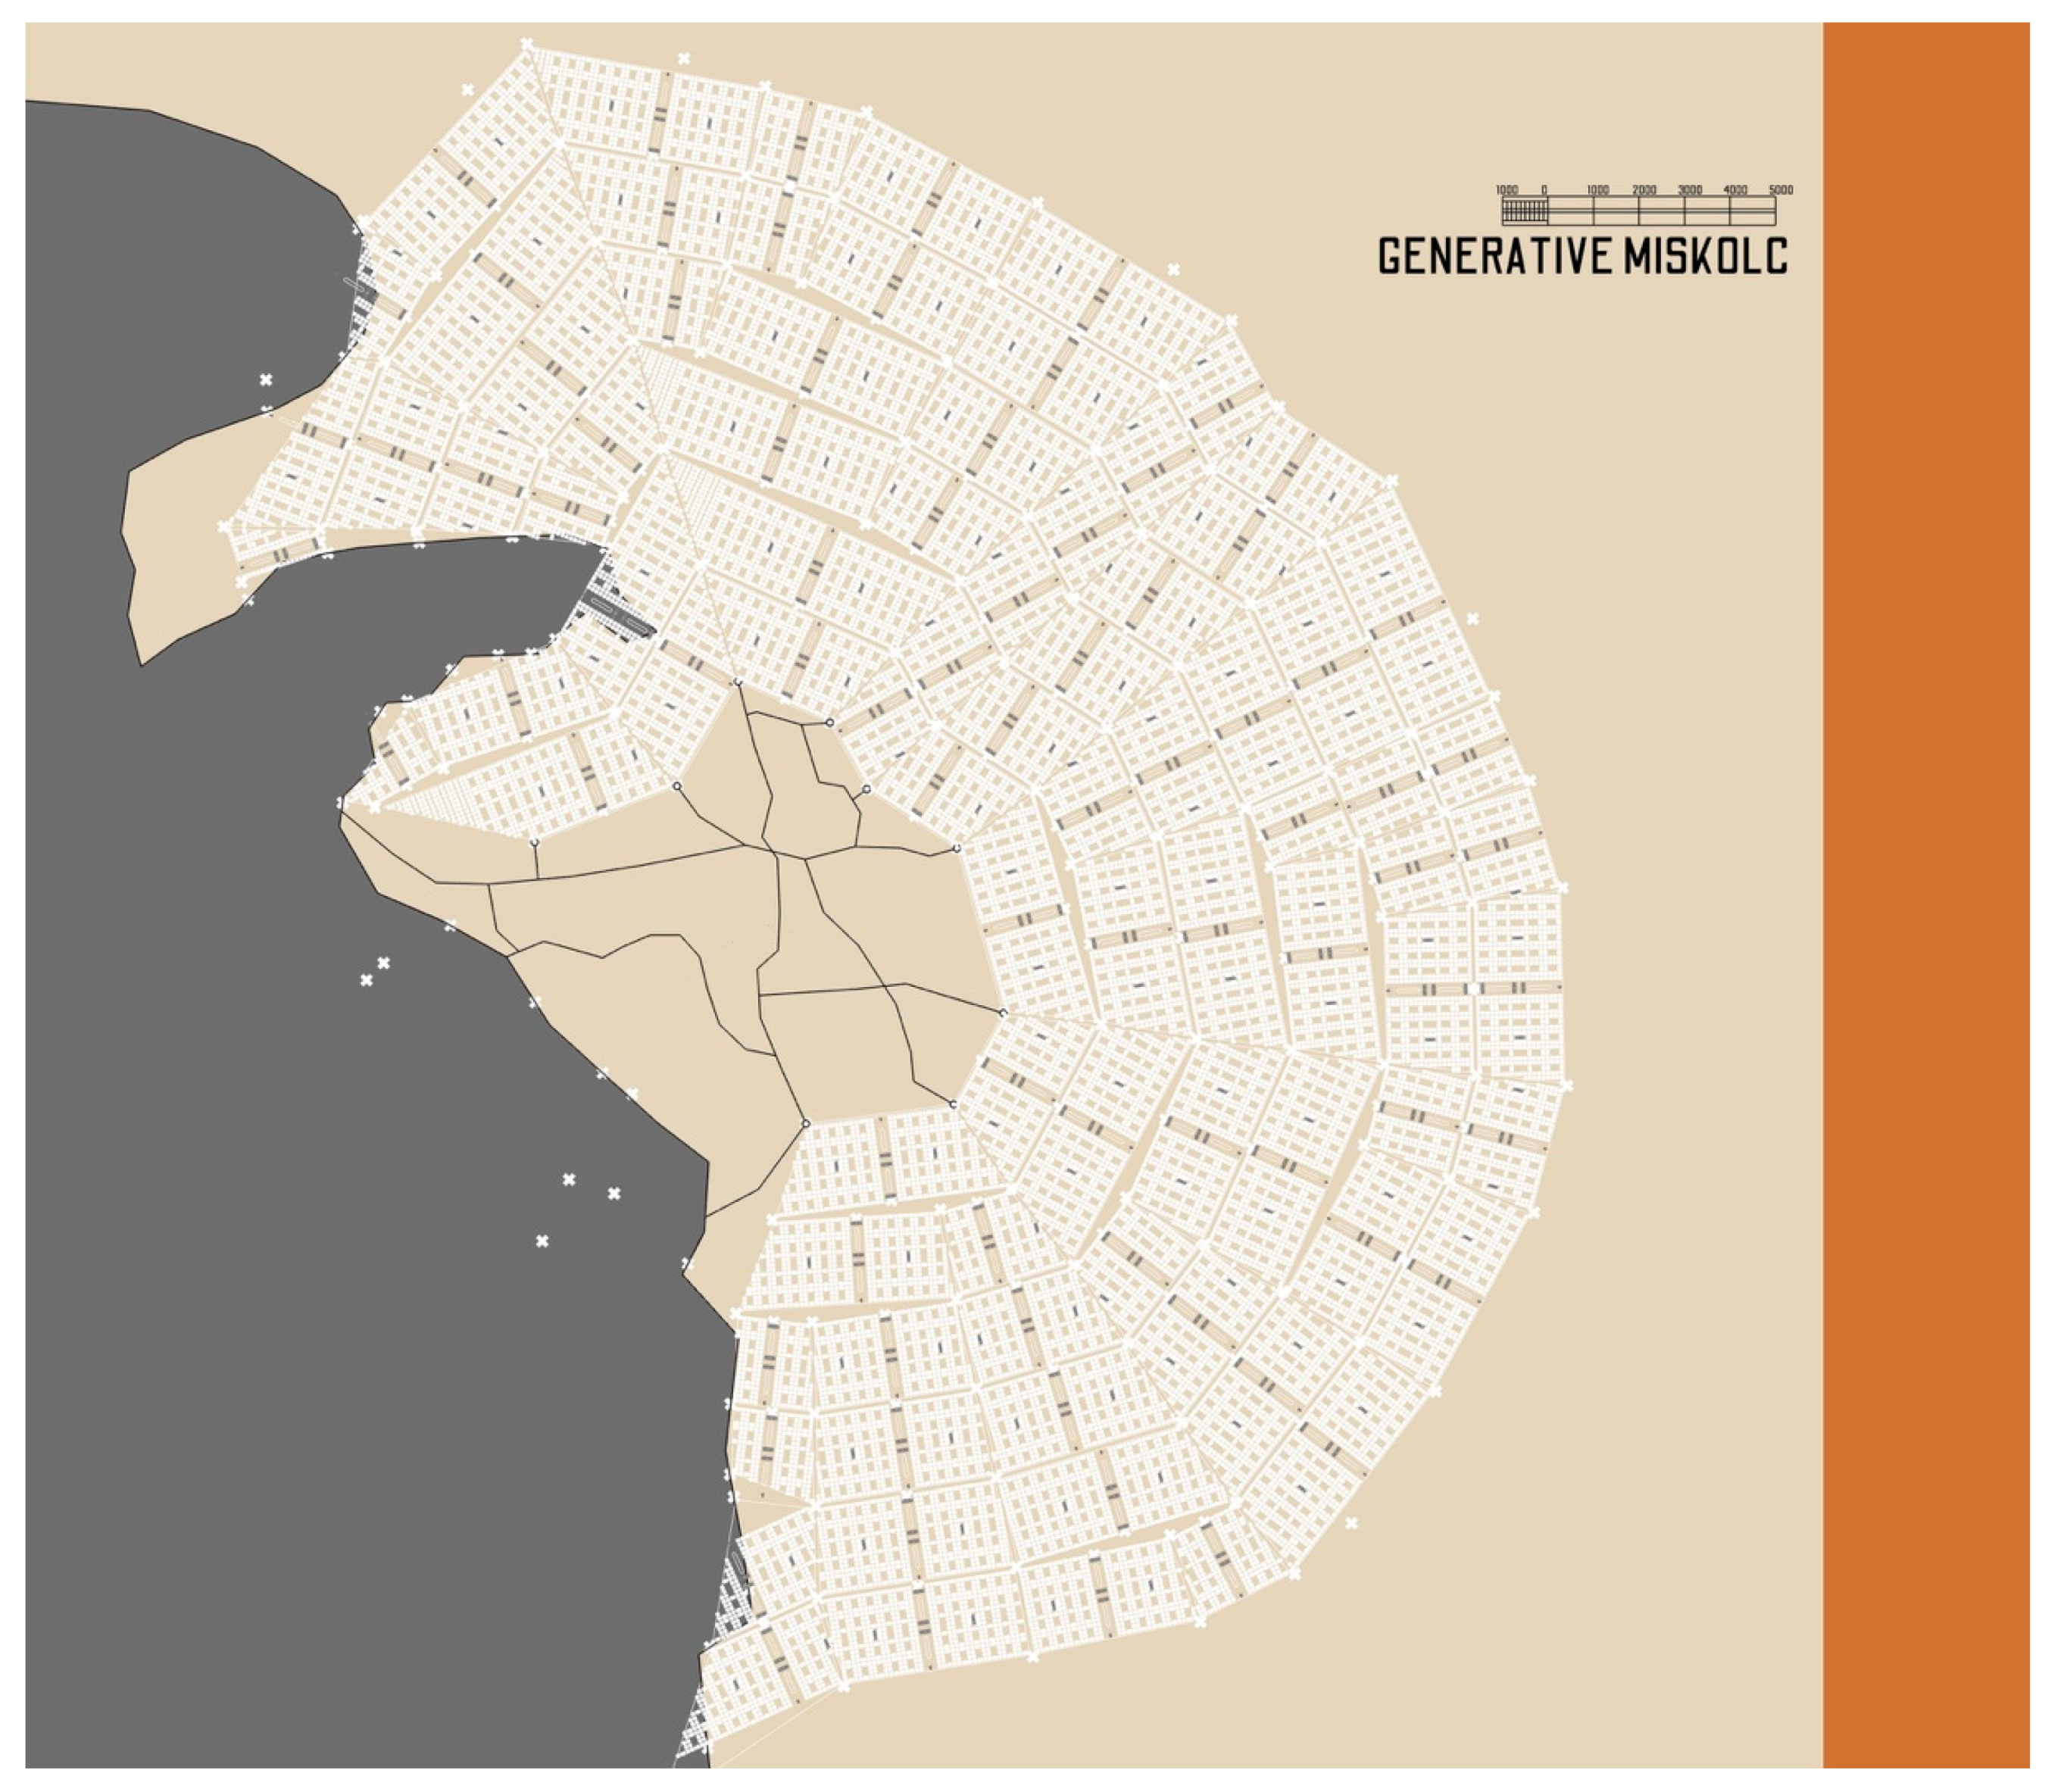
2.1. Generative Simulation: The Algorithms
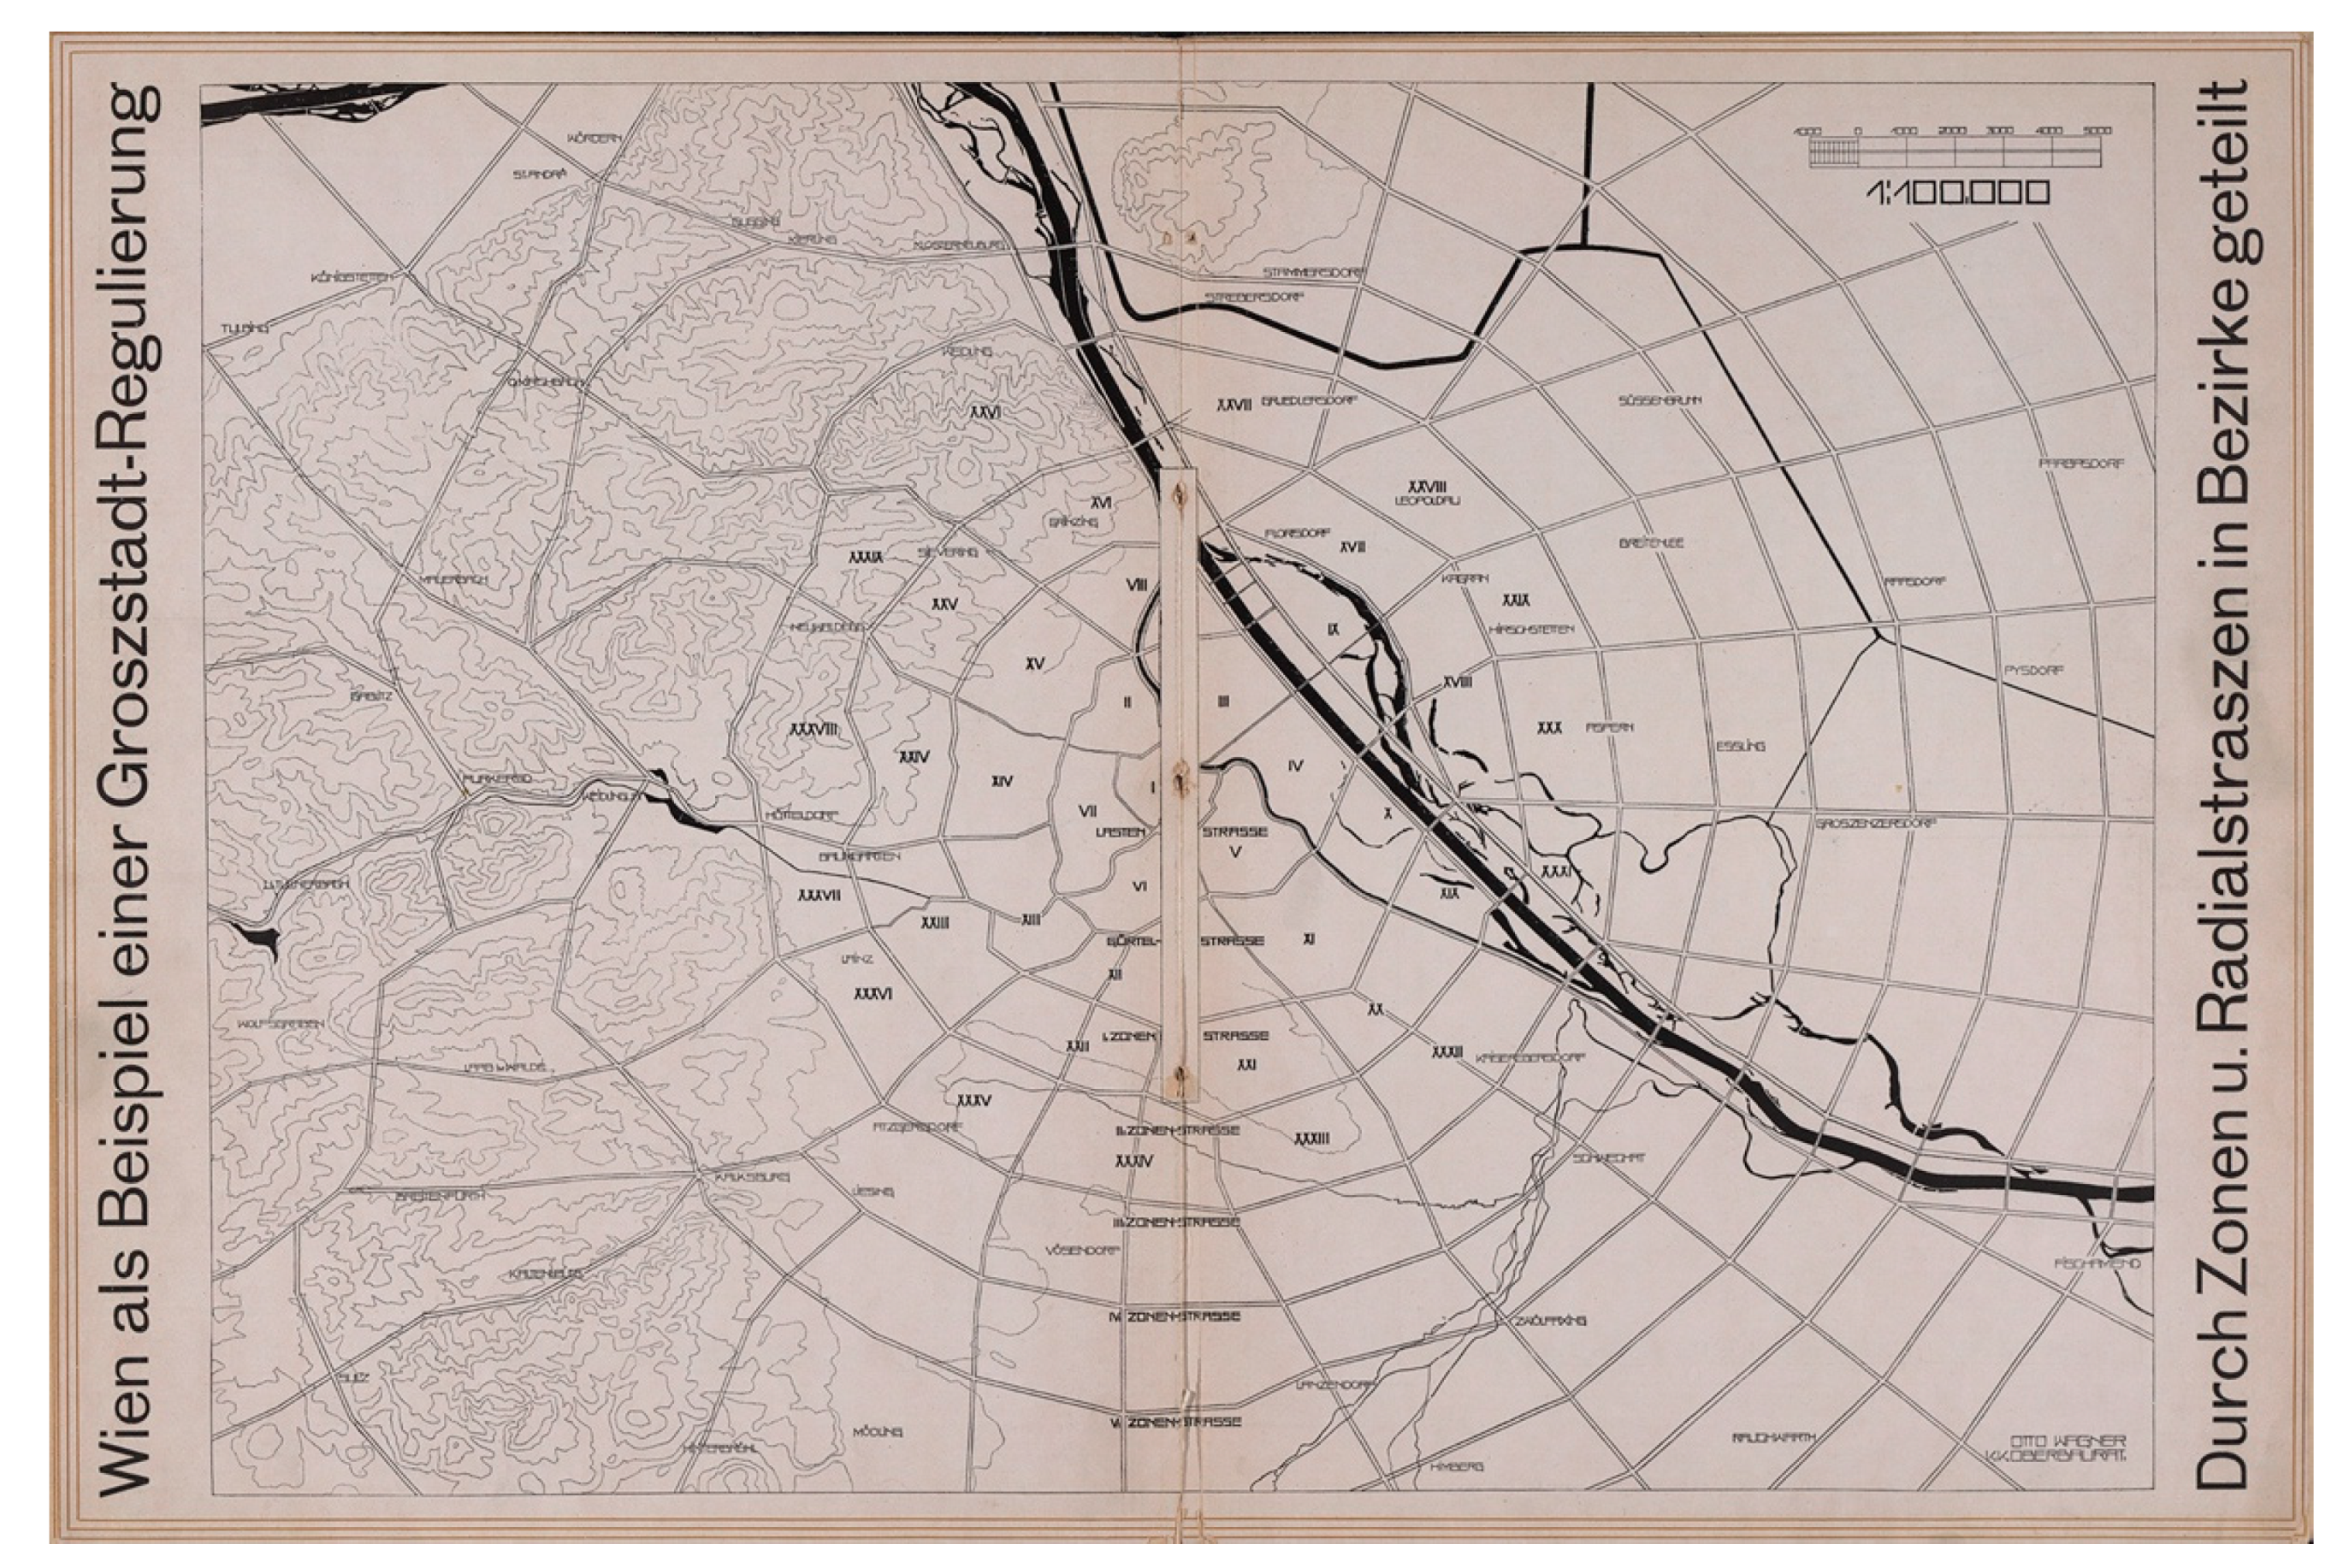
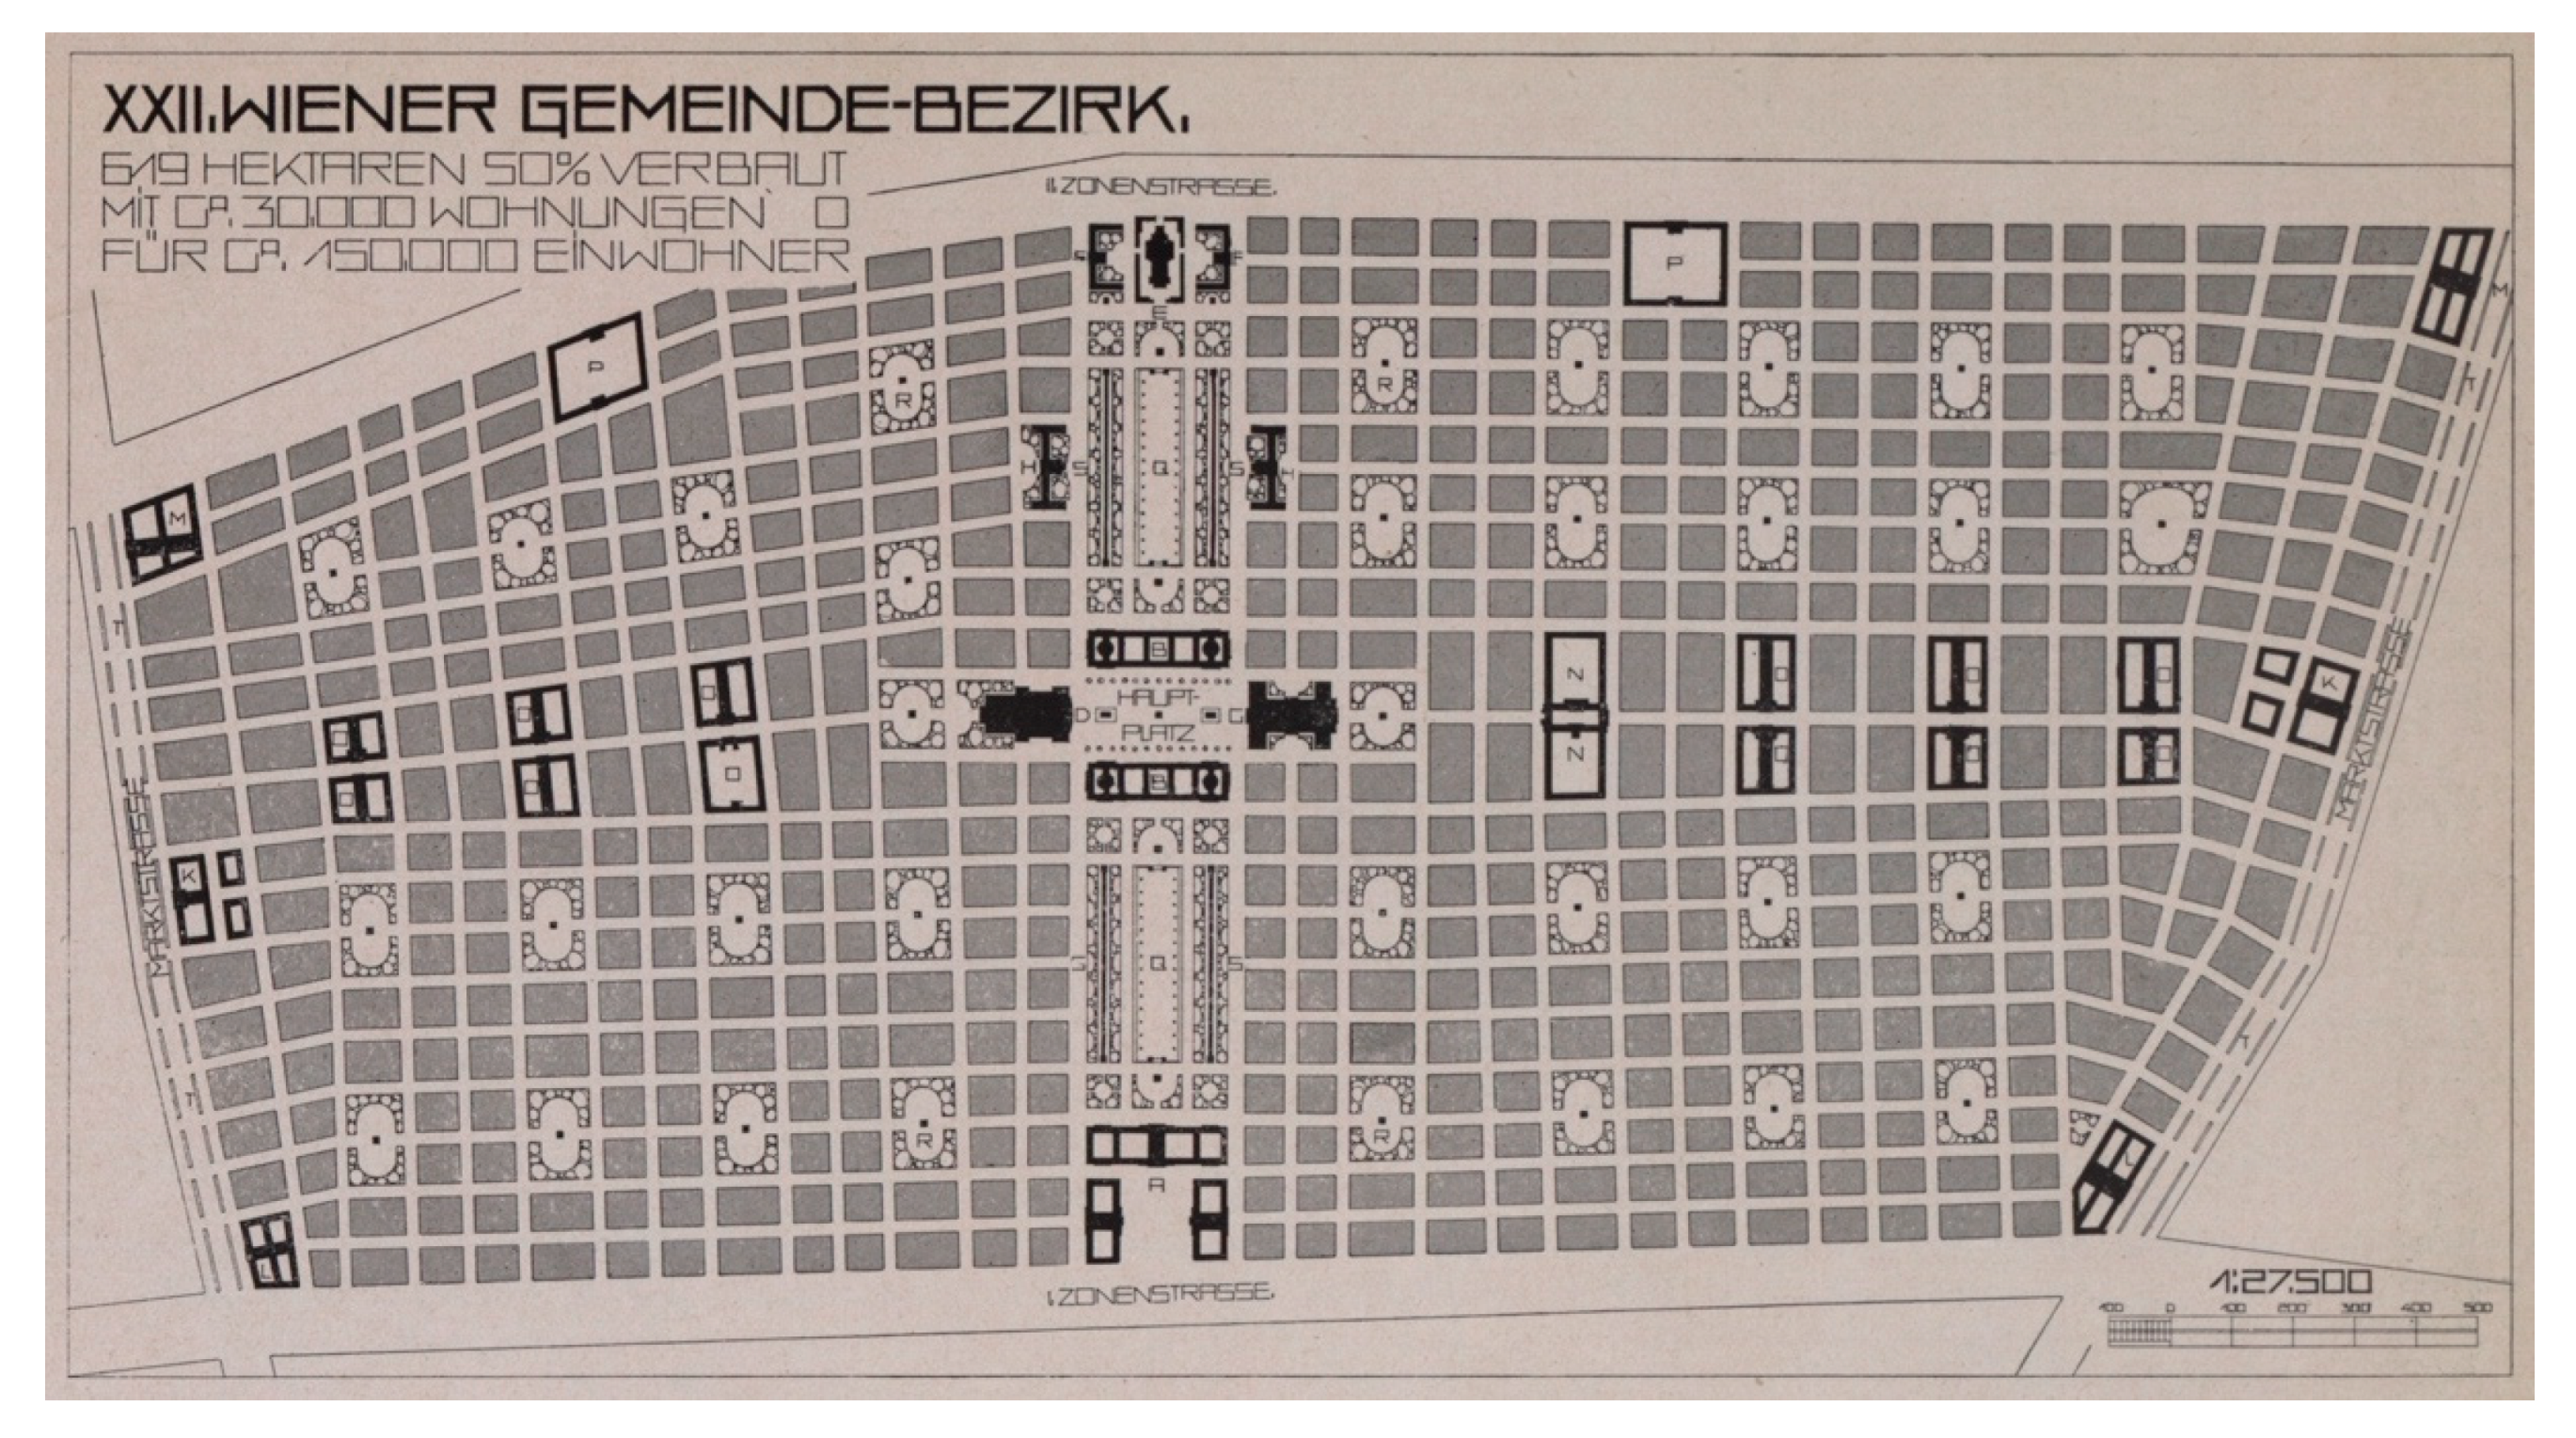
2.2. The Rules Provided by Wagner’s Text and Related Drawings
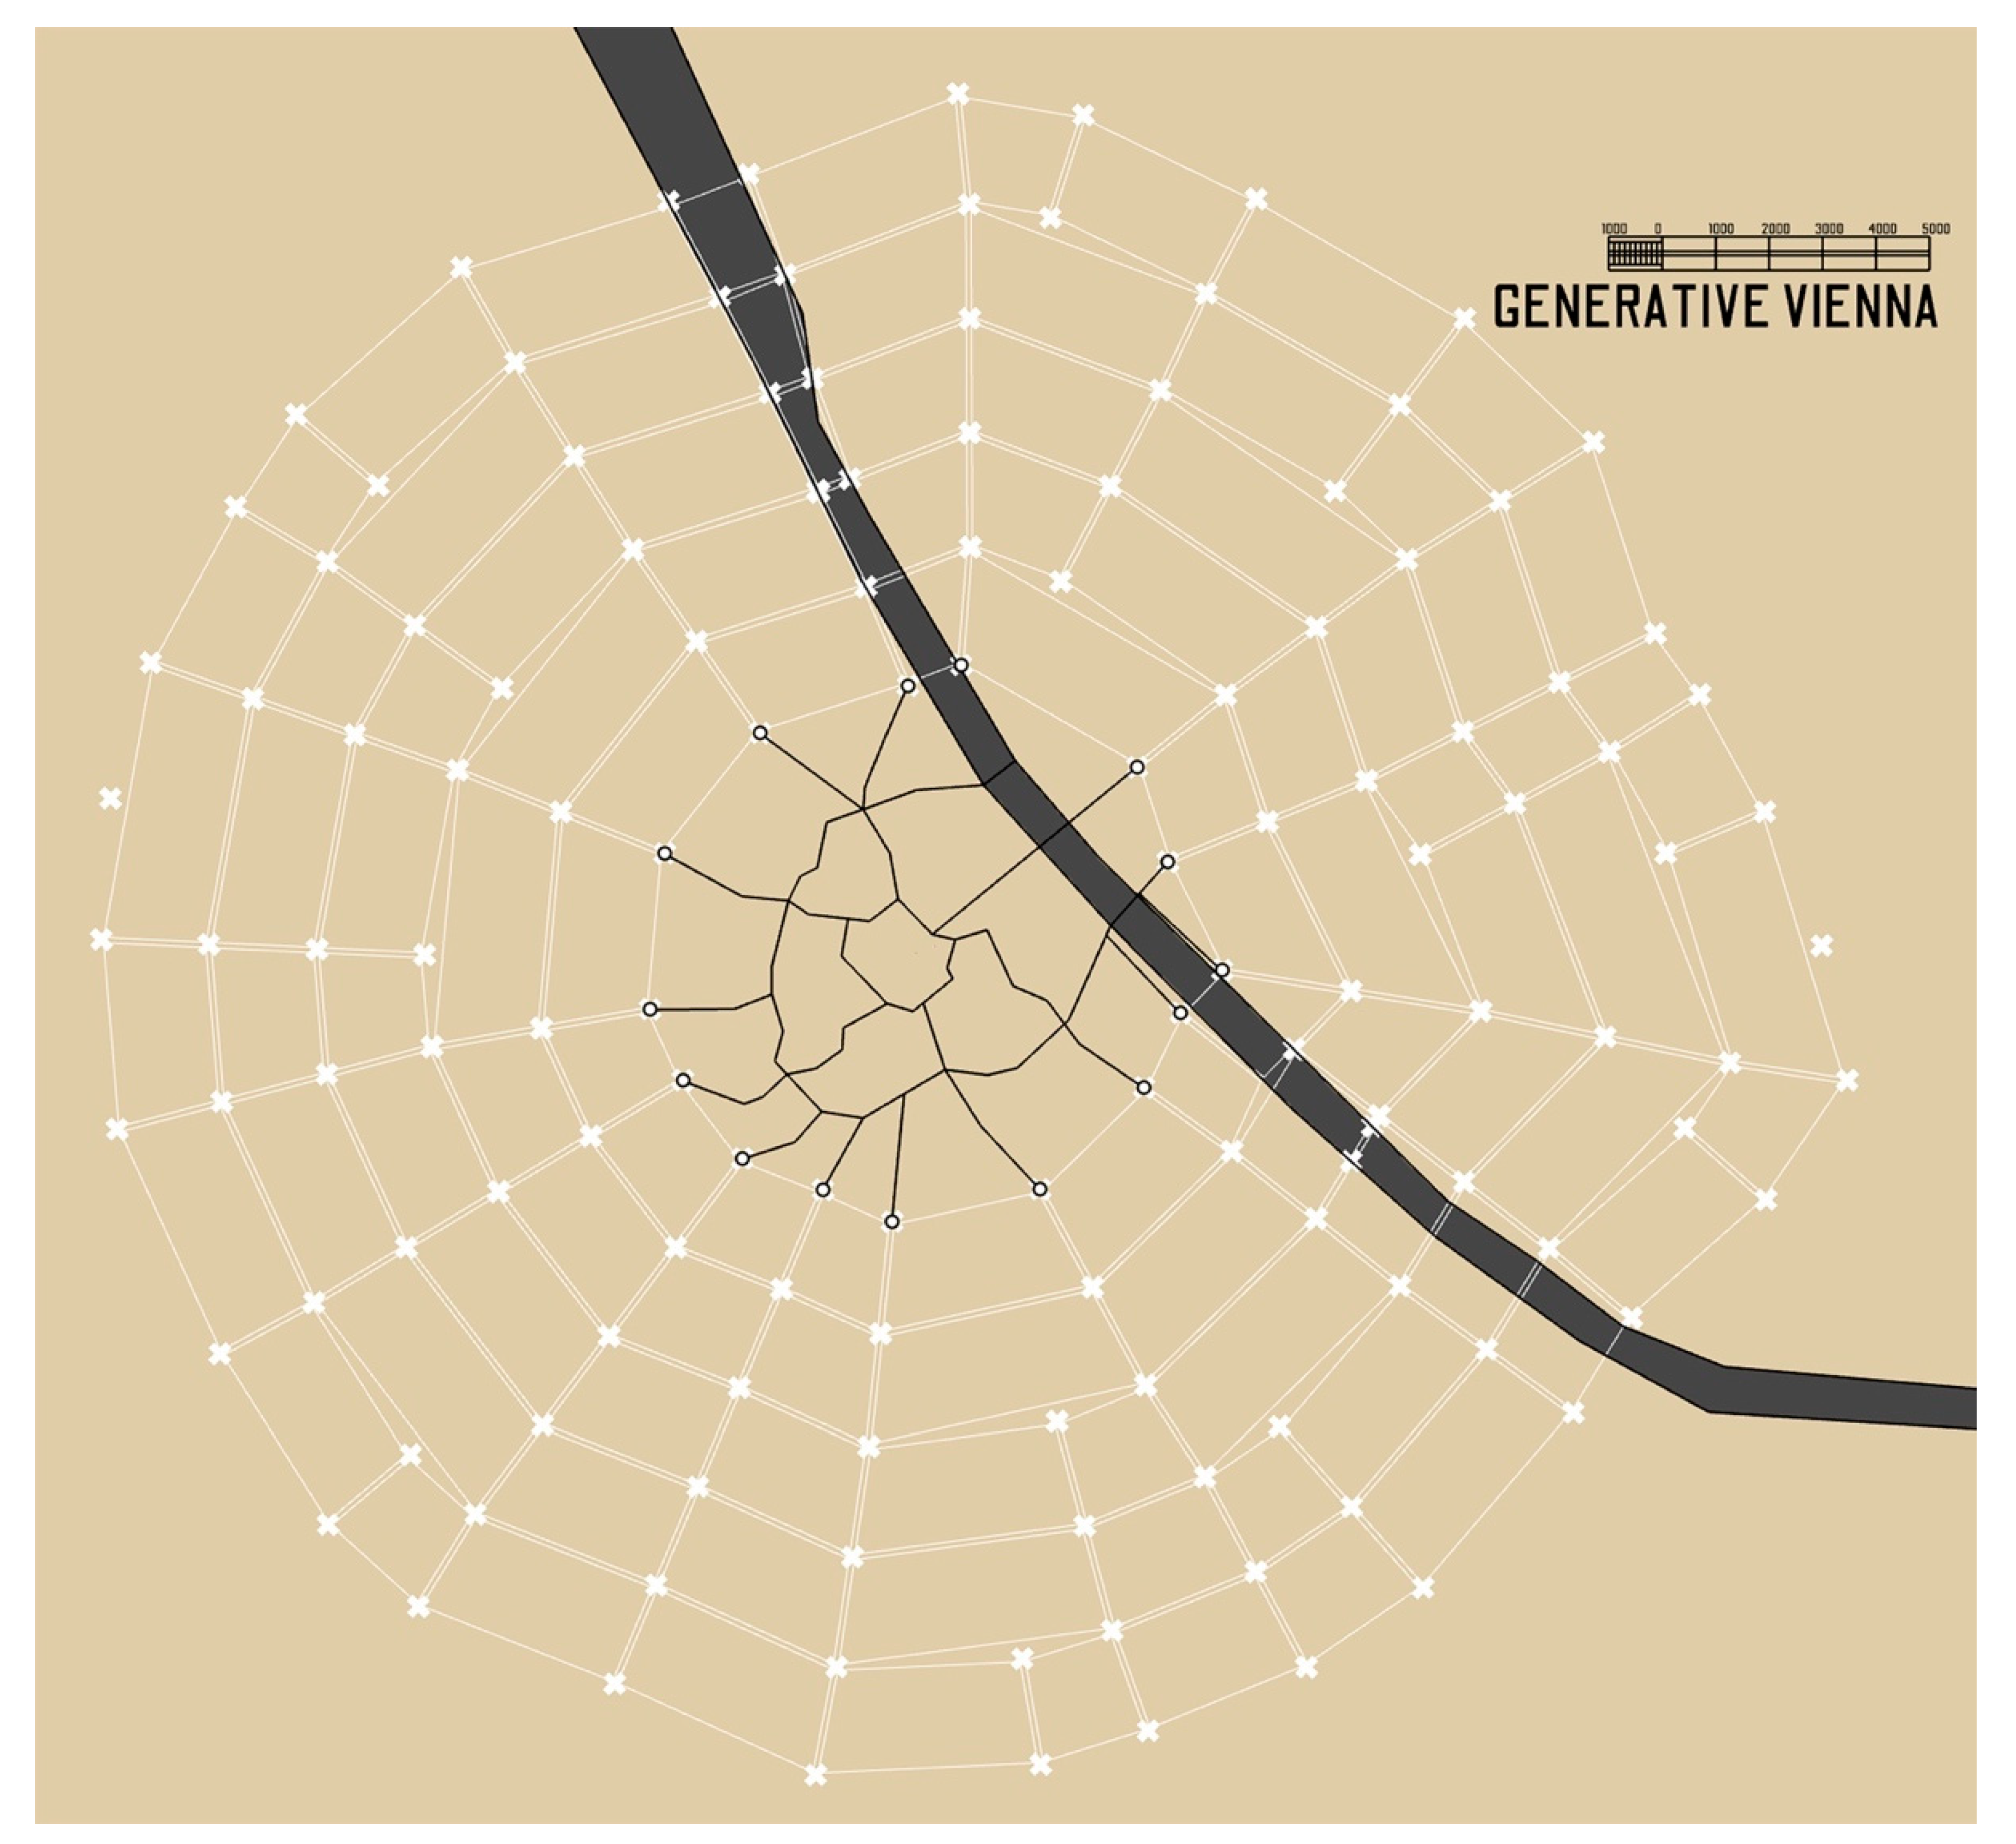
2.3. Wagner’s Rules as a Base of Algorithmic Modelling
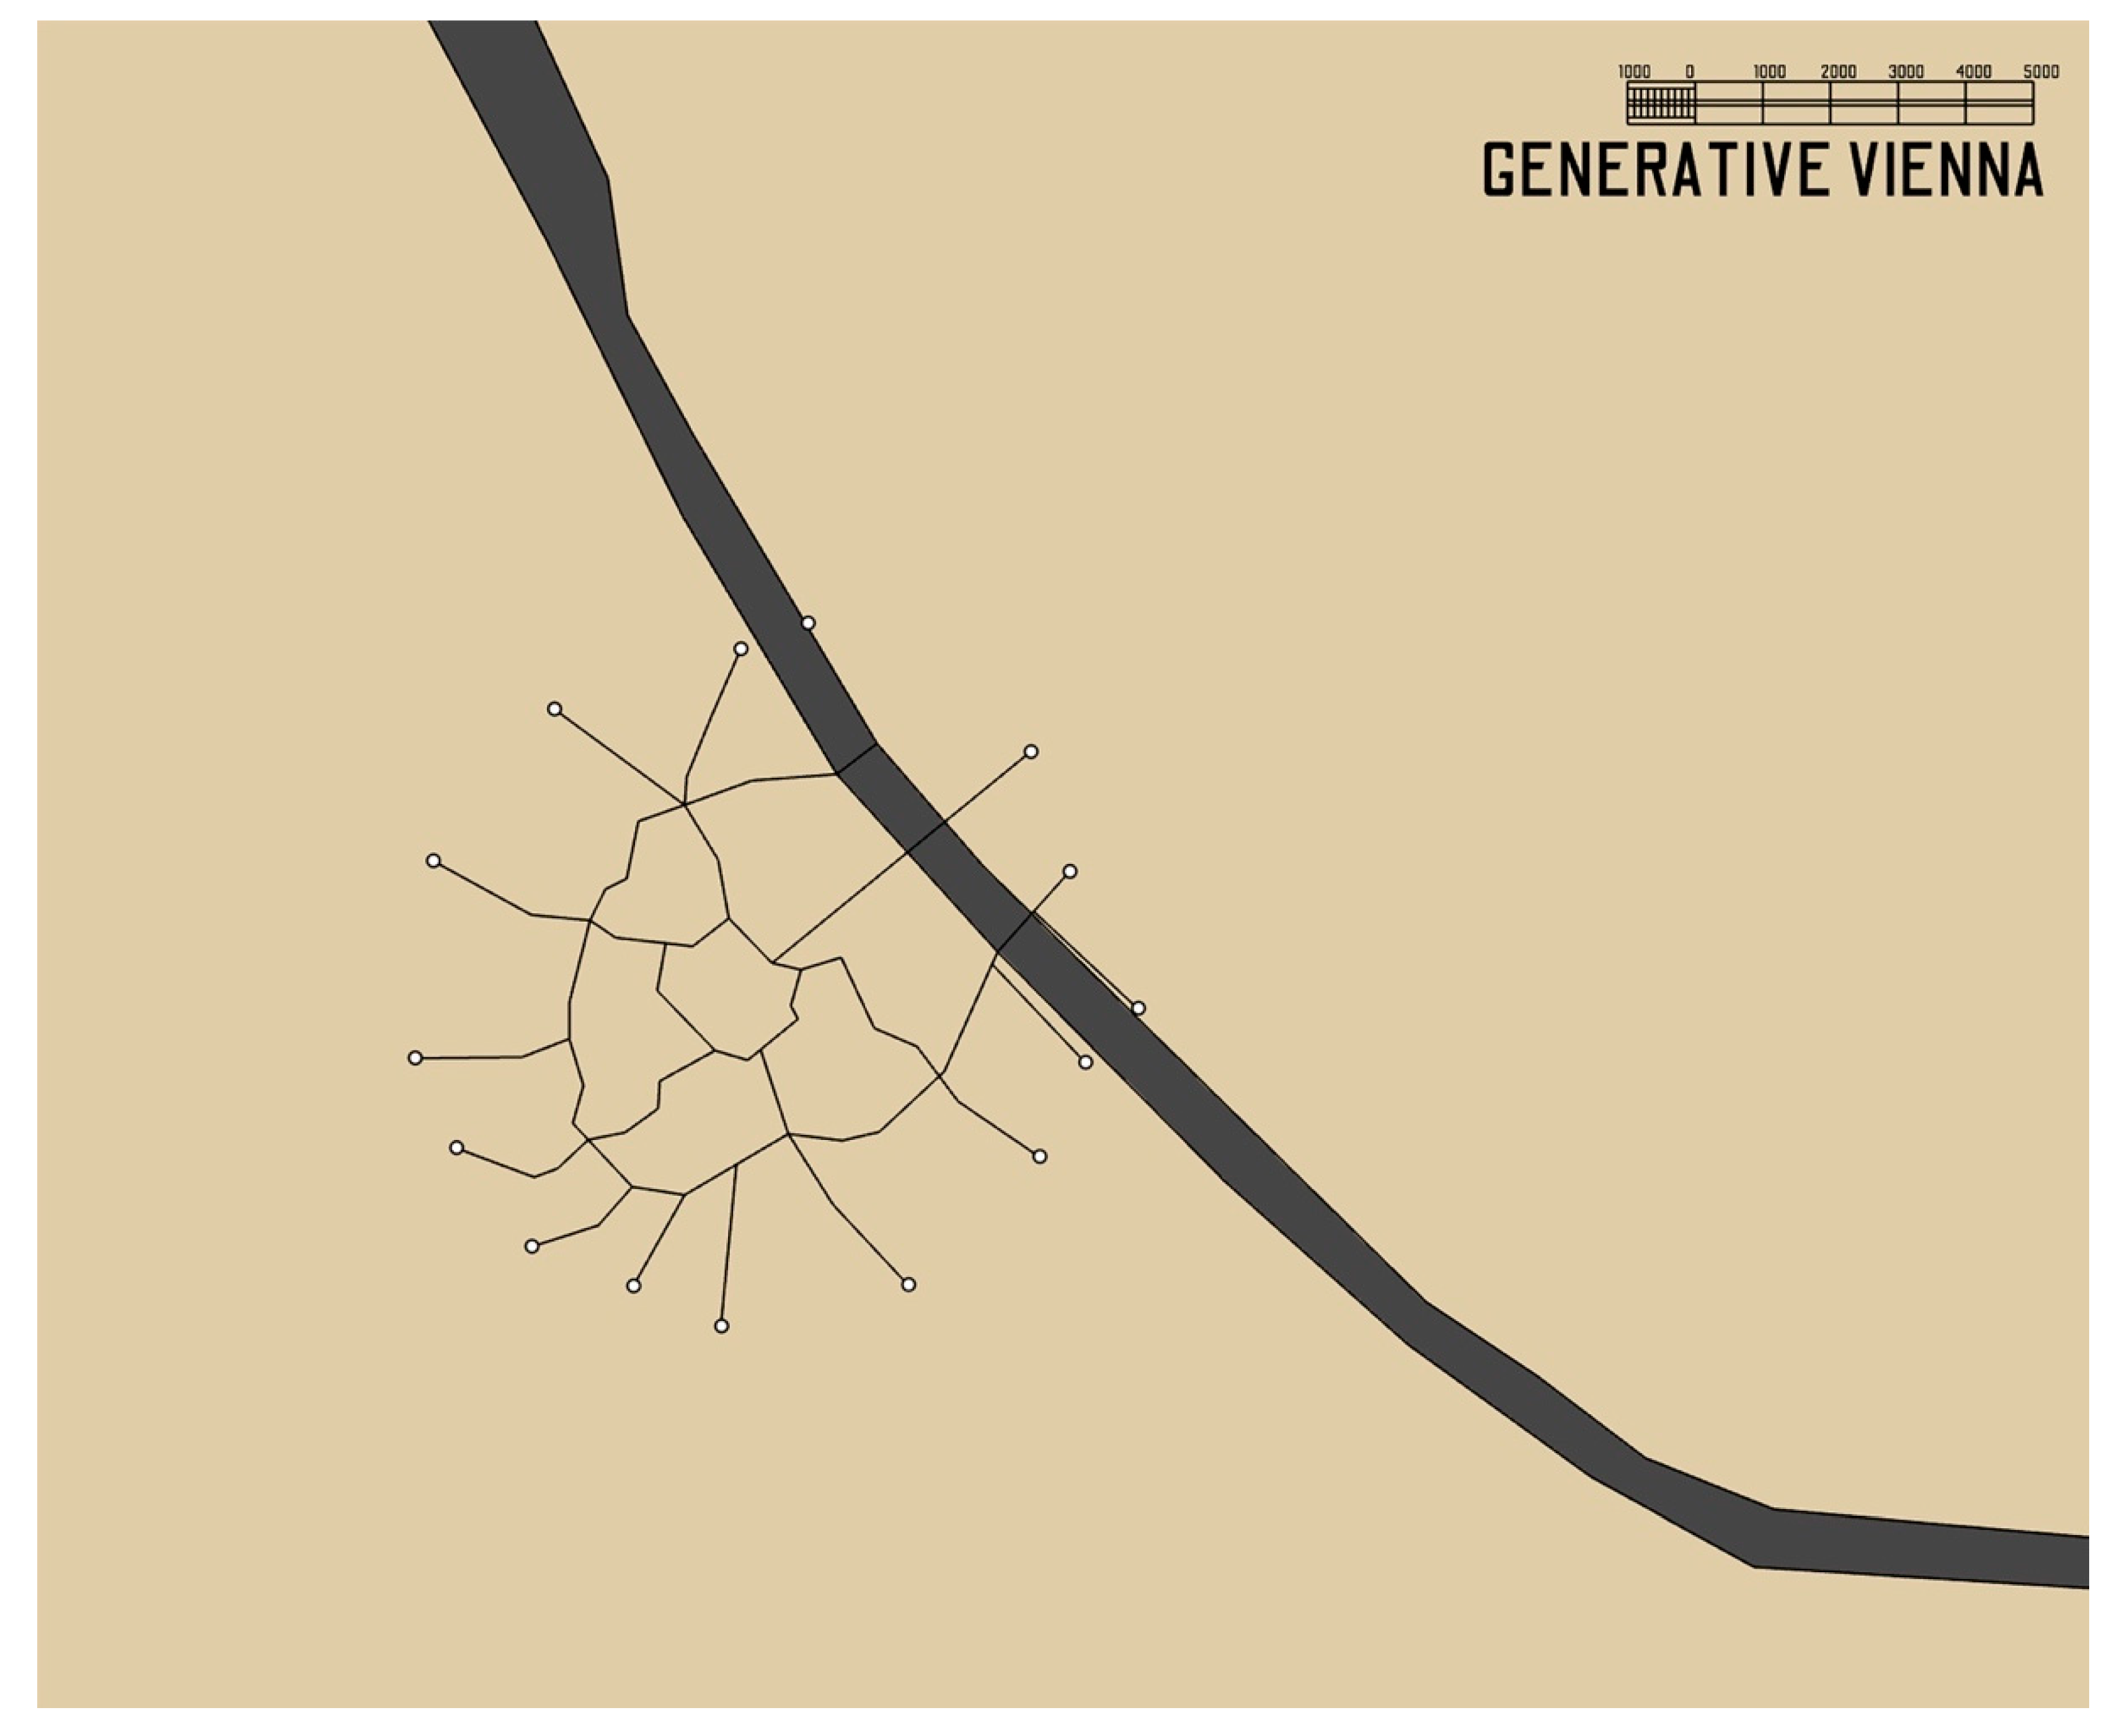
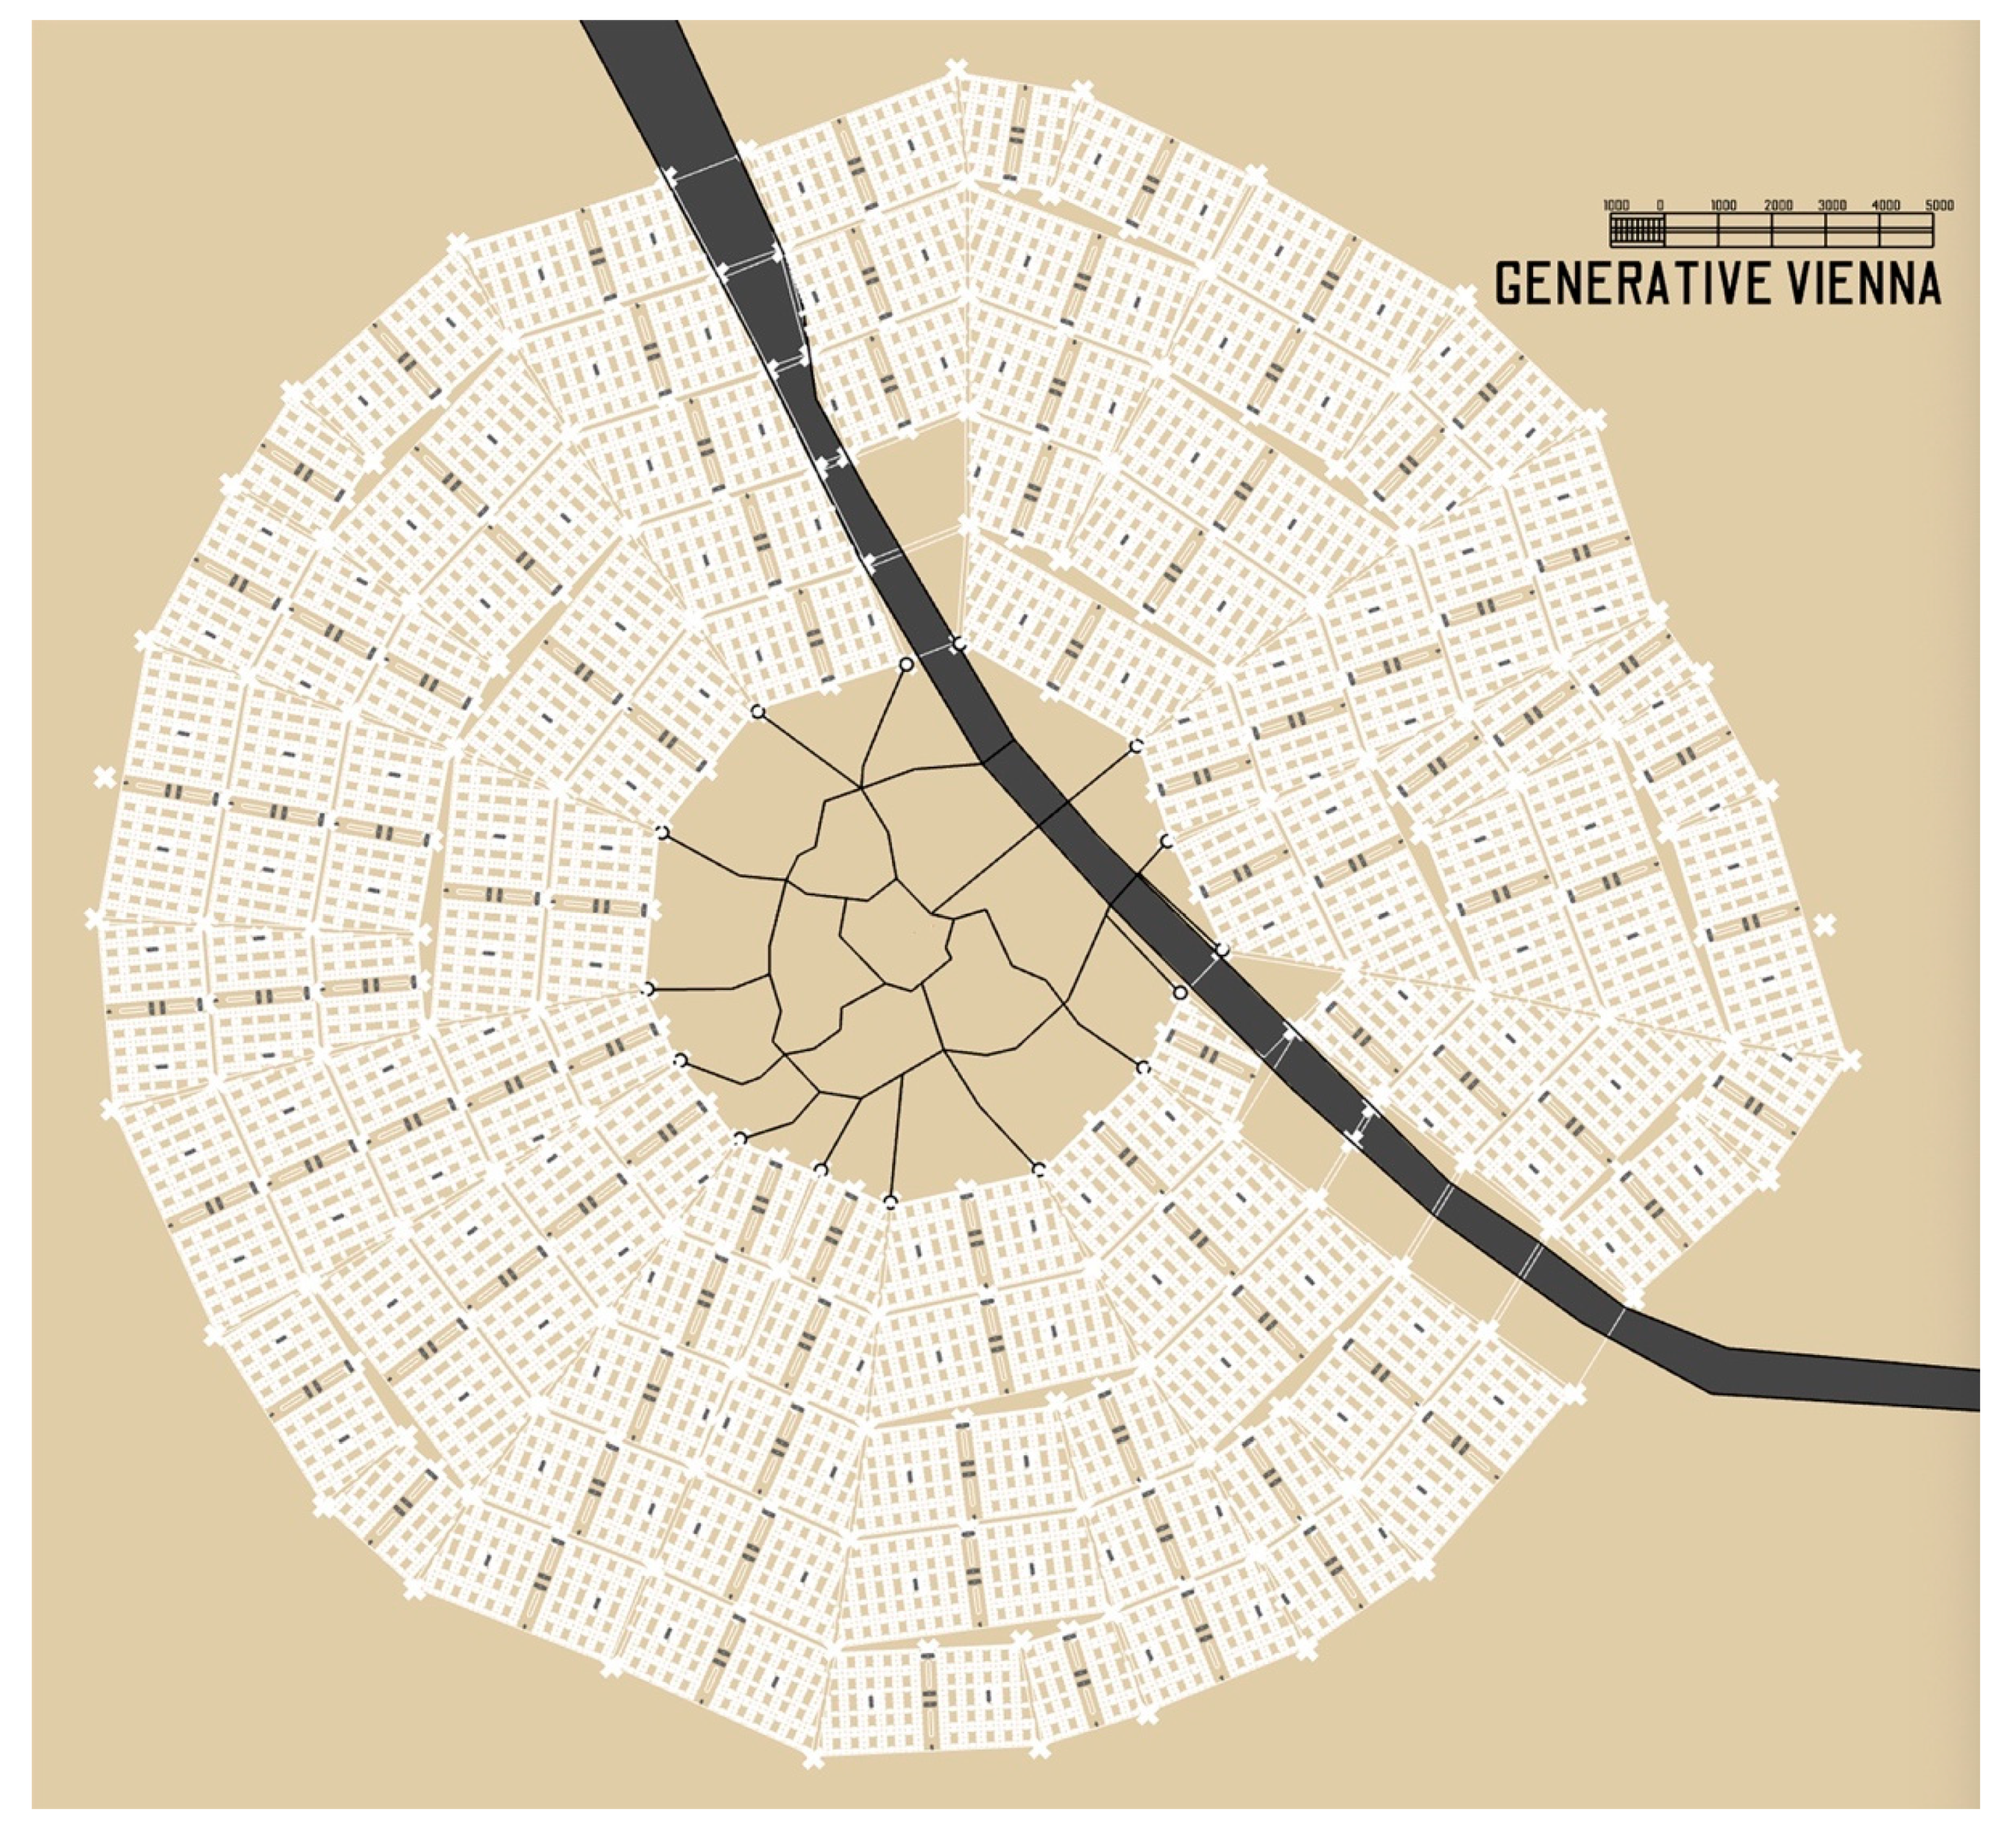
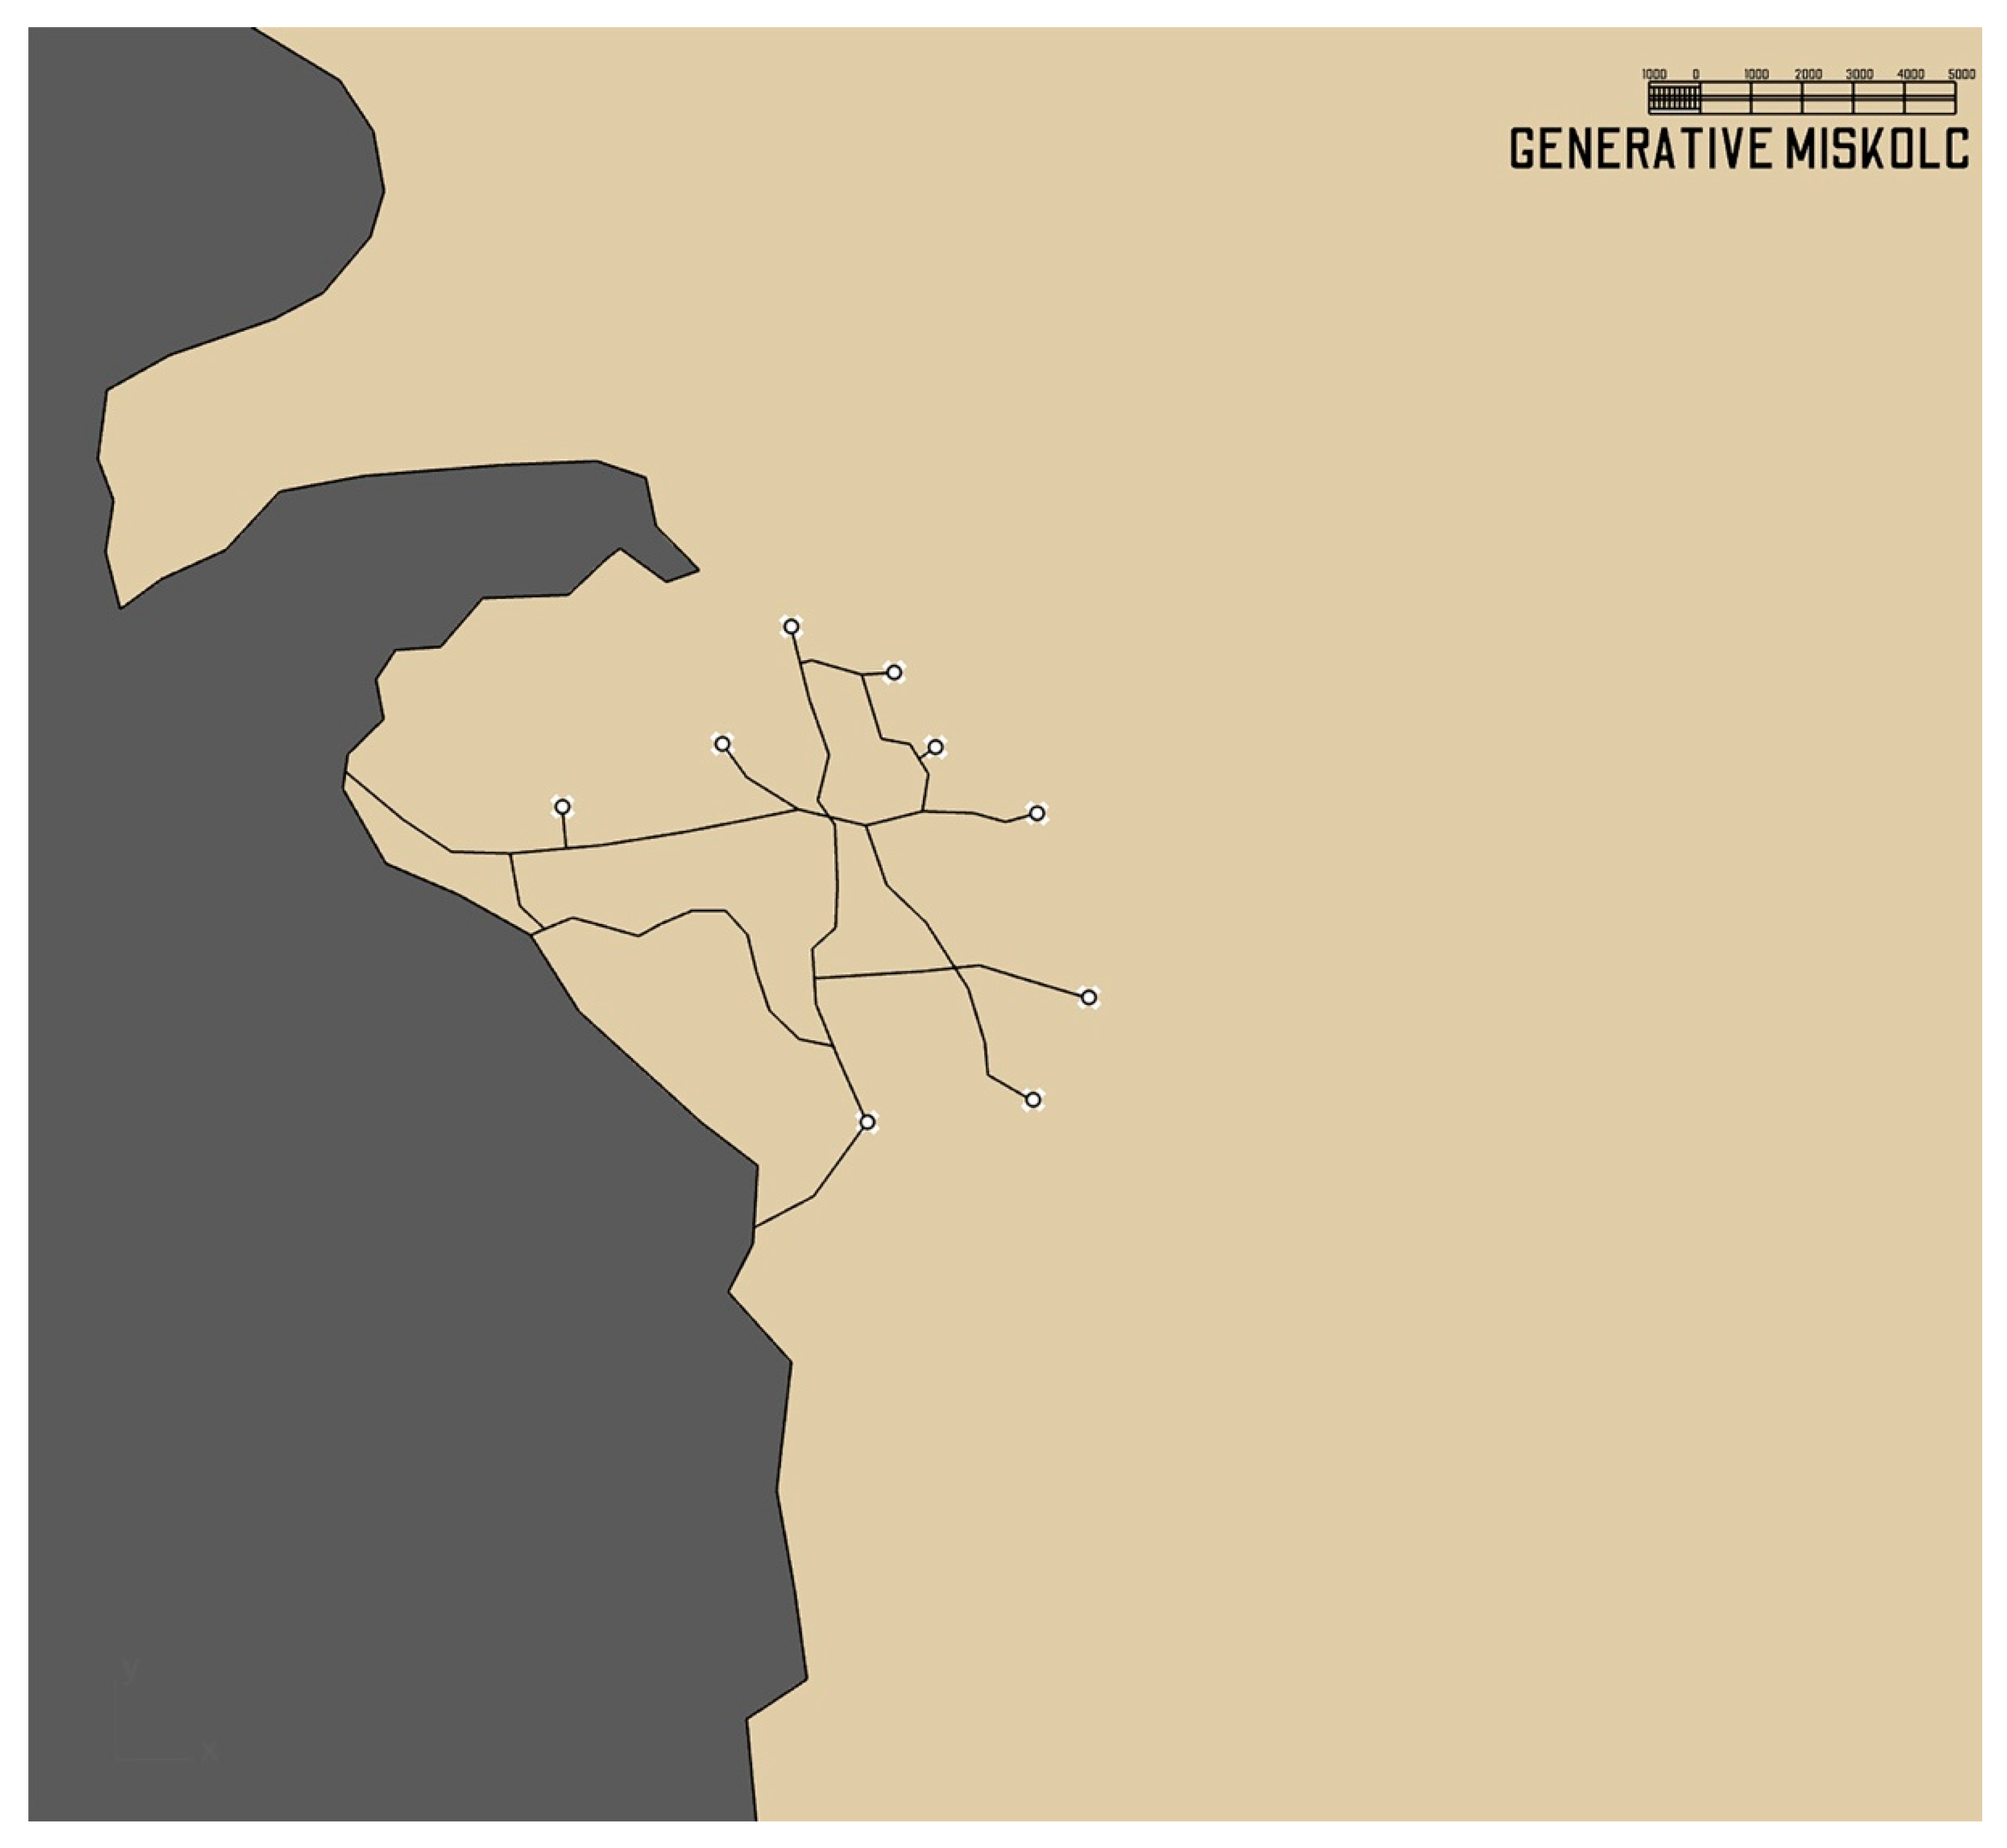
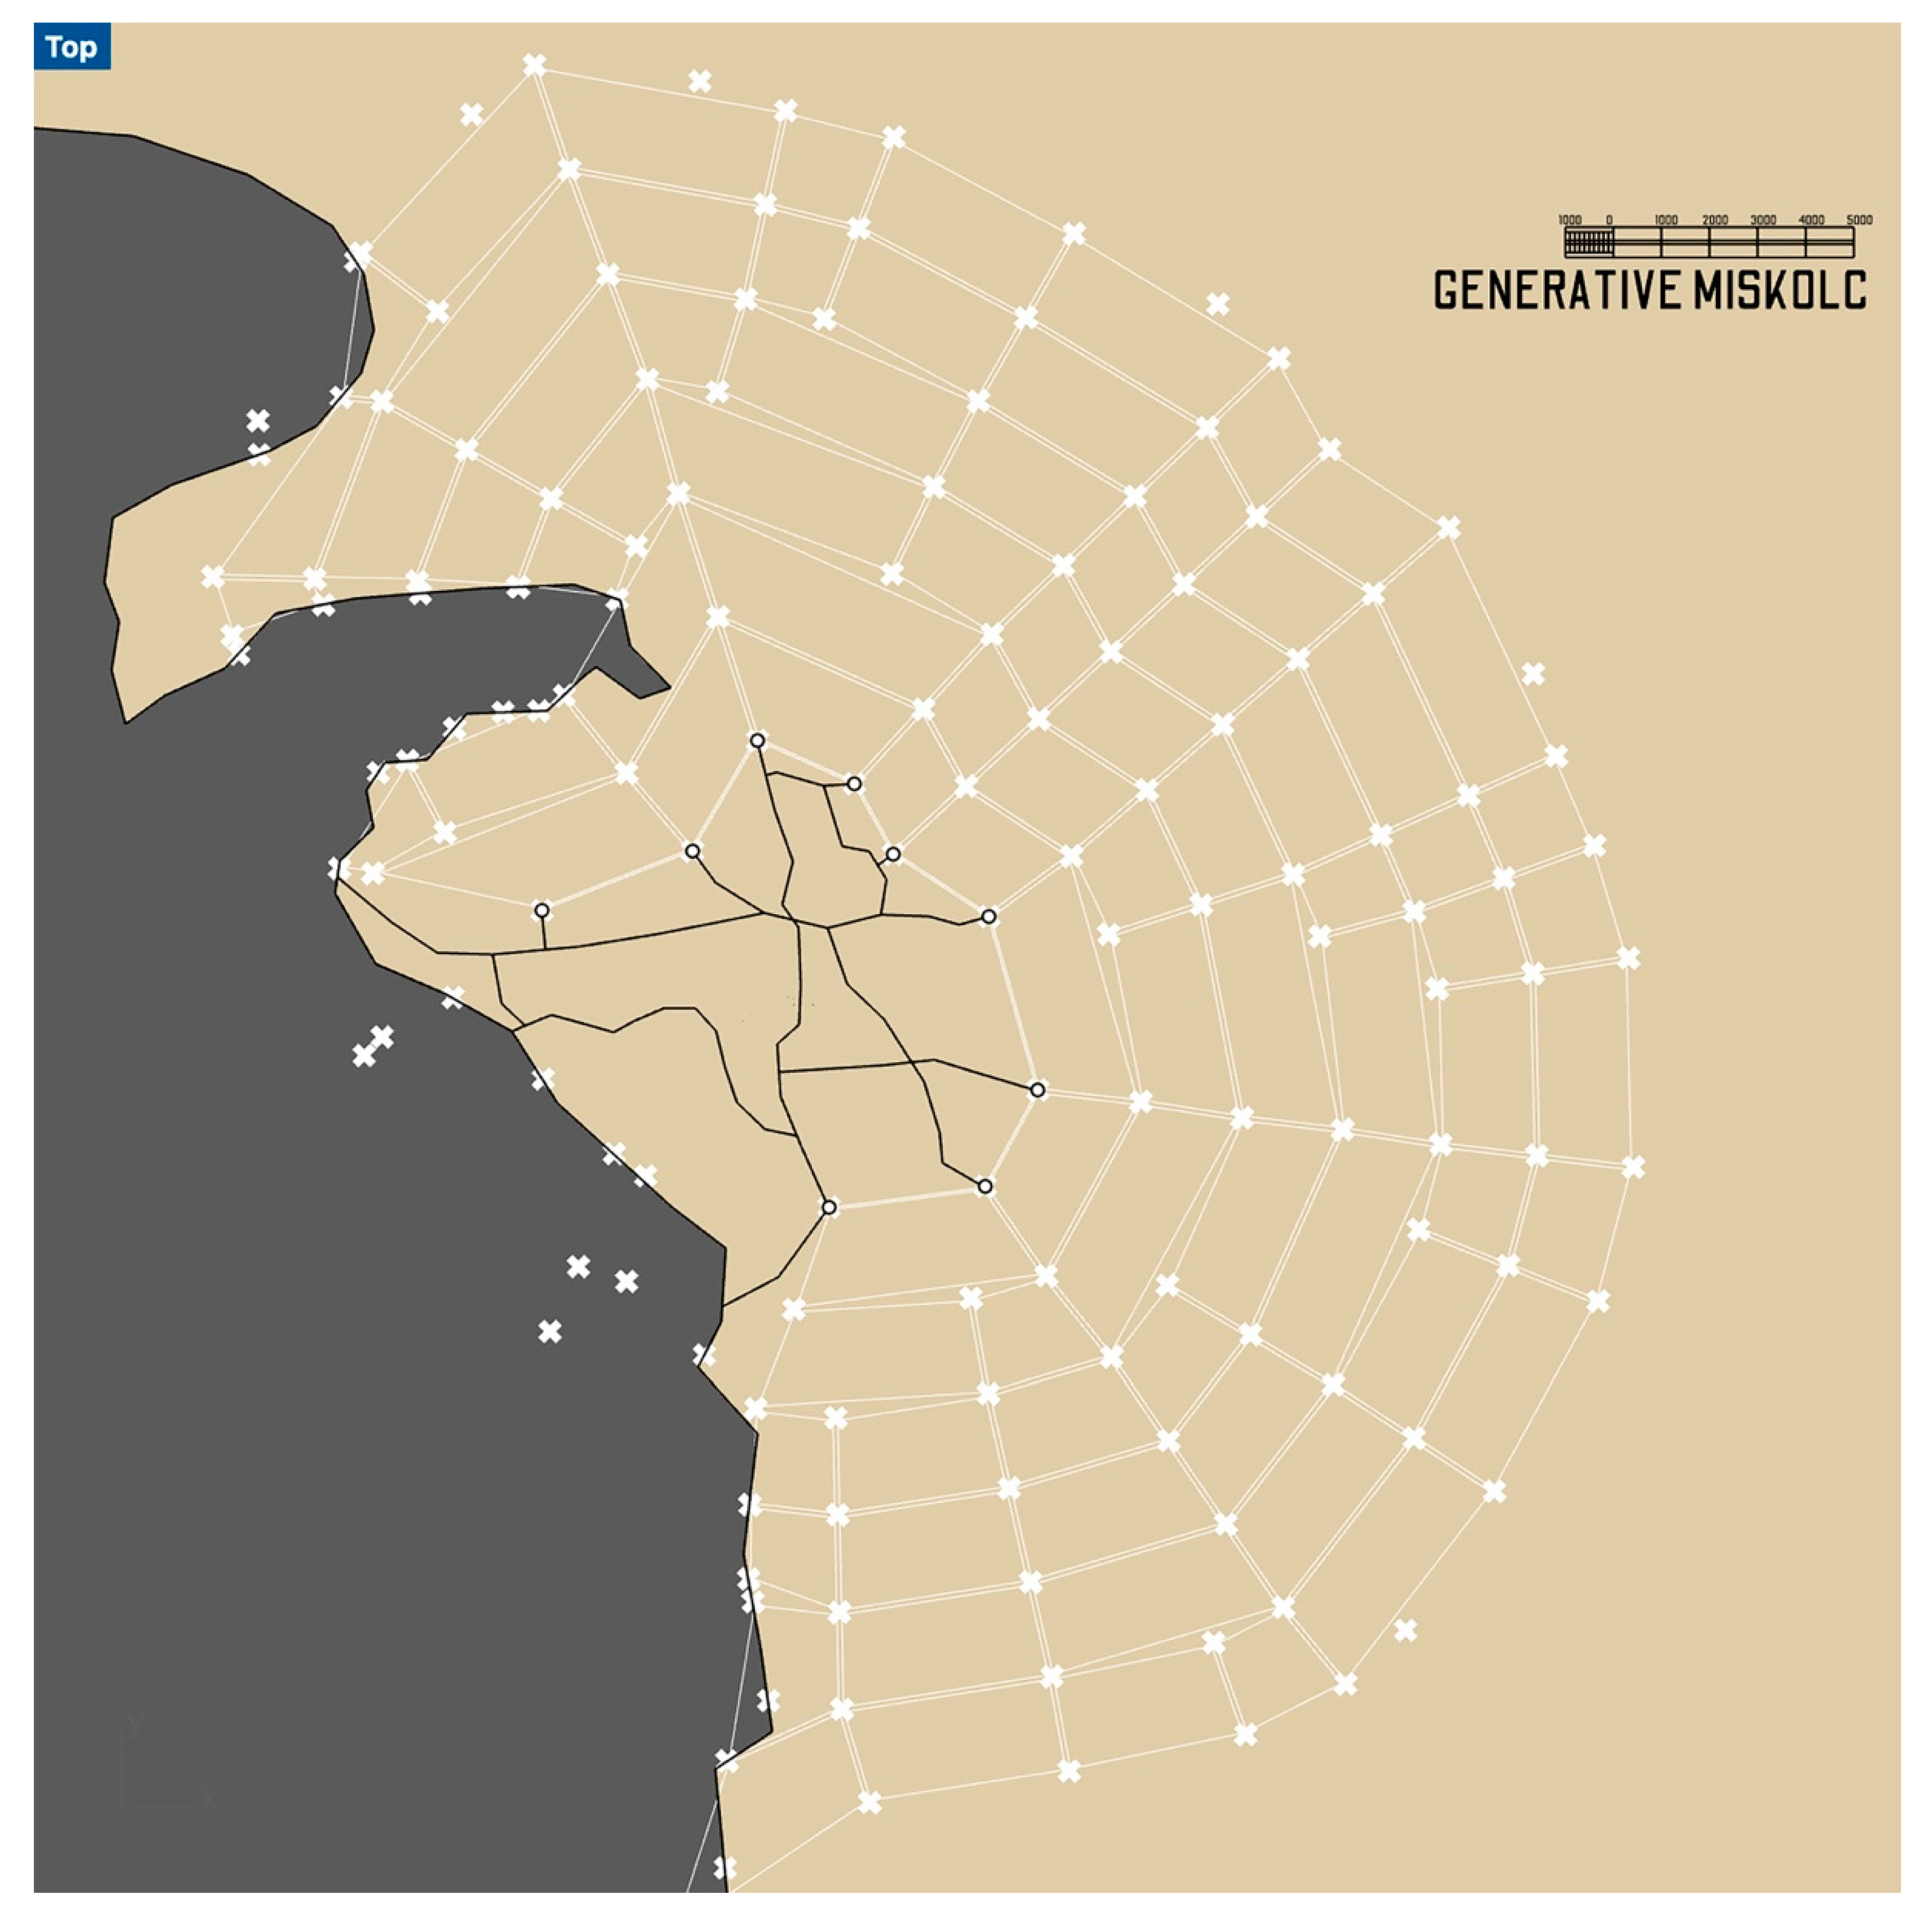
- The exit points of the main streets on the perimeter of the existing city.
- The elements of the terrain that distort the system of the districts: rivers, mountains, etc.
- An (either open or closed) curve is generated using the aforementioned exit points;
- The curve is offset to the outside by 2 km (this amount can be measured on Wagner’s drawing);
- Trapezoids are created using the relevant corner points of the two curves;
- The trapezoids are offset to the inside by 50 m to create the segments of the radial and zone roads.
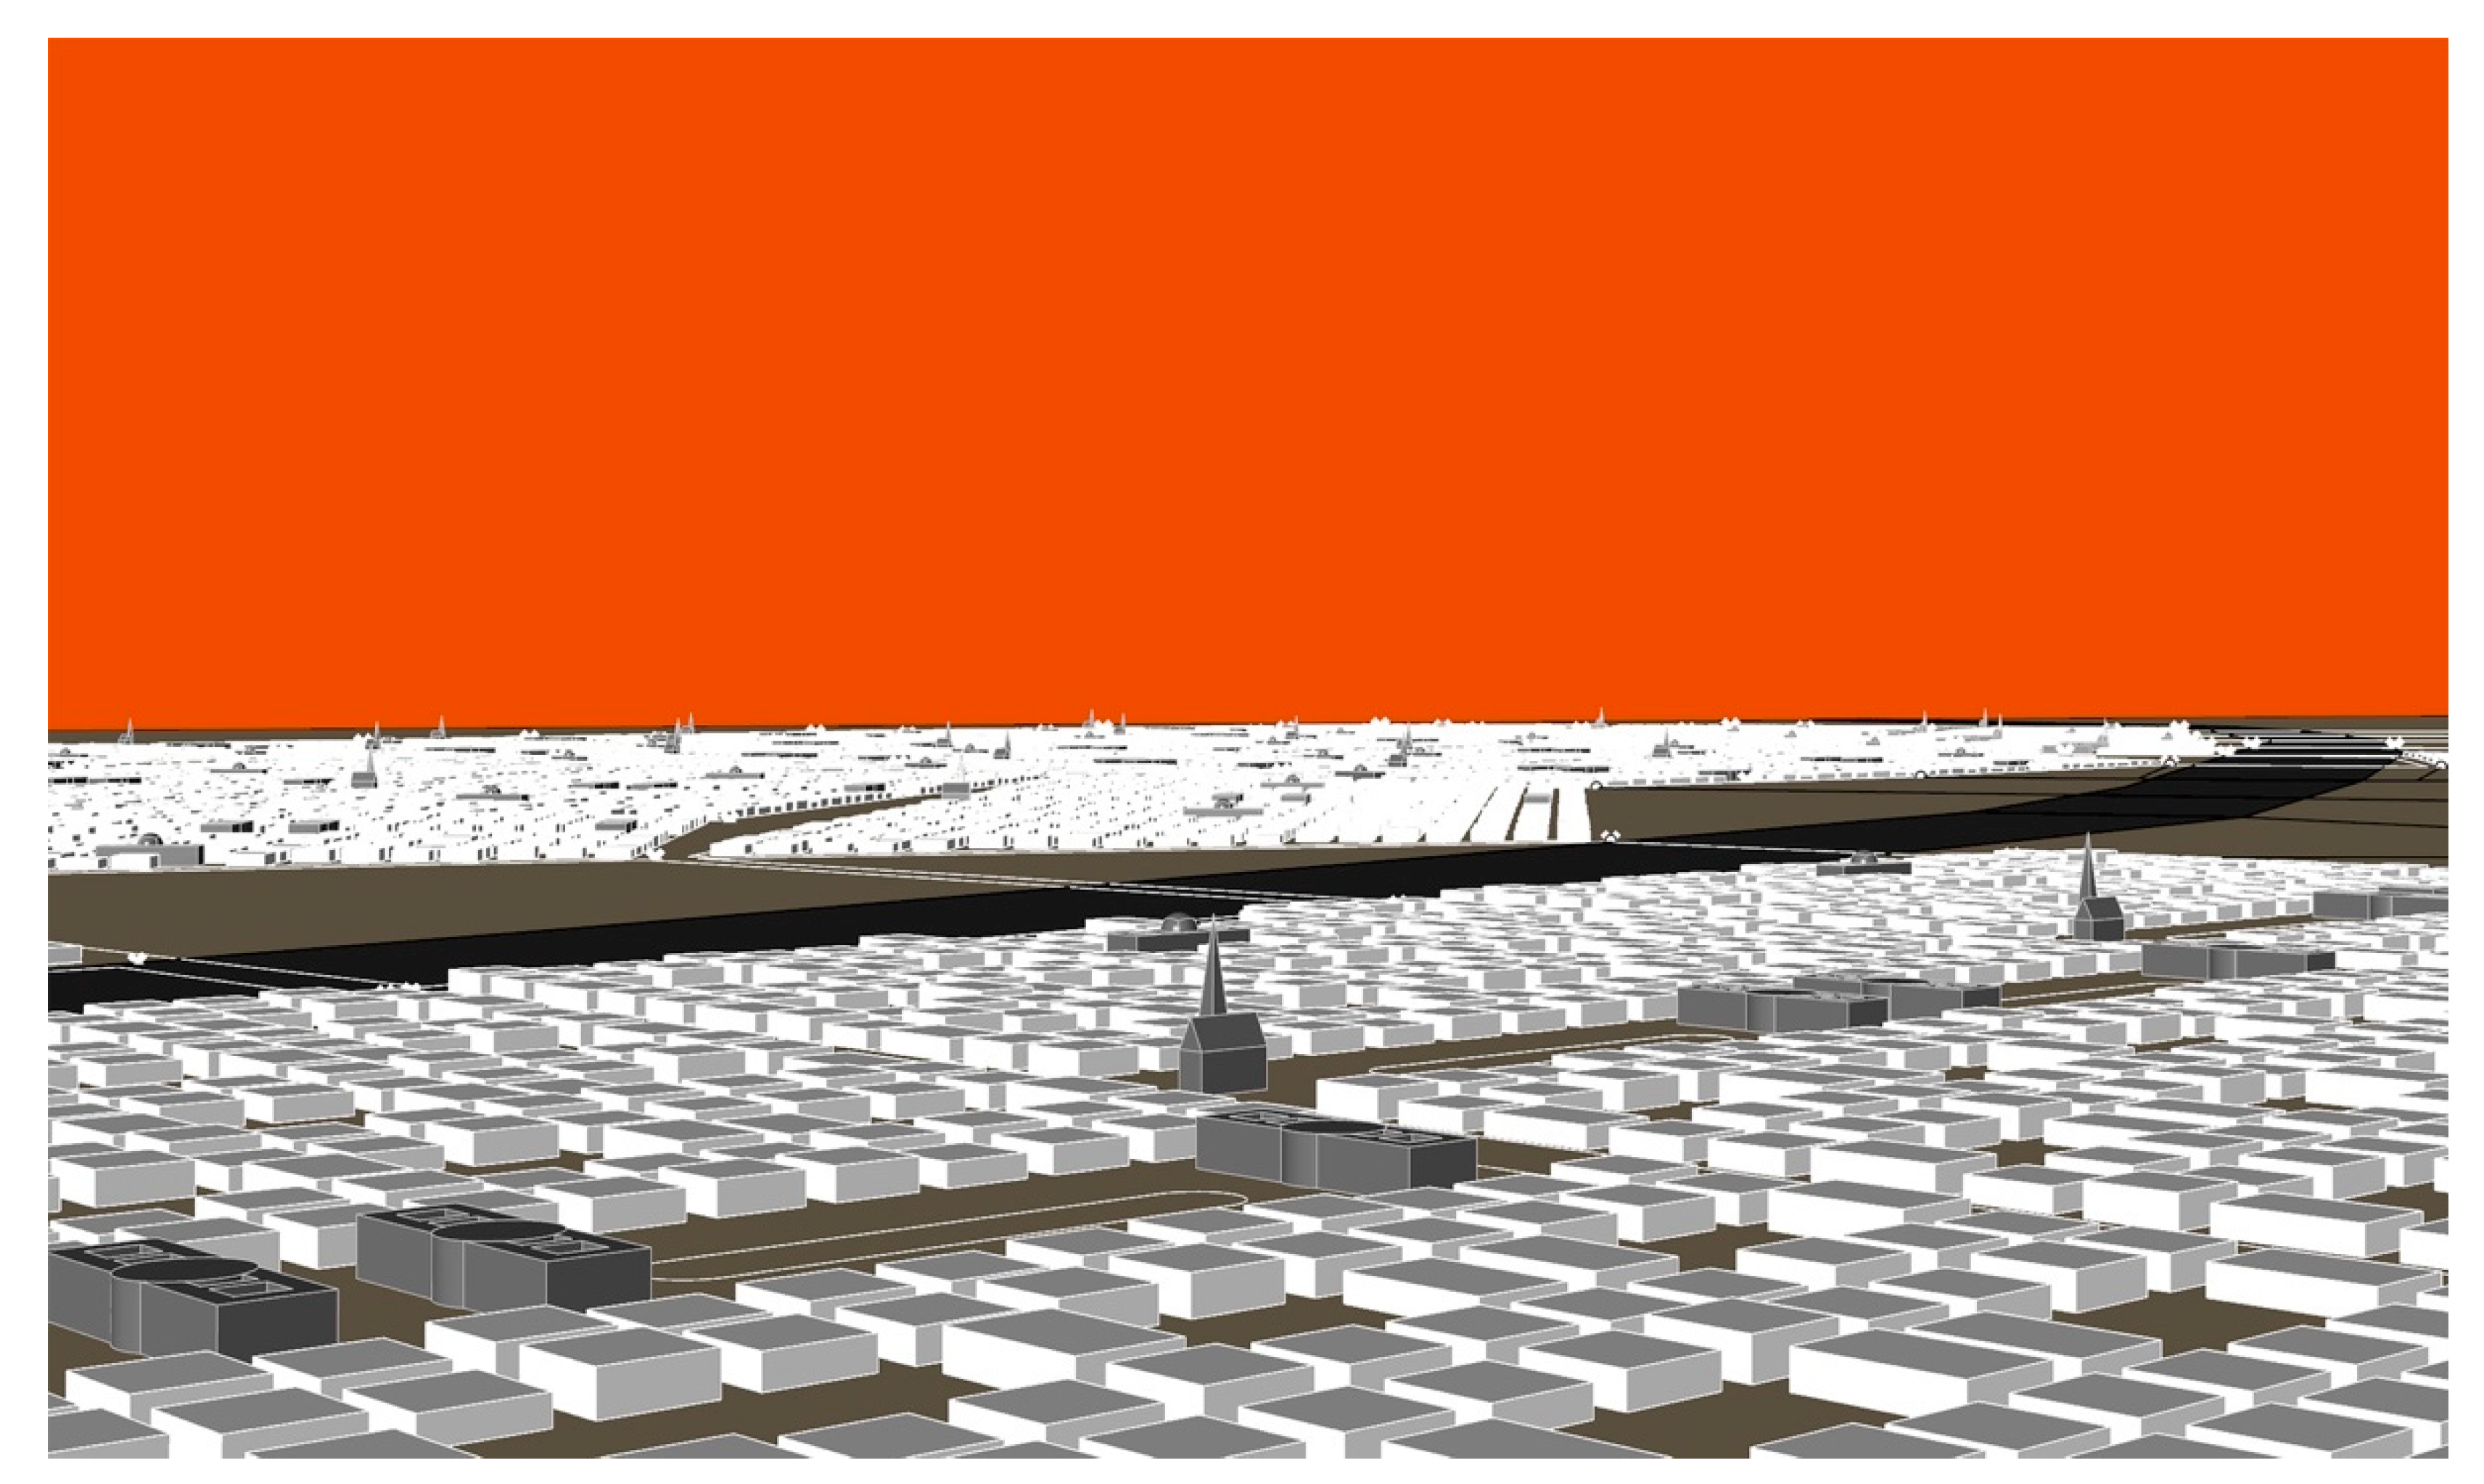
3. Results: Proof of the Generative Concept
- Ability to chase a purpose or a strategy
- Heterogeneous expression of the said purpose/strategy
- Nonlinearly additive interactions evolving due to learning
- Darwinist selection and time as a key variable
- Complexity in the interpretation of reality and rare events [16] (pp. 317–318).
4. Discussion: Wagner’s Rules and the Current Trends of Urban Planning
- High land-use intensity to create sufficient, critical mass as the basis for urban life;
- High building configuration coverage, attractive common urban space;
- Limited building height;
- Spaciousness near housing and access to large parks. Contrast between dense buildings and parks provides an alternative to suburban landscapes;
- Mixed use.
- Political and social environment (political stability, crime, law enforcement, etc.).
- Economic environment (currency exchange regulations, banking services).
- Socio-cultural environment (media availability and censorship, limitations on personal freedom).
- Medical and health considerations (medical supplies and services, infectious diseases, sewage, waste disposal, air pollution).
- Schools and education (standards and availability of international schools).
- Public services and transportation (electricity, water, public transportation, traffic congestion, etc.).
- Recreation (restaurants, theatres, cinemas, sports, and leisure).
- Consumer goods (availability of food/daily consumption items, cars).
- Housing (rental housing, household appliances, furniture, maintenance services).
- Natural environment (climate, record of natural disasters).
5. Appendix
Funding
Institutional Review Board Statement
Informed Consent Statement
Data Availability Statement
Conflicts of Interest
References
- Wagner, O. Die Groszstadt. Eine Studie Über Diese von Otto Wagner, 1st ed.; Verlag von Anton Schroll u. Komp: Wien, Austria, 1911. [Google Scholar]
- Wagner, O. The Development of a Great City. Together with an appreciation of the Author by A. D. F. Hamlin. In The Architectural Record; The Architectural Record Company: New York, NY, USA, 1912; Volume 31, pp. 485–500. [Google Scholar]
- Nierhaus, A.; Orosz, E.M. Otto Wagner, 1st ed.; Nierhaus, A., Orosz, E.M., Eds.; Residenz Verlag: Wien, Austria, 2018. [Google Scholar]
- Wagner, O. Moderne Architektur: Seinen Schülern ein Führer auf Diesem Kunstgebiete, 1st ed.; Schroll: Wien, Austria, 1896. [Google Scholar]
- Sonne, W. Großstadtbaukunst. Otto Wagners Städtebau im internationalen Kontext. In Otto Wagner, 1st ed.; Nierhaus, A., Orosz, E.M., Eds.; Residenz Verlag: Wien, Austria, 2018; pp. 52–59. [Google Scholar]
- Lovra, É. Városok az Osztrák-Magyar Monarchiában. Városszövetés Várostipológia 1867–1918, 1st ed.; Terc Kft.: Budapest, Hungary, 2019. [Google Scholar]
- Grimm, M.V. GRUND-RISS der K[aiserlich]-K[öniglichen] Haupt- und Residenz-Stadt WIEN: Mit Allen Vorstädten und der Umliegenden Gegend, 1st ed.; T. Mollo et Comp: Wien, Austria, 1798. [Google Scholar]
- Pevsner, N. An Outline of European Architecture; John Murray: London, UK, 1948. [Google Scholar]
- Lampugnani, V.M. Vienna Fin-de-siècle: Between Artistic City Planning and Unlimited Metropolis. In Sitte, Hegemann and the Metropolis. Modern Civic Art and International Exchanges, 1st ed.; Bohl, C.C., Lejeune, J.-F., Eds.; Routledge: New York, NY, USA, 2009; pp. 25–37. [Google Scholar]
- Kostof, S. The City Shaped. Urban Patterns and Meanings through History, 1st ed.; Bulfinch Press: Boston, MA, USA, 1991. [Google Scholar]
- Moravánszky, Á. Die Architektur der Donaumonarchie, 1st ed.; Ernst: Berlin, Germany, 1988. [Google Scholar]
- Kropf, K. The Handbook of Urban Morphology, 1st ed.; Wiley: Chichester, UK, 2017. [Google Scholar]
- D’Acci, L. On Urban Morphology and Mathematics. In The Mathematics of Urban Morphology, 1st ed.; D’Acci, L., Ed.; Springer: Cham, Switzerland, 2019; pp. 1–18. [Google Scholar]
- Hillier, B.; Hanson, J. The Social Logic of Space, 1st ed.; Cambridge University Press: Cambridge, UK, 1984. [Google Scholar]
- Clarke, K.C. Mathematical Foundations of Cellular Automata and Complexity Theory. In The Mathematics of Urban Morphology, 1st ed.; D’Acci, L., Ed.; Springer: Cham, Switzerland, 2019; pp. 163–170. [Google Scholar]
- Bellomo, N.; Terna, P. On the Complex Interaction Between Mathematics and Urban Morphology. In The Mathematics of Urban Morphology, 1st ed.; D’Acci, L., Ed.; Springer: Cham, Switzerland, 2019; pp. 315–333. [Google Scholar]
- Pålsson, K. How to Design Humane Cities: Public Spaces and Urbanity, 1st ed.; DOM Publishers: Berlin, Germany, 2019. [Google Scholar]
- Panerai, P.; Castex, J.; Depadule, J.C.; Samuels, I. Urban Forms. The Death and Life of the Urban Block, 1st ed.; Routledge: London, UK, 2004. [Google Scholar]
- Raith, E. A korszerű városi lakóház. A várostervezés szempontjai = The up-to-date urban dwelling house. The aspects of the urban planning. In Modell Vagy Külön út: Bécs Szociális Építészete = Model or Separate Track: The Social Architecture of Vienna, 1st ed.; Tamáska, M., Kocsis, J.B., Eds.; Martin Opitz: Budapest, Hunguary, 2018; pp. 81–92. [Google Scholar]
- Kadi, J. A szociális lakásépítés három korszaka Bécsben = The three periods of the social housing in Vienna. In Modell Vagy Külön út: Bécs Szociális Építészete = Model or Separate Track: The Social Architecture of Vienna, 1st ed.; Tamáska, M., Kocsis, J.B., Eds.; Martin Opitz: Budapest, Hunguary, 2018; pp. 51–61. [Google Scholar]
- Fiedler, J.; Hofstatter, K.; Holzer, P.; Knierbein, S.; Lainer, R.; Pilz, T.; Raith, E.; Scheuvens, R. Die Instrumente des Städtebaus, 1st ed.; Wien 3420 Aspern Development AG: Wien, Austria, 2010. [Google Scholar]
- Vienna Tops Mercer’s 21st Quality of Living Ranking. 2019. Available online: https://www.mercer.com/newsroom/2019-quality-of-living-survey.html (accessed on 14 June 2021).


Publisher’s Note: MDPI stays neutral with regard to jurisdictional claims in published maps and institutional affiliations. |
© 2021 by the author. Licensee MDPI, Basel, Switzerland. This article is an open access article distributed under the terms and conditions of the Creative Commons Attribution (CC BY) license (https://creativecommons.org/licenses/by/4.0/).
Share and Cite
Bereczki, Z. Patterns of the Expanding City: An Algorithmic Interpretation of Otto Wagner’s Work. Heritage 2021, 4, 1062-1079. https://doi.org/10.3390/heritage4030059
Bereczki Z. Patterns of the Expanding City: An Algorithmic Interpretation of Otto Wagner’s Work. Heritage. 2021; 4(3):1062-1079. https://doi.org/10.3390/heritage4030059
Chicago/Turabian StyleBereczki, Zoltán. 2021. "Patterns of the Expanding City: An Algorithmic Interpretation of Otto Wagner’s Work" Heritage 4, no. 3: 1062-1079. https://doi.org/10.3390/heritage4030059
APA StyleBereczki, Z. (2021). Patterns of the Expanding City: An Algorithmic Interpretation of Otto Wagner’s Work. Heritage, 4(3), 1062-1079. https://doi.org/10.3390/heritage4030059