Article

Protocol for the Analysis of Cross-Sections from Gilded Surfaces

1
Conservation Department, Victoria and Albert Museum, South Kensington, London SW7 2RL, UK
2
Department of Chemistry, University College London, 20 Gordon Street, London WC1H 0AJ, UK
3
Institute of Archaeology, University College London, 31–34 Gordon Square, London WC1H 0PY, UK
*
Author to whom correspondence should be addressed.
Heritage 2021, 4(3), 2416-2430; https://doi.org/10.3390/heritage4030136
Submission received: 30 July 2021 / Revised: 7 September 2021 / Accepted: 10 September 2021 / Published: 15 September 2021

Abstract

:
This paper describes the protocol currently used at the Victoria and Albert Museum for the scientific analysis of water, oil and lacquer gilding in cultural heritage objects. The purpose of the protocol is to guide scientists, curators and conservators in their routine investigations, and address questions about the characteristics of gilded surfaces, their number, sequence, date, composition and stratigraphic details. Each protocol step is described in detail and is accompanied by practical examples taken from the analysis of an 18th-century Chippendale table and the 20th-century statue of the Spirit of Gaiety. The merits of individual analytical techniques and equipment are also evaluated.

1. Introduction

The investigation and characterisation of gilded surfaces is a frequent activity in the scientific laboratories of museums and galleries. Frames, furniture and panel paintings, to select only a few types of objects, can all display gilding, the scientific analysis of which has the potential to unlock important information for conservators, curators and art historians [1,2,3]. There are four main types of questions that are routinely asked when looking at most gilded surfaces:
  • How many gilding schemes are there (i.e., how many times has an object been re-gilded)?
  • What type of gilding is it (e.g., oil gilding, water gilding, mercury gilding, electroplating, etc.)?
  • What period is each individual gilding scheme from?
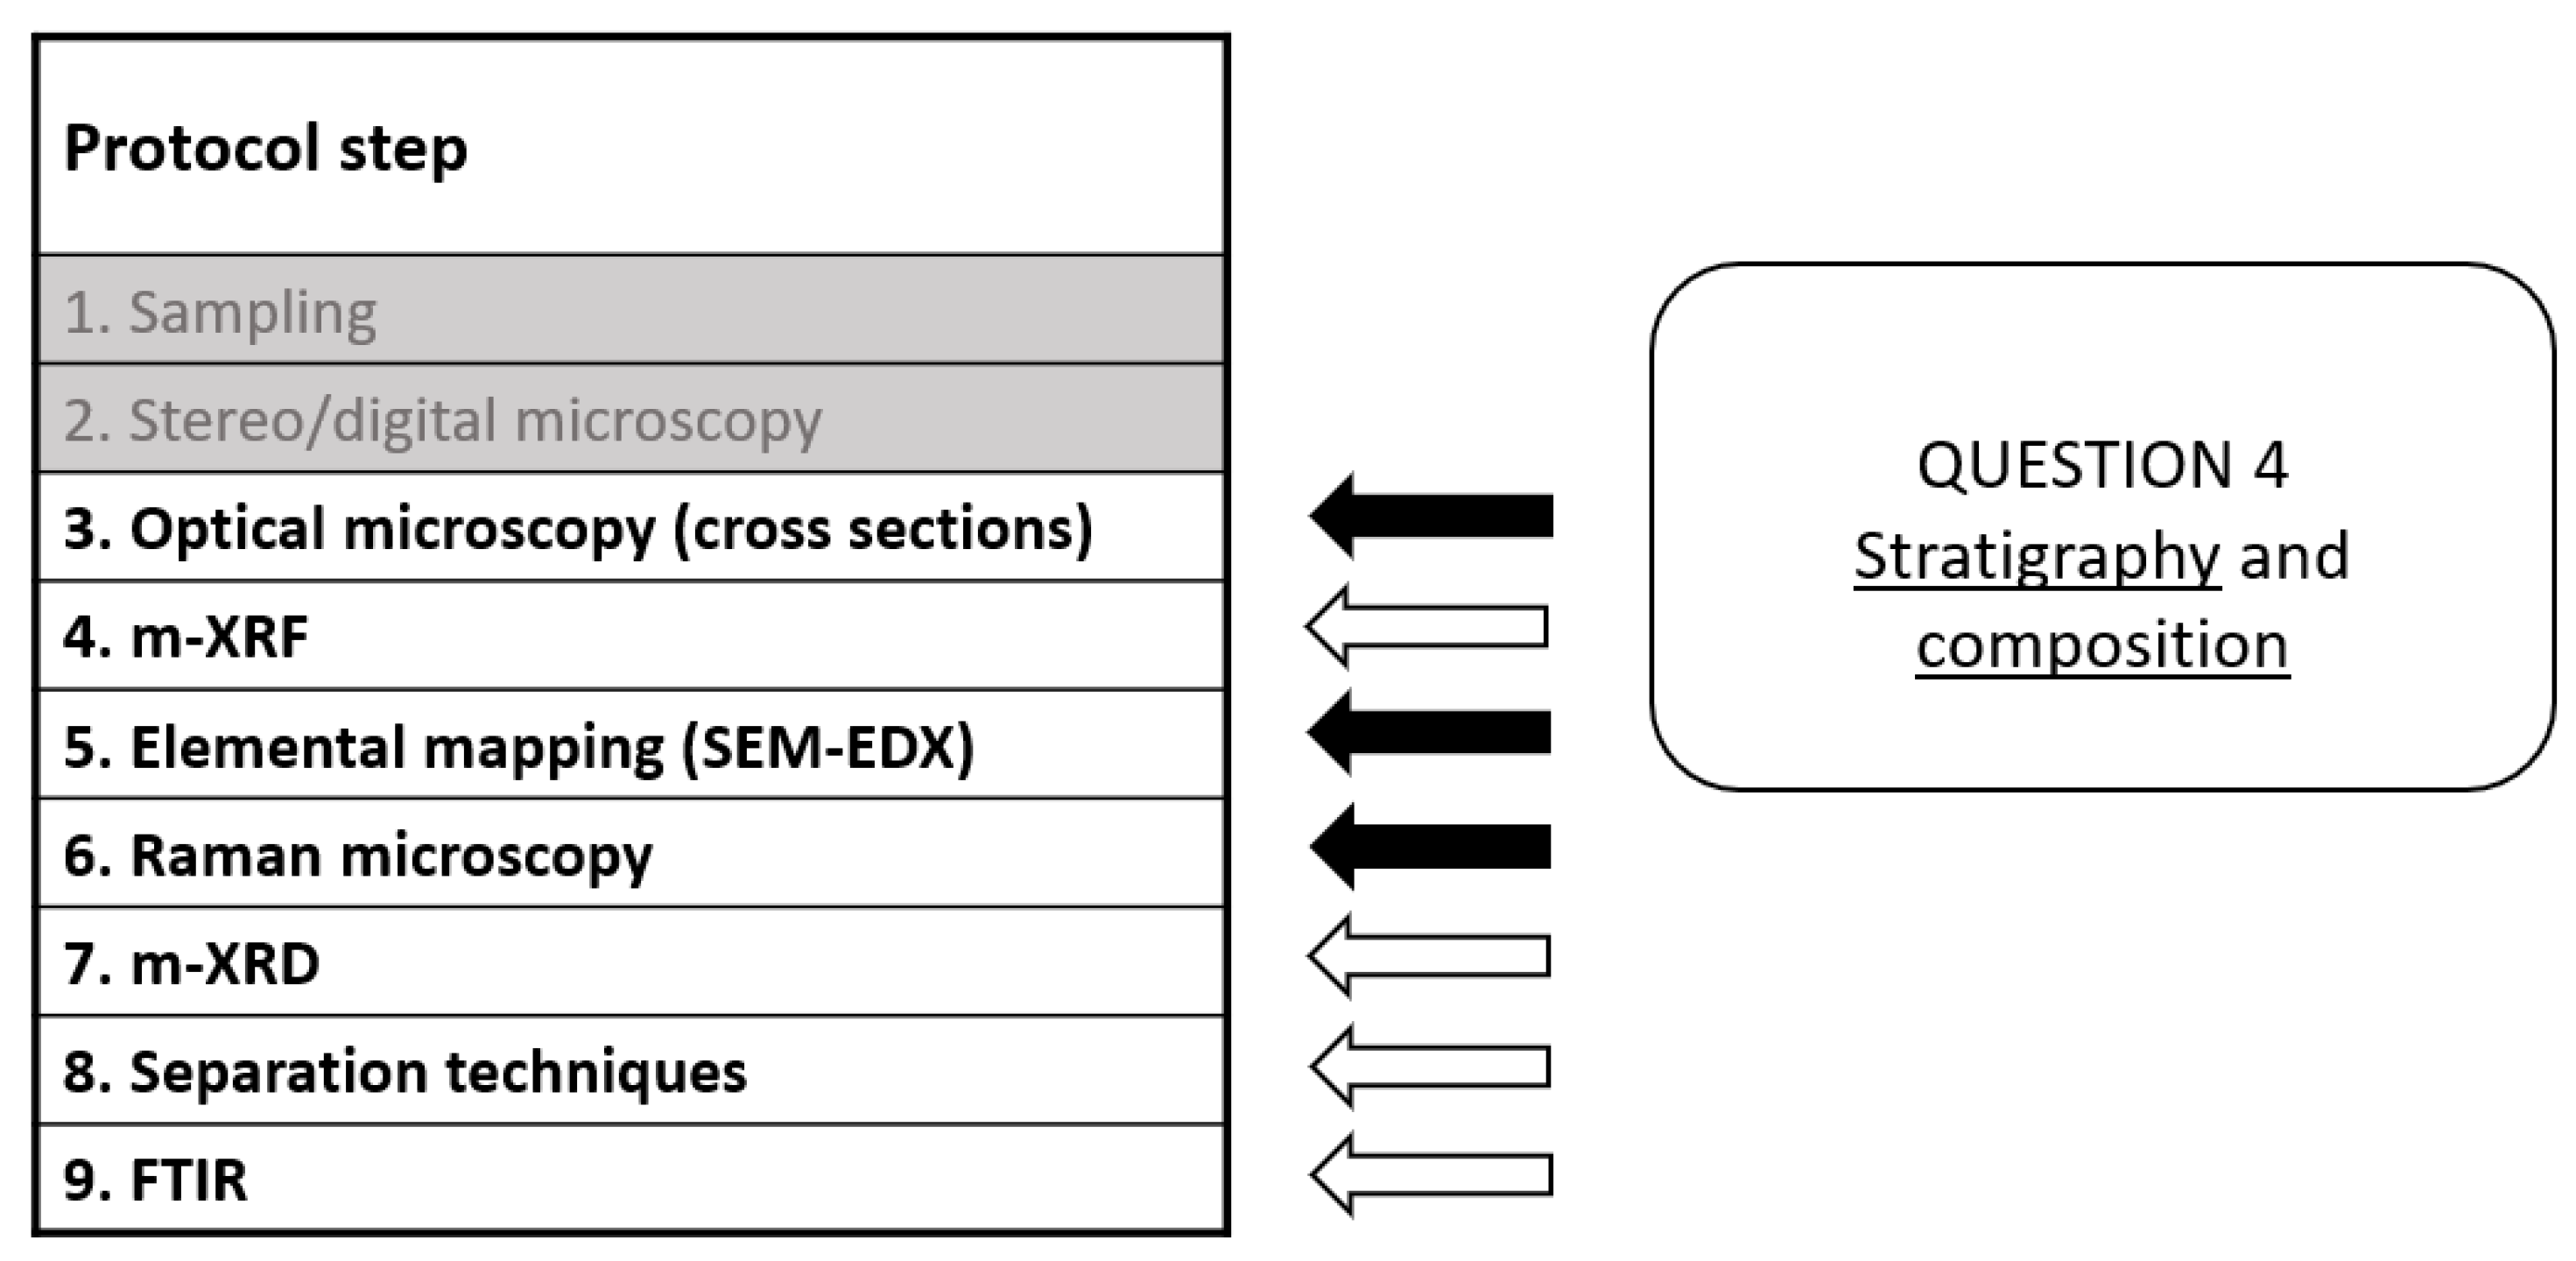
  • What is the stratigraphy and composition of the layers within each gilding scheme?
The expertise and connoisseurship of museum conservators and curators is invaluable to address these questions. Technical examination of gilded surfaces before and during conservation treatments offers invaluable tools for the evaluation and assessment of gilding. Curatorial research can produce dated bills and historical resources referring to campaigns of repair and occasionally specific materials used during the latter, and can therefore be used to help dating gilding schemes. With this in mind, scientists can provide additional evidence, often incontrovertible or offering a significant degree of certainty.
Scientists have a number of analytical techniques they can use to address the questions outlined above, from optical microscopy, to scanning electron microscopy, to Raman microscopy and more [4,5,6,7,8,9]. However, to our knowledge, there is no recognised and/or published protocol that codifies the different steps to be taken for an efficient and effective resolution of the questions stated above. This paper elucidates the protocol currently in use at the Victoria and Albert Museum for the analysis of samples of gilded surfaces from ‘soft’ objects. With ‘soft’, we refer to objects with a substrate that can be easily sampled (wood, plaster, canvas, etc.), as opposed to ‘hard’ objects, which can be difficult to sample with regular sampling tools (e.g., objects with a substrate made of solid metal, such as ‘fire’ gilded mounts in furniture). In this respect, this paper essentially deals with two types of gilding, namely water gilding and oil gilding [10,11], as mercury gilding and electroplating are normally used to gild metal objects. Incidentally, gilding is frequently found in oriental lacquer objects; in such instances, the gilding technique is based on the use of the sap of specific trees as an adhesive. Oriental lacquer gilding is not discussed extensively here, but references are given where appropriate.
The protocol is a sequence of analytical steps that are not necessarily fixed rigidly and can be picked and mixed, if necessary, depending on the specifics of the individual object under observation and/or the availability of the necessary scientific equipment and expertise.
The list of the techniques within the protocol does not intend to be exhaustive and does not encompass every single analytical method that may have been used for the technical examination and scientific analysis of gilded surfaces. It is, however, representative of the most commonly used, easily accessible methods.
Finally, a separate mention must be made about micro-chemical testing of cross-sections. While it is not part of the V&A protocol, this type of testing used to be much more frequent in the past [12], including at the V&A, and it can help in the identification of selected metals, pigments and binding media. Where access to expensive or complex scientific equipment is difficult, micro-chemical testing can still be used.

2. Materials and Methods

2.1. The Protocol

Nine steps have been identified, the first six of which (the ones followed routinely for V&A objects) are discussed in detail here:
  • Sampling;
  • Stereo microscopy of loose samples;
  • Optical microscopy of samples mounted as cross-sections;
  • Micro X-ray fluorescence (μXRF);
  • Elemental mapping by scanning electron microscopy with energy-dispersive X-ray analysis (SEM–EDX);
  • Raman microscopy;
  • Micro X-ray diffraction (μXRD);
  • Separation techniques for binding media and other organic materials (dyes, etc.);
  • Fourier-transform infrared analysis (FTIR).
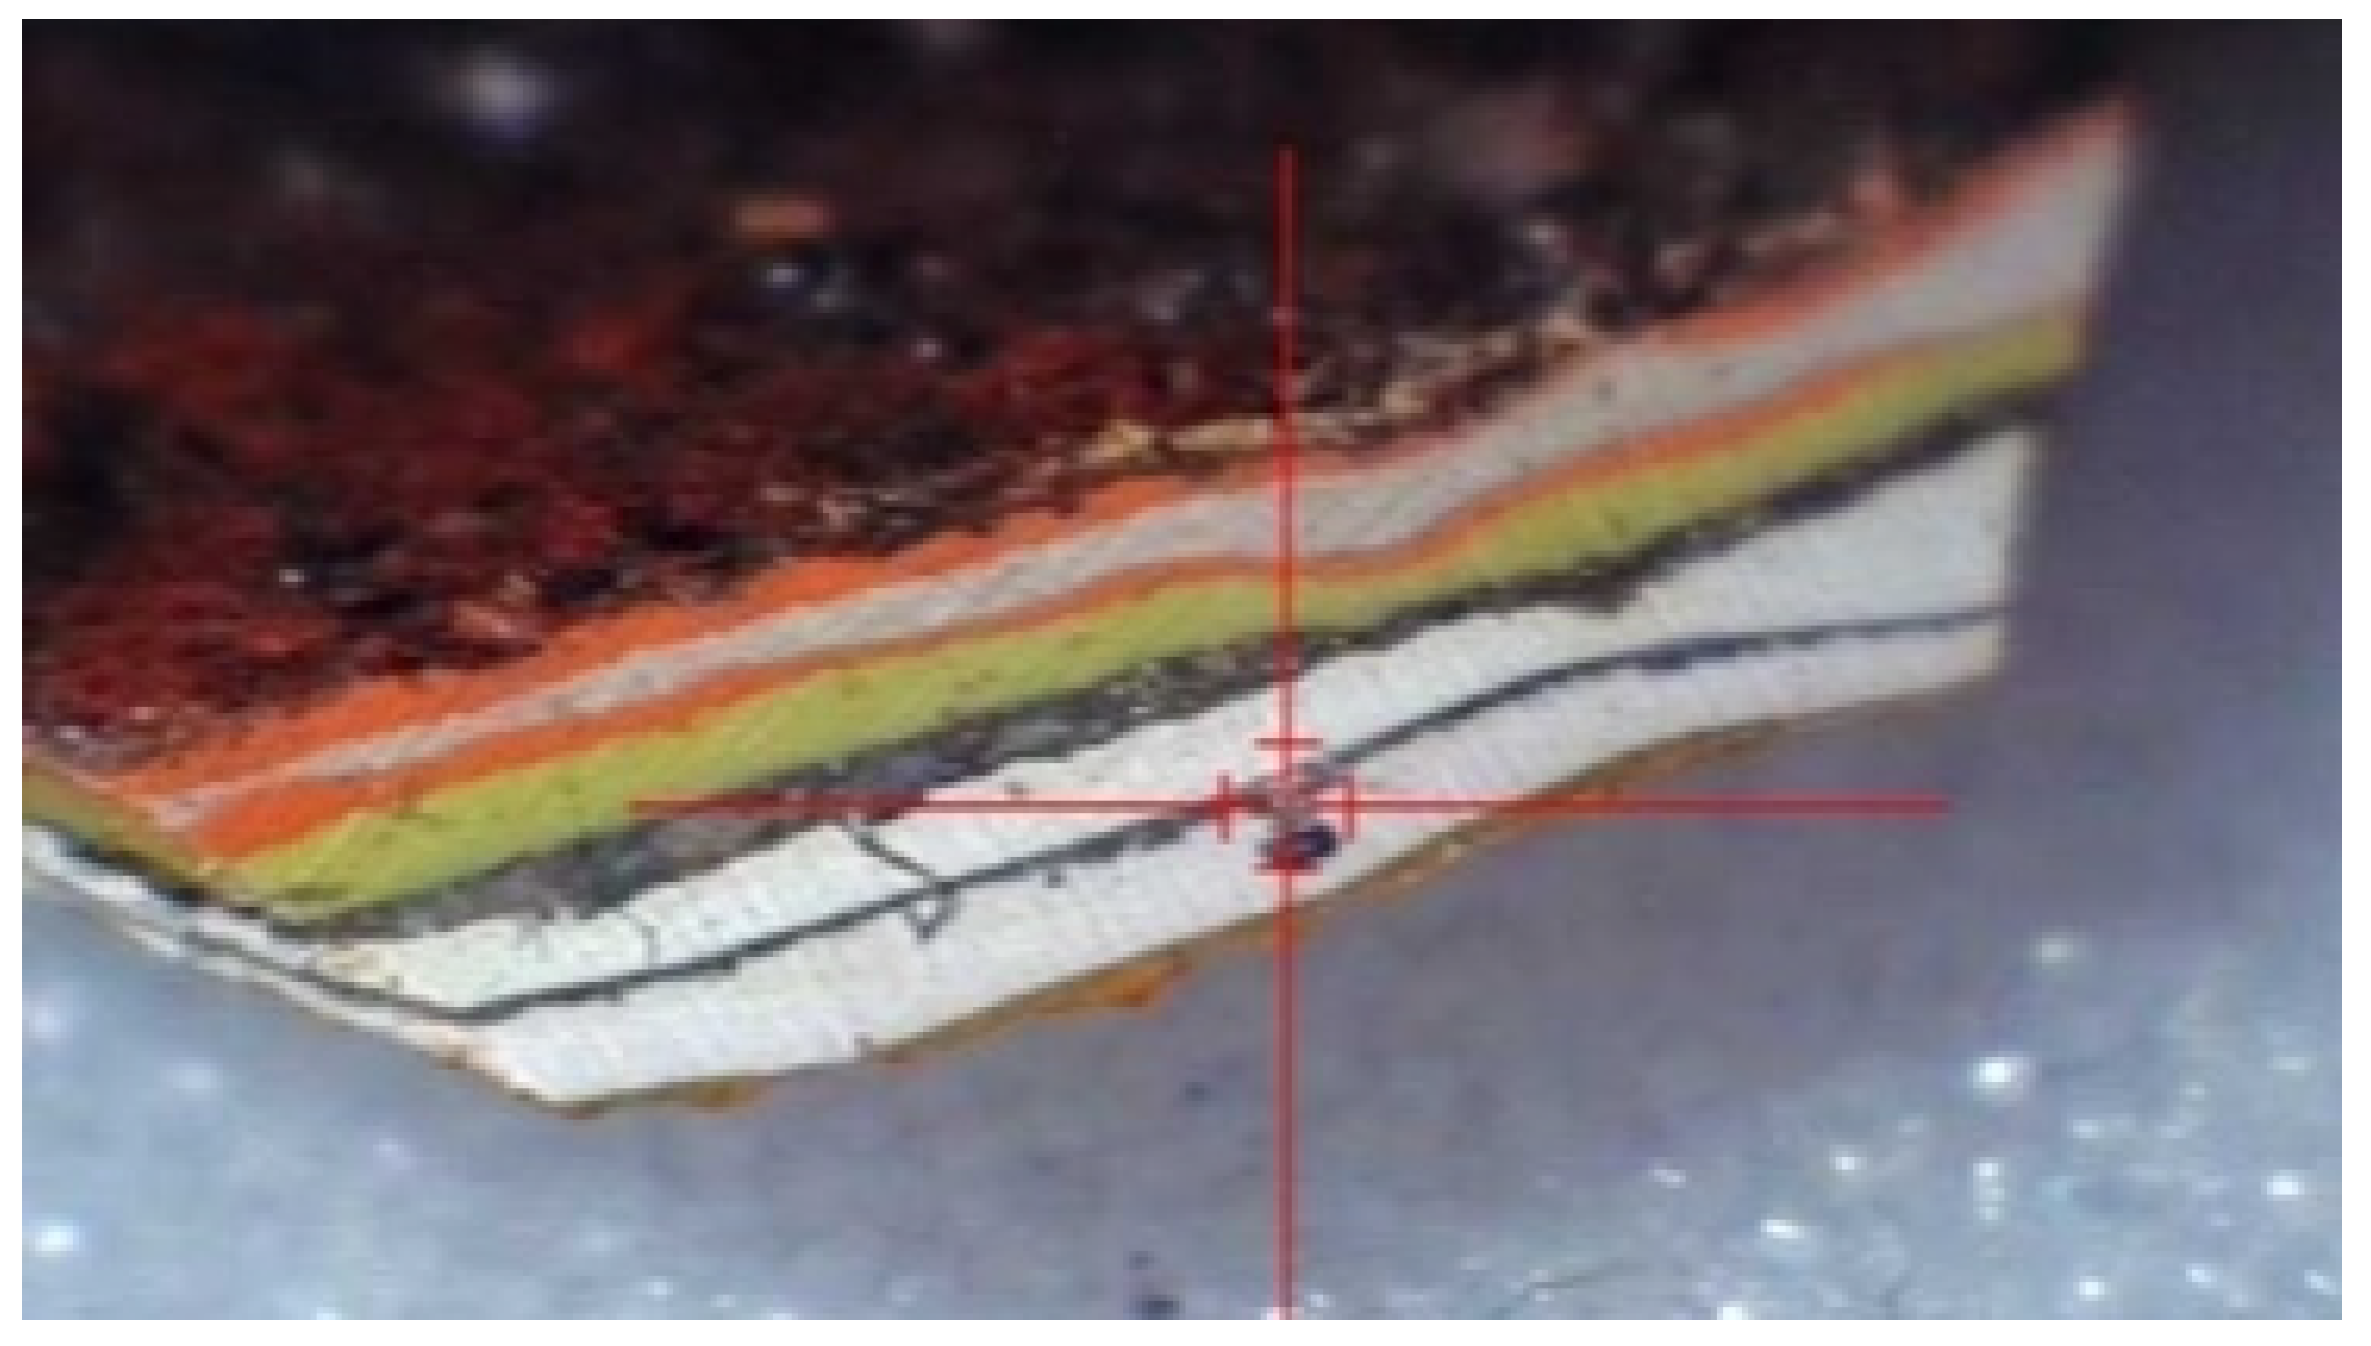
Two objects from the Victoria and Albert Museum collections are used to exemplify the different steps, where appropriate: a late-18th-century Chippendale table (accession number W.7-2019) [13] and an early 20th-century gilded statue of the Spirit of Gaiety (accession number S.2630-1986) [14,15,16]. The use and relevance of each step depend upon the question being asked. Table 1 summarises the features of each protocol step and the bearing of each technique.
  • Step 1—Sampling
Sampling is usually done on inconspicuous areas, preferably where there is an existing loss. The sampled area should be representative of the decorative scheme that is being investigated, and attention should be paid that the sample does not come from a non-original repair.
  • Step 2—Stereo microscopy
Samples are examined under a stereo microscope to reconcile their appearance with that which can be seen on the object before sampling and make a note of any layer structure and characteristics that can be discerned immediately. If the use of separation techniques (Step 8) is planned, then each sample needs to be split into two portions, one of which will be kept aside for separation techniques.
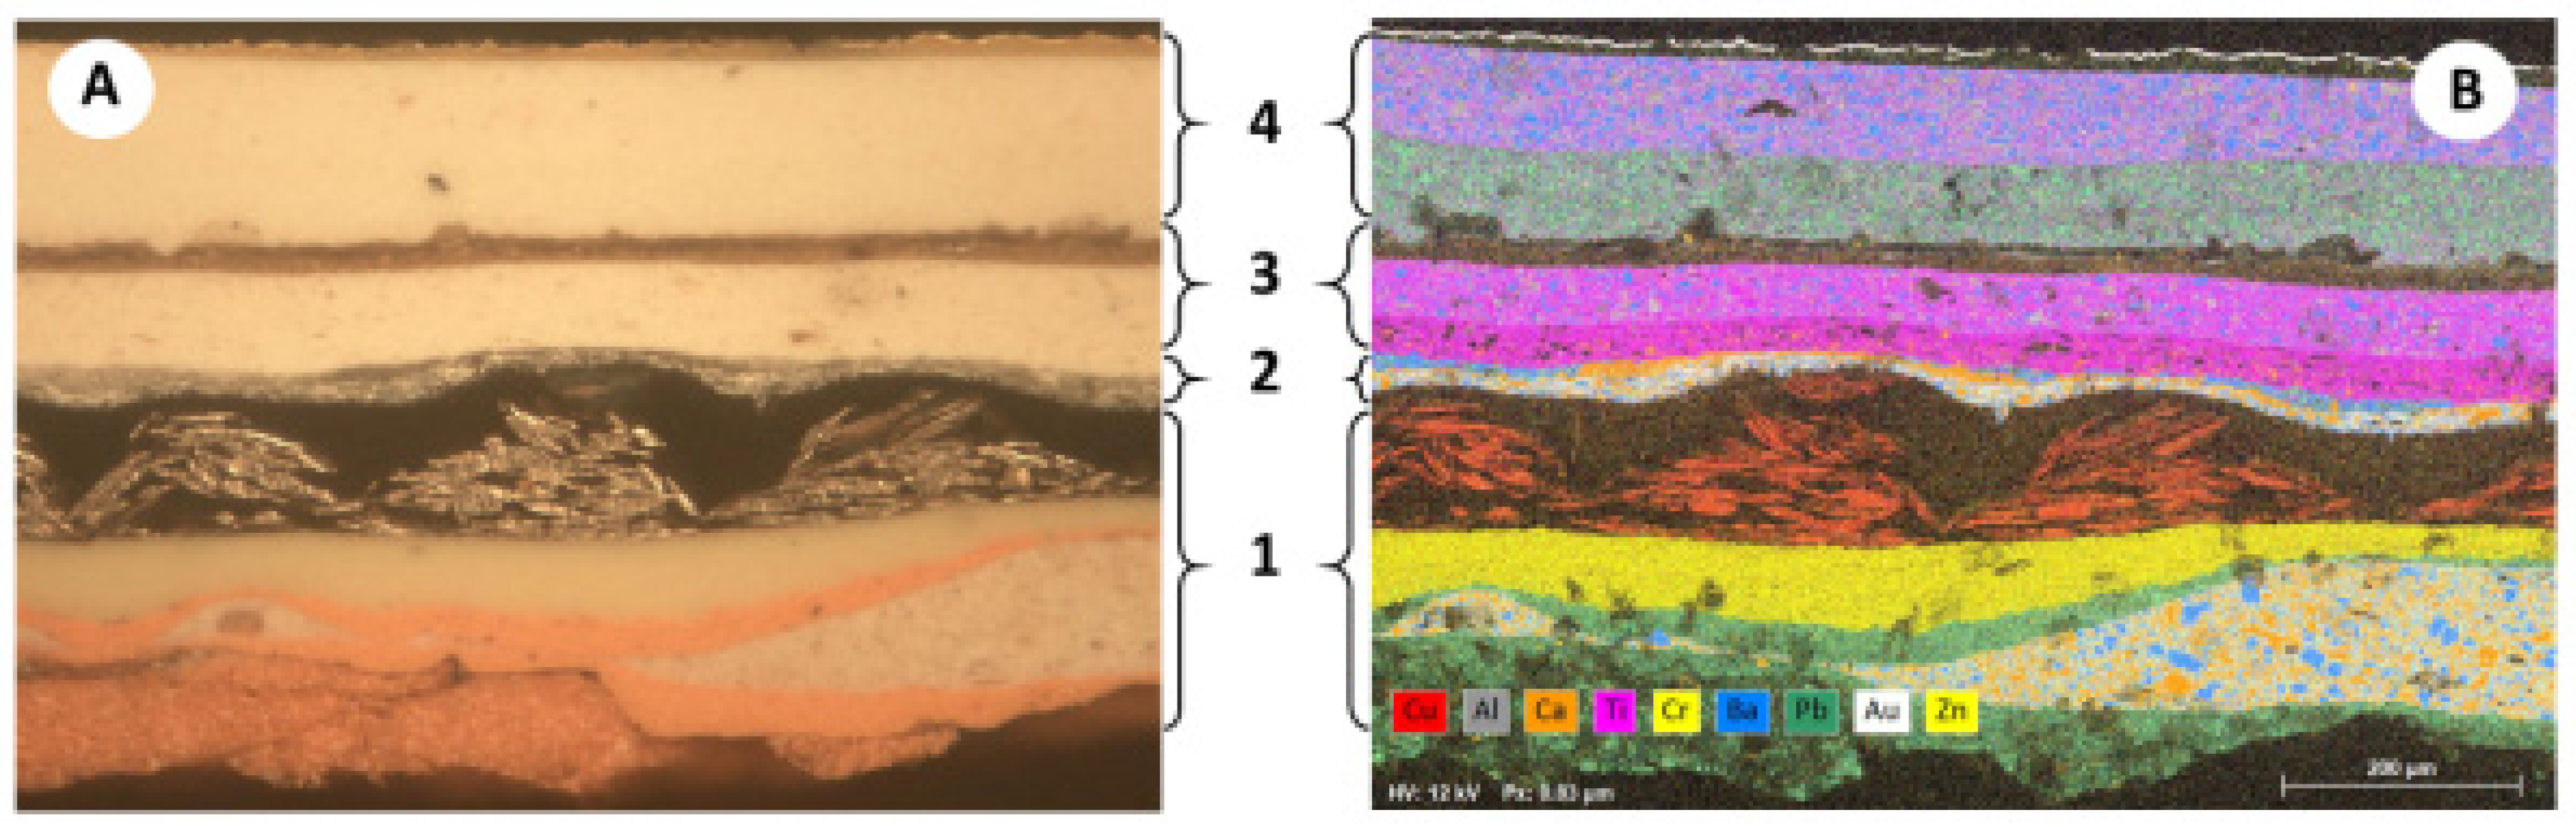
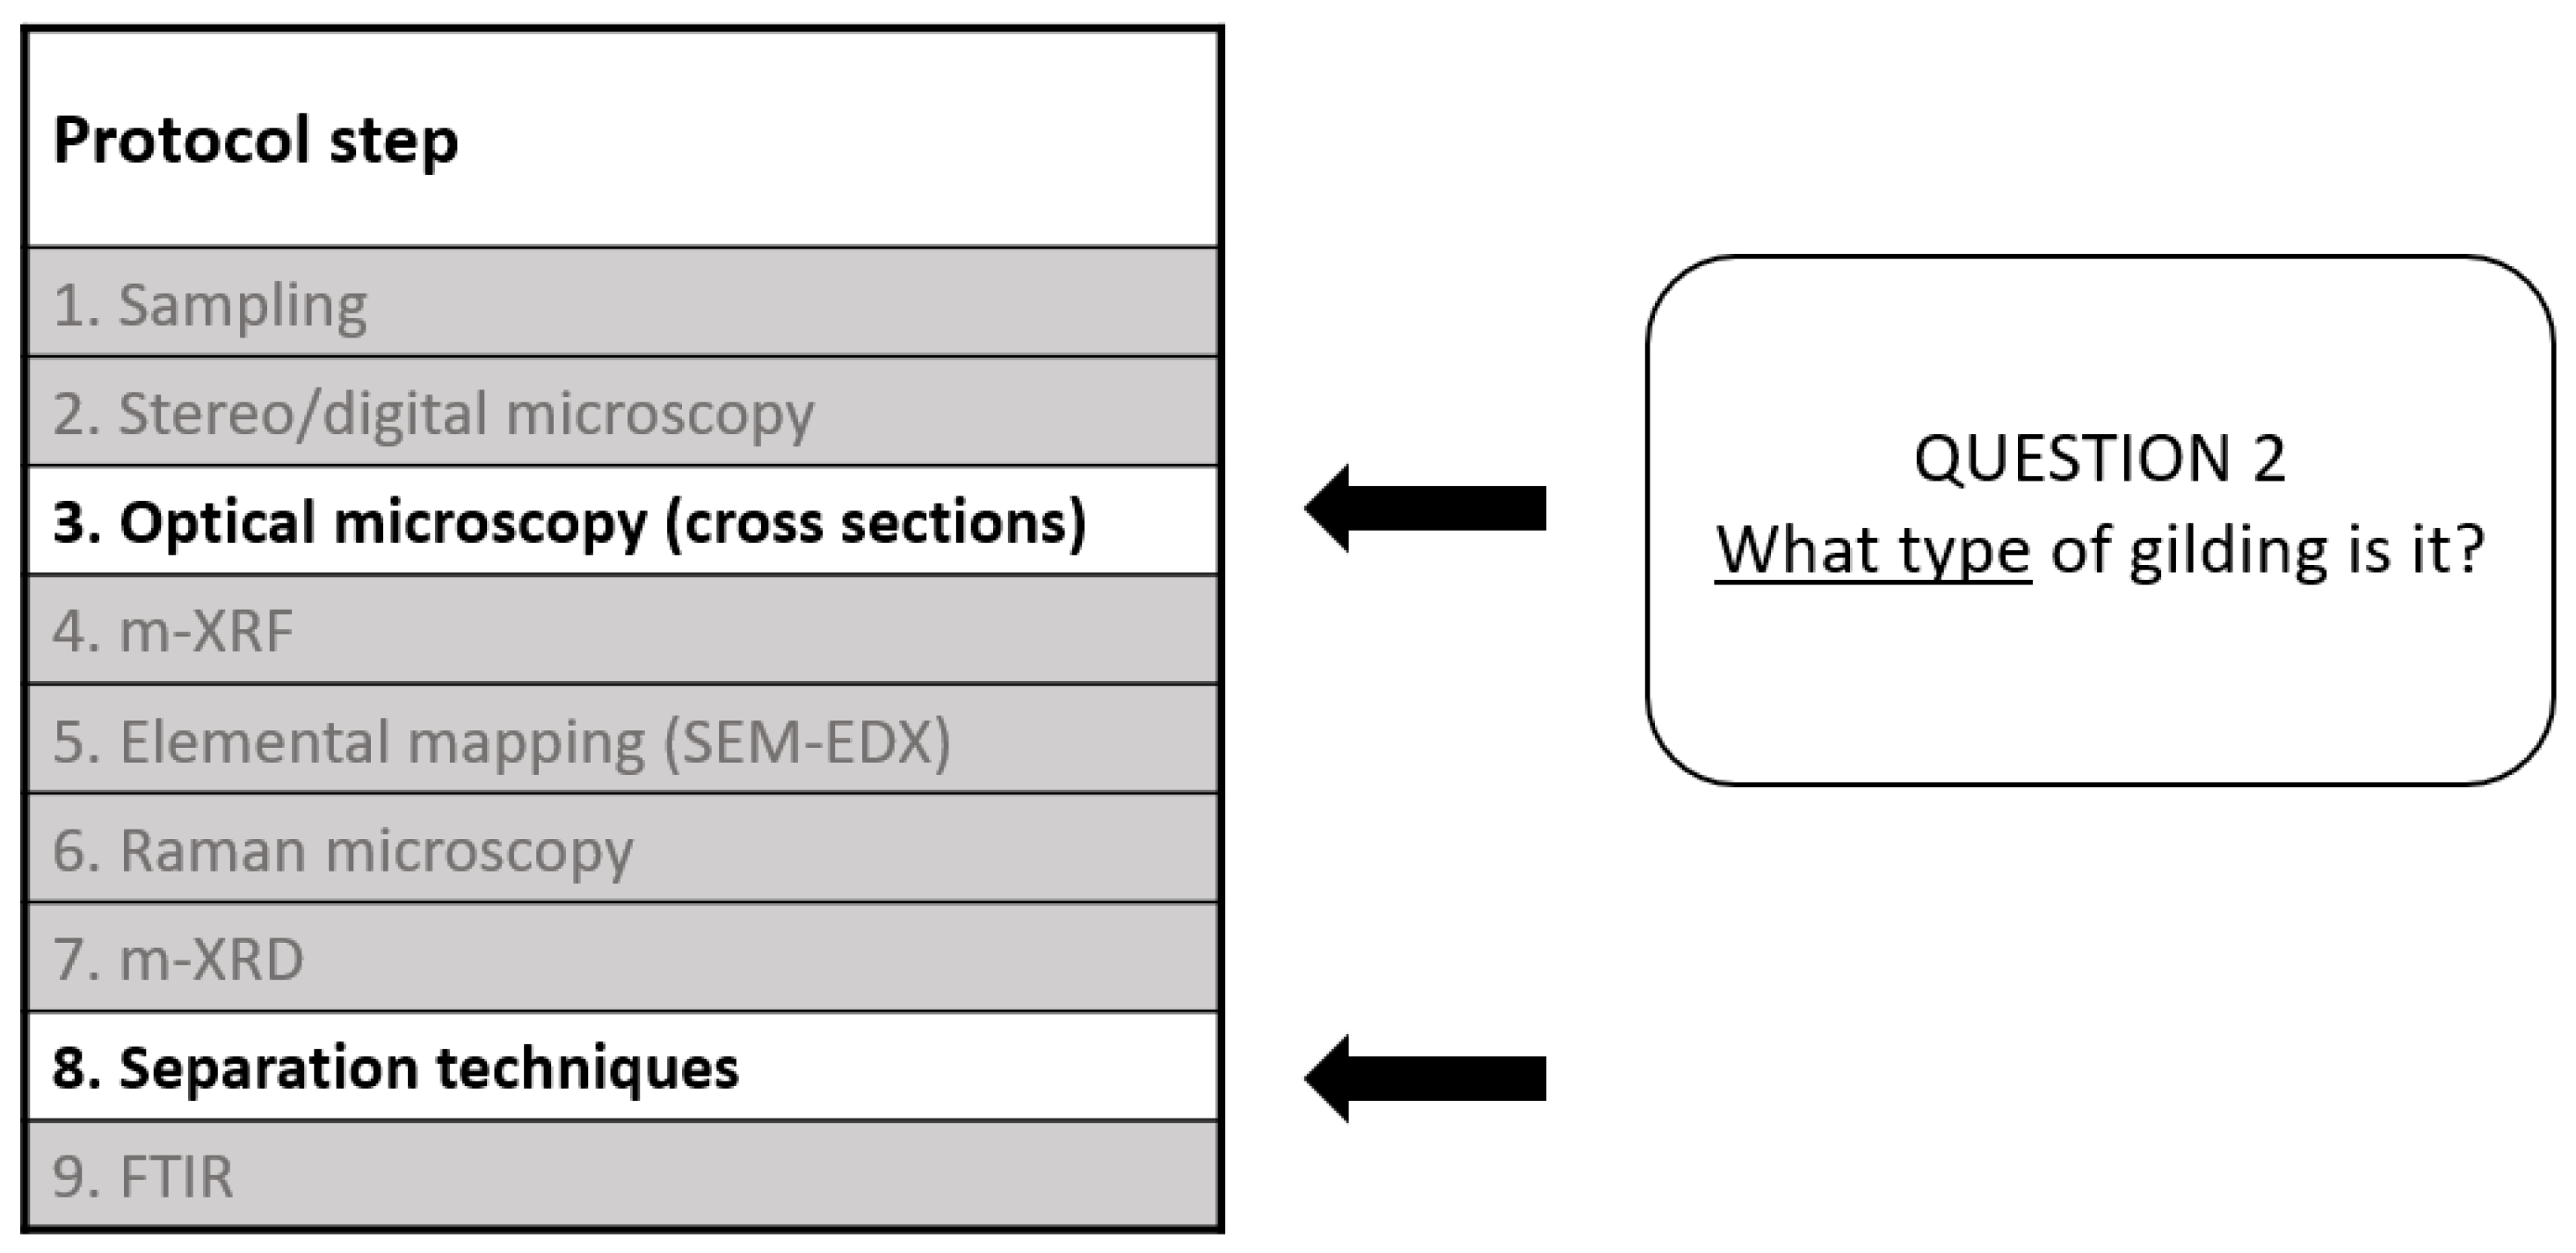
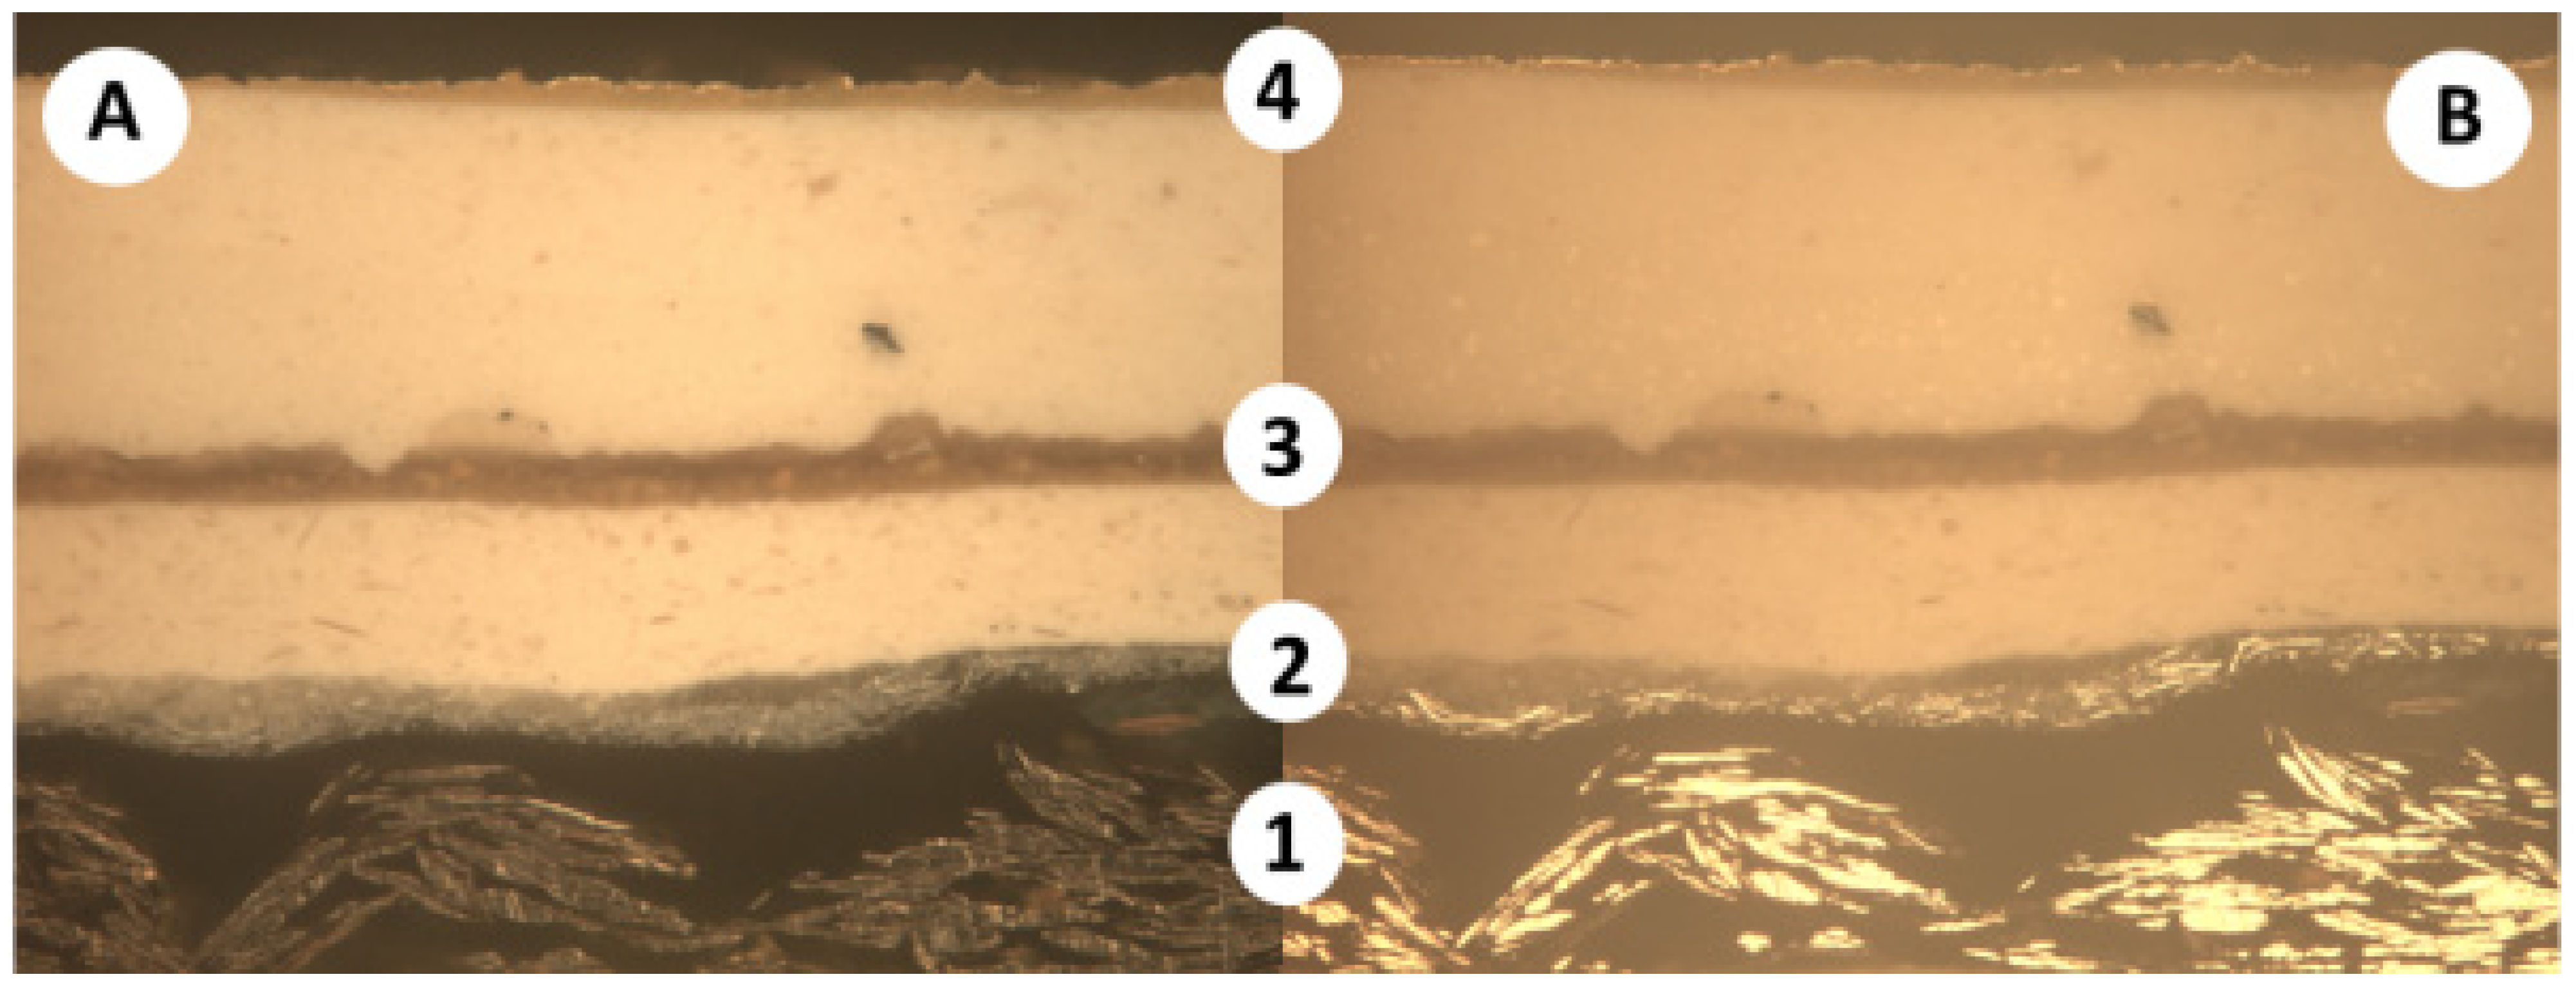
  • Step 3—Optical microscopy of cross-sections
Samples are embedded in resin and polished as cross-sections [12]. The examination of these under a polarised light microscope (with a visible light source) and under a UV microscope achieves multiple results:
  • It reveals the full layer structure;
  • It confirms, at a glance, how many gilding applications are present;
  • It shows if gold leaf or gold paint (‘shell gold’) or silver have been used, or if a cheaper imitation is present, such as tin, brass or bronze leaf, filings or paint;
  • It gives a good preliminary indication of whether water gilding, oil gilding, or both are present;
  • It provides information on the shape and size of particles in each layer
  • It allows for a preliminary estimate of the composition of many of the layers.
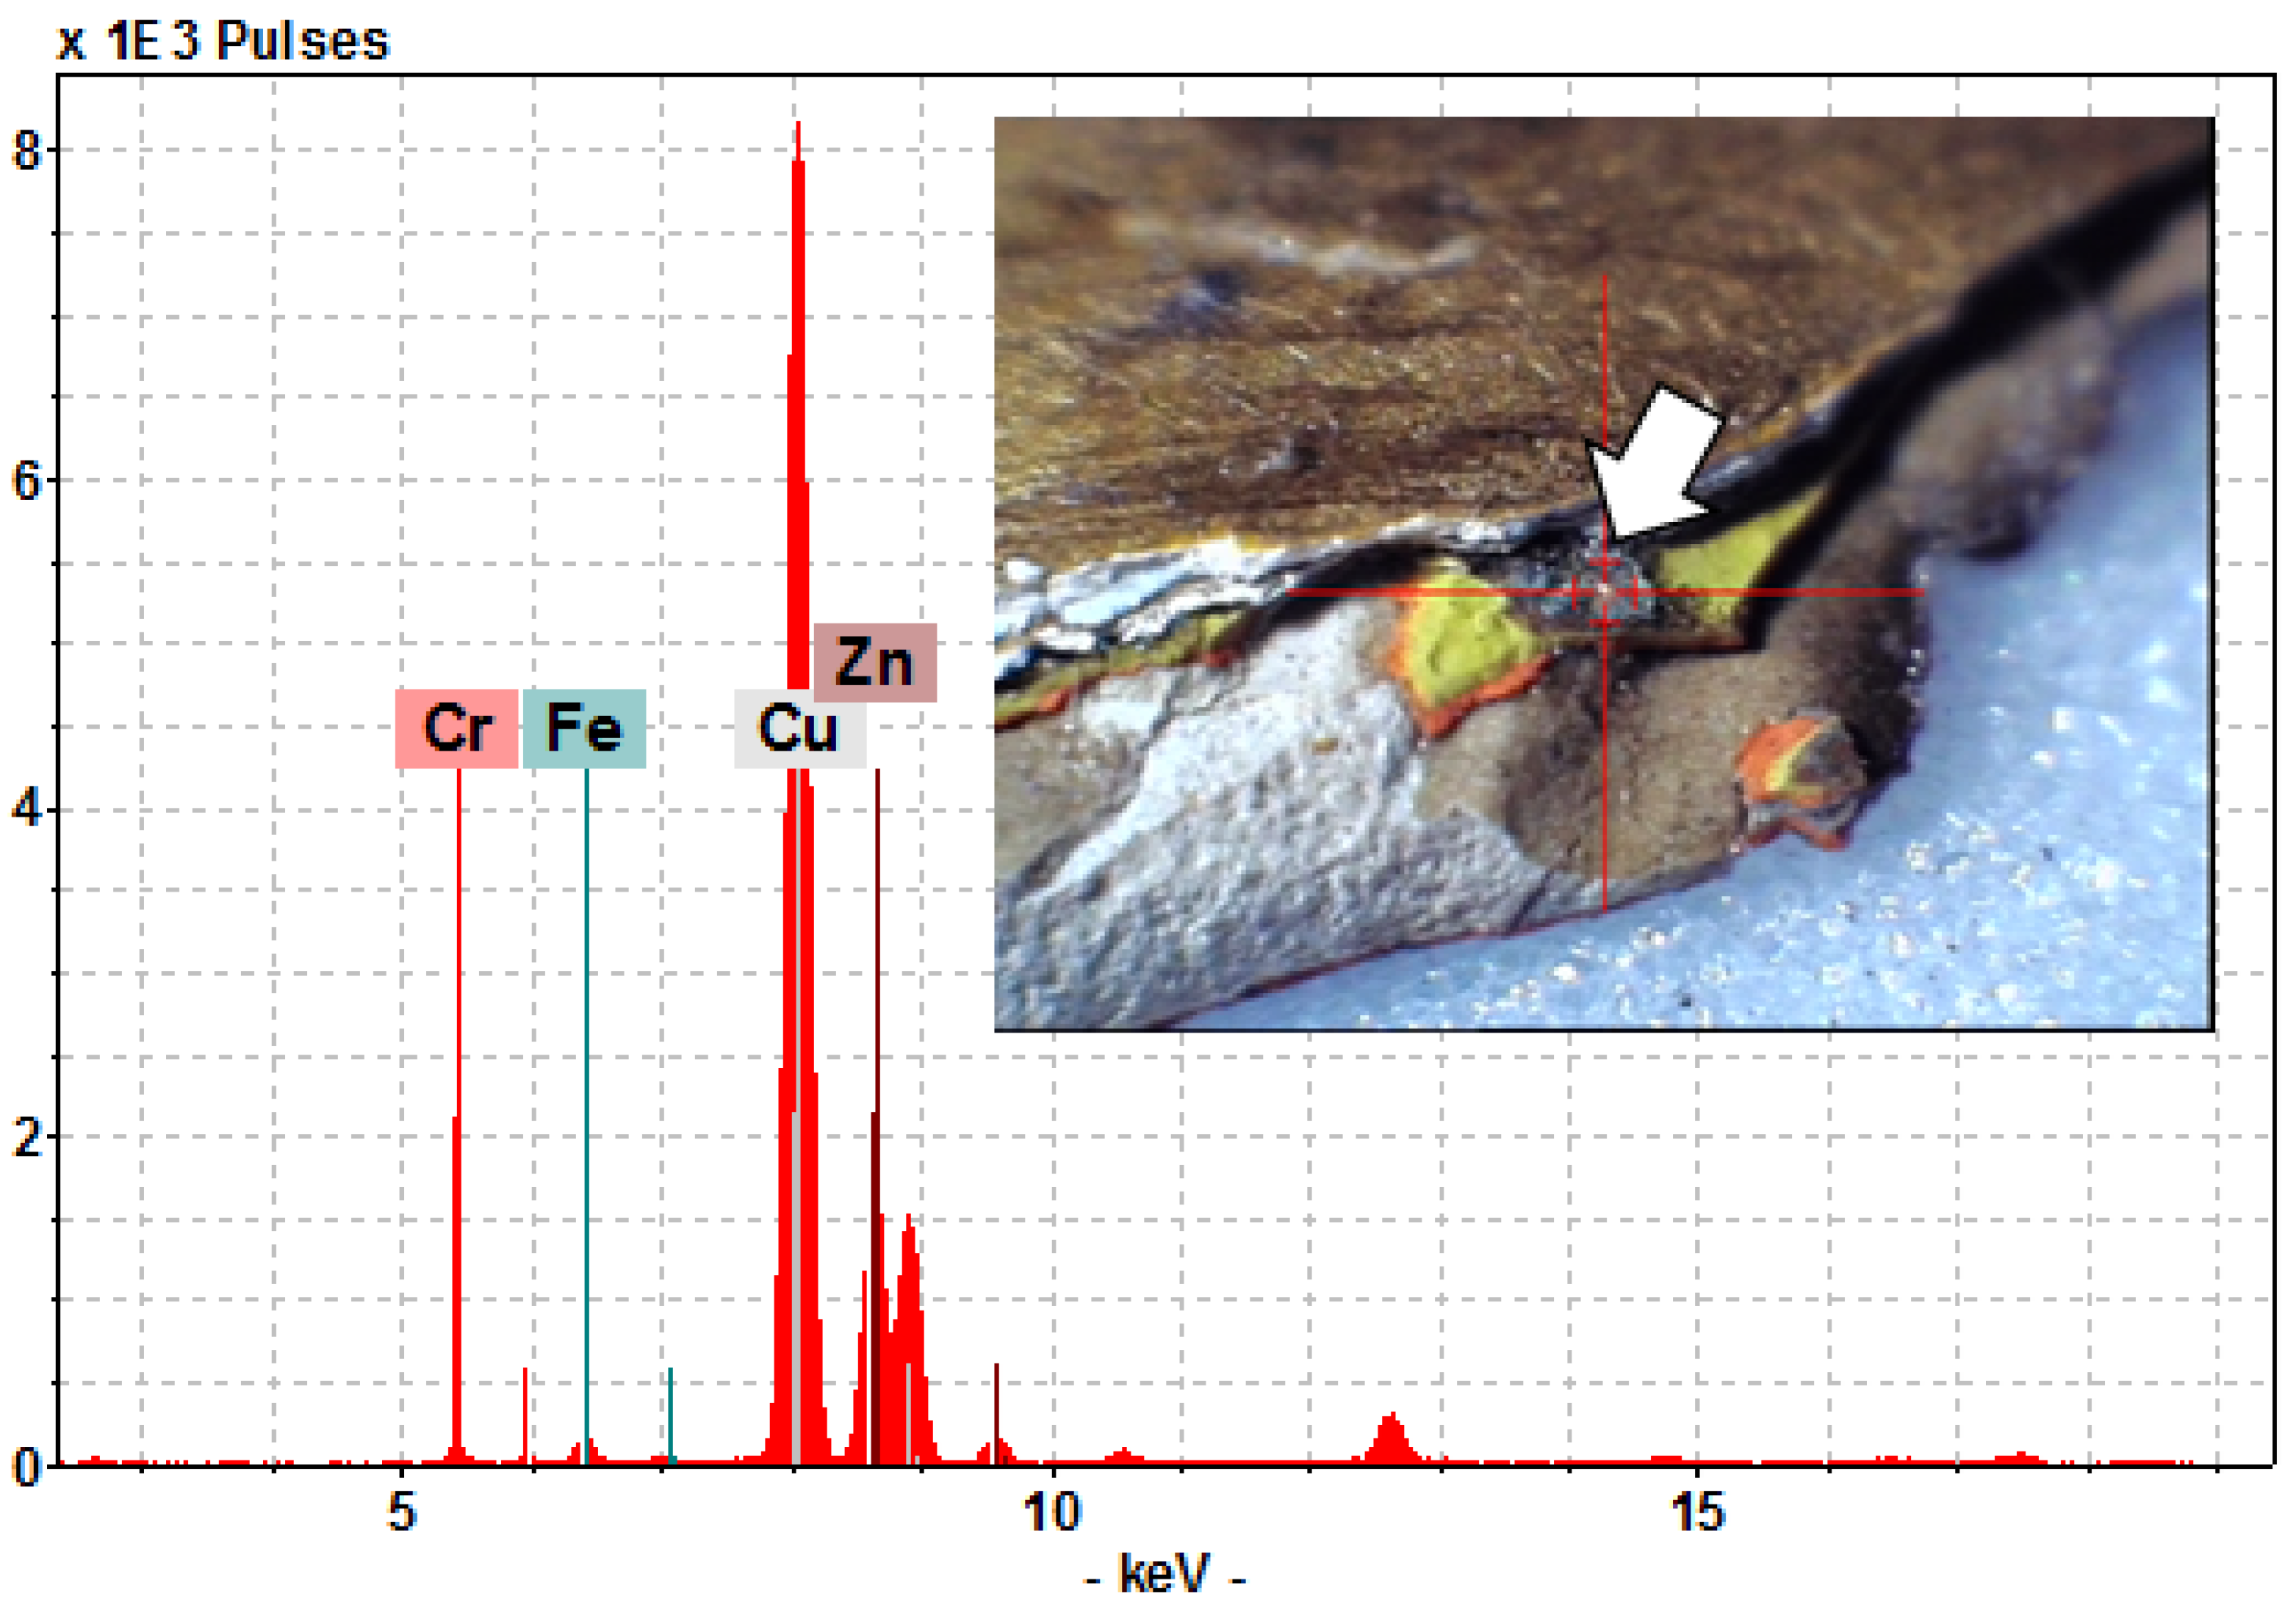
  • Step 4—Micro X-ray fluorescence (μXRF)
This technique provides spatially well-targeted information on the chemical elements present within a sample, with detection limits down to 100 ppm. The spot size of most μXRF instruments is relatively large (typically between 50 and 200 μm across) and usually encompasses multiple layers in a cross-section, homogenising the signal which may be obtained (Figure 1). This makes it impossible to obtain a clear indication of the elements present in each layer without interference from adjacent ones. However, by choosing carefully the area of a cross-section to analyse by μXRF, it is possible to deduce the composition of many gilding schemes (gold vs. brass or bronze), and infer if specific pigments or materials may be present (e.g., lead white, zinc white, vermilion, barium white, lithopone, titanium white, etc.), and in which layers.
This, in turn, can help with the dating of the gilding schemes (see Section 3) and can certainly provide useful information to be combined and compared with the results given by other techniques (for example, Raman and SEM–EDX) in later steps.
On occasions, μXRF can also be used just after Step 2 (stereo microscopy), if necessary, to answer any specific questions about unmounted samples. Figure 2A shows an unmounted sample from the Spirit of Gaiety where some of the layers (in this case a thick, yellow layer) are exposed and can be probed quickly and easily by μXRF without much interference from layers nearby.
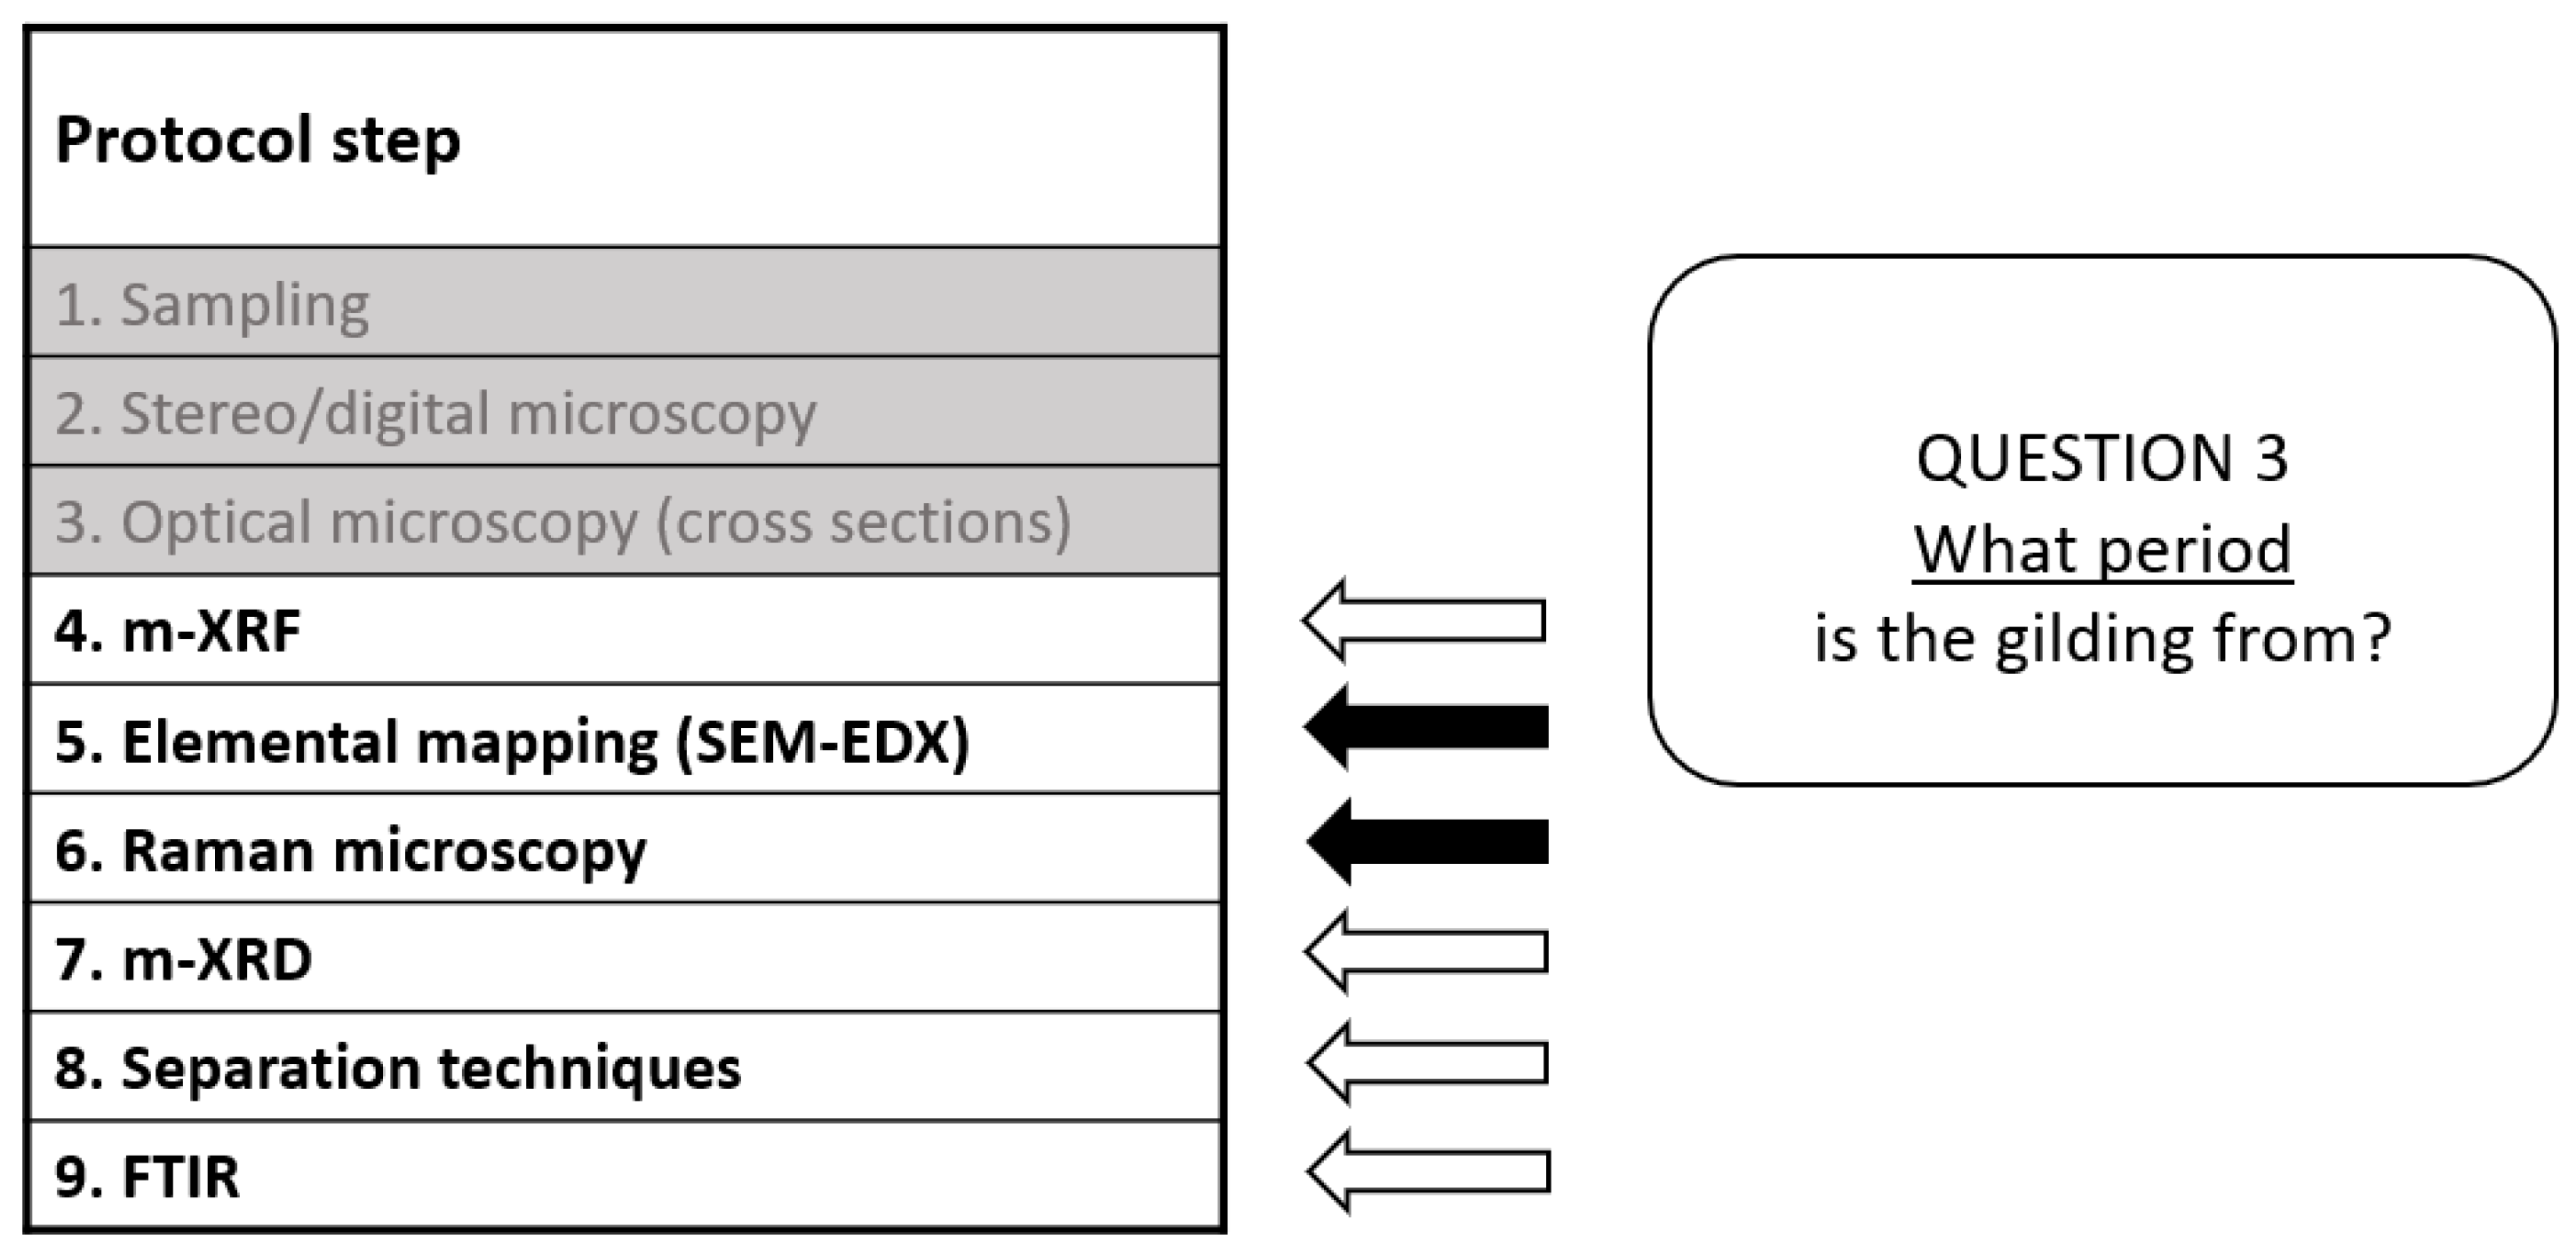
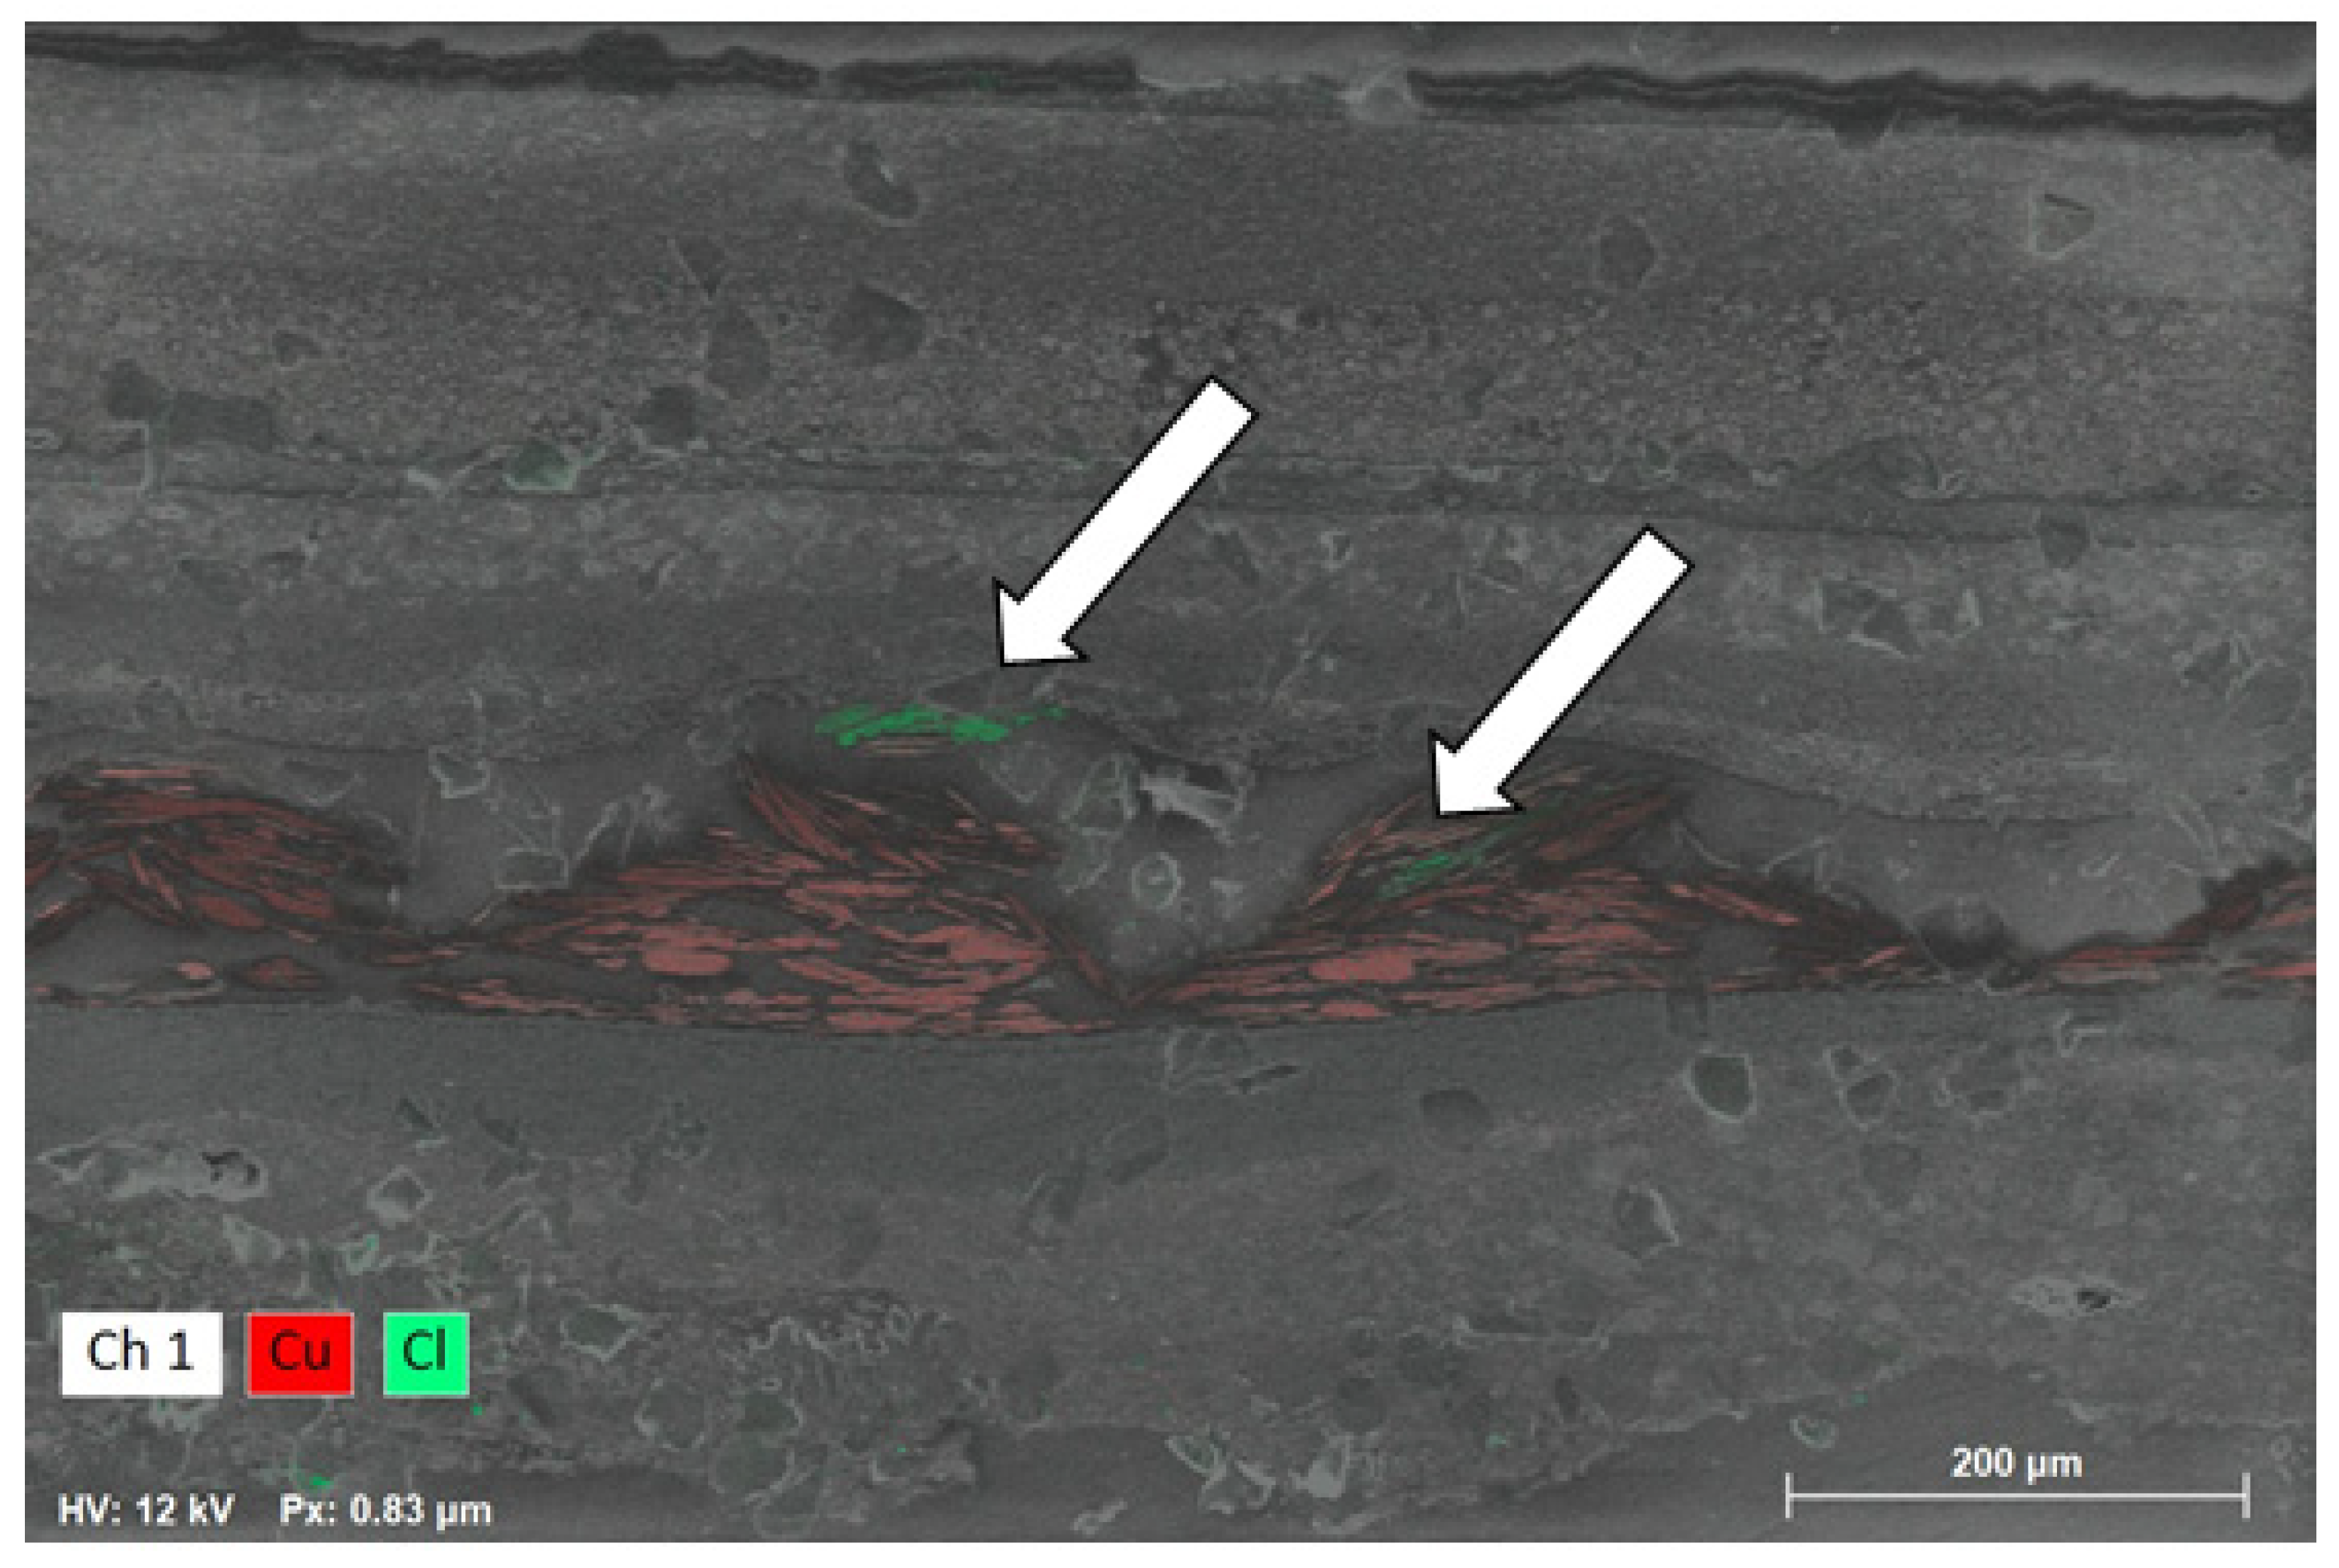
  • Step 5—Elemental mapping by scanning electron microscopy with energy-dispersive X-ray analysis (SEM–EDX)
By showing the distribution of chemical elements in each layer, SEM–EDX mapping can provide multiple results, similar and/or complementary to those obtained from Step 3 (optical microscopy):
  • It reveals most of the layer structure;
  • It confirms at a glance how many gilding applications are present;
  • It clearly identifies what type of metallic material (gold, gold imitation or silver) and morphology (leaf, filings, powder, etc.) are present in the gilding layers;
  • It shows if any of the older gilding layers are worn out, damaged or corroded;
  • It suggests what mixtures of pigments and artists’ materials may be present in each layer (with possible dating implications);
  • It provides sharp, high resolution information on the shape, distribution and size of particles in the layers.
While the mapping feature is the primary outcome of this step, individual particles or small areas can also be probed by EDX to find out more about their composition and answer specific questions. This provides a significant advantage over the use of micro-XRF (Step 4) alone, as it is possible to identify much smaller particles (<1 micron) that contribute to the overall composition of the layer. Whilst EDX mapping provides important data on the distribution of heavy elements (e.g., Pb, Hg and Au), one limitation of the technique is that it provides atomic (or elemental) not molecular information; therefore, it cannot characterise with absolute certainty the molecular composition of particles in layers.
Ideally, this step should be done on cross-sections as they are, without any additional treatment (e.g., sputter coating with carbon, usually done to prevent charging of the sample and to improve the signal-to-noise ratio). The use of uncoated materials is essential to ensure that the same surface is imaged and analysed at any given stage, and that any images and results obtained in this step are directly comparable to those obtained with other techniques: if a surface coating was applied, it would have to be polished off before any other analysis step, thereby exposing a fresh, not necessarily comparable surface, and possibly new materials.
To accommodate the use of uncoated, non-conductive materials, it is necessary to use an SEM equipped with either a variable pressure (VP-SEM) or environmental (ESEM) vacuum system. These systems permit the observation of the samples under low vacuum conditions, allowing electrons to conduct away from the surface and reduce charging. Ideally, relevant uncoated certified reference materials should be analysed semi-quantitatively along with each batch of samples to verify the accuracy of elemental identification.
  • Step 6—Raman microscopy
The molecular identity of individual particles within the cross-section can be revealed by Raman microscopy, a technique particularly suited for the characterisation of inorganic materials [17,18]. Some Raman microscopes can also perform Raman mapping and extend this type of identification to the whole cross-section rather than focusing on one particle at a time. The technique can be used for the following:
  • The molecular characterisation of individual particles;
  • The identification of corrosion or other degradation products.
  • Step 7—Micro X-ray diffraction (μXRD)
This step is only used in a limited number of cases, essentially only when confirmation of the identity of a crystalline or partially crystalline material within a layer is needed [19]. For example, to help confirm the identity of a newly observed pigment [20] or to help differentiate between zinc sulfide and zinc oxide in order to confirm the presence of lithopone. As it is not regularly employed for the protocol presented here, it is not discussed further.
  • Step 8—Separation techniques (chromatography)
This step involves chromatographic techniques, such as gas chromatography with mass spectrometry (GCMS) or high-performance liquid chromatography (HPLC), and is normally used only when the binding medium or an organic component in the layers (e.g., a natural dye) has to be identified unequivocally and without interference from bulkier components [4,21,22]. In this case, the second portion of a sample—kept aside after Step 2—needs to be unpacked first: each layer has to be peeled off and separated from the rest of the sample, so as to be analysed individually, without interference from organic components in other layers [23].
  • Step 9—Fourier-transform infrared microscopy
This step can be used to investigate the composition of individual, unpacked layers, but also the layers in a cross-section, and identify, at least in principle, both organic and inorganic components. It can also image the layers in a cross-section, according to their chemical composition. The specific type of infrared technique referred to here is called macro-attenuated total reflection Fourier transform infrared (ATR–FTIR) spectroscopic imaging [24,25]. This is not a technique that is routinely used at the V&A and is not discussed further.

2.2. Experimental Conditions

This is a list of the equipment used for the experiments presented here, involving the two V&A objects used as examples, but equivalent equipment can be used. Where necessary, additional recommendations are made, suggesting which type of experimental conditions and equipment should be sought for best results.
Casting and optical microscopy: Unmounted samples were examined with a Leica MZ75 stereomicroscope, cast in Tiranti polyester resin, polished on a Struers grinding wheel and viewed under a visible light Leica Aristomet microscope equipped with ×10, ×20 and ×40 objectives and a ×2.5 optical zoom. UV microscopy was performed on a Leitz Laborlux 12 ME microscope equipped with 365 nm and 470 nm CoolLED pE-100 light sources.
X-ray fluorescence: The μXRF analysis was performed by using a Bruker ArtTAX equipped with an air-cooled, low-power molybdenum tube and new-generation polycapillary X-ray optics. The experimental conditions were set at 50 kV, 600 mA and 100 s livetime. The area examined was approximately 200 μm across.
Scanning electron microscopy with energy-dispersive X-ray analysis (SEM–EDX): Two pieces of equipment were used. The first (at the Natural History Museum, London) was a Quanta 650 FEG SEM (FEI Company) equipped with a Bruker XFlash 5060F FlatQuad EDX detector under the following conditions: 15 kV, chamber pressure 20 Pa, map pixel size = 560 nm, count rate ~25 kcps and deadtime = 5%. Bruker ESPRIT software was used to collect EDS maps. The second (at the UCL Institute of Archaeology, UCL) was a Carl Zeiss EVO25 SEM equipped with an Oxford Instruments X-Max 80 EDX detector with the following conditions: 20 kV accelerating voltage, pixel size = 122 nm, the count rate was ~20 kcps on mapped material and deadtime was set to 40% on pure cobalt. Oxford Instruments Aztec 5.0 software was used to collect EDS maps. Samples analysed at the UCL Institute of Archaeology were coated with carbon prior to analysis using a Quorum K975x carbon coater.
Raman microscopy: Raman experiments were performed by using a Horiba XploRA equipped with two diode lasers (532 and 638 nm) and an Olympus microscope. Usually only the ×50 objective was used, providing an overall magnification of 500. The power at the sample was usually kept below 1 mW. Total accumulation times varied between 5 s and 2 min, and no spectral manipulations were used. The spectra obtained from the object were compared to reference spectra collected in-house and to those in published databases [26,27] and online resources [28,29]. A more detailed description of how to choose the best Raman experimental conditions has been published in the relevant Analytical Methods Committee Technical Brief on Raman spectroscopy in cultural heritage [17].

3. Results—The Protocol in Action

Whether or not all the steps are followed depends on the gilded object under investigation each time, as well as the specific questions raised about it. This section shows how the various scientific techniques described above can be used to answer the four more common questions about gilding in an object, as outlined in the introduction.

3.1. How Many Gilding Schemes Are There (i.e., How Many Times Has an Object Been Re-gilded)?

Figure 3 shows the main steps that can help to address this issue. During Steps 1 and 2, it is often possible to perform a preliminary inspection of the layer structure and visualise most if not all gilding schemes present on an object.
However, Steps 3 and 5 are the ones we rely on for a comprehensive assessment of the gilding schemes that still exist on the object. Step 3 (optical microscopy) shows, at a glance, how many layers are present: Figure 4A shows a cross-section taken from a gilded wooden sculpture [14,15], where four schemes are clearly visible. Step 5 (SEM–EDX mapping) also provides a clear, if different, image of the layer structure (Figure 4B).

3.2. What Type of Gilding Is It?

In many instances experienced conservators and curators are able to estimate at a glance whether water gilding or oil gilding is present. The protocol’s Step 3 (optical microscopy; Figure 5 and Figure 6) provides reliable clues in this sense: when looking at cross-sections, we usually rely on the colour of the layers in visible light, and their fluorescence under ultraviolet illumination.
Bearing in mind that exceptions can be found, layers containing gesso (calcium sulfate) and/or whiting (calcium carbonate) are invariably associated with water gilding. The latter normally involves the application of the gilding layer onto bole, the UV fluorescence of which is usually quite subdued. Bole is usually red or orange and tends to contain an iron-based pigment, such as hematite. Alternatively, vermilion (HgS, mercury(II) sulfide) can occasionally be found. Incidentally, vermilion is regularly seen, mixed with lacquer, in gilded oriental lacquer [30,31].
In contrast, oil gilding is often applied on a mordant, a sticky, oil-based layer which is usually translucent, and can have a caramel-like appearance. The mordant may or may not contain a pigment (usually yellow), and it is normally characterised by high fluorescence under UV light (see Figure 6).
When assessing whether water gilding or oil gilding is present, Step 8 (separation techniques) can provide more specific answers: by unpacking the layers and analysing them individually with chromatographic methods, a more accurate identification can be achieved, and more specific information about the binding medium of the base layer for the gilding can be obtained, especially when materials that are not traditionally found in Western artifacts (such as lacquer, lac dye or tung oil) are present [32].
Strictly speaking, Step 9 (FTIR) may be used as an alternative to Step 8 in order to investigate the composition of the layers in a cross-section and identify, at least in principle, both the binding medium and the inorganic components. In practice, the presence of a large amount of inorganic materials often swamps the signal from the binding medium, making this step problematic.

3.3. What Period Is Each Individual Gilding Scheme from?

Depending on the materials identified within the gilding structure, it is possible to suggest a terminus post quem for some of the layers, and hypothesise a date for some or all of the schemes seen in a sample. This is because some artists’ materials have a first date of manufacture which can be used as a reference point. With this in mind, the main steps that can be used are Steps 5 and 6 (SEM–EDX and Raman); however, Step 4 can be used to gather preliminary evidence (Figure 7).
The SEM–EDX elemental map for the Spirit of Gaiety sample (Figure 8) shows that titanium is present—in large amounts—only from the third gilding scheme onwards. Naturally occurring titanium oxide was never used as a white pigment in its own right, and synthetically produced titanium oxide was made commercially available only from the early 1920s [33,34,35]. This suggests that the third gilding scheme cannot have been applied before the early 1920s.
The same reasoning can be used when considering layers that contain chrome yellow, a synthetic pigment that was made available to artists only from the early 1800s [36]; or lithopone, a mixture of co-precipitated zinc sulfide and barium sulfate, available only from the second half of the 19th century [36] (p. 248).
Caution should always be used when making this type of dating hypothesis, and it is necessary to consider other factors before suggesting a date for a scheme: for example, titanium dioxide naturally occurs in white clay; therefore, individual titanium-rich particles may be present in layers applied before the 1920s simply because a clay mixture is present in a sample.
There are cases where no hypothesis can be made about the date of the gilding schemes, because the layers contain only materials that have been indiscriminately used for centuries. In the case of a pair of Chippendale tables, the presence of clay-, lead- and calcium-based white pigments (Figure 9) cannot help us in deciding whether the gilding schemes are from the 18th, the 19th or even the 20th century, because these materials could have been used at any point in time. Steps 7, 8 and 9, which are not routinely undertaken by the V&A for the analysis of gilding, can also provide additional evidence to help with the dating of the gilding schemes.
Steps 7, 8 and 9, which are not routinely undertaken by the V&A for the analysis of gilding, can also provide additional evidence to help with the dating of the gilding schemes.

3.4. What Is the Stratigraphy and Composition of the Layers within Each Gilding Scheme?

An overview of the steps that can be used to characterise the stratigraphy and composition of the layers is shown in Figure 10. Each gilding scheme is composed of multiple layers, which can include the actual metal finish, but also various types of preparation layers, such as priming layers, gesso/whiting layers, mordent and bole.
Each gilding scheme is composed of multiple layers, which can include the actual metal finish, but also various types of preparation layers, such as priming layers, gesso/whiting layers, mordent and bole.

3.4.1. Metal Finish

This is usually first assessed by optical microscopy in Step 3 (Figure 11A). When cross-sections are prepared, their analysis in dark field (Figure 11B) enhances the appearance of metallic layers and shows clearly the different morphology and colour of the metal components. This allows us to postulate what type of material was used each time; however, other steps need to be considered to confirm this.
For example, the earliest scheme in Figure 11 contains thick golden-coloured gilding made of relatively coarse filings. This suggests that a gold imitation paint is present that is made of bronze or brass filings/paint.
The second scheme is silvery in colour, made of shiny, thin, short filings. Silver paint (‘shell silver’) normally corrodes over time and becomes black. The bright appearance of the filings suggests that an untarnished silver imitation paint is present, which could be made of tin or aluminium. The second option is more likely because tin tends to corrode and darken over time. The third scheme is also silvery, but is made of very thin leaf, almost invisible even under the microscope. In this case no educated guess can be made with microscopy alone. Finally, the surface gilding is made of very thin leaf that is golden in colour. Its appearance and thinness suggest the presence of gold leaf.
Step 4 (μXRF) can provide a quick and easy way to obtain preliminary information about the possible composition of the layers, with the caveats mentioned in Section 2.1, step 4 (Figure 12).
Step 5 (SEM–EDX mapping) can resolve any residual questions about the composition of the metallic layers: one if its best features is the ability to show what metallic elements are present on the surface of the sample, and in what proportion. For example, where optical microscopy cannot effectively discriminate between bronze and brass paint because they are characterised by a similar appearance, SEM–EDX mapping clearly shows if tin or zinc or both are present.
This technique also has superior imaging capabilities and provides sharp, detailed and high-resolution images of the features of the sample. This is very useful when assessing the morphology of the particles (both metallic and non-metallic), the presence of corrosion products (Figure 13) and the preparation procedure of artists’ materials (precipitated vs. ground pigments, for example).

3.4.2. Preparation Layers

The composition of these layers can be first hypothesised with optical microscopy, μXRF and SEM–EDX mapping, in Steps 3, 4 and 5, respectively. However, Raman microscopy (Step 6) can provide unequivocal information about the molecular identity of most inorganic materials and, for this reason, is usually employed to probe individual particles in each layer (Figure 14). Incidentally, some Raman microscopes are equipped with mapping facilities, which can capture the distribution of specific materials within the layers and provide a more comprehensive picture of how different artists’ materials have been used. Steps 7, 8 and 9 can, in principle, add useful information about the composition of the layers.
Steps 7, 8 and 9 can, in principle, add useful information about the composition of the layers.

4. Conclusions

The scientific analysis of gilded surfaces takes on special relevance when it is combined with the knowledge and connoisseurship of both curators and conservators, who add their own expertise and specialist’s tools to the evaluation of gilded surfaces and provide context to the scientific analysis results. The actions of heritage and conservation scientists must always take place in parallel with curatorial studies of relevant sources and with the technical examination of any gilding stratigraphy made before and during any conservation treatment. In turn, scientific analyses can support the design of cleaning methods appropriate for each of the gilding layers.
With this in mind, the analysis protocol outlined here provides a step-by-step guide that addresses the most common questions about specific types of gilding in museum objects. Used within the correct context and on objects where the gilding is applied on a ‘soft’ substrate (such as wood, plaster, canvas, etc.), common analytical techniques, such as optical microscopy, X-ray fluorescence, scanning electron microscopy coupled with energy-dispersive X-ray analysis and Raman microscopy can help to answer a number of important questions about the history, manufacture and context of these objects. This includes providing clarity on how many gilding schemes are still present on an object, whether water gilding or oil gilding is present; they can suggest the date of individual gilding schemes or at least a terminus post quem; and finally they can reveal the composition and the distribution of artists’ materials within individual layers. The answers to these questions enrich our knowledge about the objects within our collections and provide a powerful tool to guide future conservation treatments.

Author Contributions

Conceptualization, L.B.; methodology, L.B.; investigation, L.B. and T.G.; writing—original draft preparation, L.B.; writing—review and editing, L.B. and T.G.; visualization, L.B. and T.G. Both authors have read and agreed to the published version of the manuscript.

Funding

This research received no external funding.

Data Availability Statement

Experimental data available from the authors on request.

Acknowledgments

The authors gratefully acknowledge Tomasz Goral, formerly at the Natural History Museum, London, for running the SEM–EDX experiment on a sample from the V&A Spirit of Gaiety; and Zoe Allen, Head of Furniture Conservation at the V&A for her helpful comments on the manuscript.

Conflicts of Interest

The authors declare no conflict of interest.

References

  1. Cleaning of Wooden Gilded Surfaces. Available online: https://www.getty.edu/conservation/publications_resources/pdf_publications/pdf/cleaning-wooden-gilded-surfaces.pdf (accessed on 25 July 2021).
  2. Powell, C.; Mallinson, F.; Allen, Z. Overview of the gilded objects treated for the British Galleries. V A Conserv. J. 2001, 39, 10–11. [Google Scholar]
  3. Allen, Z.; Wegwitz, L. The two make a pair: Differentiated treatment of a pair of gilded stools displayed in the furniture gallery at the V&A. In Conserving Context—Relating Object Treatment to Collections and Settings; Alabone, G., Ed.; Archetype Books: London, UK, 2015. [Google Scholar]
  4. Pinna, D.; Claudia Conti, C.; Mazurek, J. Polychrome sculptures of medieval Italian monuments: Study of the binding media and pigments. Microchem. J. 2020, 158, 105100. [Google Scholar] [CrossRef]
  5. Darque-Ceretti, E.; Felder, E.; Aucouturier, M. Foil and leaf gilding on cultural artifacts; forming and adhesion. Rev. Matér. 2011, 16, 540–559. [Google Scholar] [CrossRef]
  6. Osticioli, I.; Capozzoli, L.; Salvadori, B.; Banchelli, M.; Lavacchi, A.; Matteini, P.; Siano, S.; Gallo, L. The “oro di metà” Gilding in the Fifteenth-Century: A Multi-Analytical Investigation. Heritage 2019, 2, 1166–1175. [Google Scholar] [CrossRef] [Green Version]
  7. Crina Anca Sandu, I.; de Sá, M.H.; Pereira, M.C. Ancient ‘gilded’ art objects from European cultural heritage: A review on different scales of characterization. Surf. Interface Anal. 2011, 43, 1134–1151. [Google Scholar] [CrossRef]
  8. Gard, F.S.; Daizo, M.B.; Santos, D.M.; Halac, E.B.; Freire, E.; Reinoso, M.; Montero, R.J. Application of surface science techniques to study a gilded Egyptian funerary mask: A multi-analytical approach. Surf. Interface Anal. 2019, 51, 1001–1017. [Google Scholar] [CrossRef]
  9. Chao, R.; Heginbotham, A.; Lee, L.; Chiari, G. Materials and techniques of gilding on a suite of French eighteenth-century chairs. Stud. Conserv. 2014, 59, 102–112. [Google Scholar] [CrossRef]
  10. Gilding. Available online: https://www.rct.uk/collection/conservation/gilding (accessed on 25 July 2021).
  11. How Was It Made? Water Gilding. Available online: http://www.vam.ac.uk/content/videos/w/video-water-gilding/ (accessed on 25 July 2021).
  12. Plesters, J. Cross-sections and Chemical Analysis of Paint Samples. Stud. Conserv. 1956, 2, 110–157. [Google Scholar] [CrossRef]
  13. Burgio, L. V&A Internal Analysis Report 20-16-LB; V&A: London, UK, 2020. [Google Scholar]
  14. Burgio, L. V&A Internal Analysis Report 17-04-LB; V&A: London, UK, 2017. [Google Scholar]
  15. Burgio, L. “Under the Skin of the Spirit of Gaiety”, Part 1 to Part 5. Available online: https://www.vam.ac.uk/blog/author/lucia-burgio (accessed on 25 July 2021).
  16. Offord, S. “The Guardian Angel of Theatreland: A History of the Spirit of Gaiety”. Available online: https://www.vam.ac.uk/blog/news/the-guardian-angel-of-theatreland-a-history-of-the-spirit-of-gaiety (accessed on 28 July 2021).
  17. Analytical Methods Committee. Raman spectroscopy in cultural heritage: Background paper. Anal. Methods 2015, 7, 4844–4847. [Google Scholar] [CrossRef]
  18. Clark, R.J.H. Pigment identification by spectroscopic means: An arts/science interface. Comptes Rendus Chim. 2002, 5, 7. [Google Scholar] [CrossRef]
  19. Franquelo, M.L.; Duran, A.; Castaing, J.; Arquillo, D.; Perez-Rodriguez, J.J. XRF, μ-XRD and μ-spectroscopic techniques for revealing the composition and structure of paint layers on polychrome sculptures after multiple restorations. Talanta 2012, 89, 462–469. [Google Scholar] [CrossRef]
  20. Burgio, L.; Melchar, D.; Strekopytov, S.; Peggie, D.A.; Di Crescenzo, M.M.; Keneghan, B.; Clark, B.L. Identification, characterisation and mapping of calomel as ‘mercury white’, a previously undocumented pigment from South America, and its use on a barniz de Pasto cabinet at the Victoria and Albert Museum. Microchem. J. 2018, 143, 220–227. [Google Scholar] [CrossRef]
  21. Zhou, Z.; Shen, L.; Wang, N.; Ren, X.; Yang, J.; Shi, Y.; Zhang, H. Identification of Organic Materials Used in Gilding Technique in Wall Paintings of Kizil Grottoes. ChemistrySelect 2020, 5, 818–822. [Google Scholar] [CrossRef]
  22. Bonaduce, I.; Colombini, M.P.; Diring, S. Identification of garlic in old gildings by gas chromatography—Mass spectrometry. J. Chromatog. A 2006, 1107, 226–232. [Google Scholar] [CrossRef]
  23. Schilling, M.R.; Heginbotham, A.; van Keulen, H.; Szelewski, M. Beyond the basics: A systematic approach for comprehensive analysis of organic materials in Asian lacquers. Stud. Conserv. 2016, 61, 3–27. [Google Scholar] [CrossRef] [Green Version]
  24. Spring, M.; Ricci, C.; Peggie, D.A.; Kazarian, S.G. ATR-FTIR imaging for the analysis of organic materials in paint cross sections: Case studies on paint samples from the National Gallery, London. Anal. Bioanal. Chem. 2008, 392, 37–45. [Google Scholar] [CrossRef]
  25. Joseph, E.; Ricci, C.; Kazarian, S.G.; Mazzeo, R.; Prati, S.; Ioele, M. Macro-ATR-FT-IR spectroscopic imaging analysis of paint cross-sections. Vib. Spectrosc. 2010, 53, 274–278. [Google Scholar] [CrossRef]
  26. Bell, I.M.; Gibbs, P.J.; Clark, R.J.H. Raman spectroscopy library of natural and synthetic pigments (pre- ~1850AD). Spectrochim. Acta A 1997, 53, 2159–2179. [Google Scholar] [CrossRef]
  27. Burgio, L.; Clark, R.J.H. Library of FT-Raman spectra of pigments, minerals, pigment media and varnishes, and supplement to existing library of Raman spectra of pigments with visible excitation. Spectrochim. Acta A 2001, 57, 1491–1521. [Google Scholar] [CrossRef]
  28. RRUFF Database. Available online: http://rruff.info/ (accessed on 1 August 2020).
  29. IRUG, Infrared and Raman Users Group. Available online: http://www.irug.org/ (accessed on 1 June 2021).
  30. Risdonne, V.; Burgio, L.; Schilling, M.R.; Khanjian, H. Investigation of Burmese lacquer methods: Technical examination of the V&A Burmese shrine. J. Cult. Herit. 2018, 30, 16–25. [Google Scholar] [CrossRef]
  31. Risdonne, V.; Burgio, L.; Schilling, M.; Khanjian, H. Scientific Analysis of the V&A Burmese Shrine. Arts Asia 2017, 47, 56–62. [Google Scholar]
  32. Zhou, Z.; Shen, L.; Li, C.; Wang, N.; Chen, X.; Yang, J.; Zhang, H. Investigation of gilding materials and techniques in wall paintings of Kizil Grottoes. Microchem. J. 2020, 154, 104548. [Google Scholar] [CrossRef]
  33. Laver, M. Titanium Dioxide Whites. In Artists’ Pigments; West FitzHugh, E., Ed.; Oxford University Press: Oxford, UK, 1997; Volume 3, pp. 295–356. [Google Scholar]
  34. CAMEO Materials Database, Titanium White. Available online: http://cameo.mfa.org/wiki/Titanium_white (accessed on 3 August 2020).
  35. Eastaugh, N.; Walsh, V.; Chaplin, T.; Siddall, R. Pigment Compendium: A Dictionary of Historical Pigments; Routledge: Abingdon, UK, 2008; p. 320. [Google Scholar]
  36. Kühn, H.; Curran, M. Chrome yellow and other chromate pigments. In Artists’ Pigments; A Handbook of Their History and Characteristics; Feller, R.L., Ed.; Oxford University Press: Oxford, UK, 1986; Volume 1, pp. 187–217. [Google Scholar]
Figure 1. Cross-section viewed under the μXRF camera. The square at the centre of the cross hairs marks the approximate area targeted by the μXRF (~200 μm), encompassing more than one layer at a time.
Heritage 04 00136 g001
Figure 2. μXRF analysis of an exposed yellow layer in an unmounted sample (A): the presence of large amounts of zinc and chromium (B) suggests that the pigment zinc yellow is present.
Heritage 04 00136 g002
Figure 3. Steps that can help to address Question 1. White arrows mark the steps that can be used for a preliminary assessment, black arrows are for the steps that can provide a comprehensive assessment of the number of the gilding schemes.
Heritage 04 00136 g003
Figure 4. (A) Optical microscopy image of a cross-section with marked gilding schemes and (B) SEM–EDX mapping showing the elemental distribution within each layer.
Heritage 04 00136 g004
Figure 5. Steps that can help to address Question 2: what type of gilding is present?
Heritage 04 00136 g005
Figure 6. Sample from a Chippendale table (V&A W.7-2019) viewed under visible (A) and UV (B) illumination, showing three layers of gilding. The first and second gilding schemes are water gilding; the most recent one is oil gilding.
Heritage 04 00136 g006
Figure 7. The steps that can help to address Question 3. Black arrows mark the main steps to be used, white arrows mark the steps that can provide preliminary evidence (m-XRF) or are not routinely used.
Heritage 04 00136 g007
Figure 8. (A) SEM–EDX elemental maps of a sample from the Spirit of Gaiety. Each element is colour coded, capturing at a glance the distribution of different materials within the object; (B) only the two most recent schemes contain titanium (pink layers, highlighted on the right).
Heritage 04 00136 g008
Figure 9. (A) SEM–EDX elemental maps of a sample from a Chippendale table. Each element is colour coded, capturing at a glance the distribution of different materials within the object; (B) backscattered electron image or the mapped area, with heavier elements appearing relatively higher contrast than lighter elements.
Heritage 04 00136 g009
Figure 10. Steps that can help to address Question 4. Black arrows mark the most useful steps; white arrows mark the steps that can be used for a preliminary assessment or to gather additional information about the composition.
Heritage 04 00136 g010
Figure 11. (A) Cross-section from the Spirit of Gaiety, viewed under bright field conditions, showing four gilding schemes; (B) detail of the same cross-section viewed under dark field conditions, which enhances the contrast between preparation/paint layers and metallic finishes.
Heritage 04 00136 g011
Figure 12. μXRF analysis of the exposed earliest gilding layer—part of gilding scheme 1—in a loose sample (inset): the presence of large amounts of copper and zinc indicates that brass paint was used.
Heritage 04 00136 g012
Figure 13. SEM–EDX map of copper and chlorine in a sample from the Spirit of Gaiety. The arrows mark the areas with the highest concentration of chlorine corrosion (in green) of the original copper alloy gilding (in red).
Heritage 04 00136 g013
Figure 14. Raman microscopy identification of artists’ materials in a cross-section from the Spirit of Gaiety: map of individual particles analysed (A) and resulting Raman spectra (B).
Heritage 04 00136 g014
Table 1. Synopsis of the main characteristics of the techniques in the protocol steps. Please note that brackets (✓) indicate a technique that can offer only a possible or partial answer.
Steps
23456789
Stereo MicroscopyOptical MicroscopyμXRFSEM–EDX MappingRaman MicroscopyμXRDSeparation TechniquesFTIR
Gilding:
Number of schemes
(✓)
Gilding:
Metal composition
(✓)(✓)
Gilding:
Metal morphology
(✓)
Gilding:
Oil vs. water
Gilding:
Corrosion products
(✓)(✓) *
Layers:
Full stratigraphy
(✓)
Layers:
Atomic composition
(✓)
Layers:
Molecular composition
(✓) ✓ *(✓)(✓)
Layers:
Morphology of components
(✓)
Layers:
Binding medium
Layers:
Organic components
* Only if crystalline or semi-crystalline materials are present.
Publisher’s Note: MDPI stays neutral with regard to jurisdictional claims in published maps and institutional affiliations.

