Article

A Multilevel Procedure at Urban Scale to Assess the Vulnerability and the Exposure of Residential Masonry Buildings: The Case Study of Pordenone, Northeast Italy

1
Department of Geosciences, University of Padova, 35131 Padova, Italy
2
Earthquake Engineering Research and Test Center, Guangzhou University, Guangzhou 510405, China
3
Department of Cultural Heritage, University of Padova, 35139 Padova, Italy
*
Author to whom correspondence should be addressed.
Heritage 2020, 3(4), 1433-1468; https://doi.org/10.3390/heritage3040080
Submission received: 5 November 2020 / Revised: 23 November 2020 / Accepted: 25 November 2020 / Published: 28 November 2020
(This article belongs to the Special Issue Assessment and Protection of Cultural Heritage Masonry Structures)

Abstract

:
More than the 60% of the Italian residential building stock had already been built by 1974, when seismic codes were enforced on a minimal part of the country. Unreinforced masonry buildings represent most of that share, but they are typical for each region, in terms of both materials and structural configurations. The definition of ‘regional’, i.e., more specific, vulnerability and exposure models are required to improve existing forecast models. The research presents a new geographic information system (GIS)-based multilevel procedure for earthquake disaster prevention planning at urban scale; it includes multicriteria analysis, such as architectural types, structural vulnerability analysis, microzonation studies, and socio-economic aspects. The procedure has been applied to the municipality of Pordenone (PN), a district town of the Friuli–Venezia–Giulia region, in Northeast Italy. To assess the urban seismic risk, more than 5000 masonry residential buildings were investigated and common types within sub-municipal areas and exposure data were collected. Simplified mechanical analysis provided a ‘regional’ vulnerability model through typological fragility curves. The integration of results into GIS tool permitted the definition of cross-mapping among vulnerability, damage scenarios (conditional and unconditional) and exposure (seismic losses, casualties, impact), with respect to various earthquake intensities expected in the town. These results are presented at different scales: from the single building, to submunicipal area and to the entire town.

1. Introduction

1.1. Seismic Risk Mitigation Strategies for Preservation of Civil Masonry-Built Heritage

The seismic risk assessment, from national to local scale, is a significant issue in Italy, due to the coexistence of seismic hazard, vulnerability, and exposure. The seismic risk mitigation of urban centers requires the evaluation of several aspects about these three factors, with the aim of identifying buildings vulnerabilities (fragility models) and adopting effective risk reduction strategies (exposure models). These predictive models involve information, such as architectural types, structural characteristics, amount of buildings, spatial location, and socio-economic aspects, that permit to estimate levels of damage, losses and impacts of building types in case of natural disasters.
In Italy, the large number and dispersion of historical towns characterized by valuable heritage, considering the historical buildings, monuments, and cultural artefacts, entails the responsibility to preserve the artistic and cultural heritage from natural disasters (including earthquakes). The experience, dramatically acquired from last events, particularly Central Italy, 2016 [1,2,3,4,5,6] Emilia, 2012 [7,8], L’Aquila, 2009 ([9,10,11,12], Molise, 2002 ([13,14,15], and Umbria and Marche, 1997 [16,17,18,19,20] revealed the high vulnerability of the civil building stock, usually built with less care than public and monumental buildings [21], in the absence of seismic codes and subject to inadequate maintenance.
The heterogeneity of the Italian civil building stock (taxonomy), typical for each region, in terms of both materials and structural configurations, represents an element of complexity for the assessment and mitigation of seismic risk. Furthermore, the classification of regional and local, i.e., more specific, building types is a complex process that can be successfully addressed only by a systematically elaborated and well-organized methodology [22].
Existing procedures need to be revised or updated, aimed at defining seismic vulnerability and risk models on an urban scale, and at evaluating the fragility of residential masonry building types, within complex urban areas. These models permit to identify the probabilistic distribution of damage induced by a single seismic event or by the combination of several of them, in a certain time window, and to implement urban earthquake disaster prevention plans [23]
Following these ideas, the “Sendai Framework for Disaster Risk Reduction 2015–2030”, promoted by the Third United Nations World Conference [24], provides the world-wide guidelines for the management of multirisk disasters, in order to reduce the losses of human, economic, social, cultural and environmental goods. The program defines the general goals and actions, at national and local scale, to be pursued by countries within 2030.
In Italy, the national Department of Civil Protection (DPC) has recognized the fundamental role played by the knowledge of seismic risk scenarios, that have been categorized as nonstructural prevention actions by the new Code of Civil Protection D.Lgs. n.1 of 02/01/2018 [25]. Then, according to the Sendai framework the updated “National Risk Assessment” was issued in 2018 [26]. In addition, two current projects, i.e., DPC-Reluis projects Typological-Structural Characterization of the urban compartments (CARTIS), and Risk Maps and Seismic Damage Scenarios (MARS), focus on the updating of Italian risk maps and on the evaluation of damage and exposure scenarios at national and regional scale, useful for seismic risk predictions, as well as the definition of prevention and mitigation strategies.

1.2. Large-Scale Seismic Vulnerability Assessment Methods: A New Metodology for Urban Scale

The seismic risk represents the estimation of the overall losses that can affect a certain area, in a specific observation time window. The definition of a regional risk assessment requires the adoption of territorial models and data on seismic hazard, vulnerability, and exposure.
The methodologies for assessing the seismic vulnerability of buildings use different approaches (empirical, analytical, hybrid); they are based on the purposes of the analysis and the various levels of detail of the information available on the morphological-structural features of the buildings. Empirical methods refer to the observed damage and express the seismic vulnerability of building types through: (i) Damage Probability Matrices (DPM) [27,28,29,30,31,32]; (ii) analytical methods, which perform numerical analyses applied to a mechanical model of a building (capacity spectrum and collapse mechanism-based methods) [33,34,35,36,37,38]; (iii) hybrid procedures, which combine aspects of both previous methods based on the expert judgment and on simulated analytical damage statistics for the definition of vulnerability and fragility functions [39].
Suitable procedures for large scale vulnerability analysis start from the expeditious acquisition of information to characterize the built stock of large territorial areas and to formulate a consistent forecast of the impacts caused by a seismic event [40]. Therefore, the level of information is linked to the extension of the analysis scale. To mitigate the seismic risk, these analyses must be carried out on entire territorial areas or urban centers, i.e., on a significant and often complex sample of buildings.
For urban-scale seismic vulnerability analysis, one of the main application problems is the limited information on residential buildings, with respect to the required level of investigation. The information concerning building types generally used in these studies, in fact, is obtained by census databases (e.g., ISTAT in Italy) [41], that provide only very basic data to carry out vulnerability assessments for urban areas, such as number of buildings and floors, age of construction and type and structural materials. Therefore, the uncertainty of the input data does not allow to obtain consistent prediction models, which are necessary for the calculation of prevention and risk reduction strategies.
This work presents a new multilevel Geographic Information System (GIS)-based integrated procedure for seismic risk assessment at urban scale, through the definition of regional fragility and exposure models, based on specific typological studies [42].
The procedure involves the construction of regional inventories, more specific with respect to census databases, carried out by the CARTIS approach [43] in the framework of the Reluis 2015–2018 project.
The first level CARTIS form (issued on 2014), based on an interview protocol, recognizes the common residential types within submunicipal areas (districts). For each building type, relevant parameters are collected, such as number of floors, construction period, use, shape and surface, type of aggregation, vertical and horizontal structural configuration, type of foundations, and conservation state. The form presents distinct sections addressed to the survey of vulnerability aspects of both masonry (MUR) and reinforced concrete (CAR) buildings.
The second level CARTIS form (issued on 2016), within the same framework, permits to gather information relevant to the seismic response of specific buildings for more in-depth investigations (vulnerability studies) [44,45]. Furthermore, the use of the second level form on a large sample of buildings contributes to the validation of the typological assumptions made with the first level form at the urban scale.
The data collected on an urban scale are managed by geographic information systems (GIS), which allow developing an integrated and combined network of information, as well as gathering, storing, analyzing, and displaying large amount of geo-referenced data [46,47]. Furthermore, the development and implementation of a relational GIS database provides a planning tool useful for engineers and authorities to have overall and local views of urban areas, which can be useful in terms of risk evaluation and safety and rescue plans [6,22,48,49].
The seismic vulnerability of masonry-built heritage can be defined by a simplified mechanical approach able to describe the seismic behavior of structural types through fragility curves. A software suitable for this purpose is Vulnus VB 4.0 [34,50,51], developed at the University of Padova [52]. This software provides fragility curves from data on in-plane and out-of-plane behavior, and qualitative features of the building (for example the state of preservation, the presence of structural interventions and the quality of the information). This information is collected through the GNDT (Italian group for defense against earthquakes) second level form, that estimates the vulnerability of the building through weighted parameters [53].
The mechanical-heuristic procedure proposed by Donà et al. [54] was applied to develop typological sets of fragility curves for the five damage levels DS1–DS5, according to the European Macroseismic Scale (EMS-98) [55].
Both conditional and unconditional damage analyses were performed [54,56,57]. In conditional analyses, the damage is related to a specific return period (Tr) and to the particular level of ground motion associated with it, while in unconditional ones, a combination of multiple levels of ground motion is taken into account with their probability of occurrence [58,59,60,61,62].
Moreover, by adding information about exposure, it is possible to perform seismic risk analysis of losses and impact. In particular, losses can be expressed in terms of economic losses [63,64], also related to indirect costs [65], and fatalities and injuries [66,67,68]; impact can be represented by the number of buildings that are usable, not usable in the short and long time span or collapsed [69,70].
Lastly, the implementation of this framework into a GIS tool permits the visualization of the developed seismic scenarios at different levels of the urban scale.
The procedure here proposed was applied on the masonry-built heritage of Pordenone district town, Friuli–Venezia–Giulia (Northeast Italy). This region has one of the highest seismic hazards in Italy (according to the Italian hazard map [71]). Moreover, as a pilot case study, the municipality of Pordenone represents a significant medium-sized city of about 50,000 people, with a small medieval old town around which the city developed.
The research was carried out taking into consideration the following steps (Figure 1): (a) identification of civil building types of Pordenone; (b) update and calibration of regional mechanical fragility and exposure models (masonry-built heritage); (c) validation of a new GIS-based multilevel and multicriteria analysis for urban earthquake disaster prevention planning; (d) damage scenarios analysis (conditional and unconditional) and impacts (economic losses, accessible buildings, victims, etc.); (e) definition of local seismic risk indicators for the development of regional mitigation strategies.

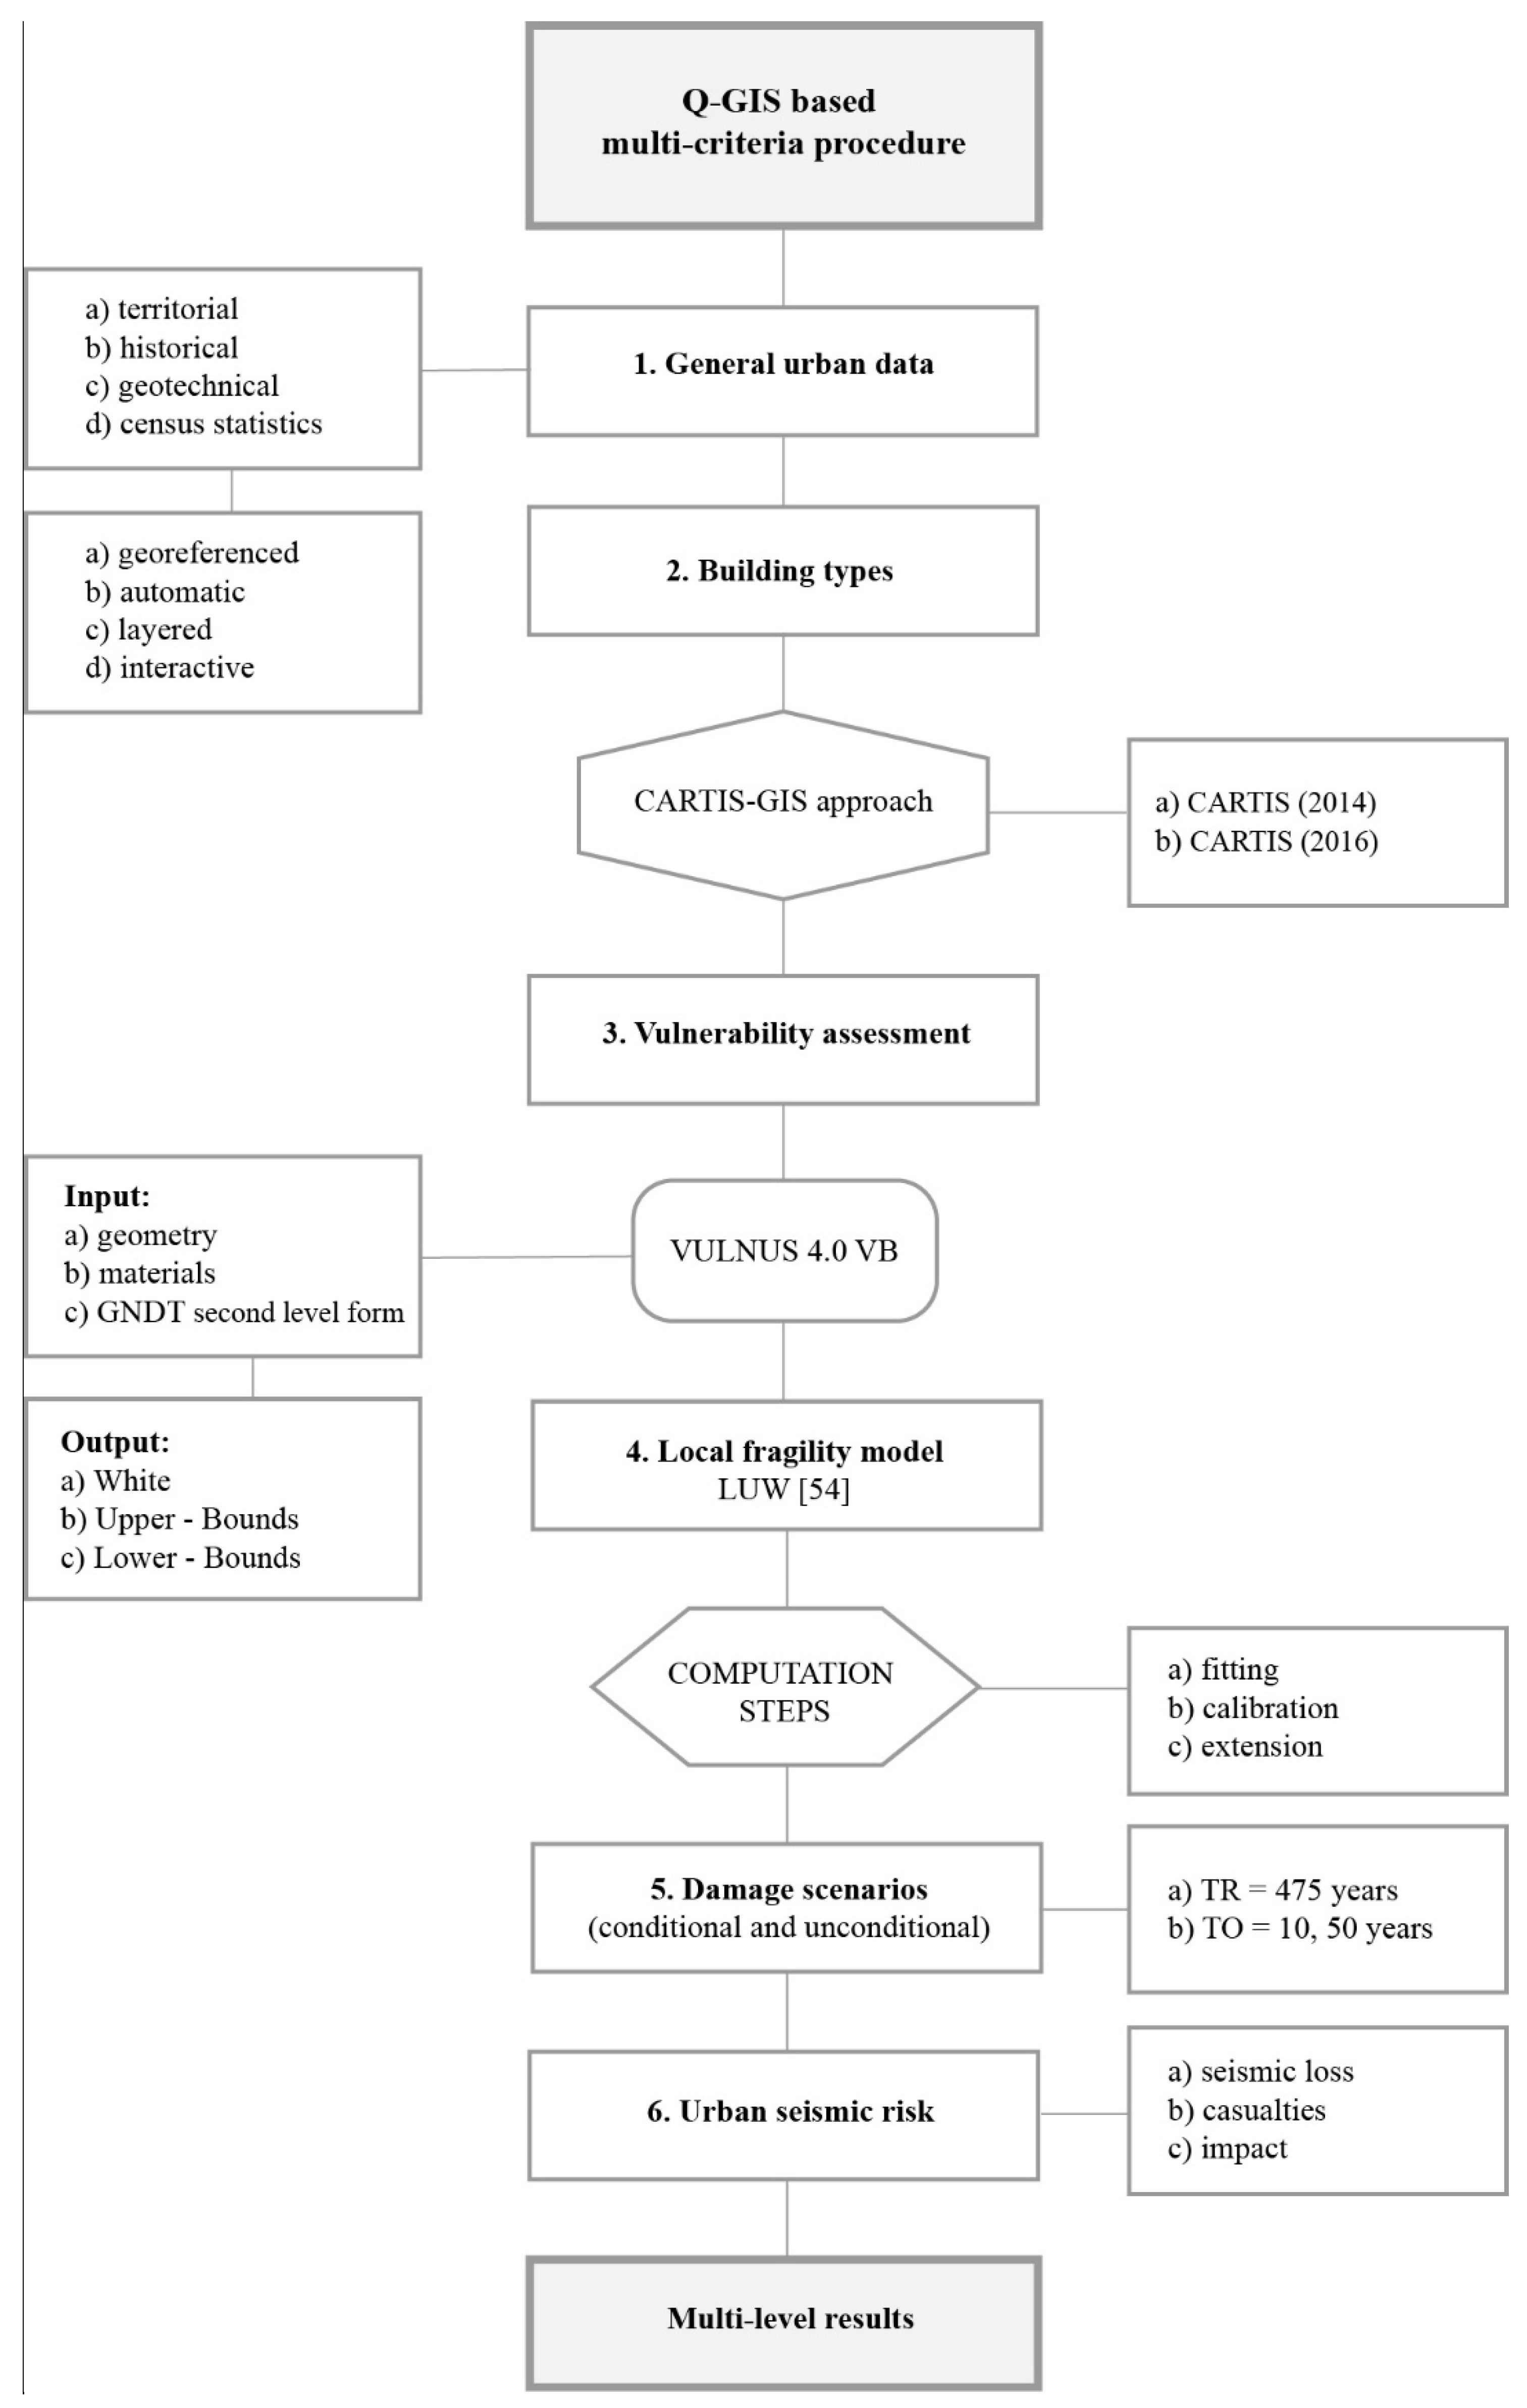
2. A New Integrated GIS-Based Procedure for Urban Seismic Risk Assessment

Multicriteria and Multilevel Framework Design and Implementation in QGIS Environment

Urban scale seismic risk assessment requires multicriteria framework that well fits with the GIS environment, where different information can be layered and integrated, such as general urban data, census statistics, building types, structural vulnerability analysis, microzonation studies and socio-economic aspects, fragility and exposure models and scenarios, etc. (Table 1).
The GIS database permits an effective management of all information and the implementation of damage and loss estimation models (probability functions). To automate and optimize the procedure, all computations were performed inside the GIS environment through query, field calculator, array, buffer, join, etc. The analysis was carried out by mapping all outputs through the open-source software Quantum GIS 3.0.3 (QGIS), released by the Open Source Geospatial Foundation [72].
Then, the implementation of information identified by the CARTIS approach, allowed for the developing of accurate fragility and exposure models for seismic risk predictions at urban scale. The first (2014) and second level (2016) CARTIS forms (Table 2) both permit an expeditious survey of building types within the town districts (first level) and a detailed investigation of vulnerability of residential buildings (second level).
The new GIS-based procedure presents a flexible structure based on four different levels of detail (building, census unit, district, city), to provide local and global assessment of the urban seismic risk. This multilevel approach aims at identifying buildings, streets, and district areas with high level of risk based on the evaluation of various criteria. By mapping working at various administrative levels, it represents a tool for a better management and interpretation of urban data, which can be useful to allocate the resources for territorial seismic risk mitigation plans [73] (Table 3) (Figure 2).

3. The CARTIS Approach Applied to the Case Study of Pordenone

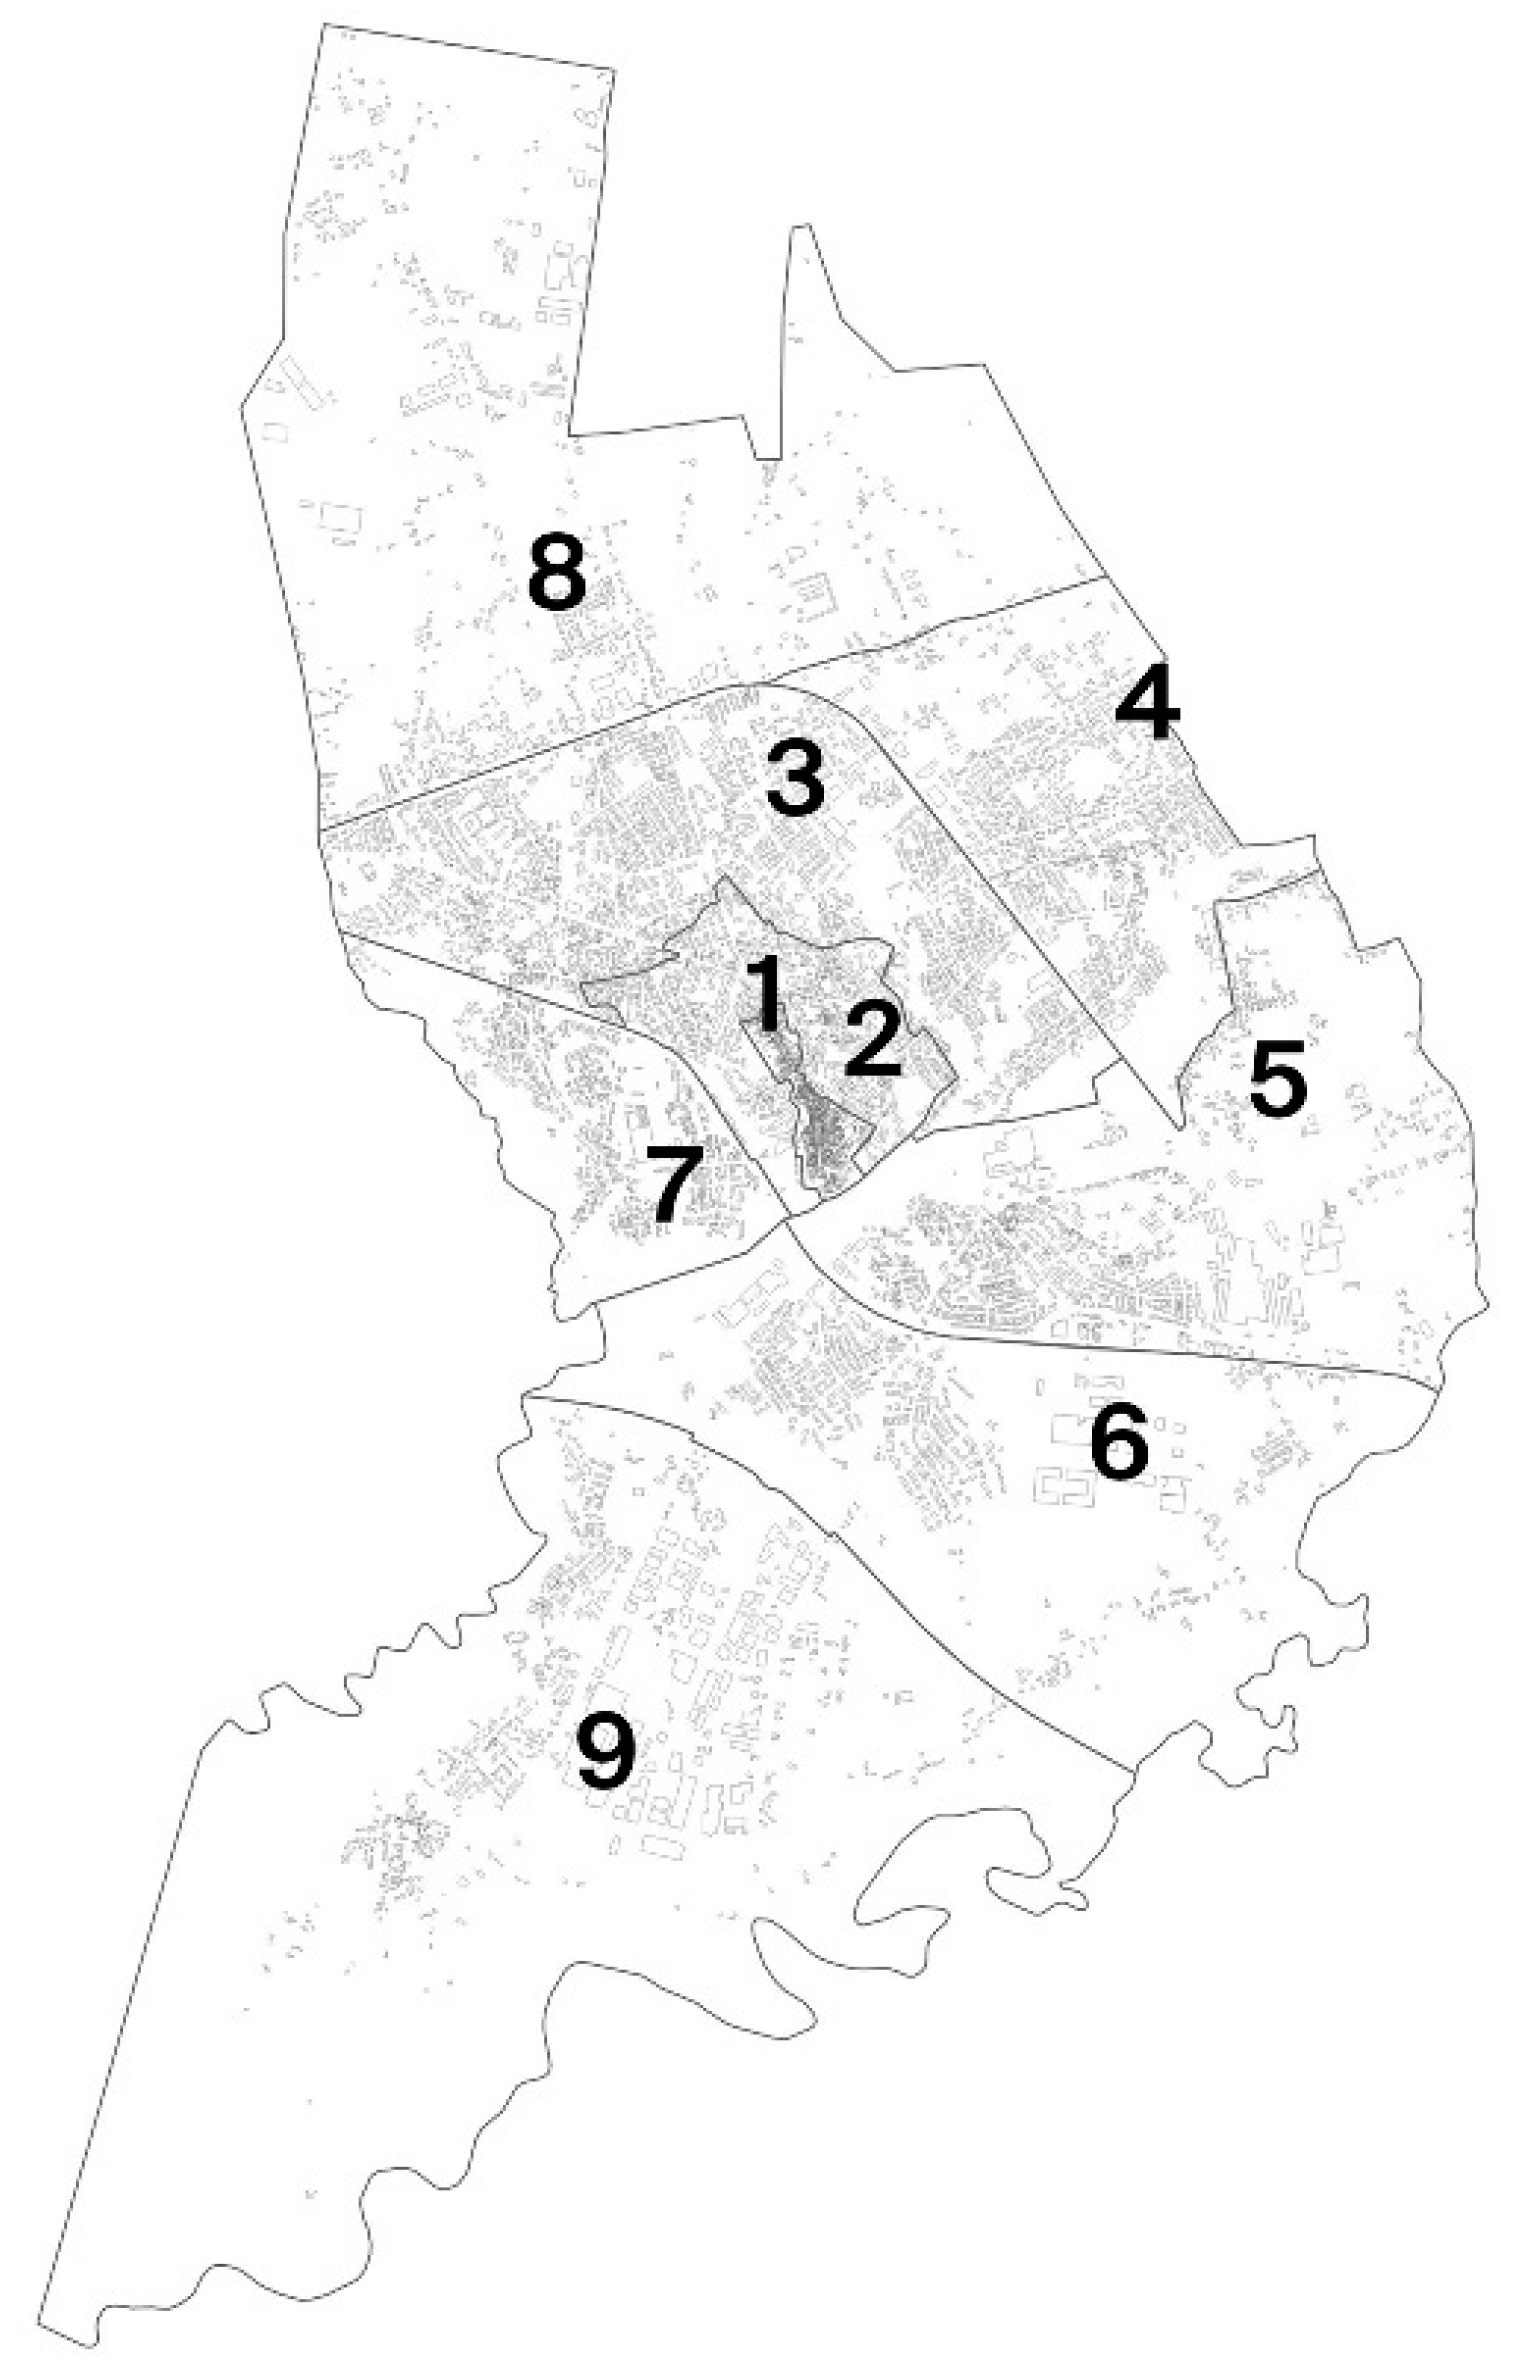
3.1. The Municipality of Pordenone: Urban Expansion and Conformation

The Friulian territory is characterized by high seismic activity [71]. Located in the Northeast of the country, Friuli–Venezia–Giulia region borders with Austria and the Carnic Dolomites (North), Slovenia (East), the Adriatic Sea (Southeast) and Veneto (Southwest). This area was struck by the dramatic earthquake of 1976 that caused about 17,000 collapses, 200,000 displaced, 965 victims and 3000 injured [74]. In these areas, high seismic hazard combines with the vulnerability and exposure of the existing building stock, thus defining an ideal case for the validation and calibration of the procedure herein presented.
Pordenone is a medium-sized town of about 50,000 inhabitants and 10,000 buildings (9171 residential [41]), located in the southwest of the region (low Friulian plain, south of the Carnic Prealps), and crossed by the Noncello river. Its consolidated old town developed through a main axis in north-south direction and is composed of arcade buildings with 3–4 floors of low medieval origin. The building fabric of this area is characterized by masonry clusters that underwent frequent transformations over the last century, which were generally aimed at adapting the buildings to commercial uses.
Since the 16th century, the town has begun to expand in all directions and small urban villages arose around the old district, such as: S. Giorgio, S. Antonio, S. Giuliano and Trinità, Borgo Colonna, Torre, Borgo Meduna, S. Gregorio, Villanova, Noncello, and Rorai Grande.
In the 19th century, the industrial development of the town led to the construction of many cotton and paper mills in its suburbs. These factories gradually became as many small urban centers, characterized by an irregular growth of low-density residential masonry buildings for the working class. After the Second World War, the process of saturating the empty spaces between the town and the suburbs led the various urban built up areas to merge into a vast organically unitary city. In this regard, Pordenone transformed from a ‘big village’ into a real town: the buildings involved in this expansion were mostly brickwork houses from 2 to 5 floors and high-density reinforced concrete buildings. Lastly, in recent decades, new constructions have been limited, but extension works on existing buildings are still frequent.

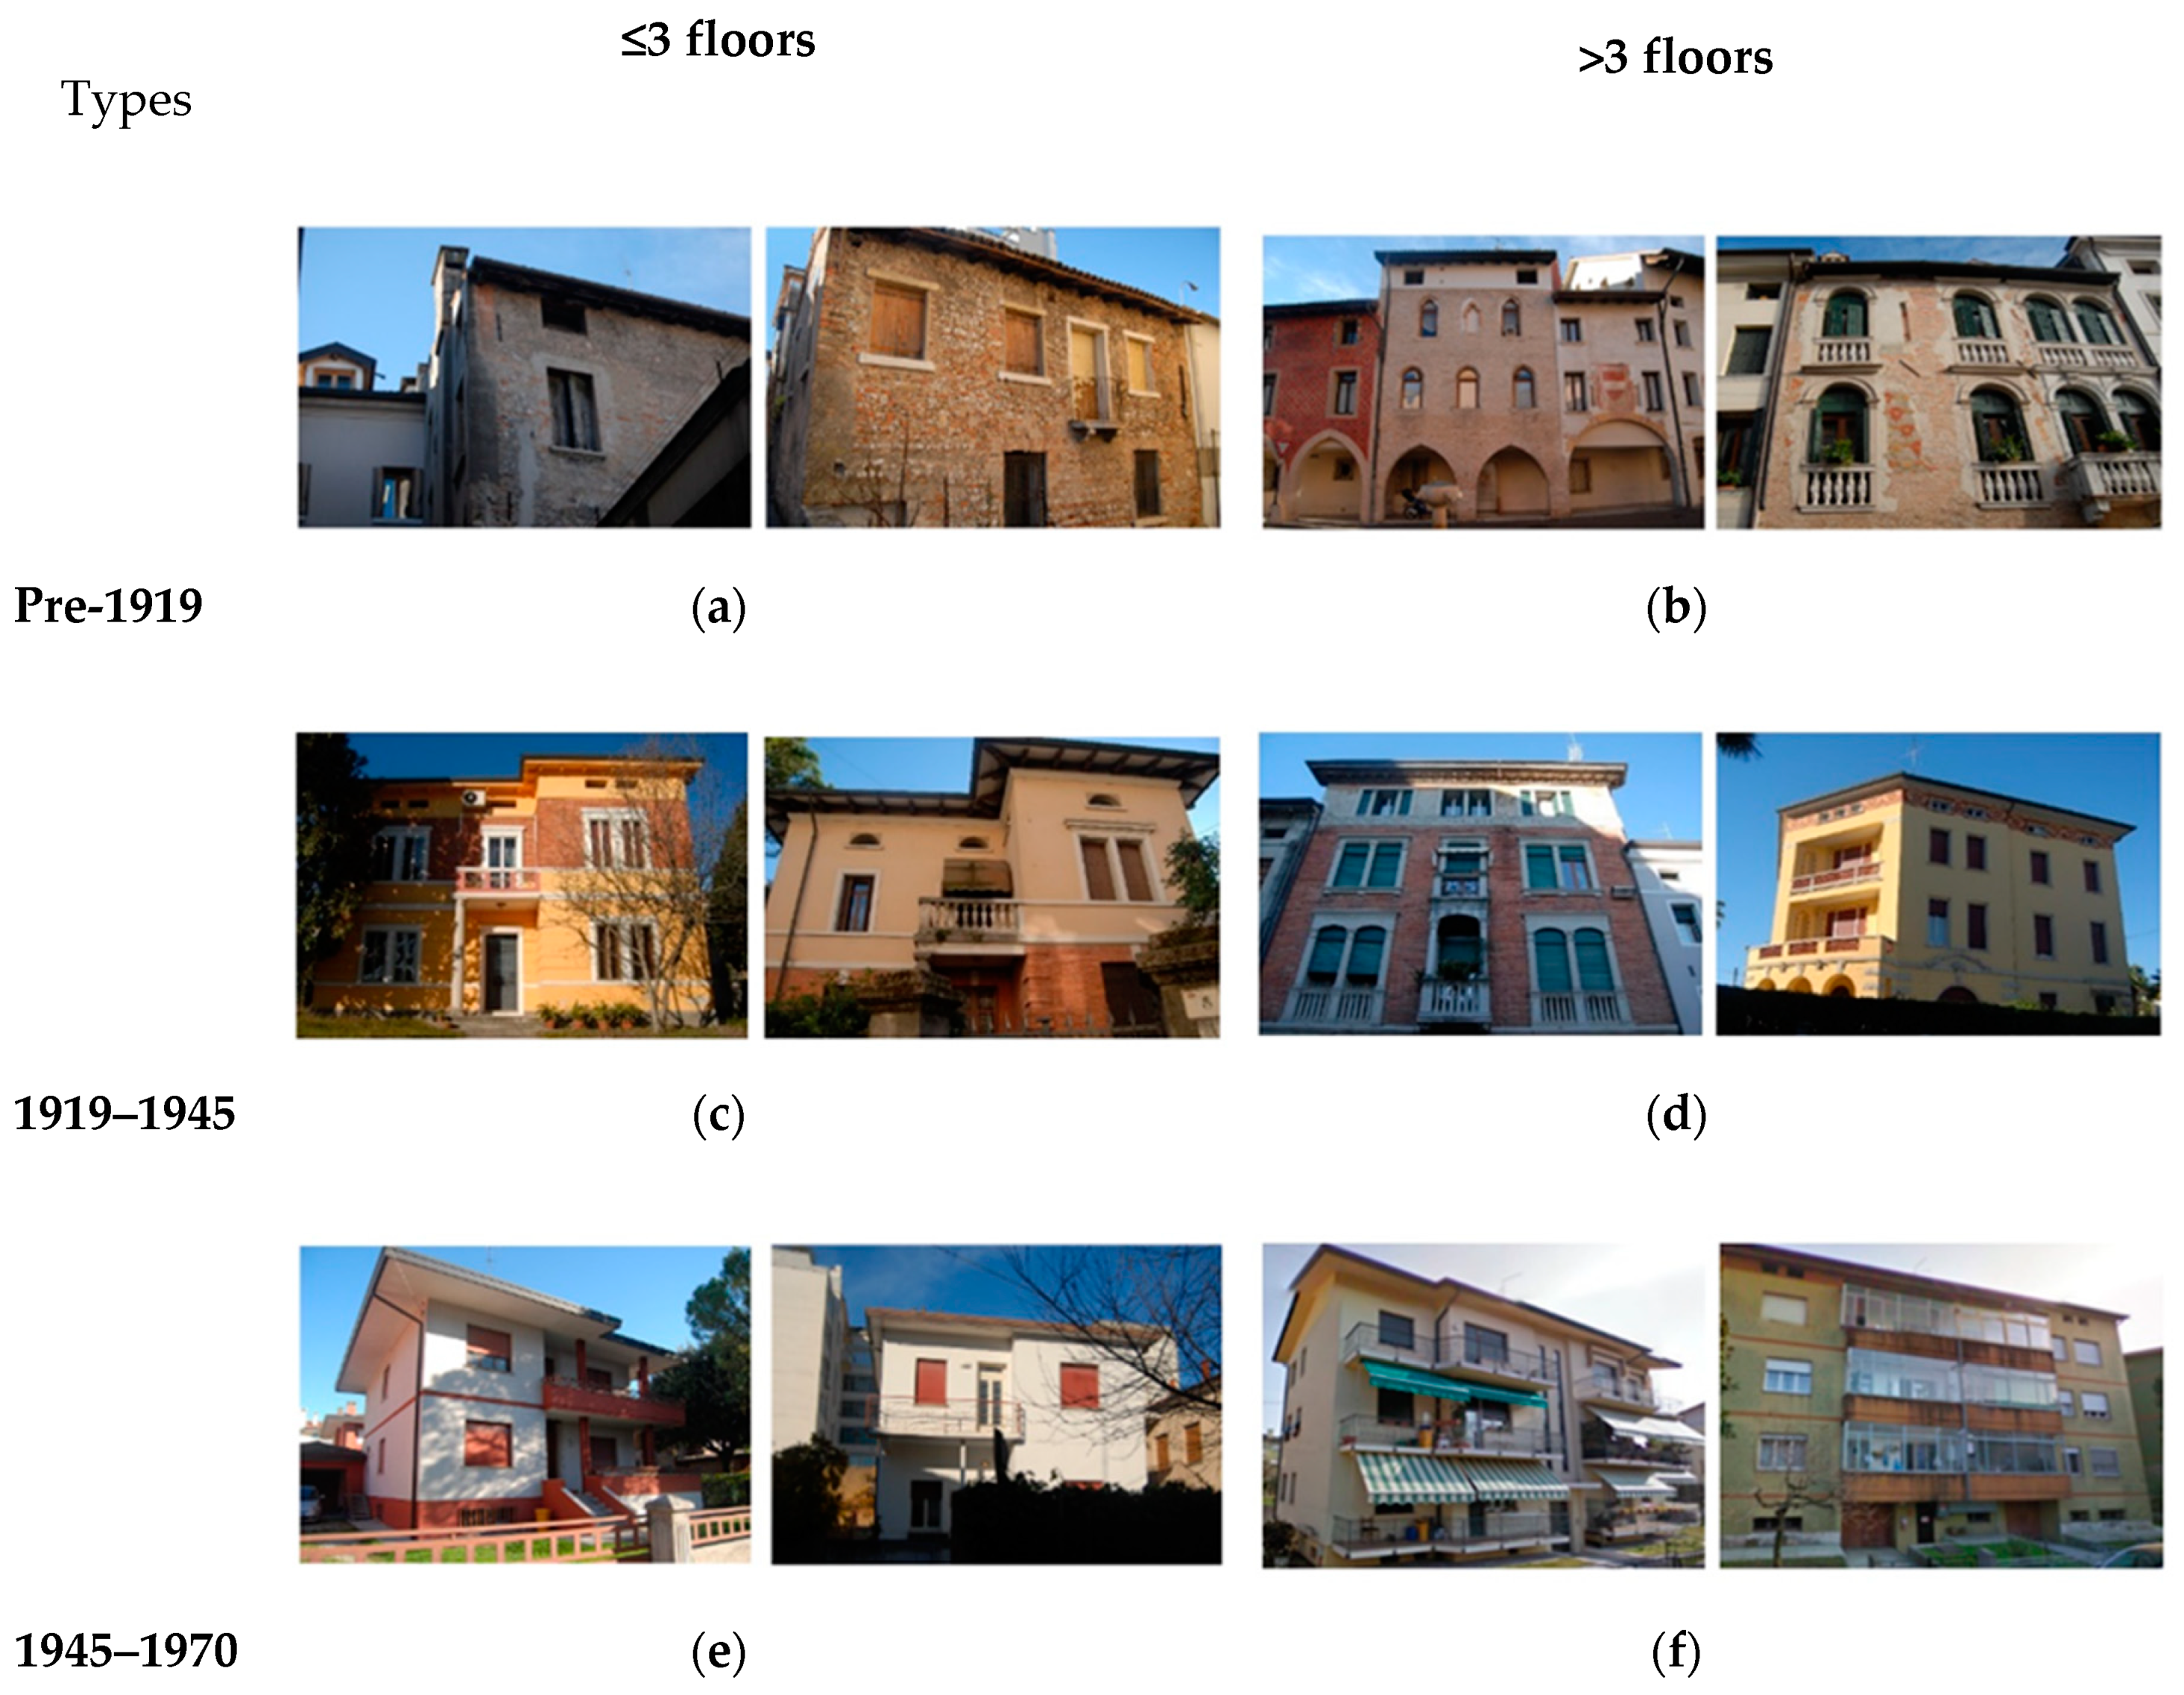
3.2. Civil Building Types Characterization—CARTIS Form Survey

A georeferenced (QGIS) multilevel database was created to assess the vulnerability of building types at urban scale. The creation of specific attribute table (shapefile) with the fields of the CARTIS forms permitted an efficient and rapid insertion of the data into the folder and the integration of different layers (vector, raster), which are quite useful when dealing with this type of analysis: Google Satellite, CTR, historical cartographies, seismic microzonation maps, ShakeMaps, etc.
Secondly, according to the CARTIS approach, the municipality of Pordenone was divided into nine sections (districts), i.e., areas characterized by homogeneity of the built fabric through aspects, such as age of original installation, construction, and structural techniques (Figure 3 and Table 4).
In total, five masonry-built residential types were recognized (MUR1—district 1, MUR1—districts 3–9, MUR2, MUR3, MUR4), depending on significant parameters, such as the construction period, the number of floors and the characteristics of vertical and horizontal structural components.
According to census data [41], Pordenone counts 3532 load-bearing masonry buildings (39%), 3760 r.c. structures (41%) and 1879 other types (20%).
Table 5 shows the masonry types according to the construction periods (pre-1919; 1919–1945; 1946–1970; post-1970). It is noted that buildings built before 1919 or at most in the early 1900s prevail in the central zones (districts 1 and 2) [75]. They are typically arranged in clusters, with more or less regular texture, from rough stones and poor mortar (MUR2) to ashlars and clay bricks with lime mortar (MUR1), and with traditional timber floors and roofs (i.e., flexible) (Table 6). The most common types of buildings in the suburbs (from district 3 to district 9) are the ones built in 1946–1970, made of clay brick walls and precast r.c. horizontal structures, such as precast joists (‘Varese’ type) or lightweight hollow clay bricks with steel rebars (‘SAP’ type) (both are semirigid types). This stock was divided into two classes: low-rise buildings with 3 floors or less (MUR3), which mostly represent the single-family residential buildings in the municipal area; and high-rise buildings with more than three floors (MUR4), that is the typical for popular housing of those years [76] (Figure 4).
Lastly, for the MUR1 class (district 1—old town), four sub-typologies were defined (MUR1—T1/T2/T3/T4) based on the geometry, regularity (plan and elevation) and organization (simple cluster, complex cluster, detached houses) of the buildings.

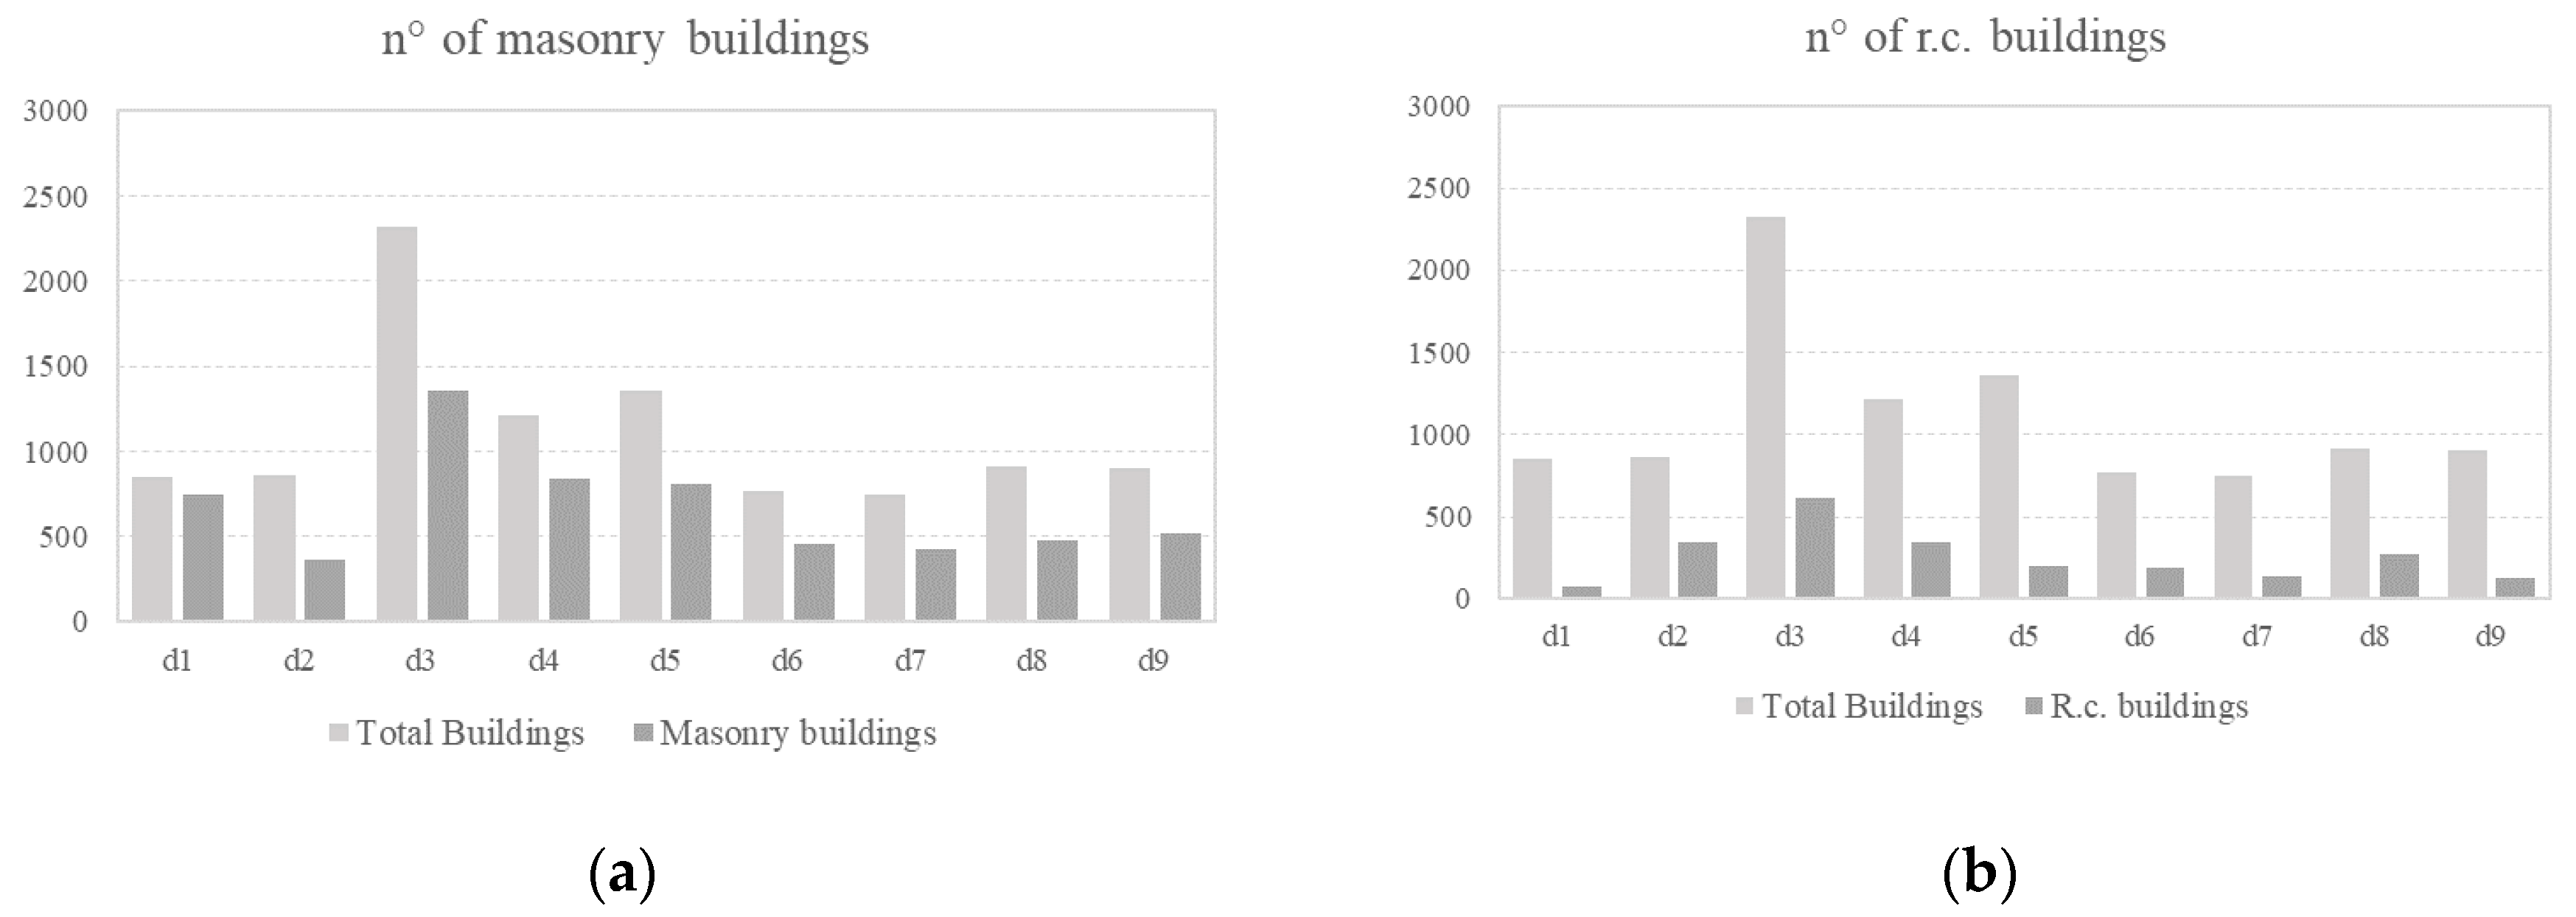
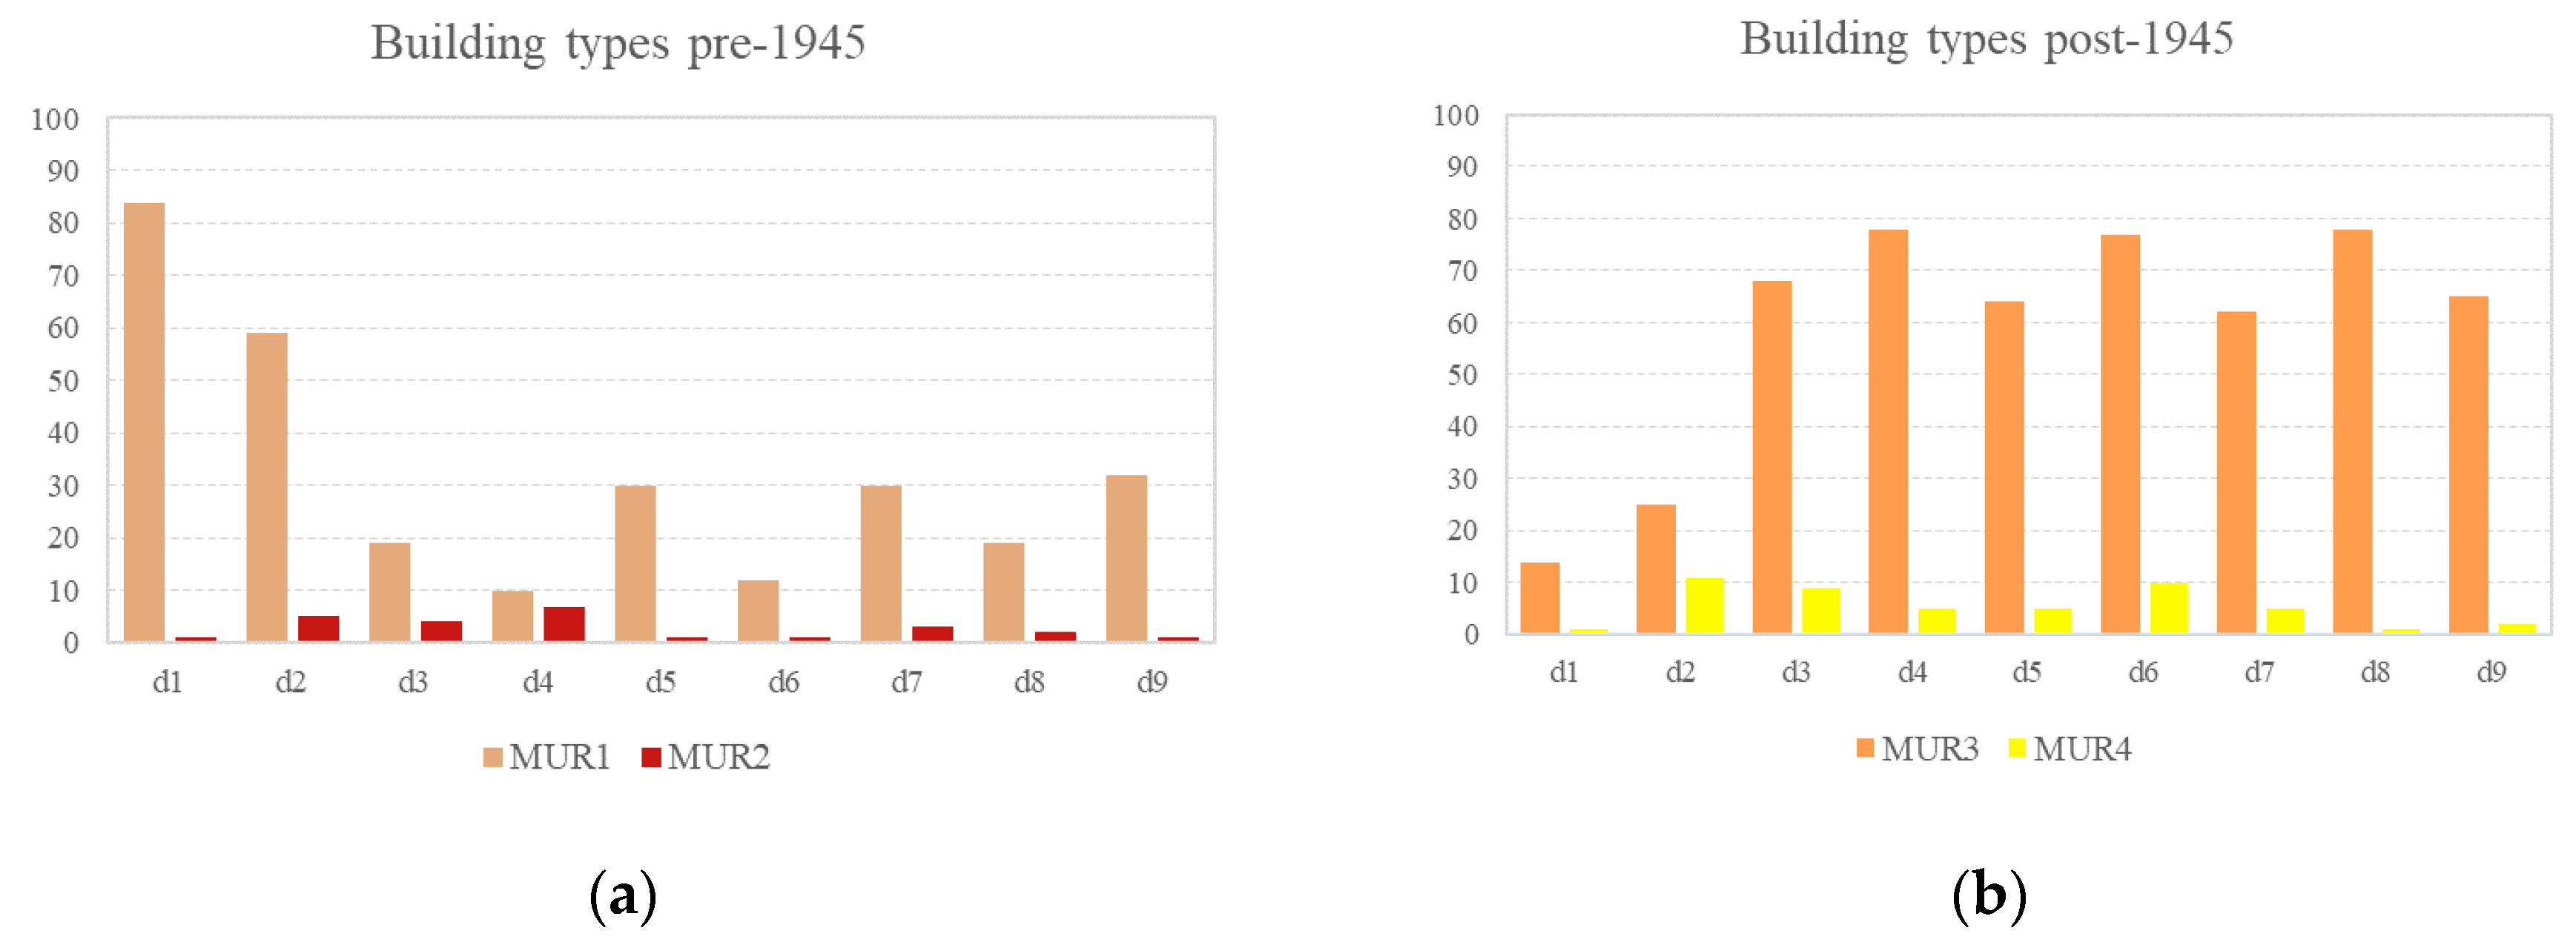
3.3. Statistics and Results of Typological Study (GIS-Based Inventory)

The application of the second level CARTIS form (2016) to about 1000 buildings in Pordenone permitted to define the masonry types described above (Section 3.2) and the following extension of type codes to each building within the municipal area (GIS layer–CARTIS buildings).
The GIS layers ‘Census Sections’ and ‘districts’ contain results for the 554 sections and the nine districts of Pordenone, expressed in terms of amount of buildings, percentage of building types, and average of floors.
The CARTIS-GIS database includes a total of 9937 buildings (9171 according to census database [41]) of which 6005 (60.43%) made of masonry, 2309 (23.24%) of reinforced concrete and 1623 (16.33%) nonresidential (public buildings). Considering the specific masonry CARTIS types the catalogue counts 1867 MUR1 (31.09%), 172 MUR2 (2.86%), 3616 MUR3 (60.22%), and 350 MUR4 (5.83%) (Figure 4). For 766 buildings of these, it was possible to view practices, drawings, and cartographies, to have specific references for an accurate compilation of as many CARTIS forms.
The results of the typological analysis show that in the central districts (i.e., districts 1 and 2) pre-1945 types (MUR1-MUR2) prevail (72%), while from district 3 to district 9 there is a strong increase of the MUR3 type (on average 70%). Moreover, the MUR1 type is around 30% of the masonry buildings in districts 5, 7, 9, i.e., suburbs having several historical clusters developed along the main old roads (Figure 5 and Figure 6).
The multilevel inventory provided the automatic calculation (fields calculator tool) and the visualization of the results through maps and graphics. As an example, Figure 7, Figure 8 and Figure 9 present the maps of the old town (district 1) and suburbs (district 3) in terms of number of building for each CARTIS type, for the three levels of the GIS database are reported.

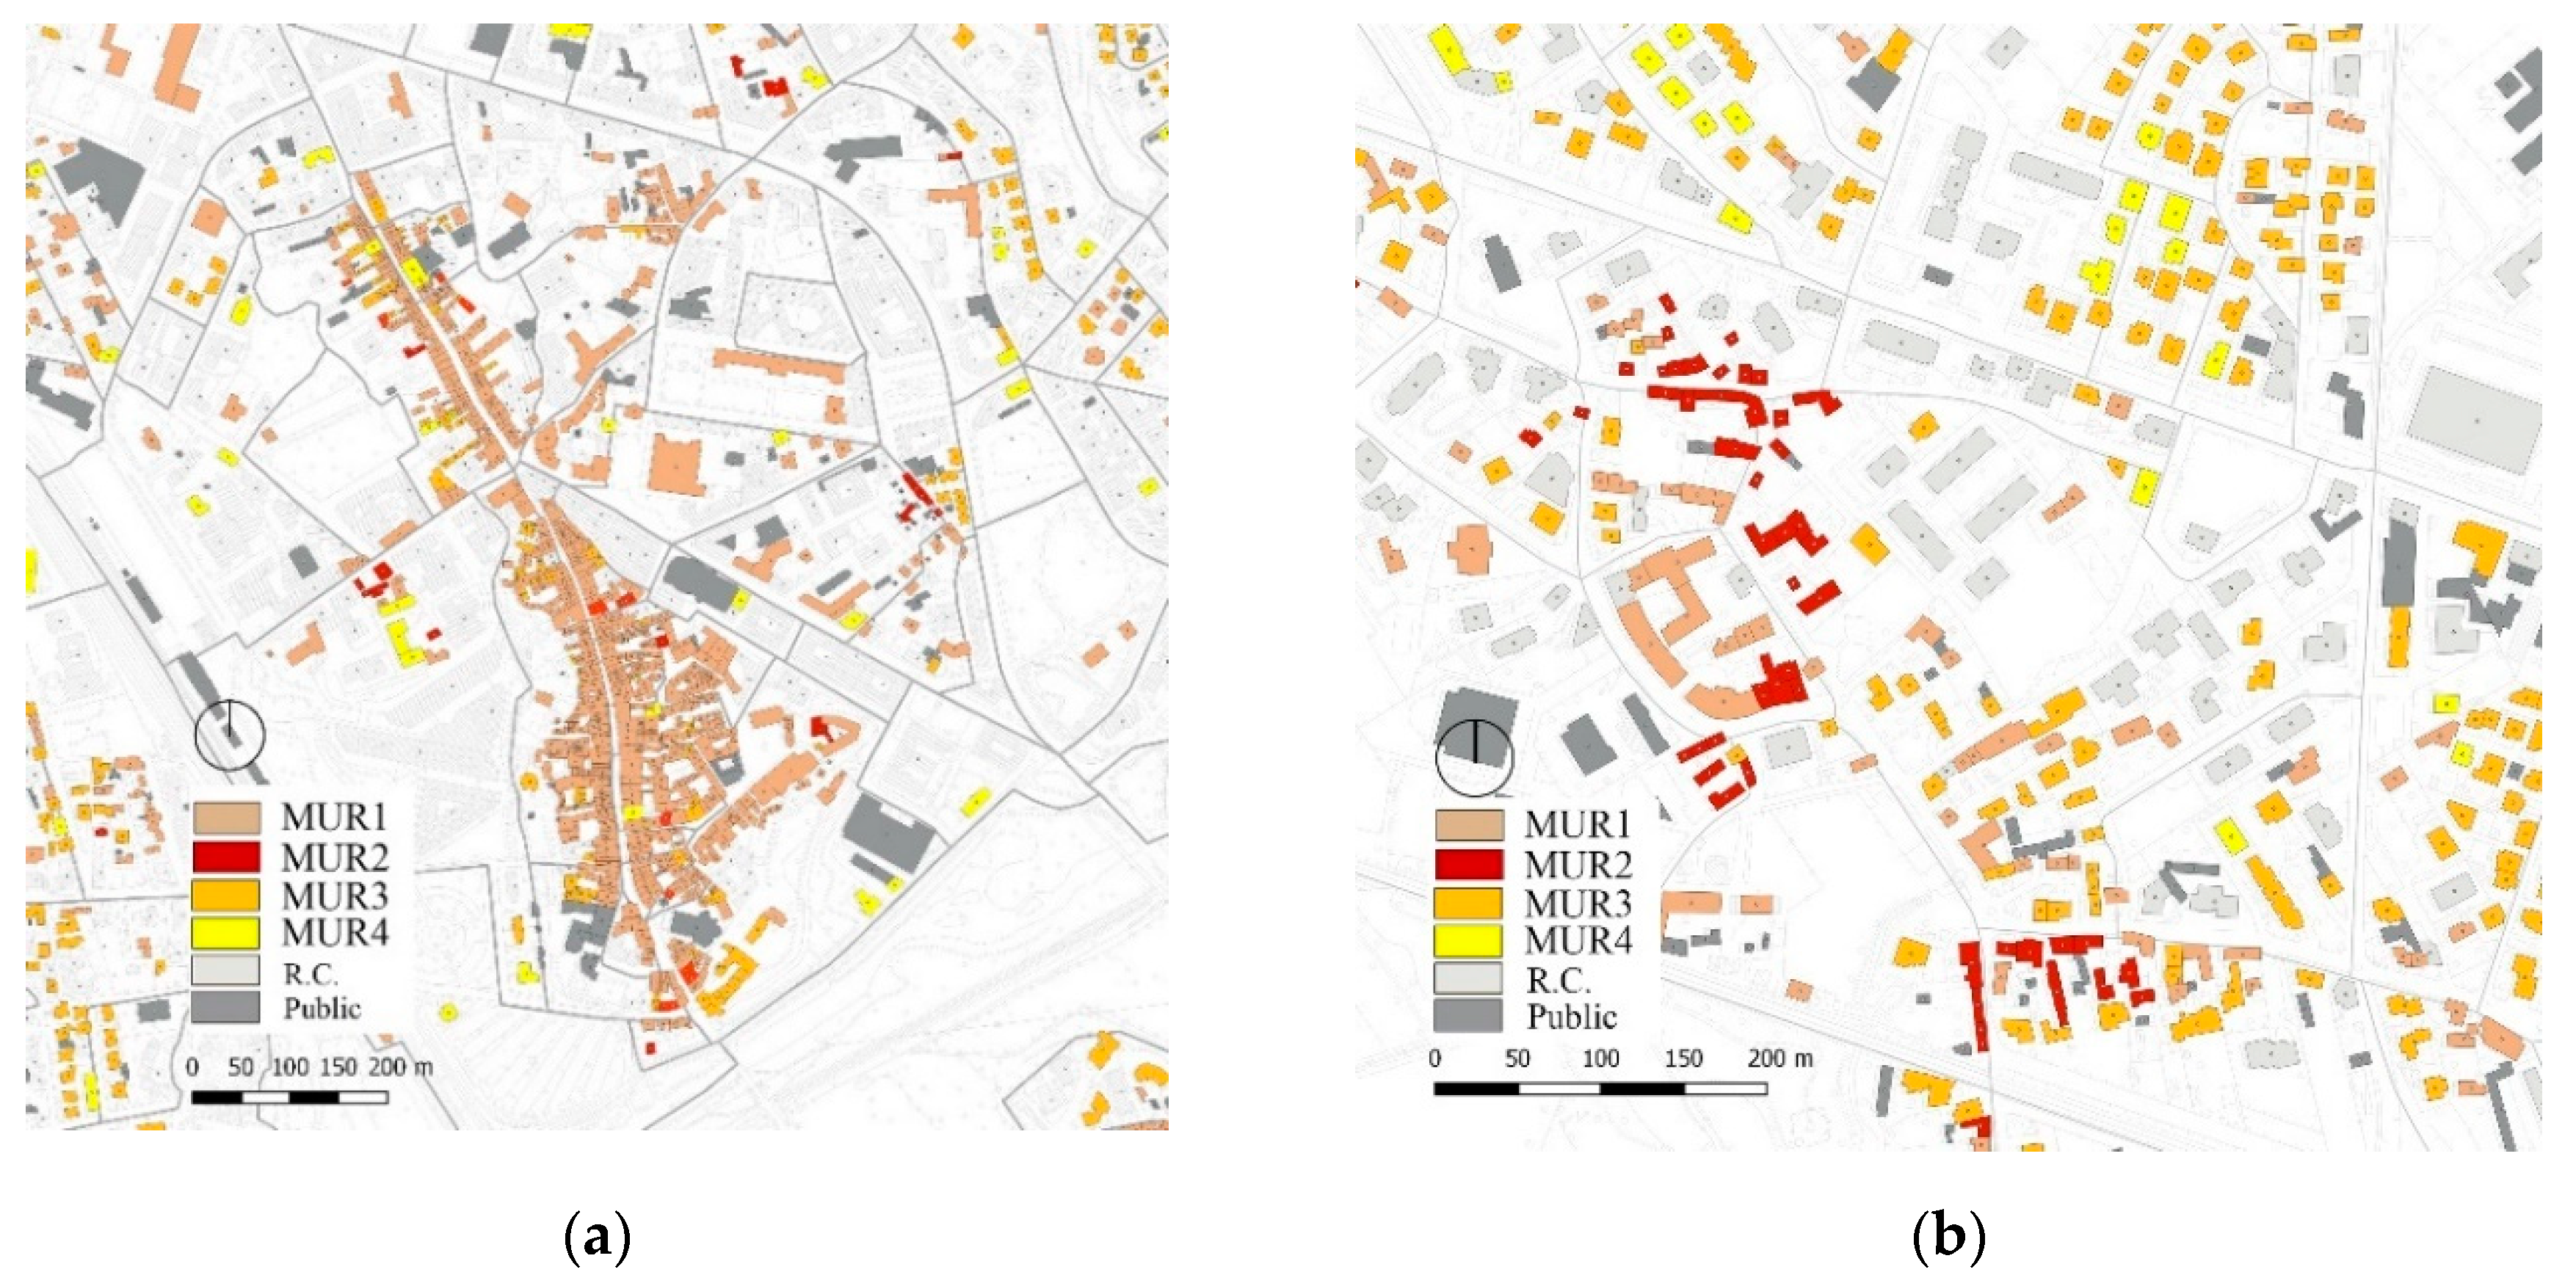
3.4. The Old Town Subtypes

The old town of Pordenone (district 1) develops from the ancient town hall through a main axis in the north-south direction along which more than 800 structural units shape either simple or complex clusters. The complexity of this area required a specific typological study to be carried out, to conveniently detail the database better.
The information of 850 US (Structural Units) (33 nonresidential; 73 R.C. 624 MUR1; 7 MUR2; 102 MUR3; 11 MUR4) identified within the district were inserted in the GIS database. Moreover, new subtypes of the MUR1 and MUR2 (district 1) were defined for these clusters, to improve representativeness of the vulnerability classification and the following seismic risk analysis (Figure 10).
Units and subtypes were defined according to the ground plan of the old town buildings, by taking into consideration various factors, such as surface, plan and elevation regularity, aggregation, presence of arcades, and warping of floors. Four subtypes were identified inside the old town (Table 7), as follows:
  • MUR1-T1: <150 m2 surface; pre-1900 age; close rectangular shape; unit in connection; load-bearing masonry in x-y direction; presence of arcades; timber floors and roof.
  • MUR1-T2: <80 m2 surface; pre-1900 age; small regular square shape with few internal partitions; load-bearing masonry; timber floors and roof.
  • MUR1-T3: 80–300 m2 surface; pre-1900 age; large sized quadrangular units with several internal partitions or with the presence of isolated masonry pillars; load-bearing masonry; timber or semirigid floors and roof.
  • MUR1-T4: 80–200 m2 surface; pre-1900 age; irregular shape and corner units; several internal partitions or presence of isolated masonry pillars; load-bearing masonry; timber or semirigid floors and roof.
The 48% of units belong to the MUR1-T1 subtype, characterized by terraced arcaded buildings; these are generally the most precious buildings of the old town, often showing frescoed facades. The 24% of the sample presents small regular inclusive units (MUR1-T2); the 15% is made up of large size quadrangular buildings (MUR1-T3) with an irregular internal distribution, as result of many aggregation processes; lastly, the 13% (MUR1-T4) corresponds to corner units of building clusters (Figure 11).
The typological surveys and the information gathered in the context of the CARTIS project were used to produce a local fragility model for the different types of masonry buildings of the town.

4. Development of a Local Fragility Model for Civil Masonry-Built Types

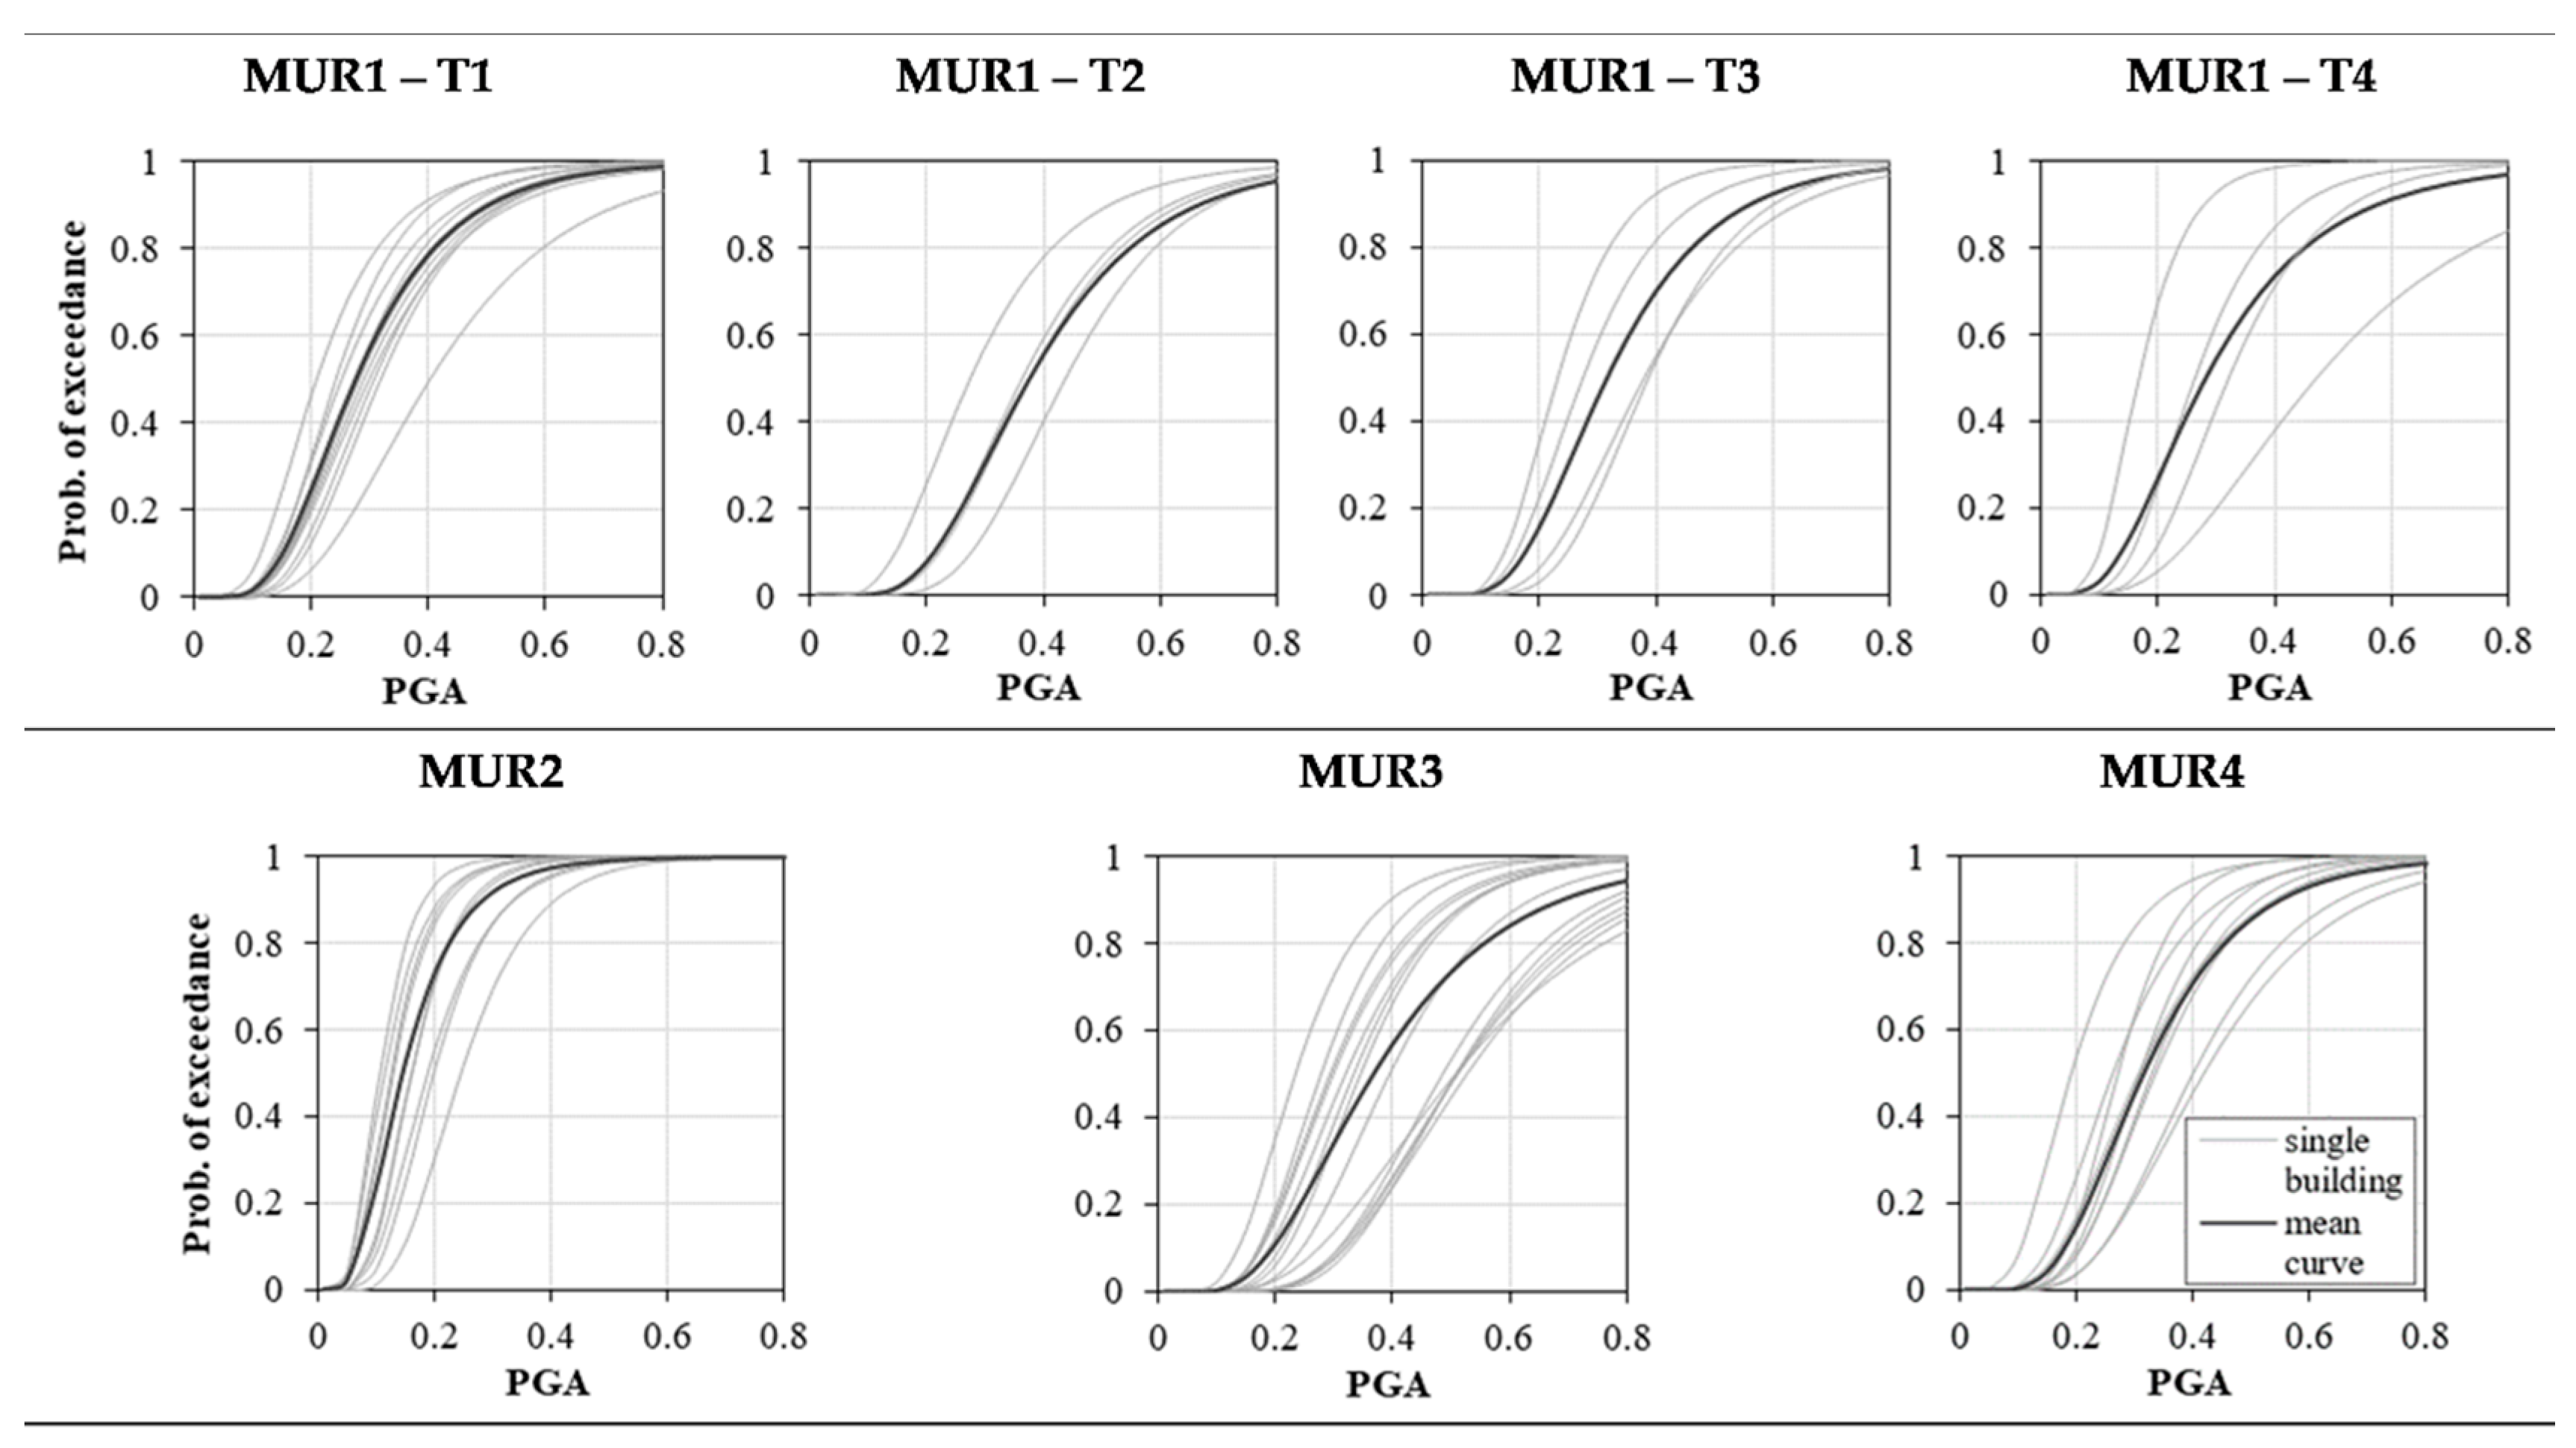
4.1. The Vulnus VB 4.0 Procedure

The calculation of fragility curves for the Pordenone masonry building stock was carried out by a mechanical procedure, which is based on simplified modeling applied to unreinforced masonry (URM) buildings through the software Vulnus VB 4.0. This permits vulnerability analyses based on few information about geometry, material properties, construction features and some qualitative data [34,50]. The simplified analysis performed by Vulnus VB 4.0 is mainly based on resistance checks and on the calculation of the possible collapse mechanisms that the various parts of the structure may suffer. This follows the kinematic approach for local verification, which is also suggested by the Italian legislation [77]. Specifically, in-plane (IP) and out-of-plane (OOP) analyses can be carried out through resistance and linear kinematic calculations, and the horizontal accelerations (a) that activate the main mechanisms can be registered. Then, based on the acceleration (a) normalized to gravity g (a/g), the indexes I1 and I2 are computed, for the IP and OOP resistances, respectively.
In more detail, I1 represents the shear resistance of the building normalized to its total weight, evaluated in its weak direction as the sum of the shear strengths of parallel wall systems analyzed in their average plane as rigidly coupled. In the case of irregularities in plan and elevation, this index is corrected, to consider the non-uniform distributions of normal and tangential stresses. The I2 index, instead, is a more complex parameter. Vulnus VB 4.0 outputs the value of the triggering accelerations of the possible OOP mechanisms associated with the vertical (i.e., tilting of the overall walls and tilting and flexural collapse of the walls at the top story) and horizontal (i.e., bending and arching effect with failure at the top story, tilting and flexural collapse of the arch effect with failure of shoulders and detachment of the transverse walls, both at the top story) masonry portions of each wall, and combines them to obtain only one index (I2) that can be representative of the OOP behavior of the whole building.
All other relevant vulnerability aspects that are not directly computable (i.e., qualitative information regarding the types of floors, roof and foundations, the configuration and regularity of the building, the state of preservation, the quality of connections and construction details, etc.) are taken in consideration through a further index, I3. It is calculated as a weighted average (from 0 to 1, where 0 represents a building designed according to anti-seismic regulations) of the scores assigned to the parameters identified by the second level GNDT form.
Lastly, using these three indices and applying the fuzzy set theory [51], three fragility curves are calculated by the software. They represent the central probability (White curve) and two extreme probabilities (Upper- and Lower-Bounds curves) of exceeding a moderate–severe damage state, associated to a DS2-3 (damage scale according to EMS-98), as a function of the expected peak ground acceleration (PGA).
The association of the fragility curve calculated by Vulnus VB 4.0 with a damage DS2-3 is a reasonable assumption considering that the triggering acceleration of a certain mechanism, assessed by linear analysis, is a necessary condition for the mechanism activation (DS2, corresponding to a Limited Damage—LD, according to [78]), can be very close to the maximum system capacity (DS3, corresponding to a Significant Damage—SD), but it is not yet a sufficient condition to turn the mechanism into a partial collapse (DS4, corresponding to a Near Collapse—NC).

4.2. Application of Vulnus VB 4.0 to the Sample of Buildings

The mechanical analysis of seismic vulnerability was carried out on a sample of 60 masonry buildings, previously detected through the CARTIS second level form (2016) and selected for their representativeness and completeness of available data. Table 8 shows the corresponding types ascribed to the buildings.
Plans and main elevations were available for all the buildings. In addition, for buildings built from 1946, sections and some information about the materials and construction techniques were also provided. Design documents were generally available for more recent buildings. These aspects affect the quality of the information available in the GNDT form, which roughly follows the quality of the second level CARTIS one. Therefore, the reliability of information is higher with regard to the geometric aspects, whereas it is less accurate for the materials properties (especially in older buildings) and the quality of the connections between structural elements, since no results of onsite investigation tests were available.
Table 9 shows the average values of the three indices provided by Vulnus VB 4.0 for the types of the sample of 60 buildings analyzed here. The MUR2 type is the most vulnerable, having the lowest I1 and I2 indexes and the higher I3 one, mainly due to the poor quality of the masonry. With regard to the subtypes of the old town, the most vulnerable is the subtype T4, which is characterized by irregular plan and large surface area, while the subtype T2 is the least vulnerable, due to the small size and regularity of the plan (simple quadrangular geometry). Lastly, for MUR3 and MUR4 types, there is a reduction in vulnerability, due to the progress of construction techniques over time, but not as significant as expected. However, the behavior of MUR3 and MUR4 types is strongly influenced by the presence of reduced thickness clay brick walls (25–30 cm), highly vulnerable horizontal structures (e.g., Varese and SAP types), and either poor materials or structural details. All these aspects strongly influenced the results in terms of both vulnerability indices and fragility curves.
The Vulnus VB 4.0 procedure also provides the fragility curves that define the probability of exceeding a certain level of damage with respect to the PGA. Fragility curves are processed by points: therefore, the first step was to fit them to obtain cumulative log-normal distribution curves, by finding the mean and the standard deviation (Figure 12).
For each of the identified masonry types, i.e., the four subtypes of the old town MUR1-T1/T2/T3/T4, and the remaining MUR2, MUR3, MUR4, the mean curves for White (Figure 12), Upper-Bounds and Lower-Bounds were obtained. Figure 13 shows the White fragility curve of all the building types: the most vulnerable type is MUR2, characterized by a poor masonry quality; MUR1-T2 is less vulnerable, whereas among the others (MUR-T1, MUR-T3 and MUR-T4) there are no substantial differences, since the structural details used in these historical buildings are the same. MUR3 and MUR4 types, which represent more recent buildings, have overall lower vulnerability but still respectively comparable to the MUR1-T2 and MUR1-T3 subtypes, due to the onset of the above-mentioned aspects that affect the seismic behavior. Moreover, MUR4 is slightly more vulnerable than MUR3; this is probably due to the presence of buildings that are taller, less regular, and with a larger surface area than the others are.
Figure 14 shows the complete model, with the White, Upper- and Lower-Bound fragility curves, for each masonry type. As it can be seen, the dispersion range defined by the Upper- and Lower-Bound curves increases for the type MUR3 according to its decrease of vulnerability. This feature is due to the reduction in the Lower-Bound fragility related to a better seismic behavior.

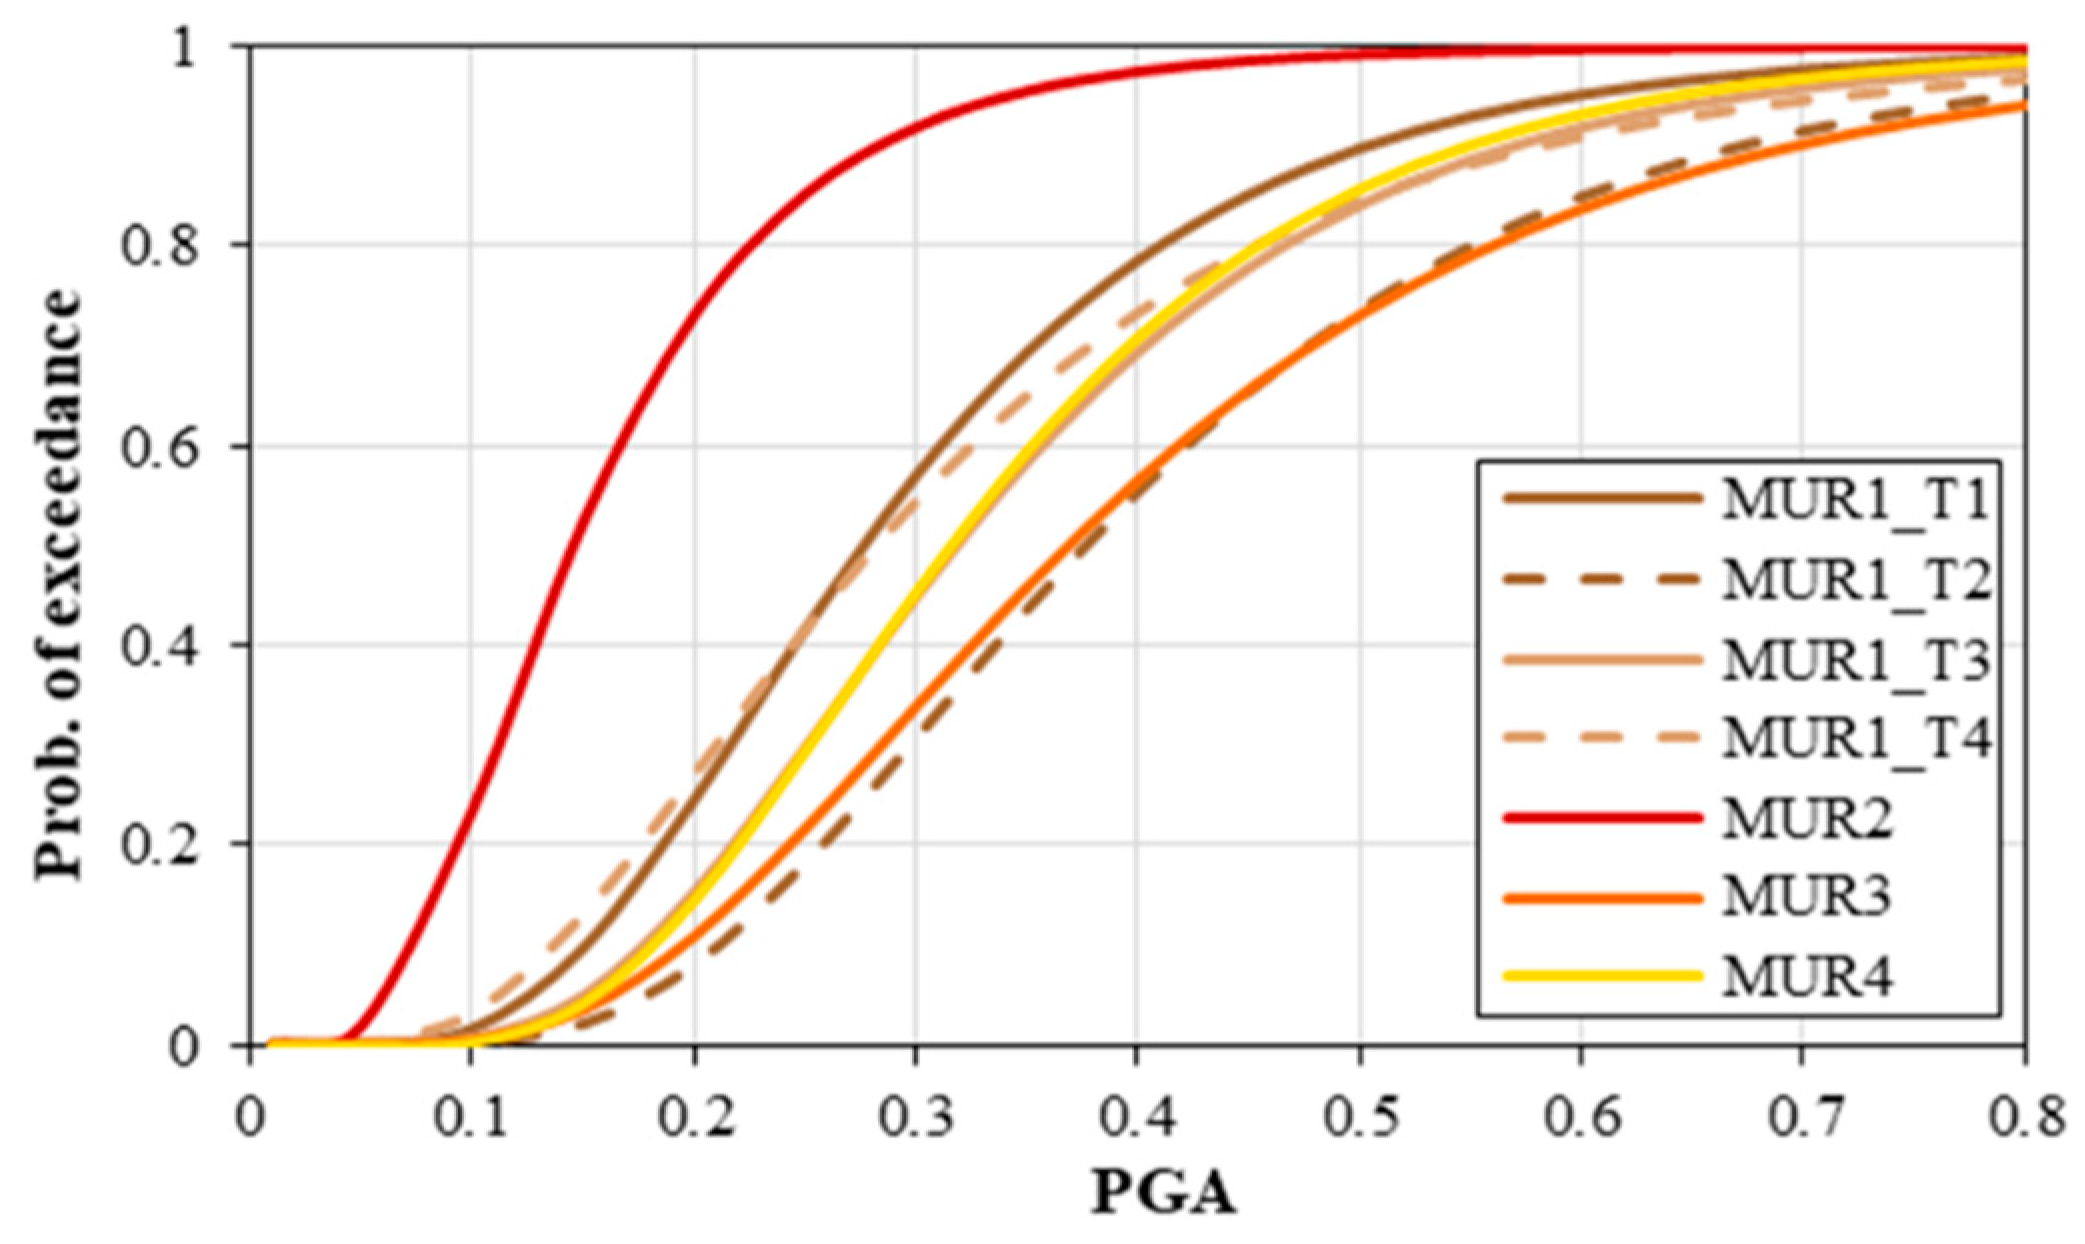
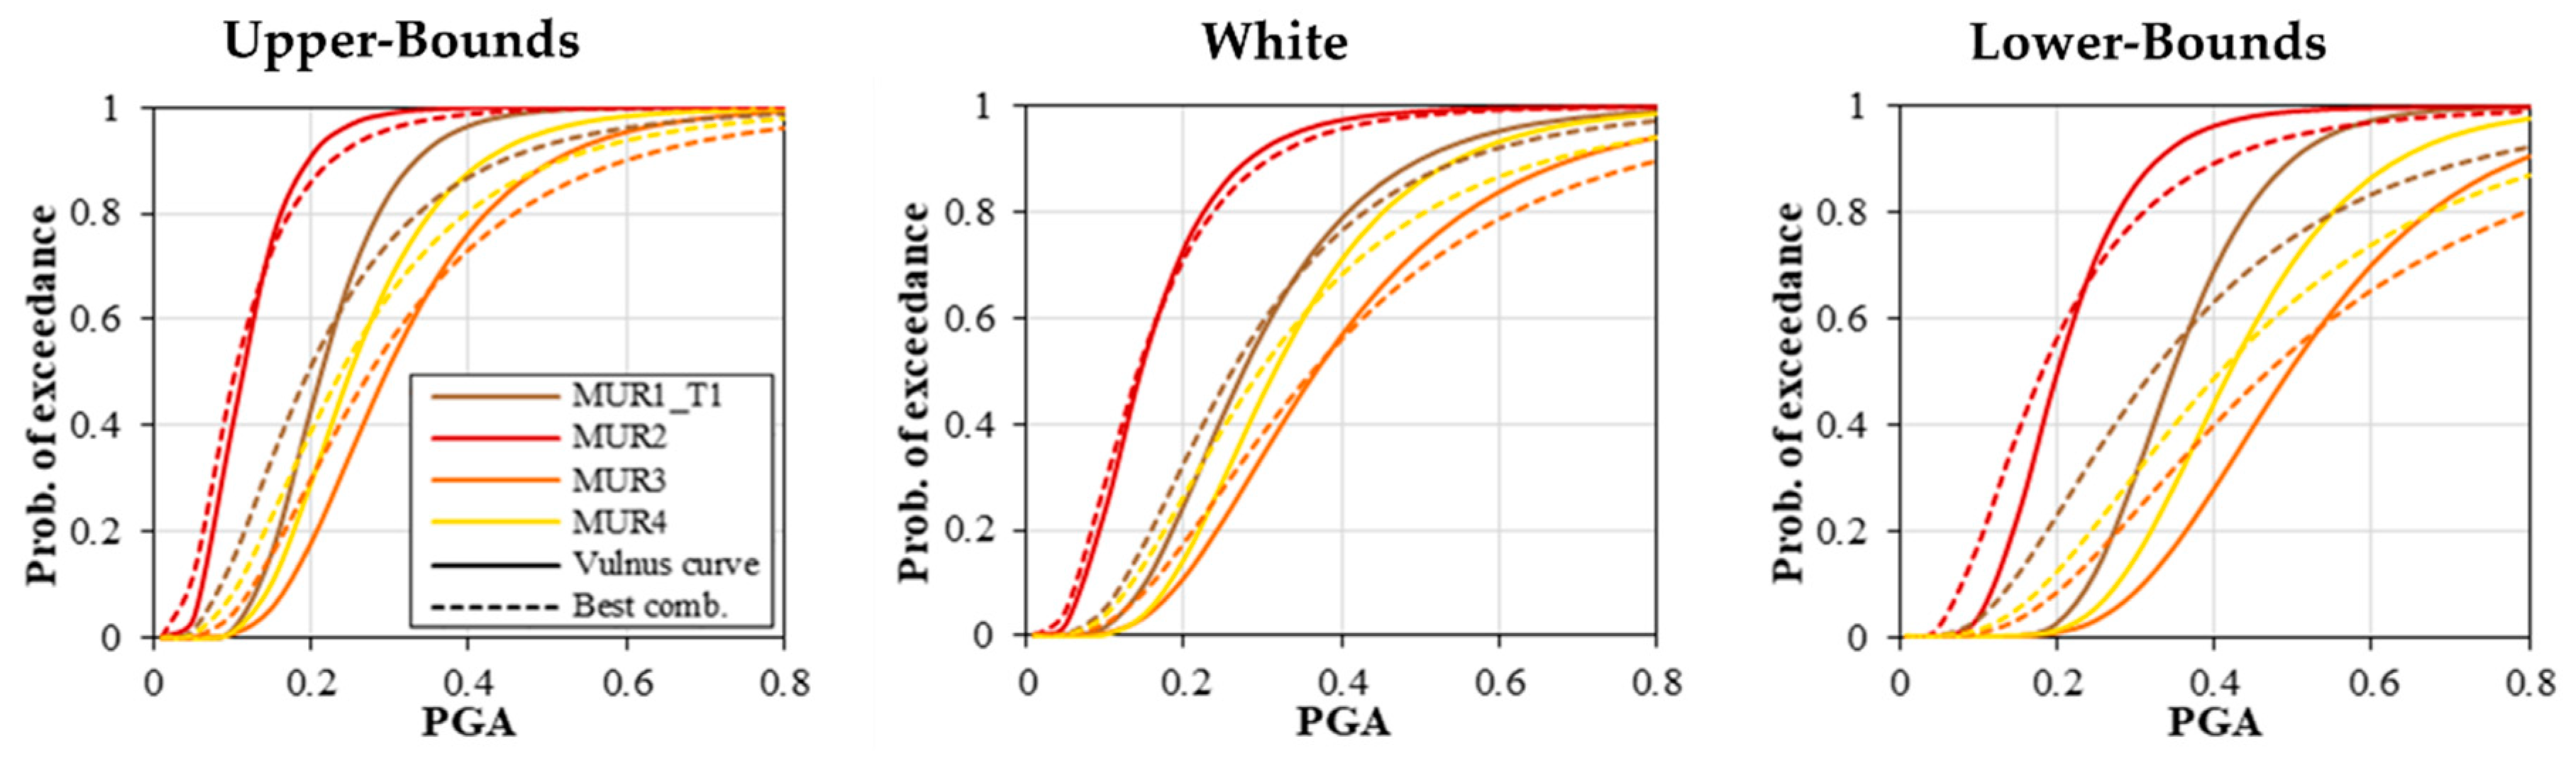
4.3. Extension and Calibration of Fragility Curves

The fragility curves obtained by Vulnus VB 4.0 analysis for the described sample were defined for a damage level DS2-3, i.e., ‘moderate–severe’, according to the classification provided by the EMS-98 [55]. To have a complete picture and, therefore, to calculate seismic damage scenarios for the ordinary built at urban scale, it was necessary to extend the curves to all five damage levels DS1-DS5.
A reference model, derived from the conversion in PGA of the model of Lagomarsino and Cattari [36] through the law of correlation according to Margottini et al. [79], was calibrated on the DS2-3 fragility curves. The following steps [54] were applied:
  • for each vulnerability class (from A—high to F—low) of the macroseismic model a fragility curve corresponding to a DS2-3 damage grade was calculated, to be compared with the mechanical ones obtained through the Vulnus VB 4.0 approach;
  • for each mechanical fragility curve, an optimal linear combination between two curves (DS2-3) of the macroseismic model was made, thanks to the genetic algorithm NSGA-II (i.e., Non-dominated Sorting Genetic Algorithm [54]), aimed at minimizing the absolute and relative errors;
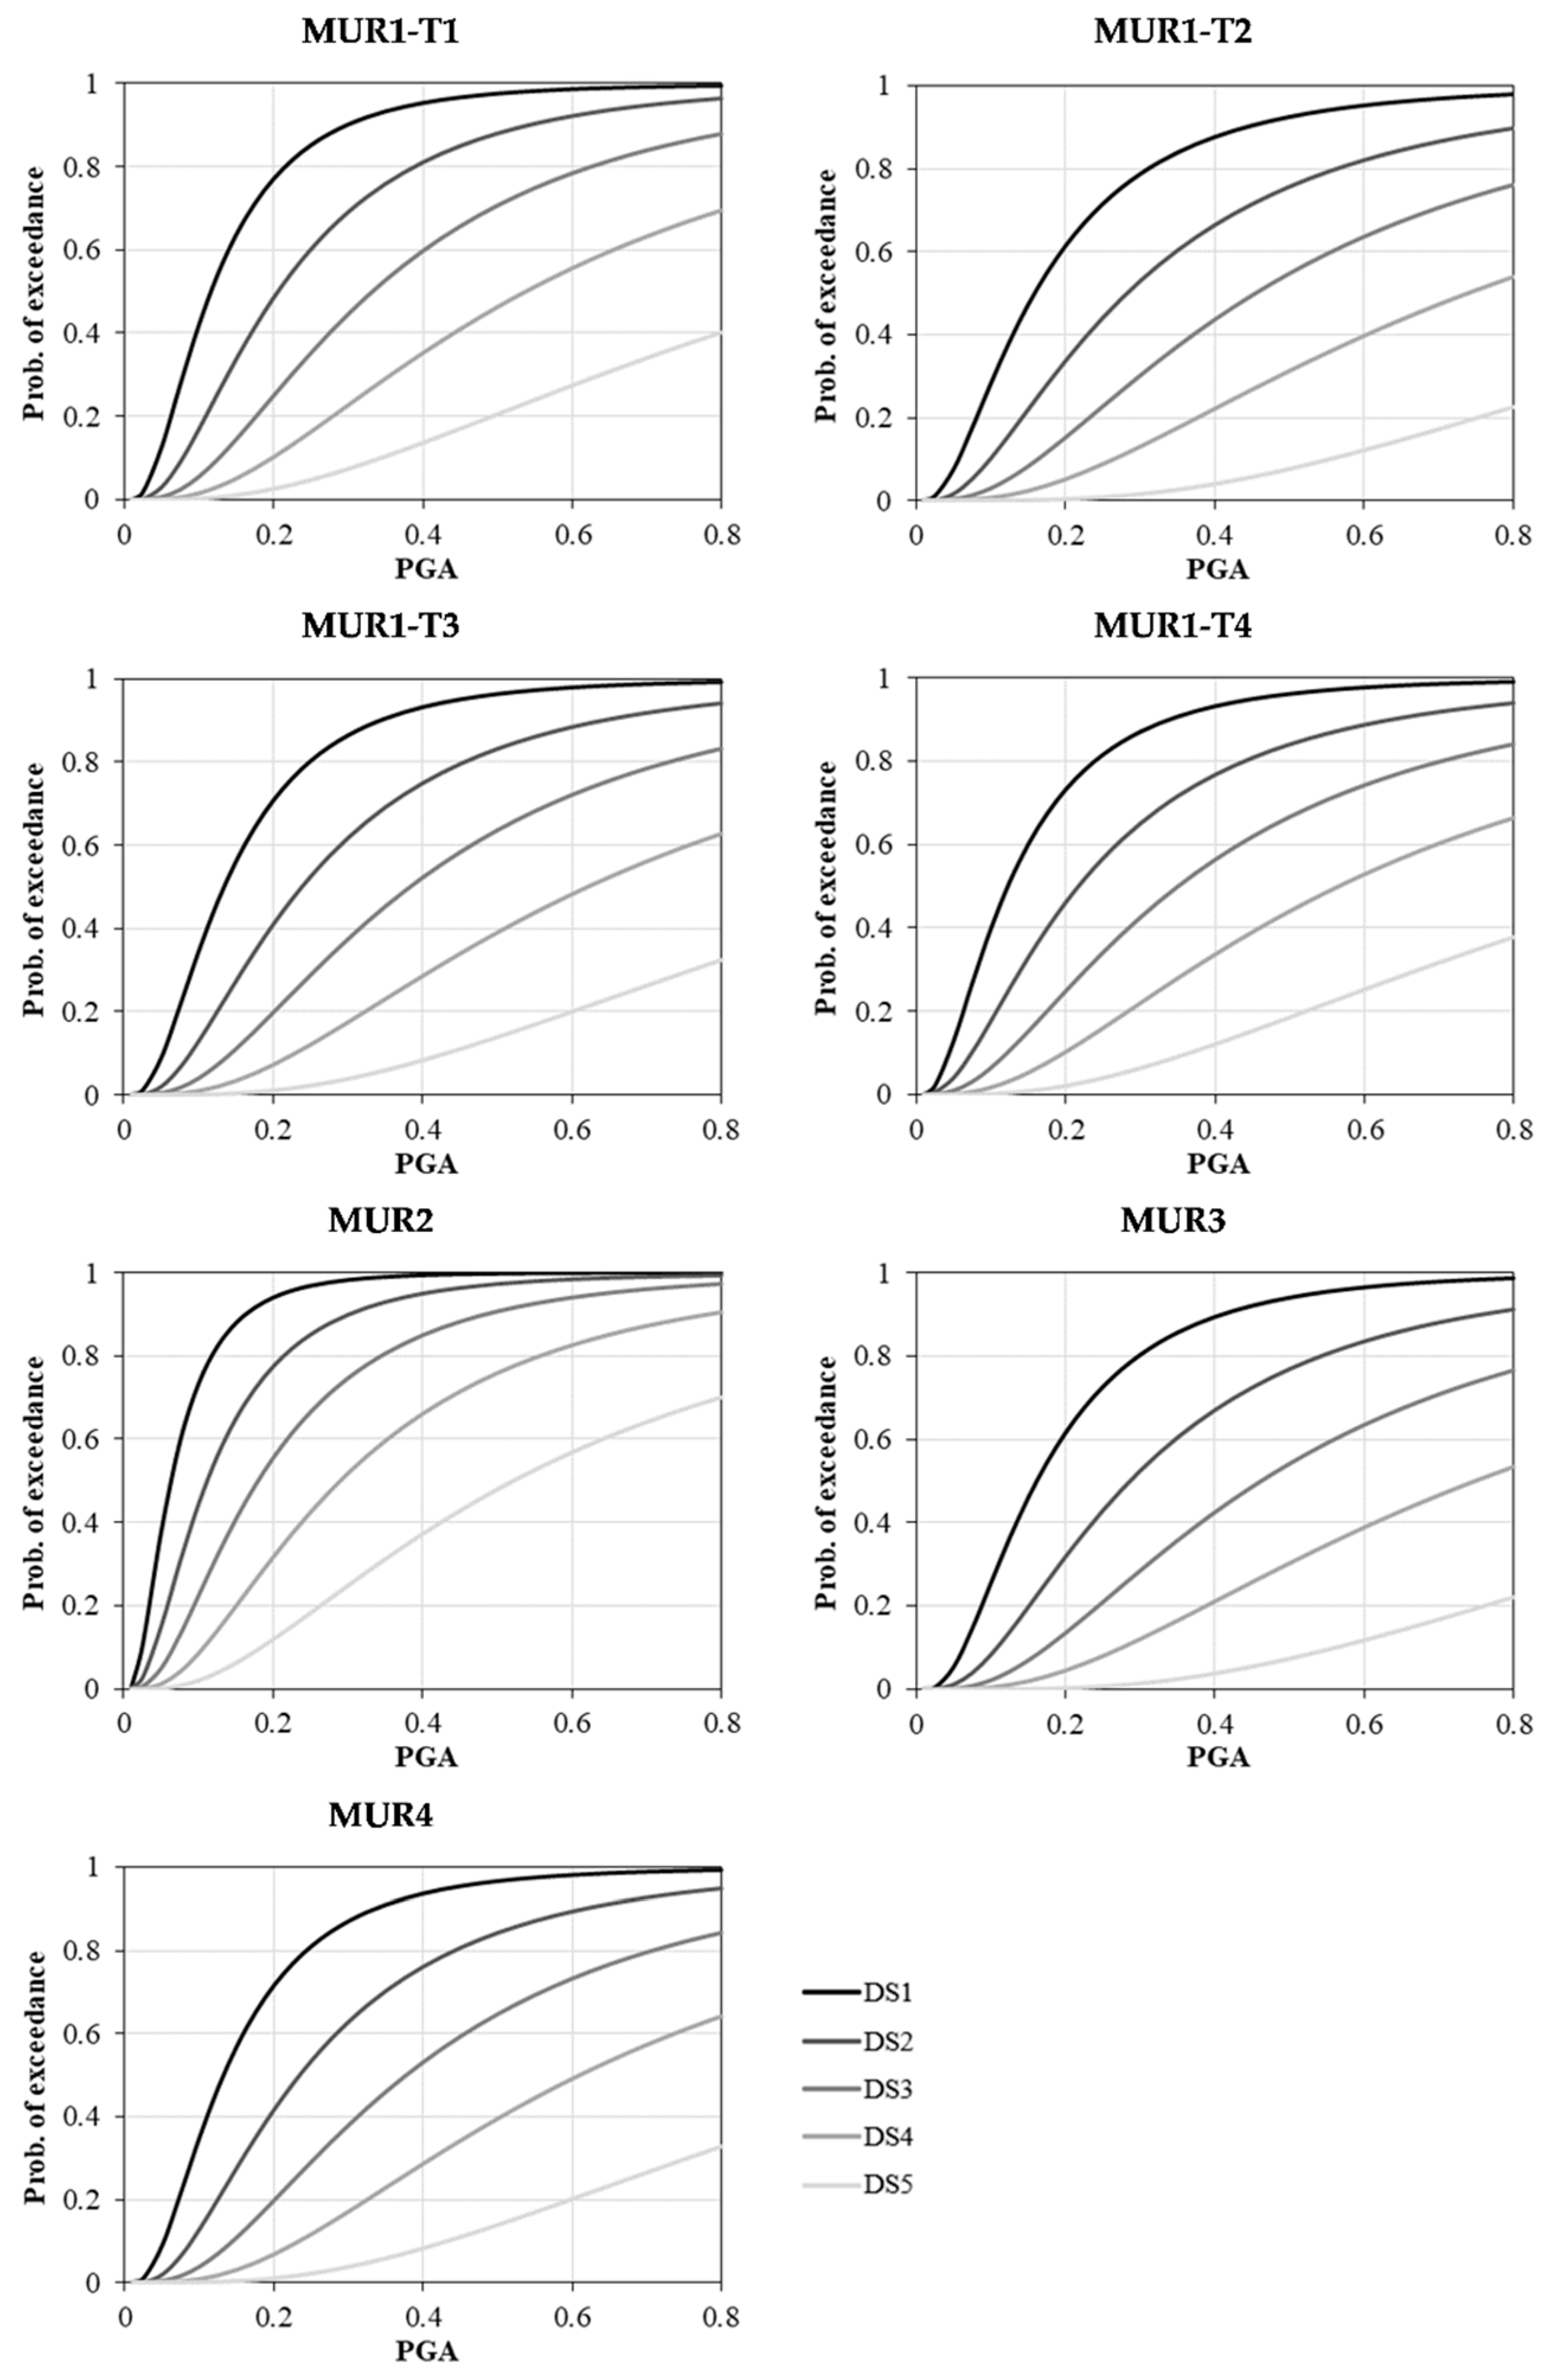
  • the combination coefficients associated to the different classes of vulnerability were used to generate a further set of fragility curves, associated to the five levels of damage (DS1–DS5) for the building types here analyzed.
Table 10 reports the results of that calibration, i.e., the percentages of linear combination of the classes of the macroseismic model, able to obtain the set of fragility curves for the five levels of damage.
According to the EMS-98 classification, unreinforced masonry buildings (URM) belong to the first four classes (A–D), based on type of structure from rubble stone (A) to massive stone (C) or URM with RC floors (C–D). Nevertheless, it should be noted that solid or hollow clay brick masonry (with or without mortar repointing) which characterize the MUR1, MUR3, and MUR4 types are not included among the specific cases considered by the EMS-98 [6].
With regard to the ‘White’ combinations, almost all building types (except for MUR2), belong to the C–D range. Consistently, the Upper-Bounds curves are shifted to the left to the B–C range, whereas the Lower Bounds curves are more displaced to the right to D class. The comparison between the Vulnus VB 4.0 mechanical curves (local mechanical–heuristic model) and the calibrated macroseismic fragility curves DS2-3 shows some differences in terms of dispersion, due to their different nature (the first derived in a mechanical way and the second obtained by expert judgment). The standard deviation of the calibrated curves is, in fact, higher, thus reflecting the greater dispersion typical of the macroseismic approach and consistent with empirical observations on the seismic behavior of pseudo-plasticity of masonry structures, but different from that of mechanical curves. This effect is more evident with Lower-Bounds (Figure 15).

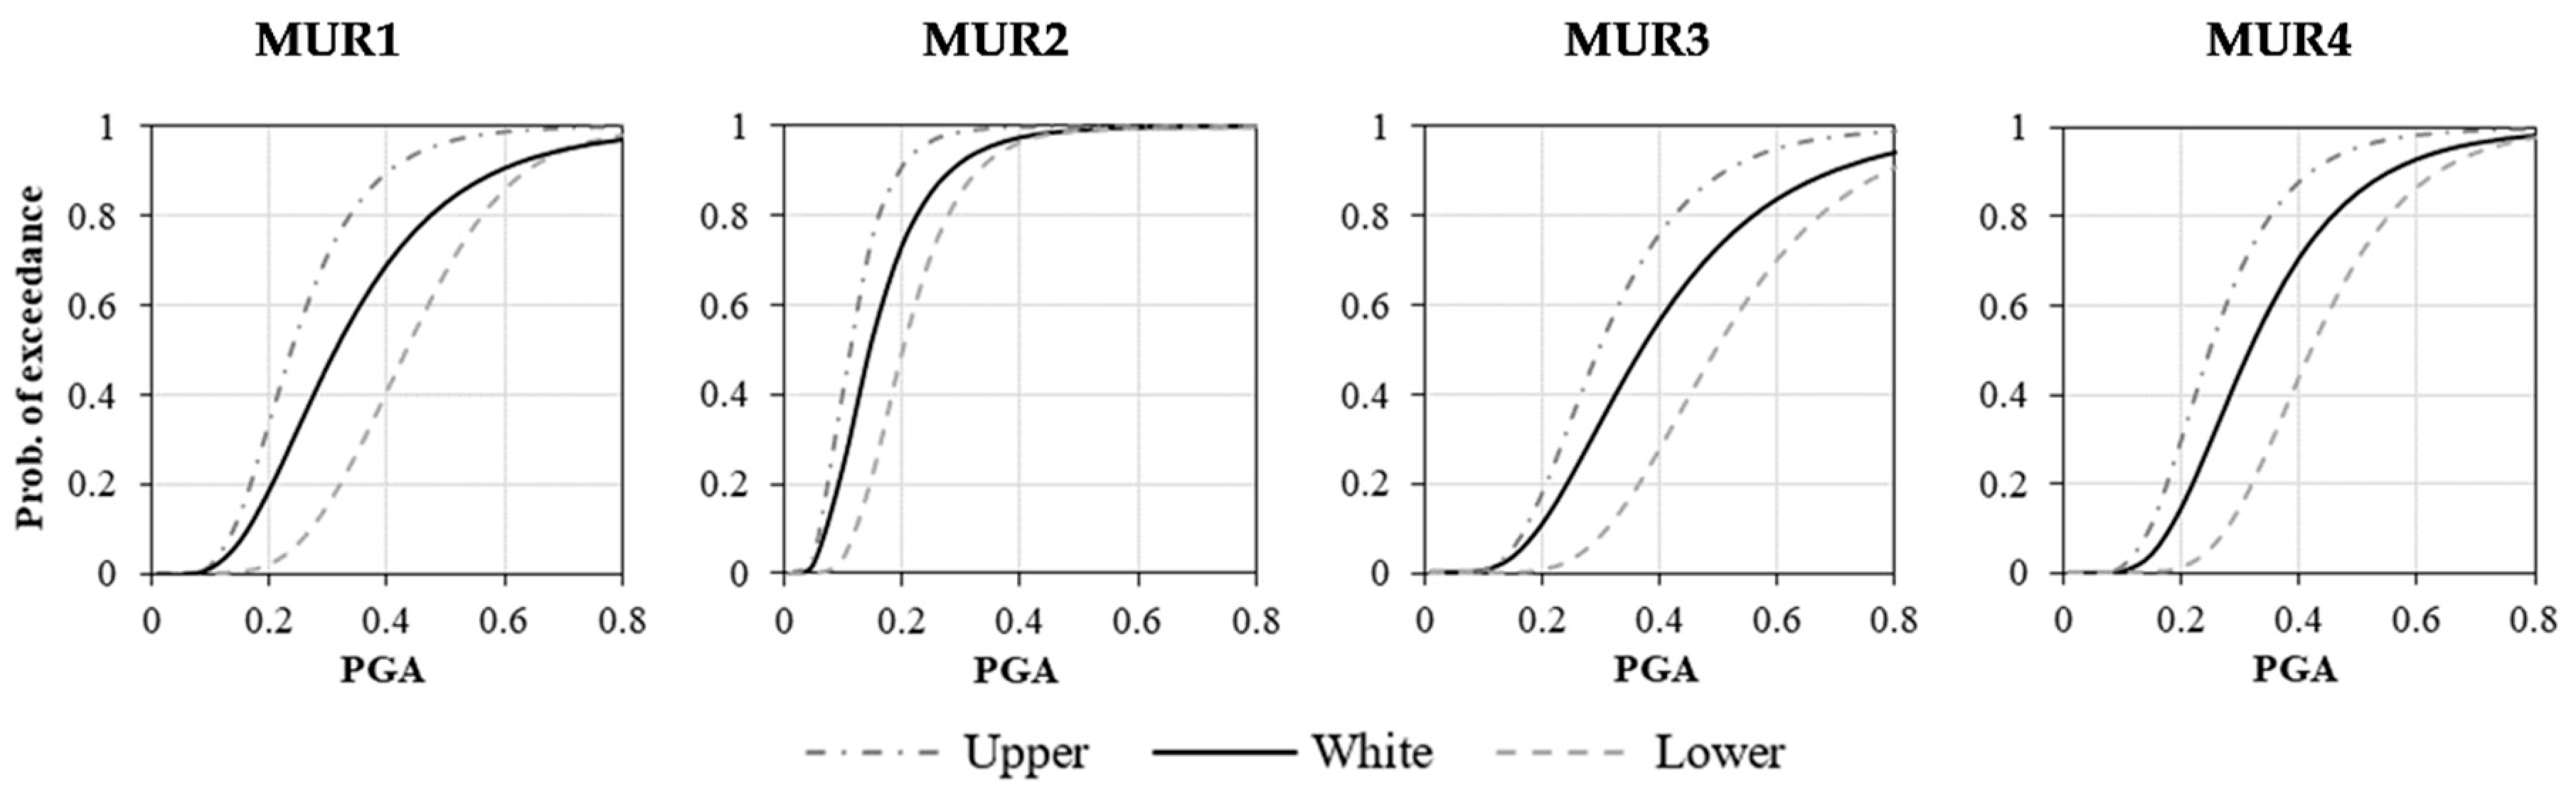
4.4. LUW Fragility Model

The further extension to a territorial scale requires a model valid at a statistical level for the whole built stock examined. In such a connection, fragility curves with greater dispersion than the deterministic case (in accordance with empirical observations related to damage detected because of past seismic events) can be used.
To obtain a single model that best describes the behavior of the different types of buildings on a territorial scale, the three heuristic–mechanical models can be combined, so that the main information provided by the White, Lower and Upper Bounds fragility curves can be included.
The curves of the three models compose a single model called LUW (Lower–Upper–White), built as follows [54]:
  • between 0% and 2.5% of the White probability, the LUW is considered totally as the Upper-Bounds curve;
  • between 2.5% and 50% of the White probability, the LUW is assumed as a linear combination of the Upper-Bounds (from 100% to 0%) and the White (from 0% to 100%);
  • between 50% and 97.5% of the White probability, the LUW is obtained combining linearly the White (from 100% to 0%) and the Lower-Bounds (from 0% to 100%);
  • above 97.5% of the White probability, the LUW is given at 100% by the Lower-Bounds curve.
The reason underlying these choices was to increase the dispersion of the mechanical model, while still maintaining the mean value of the White one. Table 11 lists the parameters that define the curves thus obtained for all the building types and for the five levels of damage; Figure 16 shows the graphs of the LUW sets.
As already observed, the most vulnerable type for ordinary masonry buildings in Pordenone is MUR2. In general, for equal PGA and damage grade, the highest damage probability is obtained for the oldest buildings designed without seismic regulation. With regard to the four historical subtypes, the most vulnerable is MUR1-T1, with 20–40% that reach DS5, while the least vulnerable is MUR1-T2; MUR-T3 curves have a greater slope, while MUR-T4 reaches a greater percentage for DS5 level and has smaller intervals between one curve and another. Lastly, as for the most recent types MUR3 and MUR4 it can be seen that the first one is the least vulnerable, whereas MUR4 has higher slopes for lower damage levels, and shorter intervals, thus reaching higher probability for DS4 and DS5 damage levels.

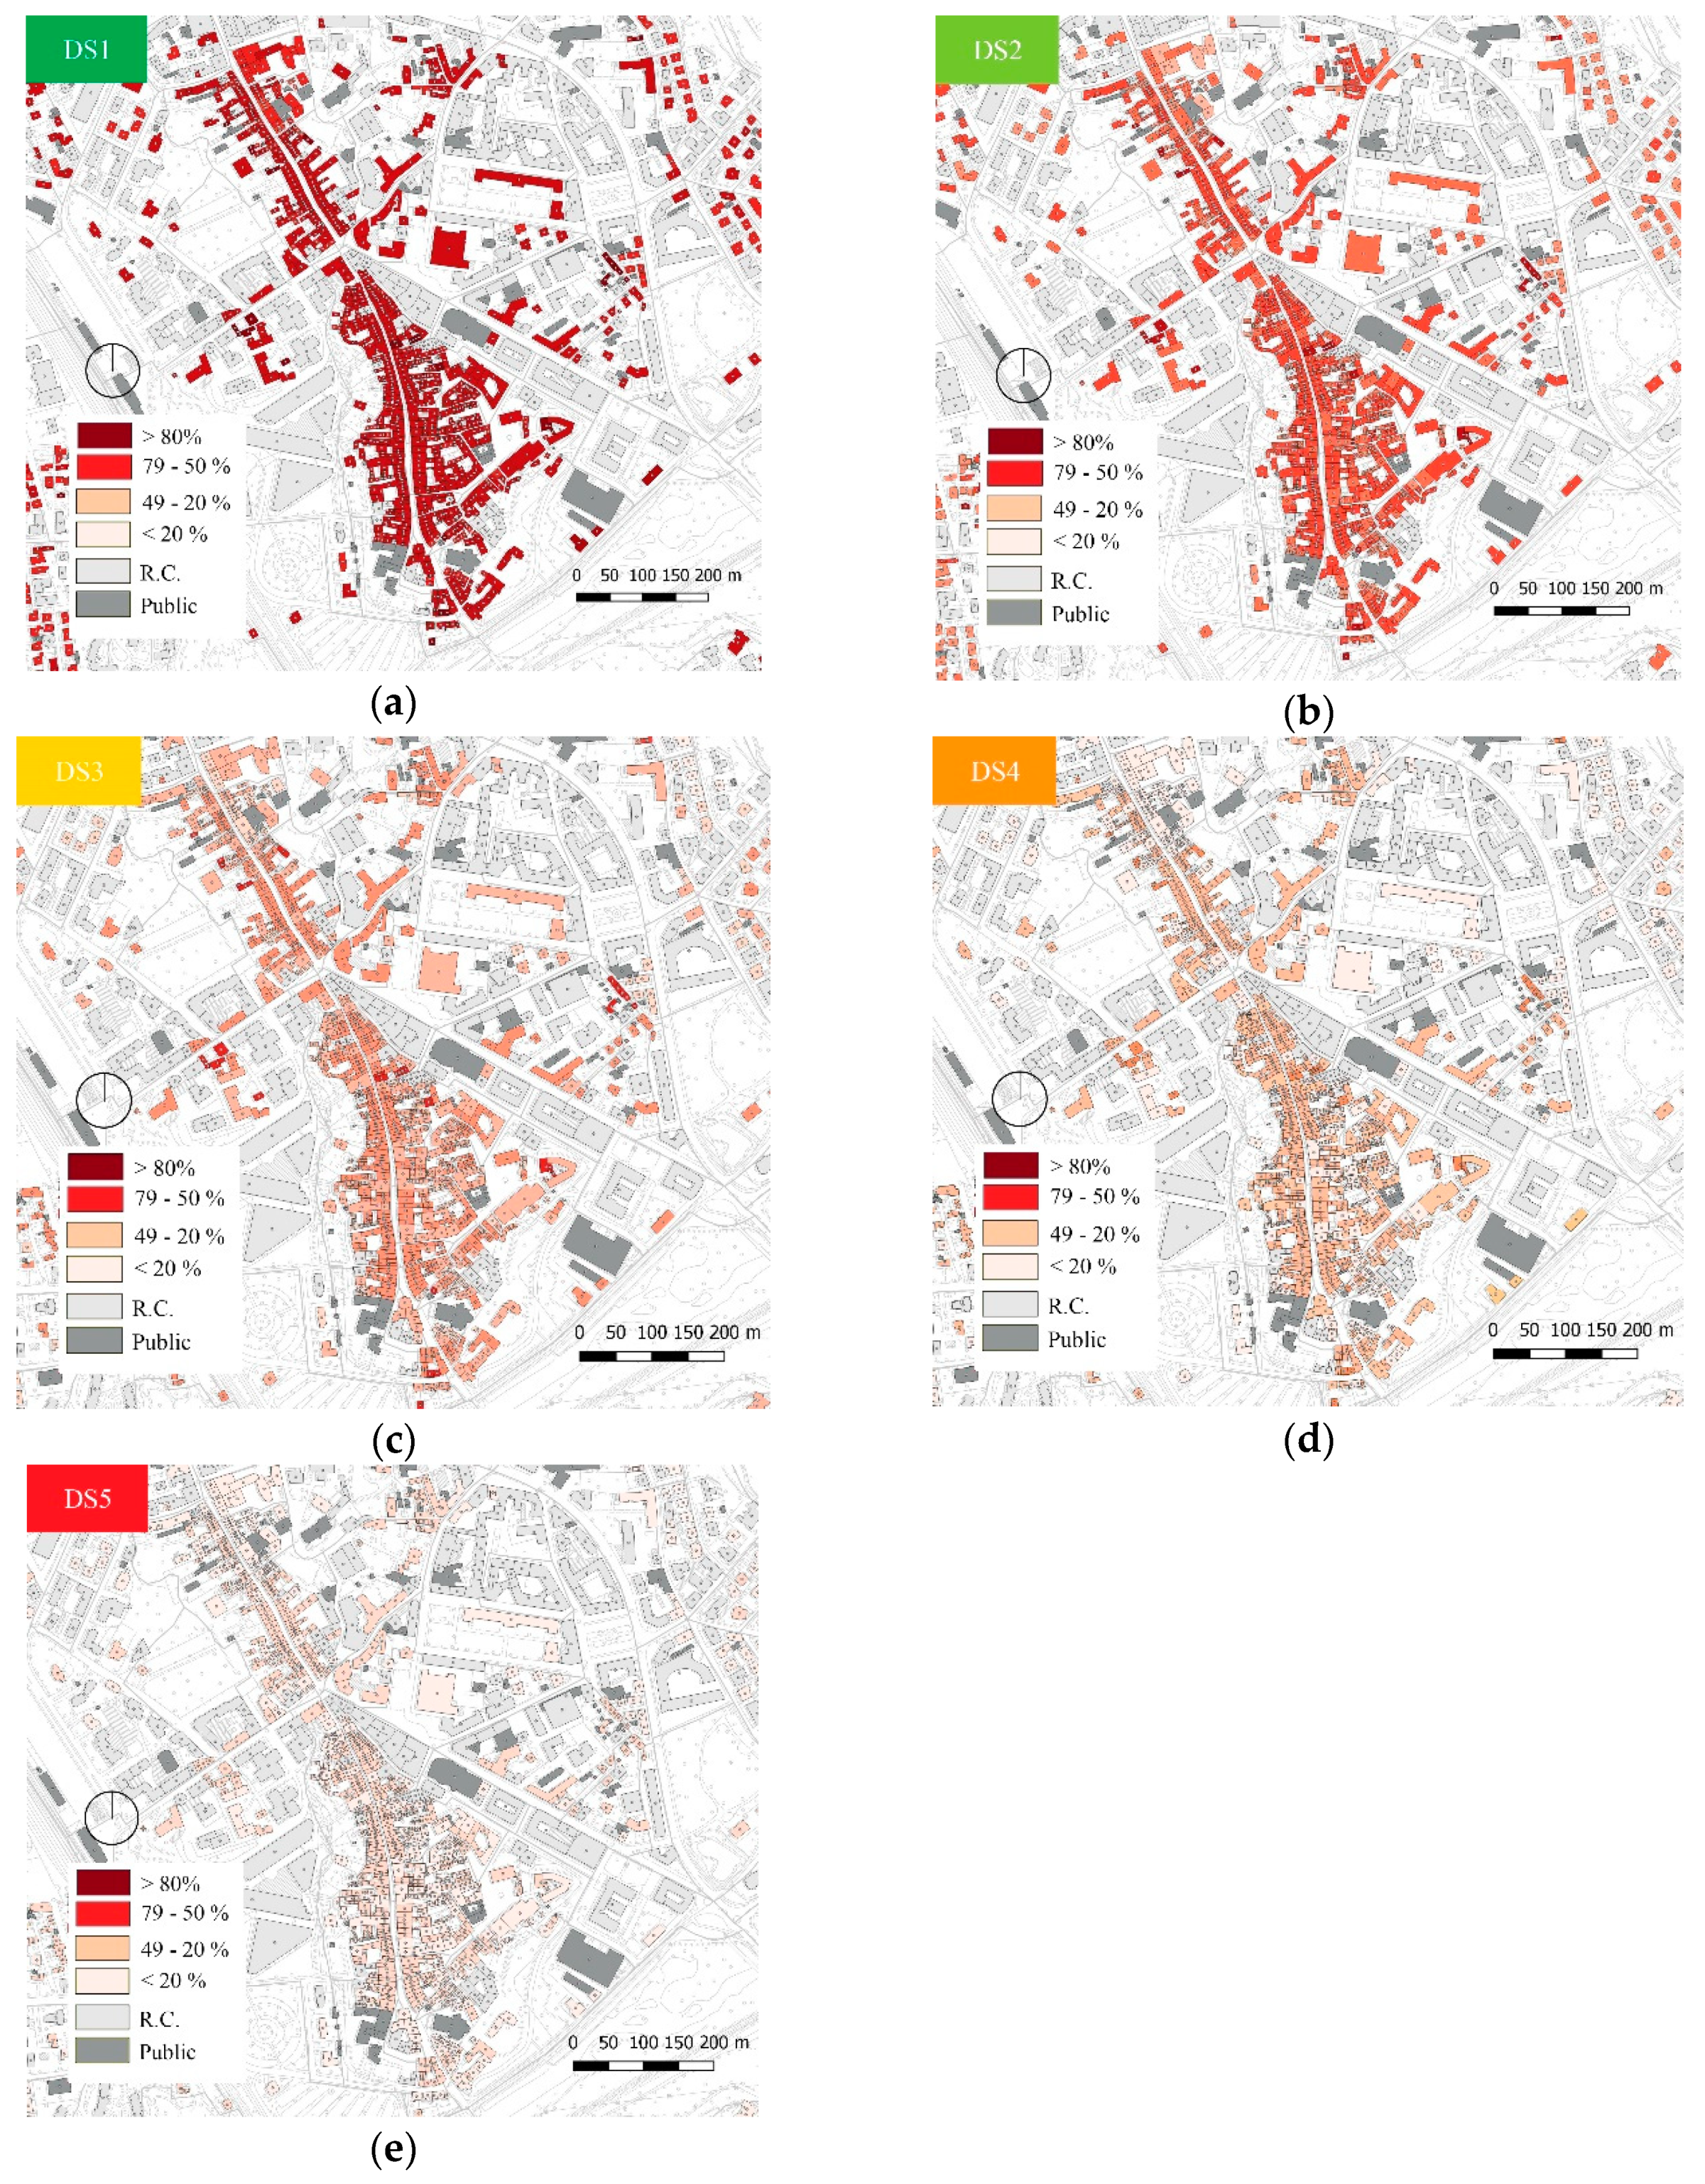
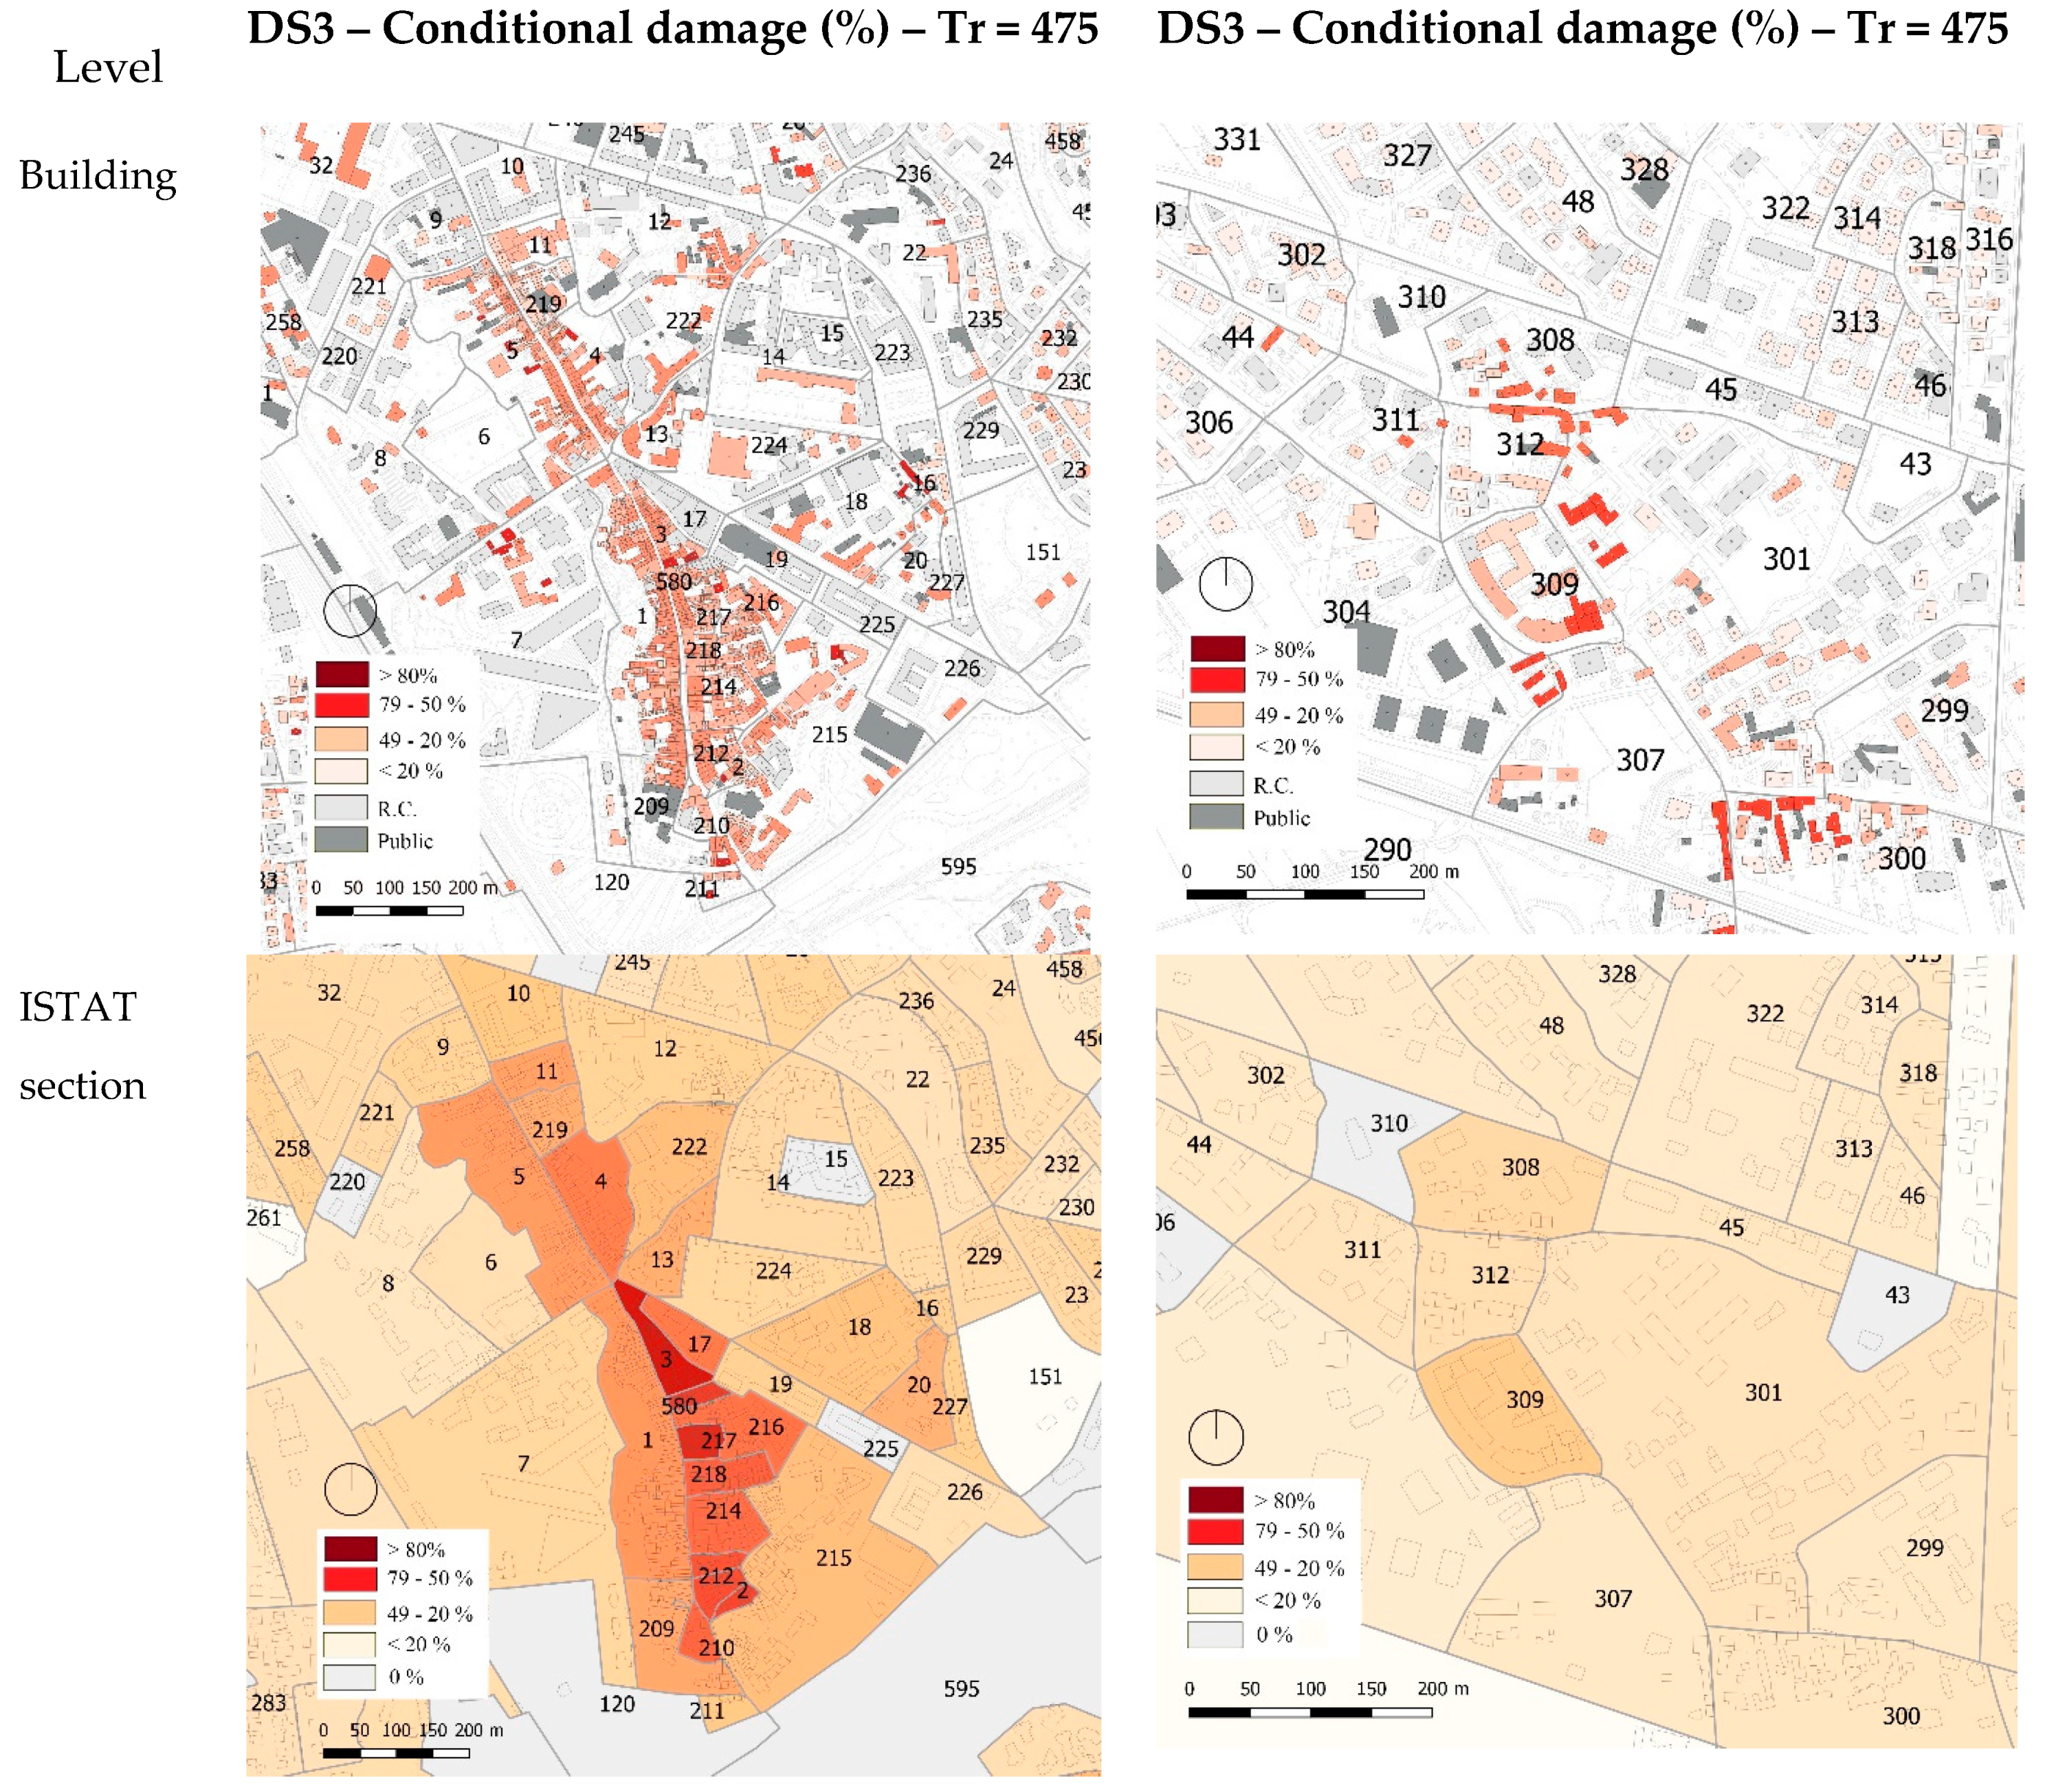
5. Seismic Damage Maps

The fragility curves presented in Section 4 define a vulnerability model for the ordinary masonry buildings of Pordenone. The final step of this work would be the combination of this vulnerability with the exposure assessed through the CARTIS approach (Section 3) and the seismic hazard of the town, in order to evaluate seismic damage and risk, through GIS maps.
The damage maps represent the probability of reaching or overcoming a certain damage state, thus providing information about which buildings, areas or districts are more prone to seismic damage. Furthermore, risk maps can show the possible economic losses in terms of different indicators, such as repair or reconstruction costs, number of unusable buildings/dwellings, victims, injuries, and homeless people.
This information can be very important for carrying out targeted investigations and defining priority criteria for seismic retrofit interventions. Specifically, these tools can be used for prevention and mitigation of seismic risk by authorities and institutions to manage resources in the aftermath of an earthquake and to select effective emergency measures and evacuation plans.

5.1. Conditional Damage

Conditional damage expresses the expected damage for a specific ground motion (e.g., PGA). The significant values of PGA for Pordenone were obtained from the parameters given by the Italian seismic code [80,81,82], i.e.,: values of ag (maximum horizontal acceleration), FO (maximum value of the amplification factor for the horizontal acceleration spectrum), and Tc* (reference value for determining the beginning of the plateau in the horizontal acceleration spectrum). Starting from a mesh of 10751 points that cover the whole Italian territory and computing nine return periods (Tr = 30, 50, 72, 101, 140, 201, 475, 975, 2475 years), the values expected for Pordenone were selected (Table 12).
These values were combined with the parameters of the morphological and stratigraphic characteristics that determine the local response (Table 13).
According to the Geological Report for Pordenone [83] and to the seismic microzonation study [84], Pordenone refers to three soil categories: the northern area can be associated with a type C soil (mostly gravel with depth of a few tens of meters); the historical center and the area south to the center to a type D (predominance of sands and clays); the remaining southernmost part of the town to a type E.
These variations can activate site effects of seismic action amplification and different PGAs for each area, or district, or even for each single ISTAT section.
Now that the seismic hazard has been defined for all the different areas, i.e., every point in Pordenone can be associated with a particular value of PGA, it is possible to estimate the damage and, consequently, create damage maps. This can be done by associating to each residential masonry type the fragility results provided by the fragility set (Section 4) evaluated for that predicted PGA. Results are given in terms of probability of occurrence of the different damage states, and can be done for all the possible return periods Tr.
In this work, conditional damage maps for a Tr = 475 years were created, as reference for the Life Protection Limit State (SLV) (see Table 12). Figure 17 shows the results obtained for all the damage states, from DS1 (slight damage) to DS5 (collapse).
Table 14 shows the conditional damage results (DS1-DS5) for the CARTIS district 1 (Tr = 475 and soil C). The probability of exceedance of the five damage grades was calculated for each CARTIS building type and subtype of the old town. The DS1 (slight damage) values exceed 75% for all the sample, the DS3 (moderate-severe damage) reaches the highest percentages (more than 40%) for MUR1-T1 and MUR2 types, while the DS5 (collapse) is on average around 4–5%, except for the most vulnerable type (22%).
This procedure can be made not only at a single-building level, but also considering wider areas (such as ISTAT sections or even CARTIS districts). A mean value of probability of reaching a specific damage state can be calculated with respect to the vulnerability, but also the number and the extension of buildings inside the area of interest. As an example, Figure 18 shows the results obtained for the damage state DS3, thus increasing the scale of the area from single buildings to ISTAT sections and, finally, to CARTIS districts.

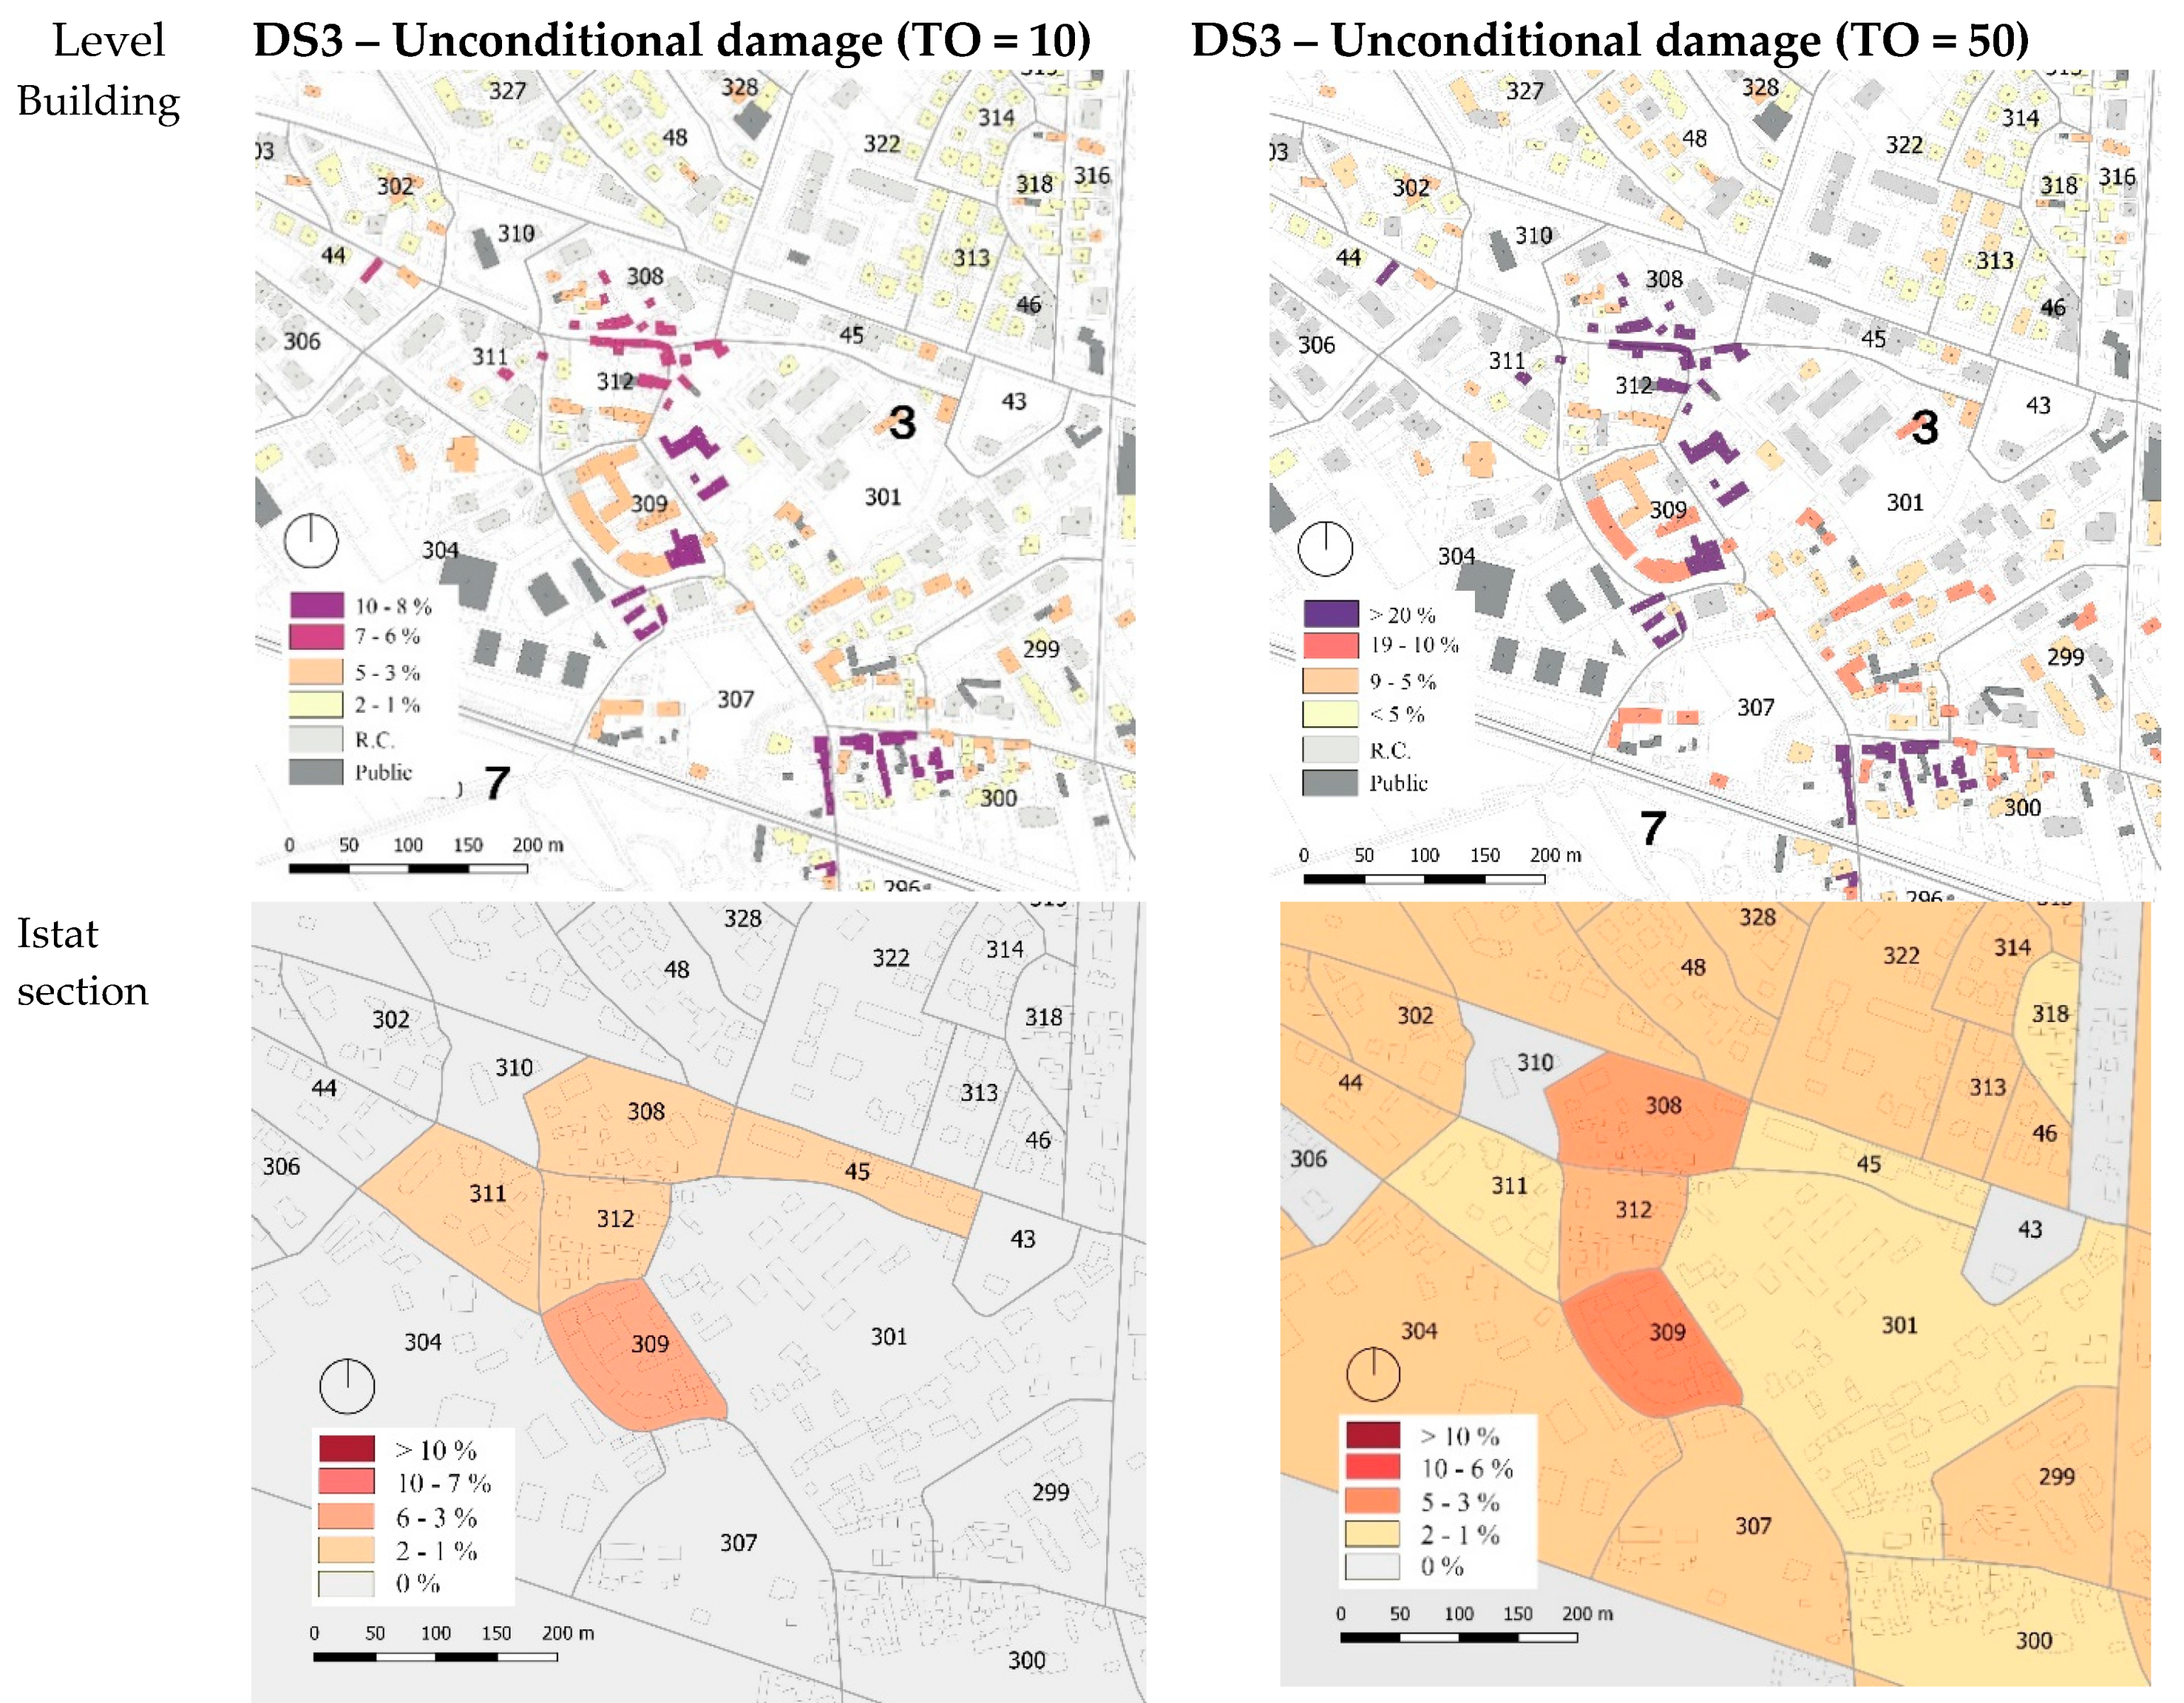
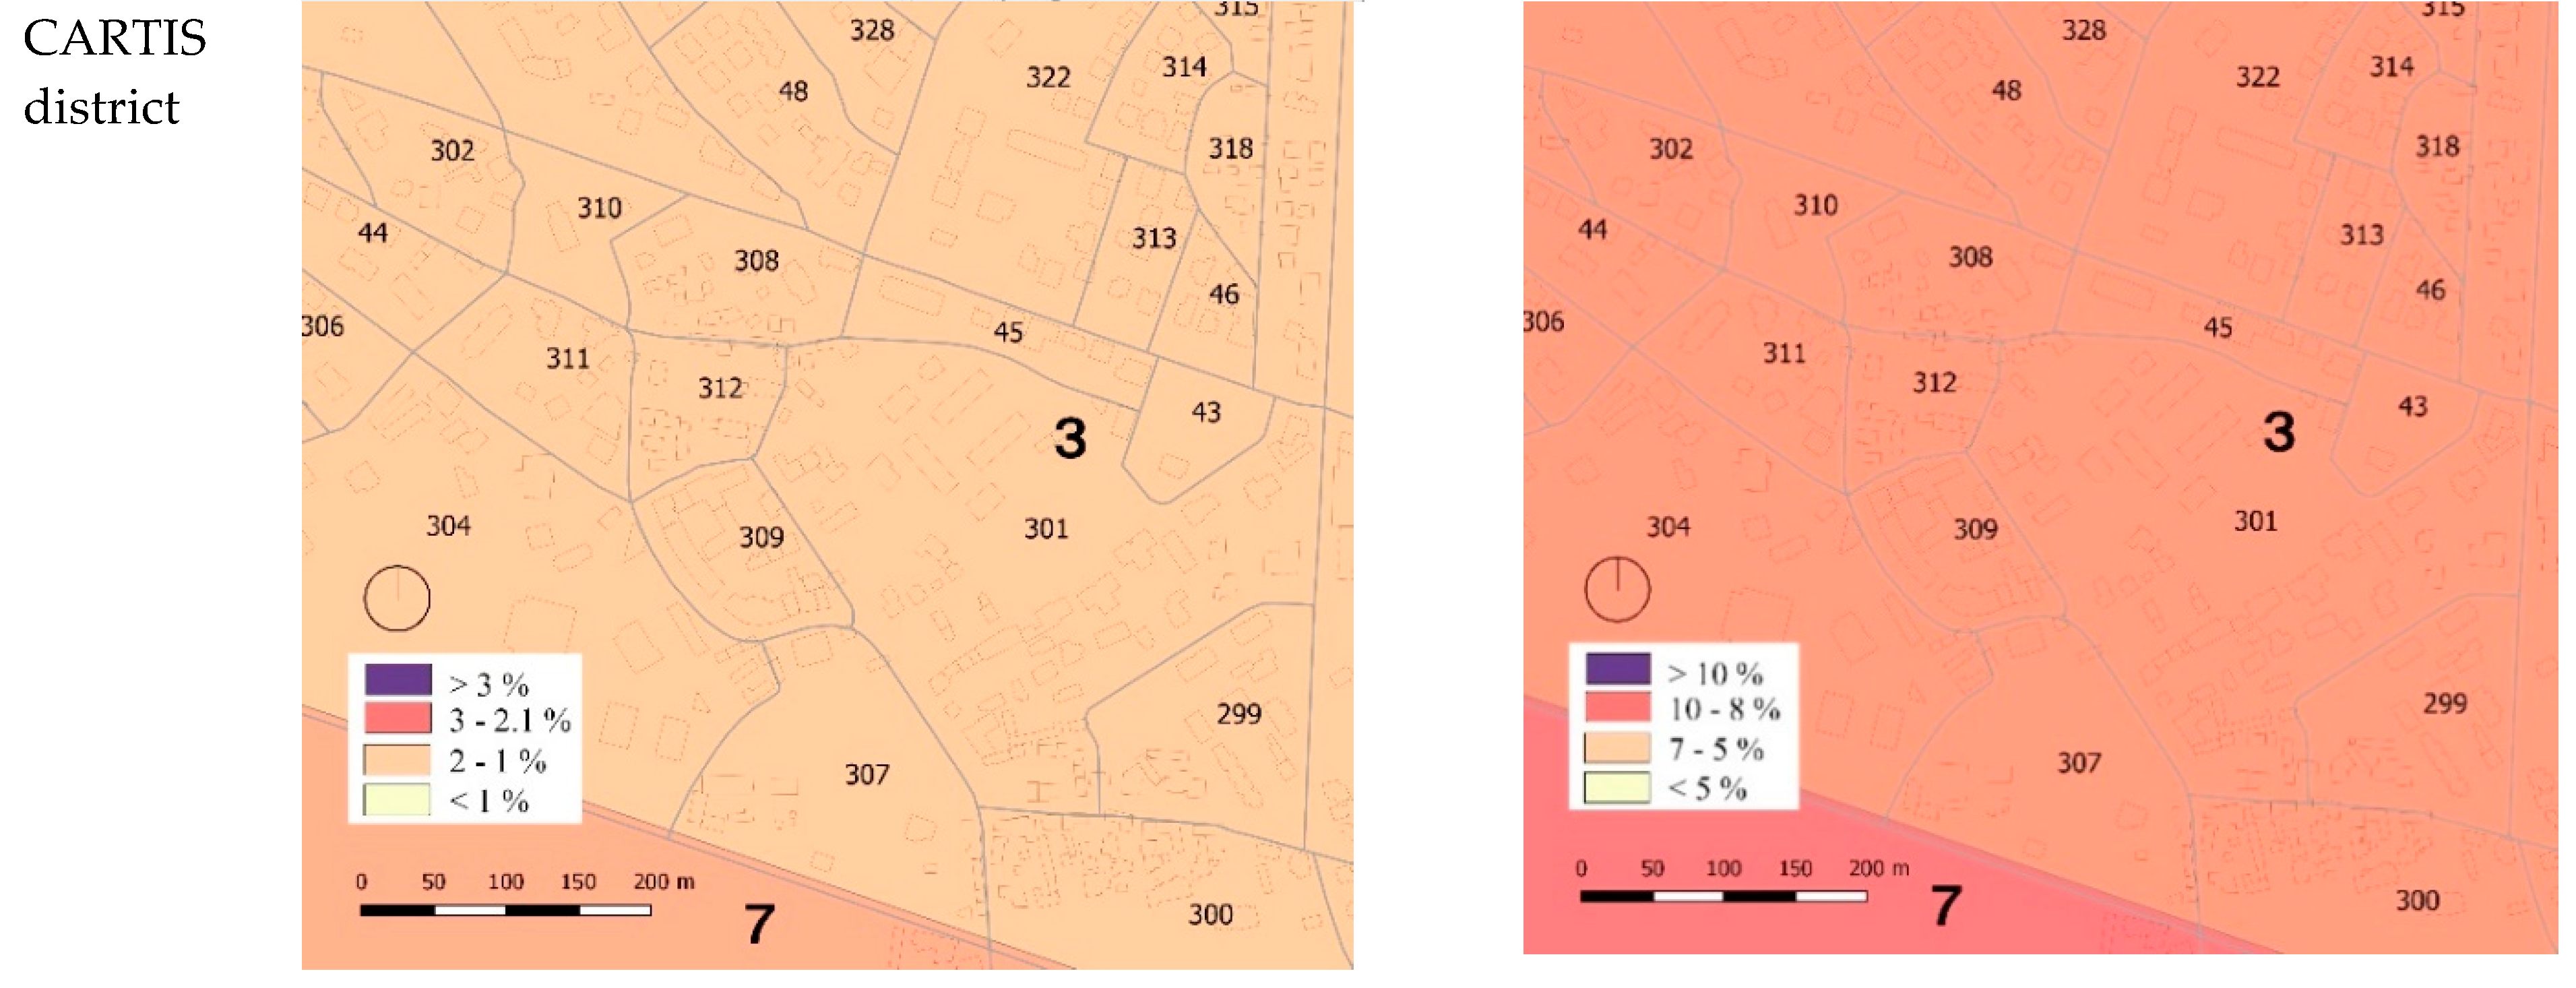
5.2. Unconditional Damage

Unconditional damage represents the combination of multiple levels of ground motion (for various Tr values), taking into account the annual probability of reaching those levels. When computing unconditional damage, an observation time window is chosen, and all the possible earthquake scenarios that can occur in the selected time are taken into consideration. Every scenario must be included with its own probability of occurrence in the observation time, as follows:
p = 1     e ( T o T r )
where p is the probability that an earthquake with return period Tr occurs in the observation time To. In this work, observation times To of 10 and 50 years were applied. Table 15 and Table 16 show the unconditional damage results for both years and soil type C. As for the conditional maps, different urban level can be represented, such as single buildings, ISTAT sections and CARTIS districts. Figure 19 shows the unconditional damage maps for a damage state DS3, for both To of 10 and 50 years, and for the three urban levels mentioned above.

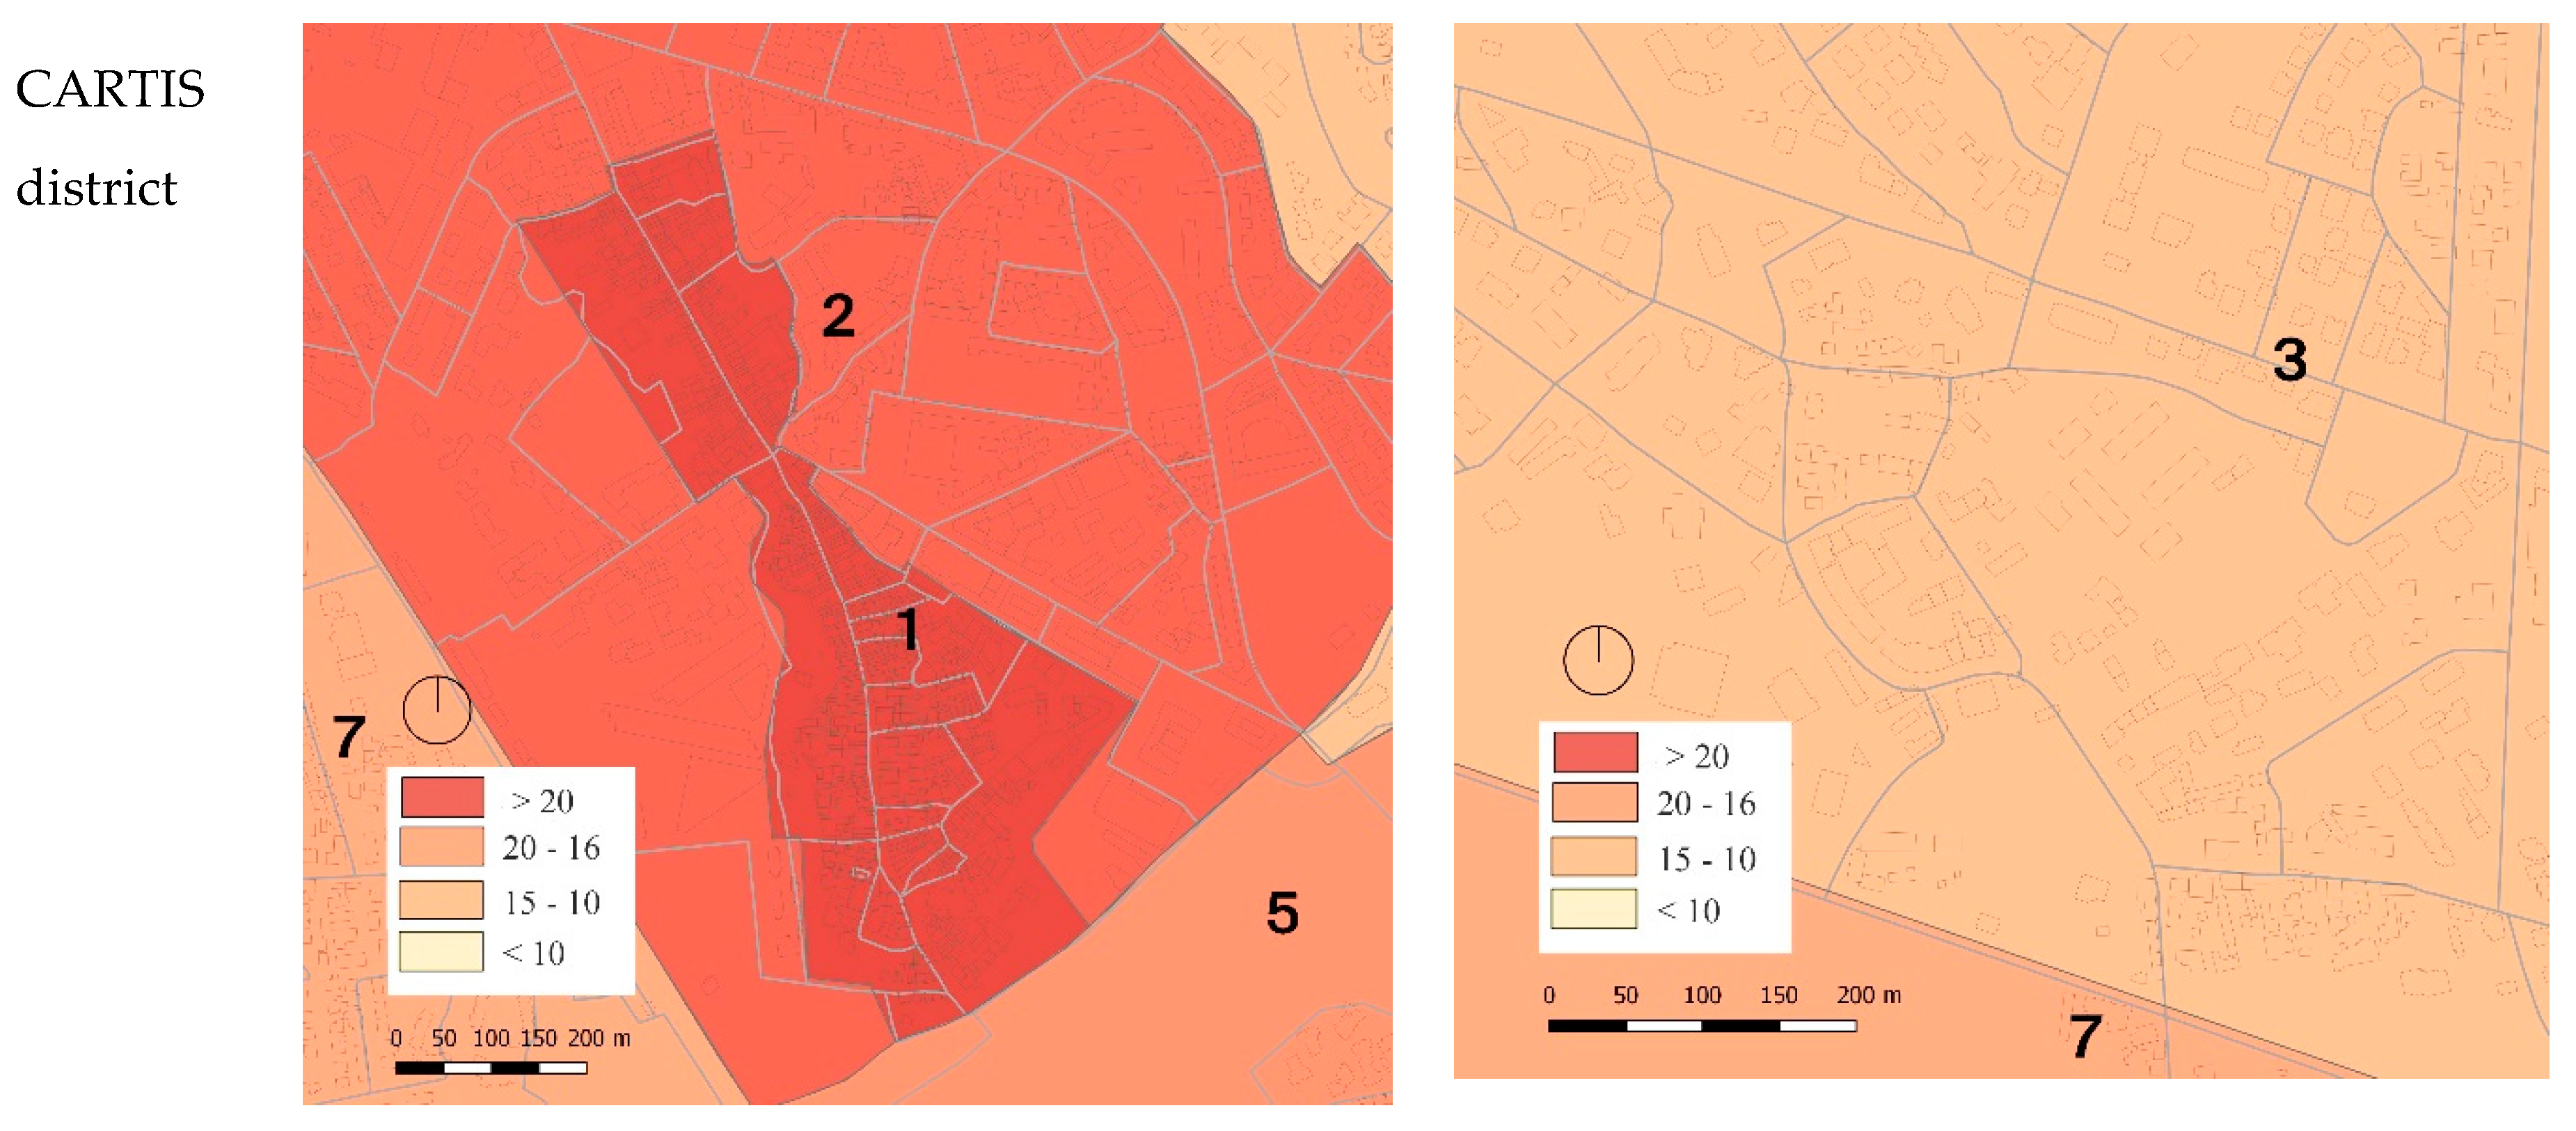
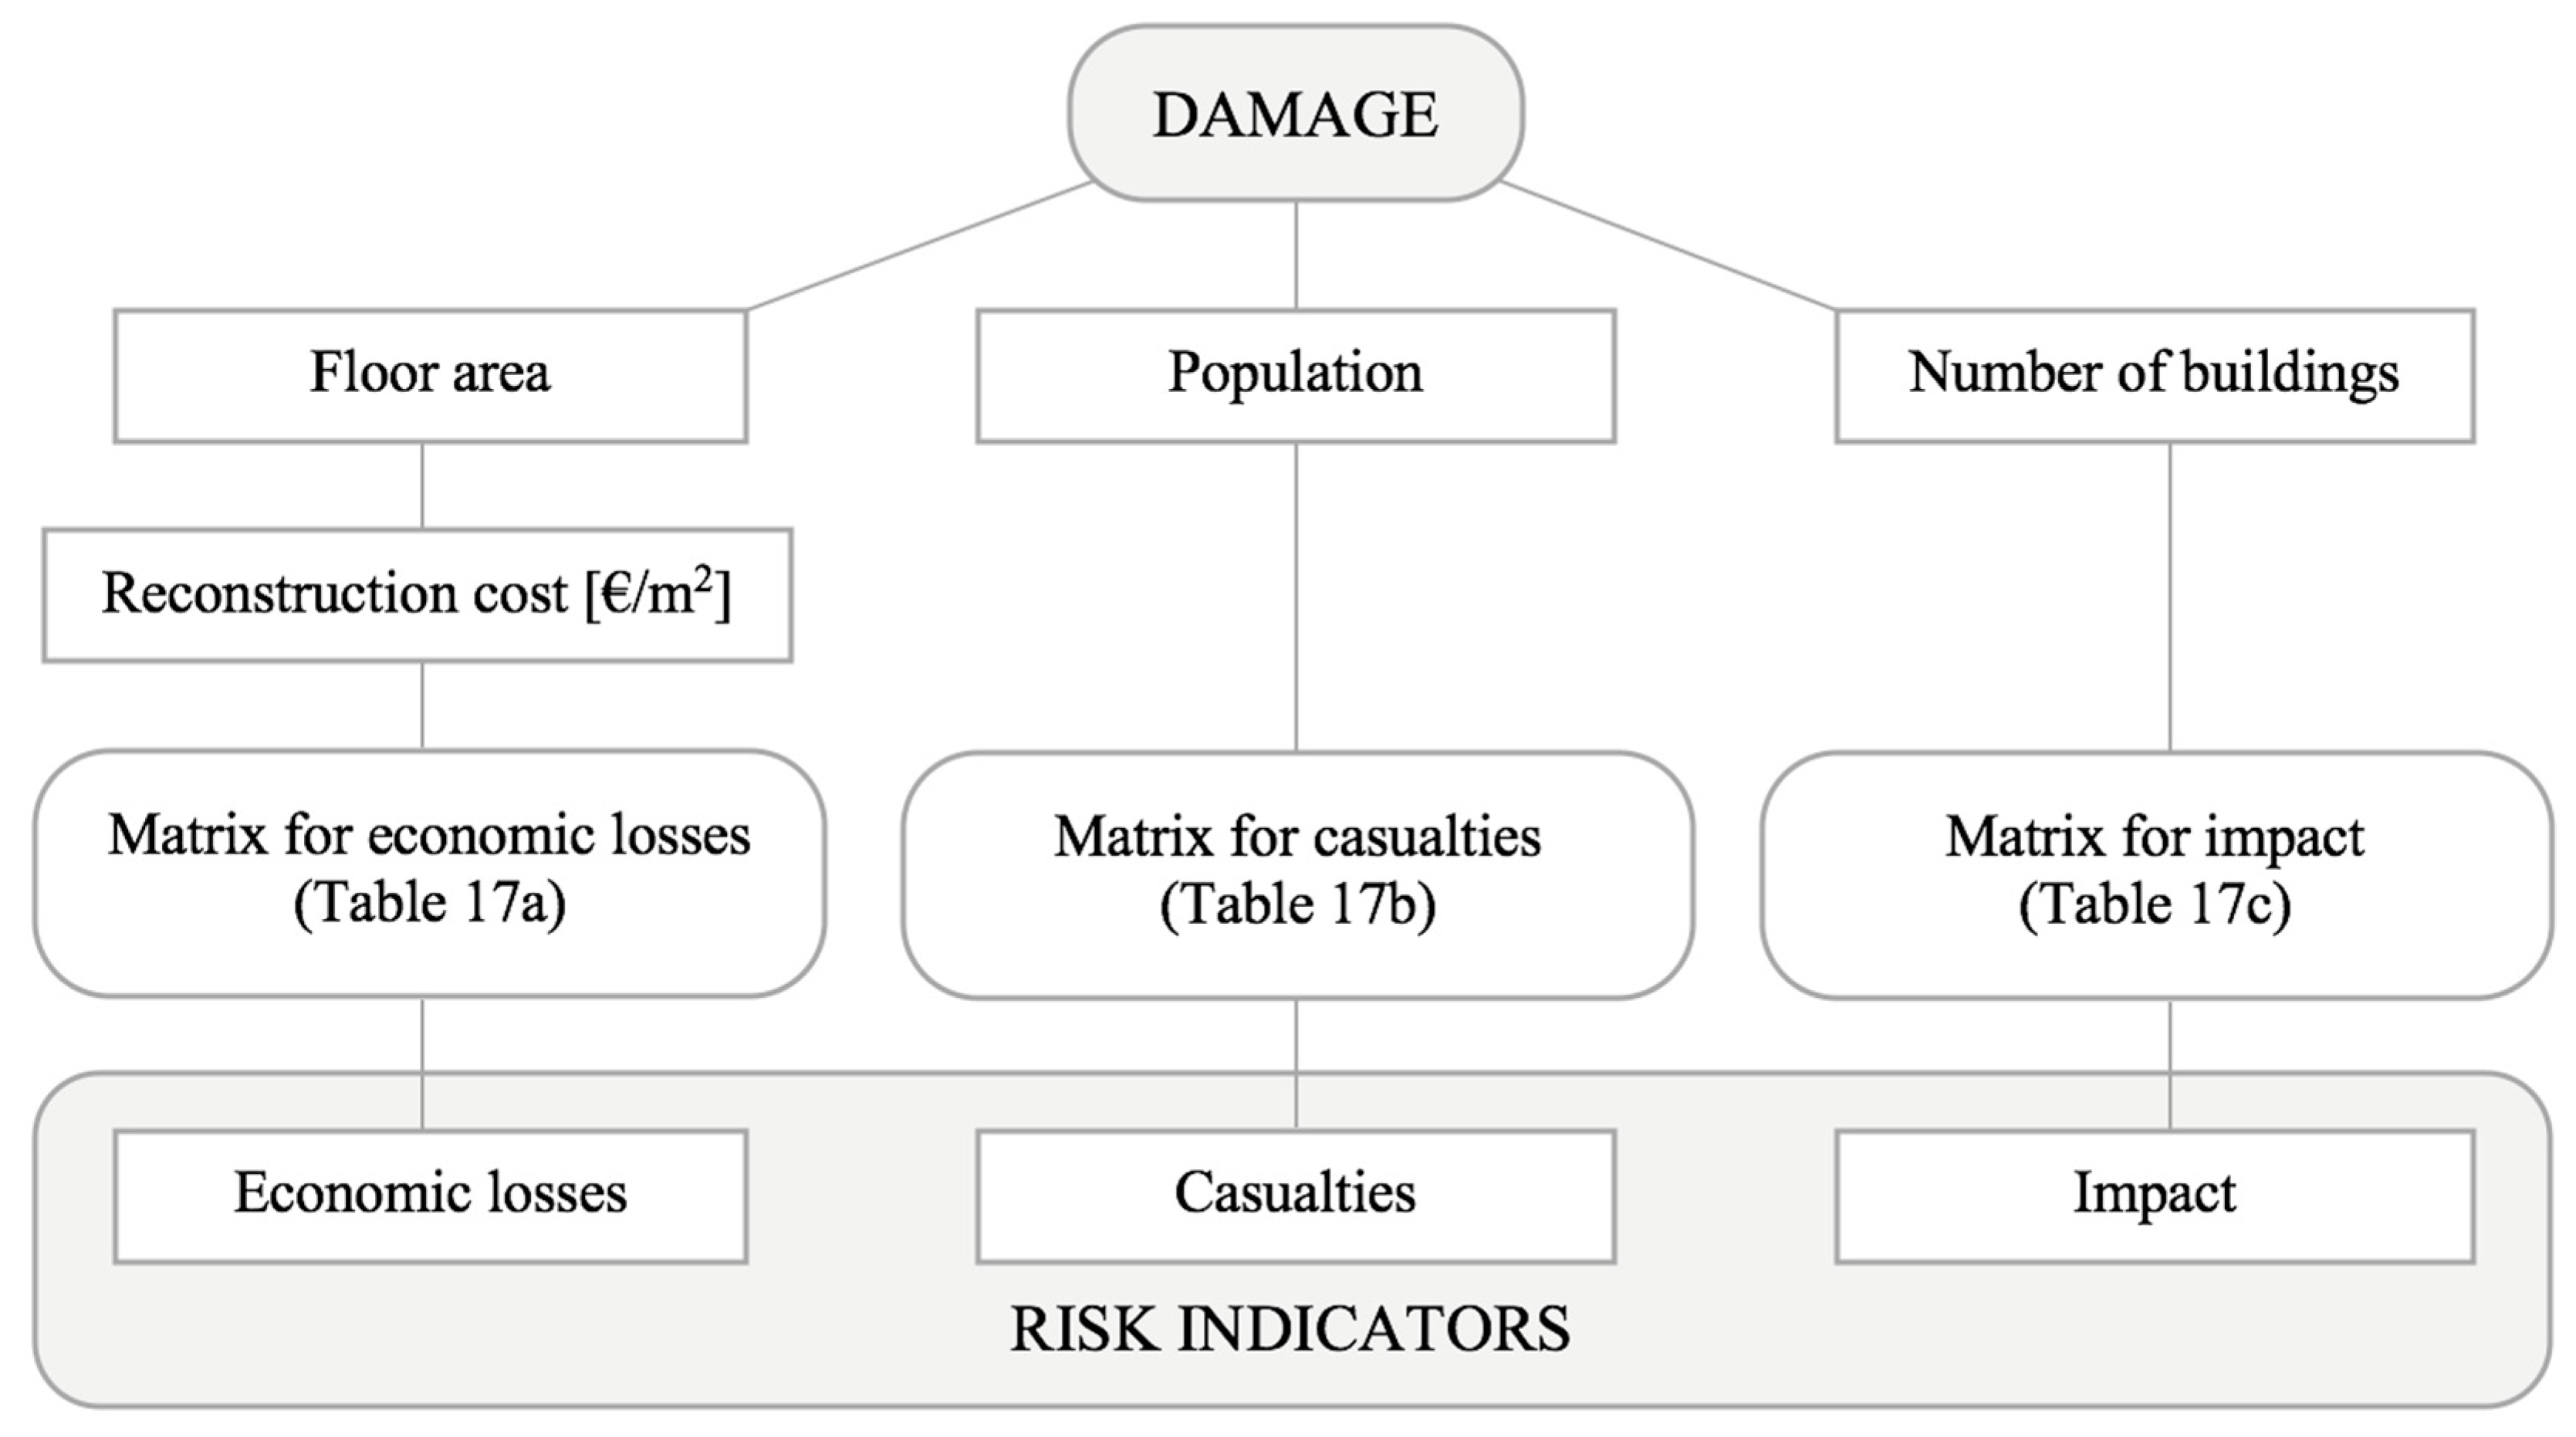
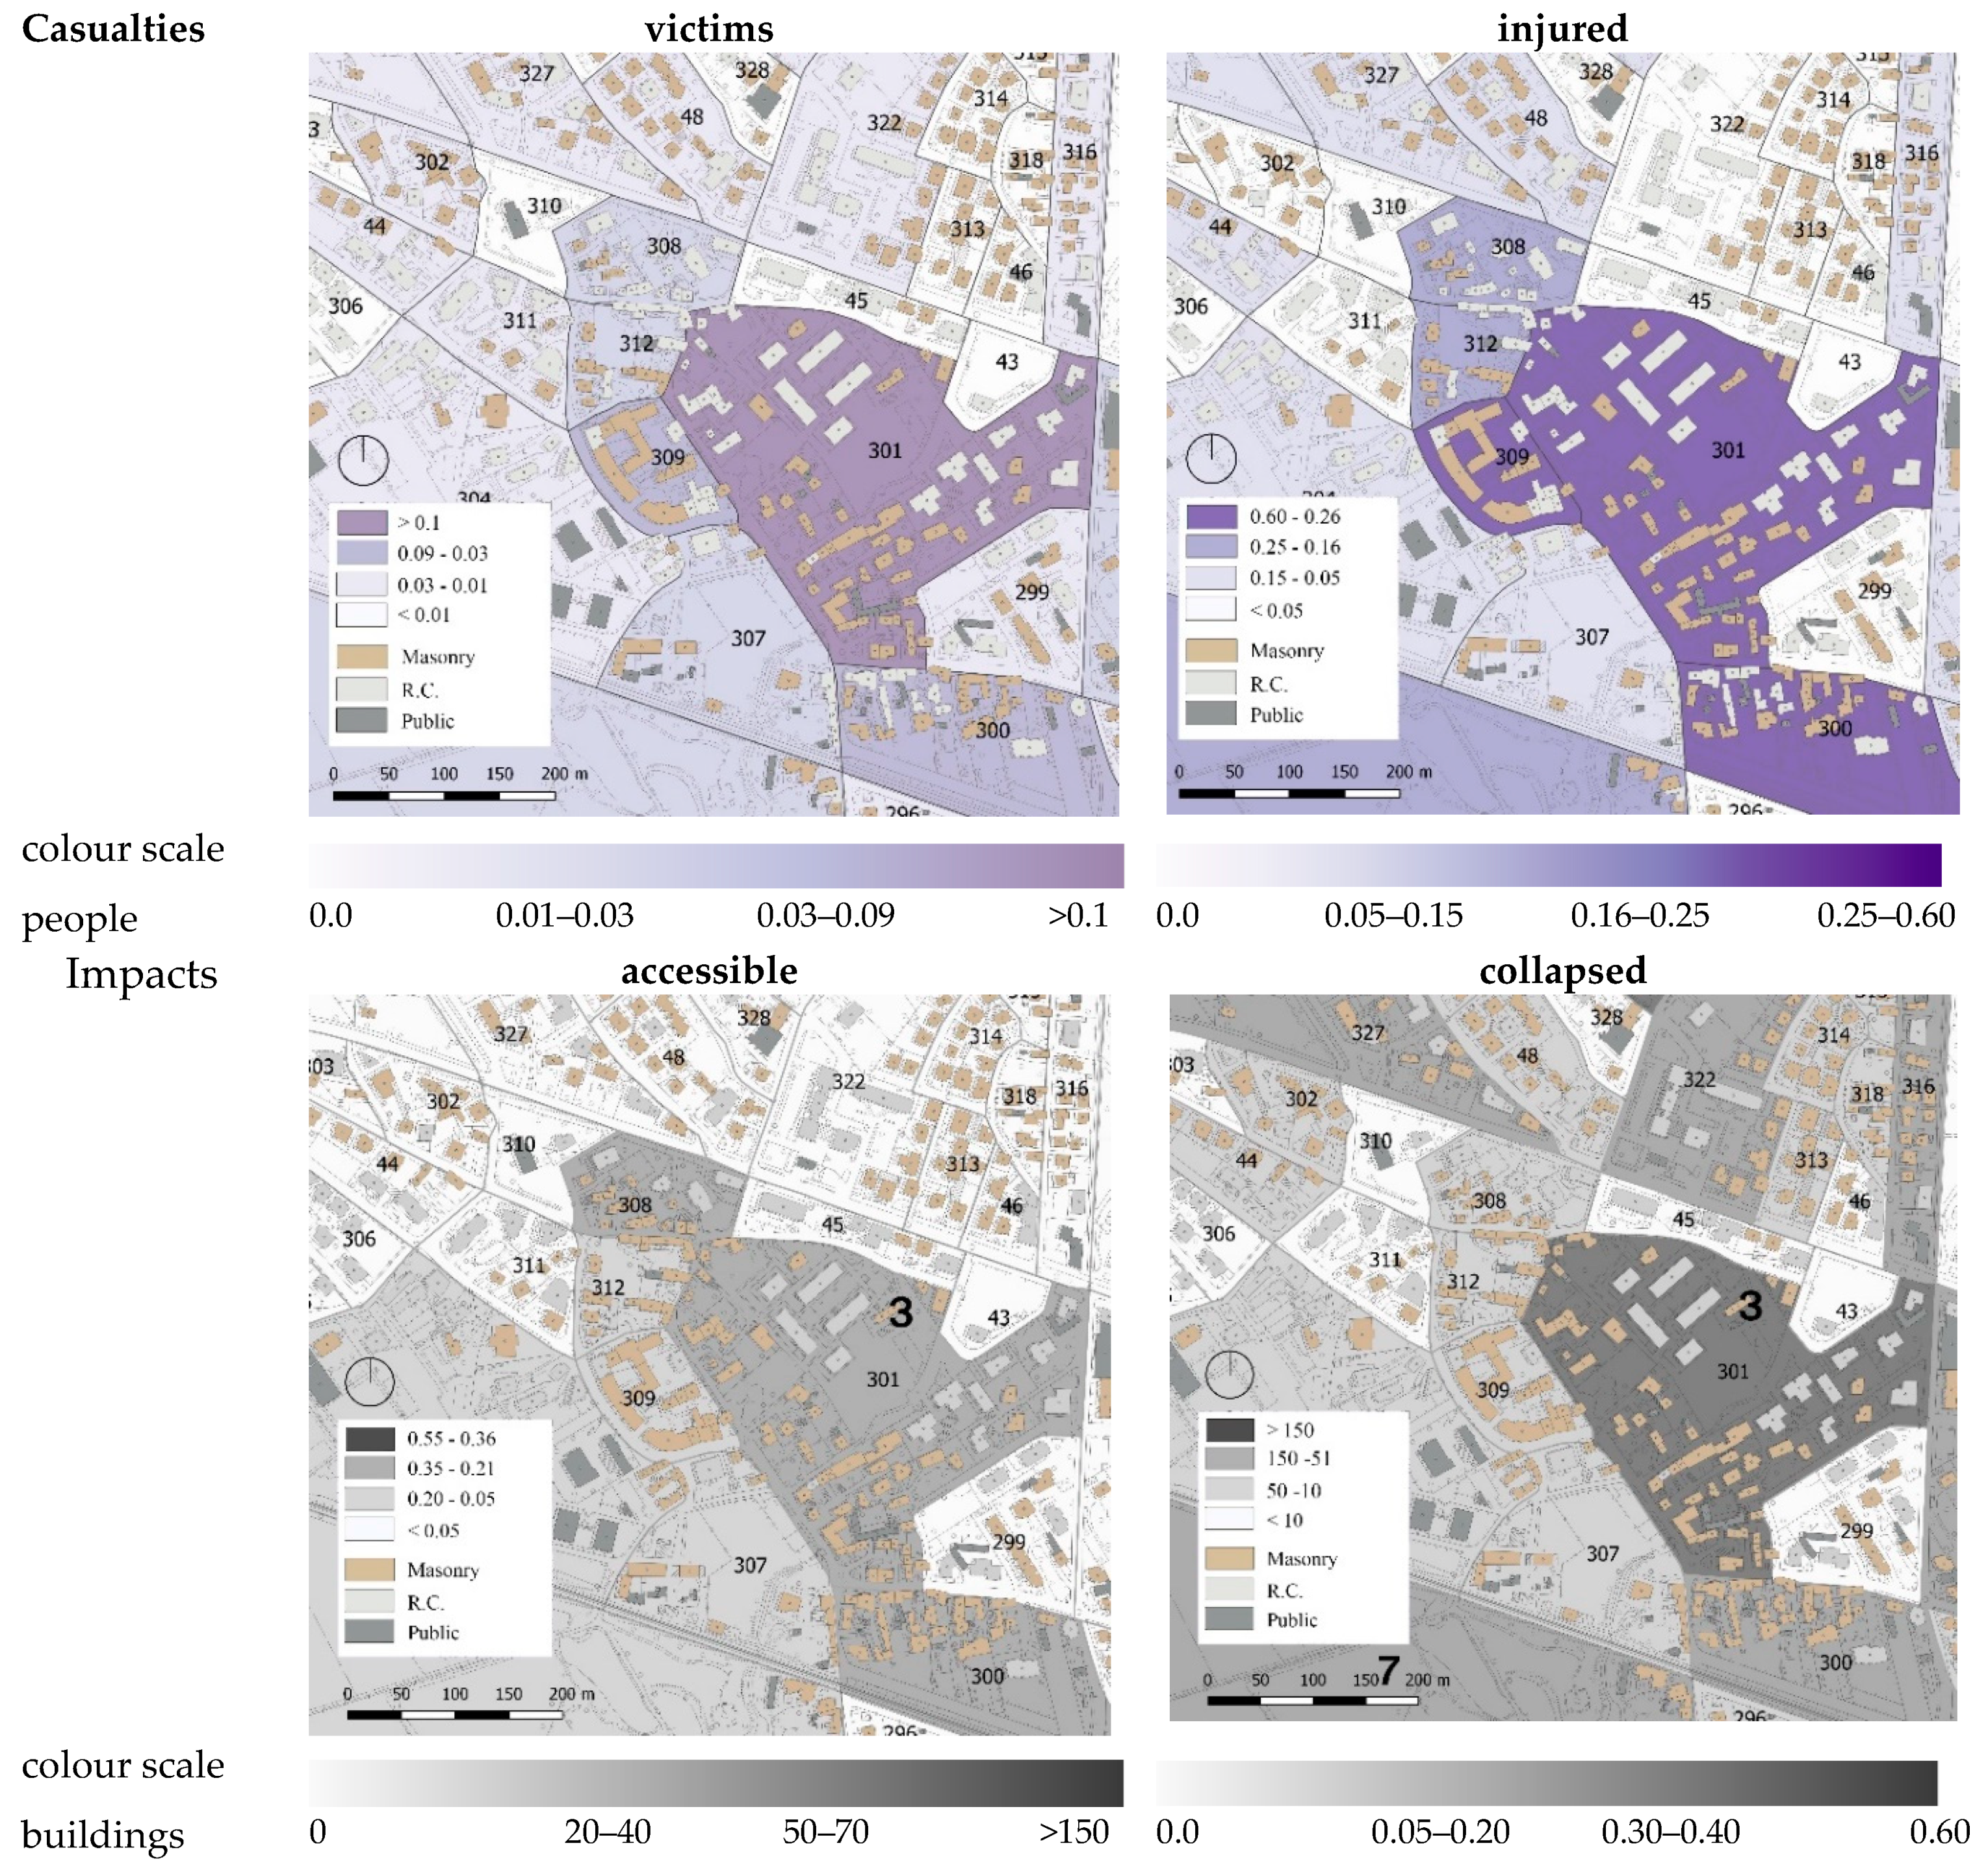
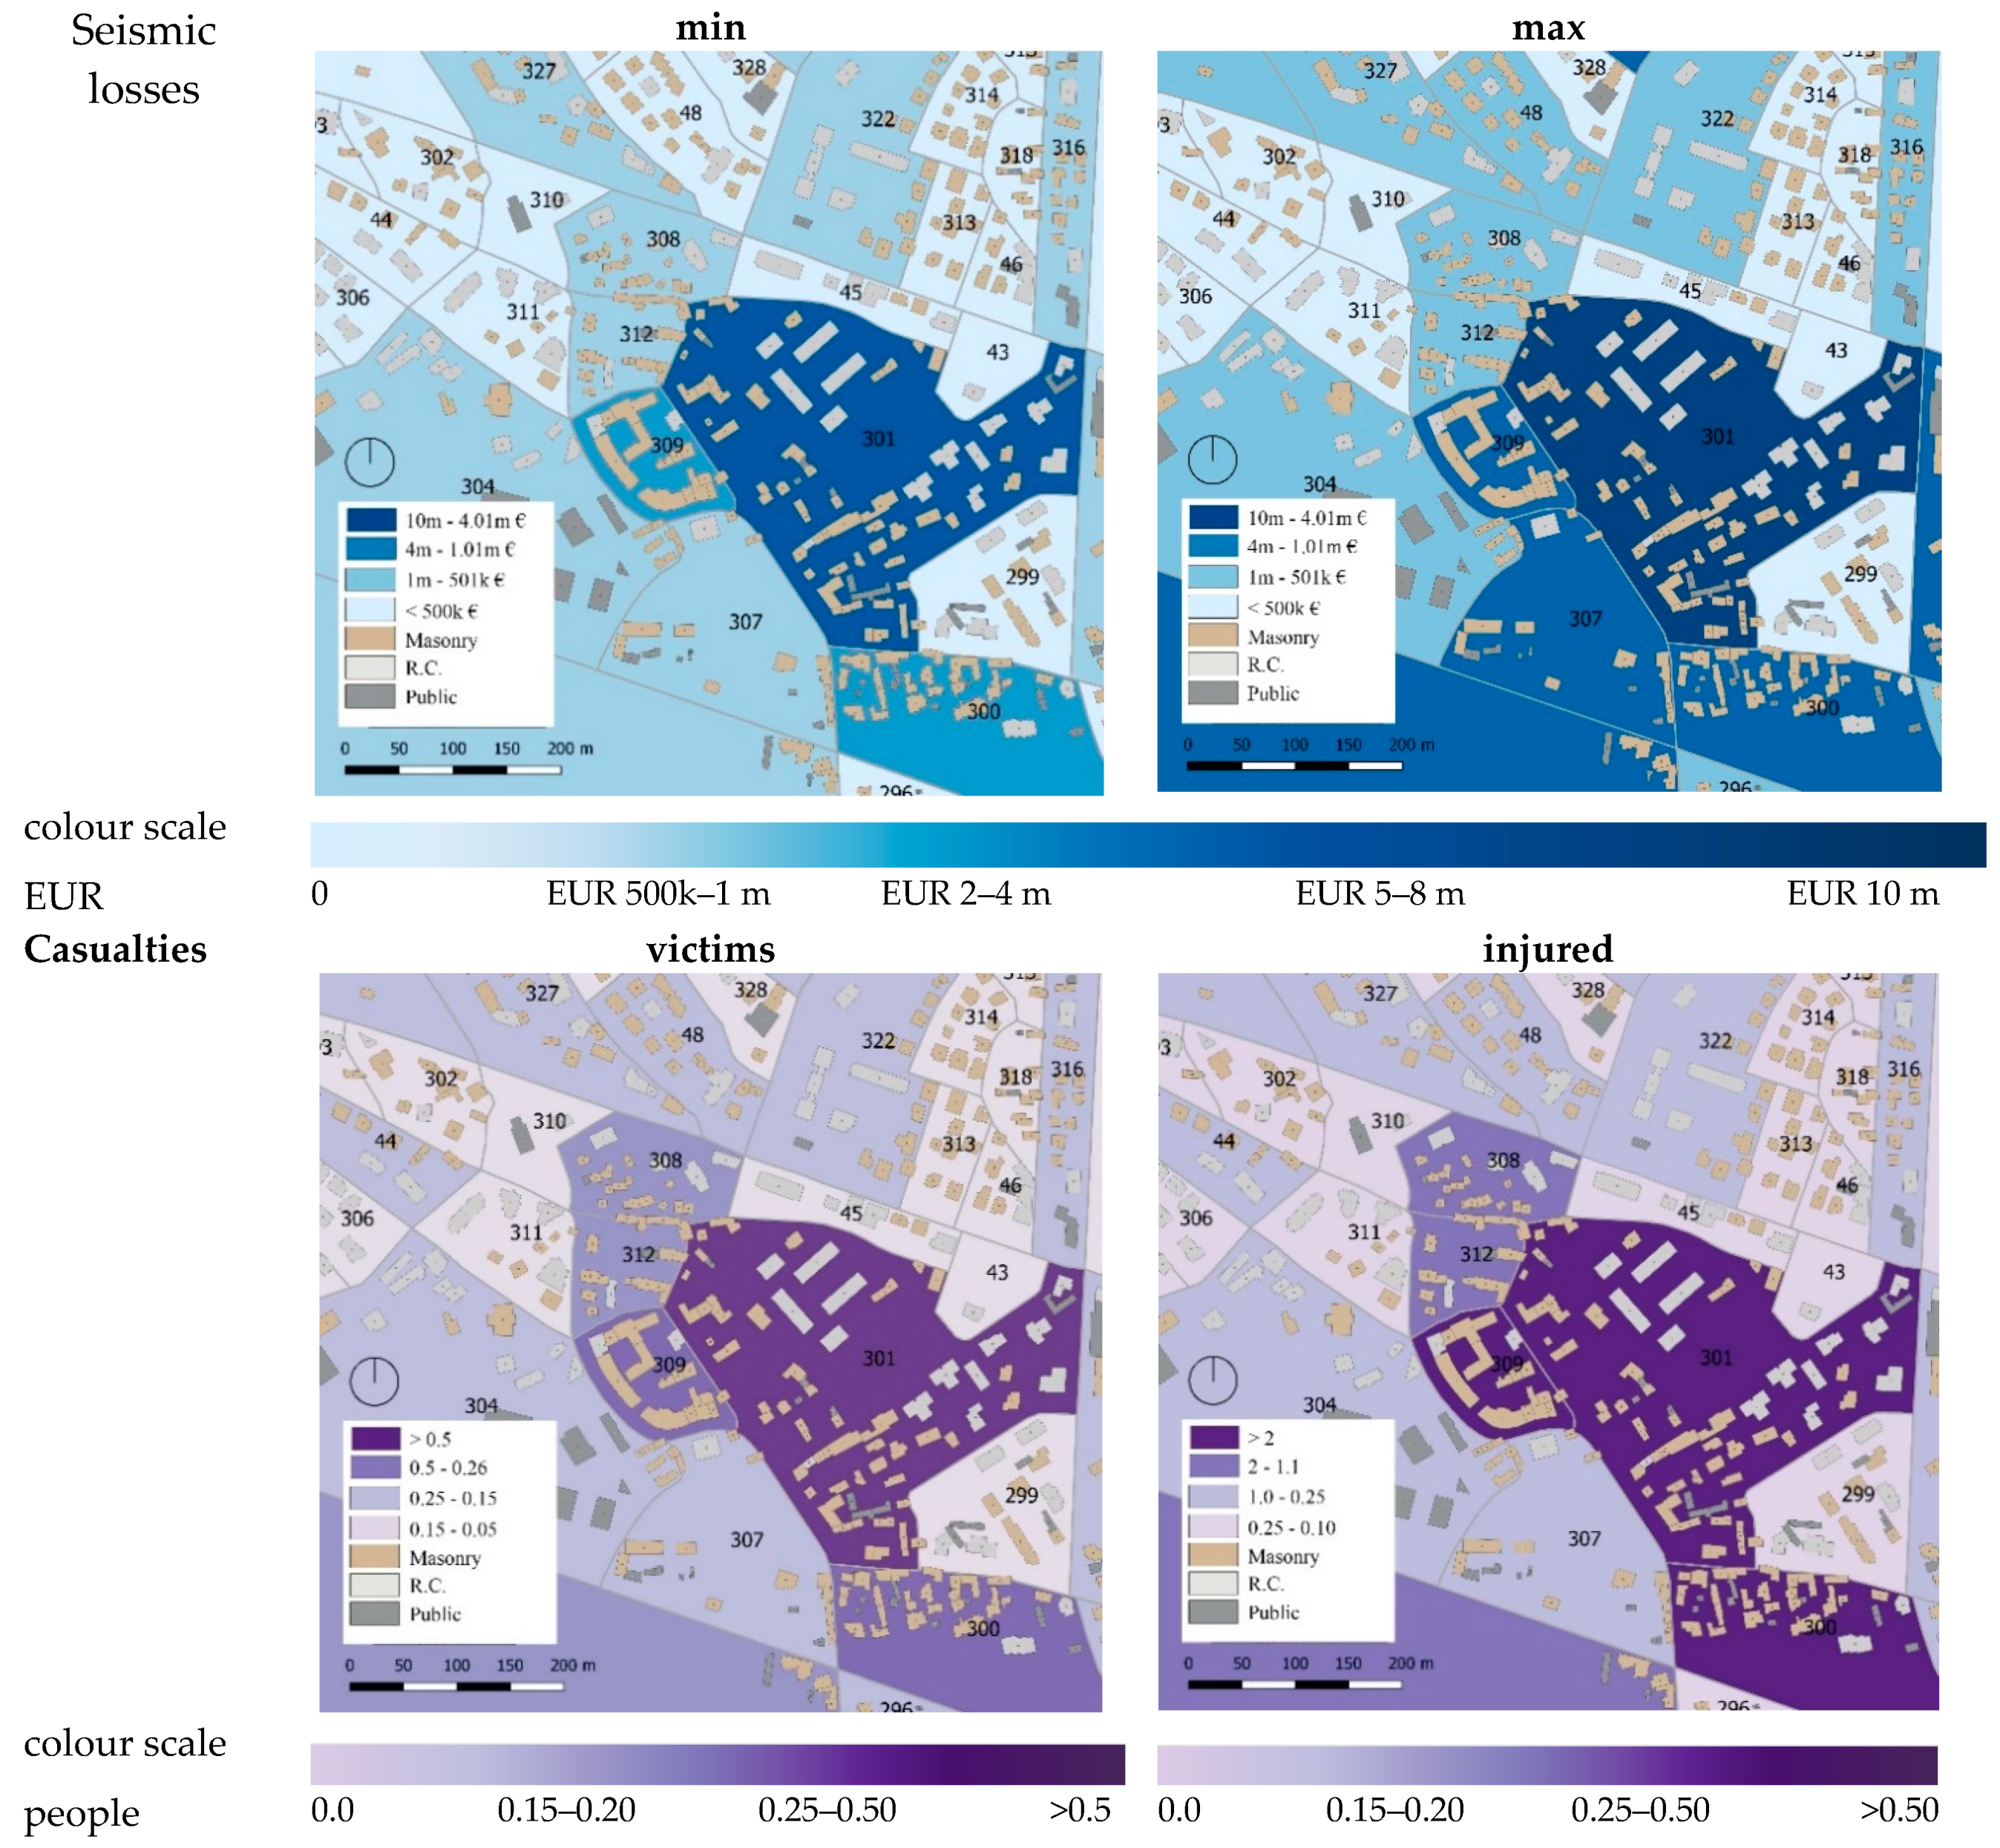
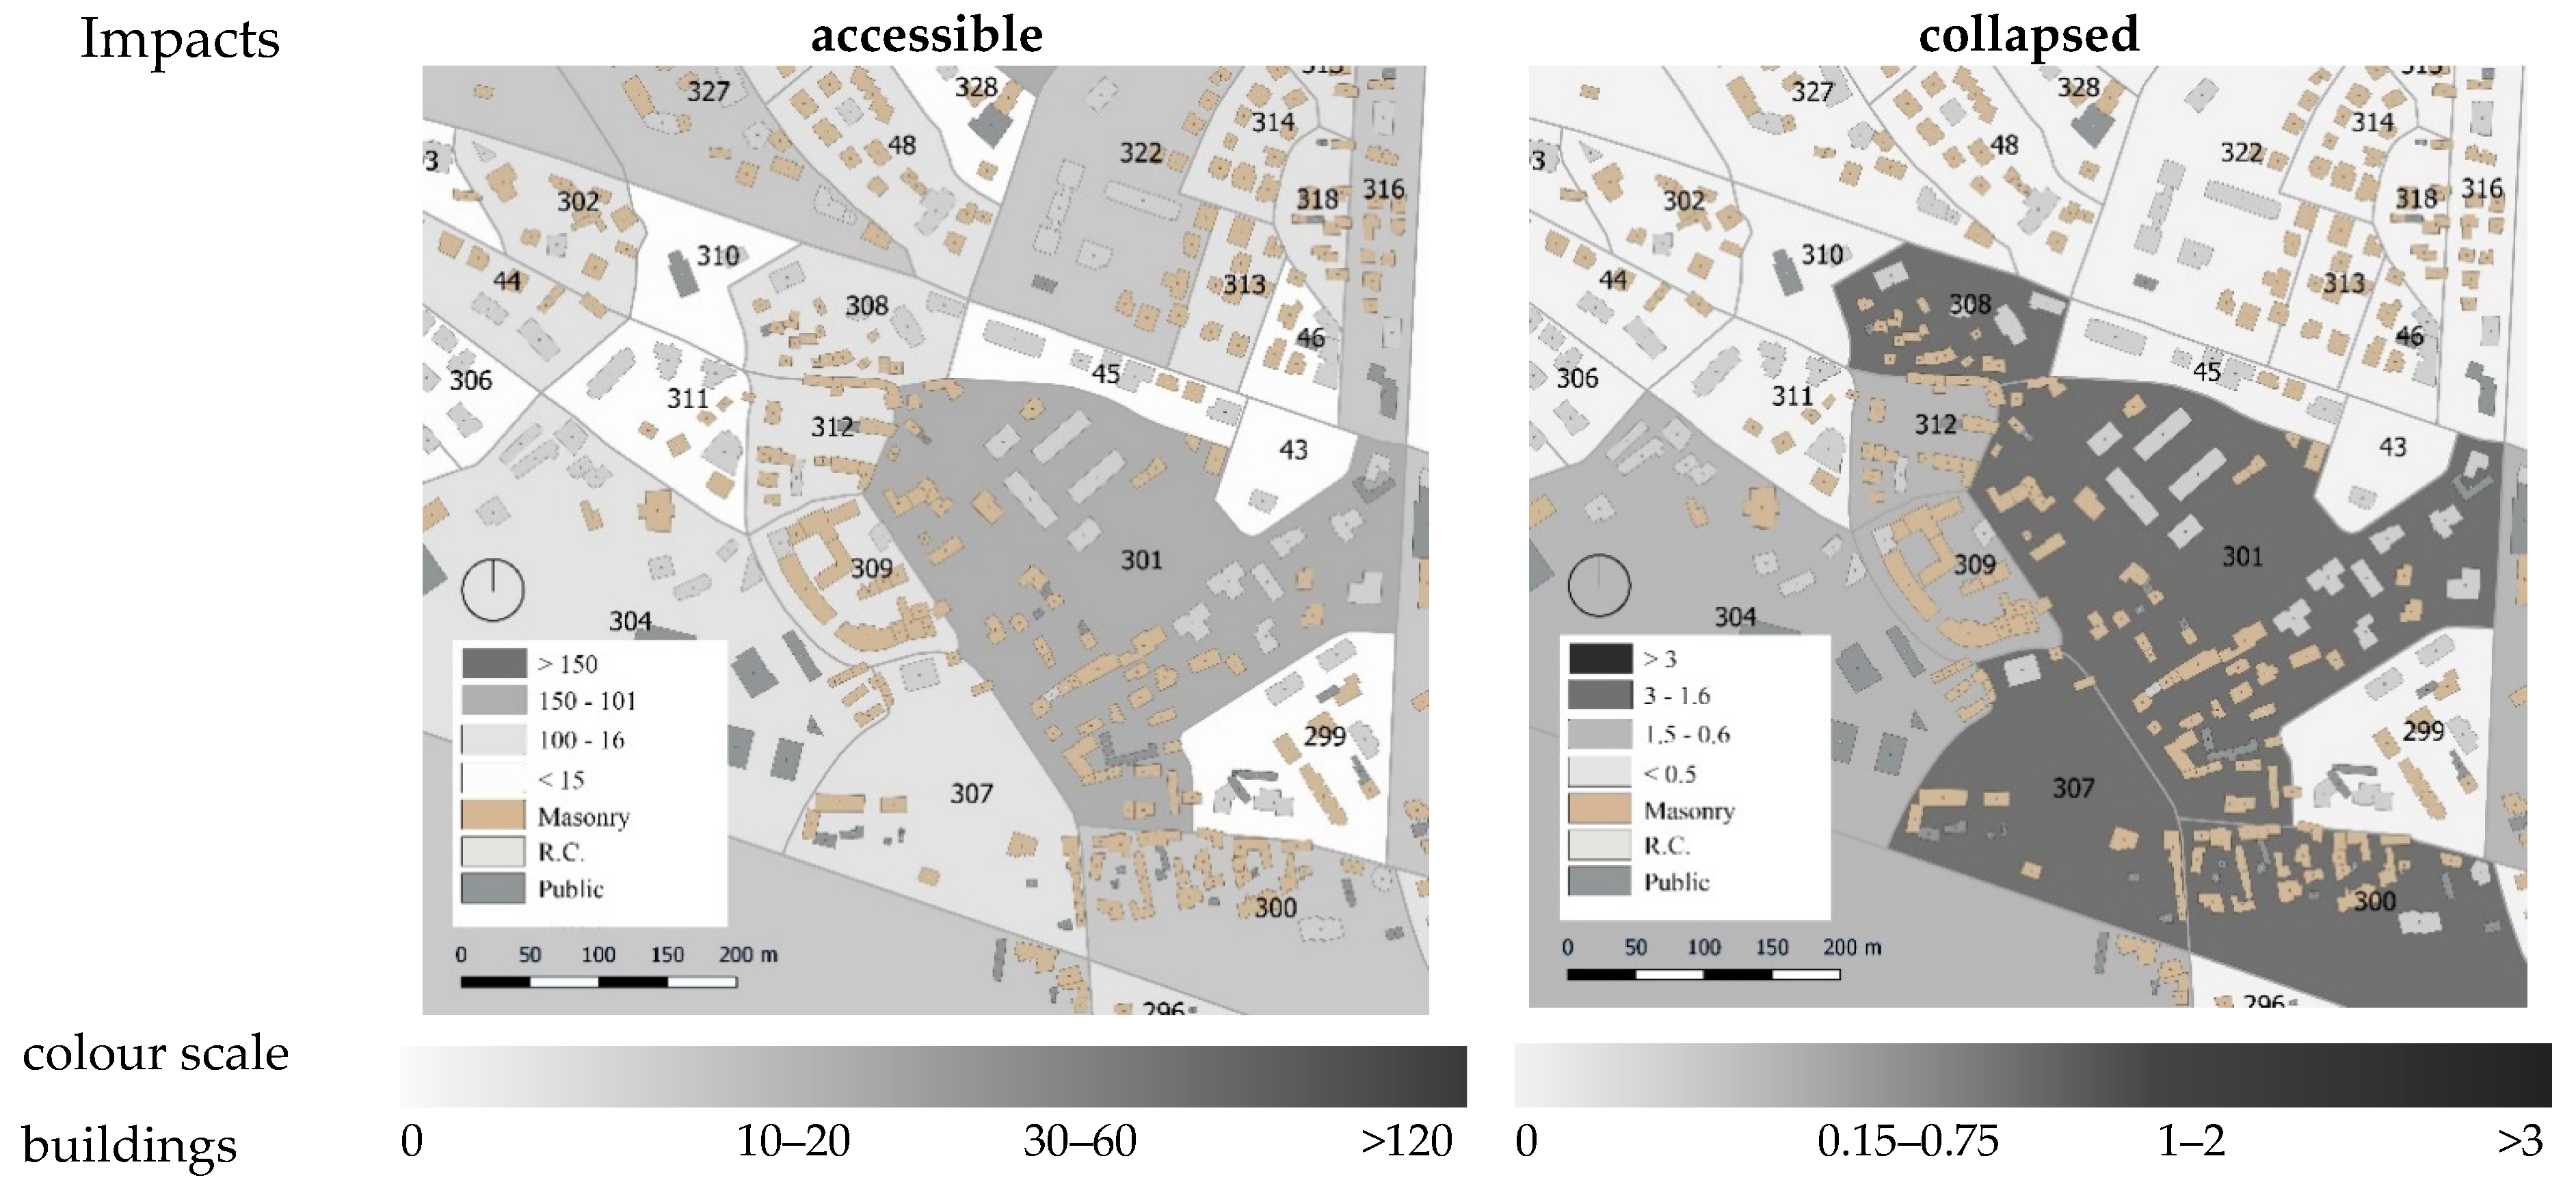
6. Seismic Risk Maps

The damage maps combine seismic hazard and vulnerability. By adding information about exposure, such as number of buildings, reconstruction or other costs, and number of people, it is possible to produce risk maps that graphically represent losses and impact indicators, such as fatalities, injuries, economic losses, and impact on the usability of the building stock.
A framework for the calculation of the seismic risk is here proposed. It can be performed for each ISTAT section, and subsequently for each CARTIS district detected in Pordenone.
In seismic risk maps, each damage state can turn into a risk indicator, thanks to different damage-to-risk matrices [60]. Table 17, in its first section (a), shows the matrix in which each damage state is associated with a different percentage of cost of repair or replacement (with a minimum and maximum value for each damage state, in order to have a possible range of economic losses). Section b shows the matrix that associates damage states with the percentage of casualties (fatalities or injuries). Lastly, section c shows the percentages of useable, not usable in the short or long-time span, and collapsed buildings associated with the damage states.
These partial results can be combined by multiplying the probability of occurrence of each damage state for the percentages shown in the matrices. Therefore, it is possible to obtain a single value that represents the most likely percentage of cost, people, or buildings that are associated with each indicator, as shown in Table 17.
Then, exposure must be considered; for each ISTAT section, the following values were extracted from the GIS database: (i) number of buildings belonging to each MUR type; (ii) total floors area belonging to each MUR type; (iii) population associated with MUR buildings.
To calculate the economic losses, a value of 1350 EUR/m2 was chosen, according to Borzi et al. [60], as a reconstruction cost for ordinary masonry buildings. By multiplying this cost for the floor area in an ISTAT section, a total cost of the considered section can be found. By multiplying the percentage of losses by the total cost of the ISTAT section, an estimate of the economic losses can be obtained. The same calculation can be performed for casualties, multiplying the percentage of fatalities/injuries by the number of people, and also for impact, multiplying the percentage of usable, not usable or collapsed buildings by the total number of buildings in the ISTAT section. Figure 20 shows the general framework described above.
The seismic risk expected losses/impact where calculated for observation times of 10 (Table 18) and 50 years (Table 19) for each district and for the whole municipality of Pordenone, and the associated maps were generated (Figure 21 and Figure 22).
As for the damage maps, these analyses do not consider the entire built stock of the municipality, therefore they reflect a forecast of losses and impact for only the ordinary masonry-built stock.

7. Conclusions

The seismic risk assessment of urban centers is an important issue due to the great vulnerability of masonry buildings and the frequent conditions of deterioration that characterize residential built heritage. When dealing with large scale assessments, simplified procedures based on expert judgement are required, since complete and detailed information for this type of analysis is often missing. Nevertheless, these procedures are generally based on census data that provide only few and poor information, to carry out accurate vulnerability assessments and seismic risk management of urban areas. Therefore, the updating of existing methods is suggested in order to: (a) create local inventory of building types (taxonomy); (b) develop mechanical fragility models for typical masonry-built types (with deep investigations to improve prediction models); (c) calculate damage scenarios (conditional and unconditional); (d) estimate the seismic risk of building types (losses and impact).
In this study, a new GIS-based multicriteria and multilevel procedure for the assessment of seismic risk of masonry-built types was presented. The typological and structural characterization of buildings (exposure model) and the following mechanical vulnerability analysis (fragility model) allowed for developing seismic risk maps. The results were produced with an automated process, thanks to the implementation of all the aspect mentioned before into a georeferenced and layered database of masonry-built types.
The procedure was applied to the case study of the municipality of Pordenone (Northeast Italy), focusing on ordinary load-bearing masonry buildings. The town was subdivided into nine districts, and various residential types were categorized by parameters, such as age of construction, number of floors and surface plan, aggregation, masonry quality, and type of horizontal structures.
A preliminary phase highlighted the aspects that most influence the seismic response of these structures according to the CARTIS approach [43]. In particular, the second level CARTIS form (2016) was compiled for a sample of about 1000 buildings belonging to four masonry-built types, as follows: MUR1 (31.09%), MUR2 (2.86%), MUR3 (60.22%), and MUR4 (5.83%). In the central districts (i.e., 1 and 2) pre-1945 building types (MUR1 and MUR2) prevail (72%). The suburbs (from district 3 to district 9) present about 70% of post-1945 buildings (MUR3–MUR4 types) and the focus on the old town (district 1) buildings defined four masonry subtypes (i.e., MUR1-T1/T2/T3/T4).
All the collected data were implemented into a multilevel urban scale georeferenced (GIS) inventory of masonry building types, collecting specific information related to seismic vulnerability. Starting from these data it was possible to carry out mechanical vulnerability analyses according to building types configurations and derive the fragility sets for the eight types (MUR1-T1, MUR1-T2, MUR1-T3, MUR1-T4, and MUR2, MUR3, MUR4) of buildings.
Furthermore, the fragility models were produced using the Donà et al. [54] procedure, that consists of the calibration of a macroseismic fragility model on a mechanical one, derived by simplified analyses of masonry buildings by Vulnus VB 4.0.
The specific fragility model obtained for Pordenone, highlights how the building types belonging to the most recent construction periods are less vulnerable, thanks to their better structural characteristics. Although buildings in the old town were the first ones to be built on the city, they are not the most vulnerable since they feature good quality structural details. Actually, the most vulnerable buildings are the ones belonging to MUR2 (pre-1919 and poor materials buildings).
Starting from this fragility model, a framework for damage and risk estimates was calculated. For what concerns damage assessment, both conditional damage (for a return period Tr = 475 years) and unconditional damage (for observation times To = 10 and 50 years) were calculated.
Furthermore, economic losses, casualties, and impact were evaluated. This procedure was implemented for single buildings, ISTAT sections, and CARTIS districts. In the next 50 years, an average economic loss of about EUR 250 million is expected for the town, as well as 22 fatalities, 28 injuries, and 777 unusable buildings (in a short time span, long time span, or in terms of collapses, respectively).
This pilot study provided the basis for the definition of a fragility and exposure ‘regional’ model for Northeast Italy, which can be taken as an example for further applications to other historical centres of the surrounding area. These applications prove that the methodology proposed can lead to practical outcomes. These results might be used by institutions not only to locate the most vulnerable areas, but also to know where to prioritize anti-seismic interventions, thus attaining a more targeted risk mitigation at different urban levels.

Author Contributions

Conceptualization and methodology, M.V., M.D., F.d.P., and M.R.V.; formal analysis: M.V. and M.D.; data curation and validation, M.V., P.C., and V.F.; writing—original draft preparation, M.V., P.C., and V.F.; writing—review and editing, M.V. and M.R.V.; supervision, M.R.V. and F.d.P.; project administration and funding acquisition, M.R.V. and F.d.P. All authors have read and agreed to the published version of the manuscript.

Funding

This research was partially funded by the Italian Projects DPC/ReLUIS–CARTIS (2019–2021) and DPC/ReLUIS–MARS (2019–2021).

Acknowledgments

The authors wish to thank the Building and Planning Office and the State Archive of the municipality of Pordenone.

Conflicts of Interest

The authors declare no conflict of interest.

References

  1. Fiorentino, G.; Forte, A.; Pagano, E.; Sabetta, F.; Baggio, C.; Lavorato, D.; Nuti, C.; Santini, S. Damage patterns in the town of Amatrice after August 24th 2016 Central Italy earthquakes. Bull. Earthq. Eng. 2018, 16, 1399–1423. [Google Scholar] [CrossRef] [Green Version]
  2. Mazzoni, S.; Castori, G.; Galasso, C.; Calvi, P.; Dreyer, R.; Fischer, E.; Fulco, A.; Sorrentino, L.; Wilson, J.; Penna, A.; et al. 2016–2017 Central Italy Earthquake Sequence: Seismic Retrofit Policy and Effectiveness. Earthq. Spectra 2018, 34, 1671–1691. [Google Scholar] [CrossRef]
  3. Sextos, A.; De Risi, R.; Pagliaroli, A.; Foti, S.; Passeri, F.M.; Ausilio, E.; Cairo, R.; Capatti, M.C.; Chiabrando, F.; Chiaradonna, A.; et al. Local Site Effects and Incremental Damage of Buildings during the 2016 Central Italy Earthquake Sequence. Earthq. Spectra 2019, 34, 1639–1669. [Google Scholar] [CrossRef] [Green Version]
  4. Valluzzi, M.R.; Sbrogiò, L. Vulnerability of architectural heritage in seismic area: Constructive aspects and effect of interventions. In Cultural Landscape in Practice, Conservation vs. Emergencies; Amoruso, G., Salerno, E., Eds.; Springer: Cham, Switzerland, 2019; pp. 203–218. [Google Scholar]
  5. Sorrentino, L.; Cattari, S.; da Porto, F.; Magenes, G.; Penna, A. Seismic behavior of ordinary masonry buildings during the 2016 Central Italy Earthquakes. Bull. Earthq. Eng. 2019, 17, 5583–5607. [Google Scholar] [CrossRef] [Green Version]
  6. Vettore, M.; Saretta, Y.; Sbrogiò, L.; Valluzzi, M.R. A New Methodology for the Survey and Evaluation of Seismic Damage and Vulnerability Entailed by Structural Interventions on Masonry Buildings: Validation on the Town of Castelsantangelo sul Nera (MC), Italy. Int. J. Arch. Herit. 2020. [Google Scholar] [CrossRef]
  7. Cattari, S.; degli Abbati, S.; Ferretti, D.; Lagomarsino, S.; Ottonelli, D.; Tralli, A. The seismic behaviour of ancient masonry buildings after the earthquake in Emilia (Italy) on May 20th and 29th, 2012. Ing. Simica 2012, 23, 87–111. [Google Scholar]
  8. Penna, A.; Morandi, P.; Rota, M.; Manzini, C.F.; da Porto, F.; Magenes, G. Performance of masonry buildings during the Emilia 2012 earthquake. Bull. Earthq. Eng. 2014, 12, 2255–2273. [Google Scholar] [CrossRef]
  9. D’Ayala, D.; Paganoni, S. Assessment and analysis of damage in L’Aquila historic city centre after 6th April 2009. Bull. Earthq. Eng. 2011, 9, 81–104. [Google Scholar] [CrossRef]
  10. Modena, C.; Valluzzi, M.R.; da Porto, F.; Casarin, F. Structural aspects of the conservation of historic masonry constructions in seismic areas: Remedial measures and emergency actions. Int. J. Arch. Herit. 2011, 5, 539–558. [Google Scholar] [CrossRef]
  11. Sorrentino, L.; Ronchetti, L.; Raglione, E.; Liberatore, D. Structural analysis of earthquake-resistant historical details of L’Aquila (central Italy) buildings. In Proceedings of the 8th International Conference on Structural Analysis of Historical Constructions, Wrocław, Poland, 15–17 October 2012; pp. 1716–1723. [Google Scholar]
  12. Lorenzoni, F.; Caldon, M.; da Porto, F.; Modena, C.; Aoki, T. Post-earthquake controls and damage detection through structural health monitoring: Applications in L’Aquila. J. Civ. Struct. Health Monit. 2018, 8, 217–236. [Google Scholar] [CrossRef]
  13. Maffei, J.; Bazzurro, P. The 2002 Molise, Italy, Earthquake. Earthq. Spectra 2004, 20, 1–22. [Google Scholar] [CrossRef]
  14. Goretti, A.; Di Pasquale, G. Building Inspection and Damage Data for the 2002 Molise, Italy, Earthquake. Earthq. Spectra 2004, 20, 167–190. [Google Scholar] [CrossRef]
  15. Decanini, L.; De Sortis, A.; Goretti, A.; Langenbach, R.; Mollaioli, F.; Rasulo, A. Performance of Masonry Buildings During the 2002 Molise, Italy, Earthquake. Earthq. Spectra 2004, 20, 191–220. [Google Scholar] [CrossRef]
  16. Spence, R.J.S.; D’Ayala, D. Damage Assessment and Analysis of the 1997 Umbria-Marche Earthquakes. Struct. Eng. Int. 1999, 9, 229–233. [Google Scholar] [CrossRef]
  17. Binda, L.; Cardani, G.; Saisi, A.; Valluzzi, M.R. Vulnerability analysis of the historical buildings in seismic area by a multilevel approach. Asian J. Civ. Eng. 2006, 7, 343–357. [Google Scholar]
  18. Binda, L.; Cardani, G.; Saisi, A.; Valluzzi, M.R.; Munari, M.; Modena, C. Multilevel approach to the vulnerability analysis of historic buildings in seismic areas—Part 1: Detection of parameters for the vulnerability analysis through on site and laboratory investigationsn. Int. J. Restor. Build. Monum. 2007, 13, 413–426. [Google Scholar]
  19. Valluzzi, M.R.; Munari, M.; Modena, C.; Binda, L.; Cardani, G.; Saisi, A. Multilevel approach to the vulnerability analysis of historic buildings in seismic areas—Part 2: Analytical interpretation of mechanisms for the vulnerability analysis and the structural improvement. Int. J. Restor. Build. Monum. 2007, 13, 427–441. [Google Scholar]
  20. Dolce, M.; Masi, A.; Goretti, A. Damage to buildings due to 1997 Umbria-Marche earthquake. In Seismic Damage to Masonry Buildings; Bernardini, A., Ed.; Springer: Cham, Switzerland, 2018; pp. 71–80. [Google Scholar] [CrossRef]
  21. Da Porto, F.; Silva, B.; Costa, C.; Modena, C. Macro-scale analysis of damage to churches after earthquake in Abruzzo (Italy) on April 6, 2009. J. Earthq. Eng. 2012, 16, 739–758. [Google Scholar] [CrossRef]
  22. Pavić, G.; Hadzima-Nyarko, M.; Bulajić, B.; Jurković, Z. Development of Seismic Vulnerability and Exposure Models—A Case Study of Croatia. Sustainability 2020, 12, 973. [Google Scholar] [CrossRef] [Green Version]
  23. Campostrini, G.P.; Taffarel, S.; Bettiol, G.; Valluzzi, M.R.; da Porto, F.; Modena, C. A Bayesian approach to rapid seismic vulnerability assessment at urban scale. Int. J. Arch. Herit. 2018, 12, 36–46. [Google Scholar] [CrossRef]
  24. UNISDR. Sendai Framework for Disaster Risk Reduction 2015–2030; The United Nations for Disaster Risk Reduction: Geneva, Switzerland, 2015. [Google Scholar]
  25. Italian Government. Legislative Decree no. 1; 2018/01/02, GU n.17 2018/01/22; Italian Government: Rome, Italy, 2018. (In Italian)
  26. DPC—Italian Civil Protection Department of Presidency of Council of Ministers. National Risk Assessment—Overview of the Potential Major Disasters in Italy: Seismic, Volcanic, Tsunami, Hydro-Geologic/Hydraulic and Extreme Weather, Droughts and Forest Fire Risks; Presidency of the Council of Ministers, Italian Civil Protection Department: Rome, Italy, 2018; pp. 1–137. (In Italian)
  27. Braga, F.; Dolce, M.; Liberatore, O. A statistical study on damaged buildings and an ensuring review of the MSK-76 scale. In Proceedings of the Seventh European Conference on Earthquake Engineering, Athens, Greece, 20–25 September 1982; Building Seismic Safety Council: Athens, Greece, 1982; pp. 431–450. [Google Scholar]
  28. Di Pasquale, G.; Goretti, A. Functional and economic vulnerability of residential buildings affected by recent Italian earthquakes. In Proceedings of the 10th ANIDIS, Convegno Nazionale di Ingegneria Sismica, Potenza-Matera, Italy, 9–13 September 2001. (In Italian). [Google Scholar]
  29. Rossetto, T.; Ioannou, I.; Grant, D.N. Existing Empirical Fragility and Vulnerability Functions: Compendium and Guide for Selection; GEM Technical Report 2013-X; GEM Foundation: Pavia, Italy, 2013. [Google Scholar]
  30. Rota, M.; Penna, A.; Strobbia, C. Processing Italian damage data to derive typological fragility curves. Soil Dyn. Earthq. Eng. 2008, 28, 933–947. [Google Scholar] [CrossRef]
  31. Rosti, A.; Rota, M.; Penna, A. Empirical fragility curves for Italian URM buildings. Bull. Earthq. Eng. 2020. [Google Scholar] [CrossRef]
  32. Cescatti, E.; Salzano, P.; Casapulla, C.; Ceroni, F.; da Porto, F.; Prota, A. Damage to masonry churches after 2016-17 Central Italy seismic sequence and definition of fragility curves. Bull. Earthq. Eng. 2020, 18, 297–329. [Google Scholar] [CrossRef]
  33. Galasco, M.; Lagomarsino, S.; Penna, A. TREMURI Program: Seismic Analyser of 3D Masonry Buildings; University of Genova: Genova, Italy, 2002. [Google Scholar]
  34. Valluzzi, M.R. User Manual of Vulnus_4.0; Original Program by Bernardini A., Gori M., Modena C.; University of Padova: Padova, Italy, 2009. (In Italian) [Google Scholar]
  35. D’Ayala, D.; Meslem, A.; Vamvatsikos, D.; Porter, K.; Rossetto, T.; Silva, V. Guidelines for Analytical Vulnerability Assessment of Low/Mid-Rise Buildings; Vulnerability Global Component Project; Global Earthquake Model Foundation: Pavia, Italy, 2015. [Google Scholar] [CrossRef]
  36. Lagomarsino, S.; Cattari, S. Fragility functions of masonry buildings. In SYNER-G: Typology Definition and Fragility Functions for Physical Elements at Seismic Risk; Pitilakis, K., Crowley, H., Kaynia, A.M., Eds.; Springer: Berlin/Heidelberg, Germany, 2014; Volume 27, pp. 111–156. [Google Scholar]
  37. Del Gaudio, C.; Ricci, P.; Verderame, G.M. A class-oriented mechanical approach for seismic damage assessment of RC buildings subjected to the 2009 L’Aquila earthquake. Bull. Earthq. Eng. 2018, 16, 4581–4605. [Google Scholar] [CrossRef]
  38. Borzi, B.; Faravelli, M.; Di Meo, A. Application of the SP-BELA methodology to RC residential buildings in Italy to produce seismic risk maps for the national risk assessment. Bull. Earthq. Eng. 2020. [Google Scholar] [CrossRef]
  39. Kappos, A.J.; Panagopoulos, G.; Panagiotopoulos, C.; Penelis, G. A hybrid method for the vulnerability assessment of RC and URM buildings. Bull. Earthq. Eng. 2006, 4, 391–413. [Google Scholar] [CrossRef]
  40. Taffarel, S.; da Porto, F.; Valluzzi, M.R.; Modena, C. Comparing expeditious procedures for the seismic vulnerability assessment on the European territorial context: Reliability, feasibility, cost, and time consumption. Int. J. Arch. Herit. 2018, 12, 1150–1161. [Google Scholar] [CrossRef]
  41. ISTAT (Italian National Institute of Statistics). Website and Data Warehouse. 2011. Available online: https://www.istat.it/it/censimenti-permanenti/censimenti-precedenti/popolazione-e-abitazioni/popolazione-2011 (accessed on 1 November 2020).
  42. Coburn, A.W.; Spence, R. Earthquake Protection; John Wiley & Sons Ltd.: West Sussex, UK, 1992. [Google Scholar]
  43. Zuccaro, G.; Dolce, M.; De Gregorio, D.; Speranza, E.; Moroni, C. La scheda CARTIS per la caratterizzazione tipologico-strutturale dei comparti urbani costituiti da edifici ordinari. Valutazione dell’esposizione in analisi di rischio sismico. In Proceedings of the 34th Conference Gruppo Nazionale di Geofisica della Terra Solida, Trieste, Italy, 17–19 November 2015. (In Italian). [Google Scholar]
  44. Polese, M.; Di Ludovico, M.; Prota, A.; Tocchi, G.; Gaetani d’Aragona, M. Utilizzo della scheda Cartis per aggiornamento dell’inventario ed effetto sulle stime di vulnerabilità a scala territoriale. In Proceedings of the 18th Conference ANIDIS: L’ingegneria Sismica in Italia, Ascoli Piceno, Italy, 15–19 September 2019. (In Italian). [Google Scholar]
  45. Saretta, Y.; Sbrogiò, L.; Molinari, F.; Vettore, M.; Valluzzi, M.R. MUSE_DV masonry: A new multilevel procedure for the empirical assessment of seismic damage and vulnerability of strengthened masonry buildings. Progett. Sismica 2020, 12. [Google Scholar] [CrossRef]
  46. Zhai, Y.; Chen, S.; Ouyang, Q. GIS-Based Seismic Hazard Prediction System for Urban Earthquake Disaster Prevention Planning. Sustainability 2019, 11, 2620. [Google Scholar] [CrossRef] [Green Version]
  47. Formisano, A.; Mazzolani, F.M.; Florio, G.; Landolfo, R.; De Masi, G.; Delli Priscoli, G.; Indirli, M. Seismic vulnerability analysis of historical centres: A GIS application in Torre del Greco. In Proceedings of the COST C26 Conference Urban Habitat Constructions under Catastrophic Events, Naples, Italy, 16–18 September 2010. [Google Scholar]
  48. Vicente, R.; Parodi, S.; Lagomarsino, S.; Varum, H.; Mendes Silva, J.A.R. Seismic vulnerability and risk assessment: Case study of the historic city centre of Coimbra, Portugal. Bull. Earthq. Eng. 2011, 9, 1067–1096. [Google Scholar] [CrossRef]
  49. Salazar, L.G.F.; Ferreira, T.M. Seismic Vulnerability Assessment of Historic Constructions in the Downtown of Mexico City. Sustainability 2020, 12, 1276. [Google Scholar] [CrossRef] [Green Version]
  50. Bernardini, A.; D’Ayala, D.; Meroni, F.; Pessina, V.; Valluzzi, M.R. Damage scenarios in the Vittorio Veneto town center (NE Italy). Boll. Geofis. Teor. Appl. Int. J. Earth Sci. 2008, 49, 505–512. [Google Scholar]
  51. Bernardini, A.; Salmaso, L.; Solari, A. Statistical evaluation of vulnerability and expected seismic damage of residential buildings in the Veneto-Friuli area (NE Italy). Boll. Geofis. Teor. Appl. Int. J. Earth Sci. 2008, 49, 427–446. [Google Scholar]
  52. Bernardini, A.; Gori, M.; Modena, C. Application of coupled analytical models and experimental knowledge to seismic vulnerability analyses of masonry buildings. In Earthquake Damage Evaluation and Vulnerability Analysis of Building Structures; Koridze, A., Ed.; Omega Scientific: Tarzana, CA, USA, 1990; pp. 161–180. [Google Scholar]
  53. Benedetti, D.; Petrini, V. Sulla vulnerabilità sismica di edifici in muratura: Un metodo di valutazione. L’industria Delle Costr. 1984, 419, 66–74. (In Italian) [Google Scholar]
  54. Donà, M.; Carpanese, P.; Follador, V.; Sbrogiò, L.; da Porto, F. Mechanics-based fragility curves for Italian residential URM buildings. Bull. Earthq. Eng. 2020. [Google Scholar] [CrossRef]
  55. Grünthal, G. European Macroseismic Scale 1998; Cahiers du Centre Européen de Géodynamique et de Séismologie: Luxembourg, 1998; Volume 15. [Google Scholar]
  56. Cornell, C.A.; Krawinkler, H. Progress and Challenges in Seismic Performance Assessment; PEER Center News, Pacific Earthquake Engineering Research Center, University of California: Berkeley, CA, USA, 2000. [Google Scholar]
  57. Eads, L.; Miranda, E.; Krawinkler, H.; Lignos, D.G. An efficient method for estimating the collapse risk of structures in seismic regions. Earthq. Eng. Struct. Dynam. 2013, 42, 25–41. [Google Scholar] [CrossRef]
  58. Pinho, R. GEM: A participatory framework for open, state-of-the-art models and tools for earthquake risk assessment worldwide. In Proceedings of the 15th World Conference on Earthquake Engineering, Lisbon, Portugal, 24–28 September 2012. [Google Scholar]
  59. Faravelli, M.; Polli, D.; Quaroni, D.; Onida, M.; Pagano, M.; Di Meo, A.; Borzi, B. Italian platform for seismic risk and damage scenario evaluation. In Proceedings of the COMPDYN 2019, 7th International Conference on Computational Methods in Structural Dynamics and Earthquake Engineering, Crete, Greece, 24–26 June 2019; pp. 1630–1640. [Google Scholar]
  60. Borzi, B.; Onida, M.; Faravelli, M.; Polli, D.; Pagano, M.; Quaroni, D.; Cantoni, A.; Speranza, E.; Moroni, C. IRMA platform for the calculation of damages and risks of Italian residential buildings. Bull. Earthq. Eng. 2020. [Google Scholar] [CrossRef]
  61. Dolce, M.; Prota, A.; Borzi, B.; da Porto, F.; Lagomarsino, S.; Magenes, G.; Moroni, C.; Penna, A.; Polese, M.; Sperenza, E.; et al. Seismic risk assessment of residential buildings in Italy: Methodology overview and main results. Bull. Earthq. Eng. 2020. in phase of publication. [Google Scholar] [CrossRef]
  62. Da Porto, F.; Donà, M.; Rosti, A.; Rota, M.; Lagomarsino, S.; Cattari, S.; Borzi, B.; Onida, M.; De Gregorio, D.; Perelli, F.L.; et al. Comparative analysis of the fragility curves for Italian residential masonry and RC buildings. Bull. Earthq. Eng. 2020. in phase of publication. [Google Scholar]
  63. Di Ludovico, M.; Prota, A.; Moroni, C.; Manfredi, G.; Dolce, M. Reconstruction process of damaged residential buildings outside historical centres after the L’Aquila earthquake: Part I—“light damage” reconstruction. Bull. Earthq. Eng. 2017, 15, 667–692. [Google Scholar] [CrossRef]
  64. Di Ludovico, M.; Prota, A.; Moroni, C.; Manfredi, G.; Dolce, M. Reconstruction process of damaged residential buildings outside historical centres after the L’Aquila earthquake: Part II—“heavy damage” reconstruction. Bull. Earthq. Eng. 2017, 15, 693–729. [Google Scholar] [CrossRef]
  65. Donà, M.; Bizzaro, L.; Carturan, F.; da Porto, F. Effects of business recovery strategies on seismic risk and cost-effectiveness of structural retrofitting for business enterprises. Earthq. Spectra 2019, 35, 1795–1819. [Google Scholar] [CrossRef]
  66. Spence, R.J.S. Human casualties in earthquakes: Modelling and mitigation. In Proceedings of the 9th Pacific Conference on Earthquake Engineering, Aukland, New Zealand, 14–16 April 2011. [Google Scholar]
  67. Zuccaro, G.; Cacace, F. Seismic Casualty Evaluation: The Italian Model, an Application to the L’Aquila 2009 Event. In Human Casualties in Earthquakes, Advances in Natural and Technological Hazards Research; Spence, R., So, E., Scawthorn, C., Eds.; Springer: Dordrecht, The Netherlands, 2011; Volume 29. [Google Scholar] [CrossRef]
  68. Alexander, D.E. Mortality and Morbidity Risk in the L’Aquila, Italy Earthquake of 6 April 2009 and Lessons to be Learned. In Human Casualties in Earthquakes—Progress in Modelling and Mitigation, Advances in Natural and Technological Hazards Research; Spence, R., So, E., Scawthorn, C., Eds.; Springer: Dordrecht, Germany, 2011; Volume 29. [Google Scholar] [CrossRef]
  69. Dolce, M.; Di Bucci, D. Comparing recent Italian earthquakes. Bull. Earthq. Eng. 2017, 15, 497–533. [Google Scholar] [CrossRef]
  70. Dolce, M.; Di Bucci, D. The 2016–2017 Central Apennines Seismic Sequence: Analogies and Differences with Recent Italian Earthquakes. In Recent Advances in Earthquake Engineering in Europe; Pitilakis, K., Ed.; Proceeding of: ECEE 2018; Geotechnical, Geological and Earthquake Engineering; Springer: Cham, Switzerland, 2018; p. 46. [Google Scholar] [CrossRef]
  71. Prime Minister’s Office. Order n. 3519, 28 April 2006, G.U. n.108, 11/05/2006. In Criteri generali per l’individuazione delle zone sismiche e per la formazione e l'aggiornamento degli elenchi delle medesime zone. Available online: http://www.protezionecivile.gov.it/amministrazione-trasparente/provvedimenti/dettaglio/-/asset_publisher/default/content/opcm-n-3519-del-28-aprile-2006-criteri-generali-per-l-individuazione-delle-zone-sismiche-e-per-la-formazione-e-l-aggiornamento-degli-elenchi-delle-ste (accessed on 16 November 2020). (In Italian)
  72. Open Source Geospatial Foundation. QGIS 15th Annual General Meeting, Girona, Spain. 2018. Available online: https://qgis.org (accessed on 1 November 2020).
  73. Ferreira, T.M.; Maio, R.; Vicente, R. Analysis of the impact of large-scale seismic retrofitting strategies through the application of a vulnerability-based approach on traditional masonry buildings. Earthq. Eng. Eng. Vib. 2017, 16, 329–348. [Google Scholar] [CrossRef]
  74. INGV. Terremoti nella Storia. I Terremoti del ‘900: Il Terremoto del Friuli del 6 Maggio 1976. 2014. Available online: https://ingvterremoti.com/2014/05/06/speciale-i-terremoti-del-900-il-terremoto-del-friuli-6-maggio-1976 (accessed on 1 November 2020).
  75. Tomasella, P. Giovanni Donadon. Architetture per la Città Nuova. Pordenone 1950–1985; Grafiche Oderzo Srl.: Oderzo, Italy, 2011. [Google Scholar]
  76. Capomolla, R.; Vittorini, R. L’architettura Ina Casa (1949–1963). In Aspetti e Problemi di Conservazione e Recupero; Gangemi: Roma, Italy, 2003. (In Italian) [Google Scholar]
  77. Ministry of Public Works. Instructions for the Application of the “Update of Technical Standards for Constructions 2018”; Circular 2019/02/21, “S.O. No. 35 G.U. 11/02/2019”; CNTC, Ministry of Public Works: Rome, Italy, 2019. (In Italian)
  78. European Committee for Standardization EN 1998-1. Eurocode 8: Design of Structures for Earthquake Resistance—Part 1: General Rules, Seismic Actions and Rules for Buildings; European Committee for Standardization: Brussels, Belgium, 2004. [Google Scholar]
  79. Margottini, C.; Molin, D.; Serva, L. Intensity versus ground motion: A new approach using Italian data. Eng. Geol. 1992, 33, 45–58. [Google Scholar] [CrossRef]
  80. Ministry of Public Works. Update of the “Technical Standards for Constructions” 2018; DM 2018/01/17, S.O. No. 8 G.U. 20/02/2018, No. 32; NTC, Ministry of Public Works: Rome, Italy, 2018. (In Italian) [Google Scholar]
  81. Stucchi, M.; Akinci, A.; Faccioli, E.; Gasparini, P.; Malagnini, L.; Meletti, C.; Montaldo, V.; Valensise, G. Redazione della Mappa di Pericolosità Sismica Prevista dall’Ordinanza PCM 3274 del 20 Marzo 2003; Rapporto Conclusivo per il Dipartimento della Protezione Civile: Rome, Italy, 2004. (In Italian) [Google Scholar]
  82. Stucchi, M.; Meletti, C.; Montaldo, V.; Crowley, H.; Calvi, G.M.; Boschi, E. Seismic hazard assessment (2003–2009) for the Italian building code. Bull. Seism. Soc. Am. 2011, 101, 1885–1911. [Google Scholar] [CrossRef]
  83. PRGC. Piano Regolatore Generale Comunale; Report Geologico Comune di Pordenone; PRGC: Pordenone, Italy, 2014. (In Italian) [Google Scholar]
  84. Collareda, M. Lo Studio di Microzonazione Sismica. In Adozione del Nuovo Piano Regolatore Generale Comunale. Carta delle Microzone Omogenee in Prospettiva Sismica del Comune di Pordenone; Comune di Pordenone: Pordenone, Italy, 2015. (In Italian) [Google Scholar]
Figure 1. Framework of procedure.
Heritage 03 00080 g001
Figure 2. Geographic information system (GIS)-based multilevel database structure: (a) building; (b) census unit; (c) district; (d) town.
Heritage 03 00080 g002
Figure 3. Location of 9 CARTIS districts in municipality of Pordenone.
Heritage 03 00080 g003
Figure 4. Masonry building types (CARTIS) in Pordenone: (a,b), pre-1919 types (low, medium-high); (c,d), 1919–1945 types (low and medium-high); (e,f), post-1945 types (low and medium-high).
Heritage 03 00080 g004
Figure 5. Building types in all districts of Pordenone (d1–d9): (a) n° of masonry buildings; (b) n° of r.c. buildings.
Heritage 03 00080 g005
Figure 6. Masonry CARTIS types in all districts of Pordenone (d1–d9): (a) % of masonry-built types MUR1–MUR2 (pre-1945); (b) % of masonry-built types MUR3–MUR4 (post-1945).
Heritage 03 00080 g006
Figure 7. The GIS-based CARTIS database (building level), masonry-built CARTIS types in Pordenone: (a) district 1—old town; (b) district 3—the suburbs.
Heritage 03 00080 g007
Figure 8. Census unit level—n° of masonry buildings: (a) district 1—old town; (b) district 3—the suburbs.
Heritage 03 00080 g008
Figure 9. District level—n° of buildings by district: (a) district 1—old town; (b) district 3—the suburbs.
Heritage 03 00080 g009
Figure 10. Detail of QGIS database of old town of Pordenone: (a) CARTIS masonry types (MUR1/MUR2/MUR3/MUR4); (b) new subtypes classification (MUR1-T1/T2/T3/T4).
Heritage 03 00080 g010
Figure 11. Subtypes of old town: (a) MUR1-T1 (48%); (b) MUR1-T2 (24%); (c) MUR1-T3 (15%); (d) MUR1-T4 (13%).
Heritage 03 00080 g011aHeritage 03 00080 g011b
Figure 12. Construction of the fragility curves (White) for types (MUR1–MUR4) and subtypes (T1–T4) identified in CARTIS analysis of Pordenone.
Heritage 03 00080 g012
Figure 13. Comparison of White curves for examined types, corresponding to DS2-3 damage levels.
Heritage 03 00080 g013
Figure 14. Lower-Bounds, White, and Upper-Bounds curves, corresponding to a DS2-3 damage level for MUR1-4.
Heritage 03 00080 g014
Figure 15. Optimal combination between mechanical curves and DS2-3 curves of the reference model.
Heritage 03 00080 g015
Figure 16. Fragility curve sets (from DS1 to DS5) of LUW model of all CARTIS types.
Heritage 03 00080 g016
Figure 17. Conditional damage maps for masonry buildings types of old town and all damage states for return period Tr = 475 years: (a) DS1; (b) DS2; (c) DS3; (d) DS4; (e) DS5.
Heritage 03 00080 g017
Figure 18. Conditional damage maps for DS3 at different urban scales (single buildings, ISTAT section, CARTIS district) for return period Tr = 475 years.
Heritage 03 00080 g018aHeritage 03 00080 g018b
Figure 19. Unconditional damage maps for observation times To = 10 years and To = 50 years at different urban scales (single buildings, ISTAT section, CARTIS district).
Heritage 03 00080 g019aHeritage 03 00080 g019b
Figure 20. General framework for risk assessment.
Heritage 03 00080 g020
Figure 21. Loss/impact maps for observation time of 10 years.
Heritage 03 00080 g021aHeritage 03 00080 g021b
Figure 22. Loss/impact maps for observation time of 50 years.
Heritage 03 00080 g022aHeritage 03 00080 g022b
Table 1. Multicriteria framework for QGIS–based urban scale seismic risk assessment.
GIS–Database Design GIS–LayersGIS–Criteria of Analysis
1. General urban dataGoogle Satellite, CTR (Regional technical map), urban plans, territorial information, census statistics (ISTAT), geotechnical studies, etc.Preliminary studies
(a) historical analysis
(b) urban expansion and conformation
(c) soil classification: A (rock)–E (clay)
(d) ISTAT database
2. Typological analysis (CARTIS)CARTIS form (2014)
CARTIS form (2016)
Civil building types characterization
(a) masonry structure (MUR)
(b) r.c. structure (CAR)
(c) masonry-built subtypes (old town)
3. Vulnerability analysis vulnerability of masonry-built types Vulnerability functions
(a) vulnerability index (GNDT second level)
(b) fragility curves (DS2/DS3) (Vulnus VB 4.0)
(c) local fragility model (DS1–DS5)
4. Seismic damage assessment conditional damage Design prediction of damage/DS1–DS5
Tr = 475 years
unconditional damage Observation time (To)/DS1–DS5
To = 10 years
To = 50 years
5. Urban seismic risk assessmentLosses and impactPrediction features
(a) economic losses
(b) casualties
(c) impact
Table 2. The first level CARTIS (2014) and second level CARTIS (2016) approach.
SectionsCARTIS (2014)–1st Level (District Scale)CARTIS (2016)–2nd Level (Building Scale)
Section 0Municipality and districts statisticsBuilding statistics
Section 1Building type identificationBuilding identification
Section 2General features (building type)Building features
Section 3aStructural classification (masonry type)Structural classification (masonry building)
Section 3bStructural classification (r.c. type)Structural classification (r.c. building)
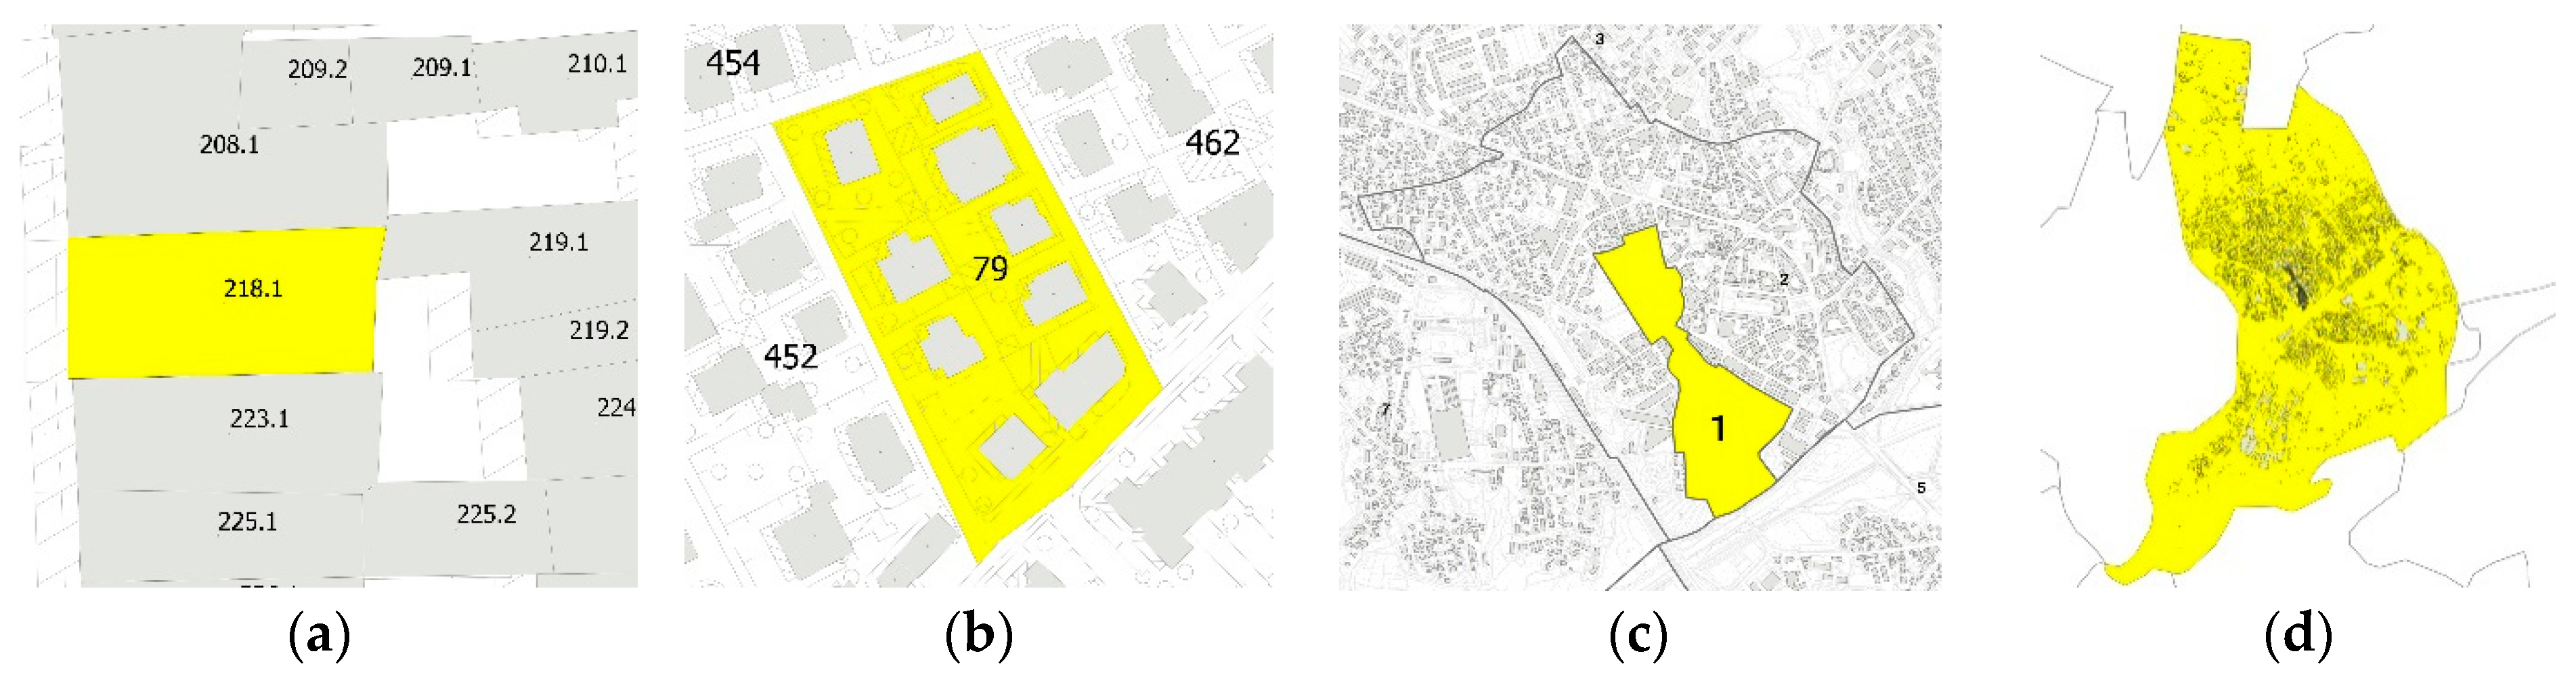
Table 3. Multilevel approach for urban scale seismic risk assessment.
LevelScaleGIS–Shapes
Level 1Building Layer—Cartis Edificio (2016)
Level 2Census unit Layer—Census units (ISTAT)
Level 3District Layer—Cartis (2014)
Level 4TownLayer—Pordenone district town
Table 4. Details of CARTIS districts of Pordenone.
CARTS DistrictNameSurface (km2)
District 1Old town0.33
District 2First expansion1.55
District 3Second expansion3.88
District 4Torre2.89
District 5Borgomeduna4.45
District 6San Gregorio5.50
District 7Rorai Grande1.87
District 8Northern suburbs8.60
District 9Vallenoncello and Villanova9.14
Table 5. Definition of CARTIS building types (masonry) of Pordenone based on: number of floors, average floor surface, construction period, common use, vertical and horizontal structures, openings on facade, roofs.
CARTIS
Types
n° Floors Surface [m2]Construction PeriodUseWallsFloorsOpenings Roofs
MUR1
(district 1)
2–4100–200<1919Residential
Commercial
Public services
Ashlars and bricks
(lime mortar)
Single-double layered timber structure20/29%Timber
MUR1
(districts 3–9)
2–4100–3001919–1945Residential Ashlars and bricks (lime mortar)Single-double layered timber structure10/19%Timber
MUR22–3100–200<1919 Residential
Disuse
Rubble stone
(poor mortar)
Single-double layered timber structure10/19%Timber
MUR32–3100–3001945–1970ResidentialBricks
(good mortar)
Precast r.c. structures
(SAP, Varese)
20/29%Precast r.c.
MUR44–6170–5001945–1970ResidentialBricks
(good mortar)
Precast r.c. structures
(SAP, Varese)
20/29%Precast r.c.
Table 6. Number of masonry buildings by CARTIS type for all districts based on: construction period, number of floors and structural features.
Cartis Masonry Types
Construction PeriodPre-1945Post-1945
N° of floors2–32–3≤ 3> 3
CARTIS typesMUR 1MUR 2MUR3MUR4
N° of building for districts
District 1624710211
District 2214198840
District 326157914126
District 4845865443
District 5242551946
District 653335648
District 71281227021
District 893103765
District 9168133710
Total of buildings18671723616350
Table 7. Subtypes of old town of Pordenone.
SubtypesShapeSurface (m2)
MUR1-T1Rectangular plan (x-y directions)<150
MUR1-T2Small regular square plan<80
MUR1-T3Large quadrangular plan80–300
MUR1-T4Irregular plan (corner units)80–200
Table 8. Macro-typologies and number of sampled unreinforced masonry (URM) buildings.
Cartis Masonry TypesNumber of Sampled Buildings
MUR1T11025
T25
T35
T45
MUR2 10
MUR3 15
MUR4 10
TOT 60
Table 9. Mean values of indices obtained from Vulnus analysis, sort by masonry type.
TypeI1I2I3
MUR1-T10.4080.5670.387
MUR1-T20.4950.8300.296
MUR1-T30.5660.4050.321
MUR1-T40.4510.4800.435
MUR20.2040.2650.483
MUR31.0020.3820.336
MUR40.5220.3750.242
Table 10. Optimal combination percentages of vulnerability classes of reference model fitting Vulnus one.
Building TypesUpper-BoundWhiteLower-Bound
ABCDABCDBCDE
MUR1-T1 55%45% 97%3% 55%45%
MUR1-T2 97%3% 32%68% 65%35%
MUR1-T3 20%80% 68%32% 2%98%
MUR1-T4 45%55% 86%14% 12%88%
MUR283%17% 21%79% 69%31%
MUR3 87%13% 32%68% 80%20%
MUR4 18%82% 71%29% 9%91%
Table 11. Mean (µ) and standard deviation (β) values of DS1–DS5 fragility curves for CARTIS types.
Building TypesDS1
(Slight)
DS2
(Moderate)
DS3
(Severe)
DS4
(Partial Collapse)
DS5
(Complete Collapse)
µ [g]β [-]µ [g]β [-]µ [g]β [-]µ [g]β [-]µ [g]β [-]
MUR1-T10.1160.73310.20580.75590.33240.74990.53780.77930.98310.8193
MUR1-T20.15890.80070.28190.82020.45540.79760.73780.79841.34400.6915
MUR1-T30.13380.73320.23750.77020.38350.76550.61940.77581.12500.7466
MUR1-T40.12230.79290.21700.83350.35030.82370.56630.82051.03200.8083
MUR20.06260.74620.11120.77440.17950.77340.28990.77980.52130.8153
MUR30.16130.72940.28620.75820.46250.76080.74960.78211.36600.6929
MUR40.13180.72490.23390.75550.37760.74800.61000.74751.10800.7334
Table 12. Values of maximum horizontal acceleration (ag), maximum value of the amplification factor for horizontal acceleration spectrum (FO), reference value for determining beginning of plateau in horizontal acceleration spectrum (Tc*) for Pordenone, according to Italian code [80].
Tr (Years)3050721011402014759752475
ag0.0530.0700.0840.0990.1150.1360.1970.2610.375
FO2.4592.4532.4512.4452.4272.4342.4412.4862.453
Tc*0.2400.2640.2730.2840.2960.3150.3330.3460.370
Table 13. Description of soil types according to Italian code [80].
Soil TypeDescription
Soil Arocky or very rigid soils
Soil Bsoft rocks and deposits of very dense coarse-grained soils or very consistent fine-grained soils
Soil Cdeposits of medium dense coarse-grained soils or medium consistent fine-grained soils, with a depth of more than 30 m
Soil Ddeposits of poorly dense coarse-grained soils or poorly consistent fine-grained soils, with a depth of more than 30 m
Soil Esoils with characteristics like those defined for categories C or D, with a depth not exceeding 30 m
Table 14. Probability of exceedance five damage levels (DS1–DS5) for masonry building types of old town (Tr = 475 and soil C).
Tr = 475 Years  PGA = 0.278  Soil C
TypeDS1DS2DS3DS4DS5
MUR1-T188.3%65.5%40.6%19.9%6.2%
MUR1-T275.8%49.3%26.8%11.1%1.1%
MUR1-T384.1%58.1%33.7%15.1%3.1%
MUR1-T484.9%61.7%38.9%19.3%5.2%
MUR297.7%88.2%71.4%47.9%22.0%
MUR377.2%48.5%25.2%10.2%1.1%
MUR484.8%59.0%34.1%14.7%2.8%
Table 15. Probability of exceedance for all damage states (DS1–DS5) for masonry building types of old town (To = 10 years and soil C).
To = 10 Years–Soil C
TypeDS1DS2DS3DS4DS5
MUR1-T114.53%7.54%3.45%1.39%0.38%
MUR1-T210.67%5.08%2.08%0.71%0.06%
MUR1-T312.63%6.22%2.71%1.00%0.17%
MUR1-T413.87%7.46%3.58%1.41%0.31%
MUR222.06%15.08%9.14%4.60%1.66%
MUR310.21%4.55%1.83%0.64%0.06%
MUR412.81%6.26%2.69%0.93%0.16%
Table 16. Probability of exceedance for all damage states (DS1–DS5) for masonry building types of old town (To = 50 years and soil C).
To = 50 Years–Soil C
TypeDS1DS2DS3DS4DS5
MUR1-T147.35%26.71%13.21%5.65%1.61%
MUR1-T235.94%18.45%8.19%2.98%0.29%
MUR1-T342.01%22.40%10.55%4.13%0.76%
MUR1-T445.17%26.04%13.42%5.65%1.35%
MUR266.81%48.62%31.52%17.03%6.58%
MUR335.00%16.97%7.34%2.71%0.28%
MUR442.59%22.63%10.53%3.91%0.74%
Table 17. Matrix for: a. economic losses (% of cost of repair or replacement—minimum and maximum set), b. casualties (% of fatalities and injuries) and c. impact on buildings (% of useable, not usable in short or long-time span, and collapsed buildings).
% of Damage ResultsDS1DS2DS3DS4DS5
a. Economic losses
Cost of repair or replacement, minimum set2103060100
Cost of repair or replacement, maximum set5204580100
b. Casualties
Fatalities000110
Injuries000530
c. Impact on buildings
Usable10060000
Not usable in short time span0404000
Not usable in long-time span00601000
Collapsed0000100
Table 18. Loss/impact results for each district in Pordenone: observation time of 10 years.
Economic Loss (Min. Set)Economic Loss (Max. Set)Economic Losses (Average)Fatalities (People)Injuries
(People)
Usable BuildingsNot Usable Buildings
(Short Time)
Not usable Buildings
(Long Time)
Collapsed Buildings
District 1EUR 6,132,636 EUR 9,388,813 EUR 7,760,725 0.411.42707.5017.2615.722.51
District 2EUR 6,057,290 EUR 9,328,814 EUR 7,693,052 0.652.25345.397.606.931.08
District 3EUR 7,625,814 EUR 12,273,975 EUR 9,949,895 0.853.041326.3116.7013.541.45
District 4EUR 4,115,665 EUR 6,589,042 EUR 5,352,353 0.451.60820.609.607.910.89
District 5EUR 10,448,314 EUR 16,202,988 EUR 13,325,651 1.033.70774.5118.4117.191.89
District 6EUR 6,036,391 EUR 9,442,925 EUR 7,739,658 0.582.12439.4410.279.500.79
District 7EUR 4,091,227 EUR 6,370,774 EUR 5,231,001 0.481.68415.477.816.900.82
District 8EUR 2,155,138 EUR 3,520,580 EUR 2,837,859 0.130.48475.524.663.520.31
District 9EUR 6,932,979 EUR 10,708,684 EUR 8,820,832 0.662.36490.9412.2511.551.26
PordenoneEUR 53,595,454EUR 83,826,596EUR 68,711,0255.2318.665795.67104.5792.7610.99
Table 19. Loss/impact results for each district in Pordenone: observation time of 50 years.
Economic Loss (Min. Set)Economic Loss (Max. Set)Economic Losses (Average)Fatalities (People)Injuries
(People)
Usable BuildingsNot Usable Buildings
(Short Time)
Not Usable Buildings
(Long Time)
Collapsed Buildings
District 1EUR 23,008,947 EUR 34,315,539 EUR 28,662,243 1.745.94612.7059.4460.1210.73
District 2EUR 22,829,594 EUR 34,275,205 EUR 28,552,399 2.759.48303.4626.4026.564.58
District 3EUR 29,984,264 EUR 47,180,557 EUR 38,582,410 3.7213.271234.8161.9054.896.39
District 4EUR 16,153,984 EUR 25,308,489 EUR 20,731,236 1.956.93767.4835.6831.983.87
District 5EUR 38,743,935 EUR 58,697,885 EUR 48,720,910 4.2815.21675.3363.4465.297.94
District 6EUR 22,319,754 EUR 34,141,694 EUR 28,230,724 2.408.76384.8535.5536.243.36
District 7EUR 15,453,624 EUR 23,505,898 EUR 19,479,761 2.017.04372.9627.6426.873.53
District 8EUR 8,653,865 EUR 13,821,626 EUR 11,237,745 0.592.14449.9417.8914.771.40
District 9EUR 25,540,647EUR 38,554,404EUR 32,047,5252.709.64425.0741.9743.675.30
PordenoneEUR 202,688,613EUR 309,801,296EUR 256,244,95522.1478.415226.60369.90360.4147.10
Publisher’s Note: MDPI stays neutral with regard to jurisdictional claims in published maps and institutional affiliations.

