Article

Medieval Glassworks in the City of Ferrara (North Eastern Italy): The Case Study of Piazza Municipale

1
Department of Physics and Earth Sciences, University of Ferrara, Via Saragat 1, 44121 Ferrara, Italy
2
Energy and Sustainable Economic Development Fusion and Technology for Nuclear Safety and Security Department Nuclear Safety, Security and Sustainability Division (ENEA), Italian National Agency for New Technologies, Via Martiri di Monte Sole 4, 40129 Bologna, Italy
3
Archaeological Heritage Office, Superintendence SABAP Bologna, Modena, Reggio Emilia, Ferrara Via Belle Arti 52, 40126 Bologna, Italy
*
Author to whom correspondence should be addressed.
Heritage 2020, 3(3), 819-837; https://doi.org/10.3390/heritage3030045
Submission received: 27 June 2020 / Revised: 15 July 2020 / Accepted: 15 July 2020 / Published: 17 July 2020
(This article belongs to the Special Issue Geosciences for Cultural Heritage and Archaeology)

Abstract

:
Compositional and structural characterization was carried out on transparent glass fragments found in a brick rubbish pit discovered in basal floor of the ducal palace of Ferrara, during the excavation of Piazza Municipale. This study aims to identify raw materials and glass-working techniques through X-Ray Fluorescence (XRF) quantitative chemical analyses and semi-quantitative Scanning Electron Microscopy (SEM) observations. The studied fragments were produced using siliceous-lime sands with natron as flux, and allowed us to better understand the production technologies in a historical period of great innovation for European glass art. The numerous findings of glass fragments discovered in brick underground cellars built for the specific purpose of household rubbish of wealthy complexes in Ferrara testify a consolidated system of separate discharge of solid waste into underground containers, which were closed and sealed once filled. The high volume of the finds indicates the absence of recycling of accumulated materials due to the well-being of the city. Compositional analysis confirmed the local production of glass shops in Ferrara during the late Middle Ages, characterized by differences with the glasses of the nearby city of Venice. Morphological analyses also defined the nature and relative abundance of the products, exploring the types and compositions of the Ferrara glass art.

Graphical Abstract

1. Introduction

In the Medieval-Renaissance period, the city of Ferrara was located at the end of the navigable Po river, a safe and fast waterway compared to land routes. The city was one of the main crossroads between the Adriatic coast and the internal areas of the Po valley. It was an area of attraction for traders and artisans who, by settling, transformed the city into one of the technologically advanced areas where ceramic, glass, and metallurgical workshops developed [1,2,3].
Different archaeological excavations in medieval Renaissance sites in the urban center of the city of Ferrara have discovered significant quantities and types of fragments of glass and ceramics as evidence of the flourishing glass activity of the period [4,5,6,7,8,9].
Glass, defined as the product of fusion of inorganic materials cooled to a hard condition without crystallizing, is generally characterized by high chemical stability. Often transparent or translucent, glass is made by heating a mixture of materials such as sand or soda and lime at a high temperature to form a liquid. When this liquid is taken from the furnace, it stiffens rapidly as it cools. Glass has been extensively used, thanks to its unique mechanical and chemical-physical properties, from ancient until modern times. It is therefore frequently discovered during archaeological excavations. The object of this study was to collect data on glass used in northern Italy in the Middle Ages, and in more detail in the city of Ferrara, an area where ancient glass was probably produced and processed. Scientific studies on glass produced in the second half of the first millennium AD mostly concern fragments from northern Europe [10,11], whereas more limited attention has been paid to glass produced in Italy [12,13,14,15,16,17,18]. Gruppioni [19] pointed out that raw materials and processing techniques independent from Venice were used in the glass of Ferrara, and this suggests that there were unique processing methods for the creation of glass products in Ferrara [20,21].
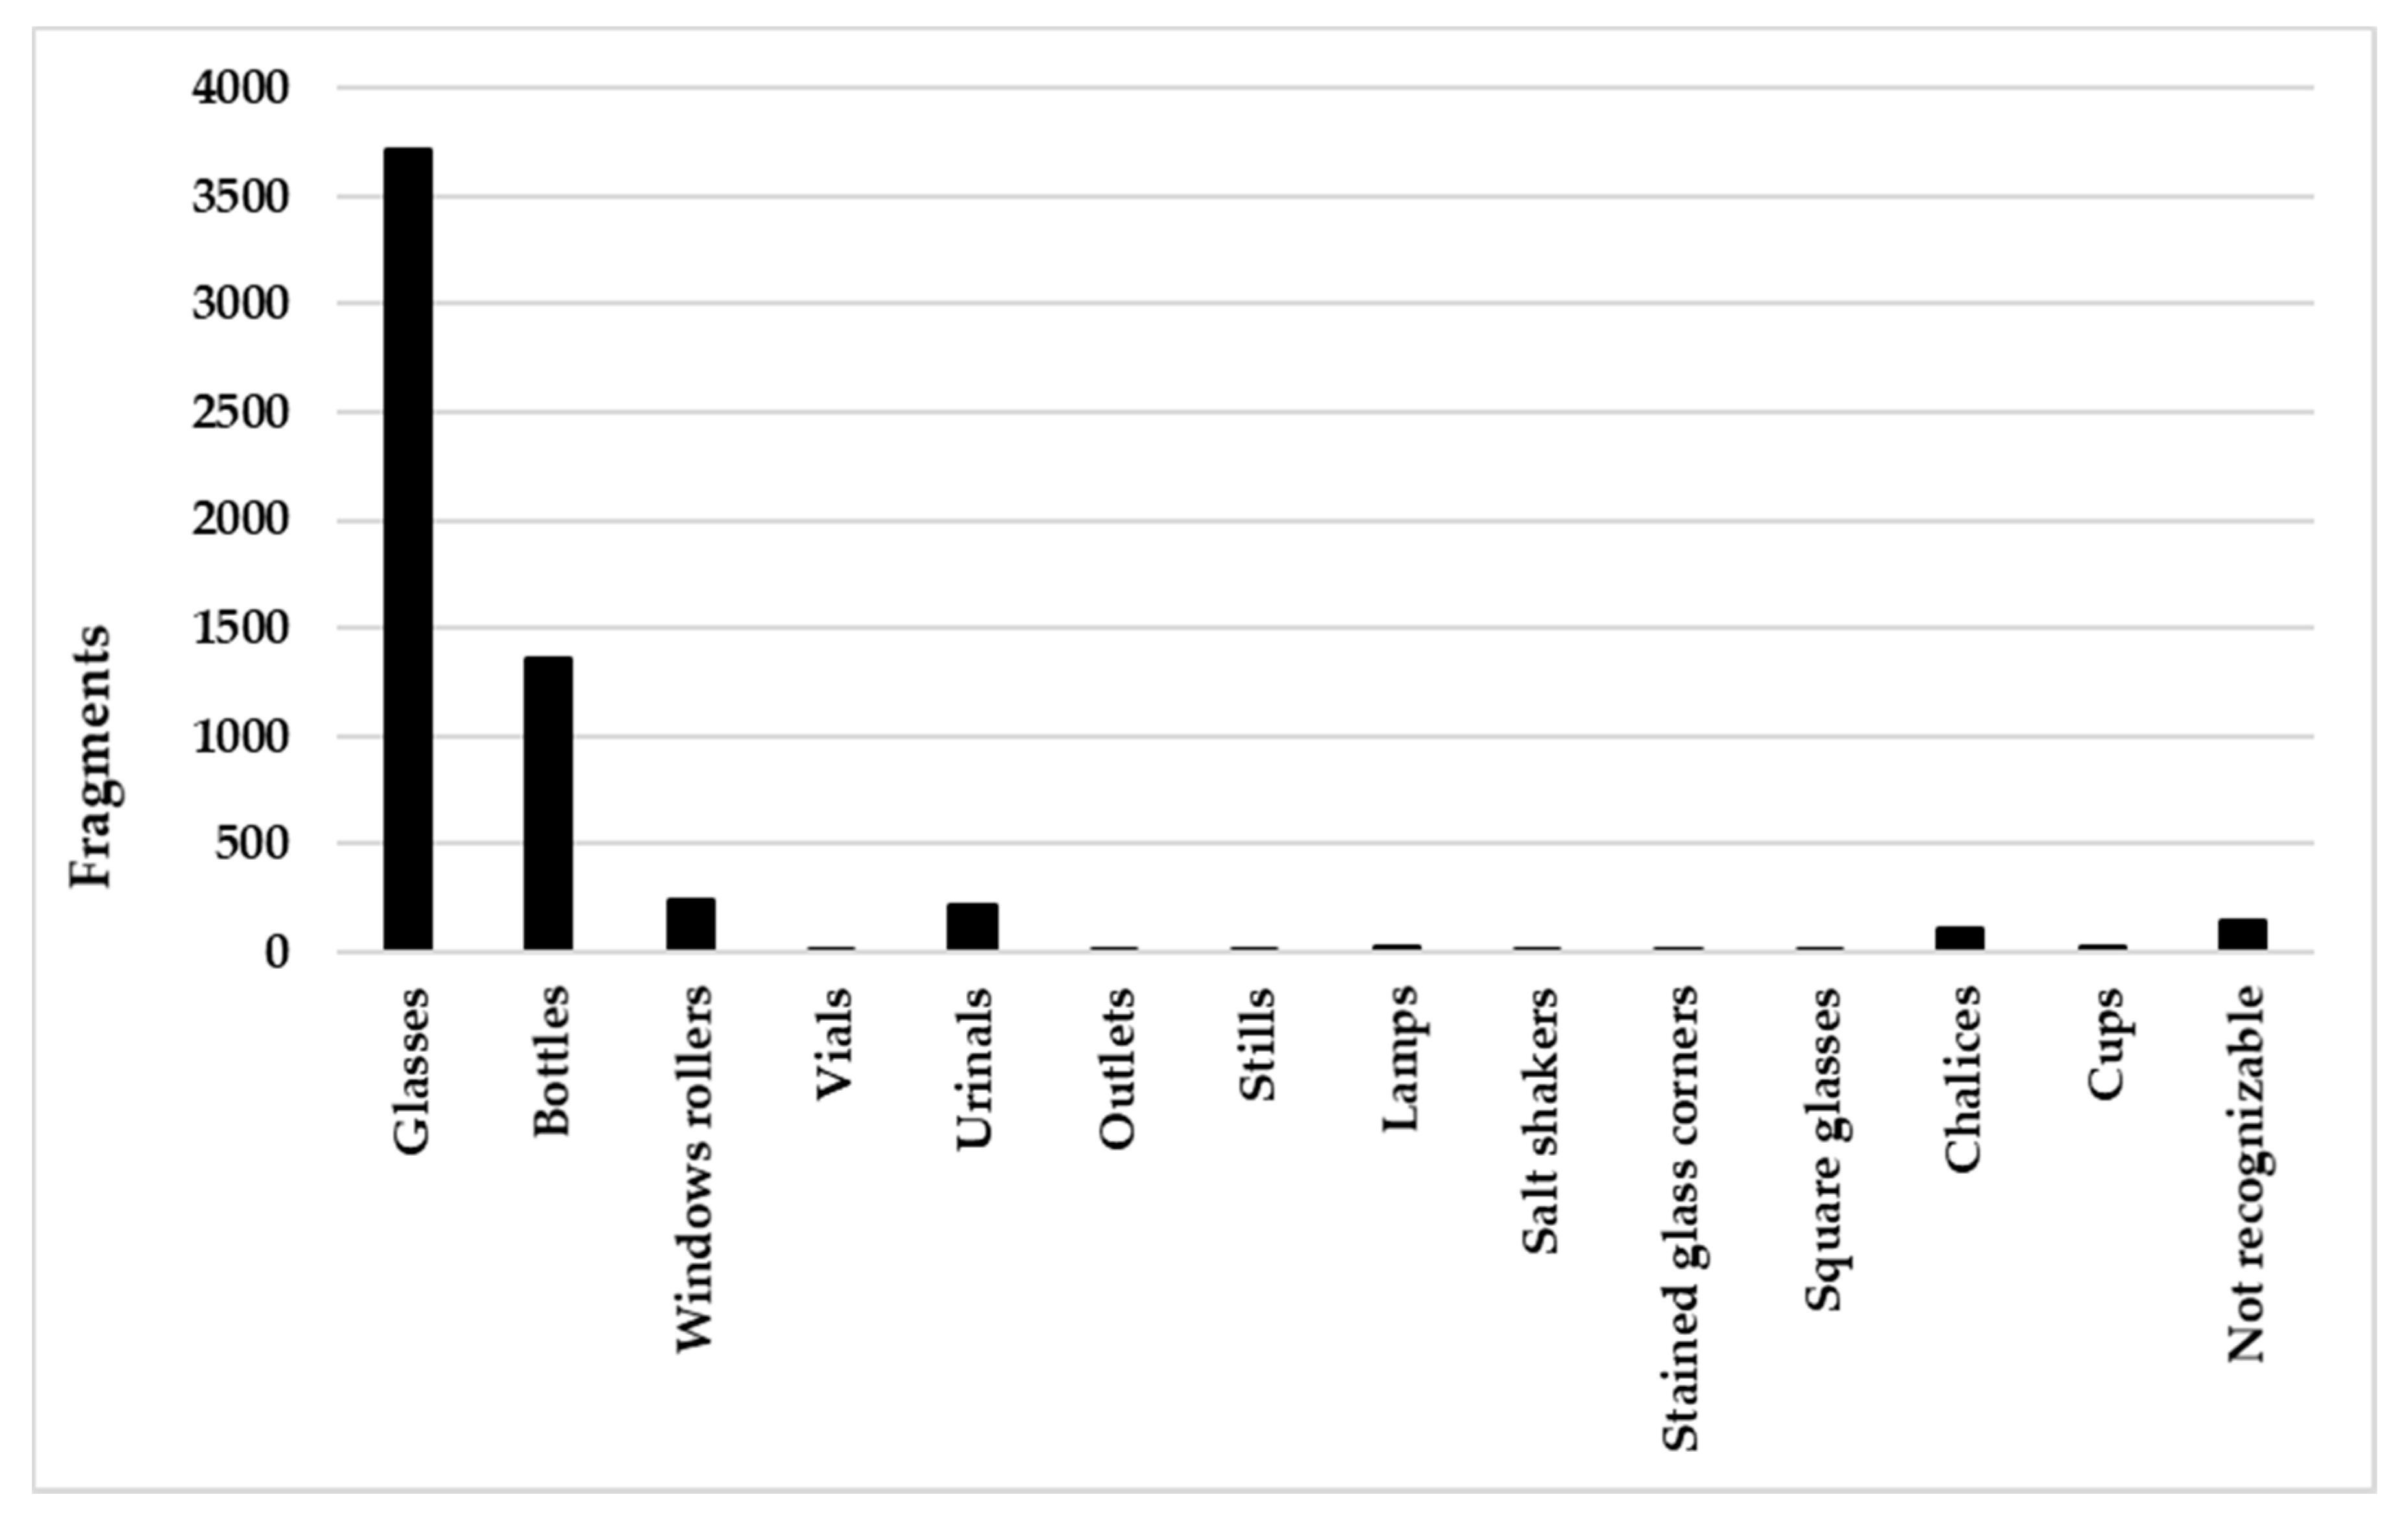
In this paper, glass fragments had been characterized after finding them in the Piazza Municipale of Ferrara (northern Italy) following repaving works. Many fragments had been found in a garbage tank free of subsequent contamination and archaeologically well characterized. During the excavation, 8198 fragments were found, currently kept at the National Archaeological Museum of Ferrara. The garbage tank, from where the studied fragments came, was in the southern side of the current Piazza Municipale, and was leaned against the foundations of the load-bearing walls of the medieval buildings. In this area, two waste discharge tanks were found, which supplied a large quantity of ceramic, glass, and metal objects and fragments. The fill, divided into stratigraphic units, was well preserved and entirely ascribed to a short period of use based on pottery and glass analyses. The period was related to the second half of the 15th century AD, but before 1479, when Eleonora d’Aragona, the wife of Duke Ercole I d’Este, wanted to demolish this part of the ducal palace to make way for a large inner courtyard, currently the Piazza Municipale [22]. The garbage tanks were made of brick and were quadrangular underground rooms covered by a barrel vault whose top was placed at the level of the floor of the Via Nova, which overlooked the ancient Palazzo del Duca, in the current Piazza Municipale, demolished in 1479 by the will of Eleonora D’Aragona [22]. The discharge chambers began to appear in Ferrara around the mid-fourteenth century and were used at least until the seventeenth century in aristocratic living contexts, such as Palazzo Paradiso and Palazzo Schifanoia, or in monastic complexes such as S. Paolo and S. Antonio in Polesine [23], or in residences belonging to the wealthy class, exemplified by the house found in Via Vaspergolo/Corso Porta Reno [7]. The waste tanks represented an ancient waste management system, in which the wet was separated from the solid and discharged into special wells and tanks equipped at the top with a disposal system that allowed the daily management of waste [8,9]. This innovative system was also adopted in the Middle Ages in other historical centers of the Emilia Romagna region [22,24]. Once filled, the structure was sealed and then abandoned; in the case of the tanks in Piazza Municipale, it was possible to refer them to the second half of the fifteenth century, and no subsequent contaminations were found. In the two tanks, the excavation operations allowed for the identification of six stratigraphic units, from which 8198 fragments of glass were found. Only the Stratigraphic Unit US1050 was investigated in this work to verify the compositional characteristics of the Ferrara glass. In the US1050 unit, the tank was sealed; this probably means that the glass fragments discovered in it were not contaminated by objects from later periods. This allows us to characterize a short chronological period more accurately. In addition, about 73% of the total fragments of glass belonging to numerous glasses, bottles, and other artefacts were found in this stratigraphic unit.
Quantitative information on the major, minor, and trace elements in archaeological artefacts including glass, is important in resolving problems connected with manufacturing technology, raw materials, and the origin of these objects. X-Ray Fluorescence analysis (XRF) allowed to us know the compositions of the glass fragments analyzed and to hypothesize the raw materials used [
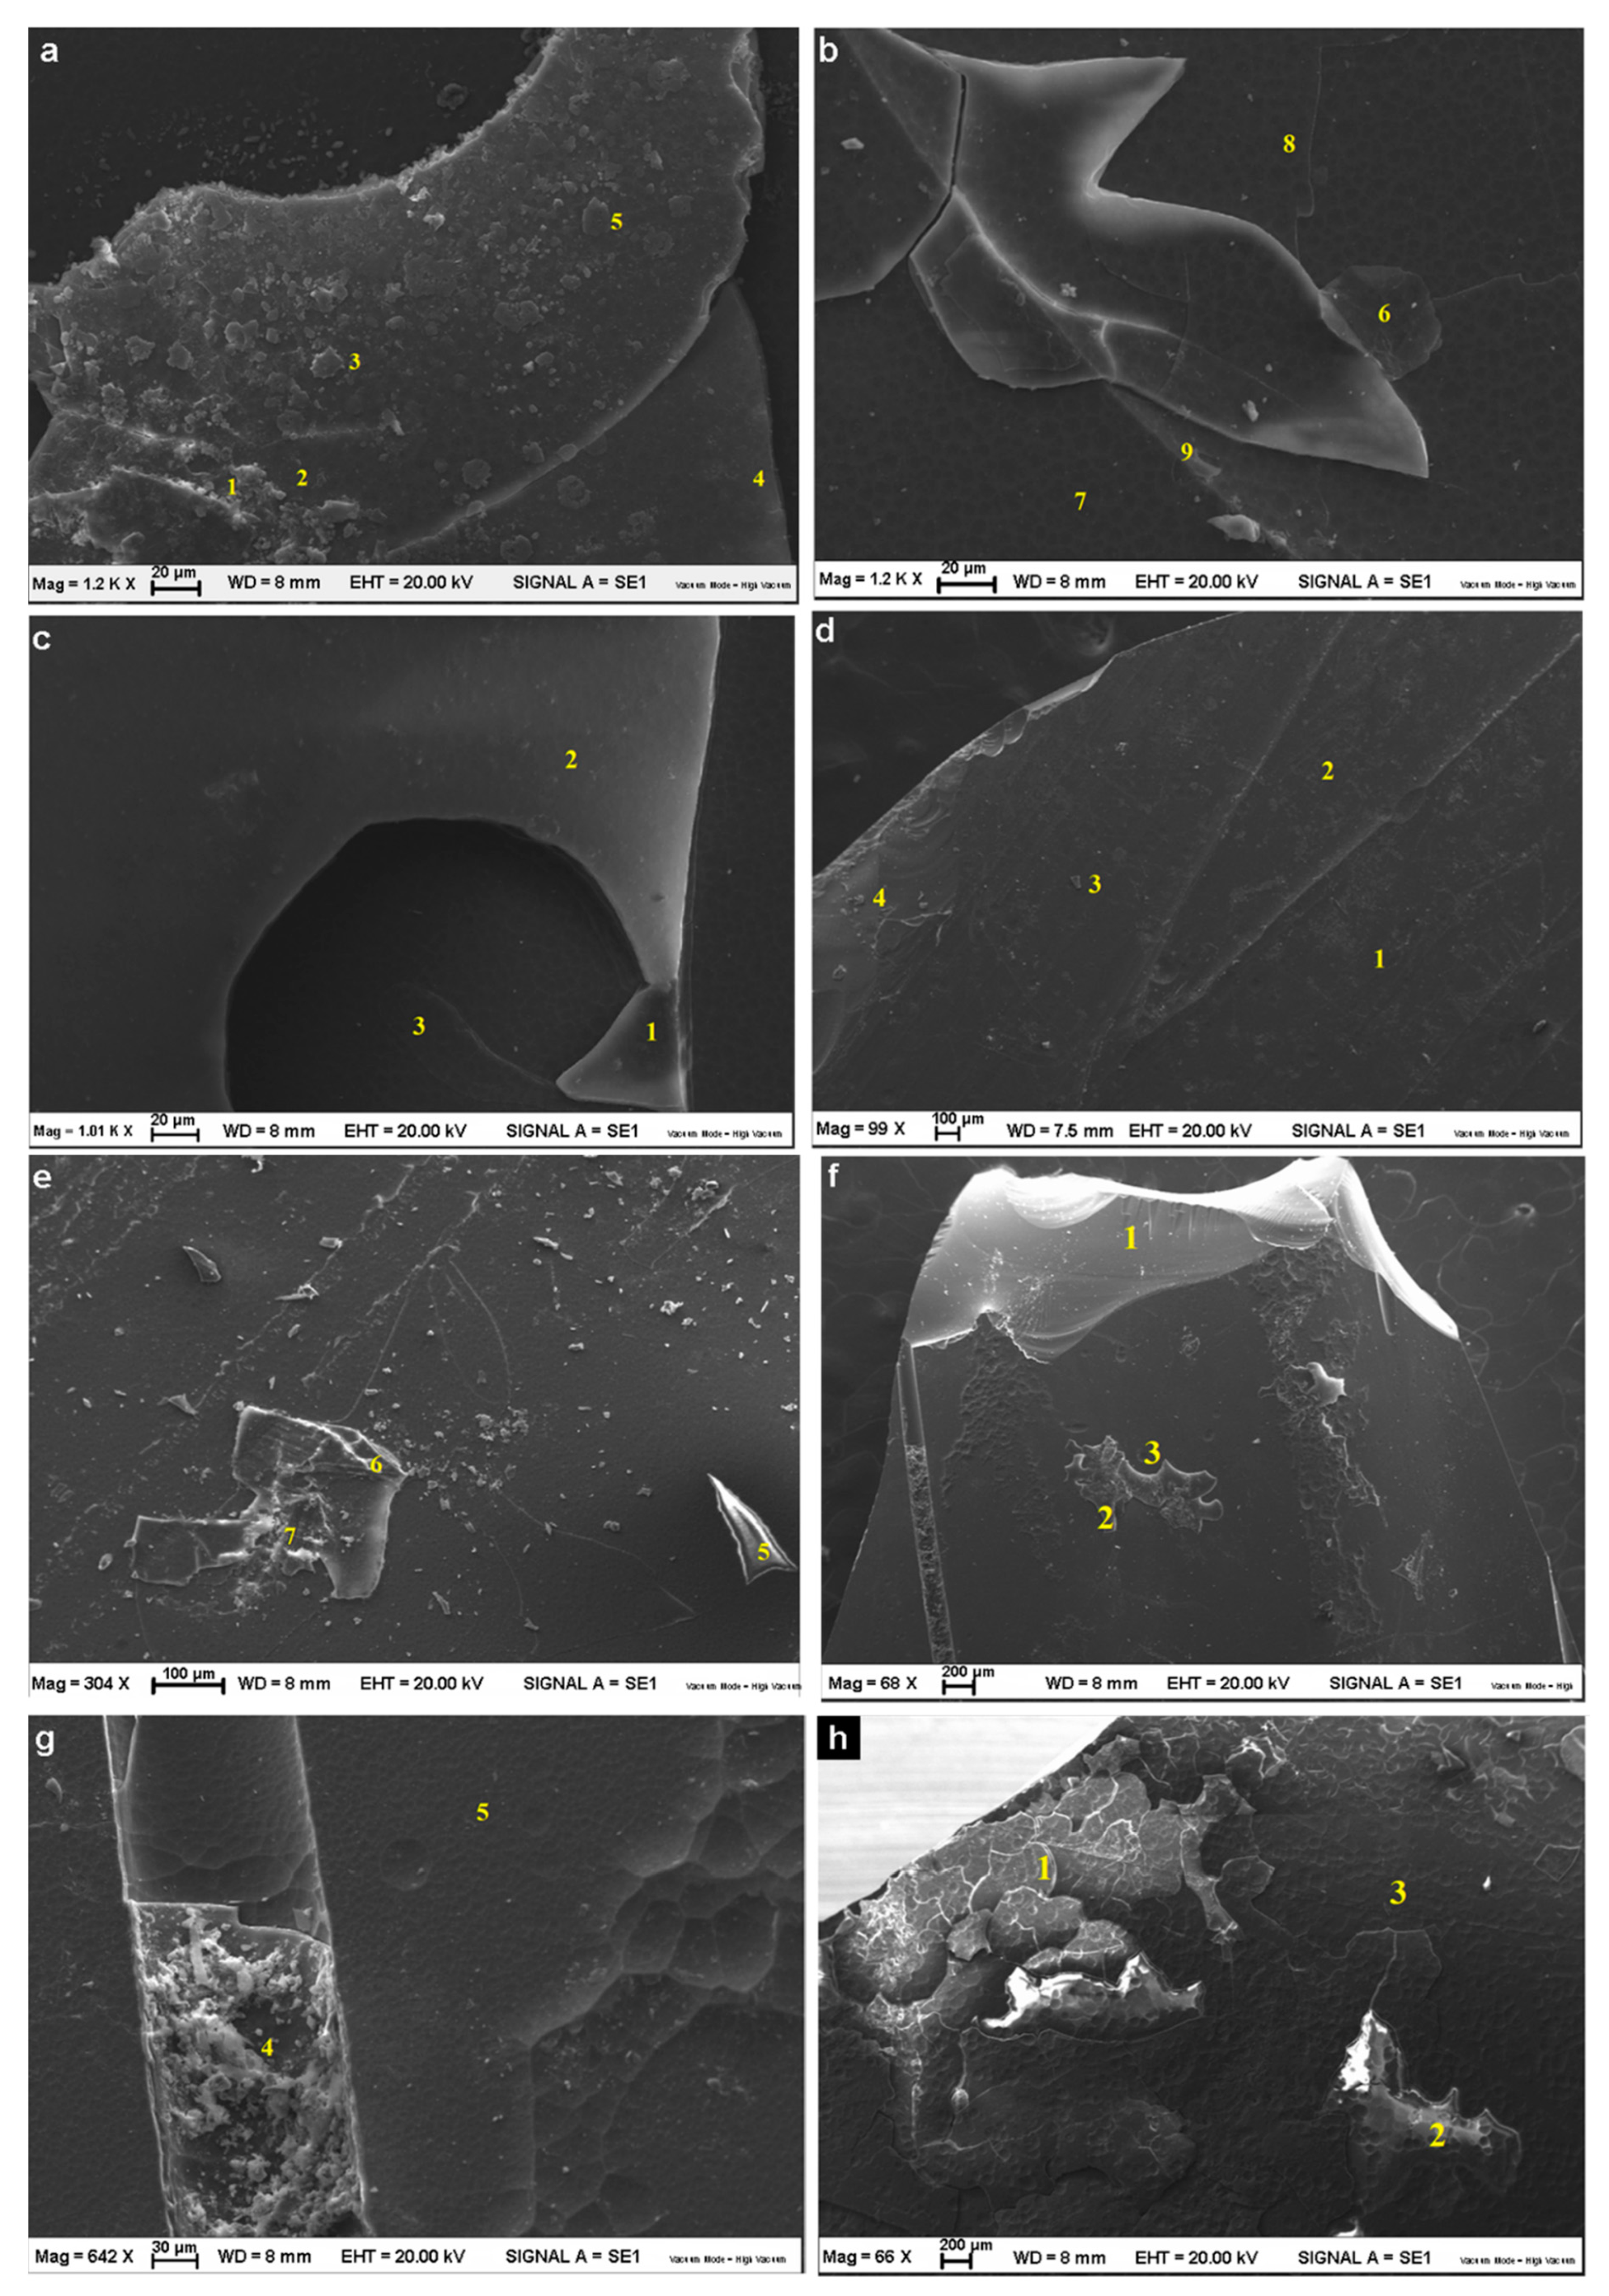
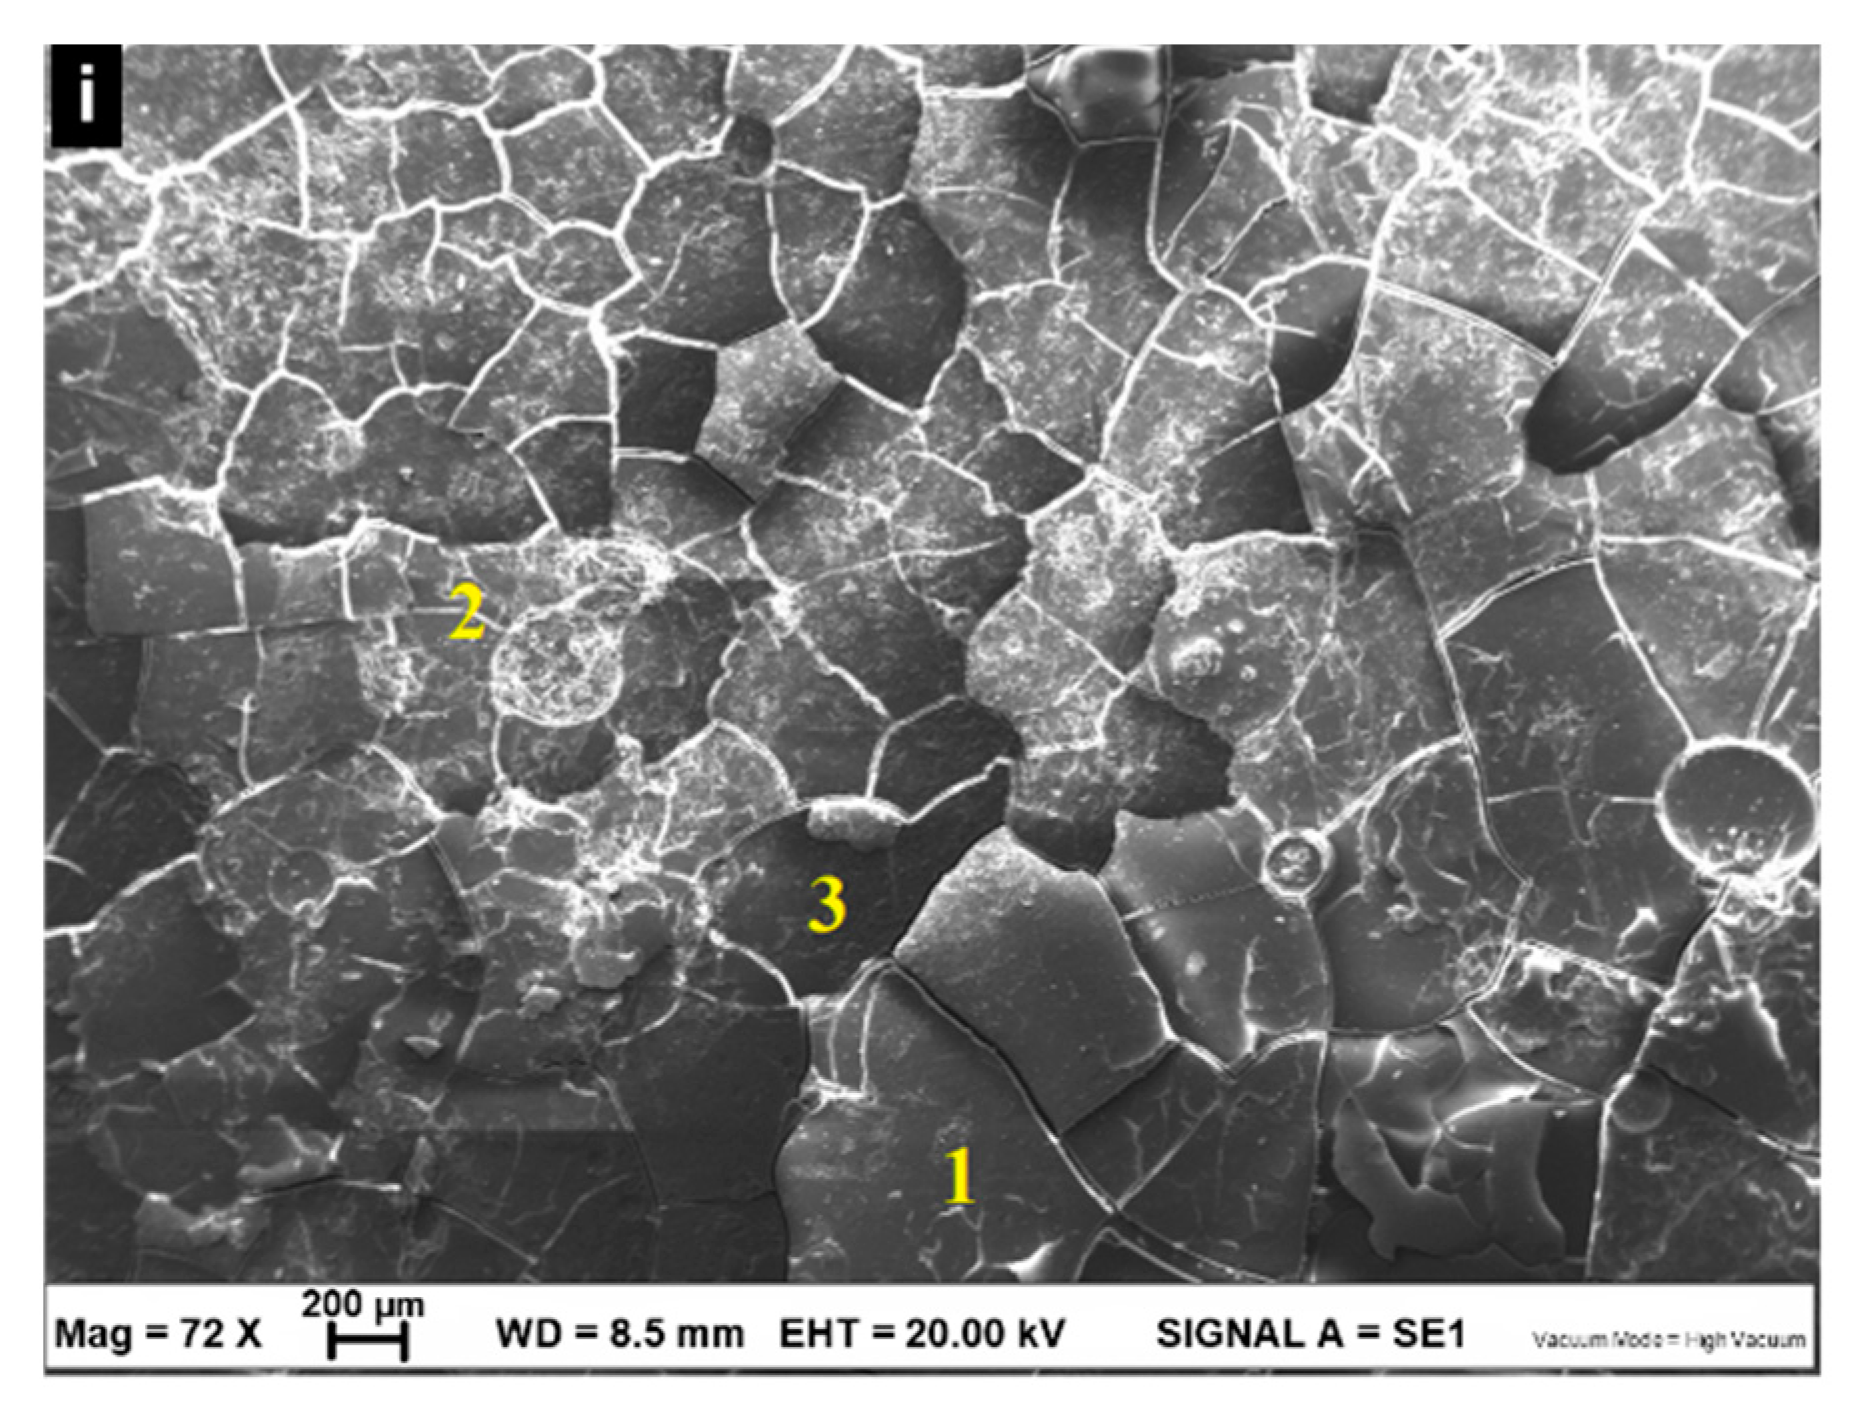
25]. In addition, Scanning Electron Microscopy (SEM) observations allow us to describe the surface in order to detect deterioration phenomena on glass objects and to characterize the phenomena of atmospheric attack observed on some fragments.
Raw materials used for the manufacture of glass are divided into formers, fluxes, and stabilizers. Wide literature about chemical composition of glass findings, throughout the Roman Empire, emphasizes a roughly identical major elements composition, typically with low Mg and K content, suggesting traditional and conservative technology [25,26]. On the other hand, during the Medieval and post-Medieval periods, widely different compositional features were documented, such as high-Mg high-K glass [27], green forest glass (with about 22% CaO and 8% K2O), yellowish green fern glass (with different K/Ca concentration ratio), and mixed-alkali glasses (with high Na and K content) [11], suggesting a continual evolution of technology. Moreover, as suggest by [18,19], the large differences in major element composition are attributable to a different choice of raw materials, so the chemical characterization just in terms of major and minor components can be conveniently used as a descriptive tool to identify the raw materials used for making ancient glass. Comparatively, alumina and lime content in soda-lime-silica glass can be used to trace back the raw material source of the former used [28,29], being this latter either obtainable from crushed quartz pebbles and quartz sand [29,30]. The use of quartz sand instead of quartz pebbles can be recognized by a higher amount of alumina and lime [12,16,21,28,31,32]. In glass production, the use of fluxes (or melting raw materials) is fundamental to lower the melting point of the mixture and to improve the rheological characteristics of the glass (viscosity, workability). Three fluxes could be used: Natron (leading to a glass with low Mg and K around 1% wt oxide), halophytic plant ashes (leading to a glass with Mg and K around 3%) [12], and continental plant ashes (leading to a potash glass). Potash and magnesia contents can be used to trace back the possible sources of flux, natron, or ashes, since the usage of natron as a flux turns out in a low Mg and K content, while plant ashes can significantly increase the potash and magnesia content [28,29,30,31,32,33]. Consequently, some relationships between the major elements, such as Na and K, can provide useful information to recognize the nature of the flux used and to reconstruct the supply areas and commercial exchanges of the period.
This paper aims to investigate glass production technology in the Middle Age city of Ferrara throughout the analyses of fragments collected during the excavation of the Piazza Municipale and their comparison with a previous dataset.

2. Materials and Methods

2.1. Sampling

The glass fragments were sampled in situ into the stratigraphic unit (US1050) in the Piazza Municipale of the city of Ferrara, located in the north of Italy (Figure 1—red circle), during the works for the repaving of the square under the direction of the Superintendence.
Glass fragments for analysis were selected among homogeneous ones and were transported to the laboratories of the Department of Physics and Earth Sciences, University of Ferrara, in order to prevent contamination. All fragments collected have been washed with tap water, followed by thorough rinsing with distilled water and the superficial incrustations of rocks or sands removed on them without use of acid solutions.
The glasses were found in a brick underground cellar’s limited tank made up of material belonging to a single historical period, between about 1450 and 1479, and this did not allow any contamination with materials from other periods. The glasses found consisted of numerous fragments of objects (5959 fragments on 8198 total fragments) belonging to different objects [22]:
-
Tableware: Glasses (apode glasses and mold-decorated with different motifs), cups, salt shakers, bottles (smooth-walled bottles, bottles with vertical edges on the surface characterized by large vertical glass thicknesses on the smooth surface, a bottle with a particular decoration called “rigadin”, which is obtained by blowing into an open bronze mold producing triangular section grooves that give pointed ribs);
-
objects of medical use: Urinals, ampoules, stills;
-
decorative and architectural objects: Window rollers, taken, loops, lamps.
Figure 2 shows the quantity of fragments found for each type of classified object.
In this work, fragments of truncated cone glass, smooth-walled bottles, bottles with vertical edges on the surface, a bottle with a particular “rigadin” decoration, and urinals were analyzed.
The color classification was difficult due to the strong shades and hues, and only with a direct comparison was it possible to associate the fragments of glass with the relative possible objects, a comparison that in one lucky case allowed for the reconstruction of the entire artefact.

2.2. Chemical and Surface Characterization

The samples of glass fragments were ground until a powder with a particle size less than 2 µm was obtained. A quantity of 0.5 g of powder for each fragment was prepared by pressing a tablet on boric acid support for XRF analysis.
The chemical analysis of the collected fragments was determined by X-Ray Fluorescence (XRF) carried out at the Department of Physics and Earth Sciences, University of Ferrara, with a wavelength dispersion spectrometer ARL Advant-XP (Thermo Fisher Scientific, Waltham, Massachusetts, USA) [34,35]. The instrument consisted of an X-ray tube with a Mo target and an SSD Peltier-cooled detector (10 mm2 active area and resolution of <155 eV at 10 kcps). The system performs a simultaneous multi-element analysis in the element range from Na(11) to U(92). The maximum voltage and current of 50 kV and 1500 µA, respectively, were used to excite the secondary fluorescence X-rays. A collimator with a diameter of 1 mm was used to collect the emitted secondary X-rays from a surface area of about 0.79 mm2 in air.
This technique allowed the determination of the major elements, expressed as a percentage by oxide weight (SiO2, TiO2, Al2O3, Fe2O3, MnO, MgO, CaO, Na2O, K2O, P2O5) and of the following trace elements reported in ppm (parts per million): Ba, Ce, Co, Cr, La, Nb, Ni, Pb, Rb, Sr, Th, V, Y, Zn, Zr, Cu, Ga, Nd, S, Sc. The accuracy of the instrument, estimated on the basis of the results obtained on international standards of geological samples, and the precision, expressed as standard deviation of replicated analyses, were between 2% and 5% for the major elements, and between 5% and 10% for trace elements. The detection limit (0.01% for major oxides) was estimated to be close to ppm for most trace elements, except for S for which 50 ppm was considered. The processing of the acquired intensities and the correction of the matrix effect was performed according to the model proposed by Lachance and Trail [36]. The qualitative data obtained were expressed as single element weight.
The morphological and chemical characterization on the surface of the fragments was carried by a Scanning Electron Microscope (SEM) equipped with an Energy Dispersive X-ray Spectrometer (EDS) INCA 300 (Oxford Instruments, Abingdon, UK) for X-ray microanalysis. The SEM instrument consists of a Zeiss EVO MA15 Basic Instrument (Carl Zeiss AG, Oberkochen, Germany) with a magnification range between < 5–1.000.000x and a chamber dimension 365 mm (Ø) × 275 mm (h). The accelerating voltage can work from 0.2 to 30 kV. EDS analysis was carried out using air and water as the charge compensating gas, with pressures ranging from 10 Pa and 100 Pa. An electron beam energy of 20 keV and a probe current of 200 pA were used for all measurements. The SEM-EDS high magnification images of the fragment surfaces were performed using the SmartSEM software (Zeiss) [37]. SEM-EDS is a valuable technique to obtain information on morphology, composition, and on the pore structure of the matrix. For SEM examinations, a piece not metalized of each fragment was firmed on a SEM stub utilizing double-sided conductive adhesive tape.

3. Results

Each category of samples of glass fragments (truncated cone glass, smooth-walled bottles, bottles with vertical edges on the surface, a bottle with a particular “rigadin” decoration, and urinals) was first subjected to a visually estimation of the colors and to a careful macroscopic analysis to characterize the shape. Then all the fragments were prepared for XRF analysis and SEM observations.

3.1. Macroscopic Characterization: Colours and Shape

The samples of glass fragments were classified according to the reconstruction design of the possible original objects proposed by the Superintendence, as shown in Figure 3a–c, on the basis of the shape of the fragments estimated for each object.
The semi-industrial production of the glasses according to the monoblock mold with truncated cone shape had been recognized. The glasses could be associated with the five groups recognized by Guarnieri [38] and represented by: Truncated cone glasses with smooth walls rarely decorated (the glass had a good quality and a height between 7.5 and 9 cm); truncated cone glass with rounded rim and/or stapled foot (height approx. 10 cm); truncated cone glass flared with decorated surfaces; conical glass (height of about 6.5 cm); sub-cylinder glass with decorations. In this work, only fragments of the truncated cone glass with smooth walls were analyzed.
Even the bottles had been identified according to Guarnieri [38]: Smooth-walled bottles (with thin wall thickness); striped-walled bottles (with thin wall thickness); a bottle with a particular “rigadin” decoration; bottles with vertical edges on the surface. In this work, only 3 of the 4 types of bottles were considered: Smooth-walled bottles, bottles with vertical edges on the surface, and a bottle with a particular “rigadin” decoration.
The last typology of the fragments analyzed was one of the types of objects for medicinal use: Urinals with riveted edges.
The analyzed samples were divided according to the different colors of the fragments:
-
Truncated cone glass with three different colors: Light-blue, green, and light-yellow;
-
smooth-walled bottles with two colors: Blue and light-yellow;
-
bottles with vertical edges on the surface with two colors: Blue and green;
-
a bottle with a particular “rigadin” decoration, only green color;
-
urinals with two colors: Blue and yellow/green.

3.2. XRF Analysis

Different glass fragments were analyzed, varying in color between blue, yellow, and green. Fragments in Table 1 and Table 2 were distinguished as follow: (i) Fragments of truncated cone glasses with light-blue (sample 154), green (sample 155), and light-yellow color (sample 158); (ii) fragments of smooth-walled bottles with blue color (sample 177A) and light-yellow color (sample 177B); (iii) fragments of bottles with vertical edges on the surface (sample 179 blue colored and sample 181 green colored); (vi) sample 187 was green colored and represented a bottle fragment with a particular “rigadin” decoration; (v) the last two fragments belong to urinals, the first with a yellow-green color (sample 191A), and the second blue colored (sample 191B1).
The XRF analysis shown that the fragments had a homogeneous composition such as that of common glasses called soda-lime glasses. Table 1 and Table 2 shown the average of XRF results of the major elements expressed using oxide concentration in weight% (Table 1) and trace elements concentration expressed in ppm (Table 2). The fragments were characterized by a quartz matrix mixed with sodium vegetable ash low in potassium (10.95% < Na2O < 12.42% and K2O about 1.5%). All the fragments seem to belong to the same general category, characterized by low values of Al, Ti, P, K, Fe and other impurities, medium values of Na and Ca, high values of Mg, and variable values of Si and Mn.
All fragments shown high contents of SiO2 (SiO2 > 70%). The SiO2 content depends mainly on the quantity of fusing agent that has been added to the batch. However, the low level of impurity, such as TiO2, Al2O3, and K2O, is an indication that a pure SiO2 agent were used and presumably no clay materials were added (no presence of feldspar). Low concentration of TiO2 (from 0.09% to 0.06%) was coupled by medium MnO level, as for common glass in Venice at the same time [16,17,18,20]. The fact that other species, such as Al2O3, MgO, Na2O, K2O, were much less variable than MnO could support the hypothesis of a voluntary addition into the glass in order to decolorize it. Thanks to this intentionally added to the mixture, Mn gives the glass a purple color, but it also acts as a glass soap: It can perform an oxidizing function of ferrous ions neutralizing the greenish color given by the iron itself. In geology, the iron impurities contained in the sands give a greenish-brown color, and generally the percentage of the oxide does not exceed 5% [39], which is a very high level for iron in the ancient glass. Generally, except for dark glasses, the iron concentration in the glass was around 1%. Therefore, the discoloration of the analyzed fragments was probably carried out with the addition of manganese oxide and the ratio between MnO and Fe2O3 was lower for the fragment with blue color, while it was higher for glass with green and light-yellow coloring [40]. The total percentage of TiO2, Al2O3, and Fe2O3 was about 1.5%. The all fragments analyzed shown concentration in Na2O from 12.42% to 10.95% and very low content of K2O (from 1.79% to 0.96%), while the CaO/MgO ratio was about 2. As far as trace elements, it could be observed in Table 2 that for the blue fragment, Co has higher values than the other fragments with green and light-yellow color in each type of the glass fragments analyzed. Cobalt was often combined together with one or more coloring elements, in particular Cu, Fe, and Mn [41,42,43], or associated with impurities such as As, Ni, Zn, or Bi varying with time. On the other side, the presence of other impurities does not allow us to better evaluate the presence of this element. Cu was generally used to obtain opaque red glass or more or less intense turquoise blue colors. However, in the fragments analyzed, the concentration of Cu is more variable, and Co and Cu could represent impurities of the raw material used for glass creation [44,45].

3.3. SEM-EDS Data Analysis

Surfaces of the samples of glass fragments without any metallization of the different objects collected were analyzed by SEM to characterize the alteration. SEM analyses will also allow us to verify the degradation of the glass and the influence on the composition by hydrolysis. The fragments selected for SEM-EDS analyses were fragments of: Truncated cone glass (sample 158—Figure 4a), smooth-walled bottles (sample 177B—Figure 4b), bottles with vertical edges on the surface (sample 179—Figure 4c), a bottle with a particular “rigadin” decoration (sample 187—Figure 4d), urinal (sample 191A—Figure 4e), and an example of gel layer alteration observed in the sample 179 (Figure 4f). For each sample, different EDS analyses were done.
The first analyzed fragment belonged to a truncated cone glass (sample 158). Figure 5a shows the SEM analysis of the fragment, in which polygonal fractures were observed on the glass surface, which probably correspond to crizzling, a very common manifestation of alteration [46,47,48]. Their formation was possibly related to a decrease in volume during drying of the corroded and hydrated layer. The percentage data of silica and calcium oxide were coherent to the concentrations in the glass of the same period (Table 3), as confirmed by XRF data. Manganese oxide was noted at all points of analysis, even though in low percentages it was able to give the glass a yellowish color (Figure 4a). The analyses of Figure 5b shown high percentage of calcium, manganese, magnesium, and iron oxides, respective to the analyses of Figure 5a. On the other hand, the EDS analyses of Figure 5a showed a very low percentage of sodium oxide that could be typical of alteration glass.
The two first analyses of a fragment of a yellow smooth-walled bottle (sample 177B, Figure 4b) showed very similar percentage of weight oxides (Table 4), that respect the XRF data analyses. On the other hand, point 3 in Table 4 shows about 6.72% by manganese oxide (as glass soap confirmed by XRF data) and high values of iron oxide, probably present in the compound as an impurity due to the raw materials used (Table 4). The high percentage of calcium oxide was also observed only in this last point of analysis, probably due to a deposit of this element on the glass fragment analyzed. Figure 5c shows the selected point for SEM analyses, and point 3 looked different in respect to the other two point of analyses.
Figure 4c shows a photo of a fragment of a bottle with vertical edges on the surface, and Figure 5d,e show photo images of the same sample 179 by SEM analysis. Silica oxide content was prevalent, a fundamental element because it represents the main vitrifying agent (Table 5), as confirmed by XRF data. The surface of the fragment analyzed in Figure 5d was not particularly degraded and with gel layer of alteration, which by exfoliation lead to loss of material. Due to the presence of carbon and the low value of oxygen, it was difficult to claim that the analysis was close to the original composition, but the presence of alkaline elements, such as Na, could suggest a composition similar to the original. A small amount of iron oxide was also observed in the analysis of Figure 5d (Table 5).
In the SEM image of Figure 5f,g, details of the surface of the fragment of a bottle with a particular “rigadin” decoration (sample 187 observed in Figure 4d) were observed. Figure 5f shows a corrugated surface where glass alterations were visible, probably because it was more exposed. The analyses of Figure 5f and expressed in Table 6 show the compositional analysis corresponding to point 1 carried out on the gel layer, and point 2 that corresponds to the surface of the fragment. The analyses show, in fact, different values for sodium oxide: Lower percentage in the altered area with respect to the second area where sodium oxide was higher. Always in the most altered area, probably an area of air forfeited during the process of making the glass, the presence of aluminum oxide was highlighted, in contrast to the second area in which was almost zero. The same trend was observed for calcium oxide. A detail of the surface of the fragment of the sample 187 can be seen in Figure 5g, with respect to the smooth surface. Different sodium oxide values were observed in a lower percentage in the visibly altered area (point 4 in Table 6) compared to the second zone taken into consideration, where sodium oxide had a higher concentration (point 5 in Table 6). Still, in the most altered area, probably an area of air forfeited during the process of making the glass, the presence of aluminum oxide was highlighted (point 4), and was almost zero in the second analysis (point 5).
The analyzed fragment belonged to a urinal (sample 191A, Figure 4d). Figure 5h shows the morphology of the analyzed fragment that had a gel layer that was not present on the entire surface of the fragment because detachment may have already occurred in some areas. It was possible to observe that the surface of the fragment showed polygonal fractures (Figure 5h). Table 7 shows the compositional analysis corresponding to point 1 carried out on the gel layer, and point 3 that corresponds to the surface. The gel layer had a low sodium oxide value (0.78%) that probably corresponds to a degraded surface compared to the other analysis points, where sodium oxide appeared with high value (4.45%). The percentages by weight of sodium, magnesium, calcium, potassium, and manganese oxides were higher for the less altered areas.
The fragment 179 was covered by a gel layer alteration that was observed by SEM-EDS (Figure 4f) which had become detached due to the deterioration. The deterioration therefore produced a loss of material by exfoliation (as you can see in Figure 5i) with a consequent reduction in the thickness of the walls of the glass fragment. The analysis shown the presence of sulphur oxide (point 3 in Table 8), that in a corroded layer was not unusual, and a high concentration of iron oxide (points 1 and 3), which probably came from the glass itself or from the environment. The sand used to make the glass had to be pure, in order to obtain a colorless glass, as any impurities due to iron and chromium oxides made the glass take on unwanted yellow/green shades [40,49]. The lack of sodium oxide was also observed, probably related to the alteration of the glass, as shown in [50].

4. Discussion

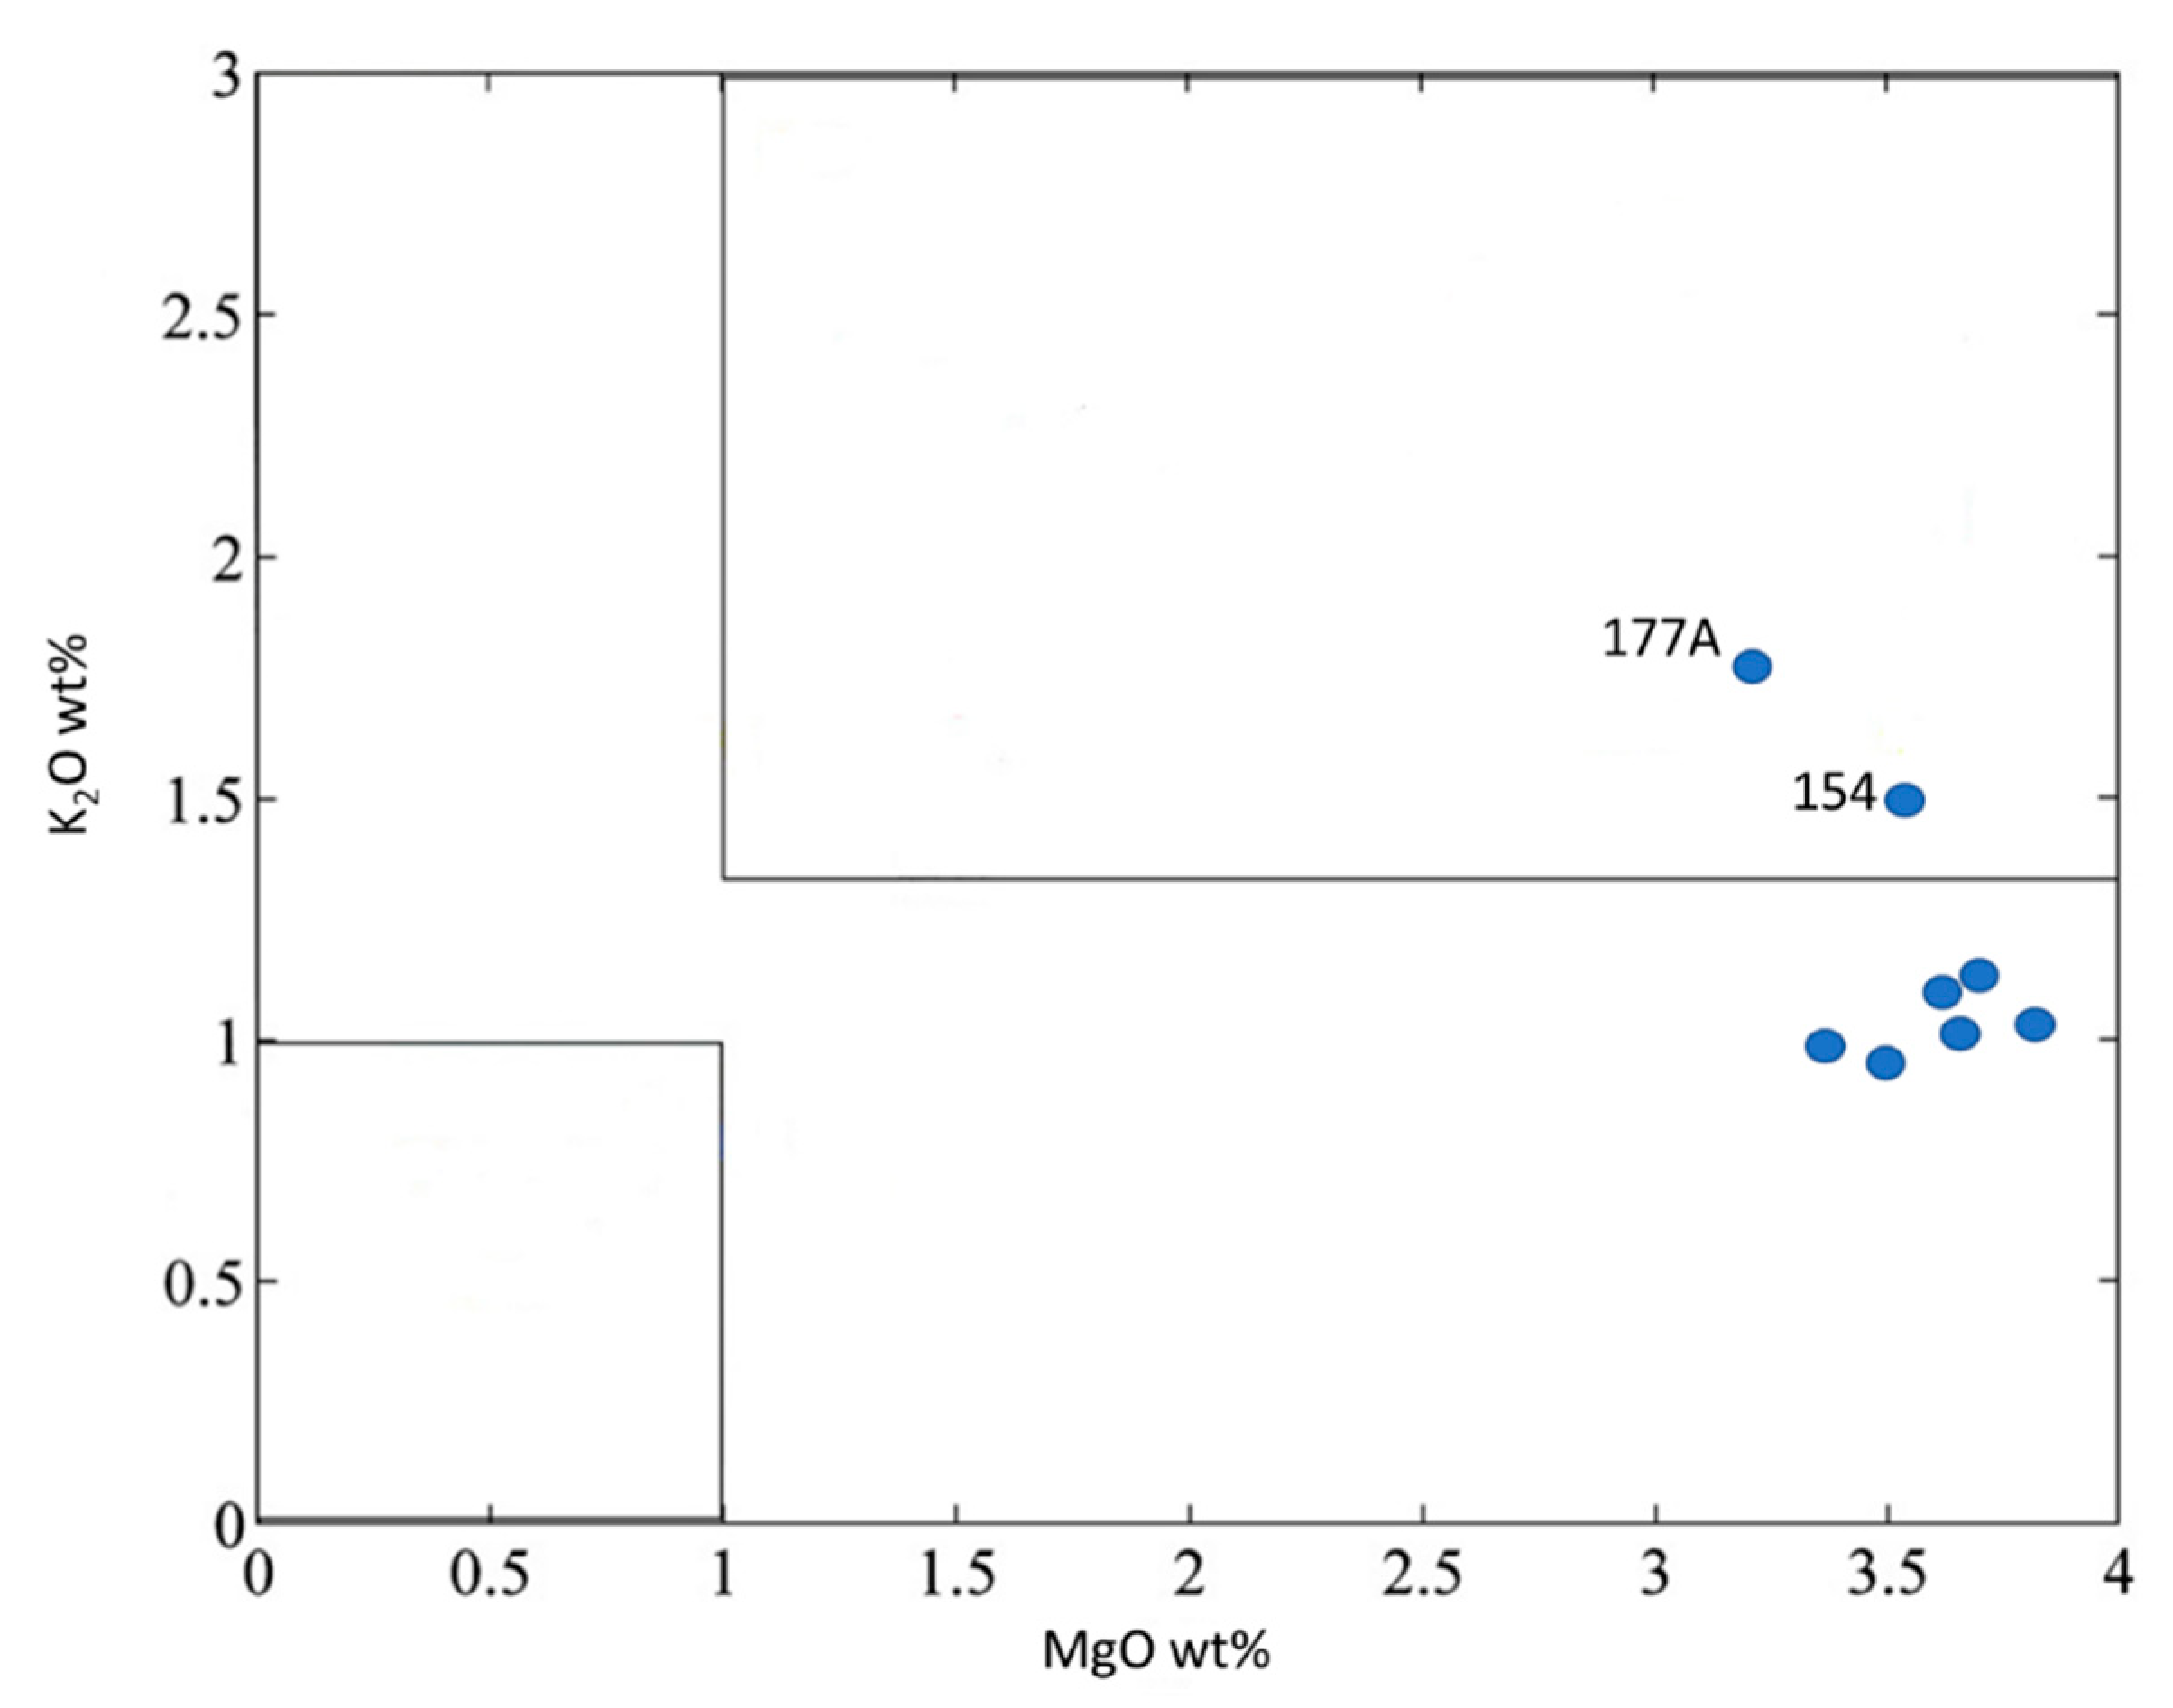
Considering the MgO and K2O contents, it was possible to infer the flux selected for the glass paste. The binary diagram MgO vs. K2O (Figure 6) shows two dotted areas regarding plant ash-based alkali and natron-based alkali [26,51,52], and samples 154 and 177A fell in the “plant ash-based alkali zone”, while other fragments showed slightly low K2O content, but high magnesia content.
The analyses of the 10 glass fragments were compared with the analyses of ashes of various plants typical of the Mediterranean area. Most of these plants belonged to the Chenipodiaceae family, imported into Europe from the Middle Eastern countries [51,52,53]. In general, the flux used was obtained from the combustion of several plants from the Chenopodiacee family, where Salsola soda was the predominant plant.
The chemical analyses of these fragments have been compared with those of different plants taken from scientific articles concerning the trade relations between East and West [53,54,55], and which have been used to obtain chemical parameters useful to discriminate the various fluxes. The plants taken into consideration were: Salsola Soda and Hammada Scoparia from the herbarium of the botany department of the University of Jerusalem; Salsola Kali from the areas around the city of Acre in northern Israel; a particular type of fern that grows on the Lido of Venice (northern Italy); Catania Soda that grows near Palermo (Sicily, south of Italy), and the "Vareque" type of seaweed from the Mediterranean coast of France.
The chemical composition of the individual plants was a function of the place of origin, climate, microclimate, and age, and this allowed us to distinguish the various supply areas.
To characterize the single fluxes, the ash analyses studied by Ashtor-Cevidalli [55] were plotted in Na2O/K2O (Figure 7a) and CaO/MgO diagrams (Figure 7b). The slopes of the various straight lines defined each individual plant based on the ratio indicated. The stars indicated the positioning of the glass fragments analyzed in this work according to the ratio shown in Table 1.
In detail, Figure 7a shows that the ash was rich in alkali carbonates of potassium and sodium, therefore it could not be used for a good quality glass. This was probably the reason why the Venetian government prohibited its use [52,53,54]. Salsola Soda ash contained about 80% alkaline carbonates, mainly sodium carbonate, which made it an excellent material for glass [53,54]. The difference between Salsola Kali and Catania Soda was slight. Catania Soda was richer in NaCl, and the amount of alkali was around 41%, slightly lower than Salsola Kali (45%). On the other hand, the ratio of Na2O/K2O was higher in Catania Soda (2.3) than in Salsola Kali (0.9). Hammada Scoparia had intermediate characteristics to the two previous plants, and the Na2O/K2O ratio was 1.3. The amount of alkaline carbonates was 27%, about half that in Salsola Kali. This means that a double quantity had to be used to obtain the same glass [52,53,54,55]. Finally, the ash produced by the "Vareque" algae was characterized by a Na2O/K2O ratio equal to 1.13.
Both sands and ashes of plants could contain calcium and magnesium compounds. In the ashes of plants, the CaO/MgO ratio was variable, but generally it was 2:1. In old soda lime glasses, the content of calcium oxide was consistent, but normally did not exceed 8%, as also evidenced by the analyses of Figure 7b, except for samples 179 and 181. We must not forget, however, that a contribution of magnesium was also provided by the flux used, in fact, even in the ashes of the plants used, such as Salsola Soda, there was a percentage of Mg, which will join the total percentage in the relationship with calcium.
Even the 15th century glass fragments from Ferrara analyzed by Gruppioni [19] were subjected to the same comparison (Figure 7a—square symbols in the green circle), and also for them the predominantly flux used was obtained by burning Salsola Soda, perhaps with the addition of ashes from other plants.
The data analysis obtained on the glass fragments were normalized with the averages of the major elements obtained on those from Venice dating between the 7th–12th century and from the 13th–14th century [18,24] to assess whether there could be affinities between the composition of glass produced in the same period of time between Venice and Ferrara.
From the analyzed glasses, it was noted that the vitrifying agent used was purer than that used by Venetian glass in the two different periods, being poorer in TiO2 and Fe2O3 (Table 9). All of these elements did not exceed 1%. Slightly less for glass dating from the 13th–14th century. Instead, the concentration of manganese was higher than in the Venetian glasses, probably because it was inserted into the glass as a glass soap. Manganese was greater in the mixture of the Ferrara glass, except for the 177A sample, compared to Venice glass from the 7th–2th century (Figure 7a), while it was in similar relationships with the Venetian glass from the 13th–14th century (Figure 7b).
The concentrations of Na2O and K2O, although being less abundant in percentage terms, shows ratios more or less similar to Venetian glass from the seventh to the fourteenth century. This highlighted the use in the analyzed glass of vitrifying raw materials other than those used in the Murano workshops; sands of better quality than those used in Venice between the 7th–12th century, but slightly poorer than those used in the following centuries, between the 13th–14th century. Na2O/K2O and CaO/MgO have been compared with the Venetian glasses of the various periods, the first ratio was more similar, even if the K2O level was lower in the Ferrara glass, instead the second ratio had a positive anomaly, probably due to the use of weakly dolomitic limestone as stabilizer.
In addition, the presence of phosphate in Ferrara glass was less than that present in Venetian glass (Table 9), and this is probably dependent on the melting conditions (temperature, time) and the treatments (crushing the glass, washing and melting again) used: Venice obtained the vitrifying from the grinding of quartz arenites, rock rich in silica, while the analyzed glass of local production from Ferrara had a lower content of phosphate because river pebbles were used, which contained few percentages.

5. Conclusions

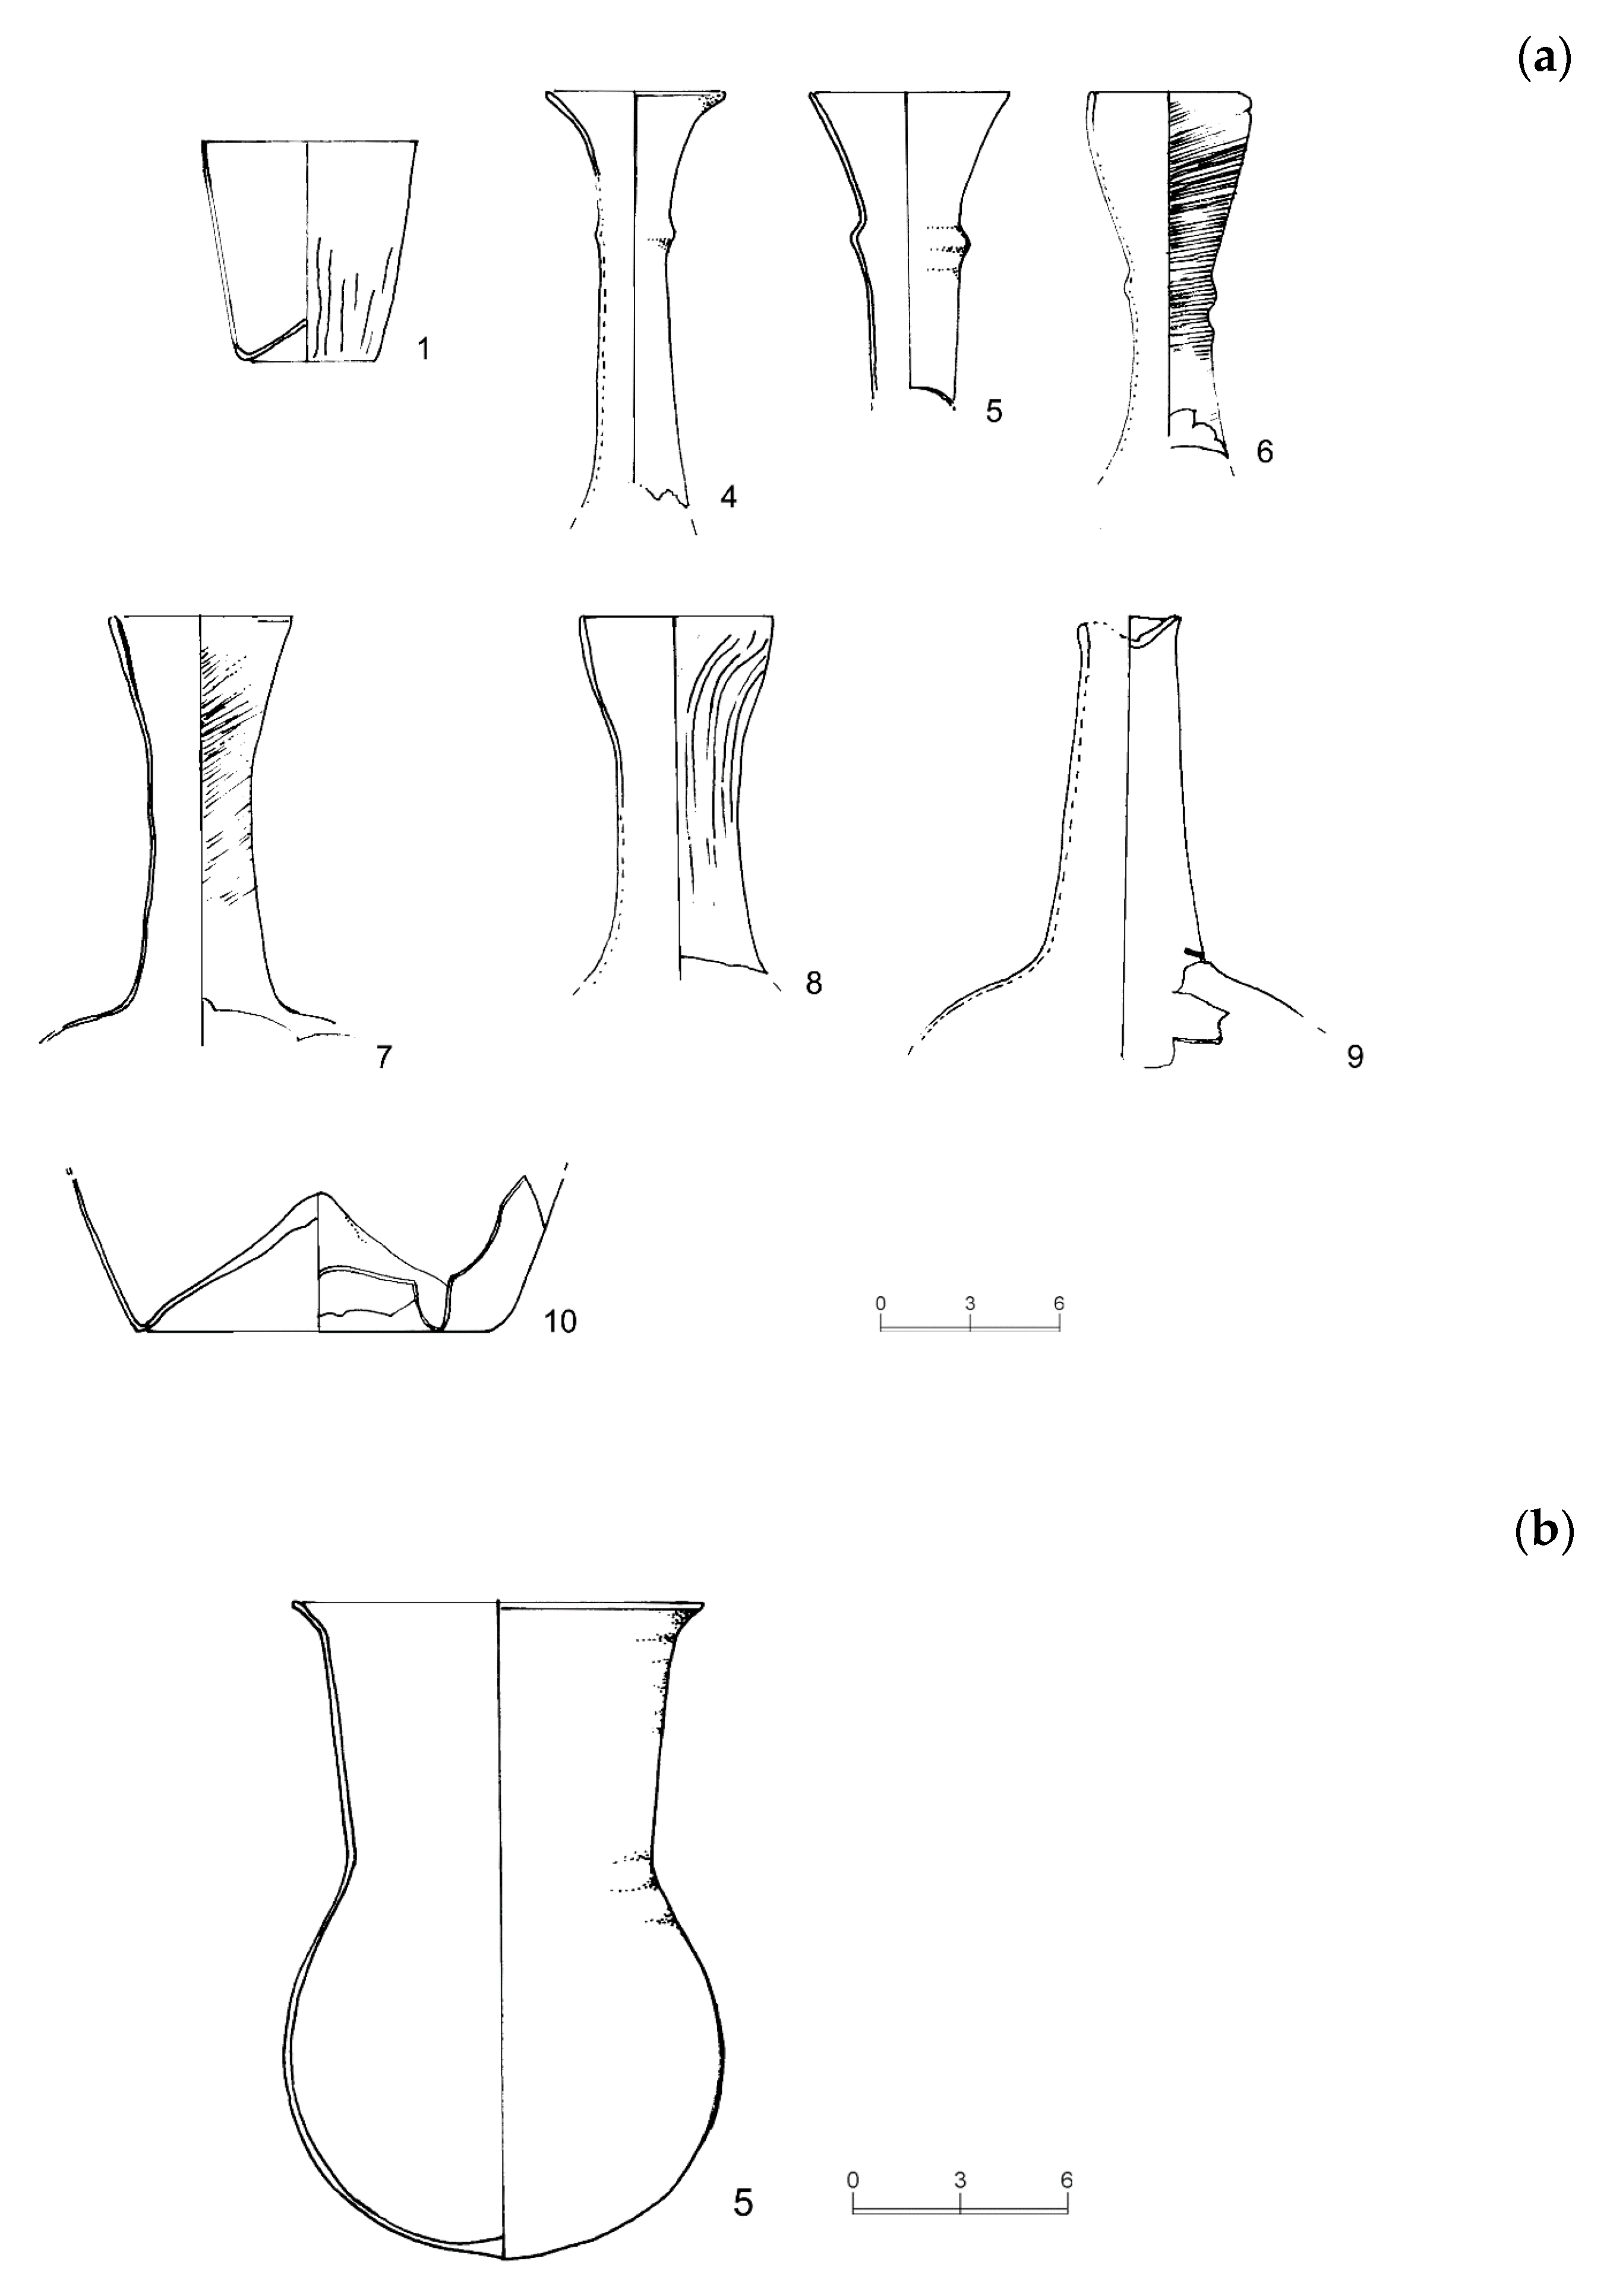
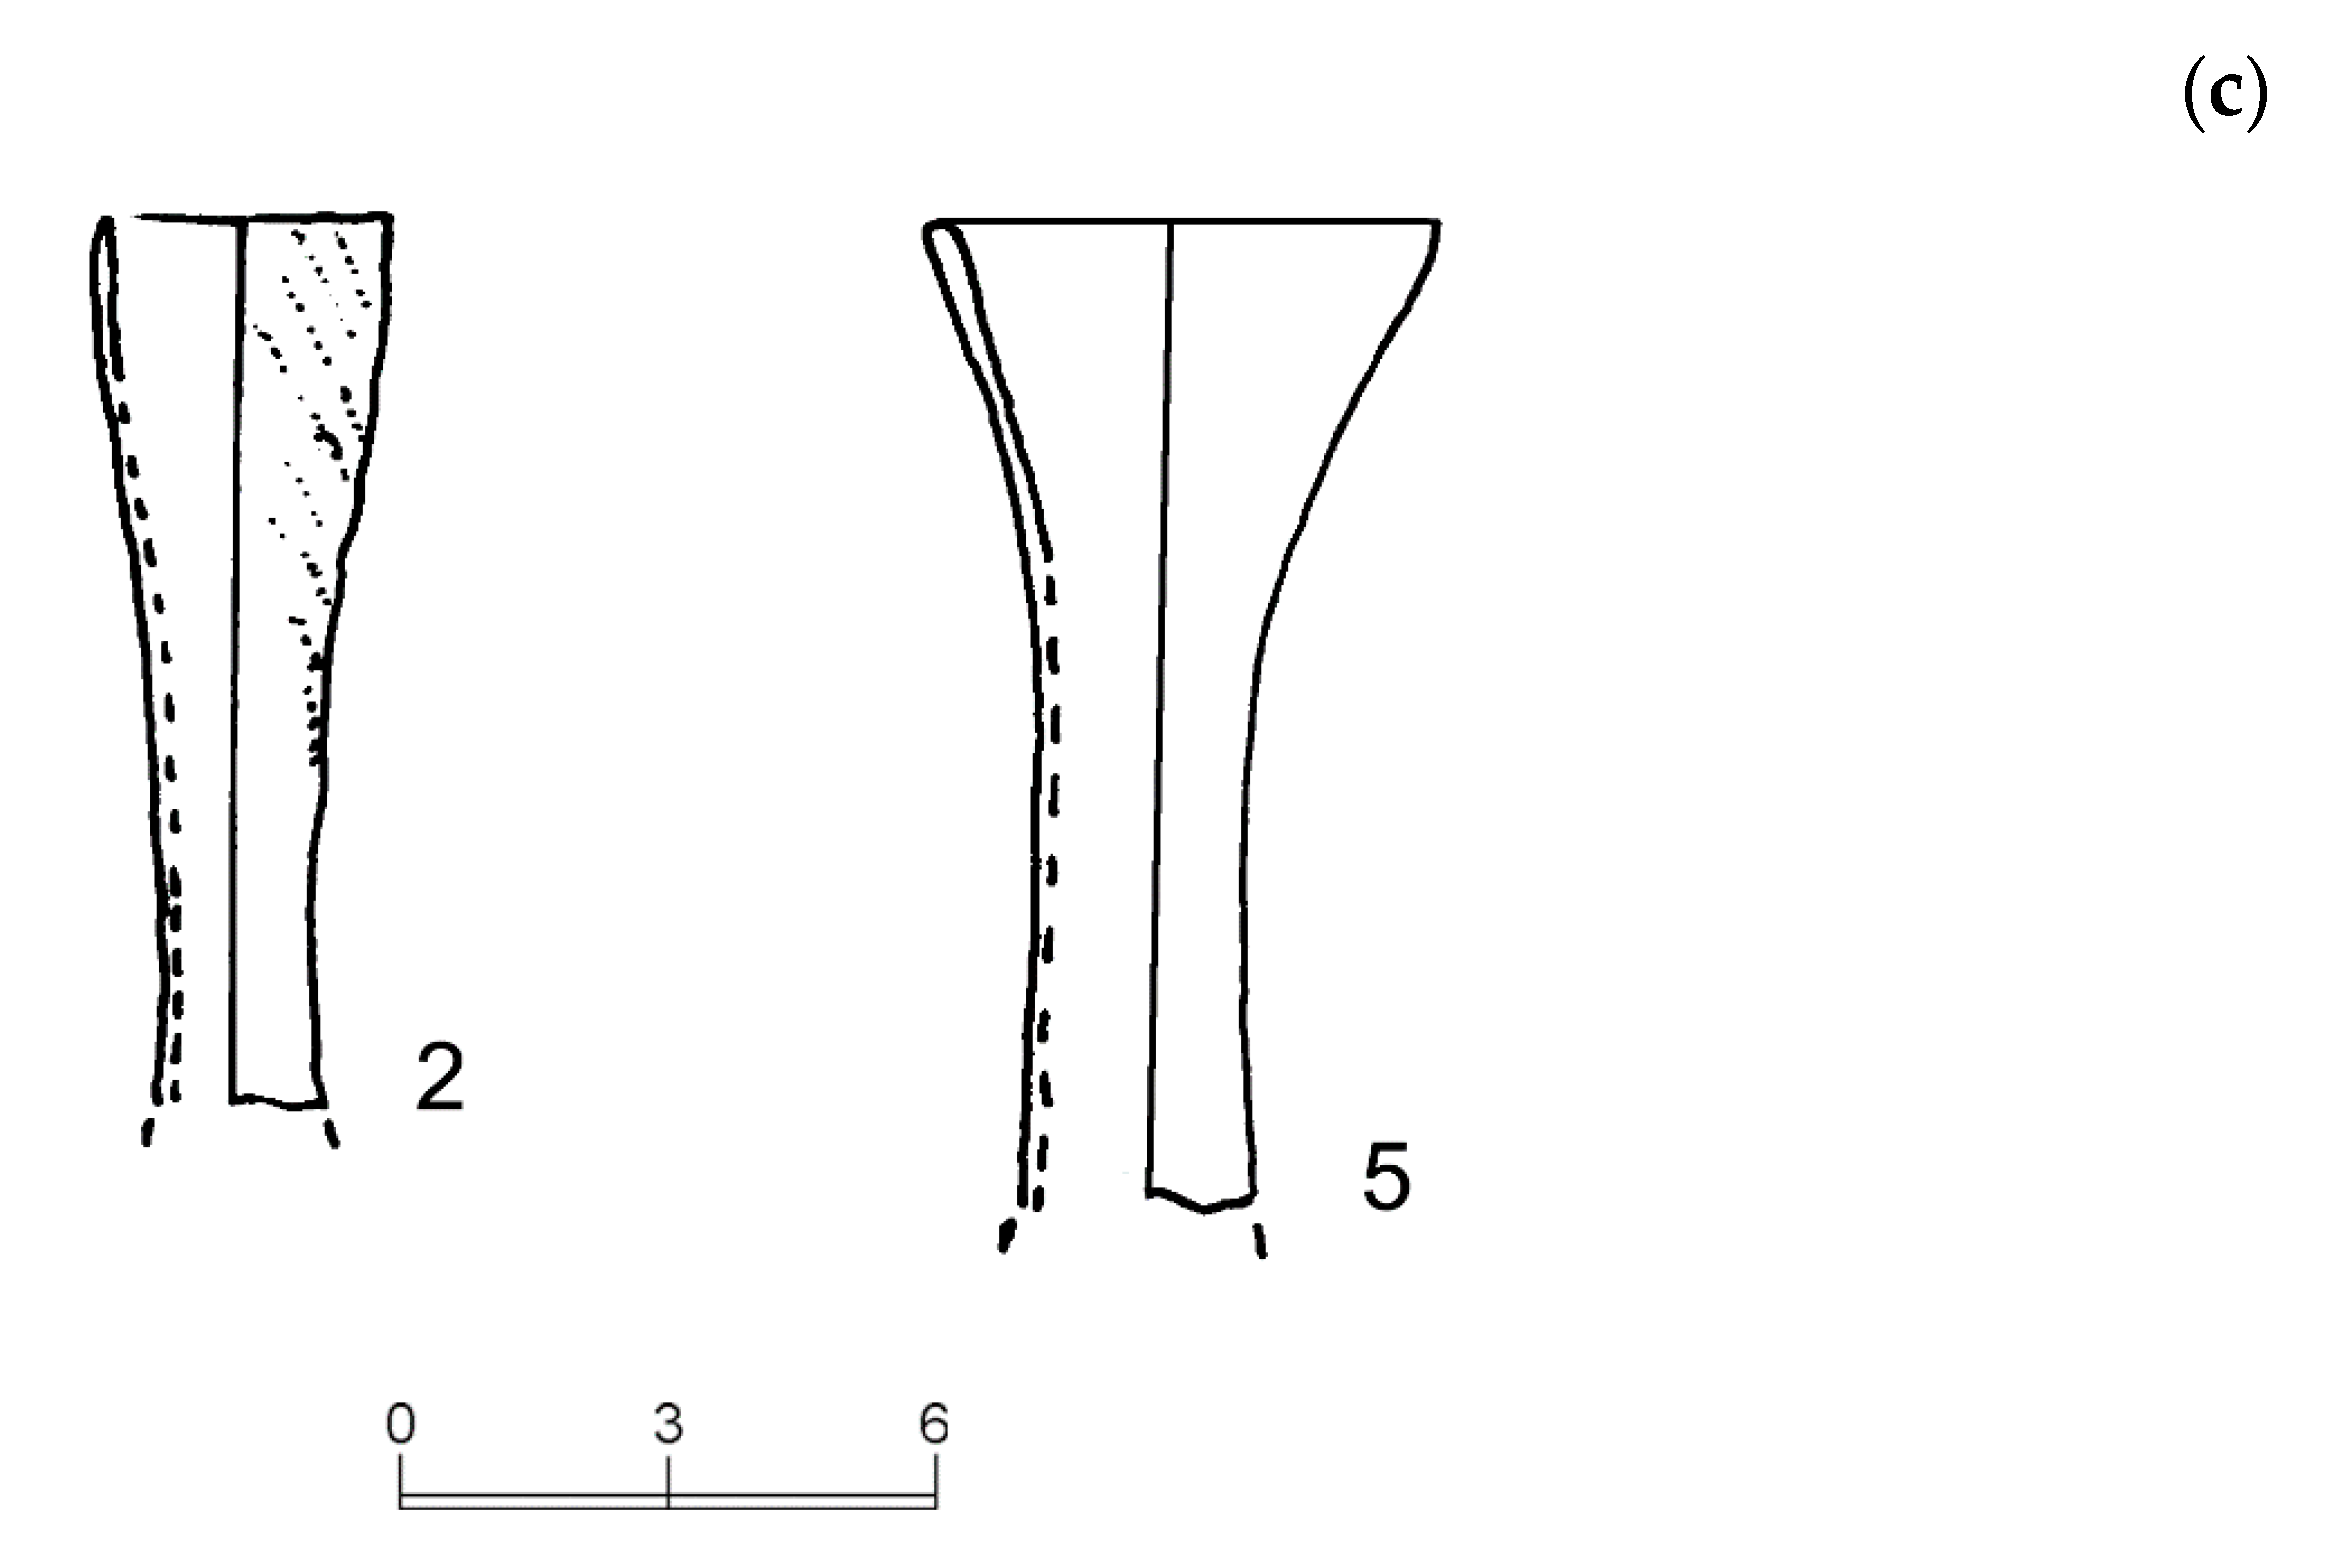
This paper allowed us to classify different fragments of glass of a historical period between 1450 and 1479. It was possible to divide the fragments by shapes, colors, and objects they belonged to. There were problems to better define the shades of the fragments since, apart from a few pieces, they did not have a single color, but had variations in colors, probably based on the purity of the raw materials used.
Chemical analyses of the fragments collected show that the glasses are made up of fairly homogeneous mixtures for all the fragments examined. The only difference was found for the blue glass fragments, where the percentages of cobalt and copper were greater than the percentages obtained for the green or yellow fragments. Considering that cobalt and copper levels were very low compared to iron and manganese in the fragments analyzed, they do not impart a visible color to the glass. Probably the blue, green, or yellow color was mainly due to the balance between Fe2+, Fe3+, and Mn2+, Mn3+. Manganese not only acts as a dye, but also as a glass soap: It was able to oxidize the ferrous ions present in the compound, neutralizing the green color given by the iron.
The XRF data were compared to other glass fragments from excavations in the city center of Ferrara of the 15th century. The data confirmed the same origin.
In addition to the chemical composition, the state of the surface of the fragments was observed through the scanning electron microscope analyses. The glass surface had no particular deterioration, except in some fragments in which Na level is lower, probably indicating surface corroded layer.
The data on the study of the flux used show that a particular plant belonging to the Chenopodiacee family, Salsola Soda, was used for the production of glass in the Ferrara area. The data were also comparable with the Venetian glasses of the various periods; this confirms the use of the same melting raw materials.
The compositions of the glass analyzed were also compared with analyses carried out on glass of Venetian origin, to observe any analogies of the Ferrara glass with the Murano glass (Venice) of the same period and previous periods to evaluate any relevance with the raw materials used for the production of the glass. It has been shown that the materials used for the Ferrara glass were purer than those of the Venetian glass dating from the 7th–12th century and 13th–14th century. From the comparison, it is possible to highlight that the analyzed glass, dating from 1450 and 1479, were obtained from vitrifying raw materials other than those used in the Murano workshops (Venice); sands of better quality than those used in Venice between the 7th–12th century, but slightly poorer than those used in the following centuries, between the 13th–14th century.
This paper, however, could confirm the hypothesis of the presence of glassworks also in the Ferrara area, capable of producing for the most part common use glasses with semi-pure raw materials and with the presence of elements added voluntarily to imbue the glass with better rheological characteristics (stability, resistance, workability).

Author Contributions

Conceptualization: E.M., C.T., C.G., and C.V.; data curation: E.M., S.C., C.T., and C.V.; formal analysis: E.M., S.C., and C.V.; funding acquisition: C.V.; investigation: E.M., S.C., C.T., C.G., and C.V.; methodology: E.M., C.T., and C.V.; resources: C.G. and C.V.; supervision: E.M., C.G., C.V.; writing—original draft: E.M., S.C., C.T., C.G., and C.V.; writing—review & editing: E.M., C.T., C.G., and C.V. All authors have read and agreed to the published version of the manuscript.

Funding

This research was supported by Superintendency Archaeological Heritage Office, SABAP Bologna, Modena, Reggio Emilia, Ferrara, and by the University of Ferrara.

Acknowledgments

We want to thank the direction of the Superintendency for making the samples of glass fragments available. We would like to thank Tassinari Renzo for chemical analyses and Mariarita Bovolenta for SEM analyses.

Conflicts of Interest

The authors declare no conflict of interest.

References

  1. Ashtor, E. The factors of technological and industrial progress in the later Middle Ages. J. Eur. Econ. Hist. 1989, 18, 7–36. [Google Scholar]
  2. Faoro, A. La produzione vetraria a Ferrara nel XV secolo: L’artigiano Baldino Loro. La Pianura 1995, 3, 66–69. [Google Scholar]
  3. Ashtor, E. Levant Trade in the Middle Ages; Princeton Legacy Library: Princeton, NJ, USA, 2015. [Google Scholar] [CrossRef]
  4. Visser Travagli, A.M.; Ward-Perkins, B. Archeologia urbana a Ferrara: Scavi nel comparto di S. Romano. Boll. Annu. Musei Ferrara 1980, 9, 55–66. [Google Scholar]
  5. Visser Travagli, A.M.; Ward-Perkins, B. Seconda campagna di scavo a Ferrara nel comparto di San Romano. Relazione preliminare. Archeol. Mediev. 1983, 10, 381–386. [Google Scholar]
  6. Nepoti, S. Le ceramiche a Ferrara nel Rinascimento: I reperti da corso della Giovecca. Ferrara prima e dopo il Castello. In Ferrara Prima e Dopo il Castello: Testimonianze Archeologiche per la Storia della Città/a Cura di Sauro Gelichi; Spazio Libri Editori: Ferrara, Italy, 1992; pp. 289–366. [Google Scholar]
  7. Guarnieri, C. Ferrara, sequenza insediativa pluristratigraficata via Vaspergolo—Corso Porta Reno (1993–1994). Archeol. Mediev. 1996, 23, 275–307. [Google Scholar]
  8. Guarnieri, C.; Cesaretti, G. Lo smaltimento dei rifiuti a Ferrara durante il tardo Medioevo: Alcune osservazioni sui contesti d’uso. In IN&AROUND Ceramiche e Comunità Secondo Convegno Tematico Dell’AIECM3; All’Insegna del Giglio: Firenze, Italy, 2016; pp. 144–150. ISBN 978-88-7814-698-3. [Google Scholar]
  9. Guarnieri, C.; Cesaretti, G.; Bosi, G.; Dal Fiume, L.; Mazzanti, M.; Caselli, V.; Pederzoli, A.; Ansaloni, I. Dimmi cosa butti e ti dirò chi sei: Informazioni da materiali archeologici, botanici e zoologici in vasche di scarico a Ferrara tra Medioevo e Rinascimento. In Food City: Cibo e la Città, Proceedings of the VII Congresso AISU, Milano, Italy, 2–5 September 2015; Università di Padova: Padova, Italy, 2015. [Google Scholar]
  10. Wedepohl, K.H. Chemical composition of medieval glass from excavations in West Germany. Glass Sci. Technol. Glass Berichte 1997, 70, 246–255. [Google Scholar]
  11. Wedepohl, K.H. Die Zusammensetzung und Herstellung antiker und mittelalterlicher Gläser TT—The composition and manufacture of antique and Medieval glass. Arb. Restaur. 1998, 31, 87–94. [Google Scholar]
  12. Freestone, I.C. Theophilus and the Composition of Medieval Glass. MRS Proc. 1992, 267. [Google Scholar] [CrossRef]
  13. Mirti, P.; Casoli, A.; Appolonia, L. Scientific Analysis Of Roman Glass From Augusta Praetoria. Archaeometry 1993, 35, 225–240. [Google Scholar] [CrossRef]
  14. Mirti, P.; Lepora, A.; Saguì, L. Scientific analysis of seventh-century glass fragments from the Crypta Balbi in Rome. Archaeometry 2000, 42, 359–374. [Google Scholar] [CrossRef]
  15. Mirti, P.; Davit, P.; Gulmini, M. Colourants and opacifiers in seventh and eighth century glass investigated by spectroscopic techniques. Anal. Bioanal. Chem. 2002, 372, 221–229. [Google Scholar] [CrossRef]
  16. Verità, M.; Renier, A.; Zecchin, S. Chemical analyses of ancient glass findings excavated in the Venetian lagoon. J. Cult. Herit. 2002, 3, 261–271. [Google Scholar] [CrossRef]
  17. Biron, I.; Verità, M. Analytical investigation on Renaissance Venetian enamelled glasses from the Louvre collections. J. Archaeol. Sci. 2012, 39, 2706–2713. [Google Scholar] [CrossRef]
  18. Verità, M. Venetian Soda Glass. In Modern Methods for Analysing Archaeological and Historical Glass; John Wiley & Sons, Ltd.: Hoboken, NJ, USA, 2013; Volume 1. [Google Scholar] [CrossRef]
  19. Gruppioni, G.; Vaccaro, C.; Visser Travagli, A.M. L’attività vetraria del XV secolo a Ferrara: Indagini petroarcheometriche. In IL VETRO NELL’ALTO ADRIATICO, Proceedings of the Atti delle IX Giornate Nazionali di Studio, Ferrara, Italy, 13–14 December 2003; Editrice La Mandragora, Ed.; Editrice La Mandragora: Imola, Italy, 2007; pp. 111–120. [Google Scholar]
  20. Lazzarini, L.; Verità, M. First evidence for 1st century AD production of Egyptian blue frit in Roman Italy. J. Archaeol. Sci. 2015, 53, 578–585. [Google Scholar] [CrossRef]
  21. Vandini, M.; Chinni, T.; Fiorentino, S.; Galusková, D.; Kaňková, H. Glass production in the Middle Ages from Italy to Central Europe: The contribution of archaeometry to the history of technology. Chem. Pap. 2018, 72, 2159–2169. [Google Scholar] [CrossRef]
  22. Guarnieri, C. Ferrara al Tempo di Ercole I d’Este: Scavi Archeologici, Restauri e Riqualificazione Urbana nel Centro Storico della Città; All’Insegna del Giglio: Firenze, Italy, 2018. [Google Scholar]
  23. Guarnieri, C. Il vano sotterraneo USM 5: Alcune considerazioni sulla tipologia dei materiali, in S. Antonio in Polesine. In Il Monastero di Sant’Antonio in Polesine Archeologia e Storia di un Monastero Estense a Cura di Chiara Guarnieri; All’Insegna del Giglio: Firenze, Italy, 2006; pp. 135–189. [Google Scholar]
  24. Guarnieri, C. Il tardo medioevo ad Argenta. Lo scavo di via Vinarola-Aleotti. In Il Tardo Medioevo ad Argenta: Lo Scavo di via Vinarola-Aleotti; All’Insegna del Giglio: Firenze, Italy, 1999; pp. 94–113. [Google Scholar]
  25. Janssens, K.; Vittiglio, G.; Deraedt, I.; Aerts, A.; Vekemans, B.; Vincze, L.; Wei, F.; De Ryck, I.; Schalm, O.; Adams, F.; et al. Use of Microscopic XRF for Non-destructive Analysis in Art and Archaeometry. X-Ray Spectrom. 2000, 29, 73–91. [Google Scholar] [CrossRef]
  26. Genga, A.; Siciliano, M.; Tepore, A.; Mangone, A.; Traini, A.; Laganara, C. An archaeometric approach about the study of medieval glass from Siponto (Foggia, Italy). Microchem. J. 2008, 90, 56–62. [Google Scholar] [CrossRef]
  27. Freestone, I.C.; Leslie, K.A.; Thirlwall, M.; Gorin-Rosen, Y. Strontium isotopes in the investigation of early glass production: Byzantine and early islamic glass from the near East. Archaeometry 2003, 45, 19–32. [Google Scholar] [CrossRef]
  28. Rehren, T. A review of factors affecting the composition of early Egyptian glasses and faience: Alkali and alkali earth oxides. J. Archaeol. Sci. 2008, 35, 1345–1354. [Google Scholar] [CrossRef]
  29. Tite, M.S.; Shortland, A.J. Production technology for copper- and cobalt-blue vitreous materials from the New Kingdom site of Amarna—A reappraisal. Archaeometry 2003, 45, 285–312. [Google Scholar] [CrossRef]
  30. Rehren, T. Aspects of the production of cobalt-blue glass in Egypt. Archaeometry 2001, 43, 483–489. [Google Scholar] [CrossRef]
  31. Sayre, E.V.; Smith, R.W. Analytical Studies of Ancient Egyptian Glass, Recent Advances in Science and Technology of Materials; Plenum Press: New York, NY, USA, 1974. [Google Scholar] [CrossRef] [Green Version]
  32. Turner, W.E. Studies in ancient glasses and glassmaking processes. Raw materials and melting processes, Part. V. J. Soc. Glass Technol. 1956, 40, 1–24. [Google Scholar]
  33. Rehren, T.; Freestone, I.C. Ancient glass: From kaleidoscope to crystal ball. J. Archaeol. Sci. 2015, 56, 233–241. [Google Scholar] [CrossRef] [Green Version]
  34. Franzini, M.; Leoni, L.; Saitta, M. Revisione di una metodologia analitica per fluorescenza: X. Basata sulla correzione completa degli effetti di matrice. Rend. Soc. Ital. Mineral. Petrogr. 1975, 31, 365–378. [Google Scholar]
  35. Marrocchino, E.; Rapti-Caputo, D.; Vaccaro, C. Chemical-mineralogical characterisation as useful tool in the assessment of the decay of the Mesóla Castle (Ferrara, Italy). Constr. Build. Mater. 2010, 24, 2672–2683. [Google Scholar] [CrossRef]
  36. Lachance, G.R.; Traill, J.R. Practical solution to the matrix problem in X-ray analysis. Can. Spectrosc. 1966, 11, 43–48. [Google Scholar]
  37. Telloli, C.; Chicca, M.; Pepi, S.; Vaccaro, C. Saharan dust particles in snow samples of Alps and Apennines during an exceptional event of transboundary air pollution. Environ. Monit. Assess. 2018, 190, 37. [Google Scholar] [CrossRef]
  38. Guarnieri, C. Le forme potorie tra XV e XVI secolo a Ferrara e nel Ducato Estense: Prima sistemazione tipologica ed alcune considerazioni sui contesti. In Atti delle XI Giornate Nazionali di Studio, Produzione e Distribuzione del Vetro Nella Storia: Un Fenomeno di Globalizzazione; Editrice La Mandragora, Ed.; Editrice La Mandragora: Imola, Italy, 2007; pp. 137–145. [Google Scholar]
  39. Green, L.R.; Alan Hart, F. Colour and chemical composition in ancient glass: An examination of some roman and wealden glass by means of ultraviolet-visible-infra-red spectrometry and electron microprobe analysis. J. Archaeol. Sci. 1987, 14, 271–282. [Google Scholar] [CrossRef]
  40. Schreurs, J.W.H.; Brill, R.H. Iron and sulfur related colors in ancient glasses. Archaeometry 1984, 26, 199–209. [Google Scholar] [CrossRef]
  41. Hodge, F.G.; Dominey, L. Cobalt and Cobalt Alloys. In Kirk-Othmer Encyclopedia of Chemical Technology; John Wiley & Sons, Inc.: Hoboken, NJ, USA, 2001. [Google Scholar] [CrossRef]
  42. Hodge, F.G.; Dominey, L. Cobalt and Cobalt Alloys. In Kirk-Othmer Encyclopedia of Chemical Technology; John Wiley & Sons, Inc.: Hoboken, NJ, USA, 2010. [Google Scholar] [CrossRef]
  43. Zhou, G.X. The origin and classification of cobalt coloring materials in China. Sci. Conserv. Archaeol. 2012, 24, 113–120. [Google Scholar]
  44. Gratuze, B.; Pactat, I.; Schibille, N. Changes in the signature of cobalt colorants in late antique and early Islamic glass production. Minerals 2018, 8, 225. [Google Scholar] [CrossRef] [Green Version]
  45. Phelps, M.; Freestone, I.C.; Gorin-Rosen, Y.; Gratuze, B. Natron glass production and supply in the late antique and early medieval Near East: The effect of the Byzantine-Islamic transition. J. Archaeol. Sci. 2016, 75, 57–71. [Google Scholar] [CrossRef]
  46. Koob, S.P.; Davison, S. Conservation and Restoration of Glass. J. Am. Inst. Conserv. 2004. [Google Scholar] [CrossRef]
  47. Davison, S.; Newton, R.G. Conservation and Restoration of Glass; Routledge: Abingdon, UK, 2008. [Google Scholar]
  48. Angelini, I.; Artioli, G.; Bellintani, P.; Diella, V.; Gemmi, M.; Polla, A.; Rossi, A. Chemical analyses of Bronze Age glasses from Frattesina di Rovigo, Northern Italy. J. Archaeol. Sci. 2004, 31, 1175–1184. [Google Scholar] [CrossRef]
  49. Peake, J.R.N.; Freestone, I.C. Cross-craft interactions between metal and glass working: Slag additions to early Anglo-Saxon red glass. In Proceedings of the SPIE—The International Society for Optical Engineering, Brussels, Belgium, 16–17 April 2012; Volume 8422. [Google Scholar] [CrossRef]
  50. Sessegolo, L.; Verney-Carron, A.; Ausset, P.; Nowark, S.; Triquet, S.; Saheb, S.; Chabas, A. Alteration rate of medieval potash-lime silicate glass as a function of pH and temperature: A low pH-dependent dissolution. Chem. Geol. 2020, 550, 119704. [Google Scholar] [CrossRef]
  51. Lilyquist, C.; Brill, R.H. Studies in Ancient Egyptian Glass; Metropolitan Museum of Art: New York, NY, USA, 1993. [Google Scholar]
  52. Salviulo, G.; Silvestri, A.; Molin, G.; Bertoncello, R. An archaeometric study of the bulk and surface weathering characteristics of Early Medieval (5th–7th century) glass from the Po valley, northern Italy. J. Archaeol. Sci. 2004, 31, 295–306. [Google Scholar] [CrossRef]
  53. Tite, M.S.; Shortland, A.; Maniatis, Y.; Kavoussanaki, D.; Harris, S.A. The composition of the soda-rich and mixed alkali plant ashes used in the production of glass. J. Archaeol. Sci. 2006, 33, 1284–1292. [Google Scholar] [CrossRef]
  54. Silvestri, A.; Molin, G.; Salviulo, G. Roman and medieval glass from the Italian area: Bulk characterization and relationships with production technologies. Archaeometry 2005, 47, 797–816. [Google Scholar] [CrossRef]
  55. Ashtor, E.; Cevidalli, G. Levantine alkali ashes and European industries. J. Eur. Econ. Hist. 1983, 12, 475–522. [Google Scholar]
Figure 1. Map of the sampling site in Piazza Municipale in the center of Ferrara (red circle), and on the right side, the geometrical map in which the stratigraphic unit (US1050) was represented. Yellow colored circles indicate the sampling sites of Gruppioni [19] (San Paolo church, Palazzo Paradiso, and Palazzo Schifanoia).
Heritage 03 00045 g001
Figure 2. Subdivision of the fragments collected on the basis of their original object.
Heritage 03 00045 g002
Figure 3. Drawings of possible objects originating from the fragments analyzed: (a) 1 apode glass; 4, 5, 6, 7, 8, 9, 10 bottles; (b) 5 urinals; (c) 2 and 5 bottles with vertical edges on the surface.
Heritage 03 00045 g003aHeritage 03 00045 g003b
Figure 4. Photo of small fragments of (a) truncated cone glass (sample 158); (b) smooth-walled bottles (sample 177B); (c) bottles with vertical edges on the surface (sample 179); (d) a bottle with a particular “rigadin” decoration (sample 187); (e) urinals (sample 191A); (f) example of gel layer alteration observed in the sample 179.
Heritage 03 00045 g004
Figure 5. Photo imaging obtained by SEM of the fragments of (a) and (b) truncated cone glass, sample 158; (c) a smooth-walled bottle, sample 177B; (d) and (e) a bottle with vertical edges on the surface, sample 179; (f) and (g) a bottle with a particular “rigadin” decoration, sample 187; (h) a urinal, sample 191A; (i) gel layer alteration observed in the sample 179.
Heritage 03 00045 g005aHeritage 03 00045 g005b
Figure 6. MgO vs. K2O wt.% content in glass fragments from Piazza Municipale (XRF data). The evidenced areas are referred to as objects utilizing natron (low-potassium and magnesium area) and plant ash (high-potassium and magnesium area) as flux according to Lilyquist and Brill [51].
Heritage 03 00045 g006
Figure 7. Scatter plot of the different kind of plant analysed by Ashtor-Cevidalli [55] and of the glass samples collected, represented in the diagrams as colored stars (in the red circle): (a) Na2O/K2O diagram, in which the square symbols (in the green circle) represents the samples by Gruppioni [19]; (b) CaO/MgO diagram.
Heritage 03 00045 g007
Table 1. XRF (X-Ray Fluorescence) data of the major oxides present in the fragments analyzed and expressed in weight (%).
Oxide154155158177A177A179181187191A191B
blueGreenyellowblueyellowbluegreengreenyellowBlue
truncated cone glasssmooth-walled bottlesbottles with vertical edgesbottle with “rigadin”Urinals
SiO273.0973.6471.6173.8372.3371.5771.7571.1771.2371.96
TiO20.070.060.080.070.070.080.070.070.090.07
Al2O30.980.821.130.930.970.940.971.011.091.06
Fe2O30.410.330.480.370.400.480.410.490.540.47
MnO1.281.662.290.871.621.131.732.062.331.00
MgO3.553.373.503.213.834.053.713.633.664.05
CaO7.766.747.407.807.548.728.138.027.628.41
Na2O11.2212.2512.4210.9512.0611.4111.9712.3112.3011.43
K2O1.500.990.961.791.031.461.121.101.021.40
P2O30.140.130.140.180.140.150.140.140.140.15
TOT.100100100100100100100100100100
Table 2. XRF data of the trace elements present in the fragments analyzed and expressed in ppm (n.d. means not detected).
Trace Elements154155158177A177B179181187191A191B
Ba232171284228161211182210232170
Cen.d.137n.d.n.d.3720n.d.
Co31162127112613151821
Cr455013855442940436143
La1n.d.n.d.5n.d.40005
Nb461151061011154
Nin.d.n.d.n.d.n.d.n.d.n.d.n.d.n.d.n.d.n.d.
Pbn.d.n.d.n.d.n.d.n.d.n.d.n.d.n.d.n.d.n.d.
Rb2n.d.n.d.5n.d.5n.d.n.d.n.d.3
Sr231319370428442499521523454288
Th7121n.d.3n.d.015
V22182622222217202320
Y88126118910128
Zn120113190140120126118144177117
Zr1010928152418201416
Cu129240181231122113n.d.83
Gan.d.1123549137n.d.
Nd01104n.d.11n.d.n.d.
Sn.d.432n.d.n.d.816n.d.178n.d.69n.d.
Sc891010108117109
Table 3. SEM-EDS (Scanning Electron Microscopy-Energy Dispersive X-ray Spectrometer) data of sample 158 (fragment of truncated cone glass) and expressed in oxide (%).
ElementsPoint 1Point 2Point 3Point 4Point 5Point 6Point 7Point 8Point 9
SiO259.9281.0682.0480.9574.1467.9670.6569.9666.51
Al2O39.6710.0710.4110.858.432.433.763.615.16
Fe2O32.860.000.000.000.001.821.201.402.59
MnO3.520.000.000.000.003.652.863.055.05
MgO2.381.281.541.431.192.052.732.631.84
CaO15.723.263.403.5613.2714.4810.8411.2613.82
Na2O0.000.800.680.580.003.775.005.021.45
K2O2.031.931.932.632.133.842.953.073.58
P2O31.140.000.000.000.000.000.000.000.00
SO32.750.000.000.000.830.000.000.000.00
SrO0.001.590.000.000.000.000.000.000.00
TOT.100100100100100100100100100
Table 4. SEM-EDS data of sample 177B (fragment of smooth-walled bottles) and expressed in oxide (%).
ElementsPoint 1Point 2Point 3
SiO284.1183.4457.12
Al2O38.027.751.51
Fe2O30.000.003.06
MnO0.000.006.72
MgO1.621.190.00
CaO2.894.1725.97
Na2O1.270.870.00
K2O2.082.585.62
TOT.100100100
Table 5. SEM-EDS data of sample 179 (fragment of bottles with vertical edges on the surface) and expressed in oxide (%).
ElementsPoint 1Point 2Point 3Point 4Point 5Point 6Point 7
SiO272.7668.0773.0067.0371.1181.8440.69
Al2O32.643.202.651.521.679.944.95
Fe2O31.311.150.940.540.000.000.00
MnO0.641.531.391.151.080.000.00
MgO2.842.462.584.483.971.921.13
CaO11.0617.0410.299.108.883.0631.52
Na2O6.283.906.2613.7310.971.610.00
K2O2.472.652.892.452.311.630.82
SO30.000.000.000.000.000.0020.90
TOT.100100100100100100100
Table 6. SEM-EDS data of sample 187 (fragment of a bottle with a particular “rigadin” decoration) and expressed in oxide (%).
ElementsPoint 1Point 2Point 3Point 4Point 5
SiO266.2373.4468.8649.9569.15
Al2O31.957.832.1311.762.30
Fe2O31.090.000.825.240.77
MnO1.960.002.284.792.23
MgO4.030.003.203.953.50
CaO10.5414.7210.6714.409.89
Na2O11.790.009.461.149.89
K2O2.424.012.582.132.26
P2O30.000.000.005.050.00
SO30.000.000.001.600.00
TOT.100100100100100
Table 7. SEM-EDS data of sample 191A (fragment of urinal) and expressed in oxide (%).
ElementsPoint 1Point 2Point 3
SiO282.2570.7373.15
Al2O310.662.804.40
Fe2O30.000.001.26
MnO0.002.682.13
MgO0.803.132.07
CaO3.609.899.92
Na2O0.788.074.45
K2O1.912.712.62
TOT.100100100
Table 8. SEM-EDS data of an example of gel layer alteration observed in the sample 179 expressed in oxide (%).
ElementsPoint 1Point 2Point 3
SiO252.7625.0857.42
TiO23.150.001.51
Al2O36.345.266.20
Fe2O314.245.6911.55
MnO0.751.250.00
MgO0.960.880.72
CaO10.4857.0511.59
K2O1.562.062.02
P2O39.762.746.37
SO30.000.002.62
TOT.100100100
Table 9. Averages of the major elements analyzed in Venetian glass [18].
%7th–12th Century13th–14th Century
SiO268.6068.40
TiO20.110.09
Al2O31.821.40
Fe2O30.590.40
MnO1.120.90
MgO2.713.35
CaO8.1010.02
Na2O13.1011.70
K2O2.322.50
P2O50.330.31
TOT.100100

