Article

On-Site VIS-NIR Spectral Reflectance and Colour Measurements—A Fast and Inexpensive Alternative for Delineating Sediment Layers Quantitatively? A Case Study from a Monumental Bronze Age Burial Mound (Seddin, Germany)

1
Freie Universität Berlin, Institute of Geographical Sciences, 12249 Berlin, Germany
2
Brandenburgisches Landesamt für Denkmalpflege und Archäologisches Landesmuseum, 15806 Zossen, Germany
*
Author to whom correspondence should be addressed.
Heritage 2020, 3(2), 528-548; https://doi.org/10.3390/heritage3020031
Submission received: 22 May 2020 / Revised: 17 June 2020 / Accepted: 19 June 2020 / Published: 25 June 2020
(This article belongs to the Special Issue Optical Technologies Applied to Cultural Heritage)

Abstract

:
Quantitative sediment analyses performed in the laboratory are often used throughout archaeological excavations to critically reflect on-site stratigraphic delineation. Established methods are, however, often time-consuming and expensive. Recent studies suggest that systematic image analysis can objectivise the delineation of stratigraphic layers based on fast quantitative spectral measurements. The presented study examines how these assumptions prevail when compared to modern techniques of sediment analysis. We examine an archaeological cross-section at a Bronze Age burial mound near Seddin (administrative district Prignitz, Brandenburg, Germany), consisting of several layers of construction-related material. Using detailed on-site descriptions supported by quantitatively measured sediment properties as a measure of quality, we compare clustering results of (i) extensive colour measurements conducted with an RGB and a multispectral camera during fieldwork, as well as (ii) selectively sampled sedimentological data and (iii) visible and near infrared (VIS-NIR) hyperspectral data, both acquired in the laboratory. Furthermore, the influence of colour transformation to the CIELAB colour space (Commission Internationale de l’Eclairage) and the possibilities of predicting soil organic carbon (SOC) based on image data are examined. Our results indicate that quantitative spectral measurements, while still experimental, can be used to delineate stratigraphic layers in a similar manner to traditional sedimentological data. The proposed processing steps further improved our results. Quantitative colour measurements should therefore be included in the current workflow of archaeological excavations.

Graphical Abstract

1. Introduction

Stratigraphic documentation and interpretation are crucial parts of archaeological research. Since the emergence of the archaeological discipline, researchers have been concerned with the identification of methods that allow more objectivity in stratigraphic delineation and interpretation. The fundamental work of, e.g., Harris [1] is meanwhile complemented by a progressing digitisation of fieldwork (e.g., [2]) and a growing number of on-site measurements and analyses carried out in various laboratories in the aftermath of an excavation. These techniques comprise, e.g., the establishment of soil colour standards (cf. [3,4]), geochemical analyses of sediments (e.g., [5,6,7]), the analysis of thin sections (e.g., [8]), or the analysis of pollen [9] and phytoliths [10].
The overall objectivity of stratigraphic interpretation clearly benefits from these techniques. Nevertheless, the initial on-site delineation of stratigraphic layers (i.e., stratigraphic documentation) remains partly influenced by the perception of the respective researcher at work. As pointed out by Zhang and Hartemink [11] and Haburaj et al. [12], statistical analysis of RGB and multispectral images of soil profiles can be utilised to semi-automatically delineate stratigraphic units. These derived units are based on the physical measurement of the sediments’ spectral reflectance and allow the respective researcher to critically face up to his or her delineation.
Building upon these developments, our study further explores the potential of visible and near-infrared (VIS-NIR, 400–700–2500 nm) spectral data for archaeological fieldwork. Due to its non-destructive character and the moderate extent of necessary sample preparation, spectroscopy in general has the potential to save time and costs during fieldwork (e.g., [12,13,14,15]). Working with an archaeological cross-section from a Bronze Age burial mound from Brandenburg, northern Germany, we investigate how traditional geochemical sediment analyses, selective spectroscopic measurements, and extensive RGB and multispectral image data can be used to objectivise archaeological field documentation by quantitatively capturing stratigraphic layers. Using a detailed on-site description supported by quantitatively measured sediment properties (grain size composition, water content, and soil organic carbon content) as a measure of quality, we compare clustering results of (i) extensive colour measurements (i.e., image data) acquired with an RGB and a multispectral camera during fieldwork, as well as clustering results of selectively sampled (ii) portable energy-dispersive X-ray fluorescence spectrometer (p-ED-XRF) data and (iii) visible and near infrared (VIS-NIR) hyperspectral data, both acquired in the laboratory. This experimental approach allows us to illustrate the benefits and shortcomings of systematic spectral measurements as a complementary or alternative method for stratigraphic documentation, delineation, and interpretation.
The characteristics of the recorded diffuse reflectance spectra of the sediments are directly linked to their chemical and physical composition (e.g., [13]). Within the last two decades, an increasing number of publications were devoted to the prediction of soil properties via VIS-NIR spectroscopy (e.g., [16,17,18,19,20]). Soriano-Disla et al. [21] deliver an extensive overview on the predictability of multiple soil properties via visible, near-infrared, and mid-infrared spectral data. We therefore examined how the conducted image classification performs when using additional input data: We were able to calibrate a prediction model for soil organic carbon (SOC) based on the recorded spectral signal and created a raster containing predicted SOC values for the entire profile. Several authors have argued that the CIELAB colour space (Commission Internationale de l’Eclairage) shows a clear benefit regarding quantitative analyses (e.g., [22,23,24,25,26,27]). The CIELAB colour space consists of three values: L* is the vertical axis and is defined by lightness, while a* and b* represent the chromaticity (a*: Red/green; b*: Yellow/blue). We examined colour transformation to the CIELAB colour space, as it was found to be highly effective when analysing soil profiles (e.g., [28]). Hereby, our overarching aim remains the delineation of stratigraphic layers rather than the quantitative examination of sediment properties.
Our results indicate the importance of quantitatively measuring sediment colours—be it selective or extensive—as they constitute an additional layer of documentation during an archaeological excavation, which can be acquired easily and render the on-site archaeological documentation and interpretation more transparent and reproducible. The study at hand is presented as an experimental investigation, which allows us to assess the potential of VIS-NIR spectral sensors for archaeological fieldwork.

Study Site

The Bronze Age burial mound of Seddin (colloquial: ‘King’s Grave’, German: Königsgrab Seddin), which was discovered in 1899, is widely known for its tremendous size and the valuable funerary goods made from bronze, iron, glass, and stone (e.g., [29,30,31]). It was dated to approximately 800 BC (period V of the Nordic Bronze Age) and has a central role in the regional cultural landscape, which today covers the north-west of the federal state of Brandenburg and southern Mecklenburg [32,33]. While past studies found the surroundings of the burial mound to be heavily shaped by human influence, which occurred during the Bronze Age [31,34], the ‘King’s Grave’ keeps an outstanding position, both regarding its geographical location and its rich physical characteristics. Estimates by May [35] see the total height of the mound between eight and ten metres. The burial mound is separated spatially from smaller groups of burial mounds in the surrounding area. It is located on a slight spur, surrounded by multiple waterbodies [31]: 900 m east of the burial mound runs the river Stepenitz, and in the north and south, two of the river’s tributaries delimit the burial mound from its surroundings (Figure 1). The parent material is dominated by Pleistocene deposits, composed mostly of fine to coarse glaciofluvial sand with little or no gravel [36]. West and south of the burial mound, clayey to sandy silt can be found. In the hollows, associated with the two tributaries of the Stepenitz (Figure 1), muck soil of a sand–humus mixture dominates, which overlies fluvial and periglacial deposits [36]. The relief of the surrounding landscape is characterised by a smooth, rather levelled topography that is dissected by depressions and river valleys. Regarding the wider vicinity, several burial mounds of similar size are known but have mostly been destroyed and lack any archaeological record [31,37]. Regardless of the nature of these undocumented burial mounds, their sheer amount reflects the importance of this landscape during the late Bronze Age. Brunke et al. [38] see the ‘King’s Grave’ of Seddin as the clearest manifestation of an accumulation of wealth and power in this area around the middle reaches of the Stepenitz.
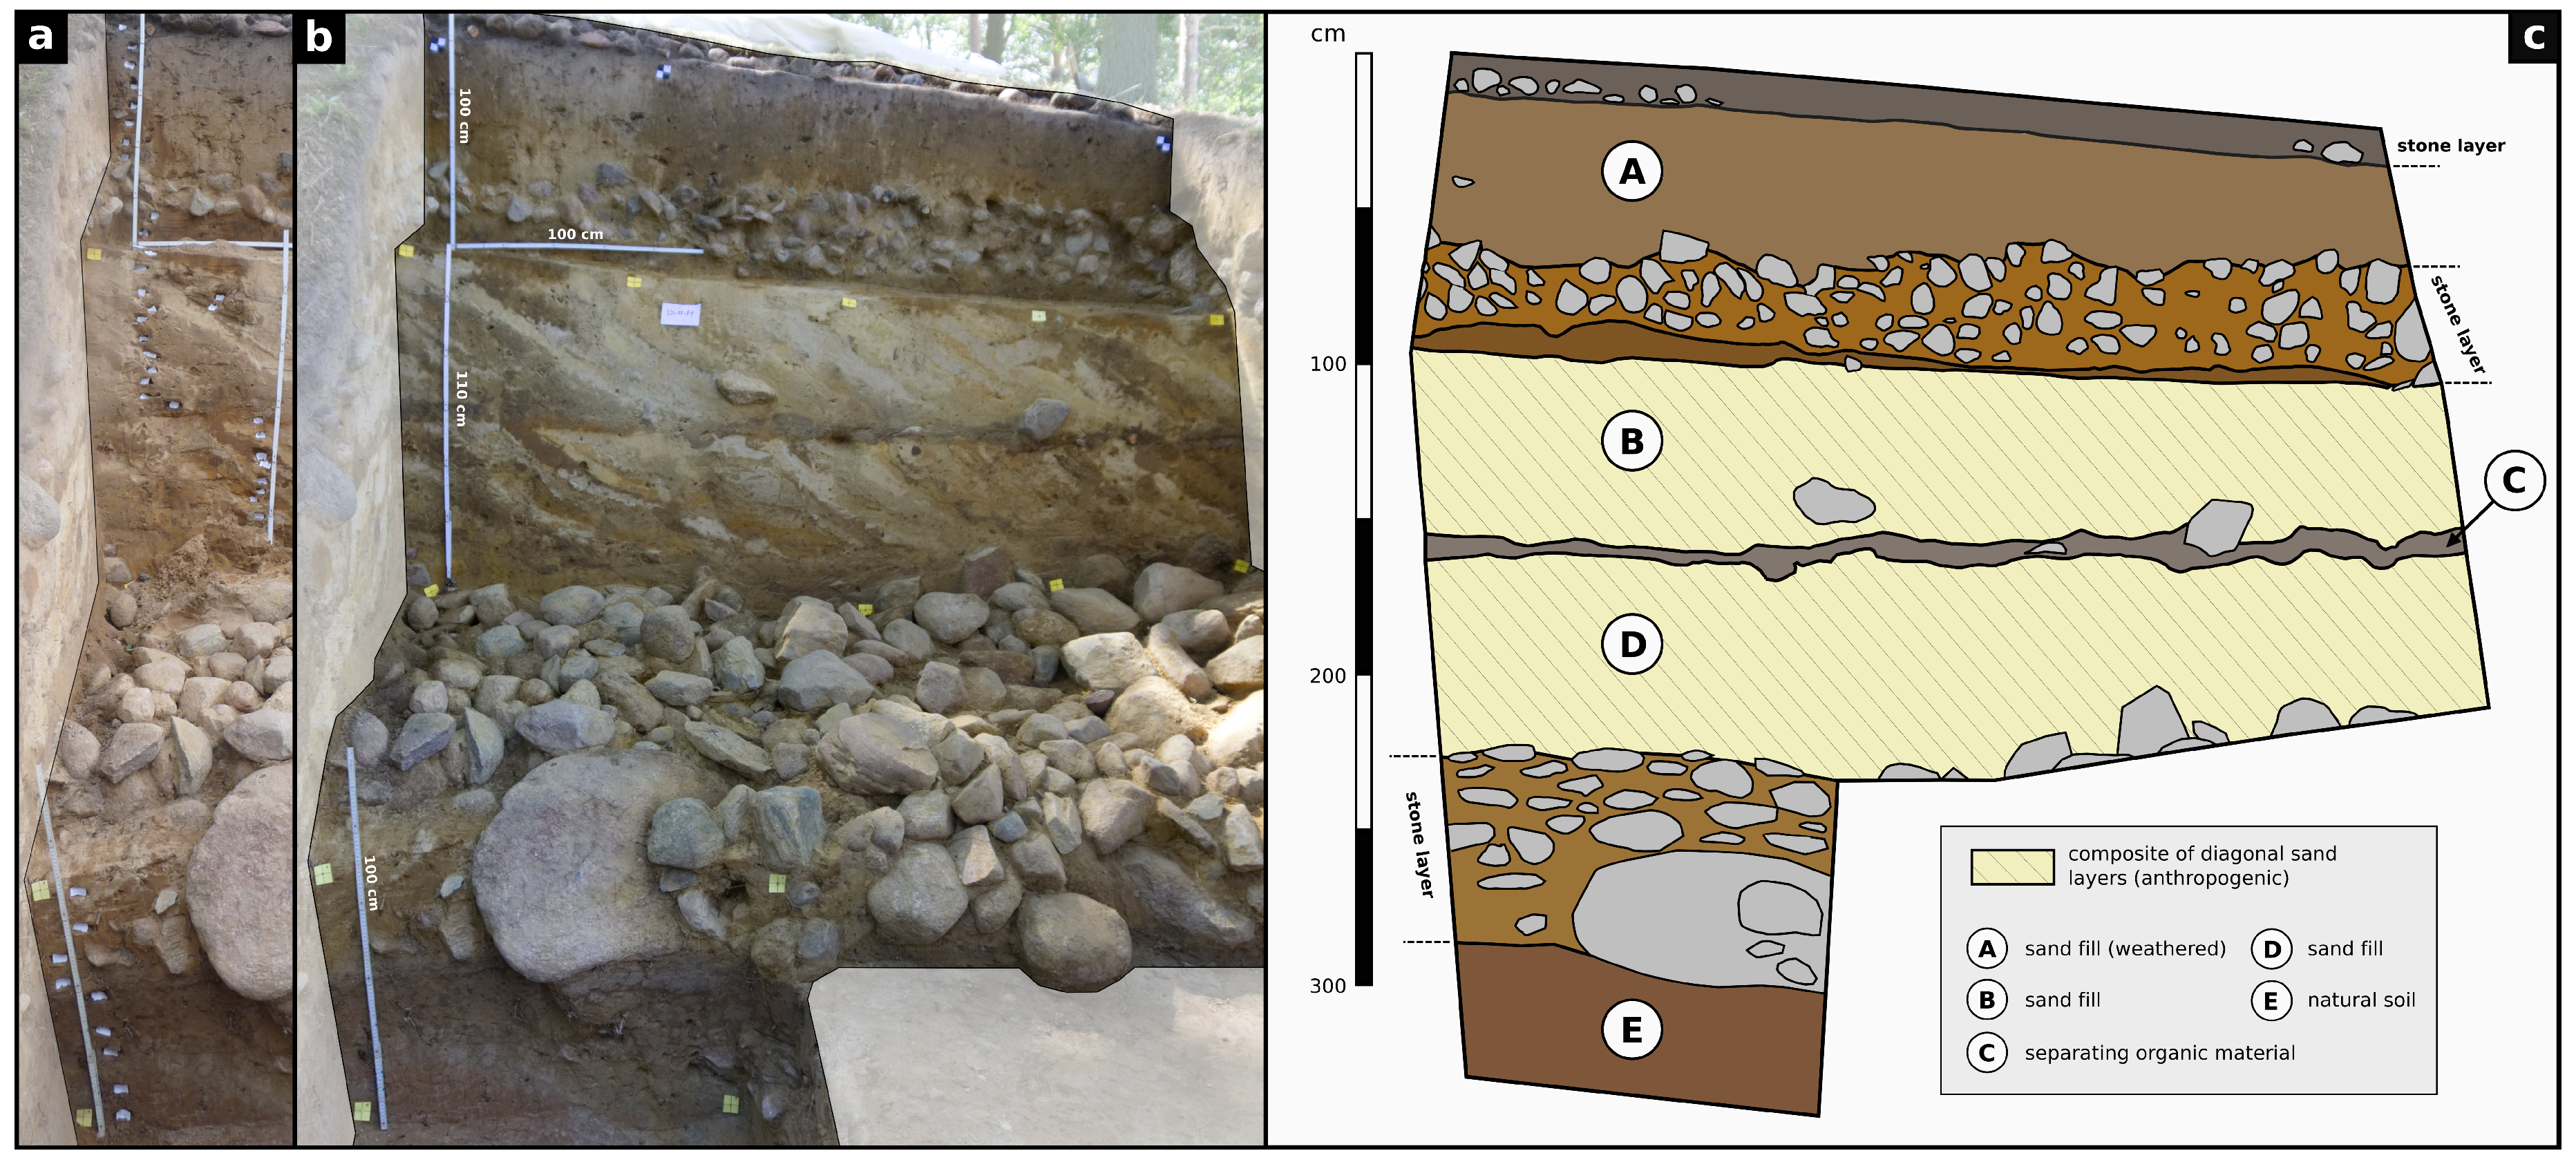
Within this study, we examine section SD17P1 (297601 E, 5891584 N; WGS84; UTM 33N), which was documented in 2017 during an excavation on the north-western slope of the Bronze Age burial mound of Seddin. The investigated section faces north, is approximately 3.2 m high, and consists mainly of anthropogenic layers: Only the lowermost 20–40 cm are interpreted as the buried local soil (Figure 2c,E), which was dated by three14C-AMS ages to the ninth century BC [33]. The remaining part of the profile consists of discrete layers, which were piled up during the construction of the burial mound with alternating layers of stone and sand that were deposited on top of each other. In addition, there is a horizontally running, thin, dark layer, which crosses the lowest artificial sand layer (Figure 2c,C). The type of construction with stone layers at hand is congruent with the findings of Brunke et al. [38], who examined the south-eastern side of the burial mound in 2013. However, the diagonal segmentation and orientation of sand layers B and D is only present in SD17P1. The topmost stone layer of SD17P1 most likely represents the Bronze Age surface, which would, in addition to the prominent position of the mound, emphasise its monumental character (cf. [33]).
All analyses carried out in this study focus on the parts of the profile that lie above the lowest layer of stones, which is approximately 200 cm below the surface of the burial mound. Layer E (local soil) is therefore excluded from the processing (Figure 2c).

2. Materials and Methods

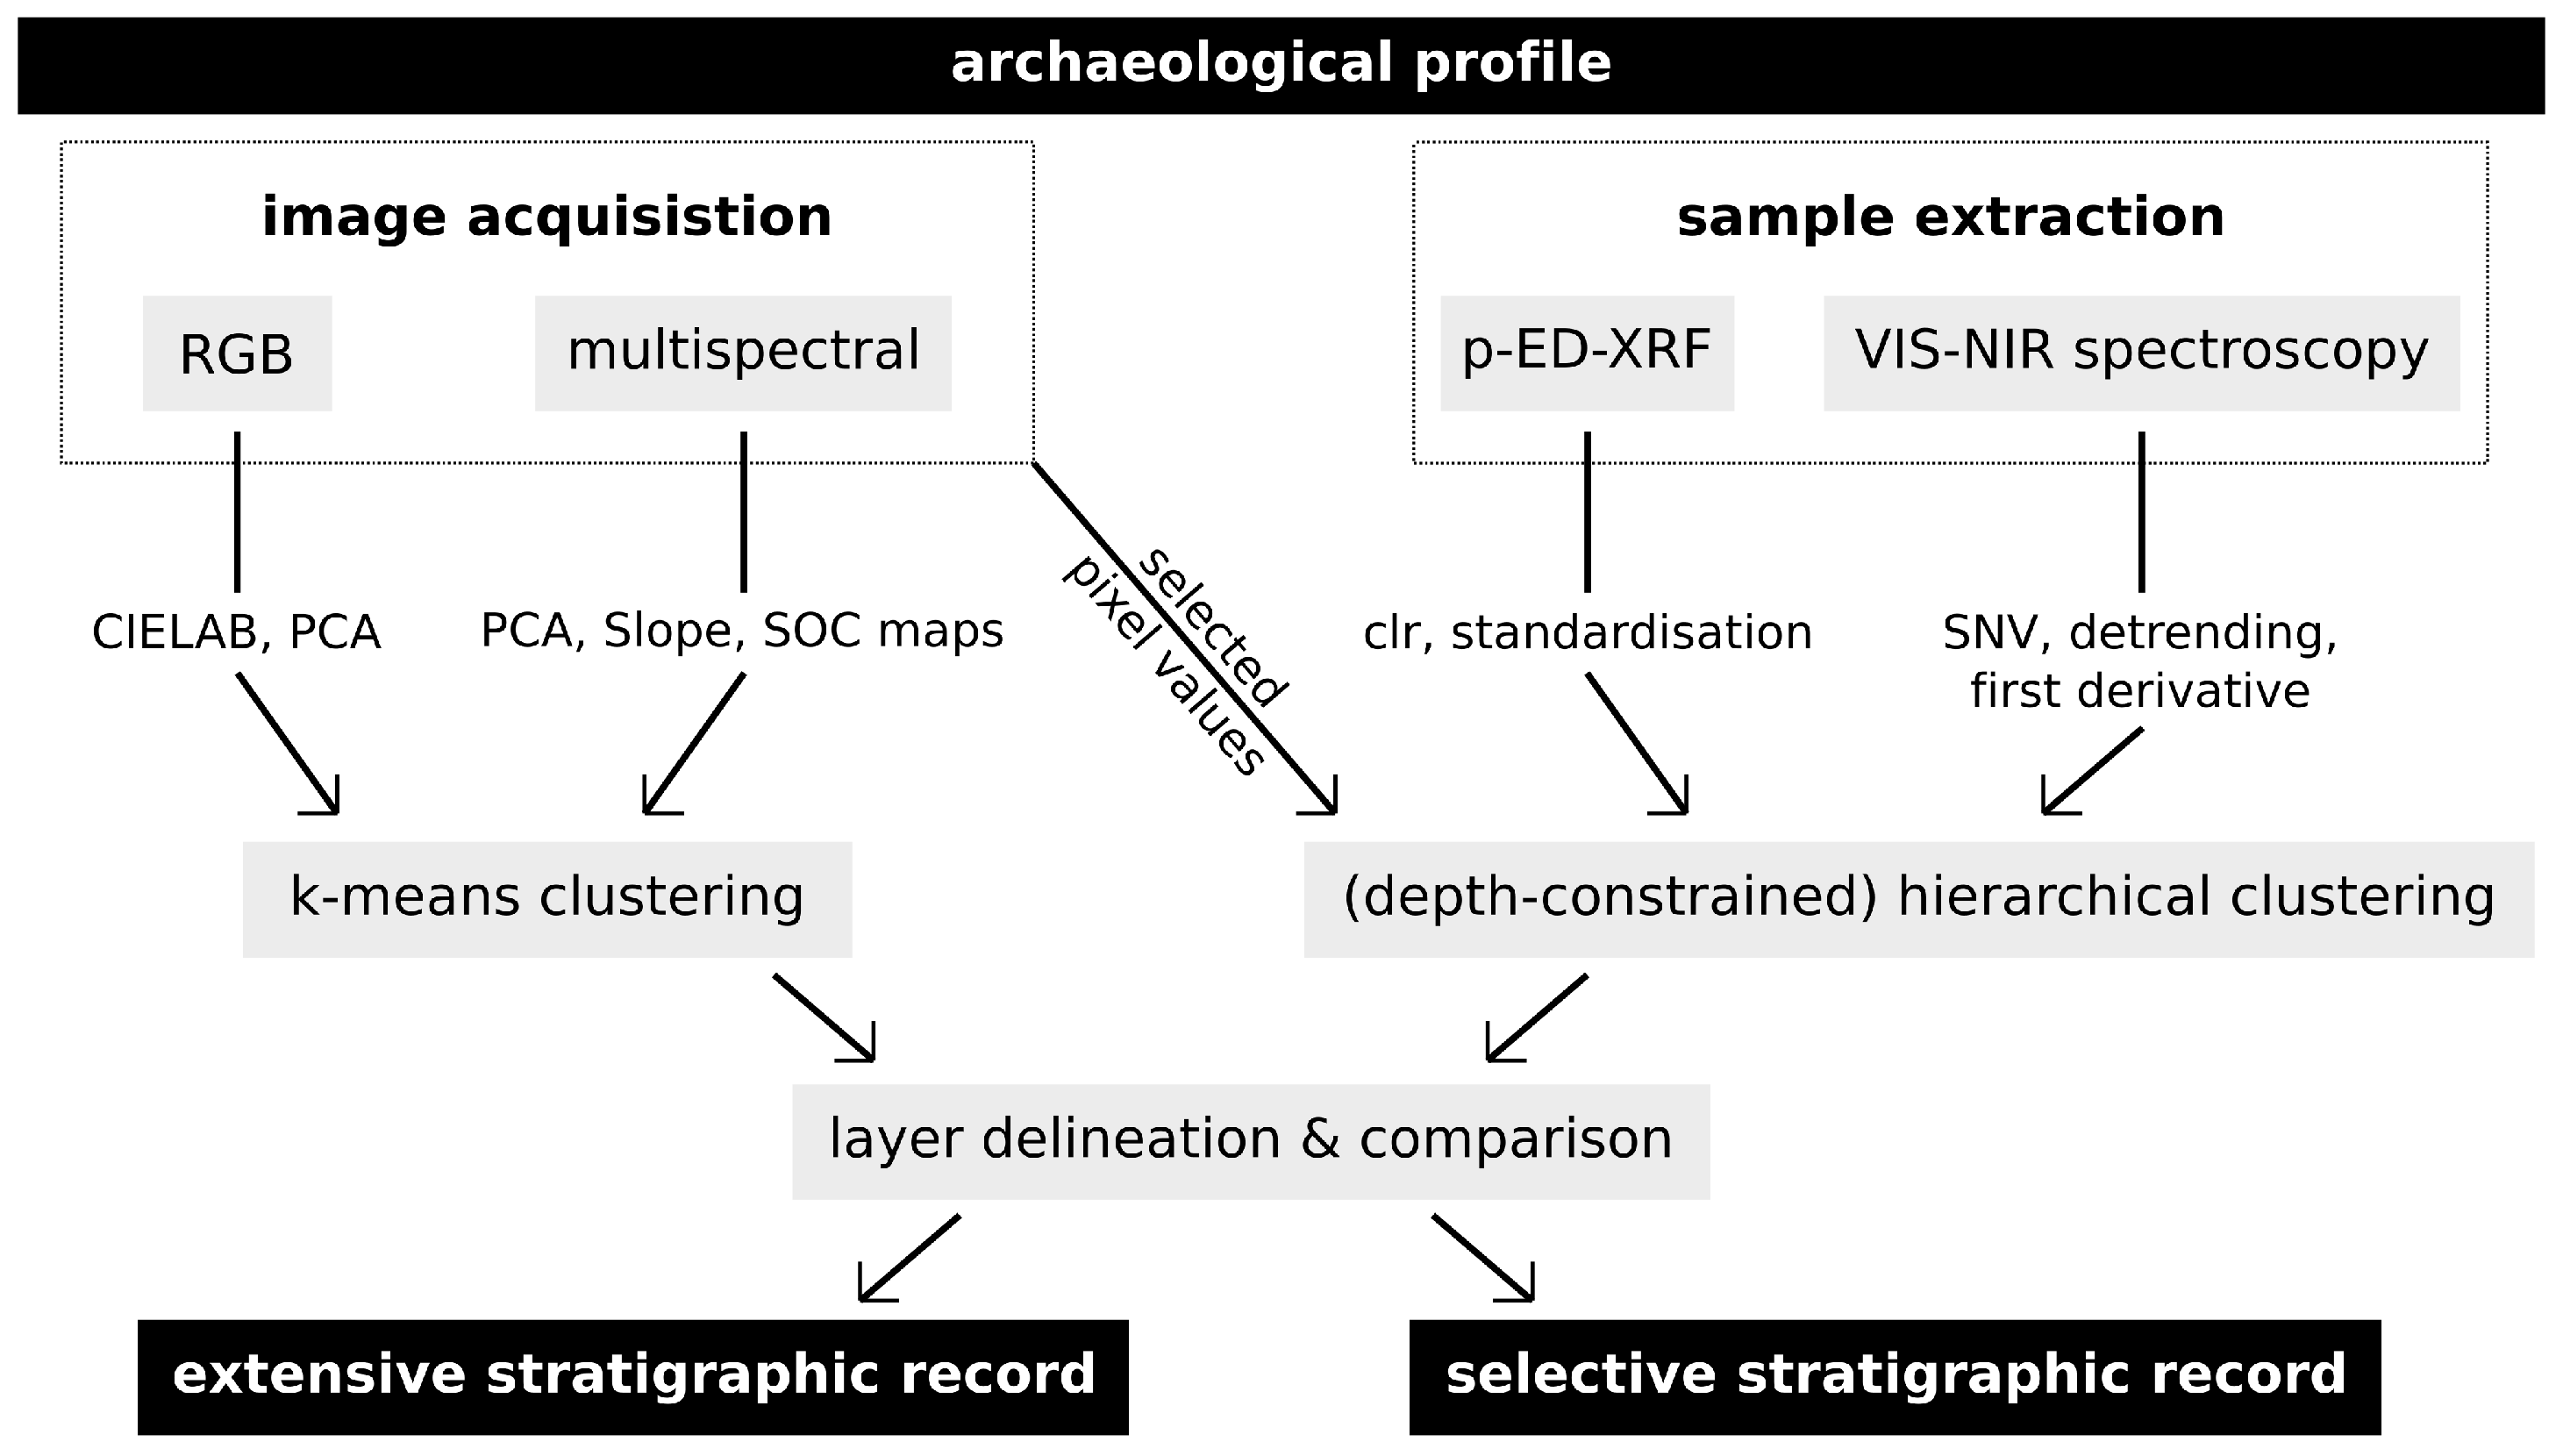
Our experimental design involves the measurement of selective data based on sediment samples extracted from the archaeological profile and extensive image data acquired during fieldwork. The workflow is depicted in Figure 3, and a more detailed documentation of the data processing along with scripts for the programming language R is given in Online Resources 1–3 (in Supplementary Materials).

2.1. Laboratory Sediment Analyses

Analyses were performed using the topmost 31 samples, extracted from the eastern part of the profile and vertically covering a depth of 6 to 194 cm, thus excluding the natural soil of layer E (Figure 2a). Samples were extracted and stored in airtight bags to minimise errors when measuring water content. We densely sampled layers B and D to consequently capture the variability between the single obliquely bedded sand layers. Stratigraphic (sub)layers were described regarding colour and texture using the Munsell soil colour chart [39] and the German manual of soil mapping [40] respectively.
Further laboratory analyses of the sediments followed after the determination of the water content and sample preparation, including crushing of aggregates, separation of coarse components with a 2-mm sieve, and homogenising of the subsamples for carbon and portable energy-dispersive X-ray fluorescence spectrometer (p-ED-XRF) analyses in a vibrating disc mill.

2.1.1. Water Content

The water content was determined gravimetrically. The moist samples were weighed, heated in a drying cabinet at 105 ° C until a constant weight was reached, cooled down to room temperature in a desiccator, and weighed again. The water content was calculated according to [41] and reported in mass%.

2.1.2. Soil Organic Carbon

The total carbon content of the samples was determined using a TruSpec CHN analyser by Leco (St. Joseph, Michigan, USA). Additionally, a small portion of the powdered material from all samples was tested for its carbonate content using 9.9% HCl acid. None of the samples showed signs of carbonate, which is why the measured total carbon content is interpreted as the total organic carbon content. During measurement, the samples were dry combusted at 950 ° C in an oxygen atmosphere, and carbon fluxes were quantified by infrared spectroscopy. The results were calibrated using certified reference material (CRM; Leco 502–309; 12.29 ± 0.37 mass% C; Leco 502–308; 3.6 ± 0.29 mass% C; reproducibility was <2% RSD) and are reported as soil organic carbon (SOC) in mass%.

2.1.3. pH Value

The pH values of the samples were measured in a 1:2.5 solution of 10 g of dried sediment and 25 mL of 0.01 M KCl using a handheld pH meter (Hanna Instruments, Woonsocket, Rhode Island, USA) with a resolution of 0.1.

2.1.4. Grain Size

The particle size distribution for the fraction ≤1 mm was determined with a laser diffraction particle size analyser LS13 320 by Beckman-Coulter (Brea, California, USA). The samples were sieved with a 1-mm sieve and bi-distilled water together with about 0.5 g Na 4 P 2 O 7 as an anti-coagulation agent. The samples were placed in an overhead shaker for 24 h and ultrasonic treated for 5 min directly before the measurement. The prepared samples were put into a liquid sample divider and two subsamples were measured with three independent runs each. The six measurements per sample were averaged to obtain the sample’s grain size distribution [42]. Particle sizes are defined according to [40] and reported in vol%.

2.1.5. Element Concentrations

Analysis of element concentrations was conducted with a Niton XL3t portable energy-dispersive X-ray fluorescence spectrometer (p-ED-XRF) by Thermo Scientific (Waltham, Massachusetts, USA). Internal parameter calibration was set to ‘mining mode’ and all measurements were recorded in %. Two certified reference materials (CRMs) were used for quality control: GBW07312 (stream sediment; National Research Center for Certified Reference Materials in China) and NCS DC 73387 (soil; China National Analysis Center for Iron and Steel). The CRMs were measured repeatedly after every eight samples. Since this study does not examine any absolute elemental concentrations but, rather, the overall variability throughout the profile, the CRMs were used only to ensure validity of the measured data. Recovery values were therefore not examined quantitatively.
Further processing of the p-ED-XRF data was necessary to produce reliable measurement results. Measurements with a value smaller than or equal to three times the 1- σ error were discarded. Following Schmidt et al. [43], the remaining results were analysed using a compositional data approach to manage the consistent sum-constrained model [44] via R [45]. Elements were only processed if the number of values below the limit of detection did not exceed 10% of the respective measurements. Subsequently, the data were transformed using centred log-ratio (clr; [44]):
z = c l r ( x ) = [ l n ( x 1 / g ( x ) ) , l n ( x 2 / g ( x ) ) , , l n ( x D / g ( x ) ) ] ,
where g ( x ) = [ x 1 × x 2 × × x D ] × 1 / D is the geometric mean of all parts of the observation x = [ x 1 , x 2 , , x D ] . This transformation was conducted using the compositions package for R [46]. Prior to the conducted cluster analysis, the data were additionally standardised using a robust z-transformation.

2.1.6. Visible and Near-Infrared Spectroscopy

Visible and near-infrared reflectance of the sediment samples was captured using an FieldSpec II spectroradiometer by ASD (Malvern, Worcestershire, UK). Samples were measured before and after homogenisation. This allowed us to indicate an influence of material, which may be coating quartz grains and, therefore, over-represented in the unground samples (e.g., fine clay or Fe oxides, see [21]), and likewise to assess the general influence of grinding and homogenisation on sediment colour [47]. Reflectance was measured between 350 and 2500 nm in 1 nm steps. Measurements were acquired in a darkroom, where each sample was uniformly illuminated by two halogen lamps to minimise the casting of shadows. Samples were spread homogeneously on a plate, and the fibre optic cable of the spectroradiometer was placed above the samples (Online Resource 3 in Supplementary Materials). Each spectrum was averaged from 50 single measurements to compensate for uneven sediment texture. A white reference was captured every 15 min to minimise variation between the measurements and to acquire normalised reflectance values in the range [0, 1].
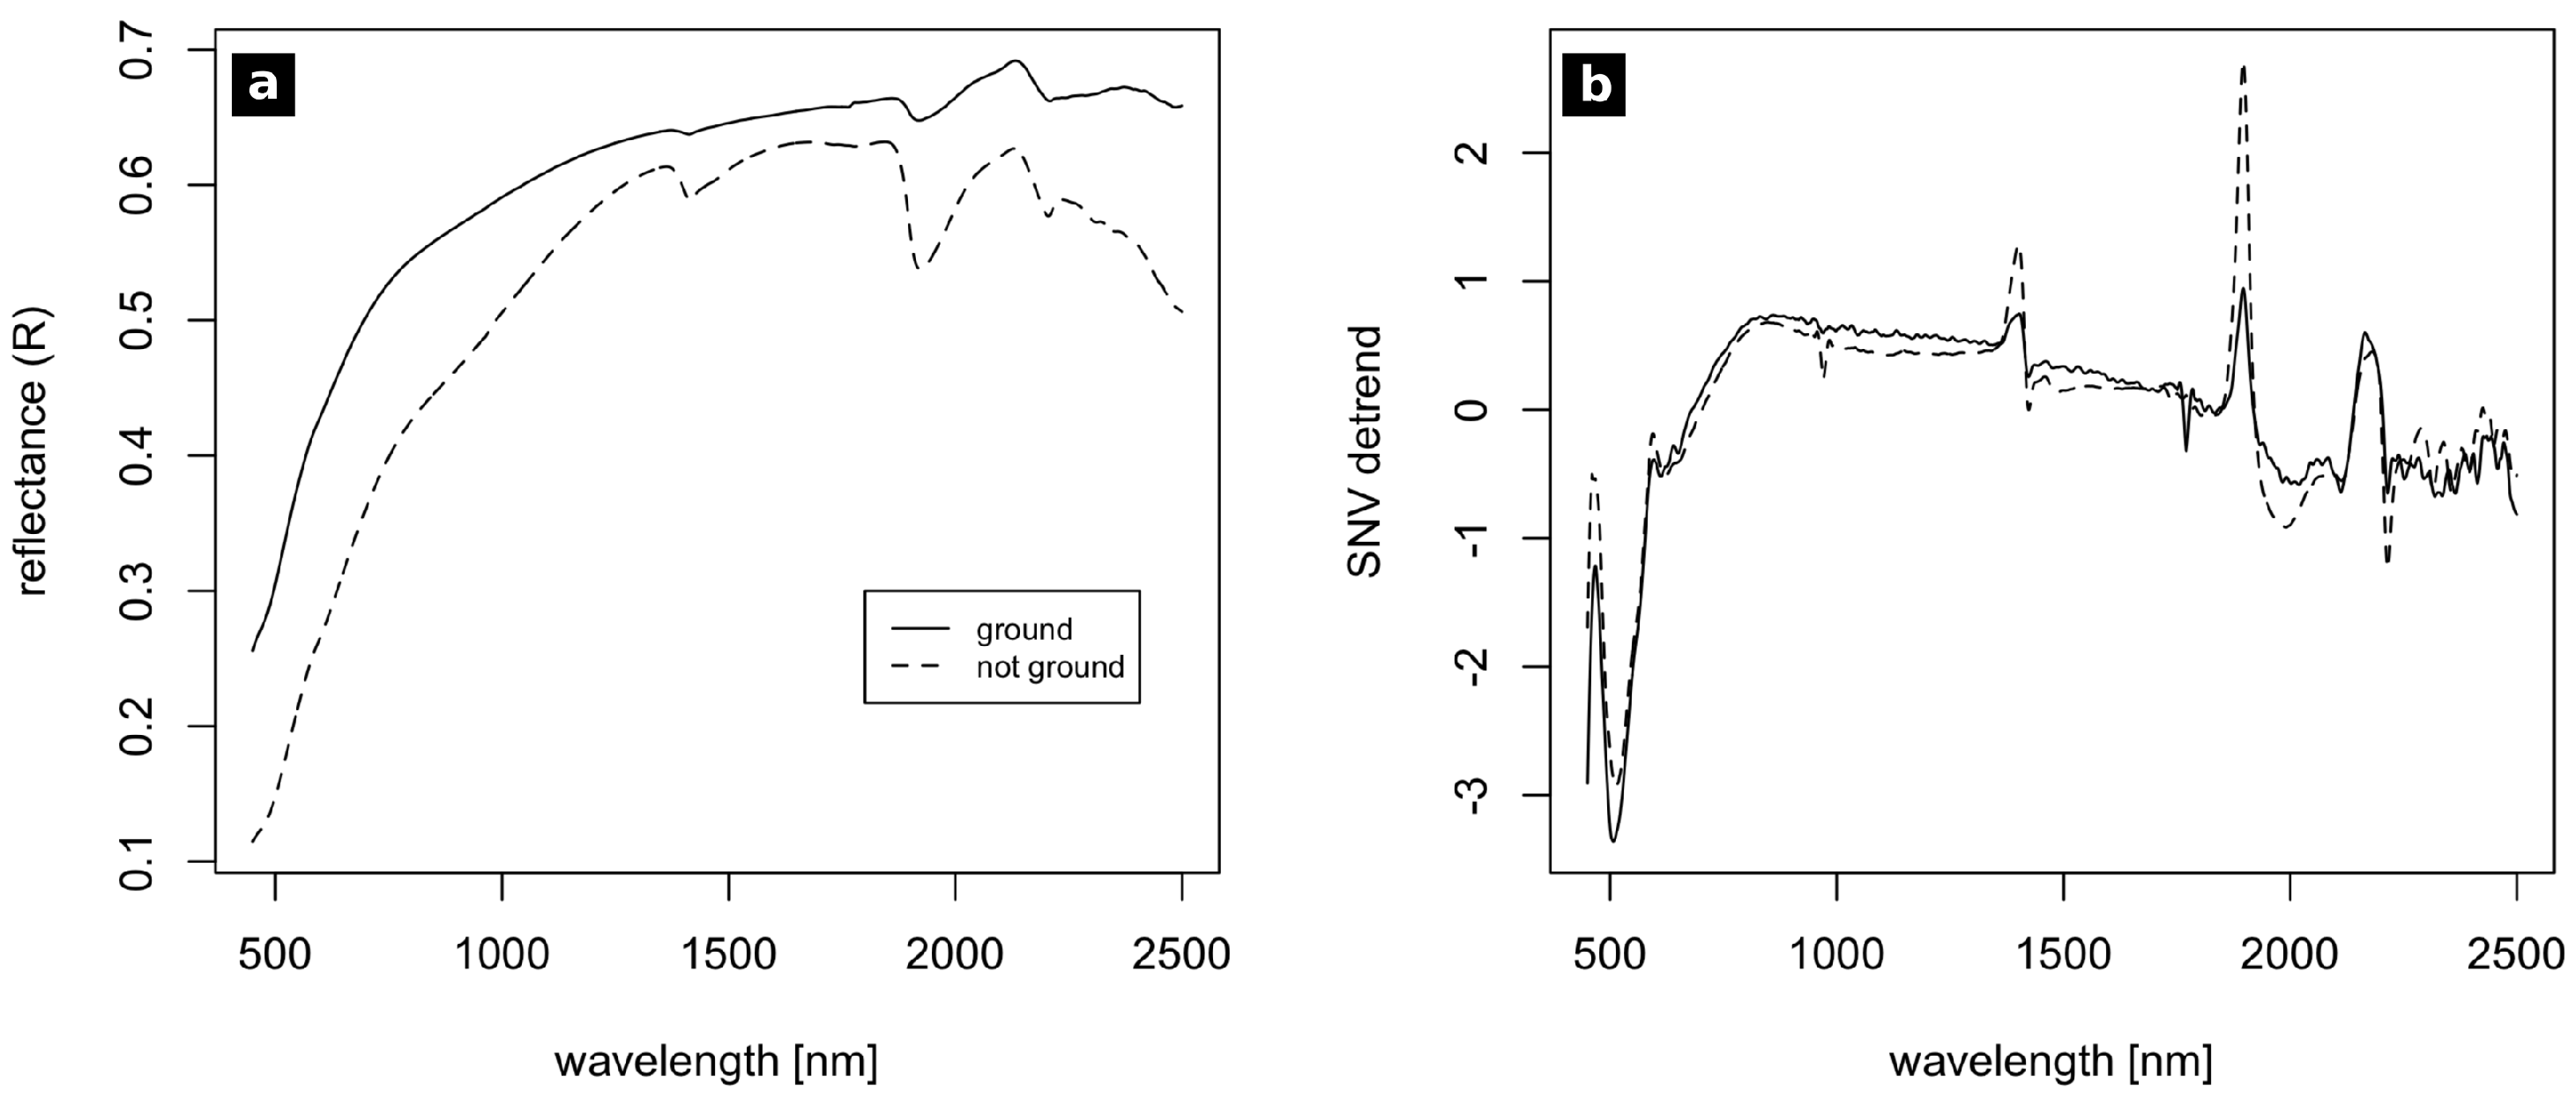
The raw spectral information showed a high noise content below 450 nm and above 2300 nm, as well as several smaller aberrations. The spectra were therefore smoothed using a Savitzky–Golay filter of second polynomial order with a width of 21 values [48]. This was conducted with the hsdar package for R [49]. Due to the high amount of noise below 450 nm, the spectral data were limited to the range between 450 and 2500 nm for further processing (Figure 4).
Several studies recommend analysing spectral absorbance rather than spectral reflectance (e.g., [23,50]). Spectral reflectance R was therefore transformed into absorbance A = l o g ( 1 / R ) , which allows for a better correlation of the signal with sedimentological data.
As an increase of overall reflectance was observed after homogenisation of the samples, several processing steps were carried out to compensate for this (Figure 4). Building upon Stenberg et al. [50], baseline correction was conducted by calculating the first derivative, which eliminated the existing baseline shift [51]. Furthermore, this step enhanced weak spectral signals. Since this step also introduced additional noise, the baseline corrected spectra were then smoothed using a Savitzky–Golay filter of second polynomial order with a width of 21 values. Subsequently, scatter correction was performed by a standard normal variate (SNV) transformation and de-trending [52]. These pre-processing steps allow for the direct comparison of the spectra of homogenised and non-homogenised samples as well as an enhancement of relevant spectral peaks and a reduction of, e.g., overall curvature [50]. A more detailed documentation of the workflow is delivered in Online Resource 3 (Supplementary Materials).

2.2. Image Acquisition

Digital RGB photographs of section SD17P1 were taken using a 24.3 MP mirrorless camera with a 2.8/16 mm lens (Sony ILCE-6000, Sony SEL-16F28, by Sony, Tokyo, Japan). Multispectral imaging was carried out using a Micro-MCA snapshot camera with six spectral channels (Table 1) by TetraCam (Chatsworth, California, USA). Central wavelengths and FWHM (full width half maximum) of the Sony ILCE-6000 RGB camera have been previously published by Haburaj et al. [12] and used throughout this study.
Using optical measurement systems, the lighting of the profile needs to be controlled and documented. Images were captured under natural diffuse daylight. Apart from smaller diffuse shadows in the corners, the section was captured under uniform lighting conditions. The cameras were placed on a tripod and centred in front of the respective section. Rotation of the cameras was limited to a minimum, and black-and-white reference targets were placed in the section, which allowed us to overlay and merge images manually afterwards while keeping spatial distortions at a minimum.
The RGB images were converted into 8-bit TIF format and normalised to the range [0, 1] via feature-scaling. Six multispectral images were recorded in TetraCam RWS-format (each containing one spectral channel and stored in three 8-bit layers, labelled red, green, and blue) and, to allow further processing, converted into six 10-bit TIF-format images using the formula provided by the manufacturer.
Since the used multispectral camera consists of an array of six separate cameras and the images were acquired from a distance of approximately five metres, a significant spatial offset between the spectral channels was present and required manual band alignment. The proprietary processing software PixelWrench2 contains an option for minimising this offset, which was used successfully by, e.g., Retzlaff [53]. This solution, however, is more suitable for images acquired during remote sensing, as they keep a certain minimal distance from the subject, therefore keeping the spatial offset at acceptable levels. Our ground-based approach, on the contrary, included an offset that was too high and, therefore, was corrected through the pairwise manual selection of reference points. The resulting multispectral images were normalised to the range [0, 1] via feature scaling.

2.3. Image Analysis

2.3.1. Image Pre-Processing

To allow for the comparison of the classification results via spatially consistent image data, the recorded RGB and multispectral images were processed by manually registering 12 reference points (overlapping geometries and artificial black-and-white targets) for thin plate spline [54] transformation (TPS) with nearest neighbour resampling, carried out with the Georeferencer plugin in QGIS (v2.18). This resulted in overlying images, which are necessary to assess the quality of the final results. All non-sediment objects captured in the images were masked manually. Aside from external disturbances like grass patches and other vegetation, this included the prehistoric stone layers that are separating the sediment layers from one another (Figure 2). This step was conducted using the raster package for R [55]. Minimising the impact of image noise and smaller disturbances within the profile, the images were filtered spatially using the raster package for R [55]. To keep the geometric alteration as low as possible and, likewise, to minimise the influence of outliers, we chose a median filter with a window size of 21 by 21 pixels (multispectral data) and 101 by 101 pixels (RGB data) for spatial filtering. The window size was scaled according to the respective spatial resolution and set to quite high values, since our main interest was in the main strata. The sediment layers examined did not include flakes of, e.g., brick, charcoal, or mortar, which renders the loss of texture detail in the image data acceptable [12].

2.3.2. Slope Rasters

Various derivatives of raster data show a positive impact on classification results. According to Haburaj et al. [12], the spectral slope between red, green, and blue channels—while introducing more noise—can help to identify organic material in the images. Slope rasters were therefore created for both the RGB and the multispectral image data, leading to two and five additional raster layers, respectively.

2.3.3. Principal Component Analysis

Additional raster layers were created by performing a principle component analysis (PCA, conducted via [56]) on the RGB image and the multispectral image. The number of principle components was set to two, since this delivered an acceptable explained cumulative variance (Online Resource 1 in Supplementary Materials).

2.3.4. CIELAB

The colour spaces CIELAB, CIE-Yxy, and Munsell are suited for the analysis of iron oxide content in soils and sediments [57,58]. The CIELAB colour space shows a clear benefit regarding quantitative analyses and was used throughout the presented study, since CIELAB coordinates are often influenced by soil and sediment properties: CIELAB lightness L* is often regarded to be related with organic matter, and CIELAB chromaticity coordinates a* and b* were proven to be related with different iron oxide concentrations (cf. [27,57,59]). While these relations are measurable, authors generally conclude that the specific relation is highly dependent on the material examined and often cannot be transferred between different soil types [27].
The recorded image data were therefore transformed into the CIELAB colour space using the convertColor() function for R. The CIE standard illuminant D65 was used as reference white, since its properties are close to real indirect daylight as present during fieldwork. The multispectral data were modified so that only the red, green, and blue bands were transformed. The produced raster layers were used as additional input for classification with the intent of adding a rough measurement of lightness and, more importantly, iron oxide content.

2.3.5. Soil Organic Carbon

Numerous studies have examined the prediction of soil organic carbon (SOC) via the spectral signal [17,18,19,20,60,61,62,63]. Most recent publications tend to stress the better accuracy of machine learning algorithms [13], especially when predicting more complex soil properties. For the prediction of SOC, however, linear regression models have proven to deliver robust predictions with acceptable accuracy. Since our study solely aims for the rough delineation of strata and our number of prediction variables is quite low, ordinary least squares (OLS) regression was chosen as a rather straightforward prediction model. As already pointed out by Bumgardner et al. [60], the overall reflectance in the visible part of the spectrum decreases when the organic matter content increases. For this reason, only the first four image bands of the multispectral image were used as input data for the prediction of SOC (450, 550, 680, and 720 nm). SOC measurement results were assigned to a set of training pixels, which were extracted from the image bands based on the respective sampling locations. Training pixels comprise all pixels of the digitised sample location. As the number of pixels is quite small due to the limited spatial resolution of the images, further processing of the pixel values via, for example, mean values of random subsets (as suggested for bigger data sets by, e.g., [63]) was not conducted. The fitted model was used for prediction of SOC based on all image pixels. Model fitting was performed with the stats package for R [45] and prediction using the raster package for R [55].

2.4. Cluster Analysis

Unsupervised classification of the processed data was conducted to semi-automatically delineate stratigraphical (sub)units from (i) the image data and their derivatives and (ii) multiple parameters of the sedimentological data. This type of classification does not require the definition of training areas and, thus, assumptions prior to the performance of the classification; it therefore excludes the researcher’s subjective perception [12]. The on-site delineation by local archaeological experts in combination with the results of the quantitative sedimentological analyses was used as a reference to discuss the quality of the results.

2.4.1. Sedimentological Data

Unsupervised classification of the sediment properties examined was used to verify stratigraphic delineation conducted during fieldwork. The most recent work of Schmidt et al. [43] shows that hierarchical clustering of element concentrations may be used to classify sediment data for stratigraphic delineation and interpretation. Building upon their work, we applied cluster analysis of Manhattan distances performed with Ward’s method (e.g., [64]). Additionally we examined the benefit of depth-constrained clustering [65] using CONISS [66]. The number of clusters/groups is based on the layers identified in Figure 2c: Four main layers (A, B, C, D) and two additional layers, representing the sediment parts within the stone layers. The total number of six clusters was increased to 10 clusters for depth-constrained clustering, now including transitional layers between the main layers. Both clustering approaches were conducted for (i) the pre-processed element concentrations (p-ED-XRF), the pre-processed spectra of the (ii) ground and (iii) unground sediment samples, and (iv) the median pixel values of the RGB and (v) multispectral images, extracted from the sampling locations.

2.4.2. Image Data

In past studies, k-means clustering was successfully applied for the analysis of soil data (e.g., [11,12,62]). In this study, clustering was carried out in the spectral domain using the k-means algorithm proposed by Hartigan and Wong [67]. Partitioning into clusters was performed using a random sample, consisting of 10% of the pixels of the respective raster stack [45,55] in order to reduce computational time. The maximum number of iterations allowed was set to 50, and three random sets were created as seed points. The resulting partition was used for prediction via the clue package for R [68].
Following Haburaj et al. [12], multiple combinations of the processed image data were used as input for the k-means clustering: All image derivatives created were combined with one another to assess the influence of each processing step regarding image noise and cluster quality. All combinations examined are presented in the supplemental material (Online Resource 1 in Supplementary Materials).
The number of clusters was set to 15, allowing the inclusion of potential disturbances and transitional layers in comparison to the six clusters of the sedimentological data. This rather high number of clusters leads to the necessity of subsequent manual grouping of the clusters with respect to the on-site stratigraphic documentation. This step was conducted in QGIS (v2.18). As argued by Haburaj et al. [12], manual grouping should be conducted attentively, as it allows for a more transparent documentation of the where and how of drawing borders between layers.
Evaluation of the image clustering results was carried out manually and by a visual interpretation of the homogeneity of the resulting clusters, as well as their conformity with the delineation of stratigraphic layers depicted in Figure 2 and Figure 5.

3. Results

3.1. Sedimentological Record

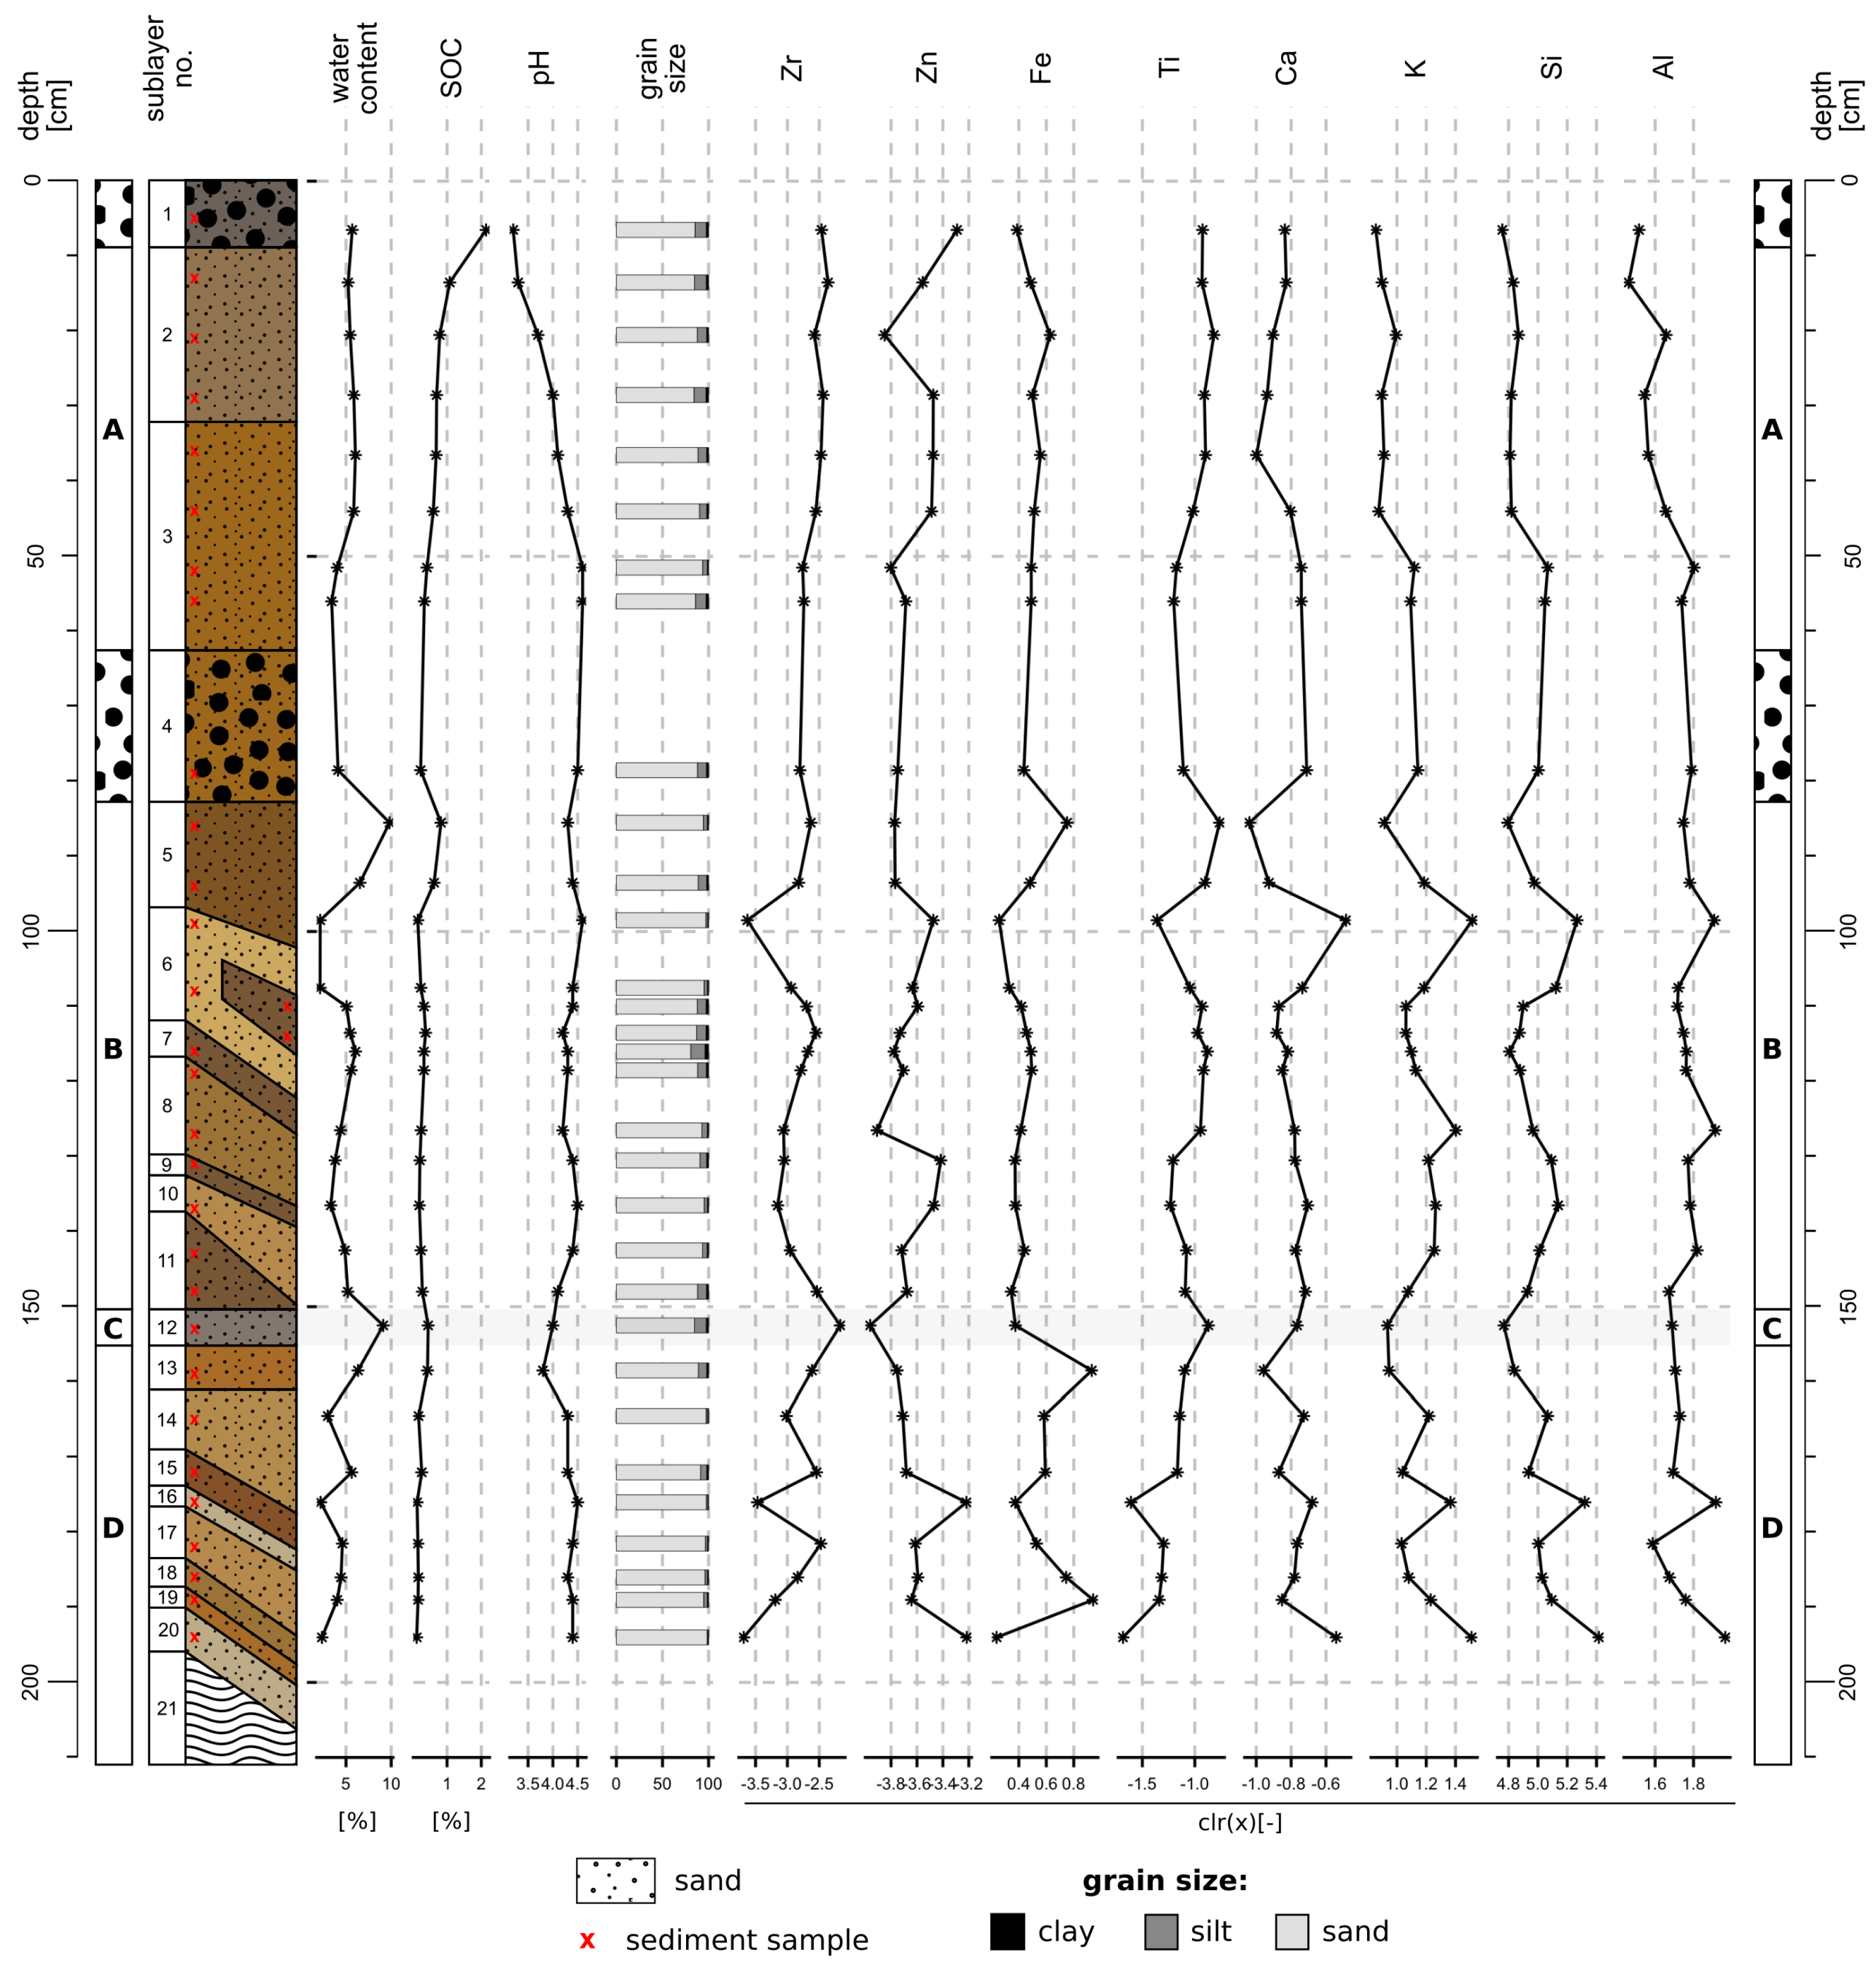
The measured sediment properties of the section examined allow a detailed description of the layers depicted in Figure 2. Layer A is characterised by a water content of c. 5%, an average SOC concentration of around 1%, acidic pH values (top A: < 3.5, basis A: 4.5), and high concentrations of silt compared to the other layers (Figure 5). At the top of layer B (sublayer 5), a peak of water content is visible (c. 10%). Layers B and D show strong variation between their individual sublayers, averaging at around 5% water content, acidic pH values between 3.5 and 4.5, and low SOC concentrations (<0.2%). The dark, thin horizontal layer C shows a peak in water content (c. 10%) and a slight increase of silty material and SOC content compared to the surrounding materials (Figure 5).
During pre-processing of the p-ED-XRF data, we excluded several elements due to their insignificance or erroneous measurements. The following eight elements showed valid measurements and were processed: Zr, Zn, Fe, Ti, Ca, K, Si, and Al. Concentrations of these elements are heterogeneous in the lower parts of the examined profile (layers B, C, D), while layer A repeatedly shows continuous trends of element concentrations from its top to its bottom (Figure 5).

3.2. Clustering Results—Sedimentological Data

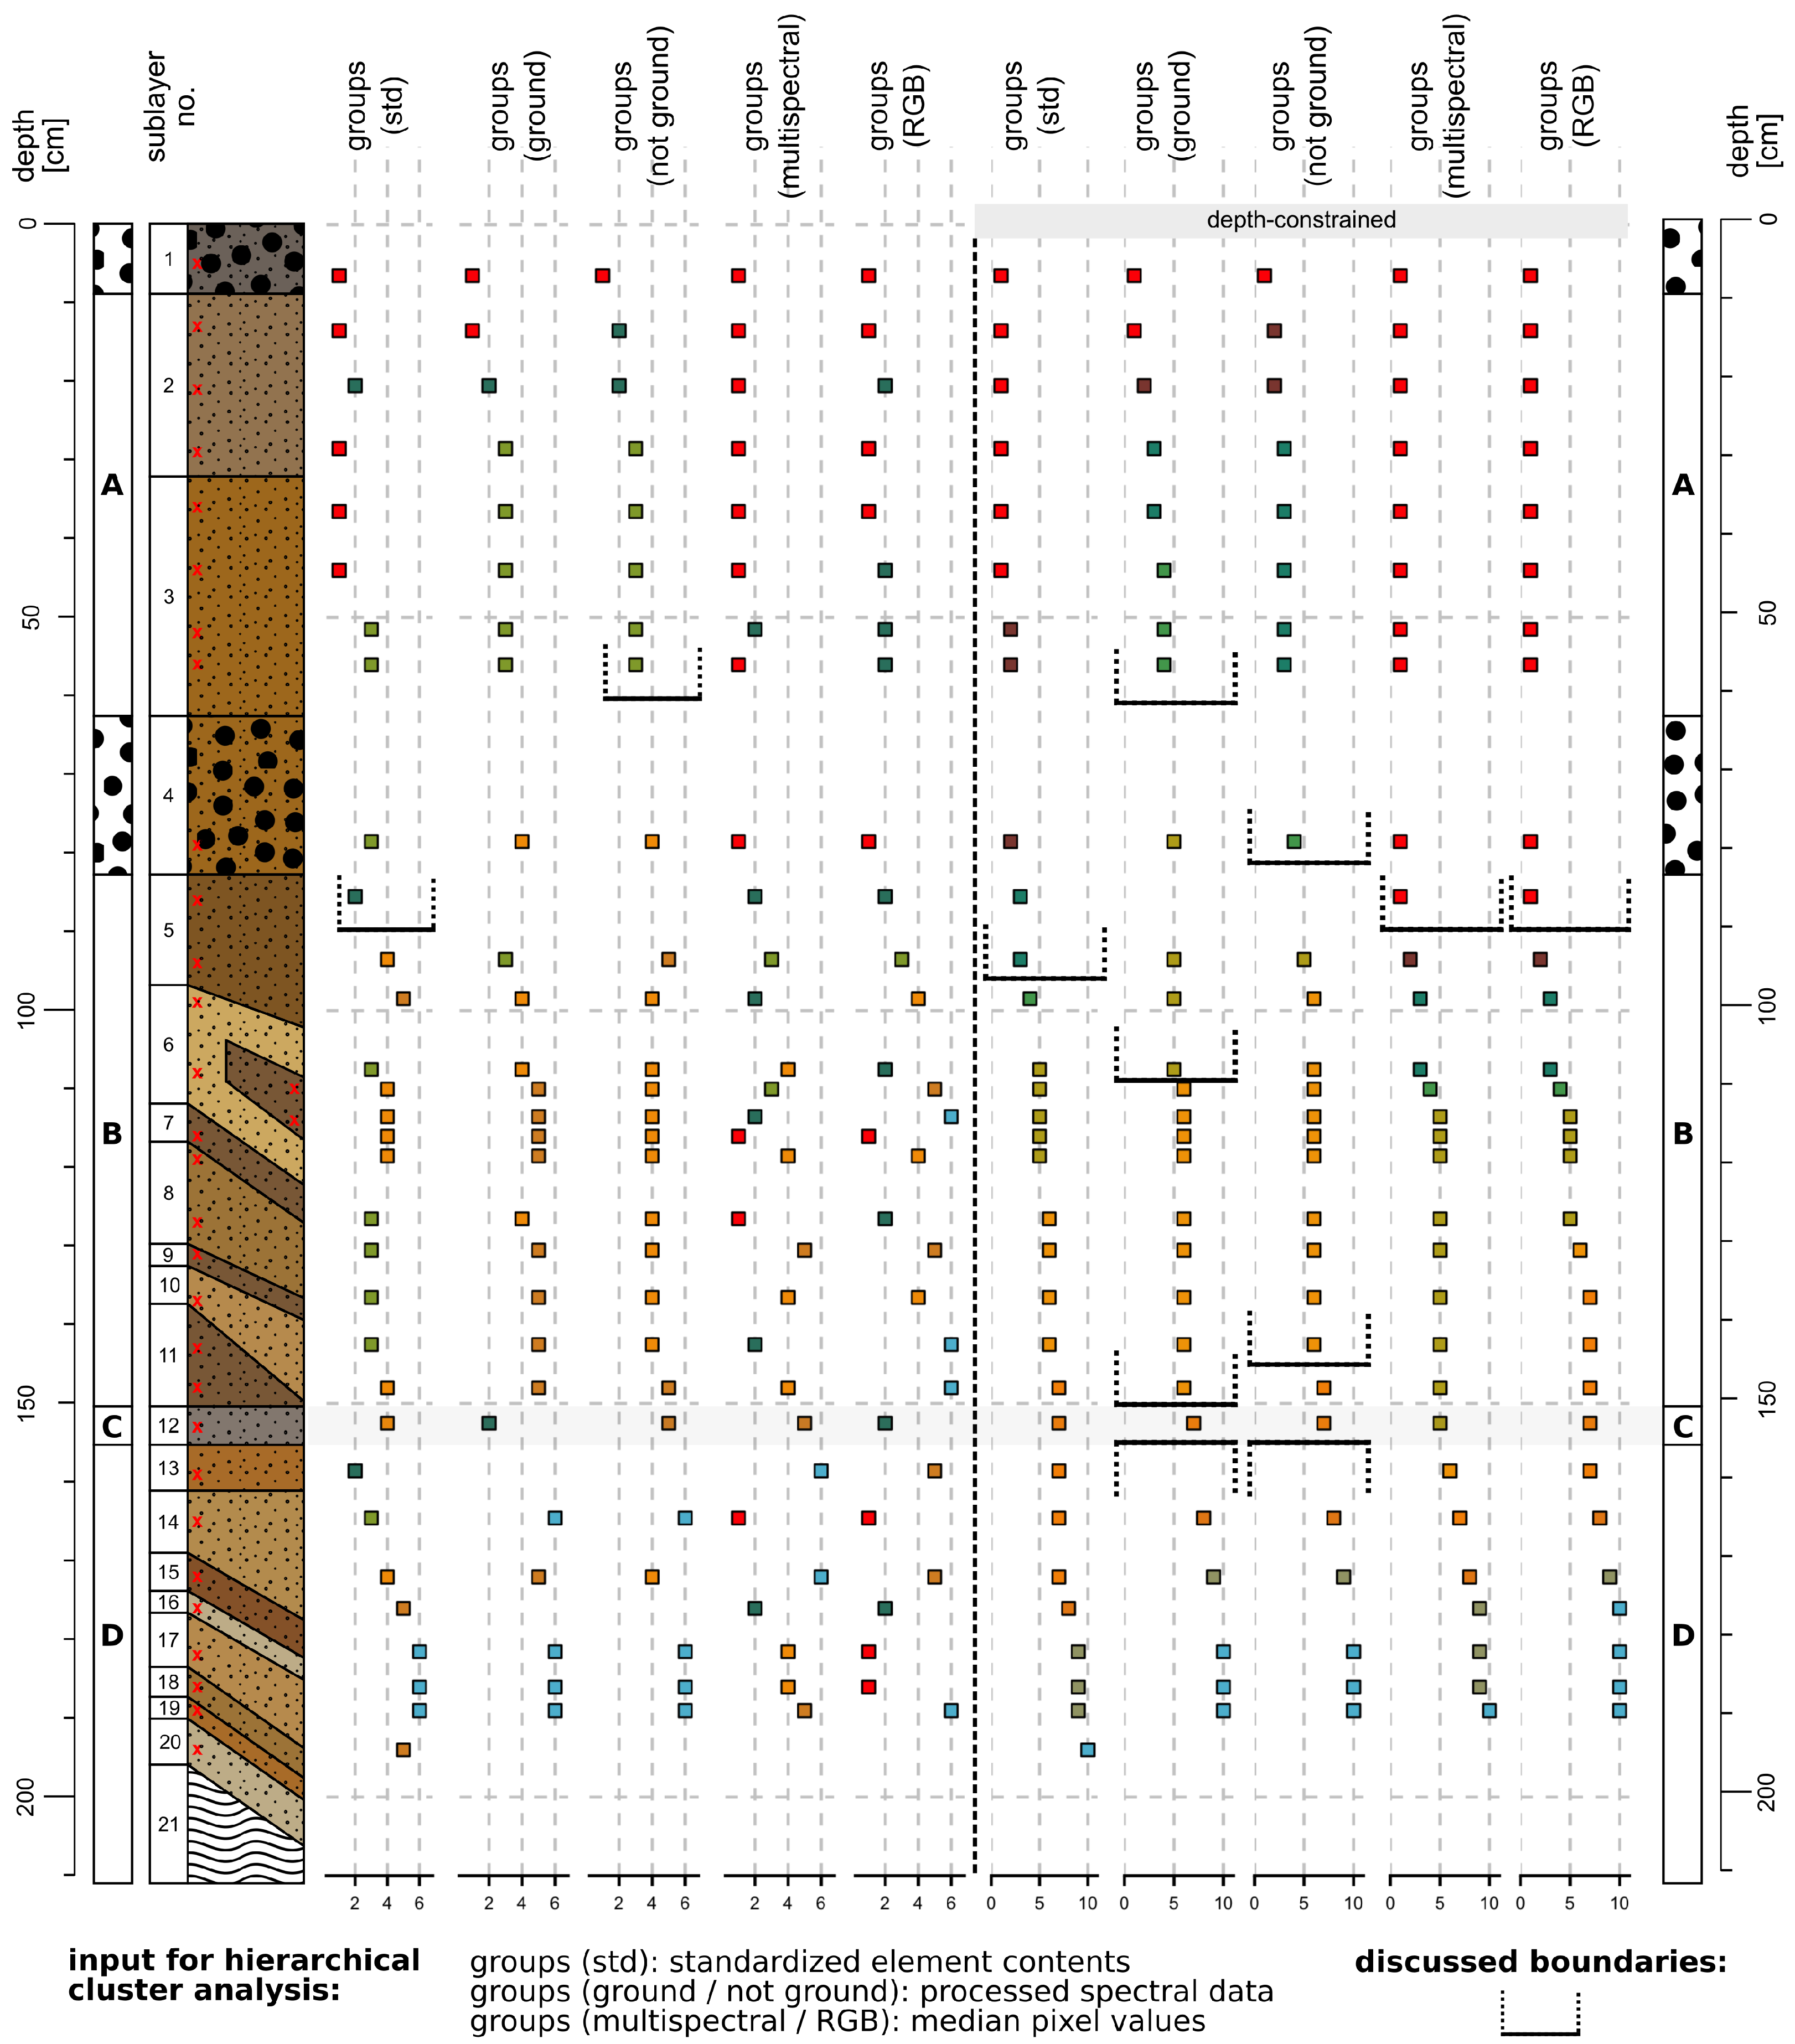
Clustering results (groups) of the p-ED-XRF data are documented in Figure 6. The groups produced by depth-constrained hierarchical cluster analysis of the transformed element concentrations capture the main stratigraphic layers of the profile and, together with the on-site delineation and the sedimentological record (Figure 5), serve as a reference for the quality of all clustering results: Groups 1 and 2 cover areas of dark material, which are characterised by high water contents and are situated in layer A and at the top of layer B (sublayer 5, see Figure 5 and Figure 6). Layer C is grouped together with the surrounding materials of layers B and D in the results of both clustering approaches.
Clustering of the pre-processed spectra of the samples showed a noteworthy influence of grinding. While layer C is grouped with the topmost layer in the ground data, it is grouped with the darker part of layer B when samples are not ground (Figure 6). Both ground and not ground samples clearly delineate data of layer A from the rest of the data in the clustering results. Layer C is assigned to a separate group in the ground data only. Compared to the results of the p-ED-XRF data, the groups produced on the basis of the spectral data are spatially more consistent. Depth-constrained clustering increases this consistency (Figure 6).
Groups produced by the clustering of both RGB and multispectral pixel data capture layer A homogeneously. Additionally, the hierarchical clustering assigns darker parts of layers B and D to groups 1 and 2. The clustering of the RGB data groups layers A and C, while the clustering of the multispectral data groups layer C with the darker parts of layer B. Both data sets assign the topmost part of layer B (sublayer 5, see Figure 6) to groups 1 and 2. Including depth-constrained clustering showed a positive effect on group homogeneity for both RGB and multispectral-based clustering results; layer A and sublayer 5 are captured as one single group. Both depth-constrained cluster approaches of the pixel data, however, do not capture layer C, but group it together with the surrounding materials of layers B and D.

3.3. Clustering Results—Image Data

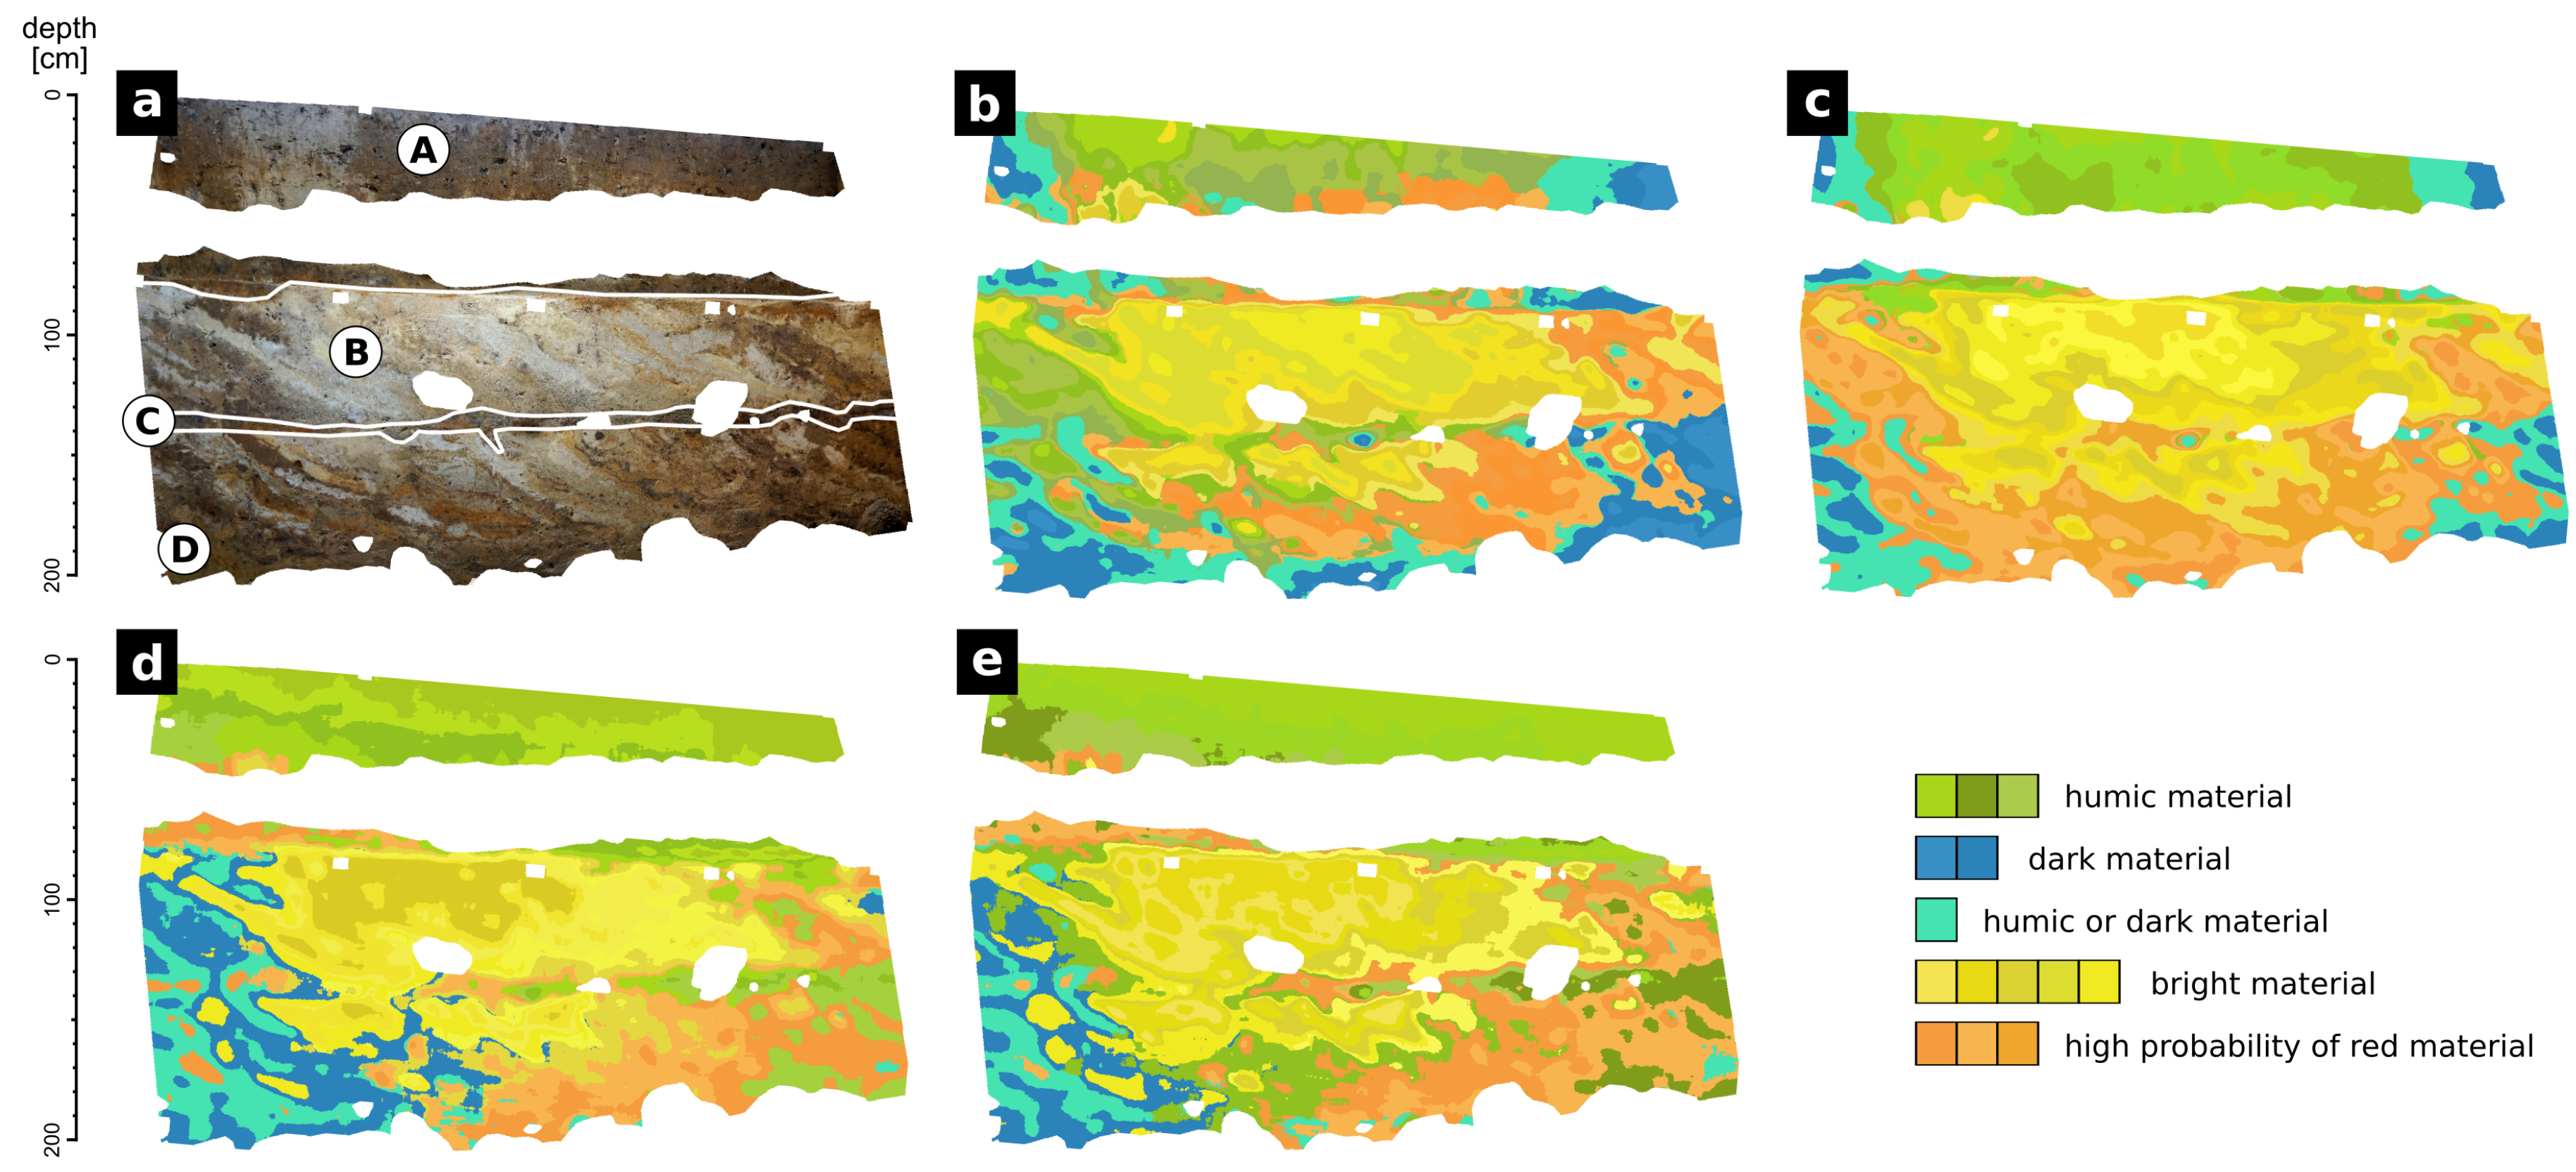
Multiple band combinations were tested as input for the performed image classification via k-means clustering. While all combinations have problems capturing the thin horizontal layer C, the results shown in Figure 7 indicate clear benefits when using specific bands: Using the RGB data, the most homogeneous classification results were derived from a combination of the raw RGB bands, two principle components, and two slope rasters (Figure 7b). The summarised groups produced by the cluster analysis roughly represent the stratigraphic (sub)layers. Clustering the same band combination of the multispectral data (Figure 7c) produced results of similar quality. Nevertheless, two major differences have to be pointed out: (1) Multispectral data succeed in separating layer A from the rest of the profile, and (2) RGB data capture layer C more precisely in the spatial domain. Layer C is grouped with materials from layer A in the results produced using RGB data, while the multispectral data clustering results group it together with parts of layers B and D (see Online Resource 1 (in Supplementary Materials) for all band combinations).

4. Discussion

4.1. Image Data

Our image classification results of the RGB data are consistent with the results of other studies (e.g., [11,12,28,70]). The combination of raw RGB bands, two principle components, and two slope rasters (as proposed by [12]) produced similar results to those of the equally processed multispectral bands. Furthermore, processing of the multispectral data improved the classification results significantly, allowing us to minimise the impact of lighting differences successfully.
Transformation to CIELAB coordinates did not deliver any benefit for the RGB data: Neither replacing the RGB bands with their CIELAB counterparts, nor using the image bands containing chromaticity coordinates a* and b* separately led to better clustering results (Online Resource 1 in Supplementary Materials). This is different for the multispectral data, as both the CIELAB data based on the multispectral data and SOC data show a significant influence on the clustering results (Figure 7d,e). A combination of slope bands and CIELAB bands eliminates the influence of slightly shadowed areas on the left and right sides of the profile. This leads to more homogeneous results, which is mostly visible in layer A and the righthand parts of layers B and D. As a consequence layer C is—while grouped with the material of layer A—captured more reliably than with the other multispectral band combinations. Another notable result is the similar performance of (i) the combination of slope bands with all CIELAB bands (Figure 7d) and (ii) the combination of slope bands with the CIELAB chromaticity bands a* and b* and the SOC raster (Figure 7e). Classification results are nearly identical, only showing small differences in the lower part of the profile.
We observed similarities between the clustering results of band combinations including the SOC raster and, alternatively, the CIELAB lightness raster. Nevertheless, the transferability of these results to other sites has to be examined critically and individuallyfor each case. The noticed relation between SOC and lightness rasters is already proposed by other authors (e.g., [27,59]), who examined this phenomenon in detail and concluded that the relation is highly dependent on the local circumstances. However, if quantitative examination of SOC as conducted by, e.g., Steffens et al. [62] cannot be included into the workflow due to technical or financial limitations, we propose CIE lightness to be a rough indicator of the spatial variance of SOC, while keeping in mind that water content also influences lightness significantly (e.g., [50,60]). Our results support the strong correlation of CIELAB image bands and SOC, as observed for high-contrast soil profiles, for example, by Zhang and Hartemink [28].
The initially proposed significance of CIELAB chromaticity coordinates for the examination of iron oxide concentrations could not be confirmed for our experimental design. The examination of iron oxides based on CIE a* and b* as proven by, e.g., Vodyanitskii and Kirillova [27] possibly requires a more sophisticated approach, including the mathematical prediction via, e.g., partial least squares regression or machine learning algorithms, as applied for other sediment properties by, e.g., Daniel et al. [71], Viscarra Rossel and Behrens [72], or Morellos et al. [73]. Other factors that could be responsible for the poor performance of our approach include the limited presence of iron in the profile examined: Elemental Fe concentration is below 1% (see Online Resource 2 in Supplementary Materials) throughout the examined samples. This would correspond to a maximum of c. 1.4% Fe 2 O 3 , given that all Fe would result from hematite. A future approach should consider a camera setup with fewer limitations regarding spectral range and resolution. Using a hyperspectral VIS-NIR device would allow the examination of Fe in far more detail [13,60,74]. This would also allow the analysis of further sediment properties, like grain size based on the spectral signal [50,75,76,77].
More generally speaking, our results support the usage of the CIELAB colour space as a standard for documentation during archaeological excavations. The observed good performance of the CIELAB datasets supports the scientific relevance of the CIELAB colour space, which was previously proposed by other authors [47,78]. For the last decades, this colour space gained popularity in the geosciences and, meanwhile, is widely used in numerous studies (cf. [14]). Many authors noted the clear advantages over the RGB or Munsell colour systems (e.g., [22,23,26]): CIELAB is a mathematically defined colour space that is free to use and suitable for quantitative analyses. In future studies, the proposed quantitative examination of colour differences throughout archaeological profiles by transformation to CIELAB could be complemented by additional colour difference formulas like CIEDE2000 to assess possible benefits [79].

4.2. Sedimentological Data

By quantitatively analysing sediment properties, we were able to explain several characteristics of the profile in detail. Clustering results suggest that the topmost parts of layer B (sublayer 5) are related to layer A or the intermediate stone layer. The observed high values of water content and SOC suggest sublayer 5 to be either related to construction work (compression by overlying stones) or resembling (together with the overlying stones) a prehistoric surface, which would have been of similar character to the topmost stone layer described by May [35]. Similarly to sublayer 5, the colour of layer C seems to be influenced mainly by a high water content. However, slightly increased SOC may also indicate a prehistoric surface here. The observed similarities also explain why layer C is often clustered with layer A or sublayer 5.
The performed hierarchical cluster analysis of the examined sediment properties produced similar results for the p-ED-XRF data and the recorded VIS-NIR data (Figure 5 and Figure 6). We see this as an indicator that selective or extensive spectroscopy should be considered a fast and efficient alternative to laboratory analyses when one is aiming for the delineation of layers or an objective confirmation of the observed variance in a profile. Spectroscopy in comparison to laboratory analyses is easy and fast to apply, non-destructive, cost-efficient in the long term, and also more environmentally friendly. While our study supports the idea of using spectroscopy during archaeological excavations due to the aforementioned benefits, the methodological approach should still be considered experimental—currently, clear limitations regarding the ease of use and the on-site applicability exist.
Throughout our study, depth-constrained clustering generally improved the results, which supports preferability of this method when clustering layers, as, e.g., Schmidt et al. [43] proposed. Depth-constrained clustering also improved clustering results of the sampled pixel values significantly (Figure 6) and—with the exception of layer C—captured overall variability of the profile. Layer C is generally treated similarly in the image data and the selective data, as it is either clustered with layer A or darker parts of layers B and D. It is also noteworthy that layer C was captured most accurately by the spectral data of ground sediment samples, which underlines the potential of VIS-NIR spectroscopy for stratigraphic analyses. In addition, both the selective pixel-based approach and the extensive image-based approach distinguish between layer A and the rest of the profile.

4.3. Shortcomings and Benefits of Spectral Measurements

Our study exposes that quantitative colour measurements during fieldwork can help with stratigraphic delineation and interpretation, be it based on selective or extensive data. Combining these measurements with semi-automated classification algorithms, we were able to increase objectivity and transparency of the delineation of stratigraphic (sub)layers in a similar manner to that if using common sedimentological data. In particular, depth-constrained hierarchical clustering should be considered a useful tool when analysing stratigraphic sequences quantitatively. Depending on the respective research question, future studies should consider the measurement of VIS-NIR spectral data as an alternative to other analytical methods, which are often time-consuming and destructive. For example, spectral measurements could offer a fast and quantitative way of documentation on rescue excavations.
We were able to successfully transfer the image analysis workflow proposed by Haburaj et al. [12] to the archaeological profile SD17P1 from the burial mound of Seddin. Moreover, we want to stress the significant improvements we could add to this process by adding CIELAB data and SOC information, both derived from the multispectral data. The observed similarities between the clustering results of band combinations, including the SOC raster and, alternatively, the CIE lightness raster, suggest that time-consuming and expensive SOC prediction can be replaced with a fast transformation of the image data to the CIELAB colour space. The noticed benefits should especially be kept in mind when one is working under heterogeneous fieldwork conditions, as CIELAB and slope rasters clearly help to overcome uneven lighting conditions. If intra- or inter-site comparability of the colour and spectral measurements is required, image acquisition should include distinct colour calibration [80,81].
The output of the conducted comparisons suggests that the selective spectral information measured from sediment samples produces similar clustering results to those of the p-ED-XRF data. Increasing the spectral range and resolution of the image data would therefore clearly improve the identification of (sub)layers based on image data. This is consistent with the results of laboratory analyses of, e.g., Steffens et al. [62] or Hobley et al. [63].
Taking the characteristics of the examined profile into account, we consider its stratigraphy complex: While it consists only of a few major layers, the overall heterogeneity of the profile is quite high. This complexity renders sediment sampling rather complicated, as one has to decide which and how many samples to take. At this point, analyses based on image data could fill a gap. This would, however, require a device that offers an improved spectral range and quality. Spectral imaging devices are still in a crucial phase of development though. Imaging technology becomes more sophisticated: Systems become smaller and are more easy to use, as recent studies suggest, using either snapshot (e.g., [12,82]) or push broom (e.g., [83]) technology. However, the offered devices are still often limited to wavelengths below 1000 nm (cf. [84]), rendering the examination of many sediment properties problematic. Established hyperspectral scanners that capture wavelengths beyond 1000 nm are most often expensive and difficult to use under fieldwork conditions due to their dimensions, weight, and power consumption. While the limited capabilities of the presented spectral imaging devices render the extensive analysis of sediment data not yet applicable for most excavations, selective spectral measurements as performed in this study may constitute an easy-to-apply additional step towards a more transparent way of field documentation during archaeological excavations.
Keeping in mind the complex stratigraphy of the profile at hand, applicability of the proposed approach to profiles and plana that include more distinct stratigraphic features (e.g., post-holes, pits, trenches) appears likely. The good performance of RGB image analysis for the examination of high-contrast soil and sediment data was lately described by Haburaj et al. [12] and Zhang and Hartemink [28], indicating a high potential of image classification for archaeological excavations in general. Our results of the selectively measured colour and spectral data indicate that hyperspectral measurements (as we measured with a spectroradiometer) could offer supportive information when analysing more complex or low-contrast stratigraphies (e.g., paleosols).
The sedimentological record obtained in the laboratory is still necessary to describe and interpret the layers. However, the good clustering results of the image data and the general performance of the selective spectral data stresses the potential of more advanced spectral image sensors for future stratigraphic studies. By extrapolating sediment properties from samples to image data, one could combine the benefits of both worlds: A sedimentological record that is not limited to selected sediment samples. While several laboratory studies were already able to produce extensive parameter maps (e.g., [62]), transferability of this approach to on-site recordings still has to be examined.
Based on our results, future studies should either focus on the optimisation of an RGB-camera-based workflow or the in-depth review of more potent spectral sensors. While RGB images delineate layers in the presented study, our results show that image data that would involve spectral information of the same quality as our selective VIS-NIR measurements could prove to be as suitable for assisting stratigraphic delineation and interpretation as labour-intensive laboratory analyses.

5. Conclusions

The presented results indicate that quantitative colour measurements and spectral measurements during fieldwork can support stratigraphic delineation and interpretation of profiles in archaeological excavations. Depth-constrained hierarchical clustering of spectral data as well as of p-ED-XRF data should be considered a useful tool when analysing stratigraphic sequences quantitatively.
The discussed benefits of the multispectral image data suggest a huge potential of the spectral domain for automating stratigraphic delineation and interpretation and, likewise, render this process more traceable. Observed drawbacks show that we cannot offer a ready-to-use approach yet. In particular, the limited capabilities of the presented spectral imaging devices render the extensive analysis of sediment data not yet applicable for most excavations. Rather, additional on-site studies should be carried out to create standardised workflows. Image data that would involve spectral information of the same quality as our selective VIS-NIR measurements could prove to be as suitable for assisting stratigraphic interpretation as labour-intensive laboratory analyses. Quantitative colour measurements and spectral measurements, as performed in this study, may constitute an easy-to-apply, non-destructive additional step towards a fast and more traceable way of field documentation during archaeological excavations.

Supplementary Materials

The following are available online at https://www.mdpi.com/2571-9408/3/2/31/s1. Online Resource 1 includes the image data used throughout this study along with the R-scripts that were used for image analyses. Online Resource 2 covers the elemental concentrations of the sediment samples retrieved from a p-ED-XRF, as well as documentation of the processing workflow of these data. Online Resource 3 comprises the VIS-NIR spectra of all sediment samples, recorded with a spectroradiometer (350–2500 nm). Additionally, the documentation of the pre-processing workflow is included.

Author Contributions

Concept and methodology devised by V.H. and B.S.; laboratory work and validation by V.H., P.H., M.N., B.S., and J.M.; formal analysis and software by V.H.; original draft of the manuscript prepared by V.H.; review and editing by B.S., M.N., P.H., J.M., and V.H.; supervision by B.S. All authors have read and agreed to the published version of the manuscript.

Funding

This research was funded by the Cluster of Excellence EXC264 Topoi (The Formation and Transformation of Space and Knowledge in Ancient Civilizations, Research Area A; Deutsche Forschungsgemeinschaft (DFG) project number 39235742.

Acknowledgments

We thank the Cluster of Excellence EXC264 Topoi (The Formation and Transformation of Space and Knowledge in Ancient Civilizations, Research Area A) for funding this research. The publication of this article was funded by Freie Universität Berlin. Additional thanks is expressed to the Geography Department of the Humboldt-Universität zu Berlin for the possibility to use their spectroradiometer. Furthermore, we would like to thank Fabian Becker, Sebastian van der Linden, Jacob Hardt, and Jan Krause for their support. We thank the four anonymous reviewers for their detailed and valuable reviews, which helped to improve the manuscript substantially.

Conflicts of Interest

The authors declare no conflict of interest.

Abbreviations

The following abbreviations are used in this manuscript:
VIS-NIRvisible and near-infrared
SOCsoil organic carbon
p-ED-XRFportable energy-dispersive X-ray fluorescence spectrometer
CRMcertified reference material
SNVstandard normal variate
clrcentred log ratio
TPSthin plate spline
FWHMfull width half maximum
PCAprinciple component analysis

References

  1. Harris, E.C. Principles of Archaeological Stratigraphy; Academic Press: London, UK, 1979. [Google Scholar]
  2. Vincent, M.L.; Kuester, F.; Levy, T.E. Opendig: Contextualizing the past from the field to the web. Mediterr. Archaeol. Archaeom. 2014, 14, 109–116. [Google Scholar]
  3. Simonson, R.W. Soil Color Standards and Terms for Field Use—History of Their Development. Soil Color 1993, 31, 1–20. [Google Scholar] [CrossRef]
  4. Landa, E.R.; Fairchild, M.D. Charting Color from the Eye of the Beholder. Am. Sci. 2005, 93, 436–443. [Google Scholar] [CrossRef]
  5. Hassan, F.A. Sediments in Archaeology: Methods and Implications for Palaeoenvironmental and Cultural Analysis. J. Field Archaeol. 1978, 5, 197–213. [Google Scholar] [CrossRef]
  6. Goldberg, P.; Holliday, V.T.; Ferring, C.R. Earth Sciences and Archaeology; Springer Science & Business Media: New York, NY, USA, 2013. [Google Scholar]
  7. Hoelzmann, P.; Klein, T.; Kutz, F.; Schütt, B. A new device to mount portable energy-dispersive X-ray fluorescence spectrometers (p-ED-XRF) for semi-continuous analyses of split (sediment) cores and solid samples. Geosci. Instrum. Methods Data Syst. 2017, 6, 93. [Google Scholar] [CrossRef] [Green Version]
  8. French, C. Geoarchaeology in Action: Studies in Soil Micromorphology and Landscape Evolution; Routledge: London, UK, 2003. [Google Scholar]
  9. Kooistra, M.J.; Kooistra, L.I. Integrated research in archaeology using soil micromorphology and palynology. CATENA 2003, 54, 603–617. [Google Scholar] [CrossRef]
  10. Meister, J.; Krause, J.; Müller-Neuhof, B.; Portillo, M.; Reimann, T.; Schütt, B. Desert agricultural systems at EBA Jawa (Jordan): Integrating archaeological and paleoenvironmental records. Quat. Int. 2017, 434, 33–50. [Google Scholar] [CrossRef]
  11. Zhang, Y.; Hartemink, A.E. A method for automated soil horizon delineation using digital images. Geoderma 2019, 343, 97–115. [Google Scholar] [CrossRef]
  12. Haburaj, V.; Krause, J.; Pless, S.; Waske, B.; Schütt, B. Evaluating the Potential of Semi-Automated Image Analysis for Delimiting Soil and Sediment Layers. J. Field Archaeol. 2019, 44. [Google Scholar] [CrossRef]
  13. Stenberg, B.; Viscarra Rossel, R.A. Diffuse Reflectance Spectroscopy for High-Resolution Soil Sensing. In Proximal Soil Sensing; Viscarra Rossel, R.A., McBratney, A.B., Minasny, B., Eds.; Progress in Soil Science; Springer: Dordrecht, The Netherlands, 2010; pp. 29–47. [Google Scholar] [CrossRef]
  14. Debret, M.; Sebag, D.; Desmet, M.; Balsam, W.; Copard, Y.; Mourier, B.; Susperrigui, A.S.; Arnaud, F.; Bentaleb, I.; Chapron, E.; et al. Spectrocolorimetric interpretation of sedimentary dynamics: The new “Q7/4 diagram”. Earth-Sci. Rev. 2011, 109, 1–19. [Google Scholar] [CrossRef] [Green Version]
  15. Zeeden, C.; Krauß, L.; Kels, H.; Lehmkuhl, F. Digital image analysis of outcropping sediments: Comparison to photospectrometric data from Quaternary loess deposits at Şanoviţa (Romania) and Achenheim (France). Quat. Int. 2017, 429, 100–107. [Google Scholar] [CrossRef]
  16. Udelhoven, T.; Emmerling, C.; Jarmer, T. Quantitative analysis of soil chemical properties with diffuse reflectance spectrometry and partial least-square regression: A feasibility study. Plant Soil 2003, 251, 319–329. [Google Scholar] [CrossRef]
  17. Mutuo, P.K.; Shepherd, K.D.; Albrecht, A.; Cadisch, G. Prediction of carbon mineralization rates from different soil physical fractions using diffuse reflectance spectroscopy. Soil Biol. Biochem. 2006, 38, 1658–1664. [Google Scholar] [CrossRef]
  18. Brown, D.J.; Shepherd, K.D.; Walsh, M.G.; Dewayne Mays, M.; Reinsch, T.G. Global soil characterization with VNIR diffuse reflectance spectroscopy. Geoderma 2006, 132, 273–290. [Google Scholar] [CrossRef]
  19. Sankey, J.B.; Brown, D.J.; Bernard, M.L.; Lawrence, R.L. Comparing local vs. global visible and near-infrared (VisNIR) diffuse reflectance spectroscopy (DRS) calibrations for the prediction of soil clay, organic C and inorganic C. Geoderma 2008, 148, 149–158. [Google Scholar] [CrossRef] [Green Version]
  20. Volkan Bilgili, A.; van Es, H.M.; Akbas, F.; Durak, A.; Hively, W.D. Visible-near infrared reflectance spectroscopy for assessment of soil properties in a semi-arid area of Turkey. J. Arid Environ. 2010, 74, 229–238. [Google Scholar] [CrossRef]
  21. Soriano-Disla, J.M.; Janik, L.J.; Viscarra Rossel, R.A.; Macdonald, L.M.; McLaughlin, M.J. The Performance of Visible, Near-, and Mid-Infrared Reflectance Spectroscopy for Prediction of Soil Physical, Chemical, and Biological Properties. Appl. Spectrosc. Rev. 2014, 49, 139–186. [Google Scholar] [CrossRef]
  22. Melville, M.D.; Atkinson, G. Soil colour: Its measurement and its designation in models of uniform colour space. J. Soil Sci. 1985, 36, 495–512. [Google Scholar] [CrossRef]
  23. Viscarra Rossel, R.A.; Walvoort, D.J.J.; McBratney, A.B.; Janik, L.J.; Skjemstad, J.O. Visible, near infrared, mid infrared or combined diffuse reflectance spectroscopy for simultaneous assessment of various soil properties. Geoderma 2006, 131, 59–75. [Google Scholar] [CrossRef]
  24. Jarmer, T.; Lavée, H.; Hill, P.S.J. Using Reflectance Spectroscopy and Landsat Data to Assess Soil Inorganic Carbon in the Judean Desert (Israel). In Recent Advances in Remote Sensing and Geoinformation Processing for Land Degradation Assessment; Röder, A., Hill, J., Eds.; CRC Press: London, UK, 2009; pp. 227–243. [Google Scholar] [CrossRef]
  25. Hill, J.; Udelhoven, T.; Vohland, M.; Stevens, A. The Use of Laboratory Spectroscopy and Optical Remote Sensing for Estimating Soil Properties. In Precision Crop Protection—The Challenge and Use of Heterogeneity; Oerke, E.C., Gerhards, R., Menz, G., Sikora, R.A., Eds.; Springer: Dordrecht, The Netherlands, 2010; pp. 67–85. [Google Scholar] [CrossRef]
  26. Sprafke, T. Löss in Niederösterreich—Archiv Quartärer Klima- und Landschaftsveränderungen; Würzburg University Press: Würzburg, Germany, 2016. [Google Scholar]
  27. Vodyanitskii, Y.N.; Kirillova, N.P. Application of the CIE-L*a*b* system to characterize soil color. Eurasian Soil Sci. 2016, 49, 1259–1268. [Google Scholar] [CrossRef]
  28. Zhang, Y.; Hartemink, A.E. Digital mapping of a soil profile. Eur. J. Soil Sci. 2019, 70, 27–41. [Google Scholar] [CrossRef] [Green Version]
  29. Kiekebusch, A. Das Königsgrab von Seddin. In Führer zur Urgeschichte; Number 1; Dt. Buchvertr. Ges.: Augsburg, Germany, 1928. [Google Scholar]
  30. May, J. Der Fundplatz und die Umgebung des Grabhügels von Seddin als ortsfestes Bodendenkmal. In Jürgen Kunow (Hrsg.), Das »Königsgrab« von Seddin in der Prignitz. Kolloquium Anlässlich des 100. Jahrestages Seiner Freilegung am 12. Oktober 1999; Number 9 in Arbeitsberichte zur Bodendenkmalpflege in Brandenburg; Brandenburgisches Landesamt für Denkmalpflege und Archoläogisches Landesmuseum: Zossen, Germany, 2003; pp. 7–11. [Google Scholar]
  31. May, J.; Hauptmann, T. Das» Königsgrab «von Seddin und sein engeres Umfeld im Spiegel neuer Feldforschungen. In Gräberlandschaften der Bronzezeit. Internationales Kolloquium zur Bronzezeit; Bérenger, D., Bourgeois, J., Talon, M., St. Wirth (Hrsg.), Eds.; Number 51 in Bodenaltertümer Westfalens; LWL-Archäologie in Westfalen und Altertumskommission für Westfalen: Darmstadt, Germany, 2012. [Google Scholar]
  32. Wüstemann, H. Zur Sozialstruktur im Seddiner Kulturgebiet. Zeitschrift für Archäologie 1974, 8, 67–107. [Google Scholar]
  33. May, J. Neue Forschung am ’Königsgrab’ von Seddin. In Der Grabhügel von Seddin im Norddeutschen und Südskandinavischen Kontext; Hansen, S., Schopper, F., Eds.; Number 33 in Arbeitsberichte zur Bodendenkmalpflege in Brandenburg; Brandenburgisches Landesamt für Denkmalpflege und Archäologisches Landesmuseum: Zossen, Germany, 2018. [Google Scholar]
  34. Schenk, T.; Goldmann, T.; Kultfeuerreihe, D.S. Geomagnetische Prospektion am Königsgrab in der Prignitz. Arch. Berl. Brandenbg. 2003, 57–59. [Google Scholar]
  35. May, J. Fokussieren, Positionieren, Schritthalten. Aspekte von Raum und Zeit am ’Königsgrab’ von Seddin in der Prignitz. In Das Ganze Ist Mehr als die Summe Seiner Teile. Festschrift für Jürgen Kunow; Number 27 in Materialien zur Bodendenkmalpflege im Rheinland; LVR-Amt für Bodendenkmalpflege im Rheinland: Bonn, Germany, 2018. [Google Scholar]
  36. Landesamt für Bergbau, G.U.R. Geologische Karte 1:25.000 (GK25) des Landes Brandenburg, Blatt Baek (2837). 1905. Available online: https://lbgr.brandenburg.de/sixcms/detail.php/622447 (accessed on 15 June 2020).
  37. Götze, A. Die vor- und frühgeschichtlichen Denkmäler des Kreises Westprignitz. Kunstdenkmäler der Prov. Brandenbg. 1912, 1, 1–54. [Google Scholar]
  38. Brunke, H.; Bukowiecki, E.; Cancik-Kirschbaum, E.; Eichmann, R.; Ess, M.V.; Gass, A.; Gussone, M.; Hageneuer, S.; Hansen, S.; Kogge, W.; et al. Thinking Big. Research in Monumental Constructions in Antiquity. Space Knowl. 2016, 250–305. [Google Scholar] [CrossRef]
  39. Company, M.C. Munsell Soil Color Charts, Revised Edition; Munsell Color: Baltimore, Germany, 1994. [Google Scholar]
  40. Ad-hoc-Arbeitsgruppe Boden. Bodenkundliche Kartieranleitung (KA5), 5th ed.; Schweizerbart: Hannover, Germany, 2005. [Google Scholar]
  41. Blume, H.P.; Stahr, K.; Leinweber, P. Bodenkundliches Praktikum: Eine Einführung in Pedologisches Arbeiten für Ökologen, Land- und Forstwirte, Geo- und Umweltwissenschaftler; Springer: Heidelberg, Germany, 2011. [Google Scholar]
  42. Vogel, S.; Märker, M.; Rellini, I.; Hoelzmann, P.; Wulf, S.; Robinson, M.; Steinhübel, L.; Di Maio, G.; Imperatore, C.; Kastenmeier, P.; et al. From a stratigraphic sequence to a landscape evolution model: Late Pleistocene and Holocene volcanism, soil formation and land use in the shade of Mount Vesuvius (Italy). Quat. Int. 2016, 394, 155–179. [Google Scholar] [CrossRef]
  43. Schmidt, M.; Leipe, C.; Becker, F.; Goslar, T.; Hoelzmann, P.; Mingram, J.; Müller, S.; Tjallingii, R.; Wagner, M.; Tarasov, P.E. A multi-proxy palaeolimnological record of the last 16,600 years from coastal Lake Kushu in northern Japan. Palaeogeogr. Palaeoclimatol. Palaeoecol. 2019, 514, 613–626. [Google Scholar] [CrossRef]
  44. Aitchison, J. The Statistical Analysis of Compositional Data; Monographs on Statistics and Applied Probability; Chapman & Hall Ltd.: London, UK, 1986. [Google Scholar]
  45. R Core Team. R: A Language and Environment for Statistical Computing; R Foundation for Statistical Computing: Vienna, Austria, 2018. [Google Scholar]
  46. Boogaart, K.G.V.; Tolosana-Delgado, R.; Bren, M. Compositions: Compositional Data Analysis. 2018. Available online: https://cran.r-project.org/package=compositions (accessed on 15 June 2020).
  47. Sánchez-Marañón, M.; Delgado, G.; Delgado, R.; Pérez, M.M.; Melgosa, M. Spectroradiometric and visual color measurements of disturbed and undisturbed soil samples. Soil Sci. 1995, 160, 291–303. [Google Scholar] [CrossRef]
  48. Savitzky, A.; Golay, M.J.E. Smoothing and Differentiation of Data by Simplified Least Squares Procedures. Anal. Chem. 1964, 36, 1627–1639. [Google Scholar] [CrossRef]
  49. Lehnert, L.W.; Meyer, H.; Bendix, J. HSDAR: Manage, Analyse and Simulate Hyperspectral Data in R; 2017; Available online: https://cran.r-project.org/package=hsdar (accessed on 15 June 2020).
  50. Stenberg, B.; Viscarra Rossel, R.A.; Mouazen, A.M.; Wetterlind, J. Visible and Near Infrared Spectroscopy in Soil Science. In Advances in Agronomy; Sparks, D.L., Ed.; Academic Press: Burlington, MA, USA, 2010; Volume 107, pp. 163–215. [Google Scholar] [CrossRef] [Green Version]
  51. Owen, A.J. Uses of derivative spectroscopy. Agil. Technol. 1995, 8. [Google Scholar]
  52. Barnes, R.J.; Dhanoa, M.S.; Lister, S.J. Standard Normal Variate Transformation and De-trending of Near-Infrared Diffuse Reflectance Spectra. Appl. Spectrosc. 1989, 43, 772–777. [Google Scholar] [CrossRef]
  53. Retzlaff, R. On the Potential of Small UAS for Multispectral Remote Sensing in Large-Scale Agricultural and Archaeological Applications. Ph.D. Thesis, Universität Trier, Trier, Germany, 2015. [Google Scholar]
  54. Duchon, J. Splines minimizing rotation-invariant semi-norms in Sobolev spaces. In Constructive Theory of Functions of Several Variables; Lecture Notes in Mathematics; Springer: Berlin/Heidelberg, Germany, 1977; pp. 85–100. [Google Scholar] [CrossRef]
  55. Hijmans, R.J. Raster: Geographic Data Analysis and Modeling. 2019. Available online: https://cran.r-project.org/package=raster (accessed on 15 June 2020).
  56. Leutner, B.; Horning, N. RStoolbox: Tools for Remote Sensing Data Analysis. 2017. Available online: https://cran.r-project.org/package=RStoolbox (accessed on 15 June 2020).
  57. Jarmer, T.; Schütt, B. Analysis of iron contents in carbonate bedrock by spectroradiometric detection based on experimentally designed substrates. In 1st EARSeL Workshop on Imaging Spectroscopy; Remote Sensing Laboratories, University of Zurich: Zurich, Switzerland, 1998; pp. 375–382. [Google Scholar]
  58. Schwertmann, U.; Cornell, R.M. Iron Oxides in the Laboratory: Preparation and Characterization; John Wiley & Sons: Weinheim, Germany, 2008. [Google Scholar]
  59. Barron, V.; Torrent, J. Use of the Kubelka—Munk theory to study the influence of iron oxides on soil colour. J. Soil Sci. 1986, 37, 499–510. [Google Scholar] [CrossRef]
  60. Baumgardner, M.; Silva, L.; Biehl, L.; Stoner, E. Reflectance properties of soils. Adv. Agron. 1985, 38, 1–44. [Google Scholar]
  61. Hill, J.; Schütt, B. Mapping Complex Patterns of Erosion and Stability in Dry Mediterranean Ecosystems. Remote Sens. Environ. 2000, 74, 557–569. [Google Scholar] [CrossRef]
  62. Steffens, M.; Kohlpaintner, M.; Buddenbaum, H. Fine spatial resolution mapping of soil organic matter quality in a Histosol profile. Eur. J. Soil Sci. 2014, 65, 827–839. [Google Scholar] [CrossRef]
  63. Hobley, E.; Steffens, M.; Bauke, S.; Kögel-Knabner, I. Hotspots of soil organic carbon storage revealed by laboratory hyperspectral imaging. Sci. Rep. 2018, 8. [Google Scholar] [CrossRef]
  64. Strauss, T.; Maltitz, M.J.v. Generalising Ward’s Method for Use with Manhattan Distances. PLoS ONE 2017, 12, e0168288. [Google Scholar] [CrossRef] [Green Version]
  65. Gill, D.; Shomrony, A.; Fligelman, H. Numerical Zonation of Log Suites and Logfacies Recognition by Multivariate Clustering. AAPG Bull. 1993, 77, 1781–1791. [Google Scholar]
  66. Grimm, E.C. CONISS: A FORTRAN 77 program for stratigraphically constrained cluster analysis by the method of incremental sum of squares. Comput. Geosci. 1987, 13, 13–35. [Google Scholar] [CrossRef]
  67. Hartigan, J.A.; Wong, M.A. Algorithm AS 136: A k-means clustering algorithm. J. R. Stat. Soc. Ser. C (Appl. Stat.) 1979, 28, 100–108. [Google Scholar] [CrossRef]
  68. Hornik, K. A CLUE for CLUster Ensembles. J. Stat. Softw. 2005, 14. [Google Scholar] [CrossRef]
  69. Schoeneberger, P.; Wysocki, D.; Benham, E.; Staff, S.S. Field Book for Describing and Sampling Soils; Version 3.0.; Natural Resources Conservation Service, National Soil Survey Center: Lincoln, NE, USA, 2012.
  70. Zhang, Y.; Hartemink, A.E. Soil horizon delineation using vis-NIR and pXRF data. Catena 2019, 180, 298–308. [Google Scholar] [CrossRef]
  71. Daniel, K.W.; Tripathi, N.K.; Honda, K. Artificial neural network analysis of laboratory and in situ spectra for the estimation of macronutrients in soils of Lop Buri (Thailand). Soil Res. 2003, 41, 47–59. [Google Scholar] [CrossRef]
  72. Viscarra Rossel, R.A.; Behrens, T. Using data mining to model and interpret soil diffuse reflectance spectra. Geoderma 2010, 158, 46–54. [Google Scholar] [CrossRef]
  73. Morellos, A.; Pantazi, X.E.; Moshou, D.; Alexandridis, T.; Whetton, R.; Tziotzios, G.; Wiebensohn, J.; Bill, R.; Mouazen, A.M. Machine learning based prediction of soil total nitrogen, organic carbon and moisture content by using VIS-NIR spectroscopy. Biosyst. Eng. 2016, 152, 104–116. [Google Scholar] [CrossRef] [Green Version]
  74. Viscarra Rossel, R.A.; Cattle, S.R.; Ortega, A.; Fouad, Y. In situ measurements of soil colour, mineral composition and clay content by vis–NIR spectroscopy. Geoderma 2009, 150, 253–266. [Google Scholar] [CrossRef]
  75. Post, J.L.; Noble, P.N. The Near-Infrared Combination Band Frequencies of Dioctahedral Smectites, Micas, and Illites. Clays Clay Miner. 1993, 41, 639–644. [Google Scholar] [CrossRef]
  76. Bishop, J.L.; Pieters, C.M.; Edwards, J.O. Infrared Spectroscopic Analyses on the Nature of Water in Montmorillonite. Clays Clay Miner. 1994, 42, 702–716. [Google Scholar] [CrossRef]
  77. Madejova, J.; Komadel, P. Baseline studies of the clay minerals society source clays: Infrared methods. Clays Clay Miner. 2001, 49, 410–432. [Google Scholar] [CrossRef]
  78. Fairchild, M. Color Appearance Models; John Wiley & Sons: Chichester, UK, 2013. [Google Scholar]
  79. Liu, H.; Huang, M.; Cui, G.; Luo, M.; Melgosa, M. Color-difference evaluation for digital images using a categorical judgment method. J. Opt. Soc. Am. A 2013, 30, 616–626. [Google Scholar] [CrossRef]
  80. Sánchez-Marañón, M.; García, P.; Huertas, R.; Hernández-Andrés, J.; Melgosa, M. Influence of Natural Daylight on Soil Color Description: Assessment Using a Color-Appearance Model. Soil Sci. Soc. Am. J. 2011, 75, 984–993. [Google Scholar] [CrossRef]
  81. Funt, B.; Bastani, P. Irradiance-independent camera color calibration. Color Res. Appl. 2014, 39, 540–548. [Google Scholar] [CrossRef]
  82. Bareth, G.; Aasen, H.; Bendig, J.; Gnyp, M.L.; Bolten, A.; Jung, A.; Michels, R.; Soukkamäki, J. Low-weight and UAV-based Hyperspectral Full-frame Cameras for Monitoring Crops: Spectral Comparison with Portable Spectroradiometer Measurements. Photogramm. Fernerkund. Geoinf. 2015, 2015, 69–79. [Google Scholar] [CrossRef]
  83. Behmann, J.; Acebron, K.; Emin, D.; Bennertz, S.; Matsubara, S.; Thomas, S.; Bohnenkamp, D.; Kuska, M.T.; Jussila, J.; Salo, H.; et al. Specim IQ: Evaluation of a New, Miniaturized Handheld Hyperspectral Camera and Its Application for Plant Phenotyping and Disease Detection. Sensors 2018, 18, 441. [Google Scholar] [CrossRef] [PubMed] [Green Version]
  84. Lodhi, V.; Chakravarty, D.; Mitra, P. Hyperspectral Imaging for Earth Observation: Platforms and Instruments. J. Indian Inst. Sci. 2018, 98, 429–443. [Google Scholar] [CrossRef]
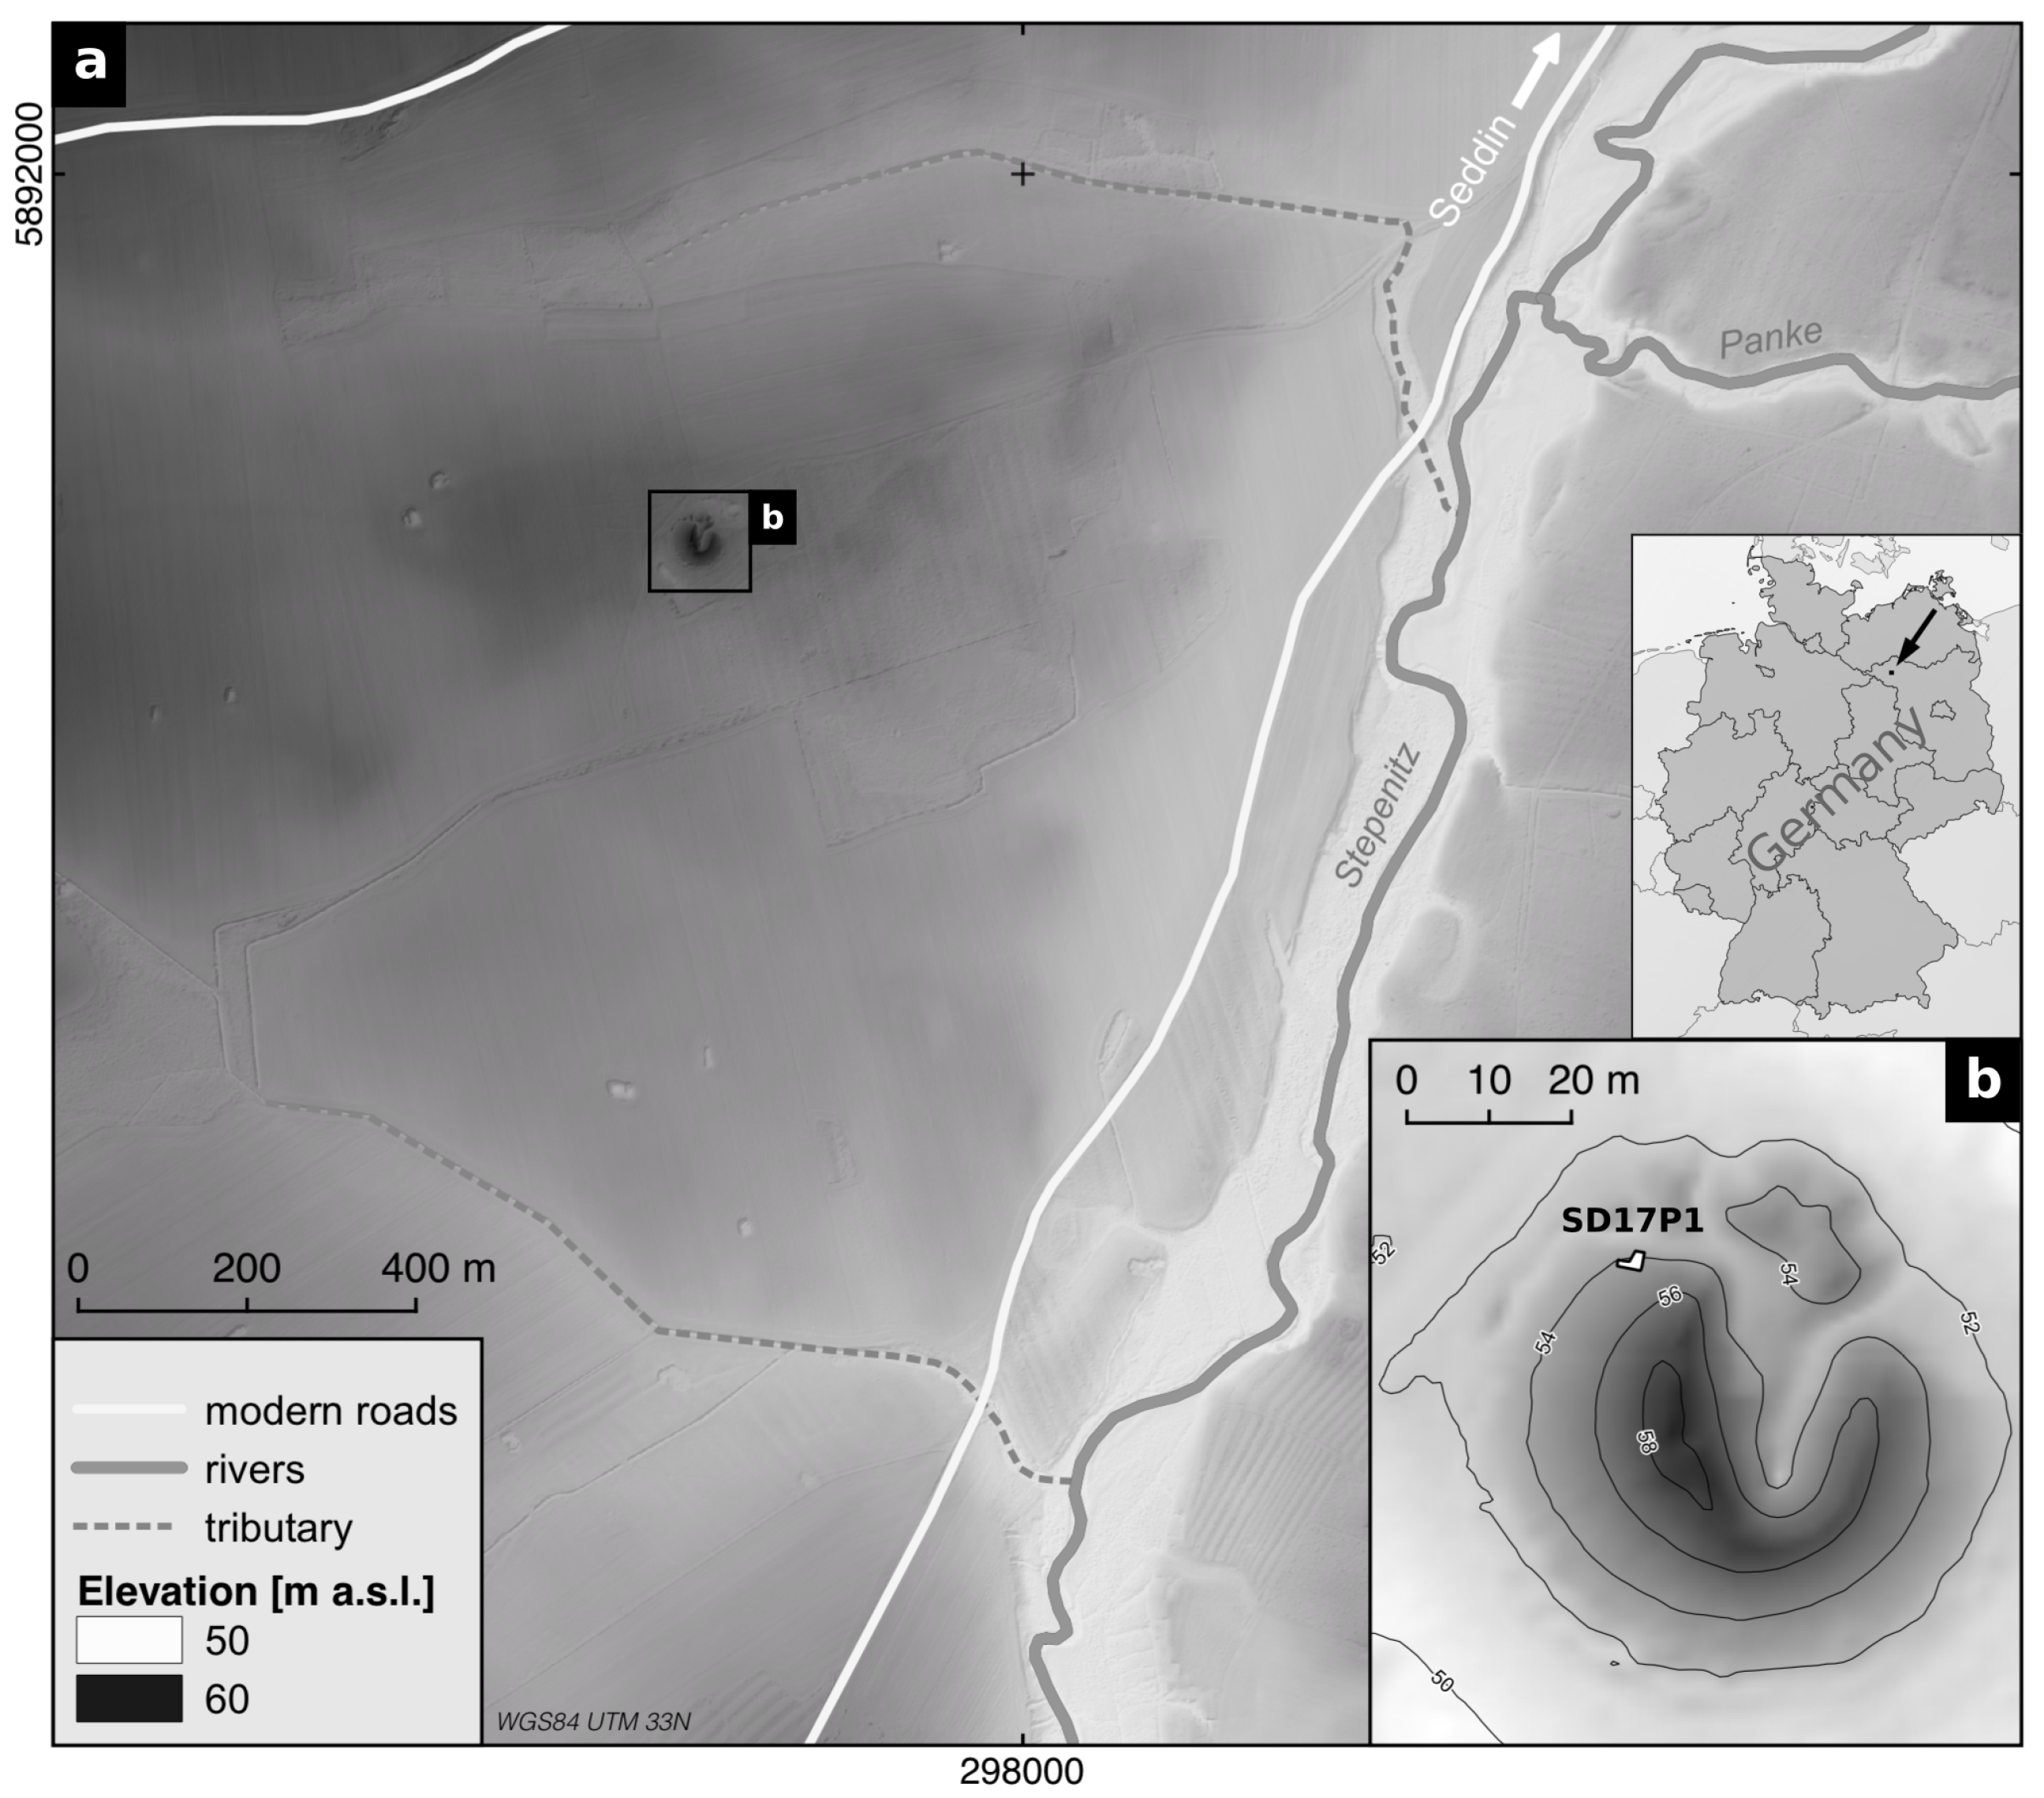
Figure 1. Location of the study site: (a) Surroundings of the burial mound; (b) location of section SD17P1. Elevation data: LiDAR-based DEM (1 × 1 m) by Geobasis-DE/LGB 2013 (R. Hesse; modified).
Heritage 03 00031 g001
Figure 2. Archaeological section examined. (a) Location of the sediment samples taken; (b) overview of the section; (c) drawing of the archaeological section examined. Layers A to D are part of the anthropogenically created burial mound. Layers B and D consist of numerous diagonal layers, which are summarised here. Colour and texture of the sediments were documented during fieldwork and are presented in Figure 5 along with the sedimentological record (Section 3.1). Layer E is interpreted as the local soil that was buried during the construction of the burial mound [33] and is excluded from all analyses.
Heritage 03 00031 g002
Figure 3. Schematic depiction of our workflow. Image processing included principle component analysis (PCA), derivation of slope rasters, colour transformation to CIELAB (Commission Internationale de l’Eclairage), and the prediction of soil organic carbon (SOC). The standardised centred log ratio (clr) of the data acquired with the portable energy-dispersive X-ray fluorescence spectrometer (p-ED-XRF) was used. Spectroscopic measurements of the sampled material were processed using standard normal variate (SNV) transformation with detrending applied to the first derivative of the l o g ( 1 / R ) transformed spectrum. This allowed us to create stratigraphic delineations based on extensive and selective data and to compare the performance of colour and spectral measurements to traditional p-ED-XRF data.
Heritage 03 00031 g003
Figure 4. Exemplary spectral signal (450–2500 nm, sample no. 10) before (a) and after (b) pre-processing. Standard normal variate (SNV) transformation with detrending was applied to the first derivative of the l o g ( 1 / R ) transformed spectrum.
Heritage 03 00031 g004
Figure 5. Sedimentological record of SD17P1 (layers A, B, C and D). Sediment colour and texture [69] as documented during fieldwork, location of samples, and respective results of the sediment analyses performed. Centred log-ratio (clr) transformed contents of relevant elements measured with the p-ED-XRF device.
Heritage 03 00031 g005
Figure 6. Clustering results (groups) of SD17P1 (layers A, B, C and D). Sediment colour and texture [69] as documented during fieldwork, location of samples, and respective results of the hierarchical and the depth-constrained hierarchical cluster analyses of the following data: p-ED-XRF data, selectively measured spectral data (450–2500 nm), and median pixel values extracted from image data. Colours of samples indicate groups obtained from the cluster analyses. Six groups (six colours) were obtained from the hierarchical clustering and ten groups (ten colours) from the depth-constrained hierarchical clustering. Boundaries discussed in the text are highlighted.
Heritage 03 00031 g006
Figure 7. Results of the performed image classification of the upper part of SD17P1; stone layers were masked manually prior to processing. (a) Profile as perceived during fieldwork with layer borders (white) according to Figure 2 (layers A, B, C and D). Classification results of (b) an RGB composite (raw data, slopes, PCA results), (c) a multispectral composite (raw data, slopes, PCA results), (d) a multispectral composite (slopes, CIELAB), and (e) a multispectral composite (slopes, predicted SOC, CIELAB chromaticity coordinates a and b). Colour shades represent individual groups produced from k-means clustering, while summarised groups are indicated by a common hue.
Heritage 03 00031 g007
Table 1. Technical specifications of the camera systems used; central wavelengths of the spectral channels blue, green, red, red edge, NIR1, and NIR2.
Sony ILCE-6000TetraCAM MicroMCA-6
B485 nm490 nm
G540 nm550 nm
R595 nm680 nm
red edge-720 nm
NIR1-800 nm
NIR2-900 nm
spatial resolution5696 × 4272 px1280 × 1024 px
colour depth8 bit10 bit