Abstract
We propose a new method for dating ancient linen threads by inspecting their structural degradation by means of wide-angle X-ray scattering. X-ray dating of a textile sample can be performed nondestructively and on a submillimeter area, e.g., 0.2 × 0.5 mm2, exploiting new table-top X-ray micro-sources. A theoretical formula is derived for dating linen samples directly from wide-angle X-ray scattering measurements. Our preliminary results show that X-ray dating results are in agreement with other dating sources, such as the radiocarbon method and historical records, if some conditions are satisfied. Indeed, this new dating method can be applied only to threads not older than about thirty centuries because of the saturation of the structural degradation with age. Moreover, the method can be applied only on textiles in which cellulose degradation is mainly due by natural aging arising from thermal, hydrolytic, photolytic, photochemical, and oxidative processes. Analyses can be repeated several times on the same sample, which remains unaltered for other complementary characterization procedures. The proposed X-ray dating of some ancient linen fabrics opens the way to explore limits and potentialities of this new approach and to further develop a new dating method, alternative to the existing ones for specific applications in archeological studies.
1. Introduction
Textiles contain important archaeological information about everyday life, religion, art, technical culture, religion, and history of ancient peoples. Unfortunately, ancient textiles are rare in archaeological sites compared to ceramic, metal, and wood artifacts because of their structural fragility under the action of humidity, temperature, fungi, microbes, and insects. Nevertheless, especially in Egypt or the Near East, there are many cases in which well-preserved textiles have been discovered in crypts and ground caves. Archeological textiles can comprise braided and woven structures from animal or vegetable fibers. Fragments of linen burial cloths indicate that weaving with flax was already used about 8000–9000 years ago [1]. Indeed, flax is a vegetable textile frequently used by populations of the Mediterranean geographical area. One reason is that linen fibers are the most resistant vegetable fibers to environmental aging agents (oxygen, humidity, light, etc.).
Deterioration of vegetable fibers is related to cellulose degradation, the main component of their structure. Cellulose in linen fabrics is a polymer, which contains anhydroglucose units bonded by β-glycosidic bonds. Aging of textiles can have thermal, hydrolytic, photolytic, photochemical, and enzymatic origins. All these physical and chemical agents degrade cellulose, provoking the scission of the polymeric chains by breaking the β-glycosidic bonds [2,3,4]. Within any glucose unit, three hydroxyl groups are available for oxidation, leading to a great variety of structural modifications and combinations of the cellulose through oxidative processes. Depending on the particular stress imposed on cellulose, the individual hydroxyl groups in both the polymeric chain and the anhydroglucose units are involved to a varying extent in giving rise to carbonyl and carboxyl groups. These groups are usually introduced in the structure of cellulose through material processing steps, such as bleaching. Furthermore, high energy radiation can cause a considerable increase in carbonyl groups in addition to chain scission, mainly through the action of the generated radical species. For example, the number of carbonyls introduced by γ-irradiation is directly correlated to the applied dosage [5].
Carbonyl and carboxyl group formations in cellulose are also caused by natural aging, which happens at room temperature and humidity. Indeed, the presence of oxygen, often in the presence of light, induces many auto-oxidative reactions. In fact, natural aging of cellulosic fabrics is due to two main processes: hydrolytic cleavage of the glycosidic bond [6,7,8] and oxidation [9,10,11,12], which mainly depends on average room temperature values. Indeed, the role of atmospheric oxygen is crucial. Radical reactions come into play leading to formation of carbonyl or carboxyl groups, to chain cleavage, and thus also to a loss in the degree of polymerization and in the fiber strength.
Recently, new dating methods of textiles have been proposed based on the mechanical analysis such as breaking strength, Young modulus, and loss factor and on opto-chemical analyses (by FT-IR and Raman spectroscopies) as a function of the age of the fabric [13,14,15]. These new dating methods are possible alternatives to the radiocarbon dating of textiles [16]. Kim et al. [17] investigated the influence of oxidation in the cellulose crystalline domains and showed that the degree of crystallinity of the oxidized cellulose determined by X-ray diffraction decreases according to the oxidation level. This finding, in principle, could allow the obtainment of information about the age of the textile by means of x-ray structural characterization. For this reason, the aim of this paper is to study by means of X-ray diffraction the decrease of the degree of polymerization of cellulose in naturally aged linen fabrics as a function of the aging time, mainly due to thermal and hydrolytic actions which have occurred where they have been preserved for centuries.
In the present paper, by characterizing the textile threads with Wide-Angle X-ray Scattering (WAXS), we have investigated the possibility of extracting structural information suitable for deriving the age of ancient linen fabrics. The work can be summarized in three main parts: (1) the analysis of the WAXS data collected from radiocarbon/historically dated ancient linen threads; (2) the study of the degree of polymerization of cellulose as a function of the aging time; and (3) the X-ray dating obtained by our novel approach compared to other dating of the same investigated linen threads, such as radiocarbon (14C) or Historical Records (HR). In the discussion of the results, we analyze expected limits of application of the proposed new dating method by verifying the WAXS-derived aging times of linen’s threads also from a statistical point of view.
2. Degree of Polymerization as a Function of the Aging Time
Cellulose consists of linear, polymeric chains of cyclic (anhydroglucose) units of which number per chain is called the Degree of Polymerization (DP) [3]. During polymerization, the chains of cellulose molecules are organized in both crystalline and amorphous regions, in micro-fibrils, and finally into fibres. The depolymerization, i.e., the increase in the number of Chain Breaks (CB), is the main mechanism of cellulose degradation.
The CB is proportional to the Scission Fraction of Cellulose Unit (SFCU), which can be related to the DP by means of the following equation [3,4]:
where is the degree of polymerization at time t and is the degree of polymerization before the degradation of cellulose starts. DP represents the average number of monomers in the cellulose polymer. Therefore, DP(t) gives a measure of the length of cellulose polymer after the aging time t. The natural aging process that degrades cellulose in thousands of years can be accelerated in suitable ovens by increasing the temperature to reach the maximum number of in few thousands of hours. For this reason, by accelerating the process in ovens, the degradation of cellulose is studied under controlled conditions, but there are no data available concerning the DP decrease due to thermal, hydrolytic, and oxidative natural aging occurring at room temperature. Threads of ancient fabrics are studied here by WAXS to retrieve the first experimental information about or CB(t) for very long natural aging processes.
To relate CB(t) to some quantities measured by WAXS on linen threads, we have defined the fraction of maximum CB, a parameter given by the ratio between CB at any aging time and the normalized asymptotic value obtained for very long aging times (see Equations (A5) and (A6) in Appendix A):
where is the reaction rate at the oven temperature at which the accelerated degradation process has been measured and is the temperature at which fabrics have been preserved during the centuries (i.e., the local average room temperature). Given , , and , Equation (2) depends only on two quantities, the DP activation energy and the DP maximum fractional loss (). The Arrhenius shift factor has the following expression [2]:
where R is the gas constant (see Appendix A for further details). The first task of this work is to obtain information by WAXS about and for the natural aging of linen, which occurs over many centuries.
3. WAXS Characterization of Ancient Linen Threads
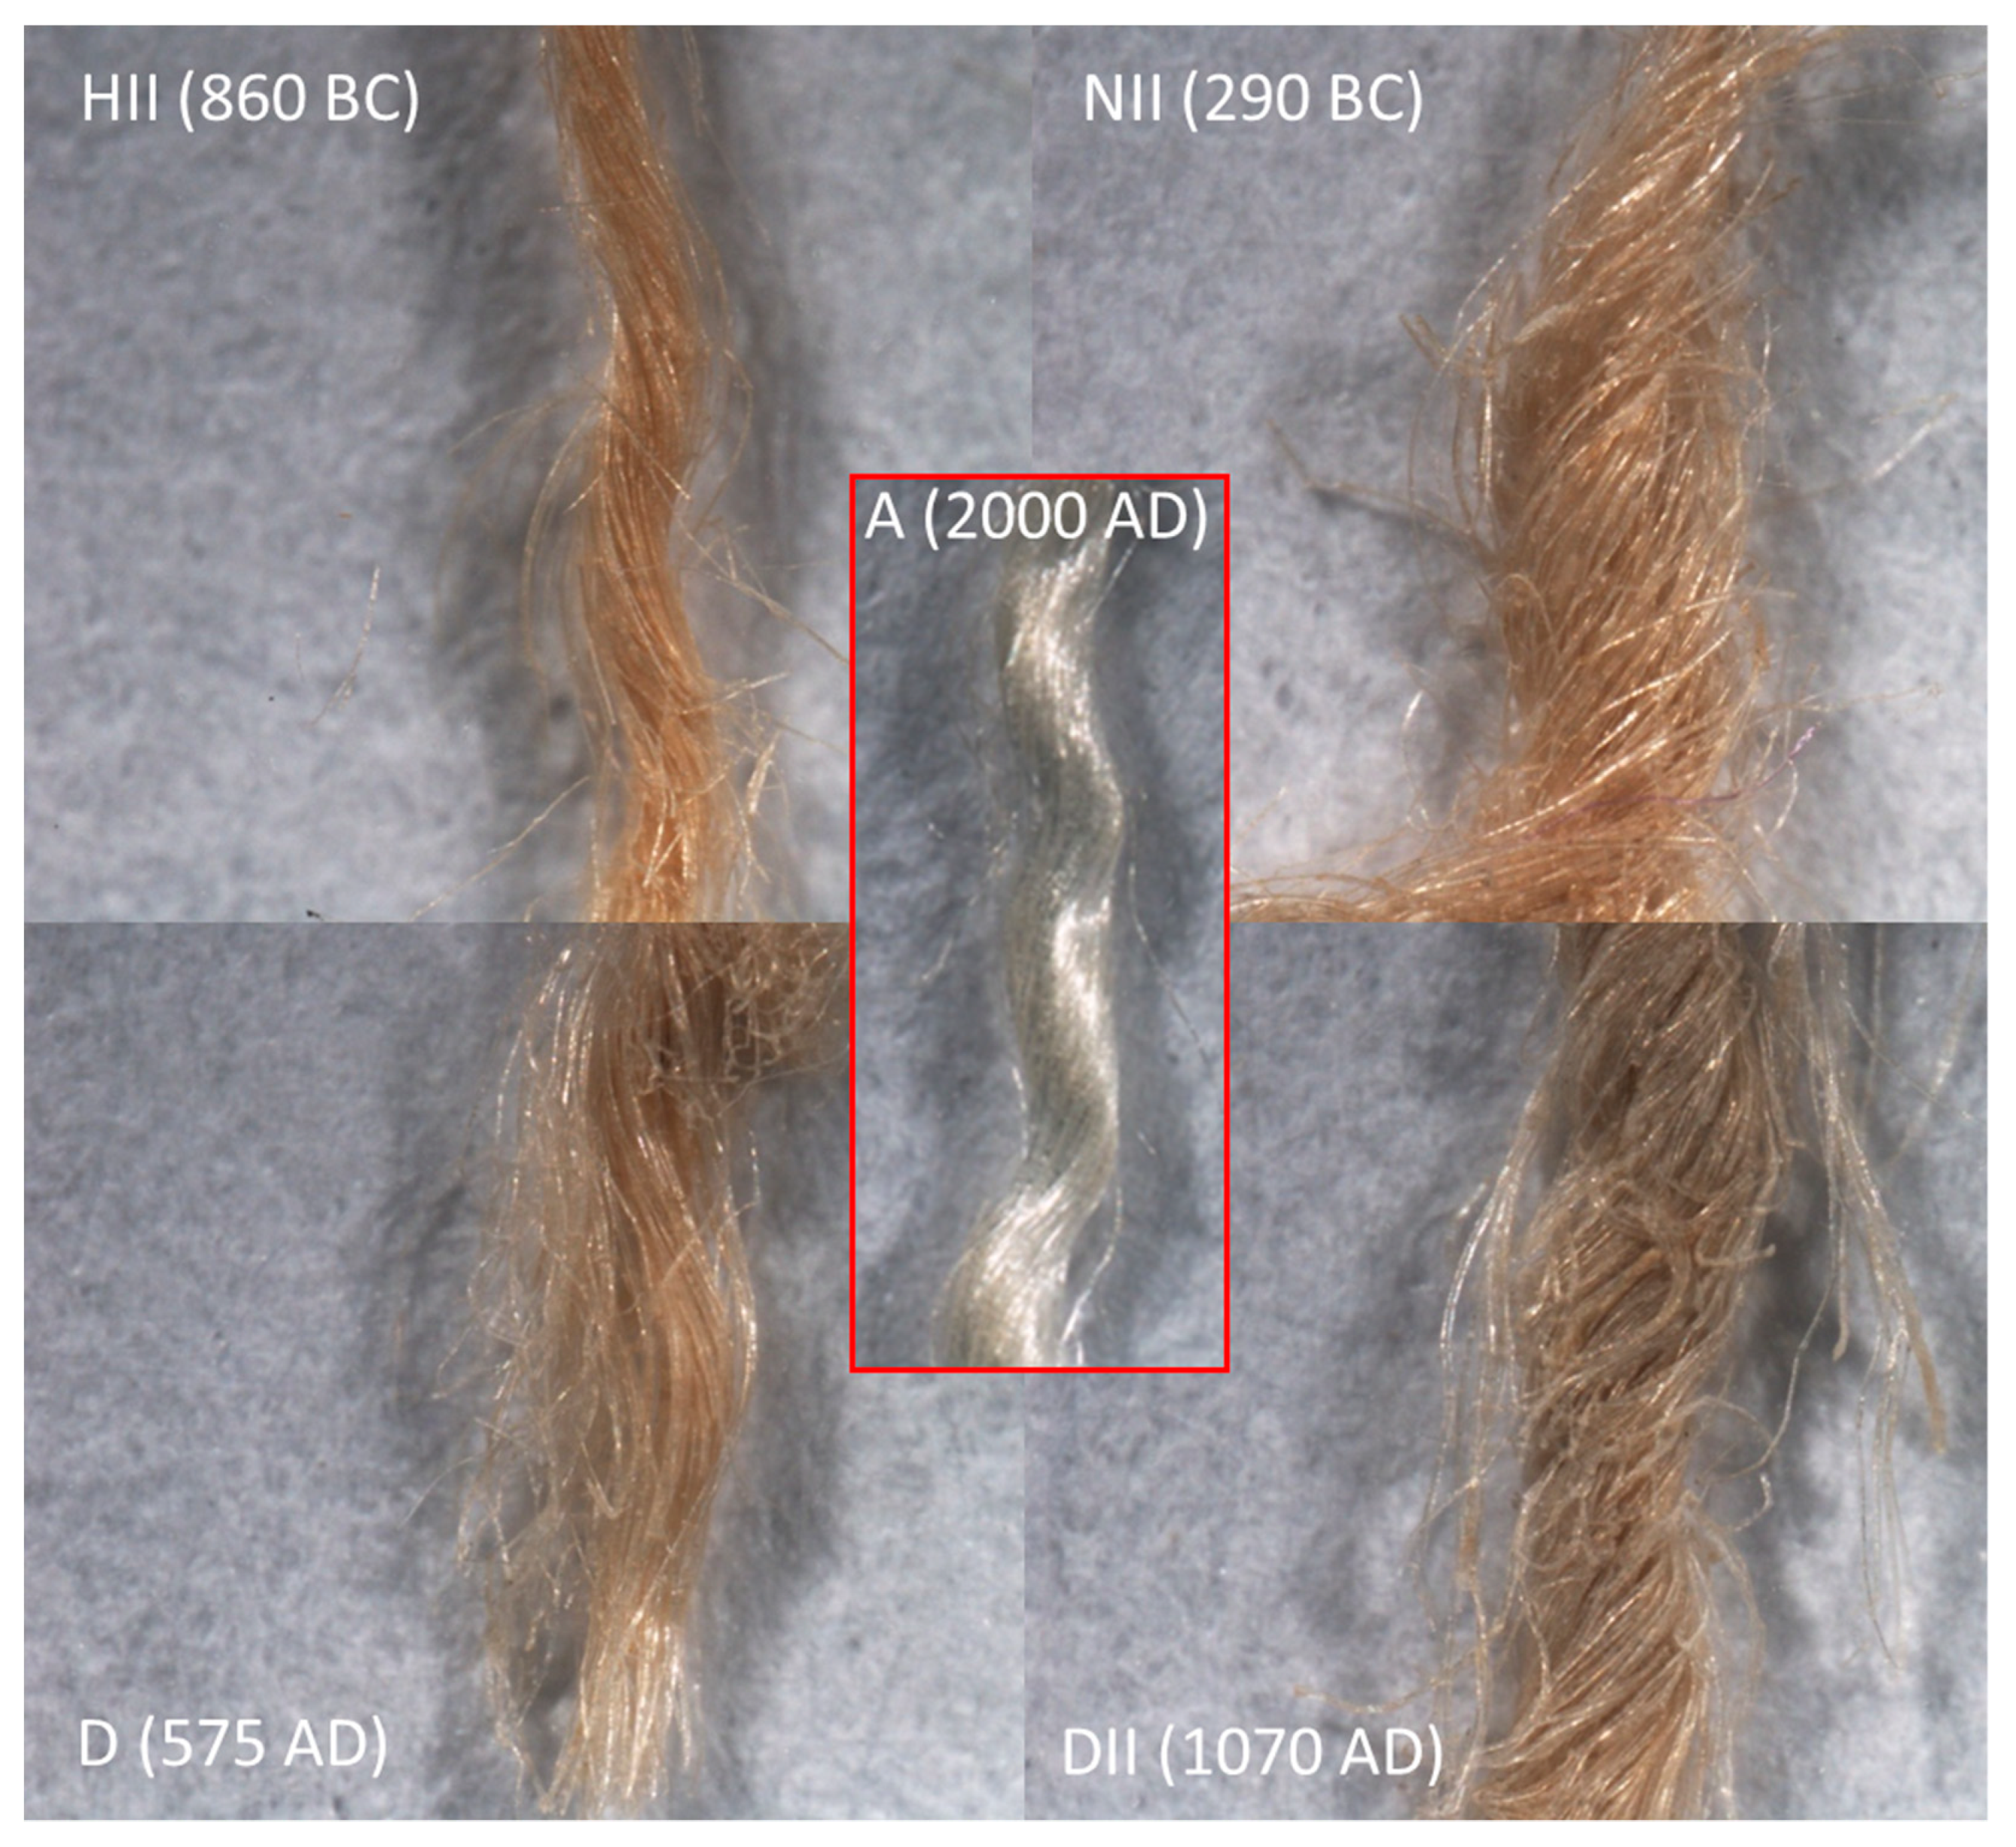
The characterized samples were linen threads, about 1 cm long and 0.2–0.6 mm wide. Some of them are shown in Figure 1. The threads shown in Figure 1 have been taken from fabric samples already studied by other authors [13,15], of which the nomenclature and average 14C/HR dating are reported in Figure 1 and in the following text. The main data of the characterized samples are summarized in the first two columns of Table 1.

Figure 1.
Low-magnification optical microscopy images of some of the analyzed samples under the same illumination conditions: The central sample is of our age (2000 AD). For the ancient samples, in parentheses are shown the average 14C/HR dating. The analyzed threads are 0.2–0.6 mm wide and a few mm long.

Table 1.
Data obtained from the analysis of the 1D WAXS profiles: Sample description and age are obtained from the literature [13,15]. The nomenclature of the samples is the same used in the cited papers. AD = Anno Domini; BC = Before Christ. Scattering vector q-values are given in nm−1.
WAXS experiments were performed at the X-ray Micro Imaging Laboratory (XMI-LAB) on all the linen samples reported in Table 1. The laboratory is equipped with an Fr-E+ SuperBright rotating copper anode micro-source (λ = 0.154 nm, 2475 W) coupled through a focusing multilayer optics Confocal Max-Flux (CMF 15–105) to a Small/Wide-angle X-ray scattering SAXS/WAXS (SWAXS) three-pinhole camera equipped for X-ray scanning microscopy. An image plate (IP) detector (250 × 160 mm2, with 100 μm effective pixel size) with an offline Rigaku RAXIA-Di reader was employed to collect WAXS data. WAXS data were collected for each linen sample directly mounted on the sample holder with an acquisition time of 1800 s. The spot size at the sample position was about 200 μm. The image plate detector was placed at about 10 cm from the sample, giving access to a range of scattering vector moduli (q = 4π × sinϑ/λ) from 1.5 to around 35 nm−1. Two-dimensional (2D) patterns were then converted into one-dimensional (1D) data profiles after the calibration procedure.
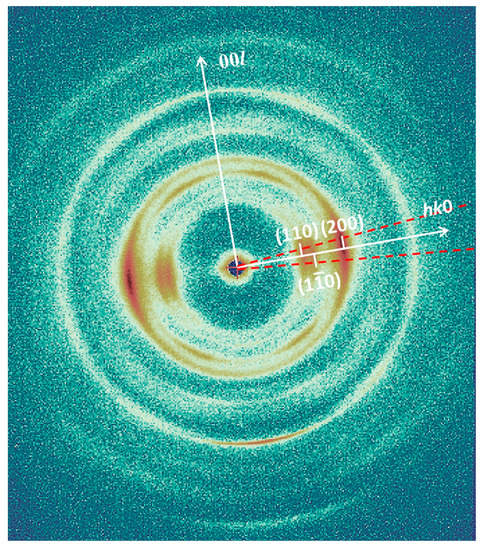
Figure 2.
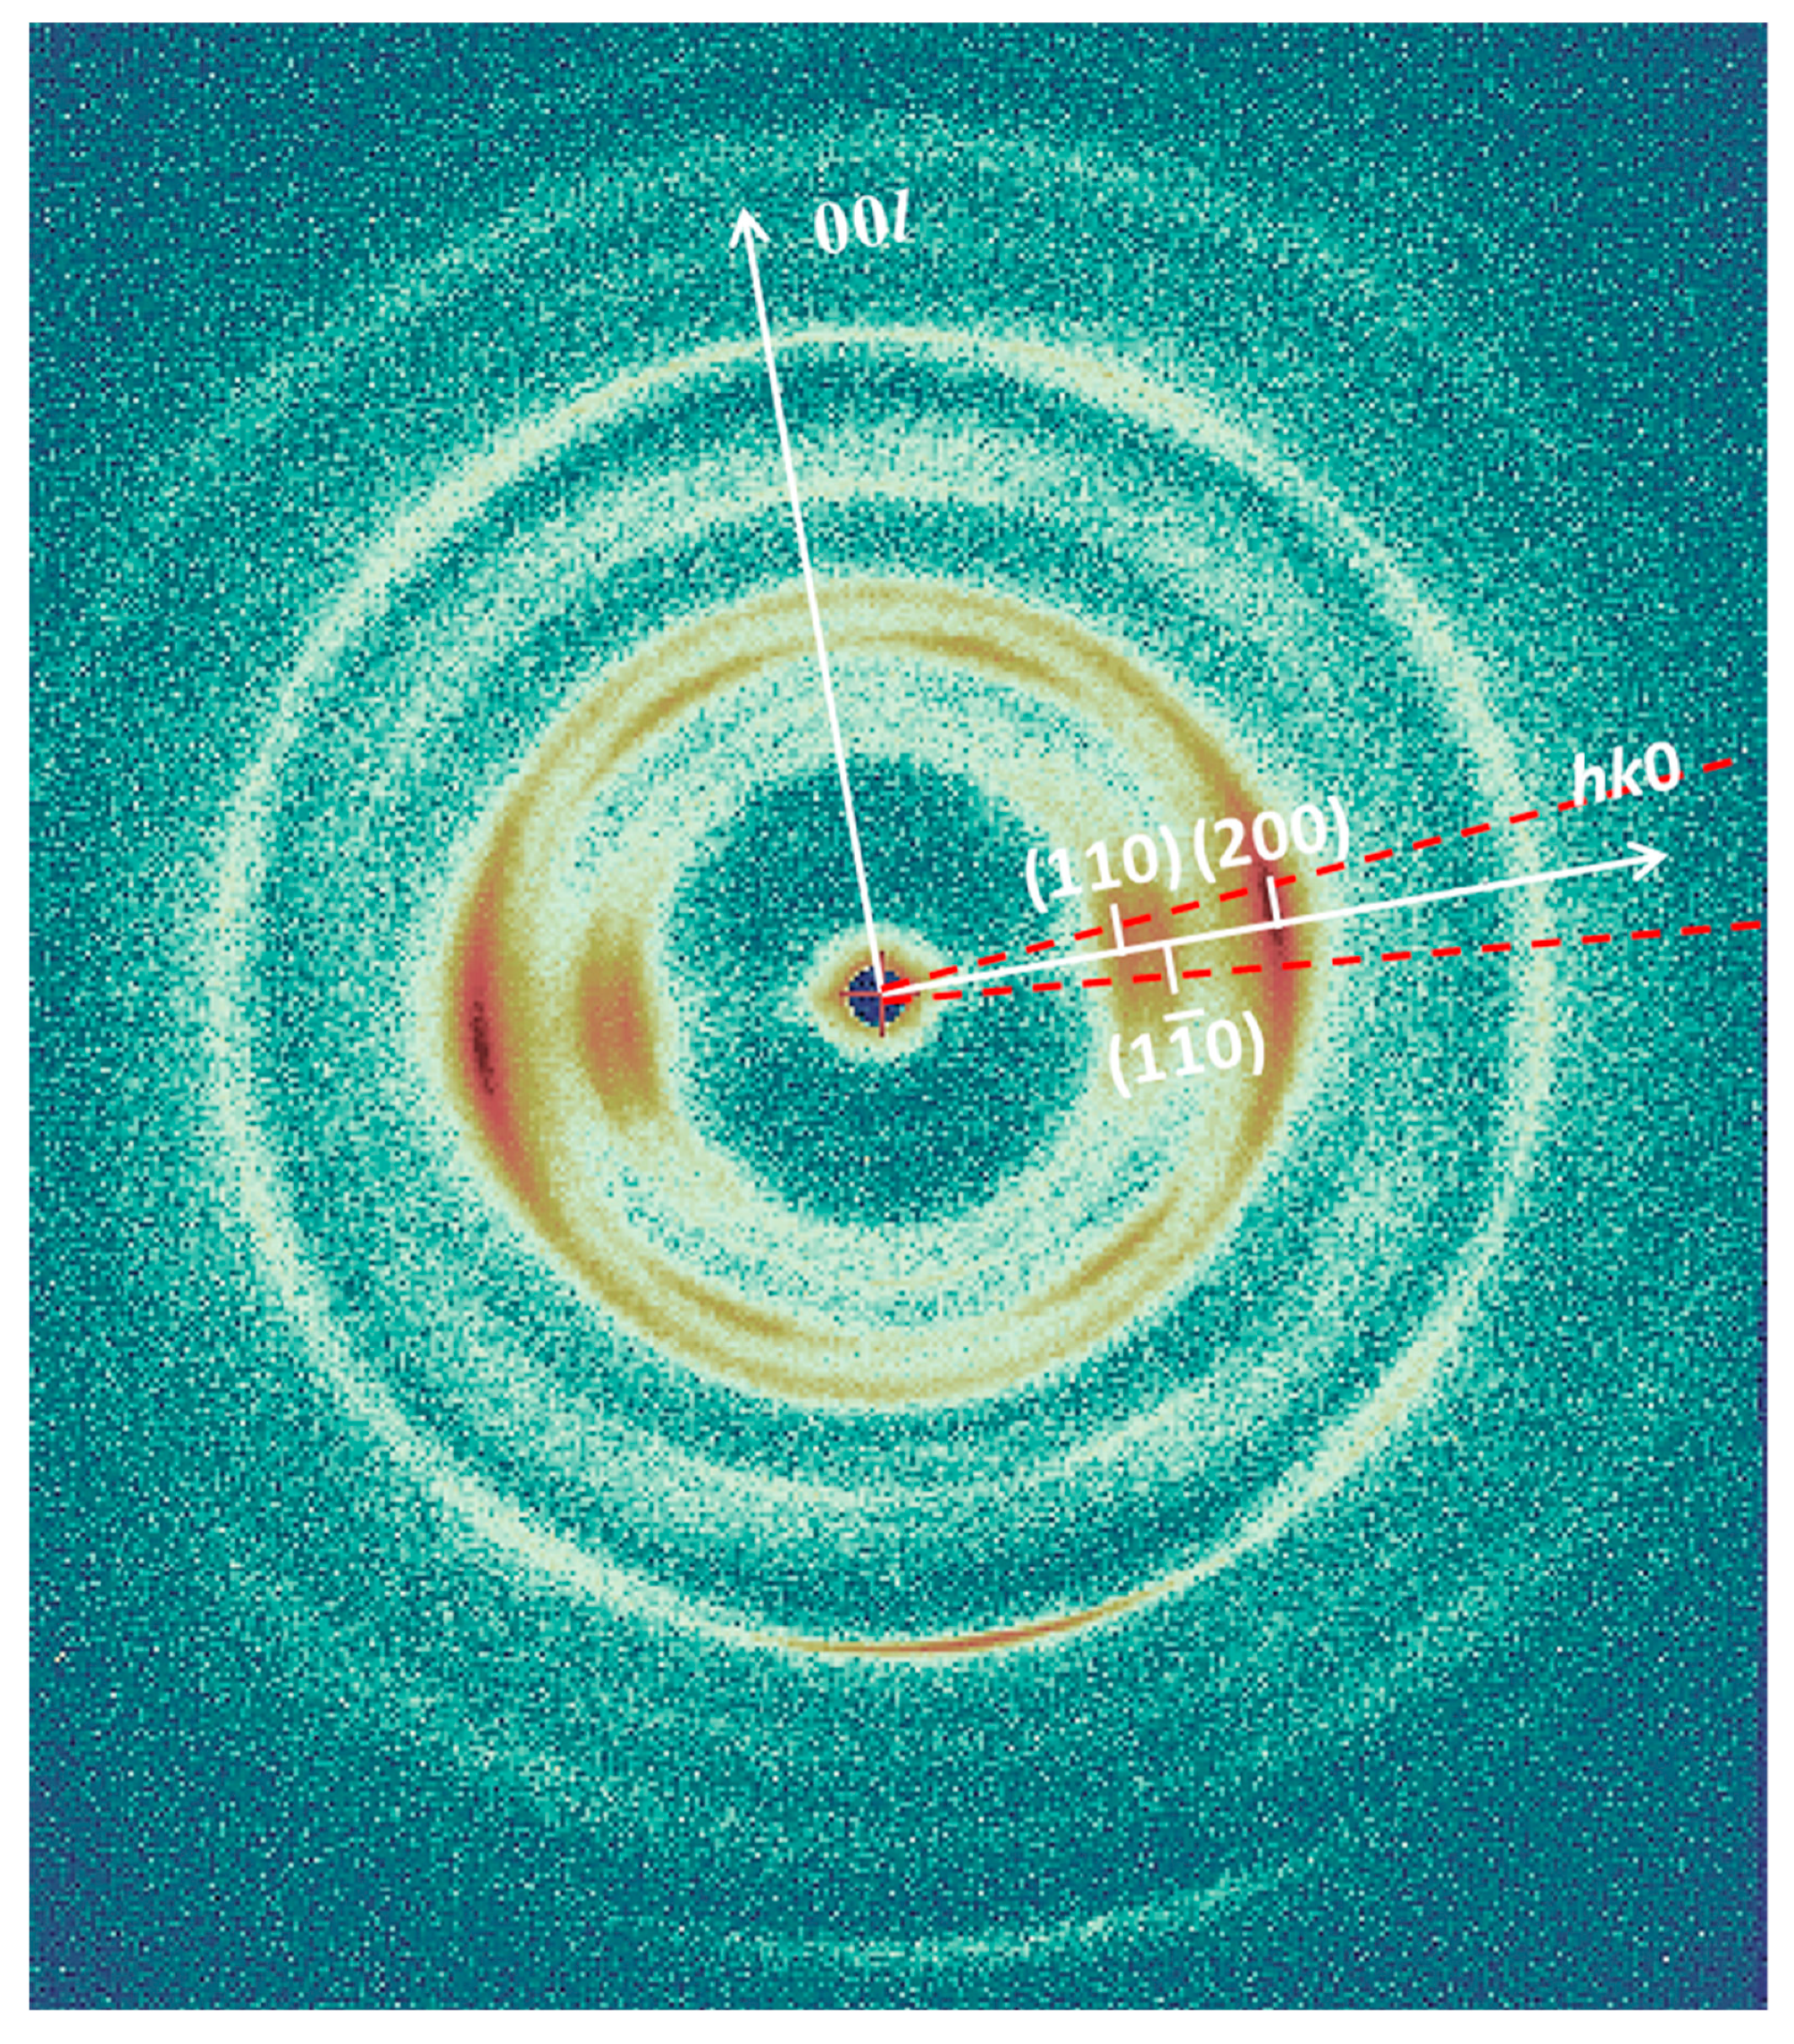
Two-dimensional Wide-Angle X-ray Scattering (WAXS) pattern measured on sample D (575 AD): The main axes of the fiber-diffraction pattern are shown (white lines) together with indexing of main cellulose diffraction peaks.
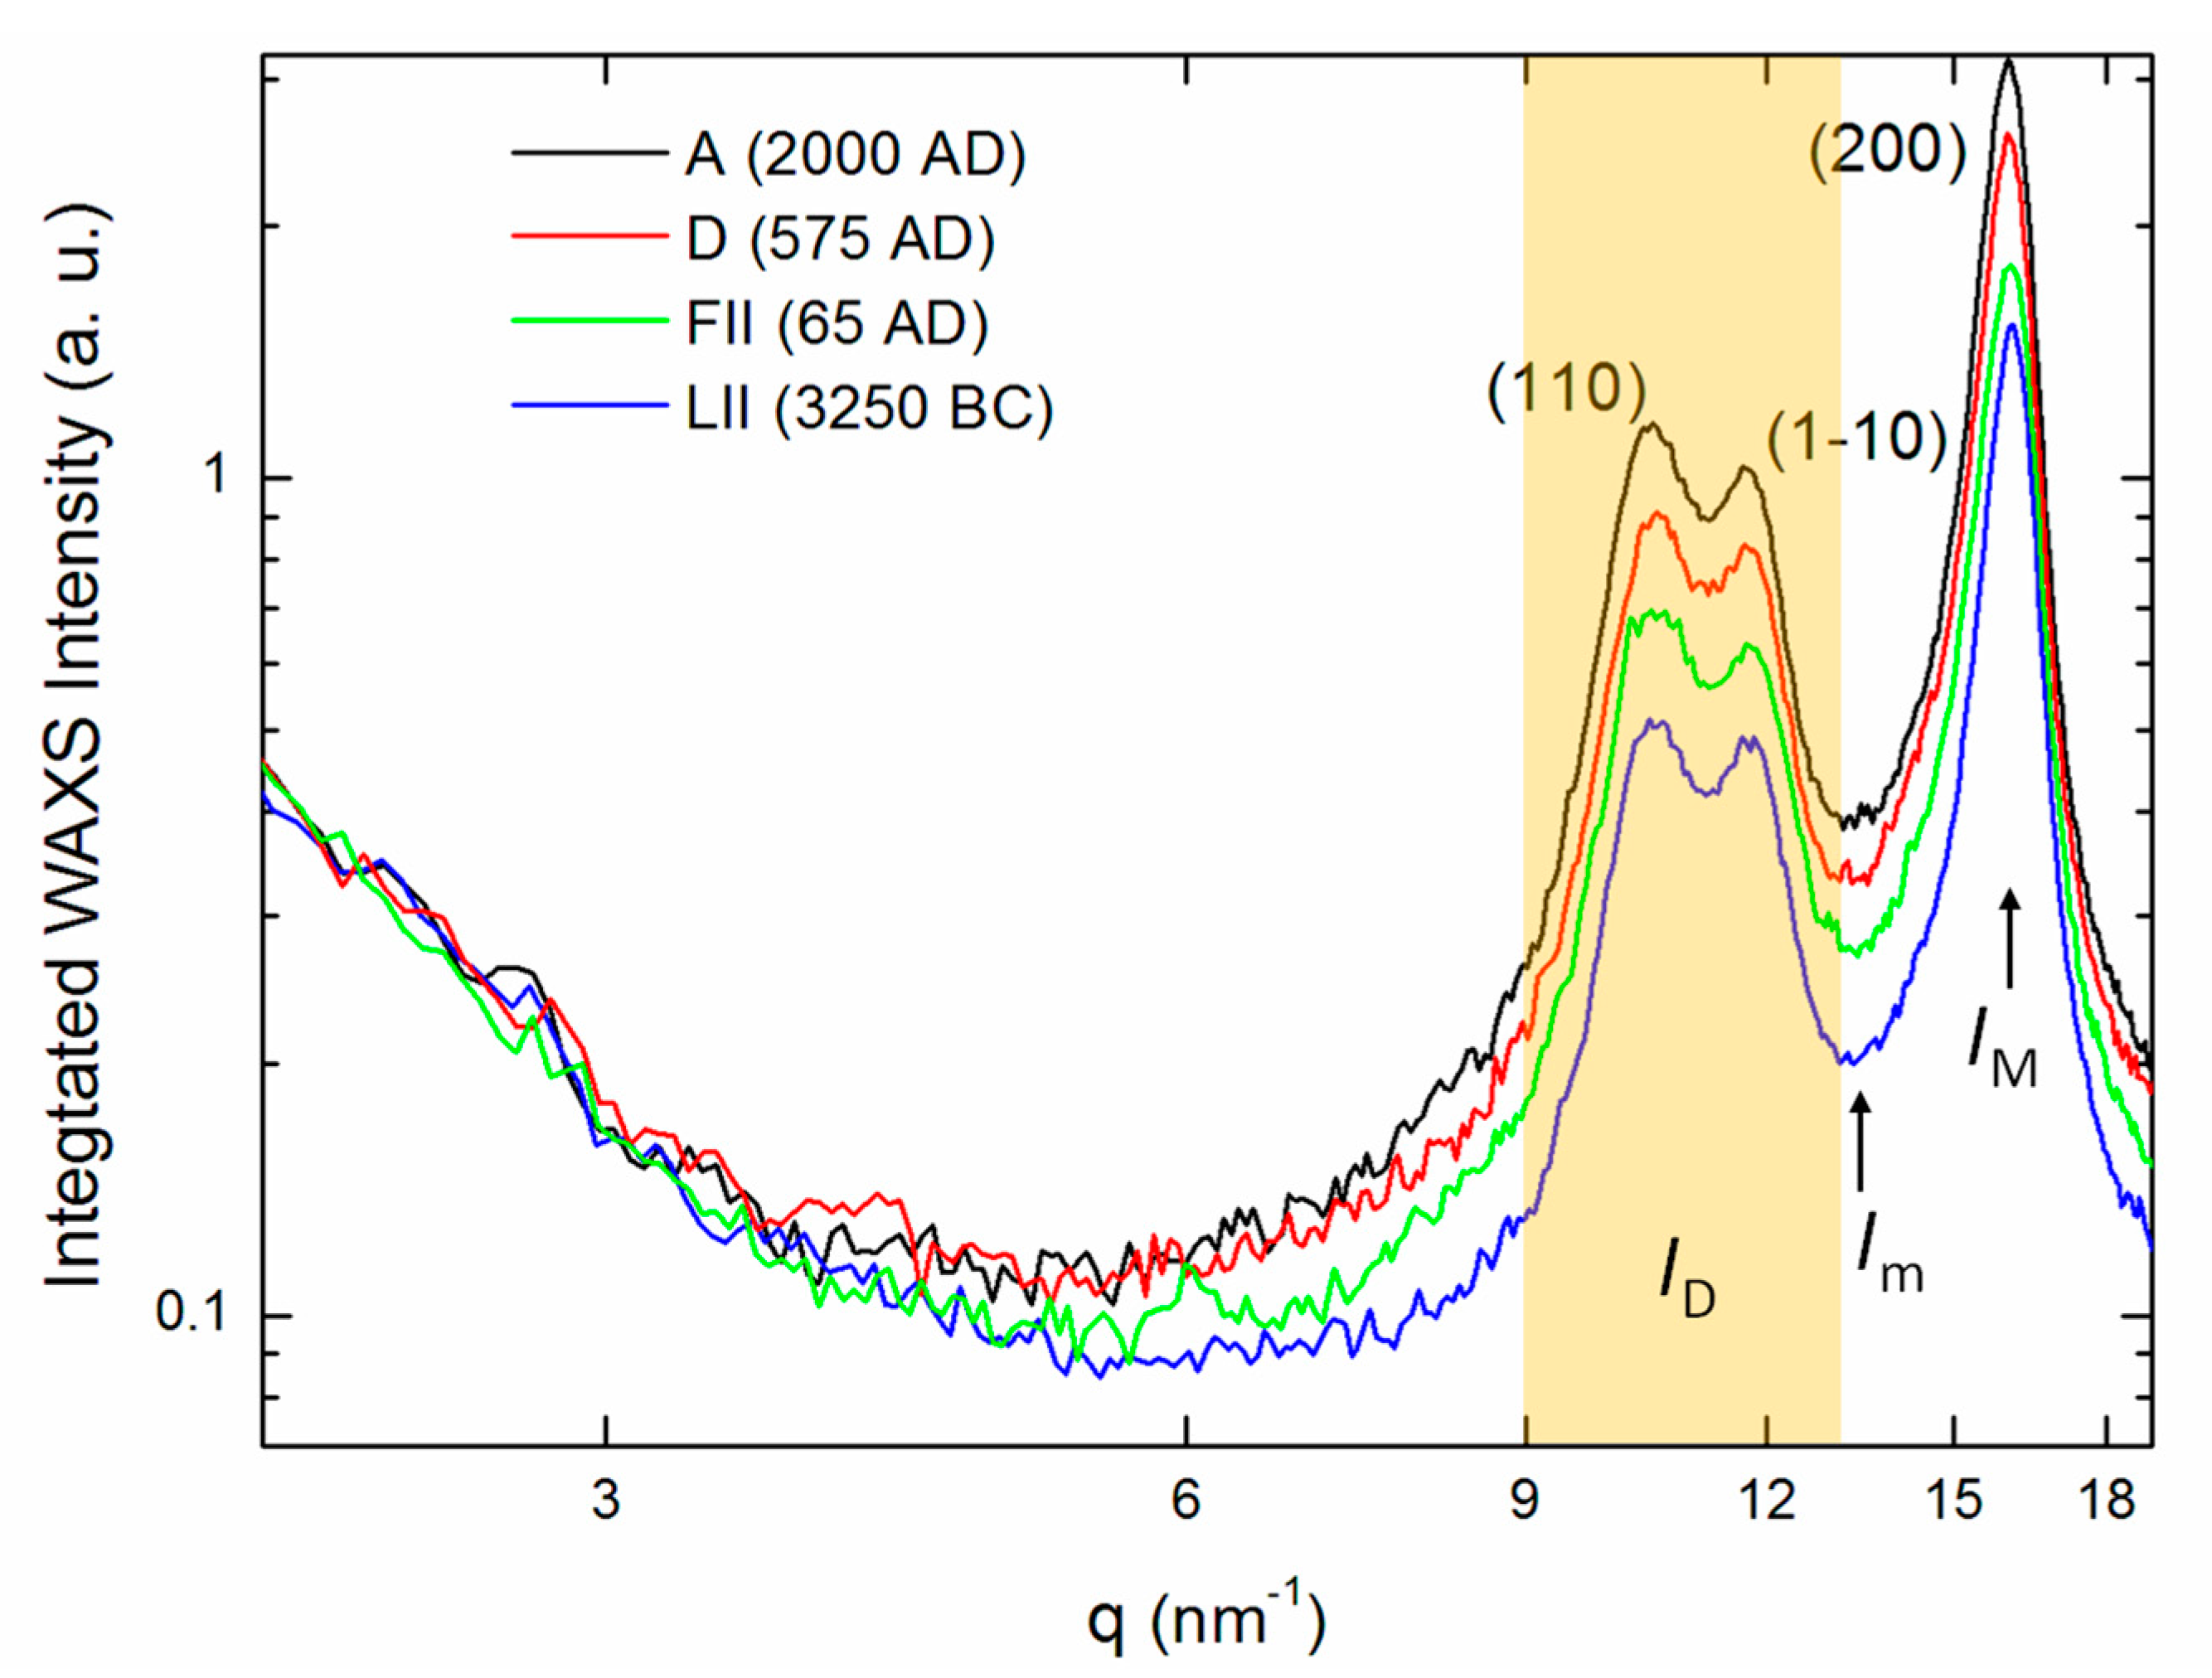
Figure 3 shows the average scattered intensity of the WAXS patterns of some of the investigated textile samples, integrated in a 10-degree wide angular sector between the two red dashed lines of Figure 2 around the hk0 equatorial fiber-diffraction axis, where h and k are the Miller’s crystallographic indexes. This information was extracted from all 2D WAXS patterns of the investigated samples. In particular, in Figure 3, we report the experimental results obtained from sample A (Figure 3, black curve), FII (Figure 3, green light curve), D (Figure 3, red curve), and LII (Figure 3, blue curve), characterized by very different ages. They exhibit clear differences in the scattering profiles, already visible from visual inspection of the curves. The profiles were rescaled to the same integrated intensity in the q-range 1.5–4.0 nm−1, i.e., the region of the incident beam tail. After this rescaling, it is evident that the diffraction WAXS intensity peaks depend on the age of the linen threads. This dependence was used to date the ancient linen threads from WAXS data.
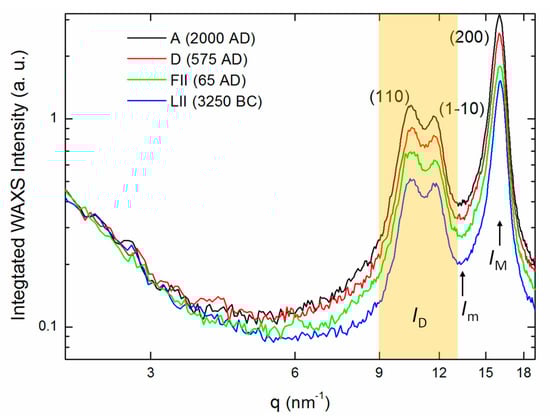
Figure 3.
One-dimensional WAXS profiles extracted from the relevant 2D patterns after integration in the angular sector of 10 degrees around the hk0 equatorial fiber-diffraction axis in arbitrary units: The cellulose (110) and (1–10) diffraction peaks have been indexed and rescaled to have the same integrated intensity in the q-range 1.5–4.0 nm−1. See the main text for further details and Table 1 for symbols.
Indeed, crystalline cellulose is known to have (1) a diamond-shaped cross section, with exposed (110) and (1–10) crystal faces, and (2) a rectangular-shaped cross section with exposed (200) and (010) faces [18]. Cellulose degradation rates are slightly different for the two crystallographic configurations (diamond- and rectangular-shaped). Moreover, DP is not simply related to the crystallinity of cellulose. DP could be the same in both crystalline and amorphous regions of cellulose, even if the decrease of the degree of polymerization with age is usually faster in the amorphous regions. However, only spatially ordered chains will contribute to the diffraction peaks. Thus, with WAXS, we can inspect the DP of the crystalline regions of the investigated linen threads.
Reaction with cellulosic chains will most likely take place on the surfaces of cellulose crystallites and at defects where water and oxygen can penetrate. Thermal rupture of chains can occur inside crystallites as well as on their outer surfaces based on normal first-order kinetic rupture of glycosidic links. Following rupture of cellulose chains, crystallite volumes will reduce by disordering at surfaces as well as by increasing disorder within crystallites following internal chain thermal rupture. Thus, an average reduction in crystallite volume will ensue but as a consequence of two different mechanisms. The integrated diffraction intensities are proportional to the crystallite volumes and, thus, proportional to the length of the cellulose polymeric chains, i.e., to DP(t) of polymeric chains in the crystalline regions at the aging time t. Therefore, the inverse of the integrated intensity under the main cellulose diffraction peaks can be used to obtain experimental information about 1/DP(t). However, from Equation (1), CB(t) is related to 1/DP(t). Thus, by WAXS quantifying the reduction in the intensity of the cellulose diffraction peaks shown in Figure 3, it is possible to obtain experimental information about CB(t).
4. X-ray Aging Parameter
Table 1 summarizes some experimental quantities obtained by WAXS: the scattered intensity, integrated below the (110) and (1–10) diffraction peaks <I>q∊[0.9,1.3] in the scattering vector q-range = 9.0–13.0 nm−1 (yellow region of Figure 3); the maximum intensity in the entire q-range, dominated by the intensity of the (200) peak (IM); and the minimum background intensity between the (1–10) and (200) diffraction peaks (Im). The symbol <...> stands for the average of the scattered intensities in the indicated q-range. The term <I>q∊[0.9,1.3] stands for the intensity in an angular sector of 10 degrees around the hk0 axis averaged in the scattering q-range from 0.9 to 1.3 nm−1 and is referred in the following as ID.
From these experimental quantities, we extracted the Aging Factor (AF), which is proportional to the inverse of ID, i.e., proportional to the inverse of DP(t). The integrated intensity under every diffraction peak is also proportional to the number of crystalline cellulose chains, which diffract photons in well-defined scattering directions, defined by the Bragg law. Therefore, in the definition of AF, it is necessary to insert a quantity proportional to the number of cellulose chains, which cause diffraction. In turn, this quantity depends on the actual thickness of the sample, which changes for every sample and comprises a different number of fibres, as shown in Figure 1. This contribution to the intensity of the peaks can be taken into account by the maximum-to-minimum ratio of the main (200) peak, evaluated as follows:
where IM is the maximum intensity corresponding to the (200) diffraction peak and Im is the minimum scattered background intensity that occurs at about q = 13.3 nm−1 between the (1–10) and (200) peaks.
Thus, the Aging Factor (AF) is defined by the following equation:
which is a quantity proportional to the actual thickness of the sample and to the inverse of DP(t). We have considered only natural aging to determine unknown quantities such as and , from which the cellulose degradation process depends on. Natural aging happens when the textiles have suffered only thermal, hydrolytic, photochemical, and oxidative degradation processes at stationary room conditions over the centuries.
Our experimental tests indicate that samples in which cellulose has been degraded by natural aging (thermal, hydrolytic, oxidative, and photochemical processes at room temperature and humidity) are characterized by RMm values larger than 4. Let us note that the maximum-to-minimum ratio of the main (200) peak RMm can be also indirectly related to the degree of crystallinity of the cellulose through the following relation [19]:
Although the above relation usually overestimates the degree of crystallinity of cellulose [20], it indicates that, below a given level of crystallinity, corresponding to RMm values smaller than 4, causes other than natural aging have probably contributed to the degradation of cellulose. Indeed, the DP maximum fractional loss and the DP activation energy values change under the action of enzymes or acid/basic solutions, which strongly accelerated cellulose degradation. Our tests indicate that even an empirical and approximated evaluation of C, through Equation (6), allows a rapid comparison of cellulose samples [20] to make a preliminary judgement if the linen fabric has suffered mainly a natural aging process and so to discard samples that could have suffered more aggressive degradation processes.
The intervals reported in columns 4–7 of Table 1 by means of the “±” symbol are uncertainty intervals related to the repeatability of the WAXS measurement in the same point of the same sample. The interval values reported in columns 7–8 of Table 1 have been obtained by propagating the corresponding uncertainties. They correspond to a single measurement of 1800 s on a single point of the sample. For homogeneous degradation due to natural aging of the sample along its extension, it is possible to derive AF values which do not depend on the particular position on the thread within the uncertainty range of the measurements. Indeed, either repeating the measurement on the same point or changing the point of analysis along the thread, the same results are obtained, within the experimental errors. Therefore, if the sample degradation is homogeneous along all its extension, the averaging of many measurements allows for the reduction of the uncertainty intervals obtained relative to a single one. For the representativeness of the WAXS characterization of a single thread for the whole fabric, see the Discussion section. We checked that repeating the WAXS characterization, in the same point of the linen threads after an irradiation of 15 h with the X-ray beam (8 KeV of energy) used in the measurements does not cause a measurable structural degradation within the experimental errors. Moreover, the average of four measurements of 1800 s, which halves the corresponding uncertainties, is already sufficient to reduce the uncertainty interval enough to become comparable with other source of errors, like the uncertainty on the average room temperature.
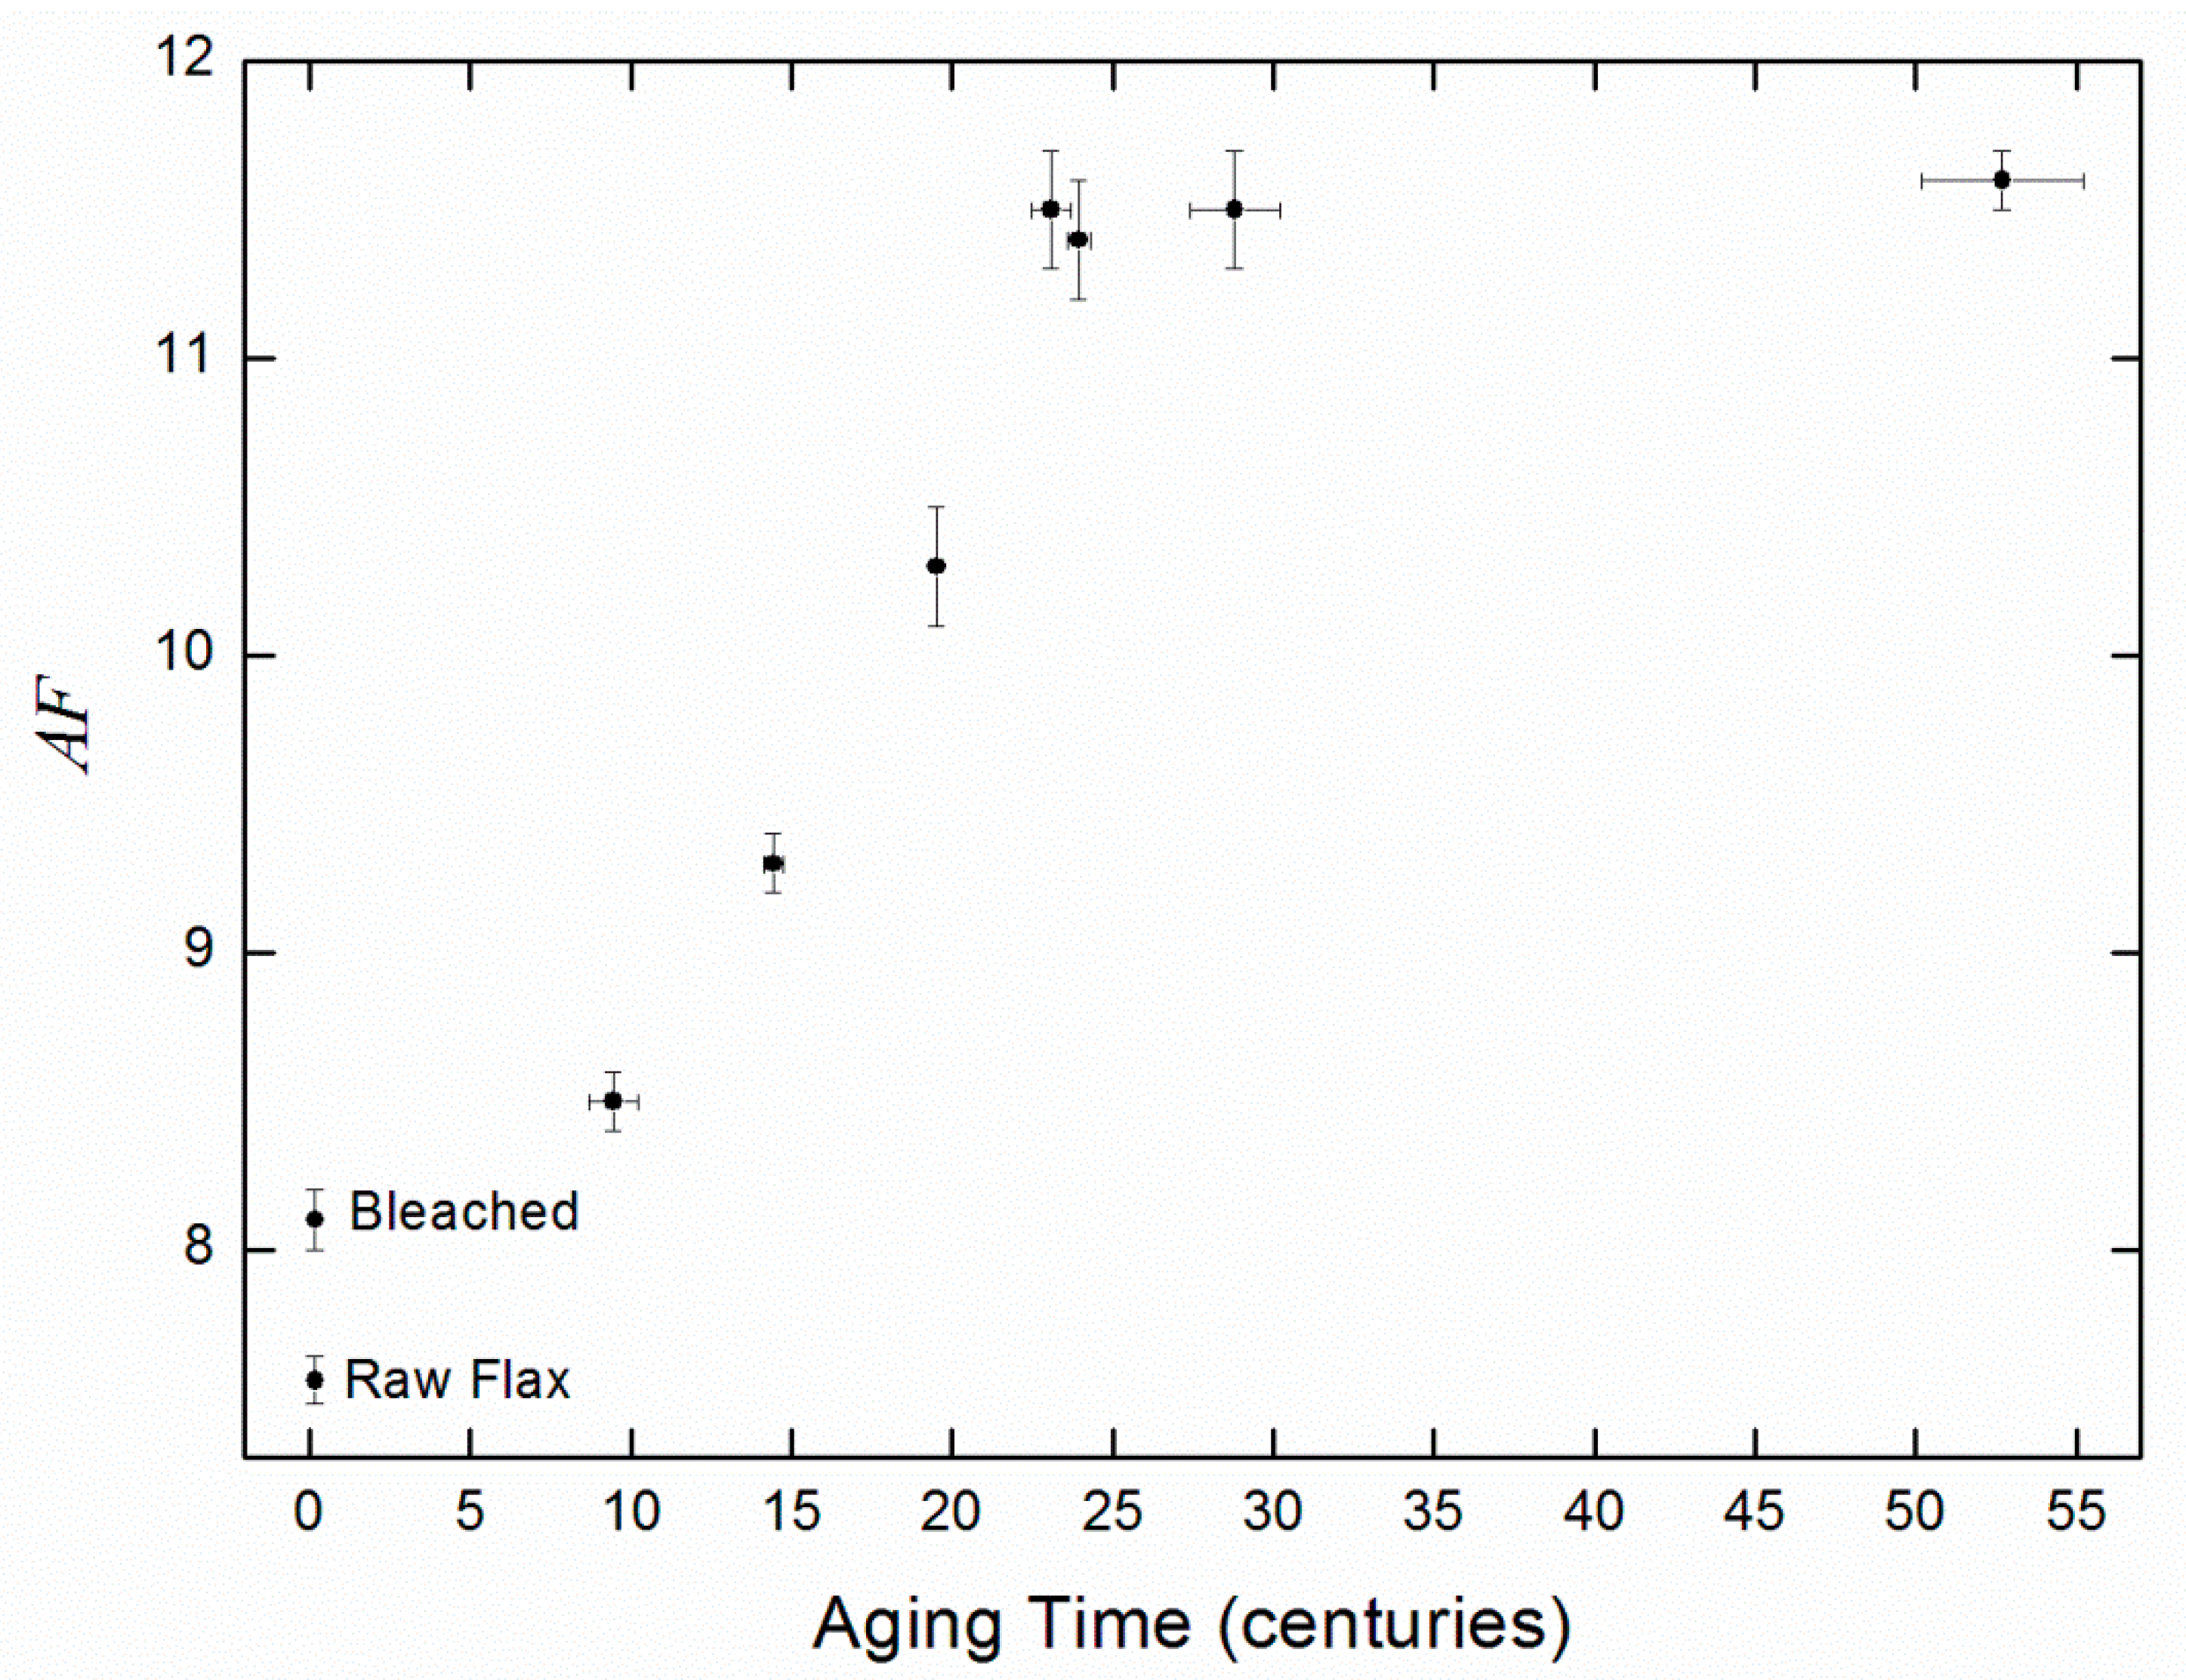
AF values obtained by a single measurement of 1800 s are reported in the last column of Table 1, and plotted in Figure 4. From Figure 4, the almost linear growth of the parameter AF as a function of the aging time estimated by 14C/HR dating up to about 25–30 centuries, after which saturation occurs, is evident. This finding can be related to the evolution equation of CB, reported in Appendix A [3,4], as a function of the aging time t.
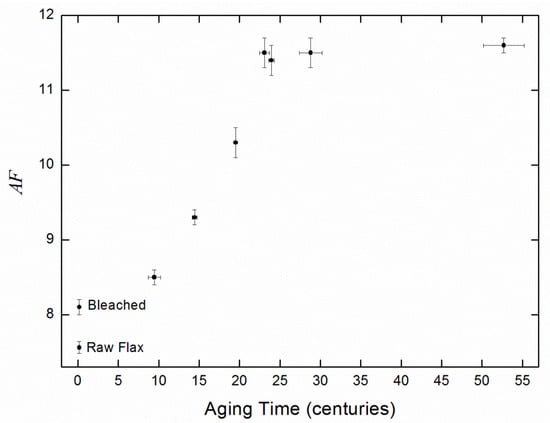
Figure 4.
Aging Factor (AF) values as a function of the 14C/HR dating of the investigated linen threads: Error bars are four standard deviations (−2σ, 2σ).
From Equation (1), it follows that CB(t) is proportional both to DP(t), the degree of polymerization at time t, and to DP(t = 0), the degree of polymerization before the degradation of cellulose. Therefore, we can introduce an aging parameter related to AF − AFmin, a quantity that is proportional to 1/DP(t) − 1/DP(t = 0), where AFmin is the minimum value of the aging factor, corresponding to the maximum value of DP, that is DP(t = 0), without any degradation due to natural aging. This value could be obtained by the contemporary linen sample of raw flax, for which we can put the aging time t = 0 on the scale of centuries. Therefore, AF − AFmin is proportional just to CB(t). Moreover, we have introduced a normalized CBnor in Equation (2) to have an a-dimensional quantity to evaluate natural aging of cellulose.
For the same aim, we can introduce a normalized Aging Parameter (AP) obtained from WAXS measured values, as follows:
where the AFmin is the minimum value corresponding to contemporary raw flax and AFmax is the maximum value obtained for very long aging times.
Given the proportionality of to 1/DP(t) − 1/DP(t = 0), we can consider AP as an experimental evaluation of CBnor obtained by WAXS. Thus, the evolution equation of CBnor can be used to fit the aging parameter AP values derived from AF values determined by the WAXS measurements (see Figure 4) as a function of the aging time t. In this way, we can experimentally determine the DP maximum fractional loss, , and the DP activation energy, , for the natural aging of linen that occurred during very long periods of time at about stationary conditions over a time scale of many centuries. The evaluation of these quantities is a prerequisite to perform an X-ray dating of ancient linen threads. Whenever the fraction of maximum CB, i.e., the CBnor values, can be quantitatively derived by AP, the X-ray aging times obtained can be compared with those obtainable by other dating methods.
5. X-ray Determination of Linen Aging Parameters
The normalized AP values, obtained by applying Equation (7) to the mean of the measured AF values, are reported in Table 2, together with the age of the samples determined by 14C/HR dating. Sample A has been discarded by the analysis because bleaching processes have introduced a nonnatural aging, i.e., an accelerated DP reduction due to the chemical action of oxygen used for the decolorization of the textile [2]. This finding is evident also by our WAXS characterization, which gives an AP value of the bleached thread (sample A) larger than that obtained by the raw flax sample (sample B). Indeed, the oxidative bleaching of the fiber has introduced a number of CB, causing a certain level of structural degradation of the fabric. For further considerations about the action of acid, basic, enzymatic chemical processes on the structural degrade of cellulose, see the Discussion Section.
Table 2.
Age of the samples derived by the 14C/HR dating, normalized aging parameter AP values obtained by the WAXS measurements, and average room temperature (°C) at which the samples have been degraded.
For the reaction rate of the linen DP degradation, usually given in h−1 (denoted in the following as h−1), is reported to be [4]. Natural aging depends on the average room temperature at which cellulose degradation occurs. To evaluate the temperature excursions for longer time periods, we can rely on a detailed analysis of tree rings’ growth [21]. A 100-year spline filter shows that the global mean temperature oscillations in the last two millennia have been contained in a range of ±0.9 °C. The duration of these warmer or cooler periods of large temperature variations has been at most about two centuries. Moreover, a long-term cooling trend of about 0.6 °C has been manifested in the last two millennia, from the beginning of the Christian Era until the beginning of 1900 [21]. The average room temperature of the last century is very similar to that of the Roman period about 2000 years ago. The average room temperature in the last century is available today for many countries [22]. For Egypt, West Bank, and Israel the average temperatures in the last century have been 22.5 °C, 19.4 °C, and 19.5 °C, respectively. Therefore, due to the results reported in weather data banks [22], these values can be considered the average room temperatures of the last two millennia within small variations, indeed, with a reduction of about 0.6 °C in the last two millennia, divided between twenty centuries, leading to 0.03 °C variations per century. The variations of ±0.9 °C with a maximum duration of about two centuries averaged over a longer period of two millennia, as it was applied a 1000-year spline filter to climate data, are equivalent to a fluctuation of about 0.09 °C per century. Therefore, within an indetermination of about ΔTr = 0.1, the temperature of the last century can be considered representative to the last two millennia.
However, local microclimate conditions can cause differences in the average room temperatures of some degrees with respect to average values of the surrounding regions. This happens in the Dead Sea Valley, the deepest depression of the Earth. Two samples—DII (Jericho) and NII (Engedi)—come from this depression. Mean annual temperatures for these localities in a temporal range of some decades are available. For Jericho, we found 21.5 °C [23]. For Engedi, we found a mean annual temperature of 23.9 °C for the years 1982–2012 [24], which should imply about 23.5 °C for the average room temperature in the last century due to the increasing average room temperatures of the last few decades. For Fayyum and Masada, we found about 21.0 °C. In the last column of Table 2, we reported temperatures expressed with an accuracy of 0.5 °C. They can be considered the average values at which the fabrics were aged during the time. Room temperatures in Table 2 have been given in °C, a unit commonly used for meteorological and climate studies. Conversion in Kelvin allows their use in the theoretical formulae of cellulose degradation.
There are no available data about the relative humidity during the last two millennia for all the localities where the considered linen fabrics aged. Nevertheless, the studied samples come from regions with similar climate, semidesert, with an average relative humidity ranging between 50 and 60%. Averaging over many centuries leads to very similar relative humidity values. values between and have been measured for cotton and linen at 90 °C and 50% of relative humidity [4]. An increment of 10% of the relative humidity, from 50% to 60%, causes an increment of about 10% of the cellulose [25]. Therefore, we can put both for cotton and linen at a relative humidity ranging between 50% and 60%, with an error on the value related to an error of about 5% on an average relative humidity value of about .
From Equations (A5) and (A6) reported in Appendix A, since AP values can be considered an experimental evaluation of CBnor obtained by WAXS, a relation between the aging time t and the other quantities involved in the natural degradation process of the cellulose can be obtained:
Through Equation (8), an evaluation of the natural aging time of fabrics’ threads can be calculated directly from the measured AP values and the estimated average room temperatures , given the measured at and estimated the values of and .
To estimate and , we use the experimental data of sample FII, aged at an average room temperature of about 21.0 °C (see Table 2). Its dating has been derived by HR (siege of Masada). The AP values, reported in Table 2, have been determined by the WAXS AF values shown in Figure 4. Let us note the linear dependence of AF and, thus, of AP, if t ranges from 10 to about 20 centuries. Indeed, if we consider also the sample just before of FII, sample D, in particular, if we consider the aging time’s region corresponding to the two samples D and FII, we note a linear growth of the AF values (see Figure 4). Since AP values are proportional to AF values and AP values can be considered an experimental evaluation of CBnor, the linear growth of AF values in the aging time’s region of the D and FII samples will be related to the slope of at half of its maximum value. In Appendix A, we have derived a relation which relates the DP activation energy to this slope (Equation (A10)):
From samples D and FII, we can estimate this slope:
From Equations (9) and (10), we obtain an estimated DP activation energy of kJ/mole, a value that falls in the range of activation energies measured for the degradation of cellulosic materials [25,26]. We can determine also by imposing that Equation (8) leads to 19.55 ± 0.1 centuries as the aging time for the sample FII, of which the dating has been obtained by HR. Our approach has allowed, for the first time to our knowledge, the determination of the factors which affect the natural aging of linen cellulose at room conditions of temperature and humidity, a process which happens very slowly, requiring period of times of many centuries or thousands of years.
6. X-ray Dating
In the previous section, in order to obtain an estimate of the values of and , we have used the HR dating of sample FII together with the evaluation of the slope of at half of its maximum value, obtained by using the 14C dating of sample D. 14C dating values of the other samples DII, NII, E, and HII have not been used. Therefore, they are useful for a reliability check of X-ray dating obtained by Equation (8), based on the WAXS experimental evaluation of CBnor given by AP. Sample LII is not useful for the check of reliability of X-ray dating because it is too ancient and has reached the maximum AP value. In addition, the contemporary sample B is not useful for the check of reliability of X-ray dating because it has not suffered any aging degradation process. In fact, because DP degradation has an asymptotic behavior as a function of t, we can associate a finite aging time value only up to a maximum AP value of 0.99 because, for AP→1, Equation (8) is indeterminate. For this reason, for sample LII, we cannot obtain any X-ray dating, and for AP values very close to 1, the uncertainty interval of the determined aging time is expected to be very large.
The results obtained by Equation (8) and by the measured AP values for , , and = kJ/mole have been summarized in Table 3. The time intervals reported in the last column of Table 3 should correspond to a 95% level of confidence. The larger 95% right confidence levels of samples NII and HII with respect to the left-hand values are due to the saturation of the CBnor curve towards 1 for large aging times. Indeed, these two samples are both characterized by very large AP values of about 0.98, and the width of their +2σ uncertainty interval (right-hand value) is about 70% larger than the −2σ interval (left-hand value). Further statistical insight about this point will be discussed in Appendix B.
Table 3.
Comparison of 14C/HR dating and X-ray dating obtained by Equation (8).
The comparison with the dating of the fabrics obtained by 14C confirms that the X-ray dating reported in Table 3 could be a valid and reliable new method to estimate the time when ancient fabrics, which have suffered natural aging, were made because any information about the dating of samples DII, NII, E, and HII has not been used to perform the corresponding X-ray dating. In fact, the obtained X-ray dating can be considered conditioned almost totally by the HR dating of sample FII and almost completely independent by the 14C dating of the other samples. Indeed, the estimate of the slope of the curve, i.e., of the fraction of maximum CB, at half of its maximum is partially dependent only on the 14C dating of sample D. In the third column of Table 3, for X-ray aging times, we show in parentheses the [−2σ,2σ] interval which, for older samples, is not symmetric with respect to the median value due to saturation effects in the decreasing degree of polymerization of cellulose, which seems to stop after several thousands of years. For details about the 14C date ranges reported in the third column of Table 1, one can refers to previous works [13,15]. To facilitate the comparison with the X-ray dating results, the 14C dating values reported in the second column of Table 3 have been obtained by expressing the data ranges of the third column of Table 1 as a median value with a [−2σ,2σ] interval. However, it should be noted that, due to the non-monotonic nature of the 14C calibration curve, 14C dating very often leads to the impossibility to summarize the data range interval as a median value with symmetric left and right 95% confidence level limits, since the calculated age distribution can be also bi- or trimodal. Therefore, the 14C aging time median values reported in Table 3 have to be considered only as equivalent values to allow a direct comparison with the X-ray corresponding dating values.
Figure 5 summarizes the results reported in Table 3 and shows the effect of the average room temperature on the increment of CB in the natural aging of linen threads. In Appendix B, the relationships between 14C and X-ray dating have been further analysed by a suitable statistical analysis of data.
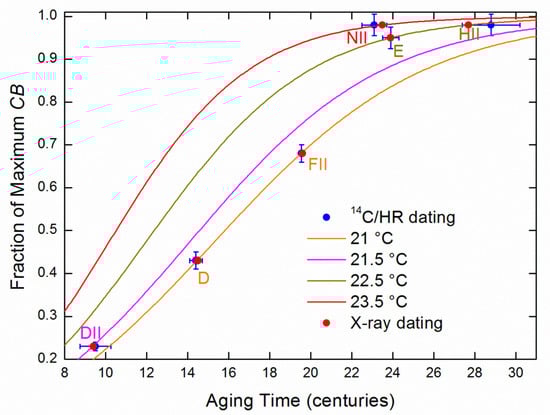
Figure 5.
Comparison between 14C/HR and X-ray dating: CBnor curves corresponding to the different average room temperatures of the samples have been plotted with different colors. Error bars (blue) correspond to the 14C/HR dating (blue circles). Error Bars of X-ray dating (red circles) have not been shown for clarity.
7. Discussion
Our analysis has shown that ancient linen threads that have suffered natural aging due to the oxidative, photochemical, and hydrolytic actions at room temperature and humidity over very long period of times of many centuries can be dated by WAXS characterization of the structural degradation of the cellulose fibers. The X-ray dating results are in agreement with the 14C dating. Additionally, the measurements are not destructive. These findings allow comparison of different dating methods on the same piece of textile, if needed.
The method does not need any sample preparation, requires just a few hours of measurements, and costs a few hundreds of euros to realize the whole X-ray characterization and data analysis of a single sample. Exploiting table-top X-ray micro-sources, dating of a textile sample can be performed also on a submillimeter area, e.g., 0.2 × 0.5 mm2. However, this possibility is based on the assumption that the ancient textile fabric is homogeneous in its physical/chemical/structural characteristics, i.e., the analyzed small thread is representative of the full textile. This important assumption is critical for other dating methods too. For example, in some cases, 14C dating of textile fabrics suffers from the impossibility to eliminate all textile carbon contaminants through the standard procedure of sample cleaning, thus leading to possible wrong dating [16]. Therefore, the possibility to perform dating of a textile by using complementary sources of information could be very useful to solve eventual doubtful cases.
Our WAXS measurements indicate that even an approximated but rapid evaluation of the degree of crystallinity of the analyzed sample can allow the selection of ancient threads that most probably have suffered only natural aging over the centuries. These threads are characterized by a higher crystallinity than through other causes of aging (enzymatic and acid/alkaline agents) which accelerate the degradation of the textile with respect to natural aging at room temperature and humidity.
The proposed approach applied to linen threads can be generalized to any textile fabrics. The analyzed threads should be made by the same kind of natural fibers. Indeed, fabrics and paper made by other textile fibers (cotton, hemp, jute, kozo, etc.) could be characterized by DP parameters and activation energy values that can be different from linen. Therefore, if one considers a textile different from linen to predict its age by means of the theoretical formula given by Equation (8) and a WAXS characterization of its threads, the following quantities have to be either experimentally determined or known: ; ; and . However, cotton and linen seem to be characterized by very similar reaction rates, measured with accelerated aging in oven experiments. Therefore, when applying the new dating method to ancient cotton threads, only the DP fractional loss and the DP activation energy for natural aging processes, which last many centuries, need to be determined. Finally, to determine unknown experimental quantities which affect cellulose degradation, such as the DP activation energy involved in natural aging of the textile, another ancient sample of the same textile of which dating is known from other reliable sources (e.g., 14C/HR dating) should be available.
In summary, our results have shown that the independent X-ray dating of four ancient linen threads is in agreement with the corresponding 14C dating. This result shows that 14C and X-ray methods, if necessary, could be used together to increase the reliability of dating measurements in order to determine the possible presence of either inhomogeneity or impurity in the sample, which could affect the dating resulting by a specific method. The agreement obtained among 14C and X-ray dating has been also quantitatively analysed by a novel statistical analysis of the data (see Appendix B), showing that the two methods of estimating the aging time are compatible within the experimental uncertainties for the linen samples analyzed here.
8. Conclusions
We propose a novel method for X-ray dating of textiles in which cellulose degradation is due to natural aging, i.e., to thermal, oxidative, hydrolytic, and photochemical processes at room temperature and humidity conditions. In particular, with this approach, we have experimentally determined by means of a WAXS characterization of some threads the DP maximum fractional loss and the DP activation energy for the natural aging of linen. Natural aging is a degradation process of cellulose, which very slowly reduces the degree of polymerization, DP, requiring many centuries or thousands of years to reach saturation.
The method is not destructive, giving the possibility to analyze the same sample with other experimental techniques. The preliminary results discussed in the paper show that the proposed X-ray approach could be considered to yield novel, independent, and complementary information available to integrate and compare with already existing dating methods on ancient textile fabrics. Further studies will help to clarify the potentiality of the new X-ray dating method proposed here. In particular, the effects of mordant, dyes, and ancient beating procedures of extraction of the textile fibers could, in principle, affect the initial values or the time evolution of the degree of polymerization of cellulose. Specific studies on these topics would allow the clarification of the limits of applicability of this new proposed dating method of ancient textile fabrics.
Author Contributions
All authors have contributed to writing the paper and discussing the results. L.D.C. developed the theory. G.F. furnished the samples. L.D.C., F.S., G.F., C.G. and T.S. analyzed the data. T.S. and R.L. performed WAXS measurements. E.M. developed the statistical analysis.
Funding
This research did not receive any specific grant from funding agencies in public, commercial, or not-for-profit sectors.
Acknowledgments
Ulf Olsson from Lund University, Chemistry Department is acknowledged for critical reading of the manuscript.
Conflicts of Interest
The authors declare no conflict of interest.
Appendix A. Evolution Equation of Chain Breaks in Cellulose
The DP fractional loss can be estimated as:
where is the accumulated loss at time t compared to the initial value is the DP maximum fractional loss; and is the reaction rate of the degradation. Measures of loss for linen as a function of time are reported at 90 °C temperature and 50% relative humidity [3]: .
The Chain Breaks (CB) for linen, in mmol/100 g of cellulose, can be estimated by the degradation [4]:
From Equations (A1) and (A2), we get the following:
We define a normalized CB value with respect to its maximum value obtained for very long aging times: . After some straightforward calculations, from Equation (A3), the normalized CB value can be written as follows:
In Equation (A4), the dependence on the temperature T has been reported explicitly. For , one obtains . For , one obtains .
The effect of the high oven temperature used to measure [4] is to accelerate the degradation of cellulose with respect to the natural aging at room temperature. The value at room temperature is related to the reaction rate of the degradation at 90 °C by an Arrhenius shift factor [2], depending on the activation energy [3]:
where is the DP activation energy; is oven absolute temperature [4]; is average absolute room temperature during the centuries at which the linen fabrics have been aged; and R is the gas constant (8.314 J/mol/K).
By inserting Equation (A5) into Equation (A4), we finally obtain an equation to fit the normalized AP experimental values reported in the Results section:
Equation (A6) is dependent only on two free parameters, and , once the average room temperature has been decided.
From the time derivative of Equation (A6), we obtain the following:
When is close to 0.5, from Equation (A7), we obtain
Now, let us consider that, for natural aging of thousands of years, is quite close to one. Indeed, after 4000 h in an oven at 90 °C, the measured DP values for linen decrease from an initial value of 9600 down to 900 [3], implying that, for natural aging of thousands of years, should be greater than . Moreover, should be less than 1.0, corresponding to DP, which goes to zero. Thus, putting in Equation (A8), we have
Inserting Equation (A9) into the definition of the Arrhenius shift factor , given by Equation (A5), we can relate the DP activation energy to this slope:
Appendix B. Noise-to-Signal Ratio Statistical Analysis of the X-ray Dating
In this section, we analyze the robustness of the X-ray prediction of the aging times calculated from Equation (8). This deeper study can be done with the theory of regression because the best relationship between the X-ray aging time and the 14C aging time should be linear before saturation occurs, and a novel analysis of its results considers a suitable “noise” and a noise-to-signal ratio and its geometrical representation. We first consider the prediction of the 14C data from the X-ray and then the opposite. We exclude by the following analysis sample FII, characterized by a HR dating, because it has been used to calculate linen aging quantities used in the X-ray dating.
Let be the X-ray aging time reported in the third column of Table 3, and let be the central/median value of 14C aging time reported in the second column of Table 3.
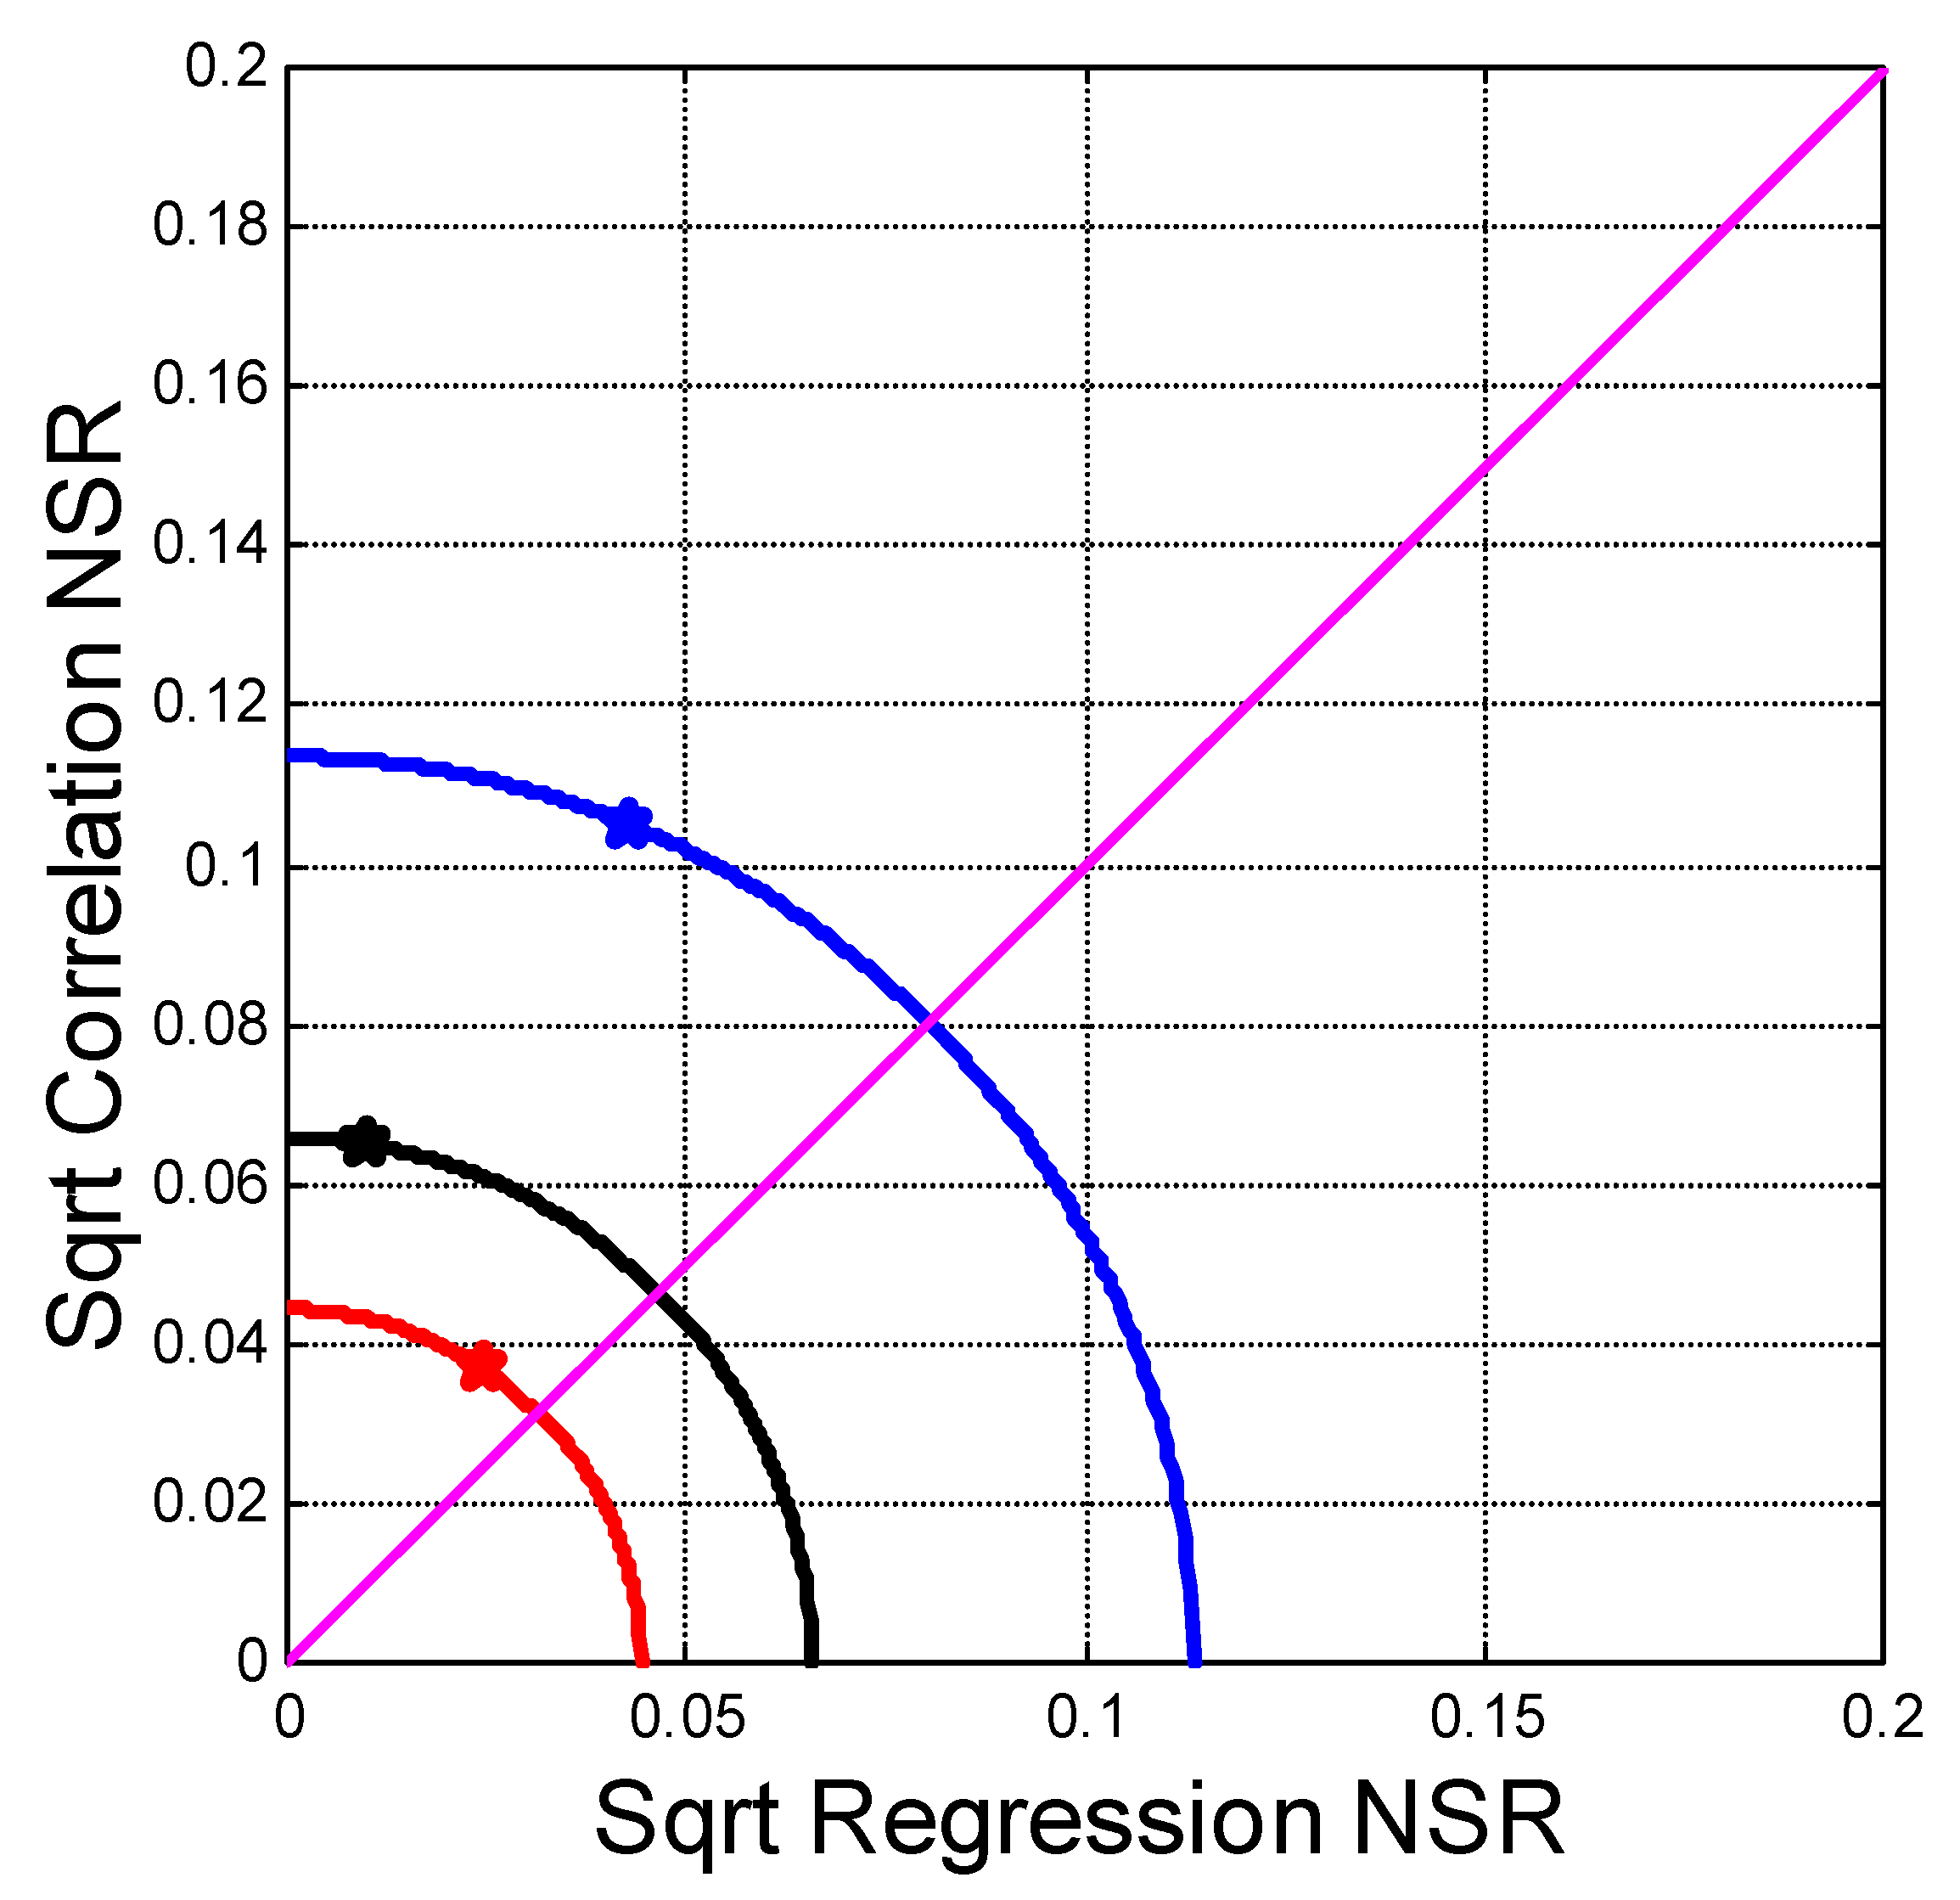
Figure A1 shows the three scatter plots and their best-fit regression lines between (i) the central values of vs. ; (ii) the +2 standard deviations bound (2σ) of vs. ; and (iii) the −2 standard deviation (−2σ) bound of vs. . We notice that a regression line fits the data very well. We propose to estimate the robustness of the linear regression lines between and obtainable from Table 3 by using a suitable noise-to-signal ratio (NSR) and its geometrical representation, the latter borrowed from the optimum design of deep-space 2-hop radio links [27].
Two variables, and , linked by a regression line where is the slope, are perfectly correlated if and are not biased if in other words, if the regression line is (45° line, ) and all values lie along the line (). For the central value of Figure A1 (black line), and . If one or both of these conditions are not met, we can take the differences between the actual regression line—with and —and the ideal line as “noise”. Defining the variances of and as and , the variance (power) of the noise due to (regression noise) is given by the following [28]:
The power of the noise due to all the values not lying along the line is given by the following:
Therefore, the total noise-to-signal ratio is given by the sum of the two unconnected single ratios:
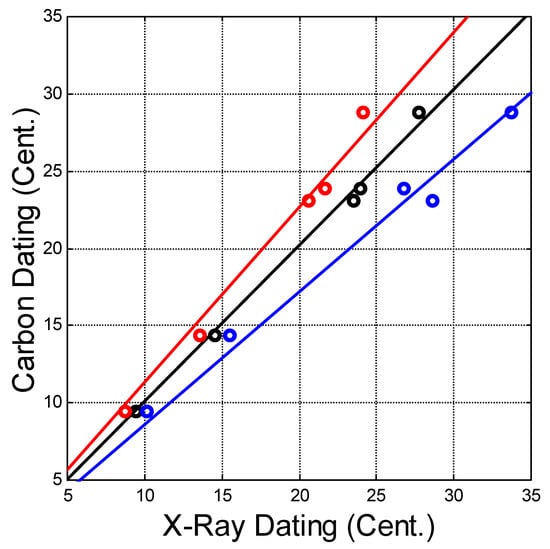
Figure A1.
Scatter plots and their best-fit regression lines between (i) the central values of vs. (black); (ii) the +2σ values of vs. (blue); and (iii) the −2 of vs. (red).
Figure A1.
Scatter plots and their best-fit regression lines between (i) the central values of vs. (black); (ii) the +2σ values of vs. (blue); and (iii) the −2 of vs. (red).
Because Equation (A13) can be written as follows:
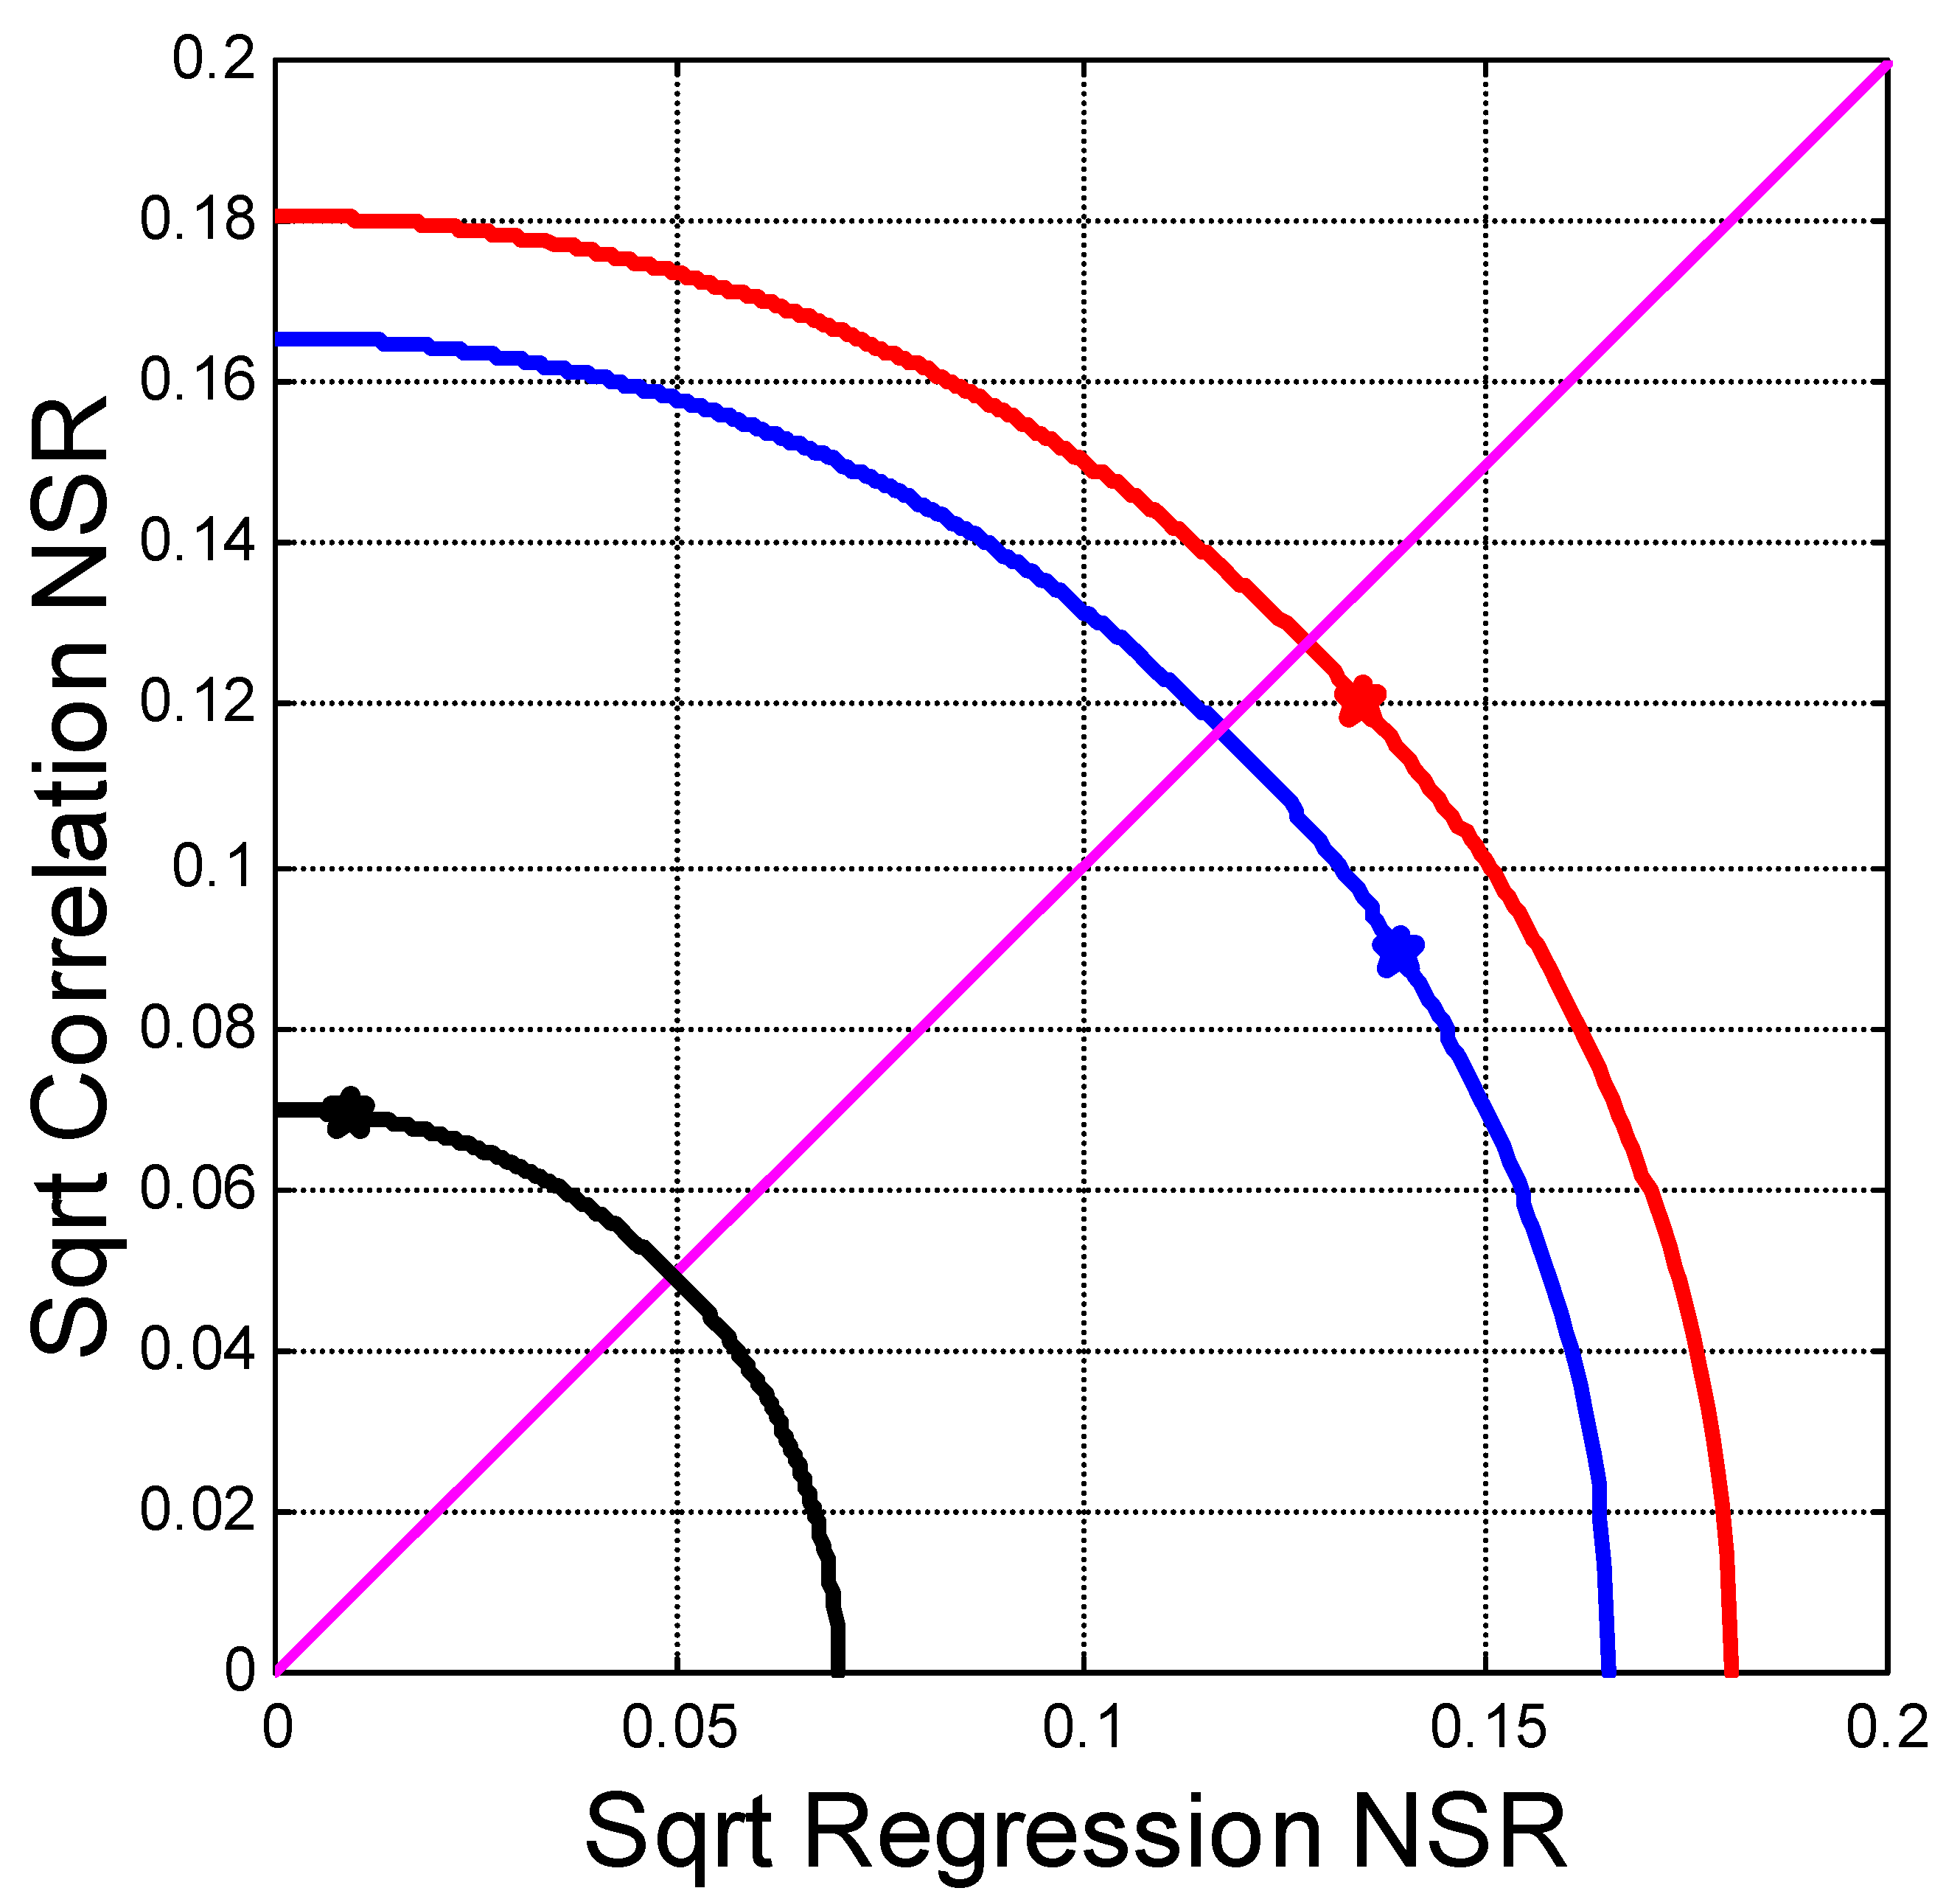
Equation (A13) graphically describes a circle with radius [27]. Therefore, in the first Cartesian quadrant, and for a constant lie in a quarter of a circle, as shown in Figure A2 for the three cases of the variable . All values inside the circle with radius have . The origin has ; therefore, and . The reciprocal of is the signal-to-noise ratio, , which becomes infinite at the origin. As discussed in Reference [27], among other features not of interest here, the NSR allows a graphical representation that clearly shows how the partial and contribute to the total NSR.
Figure A2 shows the results obtained using the central values of the X-ray aging time and the 95% bounds (−2σ, 2σ) reported in Table 3: (i) only for the central values the NSR is dominated by because ; (ii) the central values of Table 3 give the lowest (highest) NSR (SNR), while the ±2σ values gives similar and markedly larger NSRs. For the central value, the slope is in practice 1 (i.e., a 45° line); therefore, , as Figure A2 shows.

Figure A2.
From X-ray to 14C measurements: Square root of the noise-to-signal ratio (NSR) as a function of the square root of the regression (abscissa) taken as the absolute value and the square root of the correlation (ordinate): The black line is the central values of column 3 in Table 3. The blue line is +2σ. The red line is −2σ. The 45° line shows where .
The point which graphically represents the central value NSR on the black circle in the first Cartesian quadrant is very close to the vertical axis. Conversely, the ±2σ NSRs are dominated by . This finding is related to the saturation with the aging time of the natural degradation of cellulose towards the maximum allowed values, which causes an increase of the uncertainty interval as a function of CBnor. The different widths of +2σ and −2σ uncertainty intervals for large CBnor values close to 0.98 have the same origin. The association of an asymmetric −2σ,+wσ uncertainty interval at the central value, with w < 2, in case of very large aging times (CBnor close to 0.98) would partially reduce the effect of CBnor saturation on the statistical noise which, in these cases, is dominated by . In any case, the central values of the X-ray dating minimizes the NSR and is practically not polarized, with a negligible because . Therefore, it gives an accurate estimate of the aging time, at least in terms of comparison with the 14C dating.
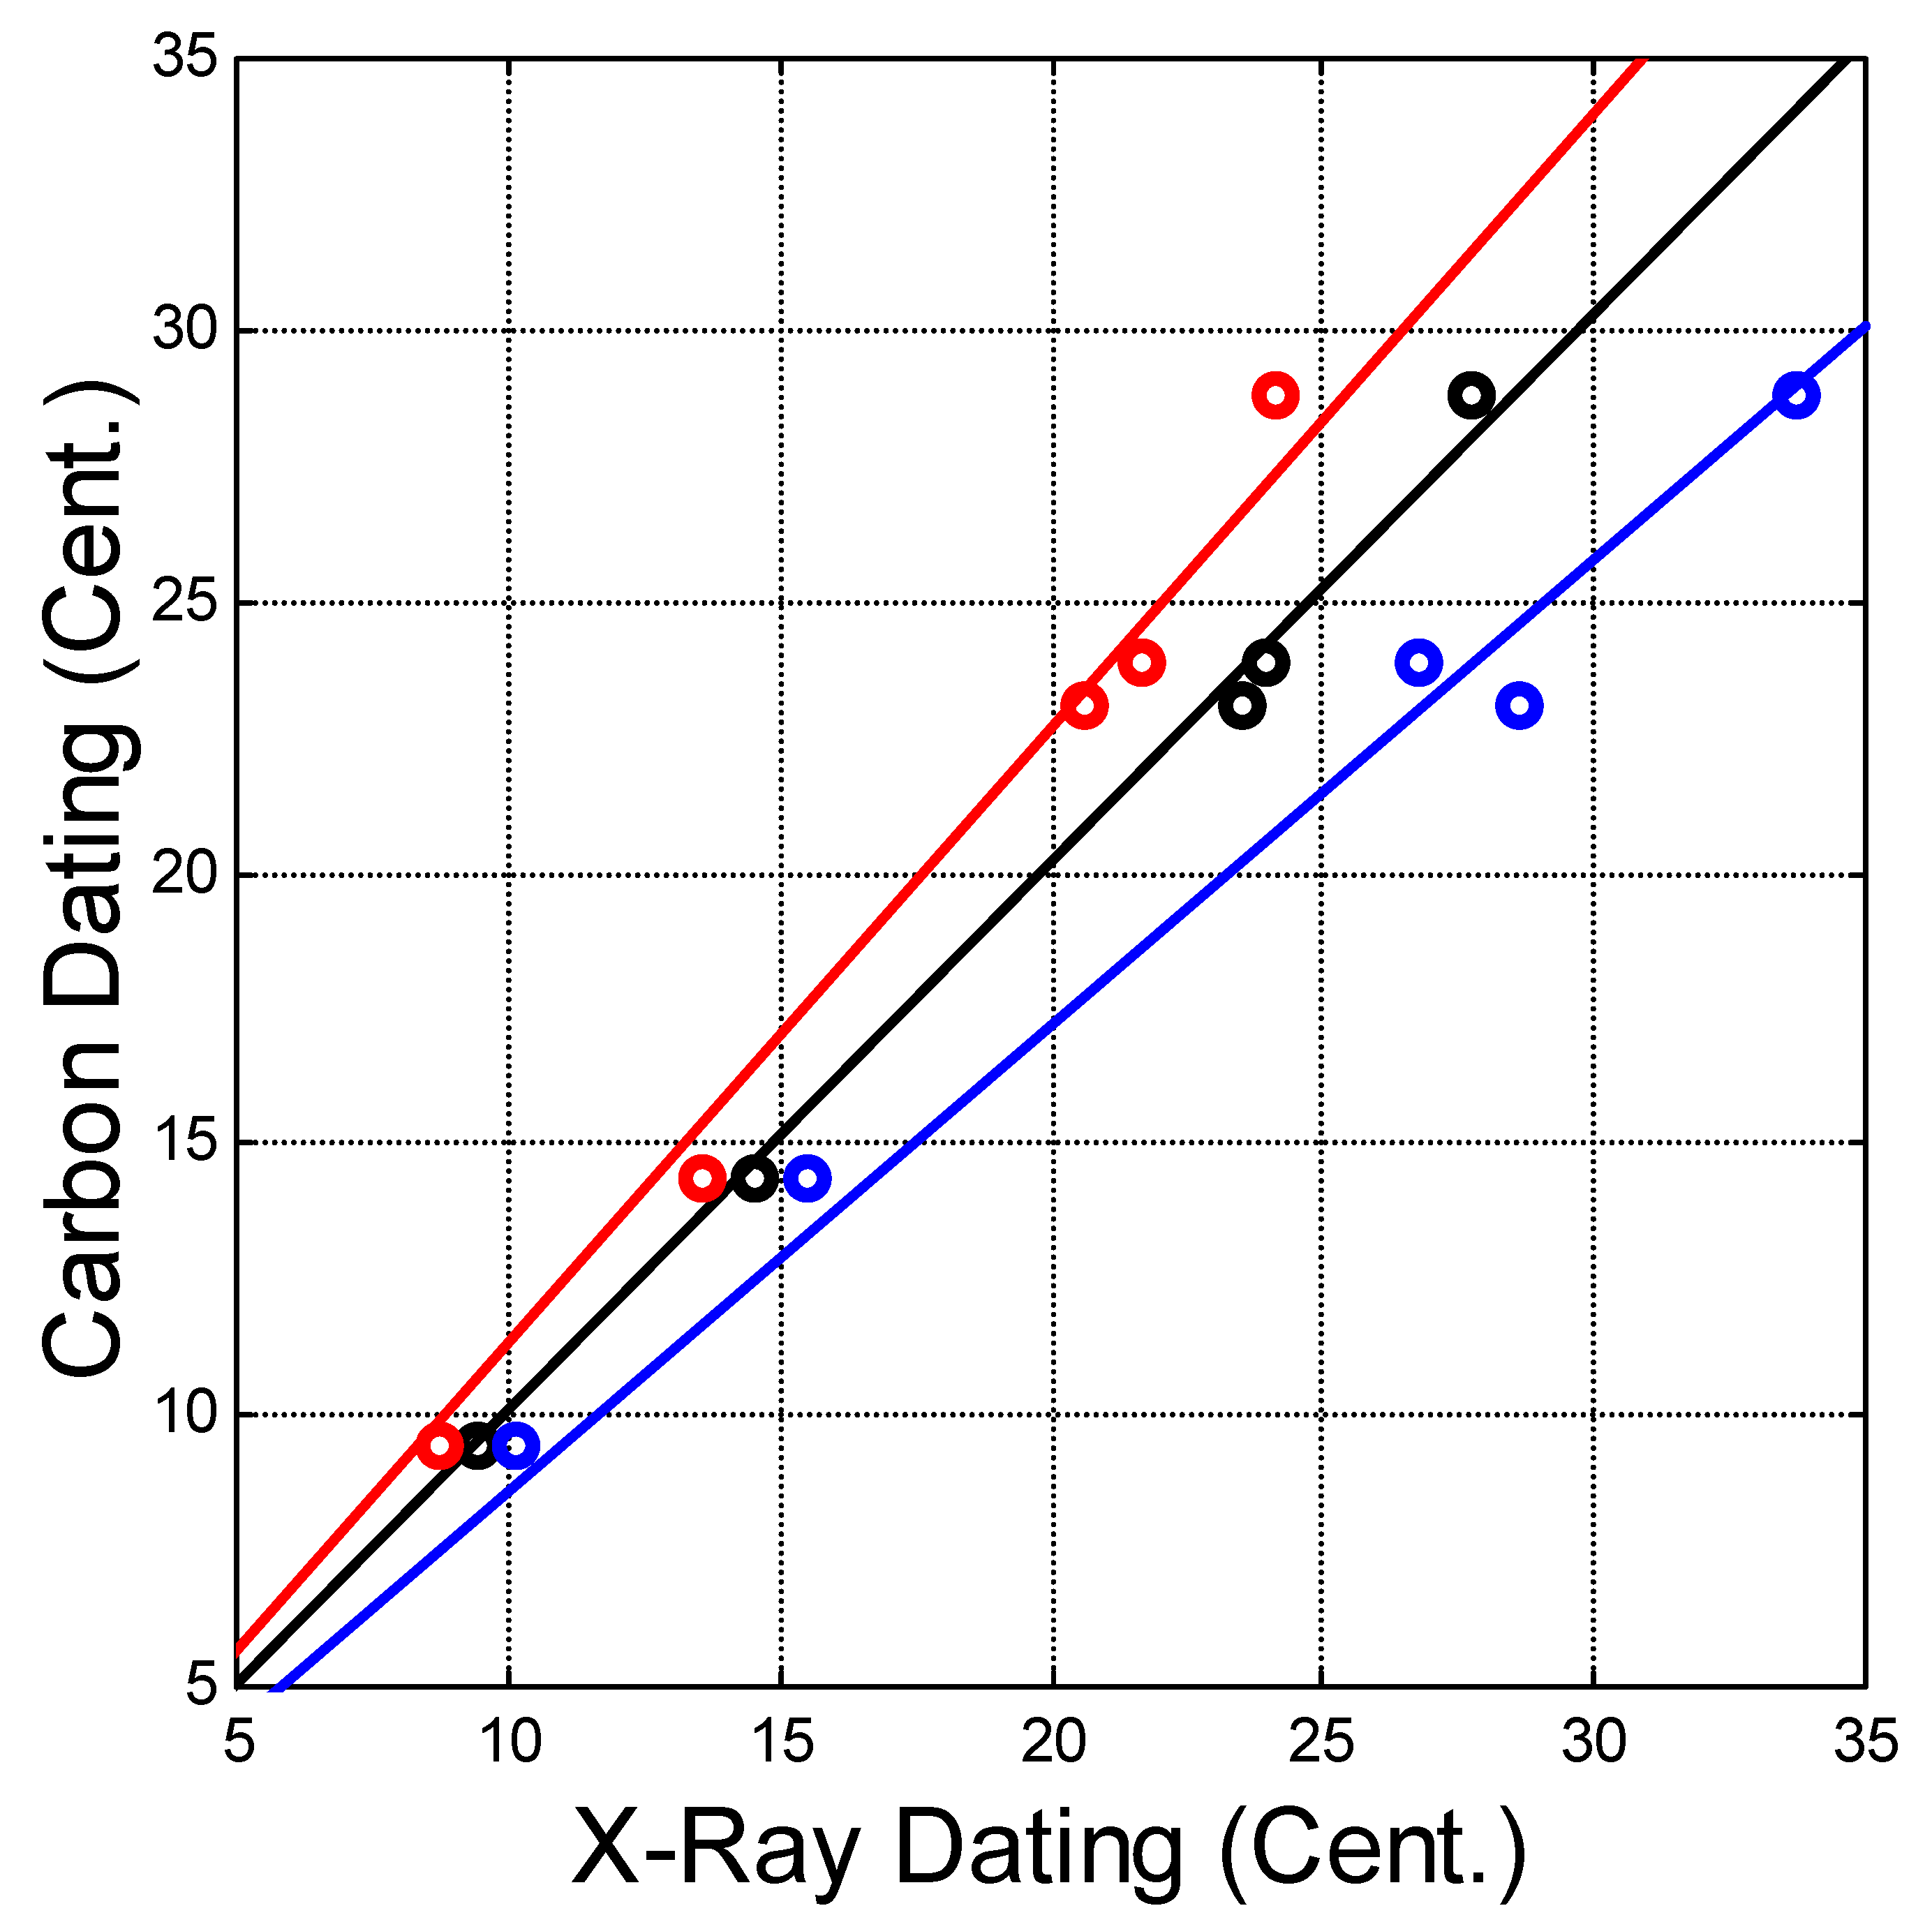
Now, let us consider the results the prediction of the X-ray aging time from the 14C data of Table 3. Figure A3 shows the regression lines fitted to the data, while Figure A4 reports the NSR Cartesian quadrant. The 14C data are less scattered around the central values, as Table 3 reports and Figure A3 clearly shows in the estimate of the X-ray prediction bounds.

Figure A3.
Scatter plots and their best-fit regression lines between: (i) the central values (black); (ii) the +2σ values (blue); and (iii) the −2σ values (red).
Figure A3.
Scatter plots and their best-fit regression lines between: (i) the central values (black); (ii) the +2σ values (blue); and (iii) the −2σ values (red).
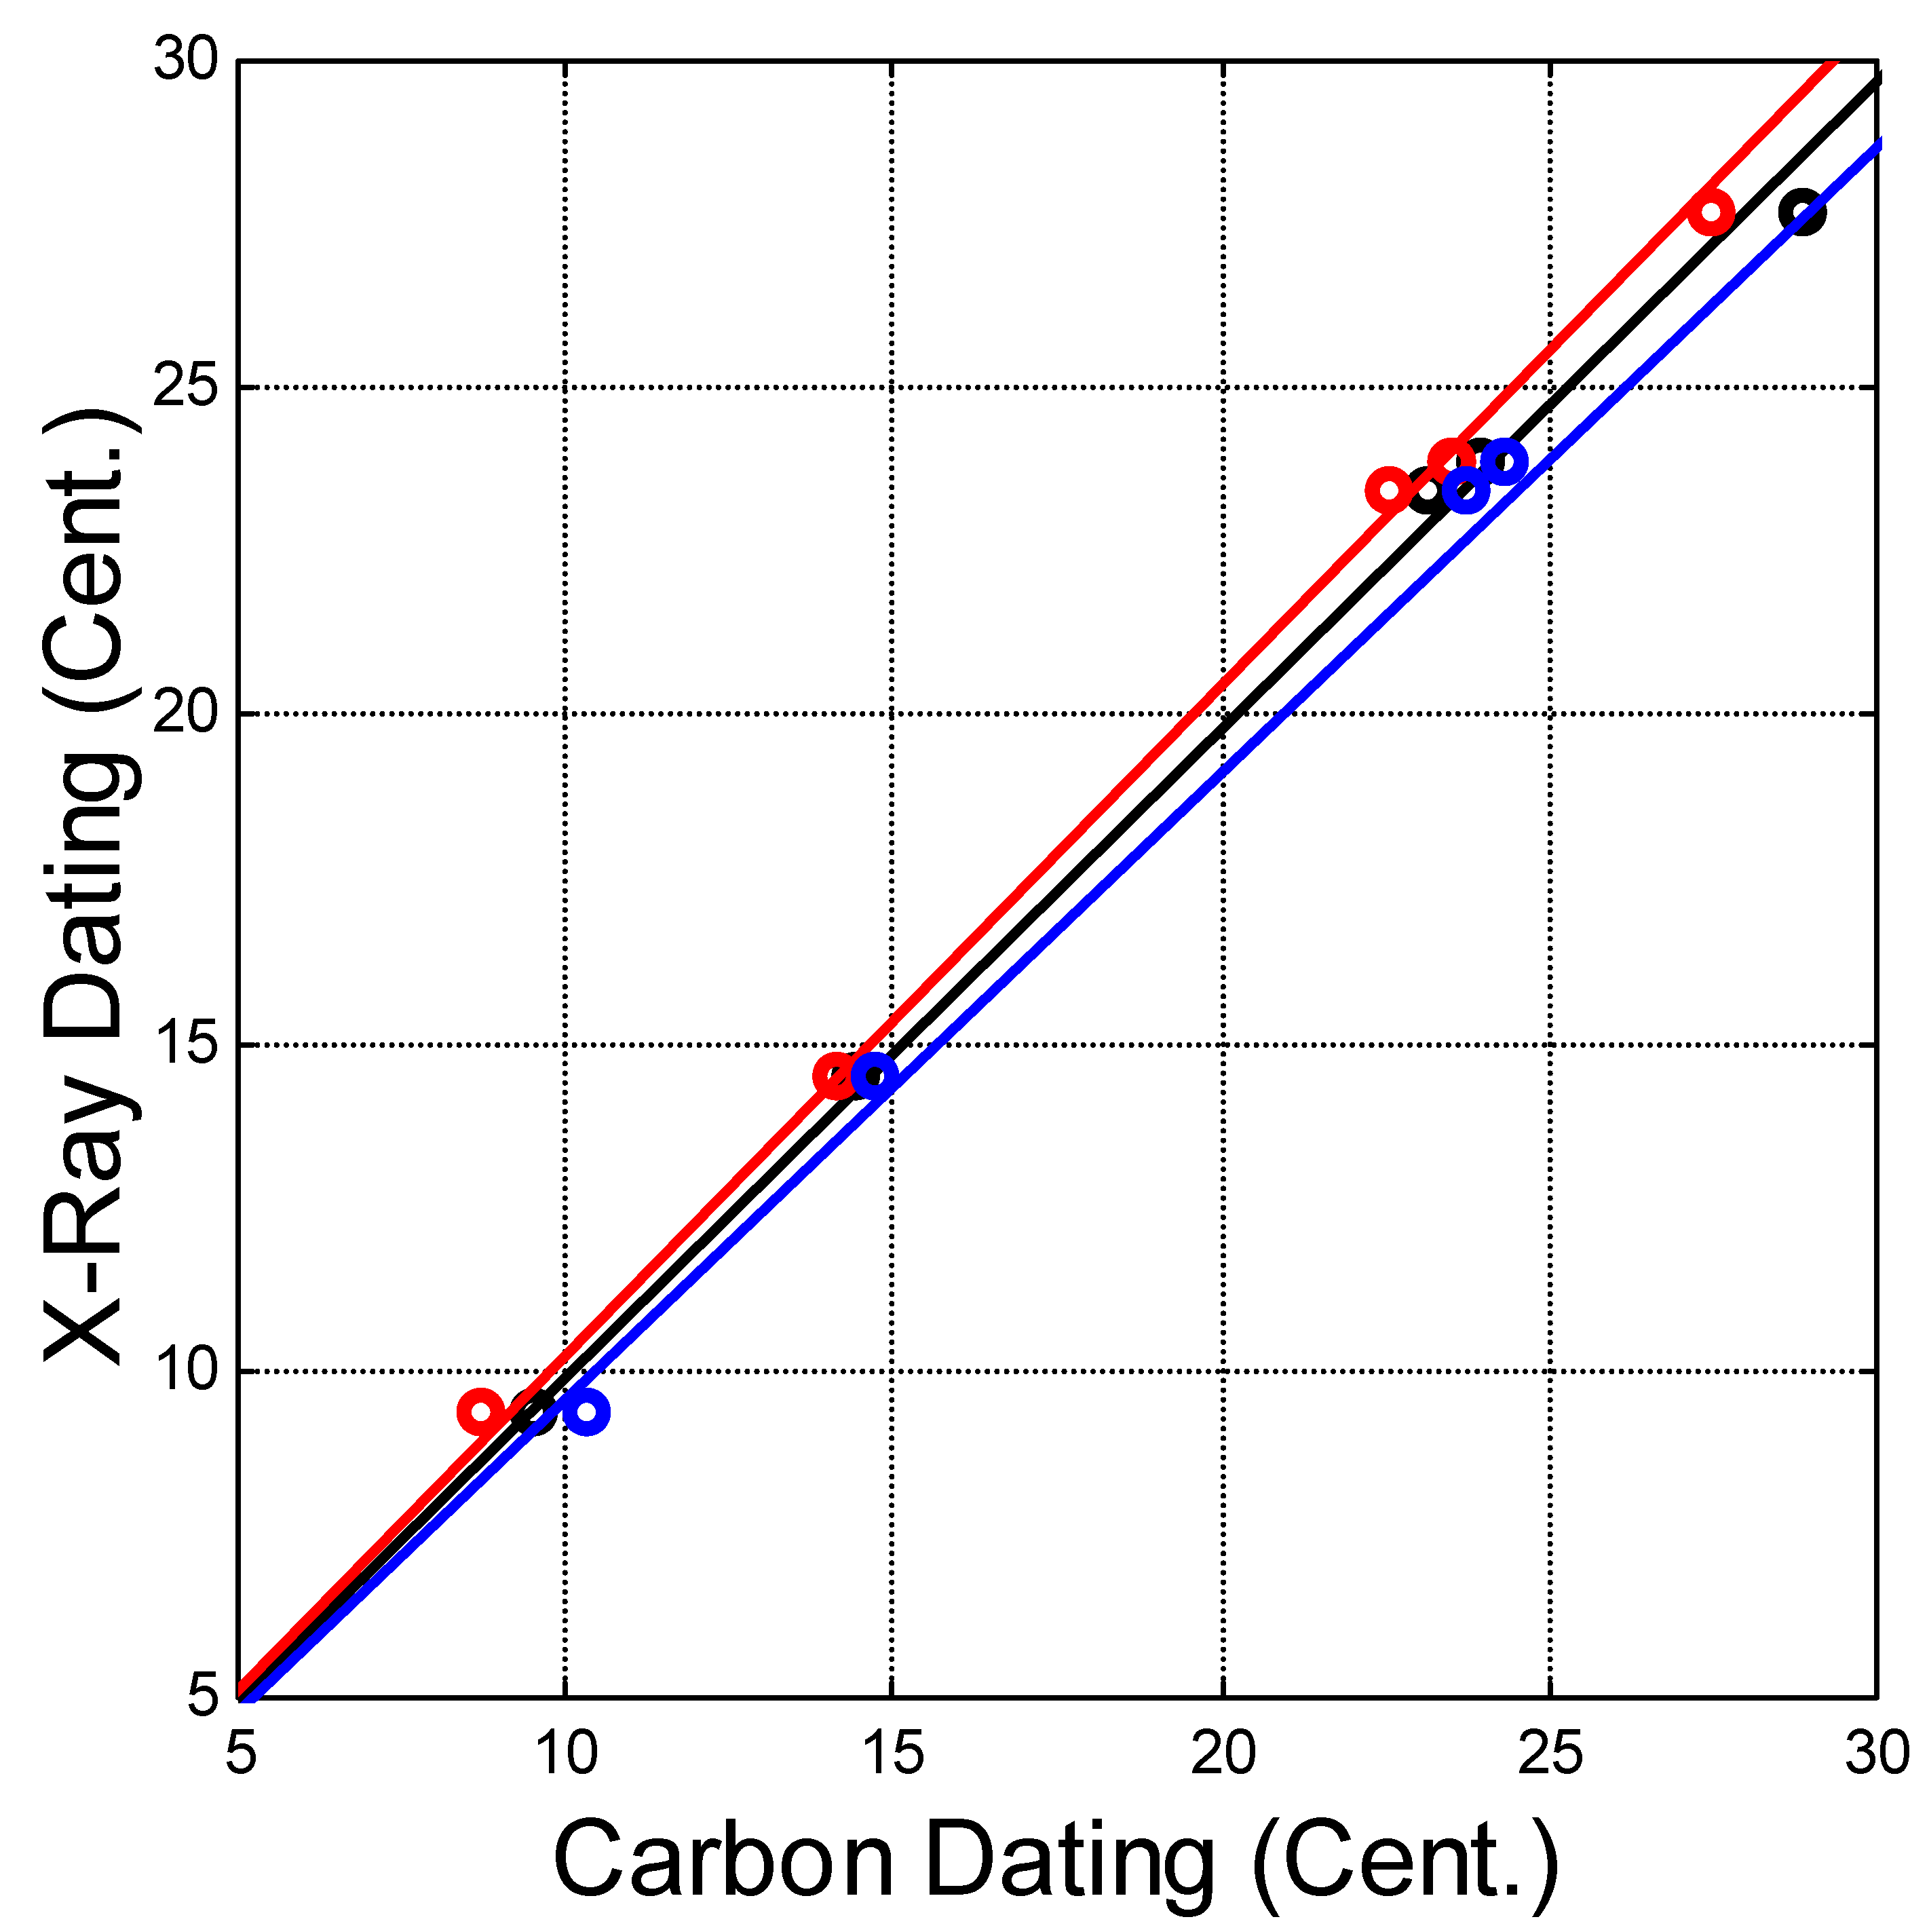
We can now see that the central values give the same NSR of Figure A2. This means that the prediction works with the same precision in both directions. Moreover, contrarily to Figure A2, the three NSRs in Figure A4 are dominated by ; therefore, there is not a large polarization of the statistics as is the case with the +2σ and −2σ bounds reported in Figure A3. Therefore, if we consider the central values of Table 3, we can state that the two methods of estimating the aging time, namely the 14C and the X-ray, are practically indistinguishable. If we consider ±2σ bounds, the X-ray dating can be affected by statistical polarization for large CBnor values close to 1 due to the saturation of the cellulose degradation for large aging times. This finding leads to reliable X-ray dating only when the linen fabrics have suffered a natural aging at an average room temperature of 21–23 °C for not more than 25–30 centuries. For smaller average room temperatures, linen fabrics also older than 25–30 centuries could be reliably dated by the proposed X-ray method.

Figure A4.
From 14C to X-ray measurements: Square root of the noise-to-signal ratio (NSR) as a function of the square root of the regression (abscissa) taken as the absolute value and the square root of the correlation (ordinate): The black line is the central values of column 2 in Table 3. The blue line is +2σ. The red line is −2σ. The 45° line shows where .
References
- Cybulska, M.; Maik, J. Archaelogical Textiles—A need for new methods of analysis and reconstruction. Fibers Text. East. Eur. 2007, 15, 64–65. [Google Scholar]
- Potthast, A.; Rosenau, T.; Kosma, P. Analysis of Oxidized Functionalities in Cellulose. Adv. Polym. Sci. 2006, 205, 1–48. [Google Scholar] [CrossRef]
- Ding, H.Z.; Wang, Z.D. On the degradation evolution equation of cellulose. Cellulose 2008, 15, 205–224. [Google Scholar] [CrossRef]
- Stephens, C.H.; Whitmore, P.M. Comparison of the degradation behaviour of cotton, linen, and kozo papers. Cellulose 2013, 20, 1099–1108. [Google Scholar] [CrossRef]
- Takacs, E.; Wojnarovits, L.; Földvary, C.; Borsa, J.; Sajo, I. Effect of combined gamma-irradiation and alkali treatment on cotton–cellulose. Radiat. Phys. Chem. 2000, 57, 399–403. [Google Scholar] [CrossRef]
- Feller, R.L.; Lee, S.B.; Bogaard, J. The kinetics of cellulose deterioration. Adv. Chem. Ser. 1986, 212, 329–347. [Google Scholar] [CrossRef]
- Bouchard, J.; Overend, R.P.; Chornet, E.; Van Calsteren, M.-R.J. Mechanism of dilute acid hydrolysis of cellulose accounting for its degradation in the solid state. Wood Chem. Technol. 1992, 12, 335–354. [Google Scholar] [CrossRef]
- Calvini, P. The Influence of Levelling-off Degree of Polymerisation on the Kinetics of Cellulose Degradation. Cellulose 2005, 12, 445–447. [Google Scholar] [CrossRef]
- Whitmore, P.; Bogaard, J. Determination of the Cellulose Scission Route in the Hydrolytic and Oxidative Degradation of Paper. Restaurator 1994, 15, 26–45. [Google Scholar] [CrossRef]
- Whitmore, P.; Bogaard, J. The Effect of Oxidation on the Subsequent Oven Aging of Filter Paper. Restaurator 1995, 16, 10–30. [Google Scholar] [CrossRef]
- Kolar, J. Mechanism of Autoxidative Degradation of Cellulose. Restaurator 1997, 18, 163–176. [Google Scholar] [CrossRef]
- Margutti, G.; Conio, G.; Calvini, P.; Pedemont, E. Hydrolytic and Oxidative Degradation of Paper. Restaurator 2001, 22, 67–83. [Google Scholar] [CrossRef]
- Fanti, G.; Baraldi, P.; Basso, R.; Tinti, A. Non-destructive dating of ancient flax textiles by means of vibrational spectroscopy. Vib. Spectrosc. 2013, 67, 61–70. [Google Scholar] [CrossRef]
- Baraldi, P.; Tinti, A. Molecular spectroscopy as an alternative for dating textiles. MATEC Web Conf. 2015, 36, 01002. [Google Scholar] [CrossRef]
- Fanti, G.; Malfi, P.; Crosilla, F. Mechanical and opto-chemical dating of the Turin Shroud. MATEC Web Conf. 2015, 36, 01001. [Google Scholar] [CrossRef]
- Taylor, R.E. Radiocarbon Dating—An Archeological Perspective; Academic Press, Harcount Brace Jovanovich Publishers: Orlando, FL, USA, 1987; ISBN 0-12-684860-2. [Google Scholar]
- Kim, U.J.; Kuga, S.; Wada, M.; Okano, T.; Kondo, T. Periodate oxidation of crystalline cellulose. Biomacromolecules 2000, 1, 488–492. [Google Scholar] [CrossRef] [PubMed]
- Fernandes, A.N.; Thomas, L.H.; Altaner, C.M.; Callow, P.; Forsyth, V.T.; Apperley, D.C.; Kennedy, C.J.; Jarvis, M.C. Nanostructure of cellulose microfibrils in spruce wood. Proc. Natl. Acad. Sci. USA 2011, 108, 1195–1203. [Google Scholar] [CrossRef]
- Segal, L.; Creely, J.J.; Martin, A.E.; Conrad, C.M. An empirical method for estimating the degree of crystallinity of native cellulose using the x-ray diffractometer. Text. Res. J. 1962, 29, 786–794. [Google Scholar] [CrossRef]
- Park, S.; Baker, J.O.; Himmel, M.E.; Parilla, P.A.; Johnson, D.K. Cellulose Crystallinity Index: Measurement Techniques and Their Impact on Interpreting Cellulase Performance. Biotechnol. Biofuels 2010, 3, 10. [Google Scholar] [CrossRef]
- Esper, J.; Frank, D.C.; Timonen, M.; Zorita, E.; Wilson, R.J.; Luterbacher, J.; Holzkämper, S.; Fischer, N.; Wagner, S.; Nievergelt, D.; et al. Orbital forcing of tree-ring data. Nat. Clim. Chang. 2012, 2, 862–866. [Google Scholar] [CrossRef]
- World Bank Climate Change Knowledge Portal. Available online: https://climateknowledgeportal.worldbank.org/ (accessed on 13 June 2019).
- Mizyed, N. Impacts of Climate Change on water resources availability and agricultural water demand in the West Bank. Water. Resour. Manag. 2009, 23, 2015–2029. [Google Scholar] [CrossRef]
- Climate Data for Cities Worldwide. Available online: https://en.climate-data.org/ (accessed on 20 June 2019).
- Zou, X.; Uesaka, T.; Gurnagul, N. Prediction of paper permanence by accelerated aging I. Kinetic analysis of the aging process. Cellulose 1996, 3, 243–267. [Google Scholar] [CrossRef]
- Rouchon, V.; Belhadj, O.; Duranton, M.; Gimat, A.; Massiani, P. Application of Arrhenius law to DP and zero-span tensile strength measurements taken on iron gall ink impregnated papers: Relevance of artificial ageing protocols. Appl. Phys. A 2017, 122, 773. [Google Scholar] [CrossRef]
- Matricciani, E. An optimum design of deep-space downlinks affected by tropospheric attenuation. Int. J. Satell. Commun. Netw. 2009, 27, 312–329. [Google Scholar] [CrossRef]
- Papoulis, A. Probability & Statistics; Prentice Hall: Upper Saddle River, NJ, USA, 1990; ISBN 0137116985. [Google Scholar]

© 2019 by the authors. Licensee MDPI, Basel, Switzerland. This article is an open access article distributed under the terms and conditions of the Creative Commons Attribution (CC BY) license (http://creativecommons.org/licenses/by/4.0/).