The Effect of Fire on Building Materials: The Case-Study of the Varnakova Monastery Cells in Central Greece


Abstract
:1. Introduction
2. Materials and Methods
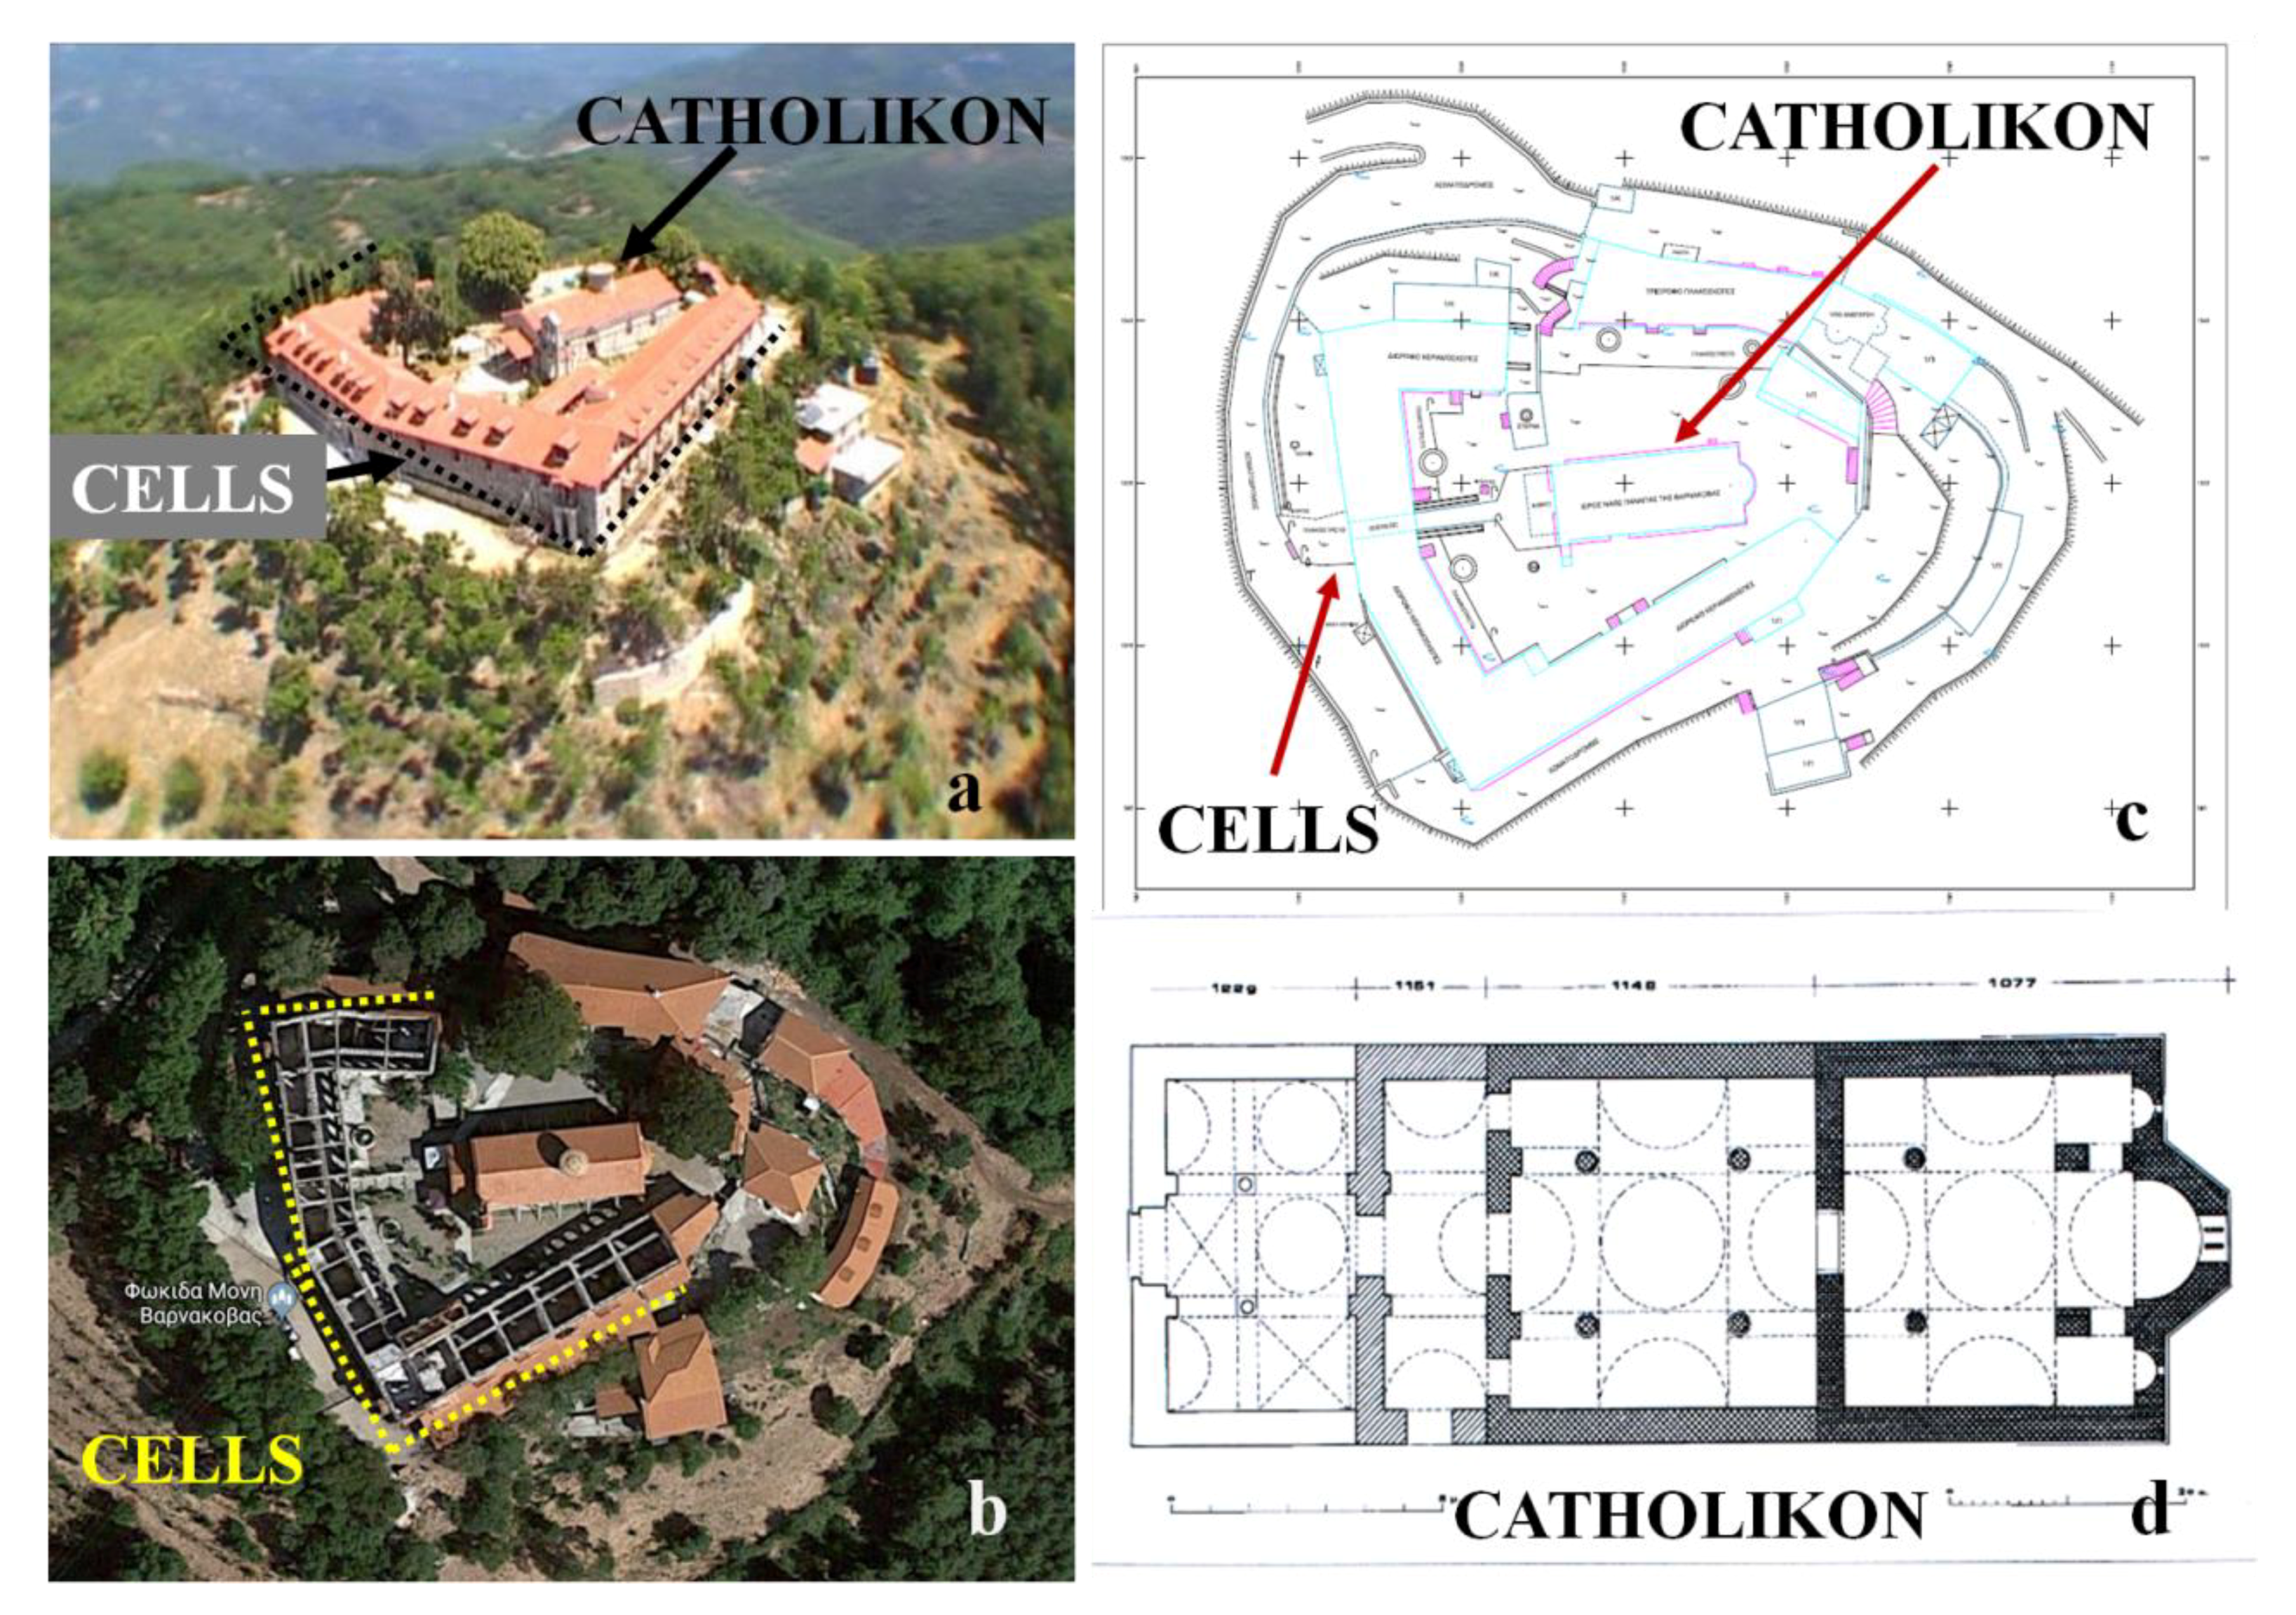
2.1. The Varnakova Monastery
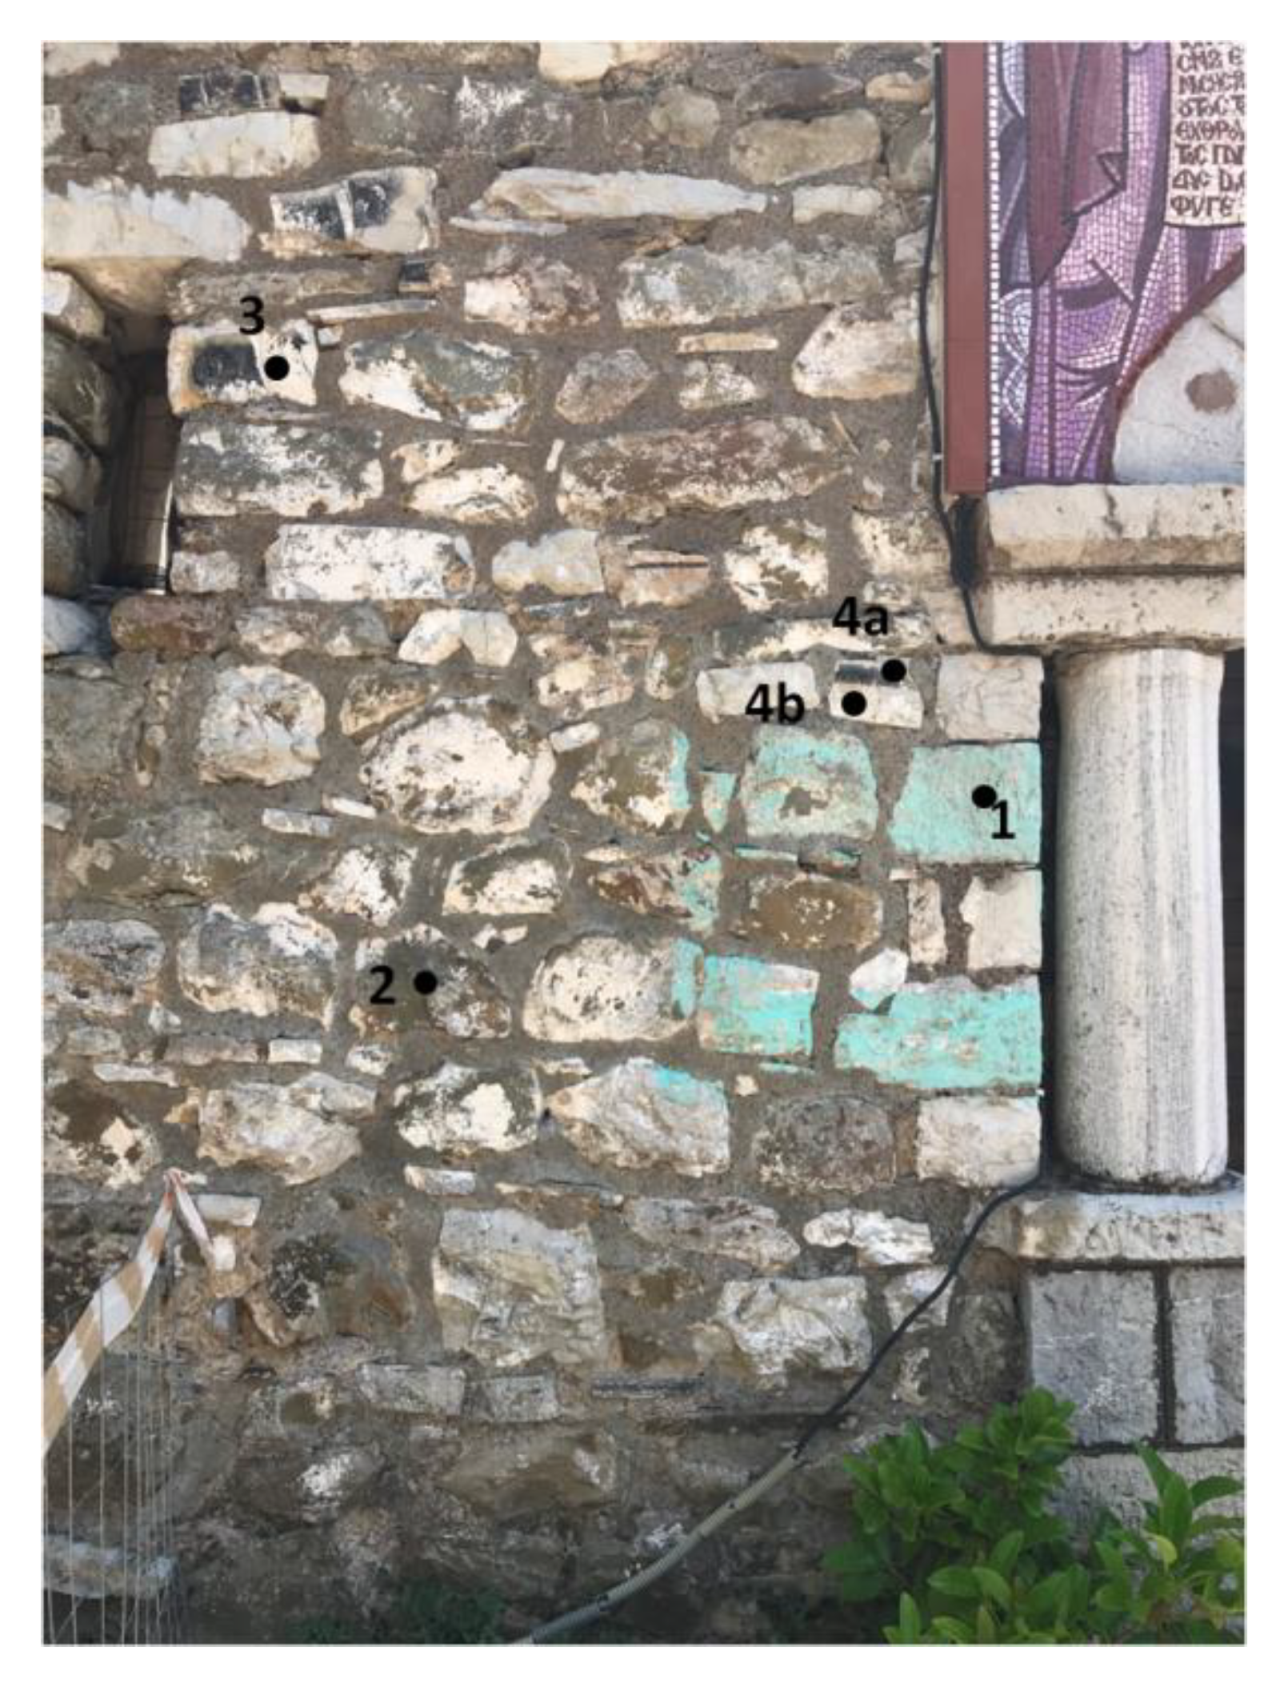
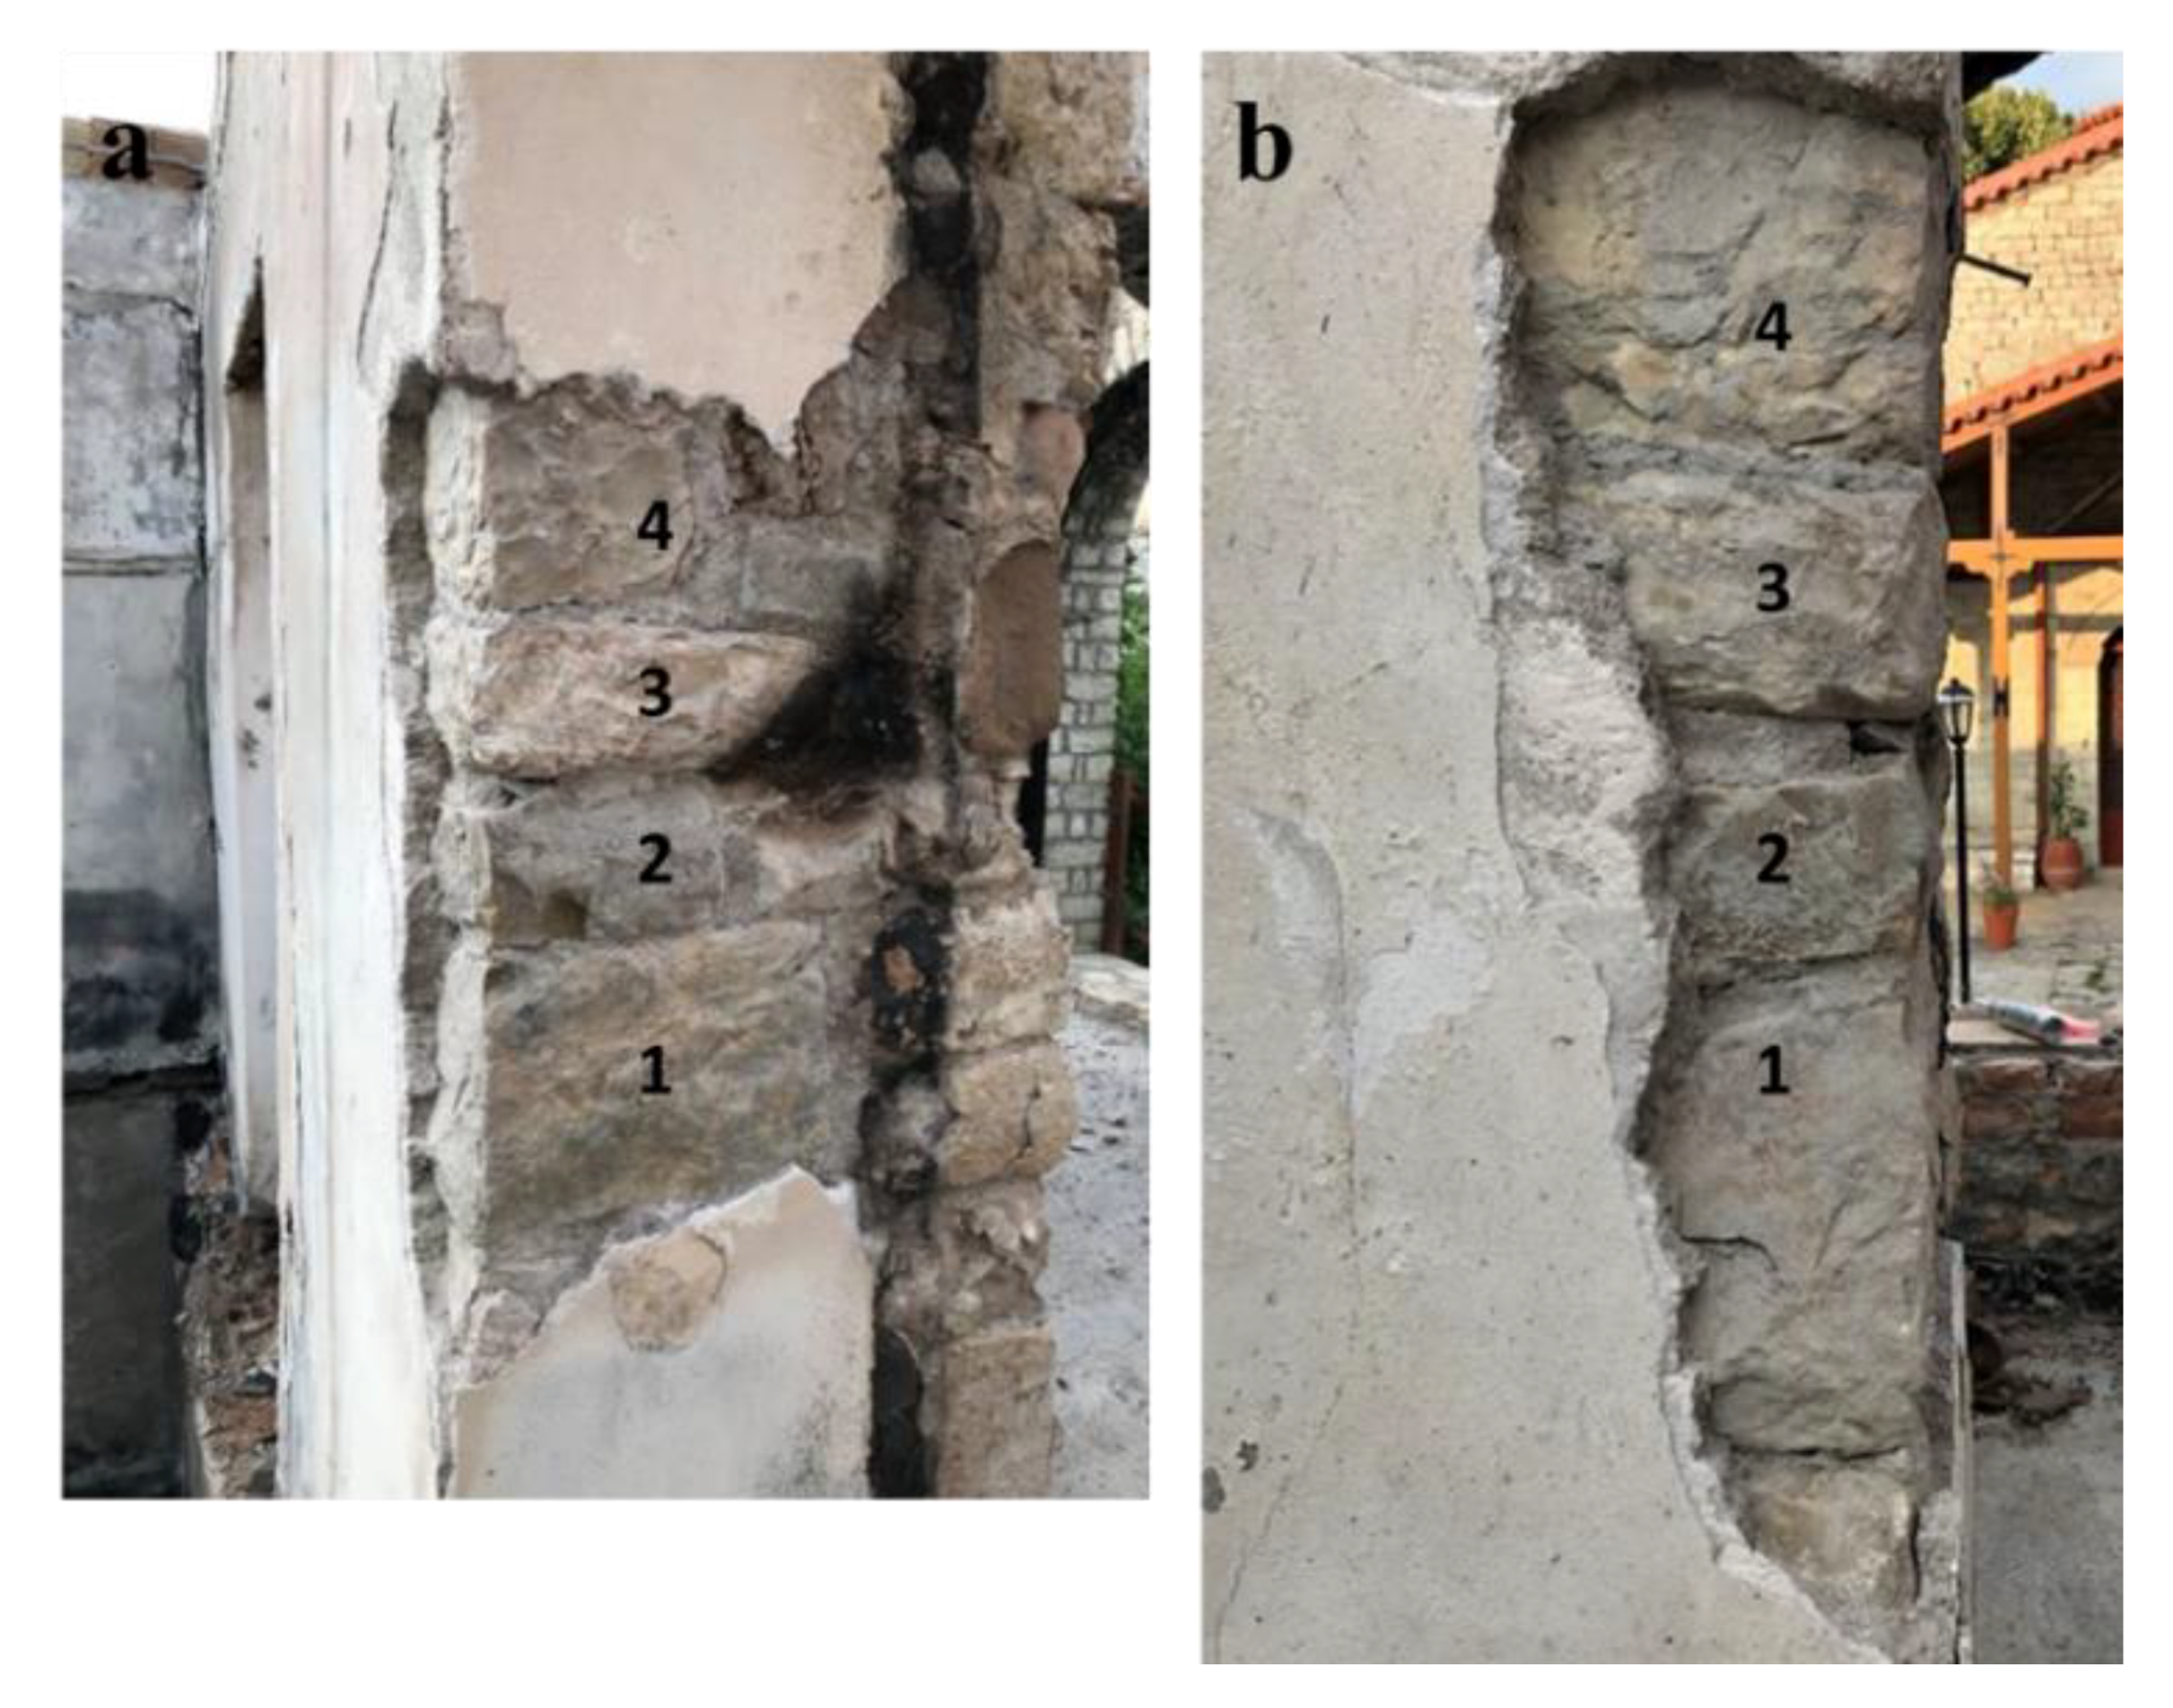
2.2. Visual Inspection
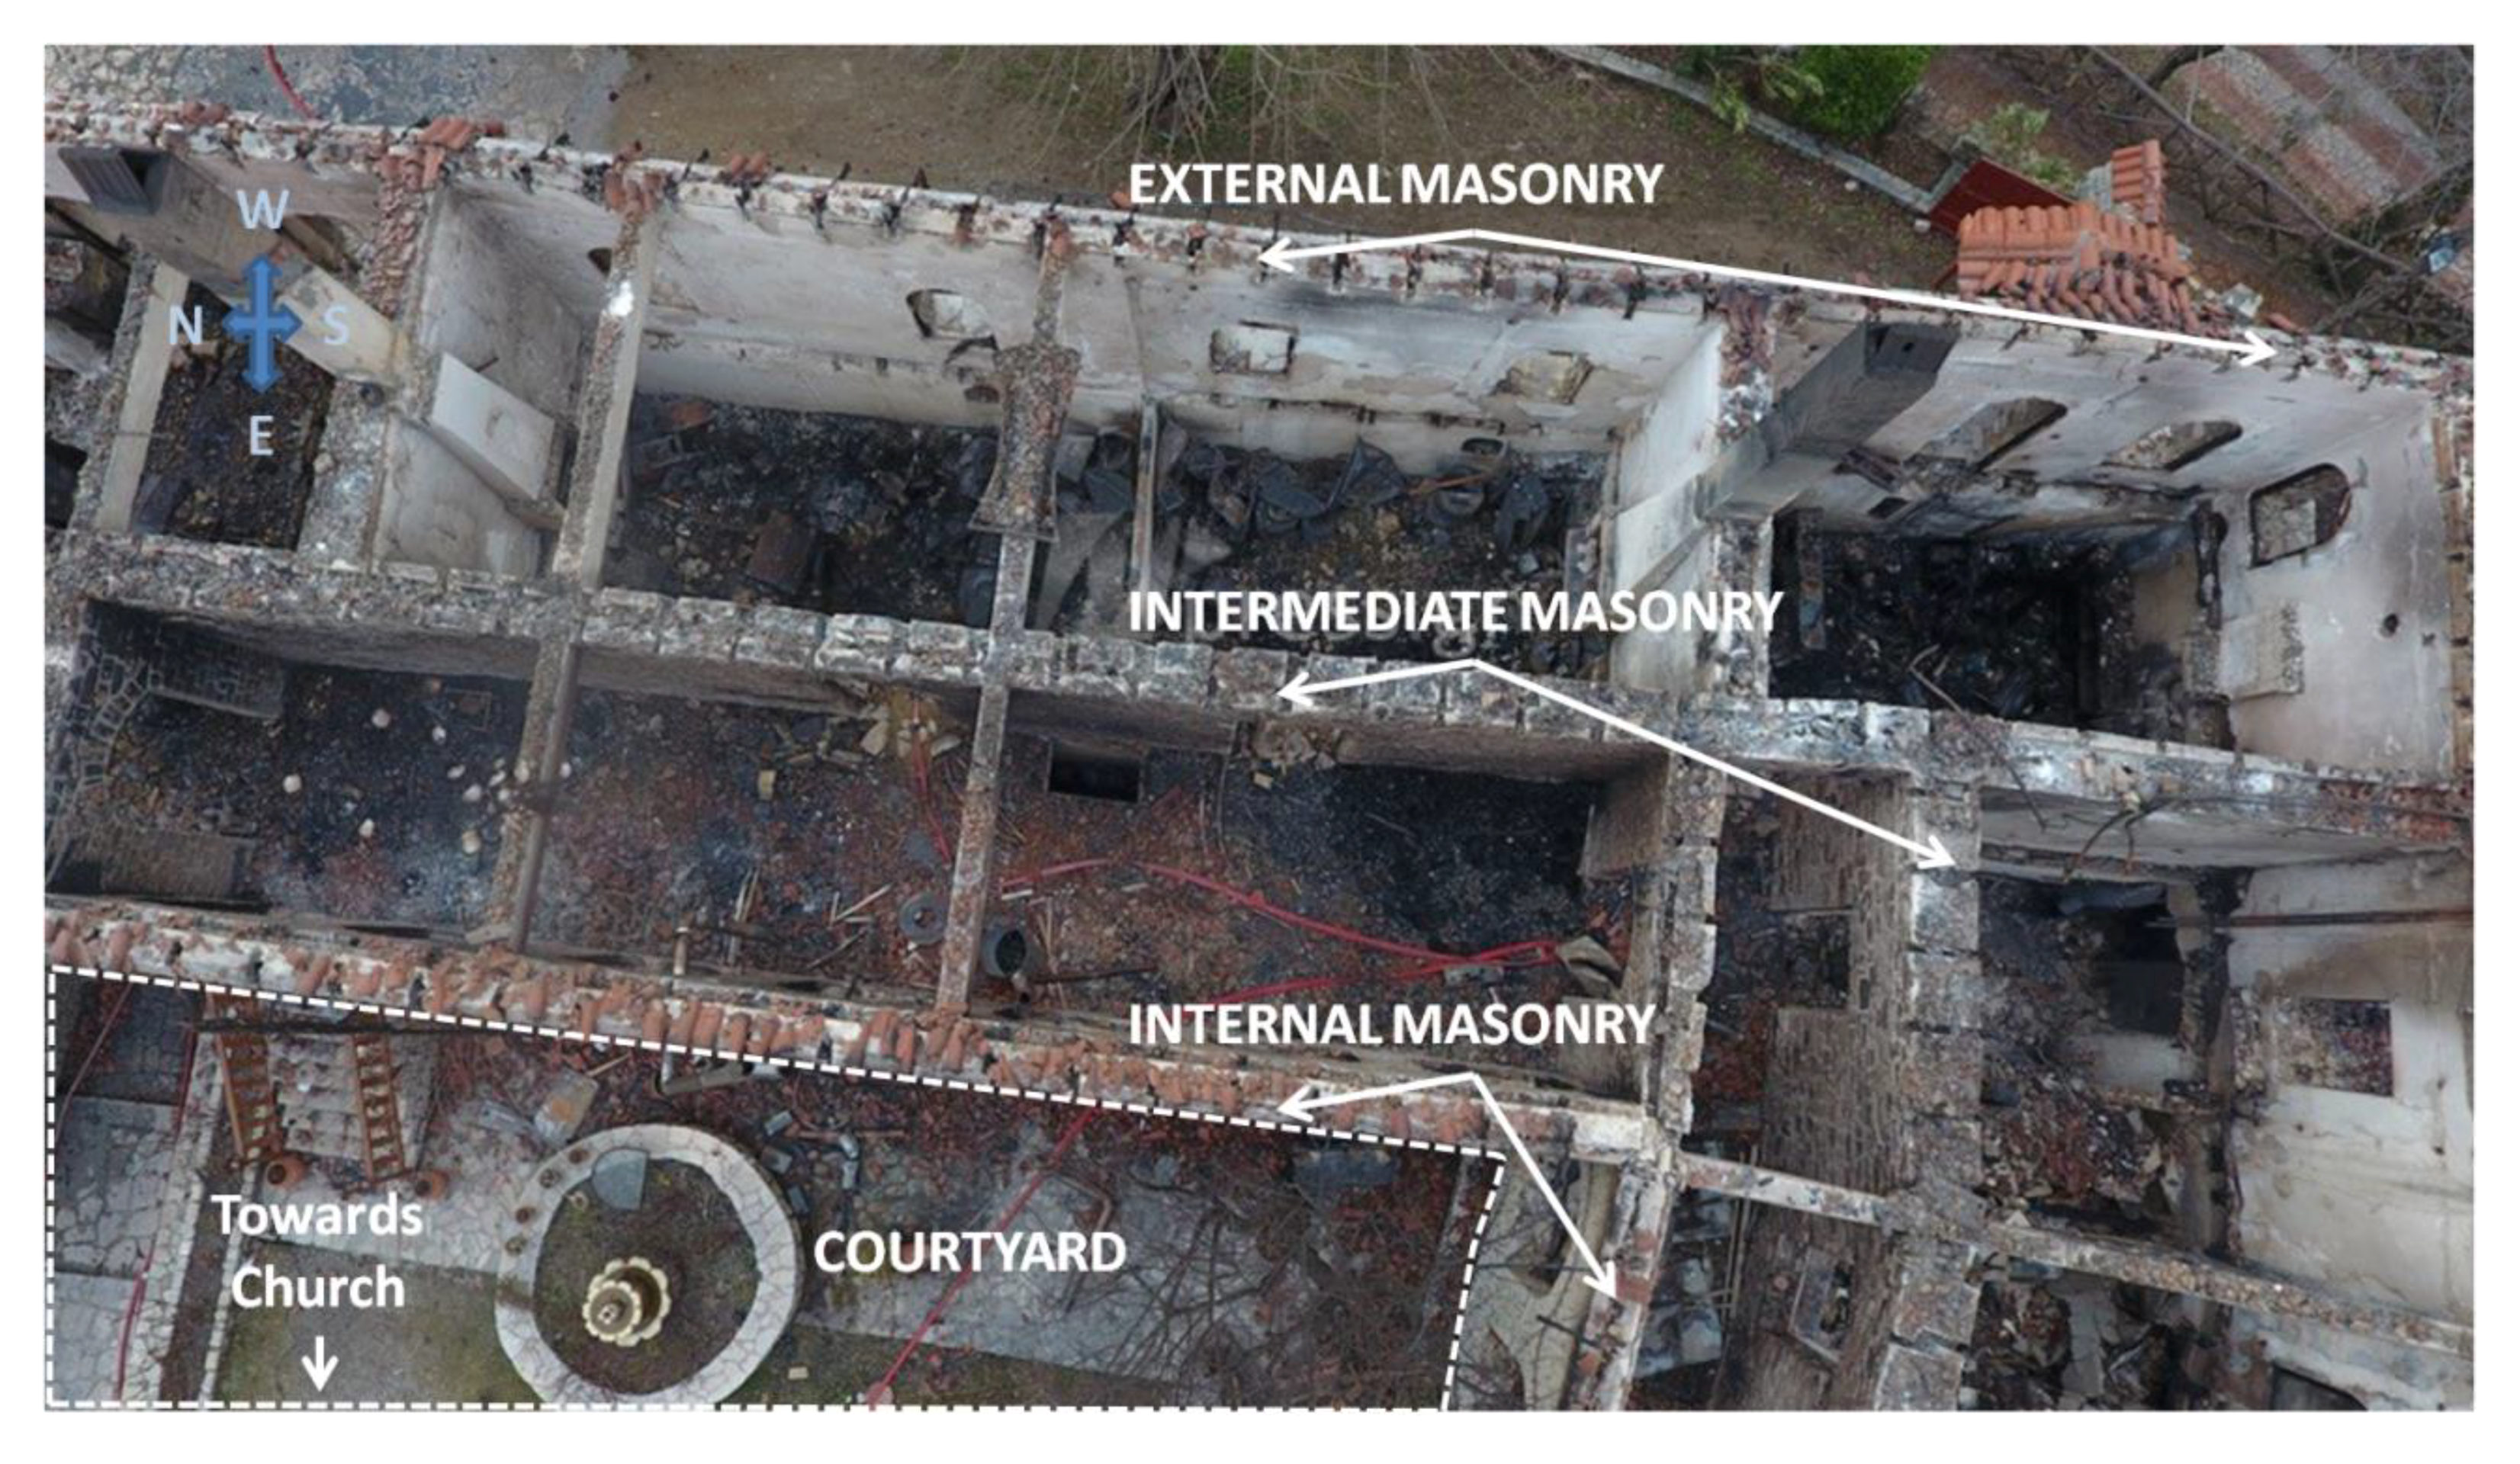
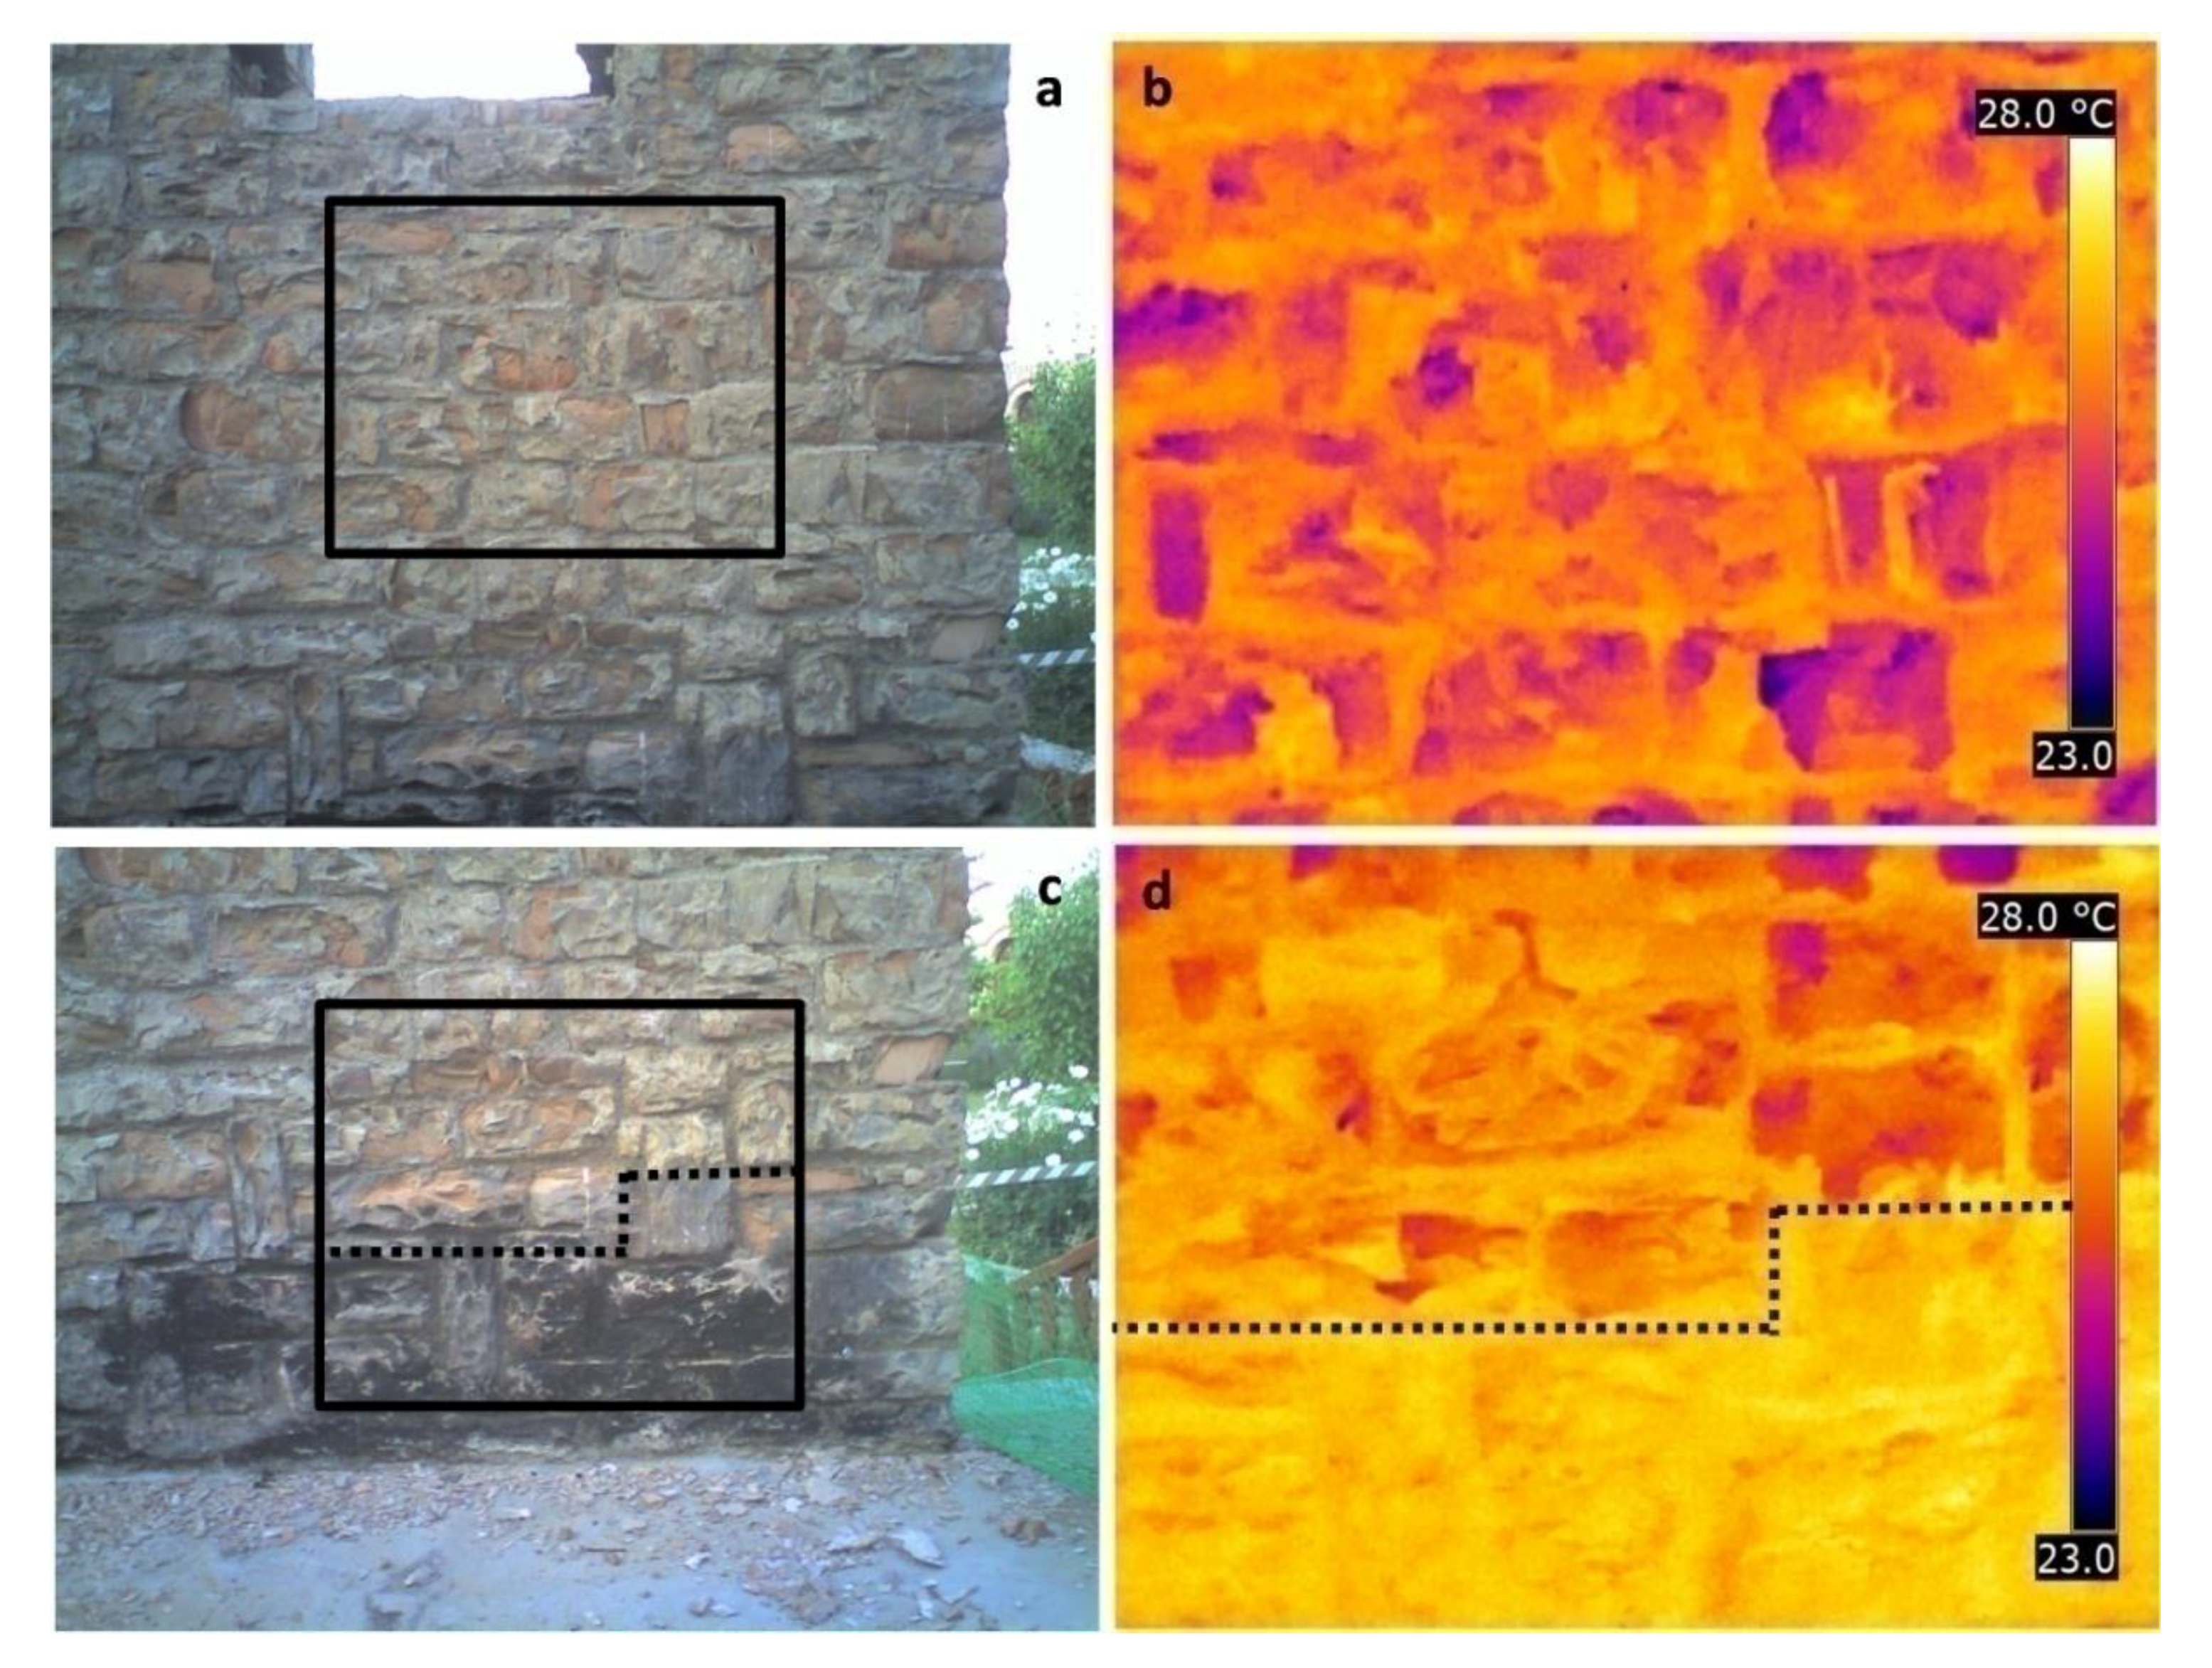
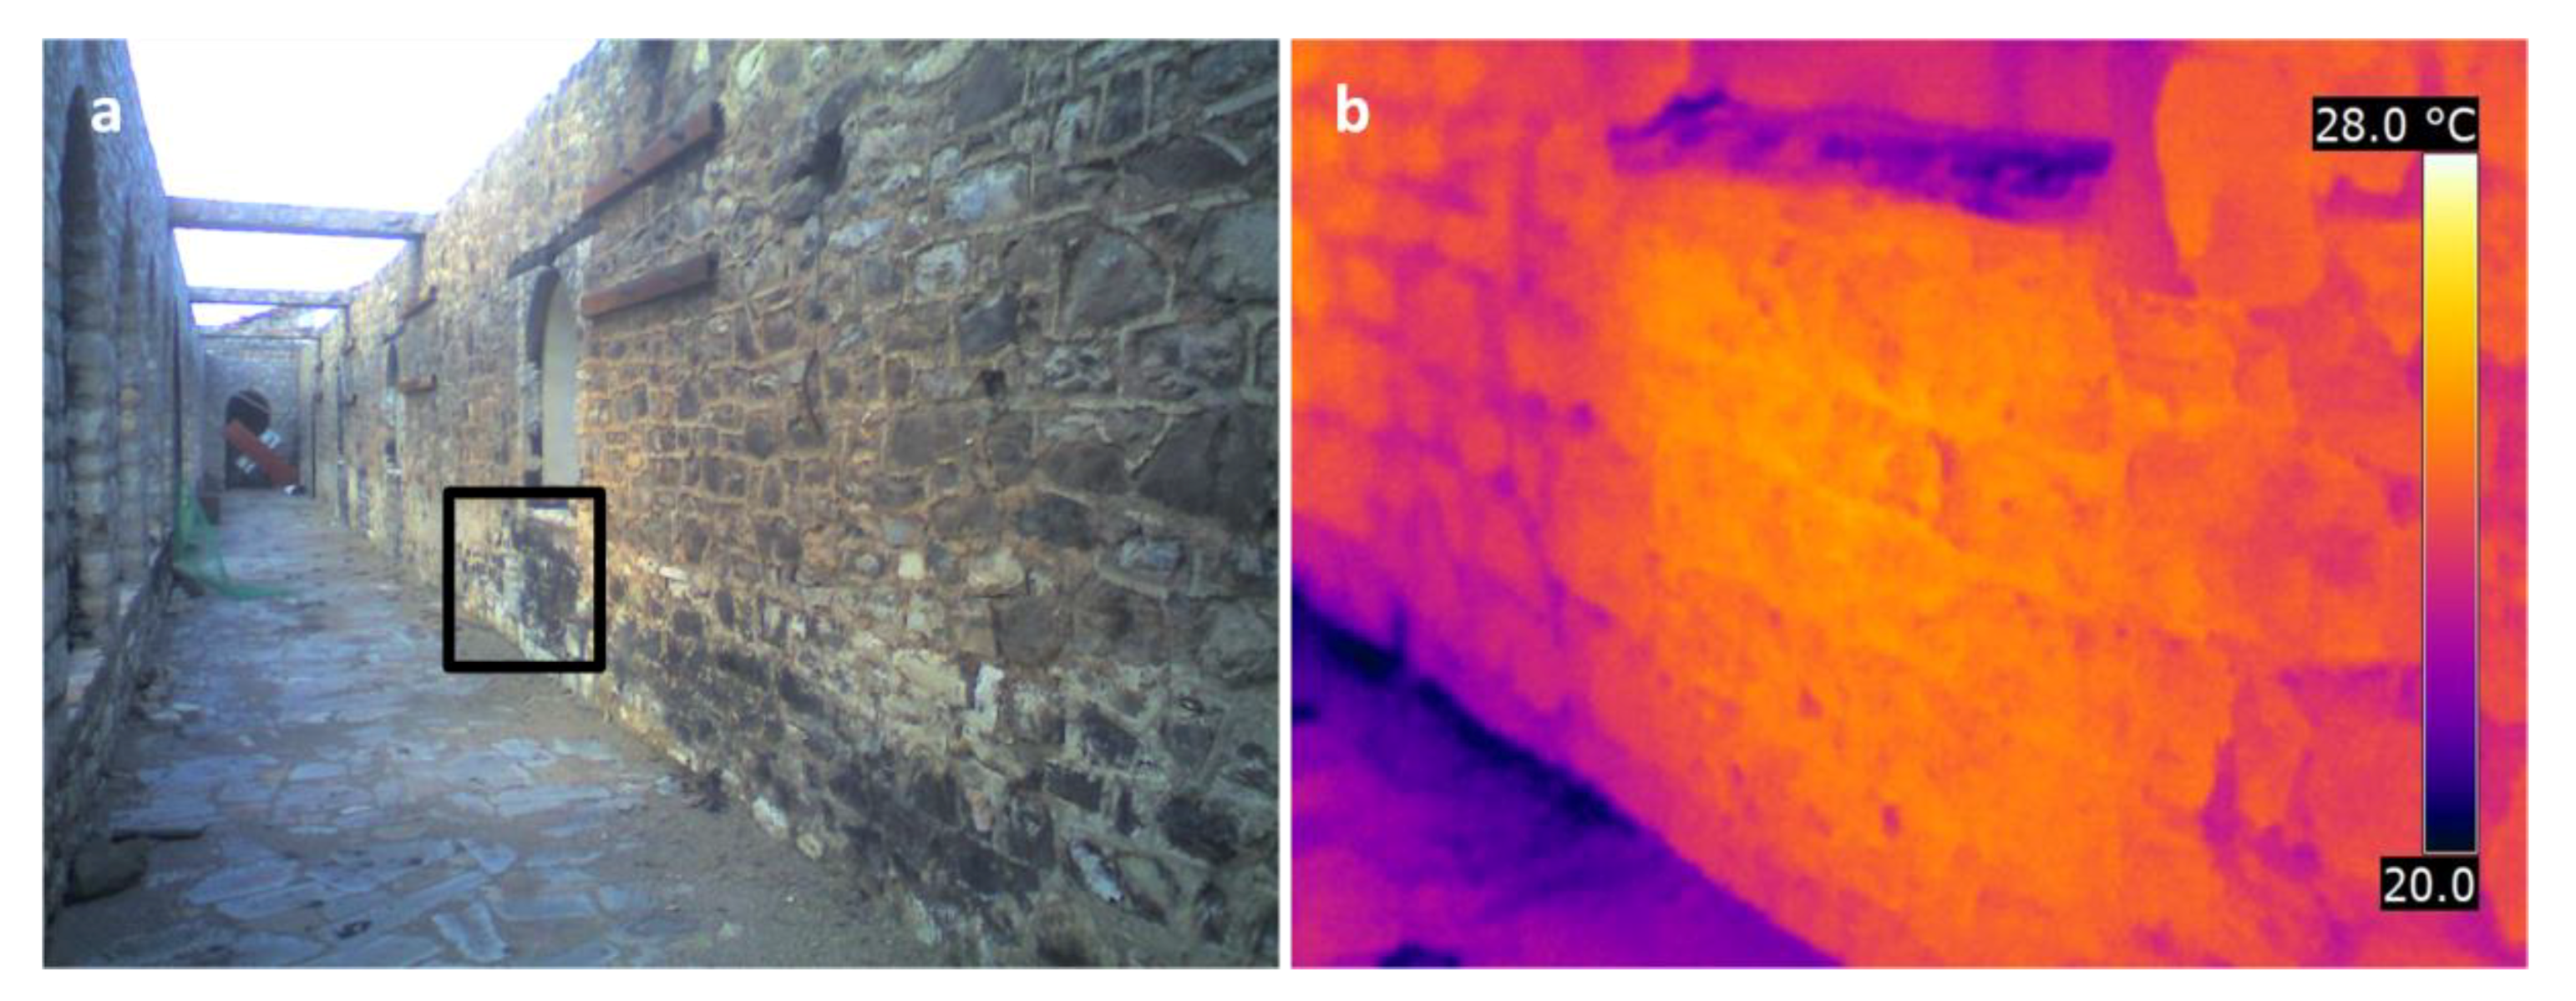
- The exterior façade of the external masonry (Figure 3a), which faces to the west, does not present any apparent damage from the fire. The interior plastered facade (Figure 3b) has clearly been affected, which displays blackened areas from the smoke produced during the fire, while partial plaster detachments can be noticed. Unfortunately, the total destruction of the wooden floors restricted access to these areas during this preliminary study.
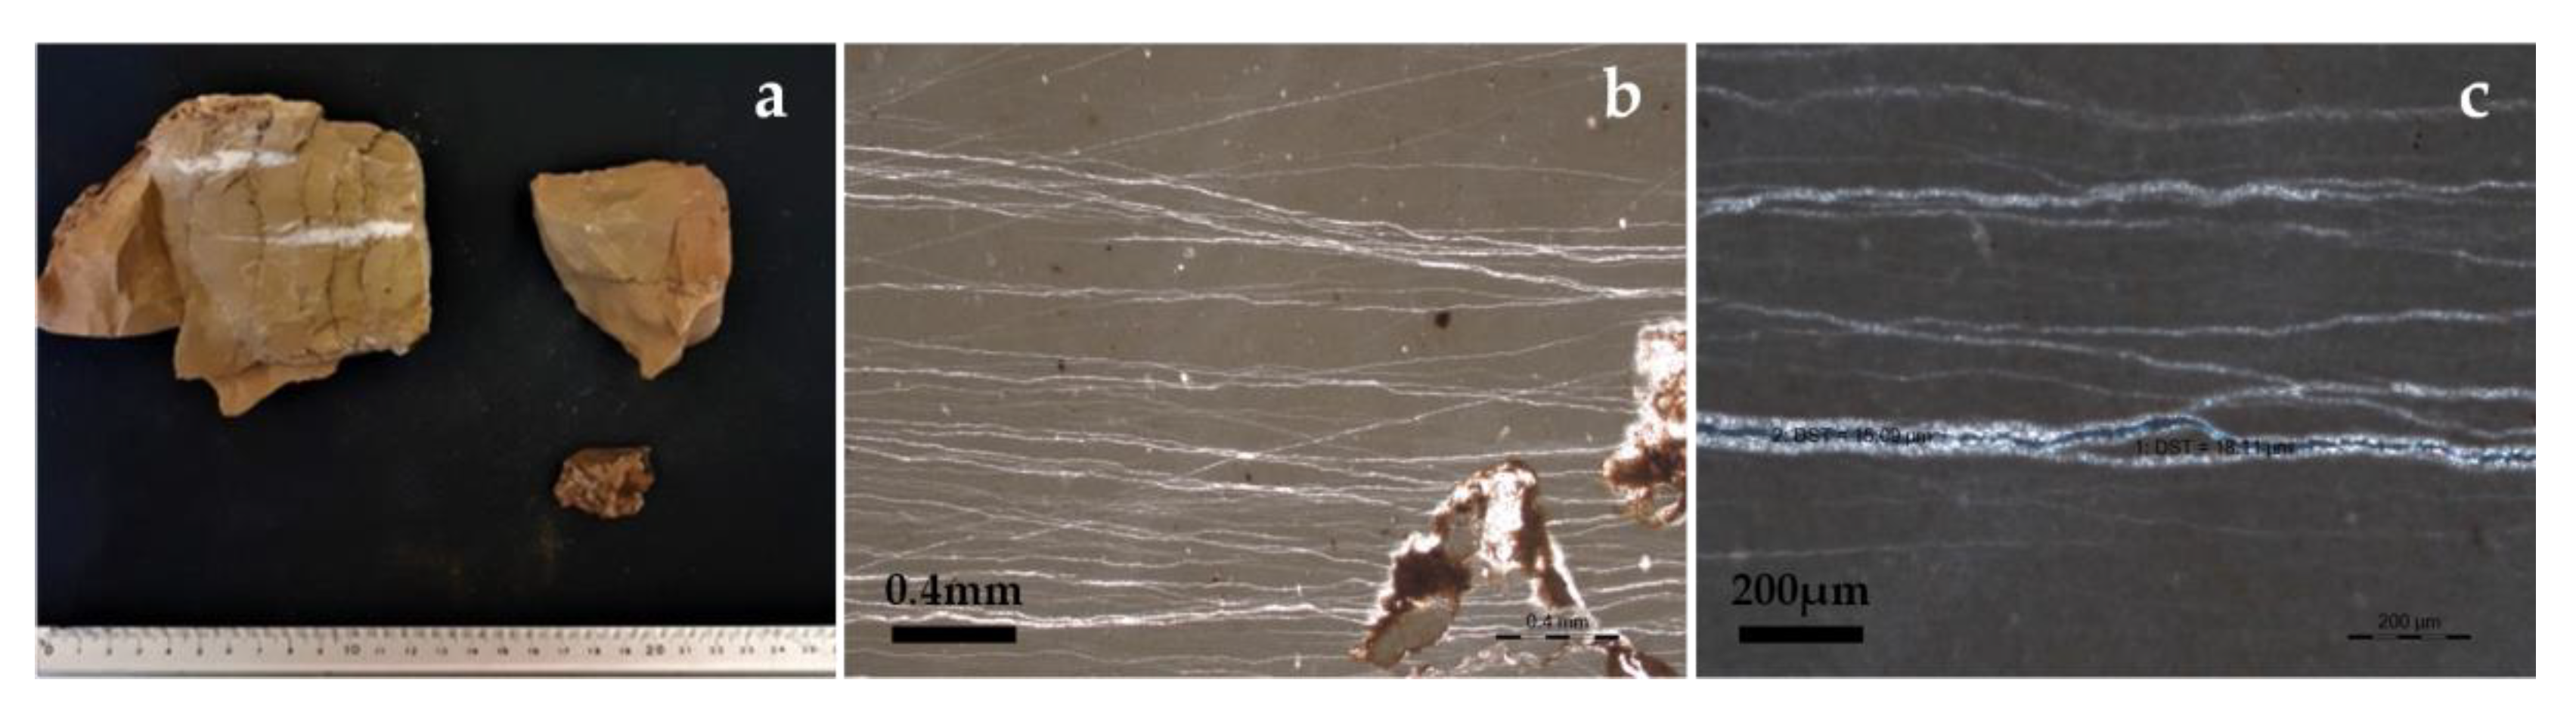
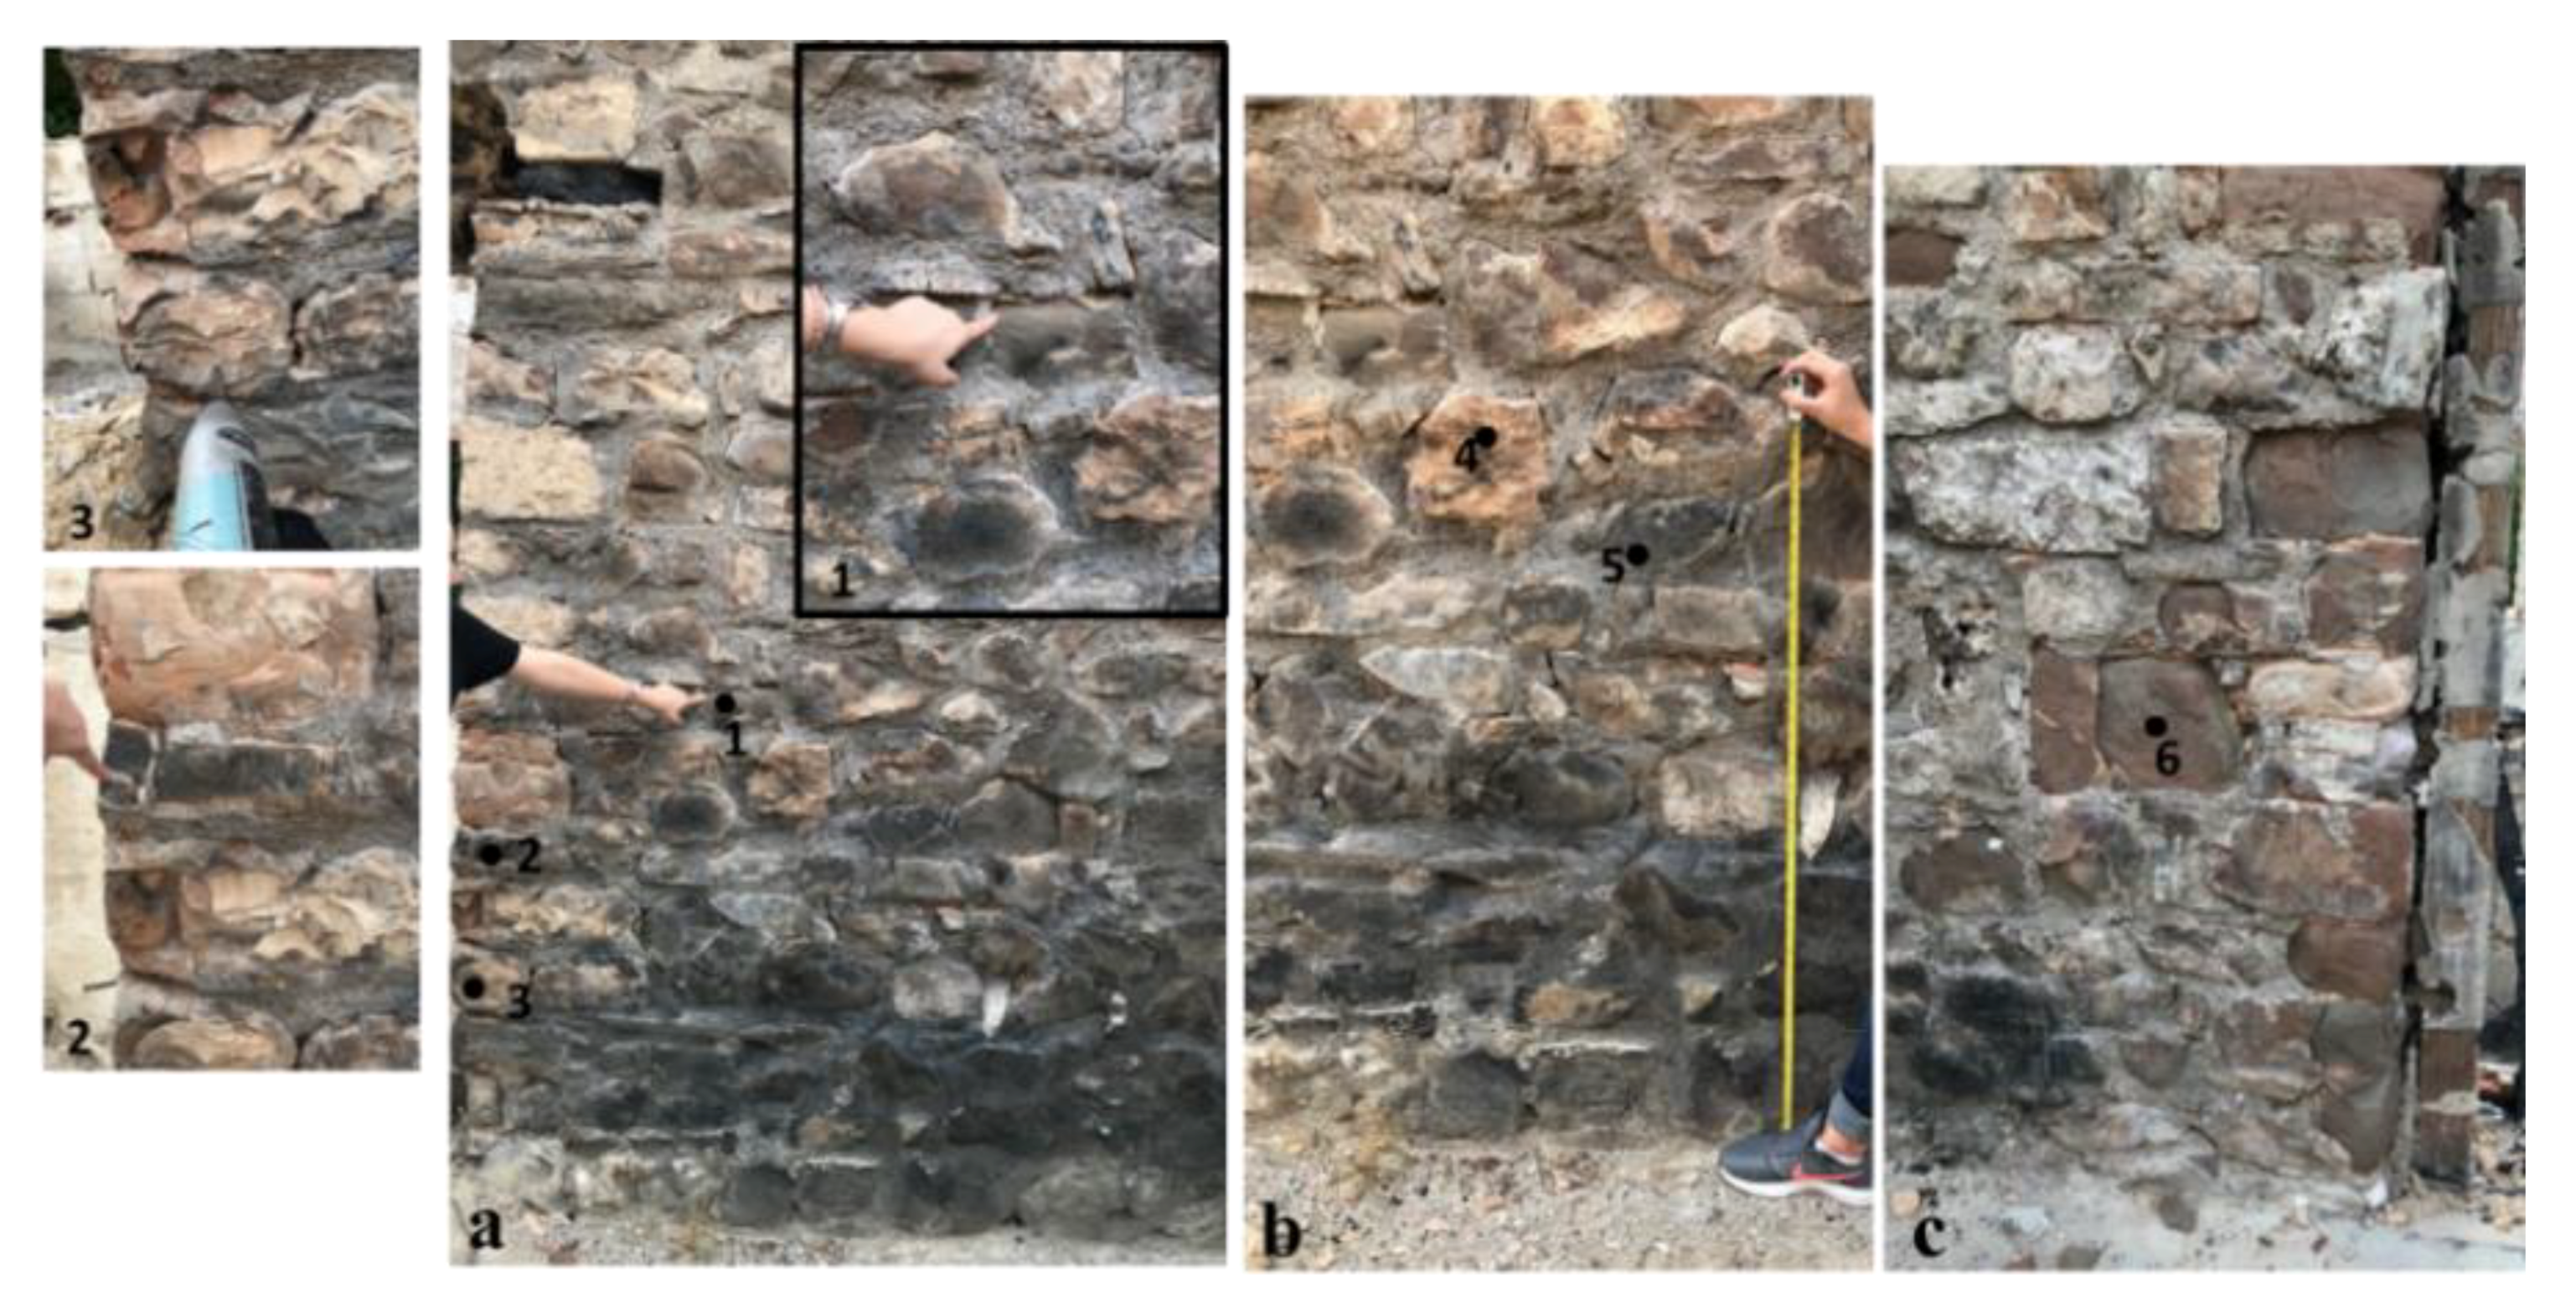
- The historic intermediate masonry seems to have been severely affected by the fire (Figure 3d,e). Its building materials present several damages and stone decay patterns such as color change, spalling, and flaking (Figure 4a). The western façade of this masonry (interior of domestic cells) was covered in plaster including remnants that still remain.
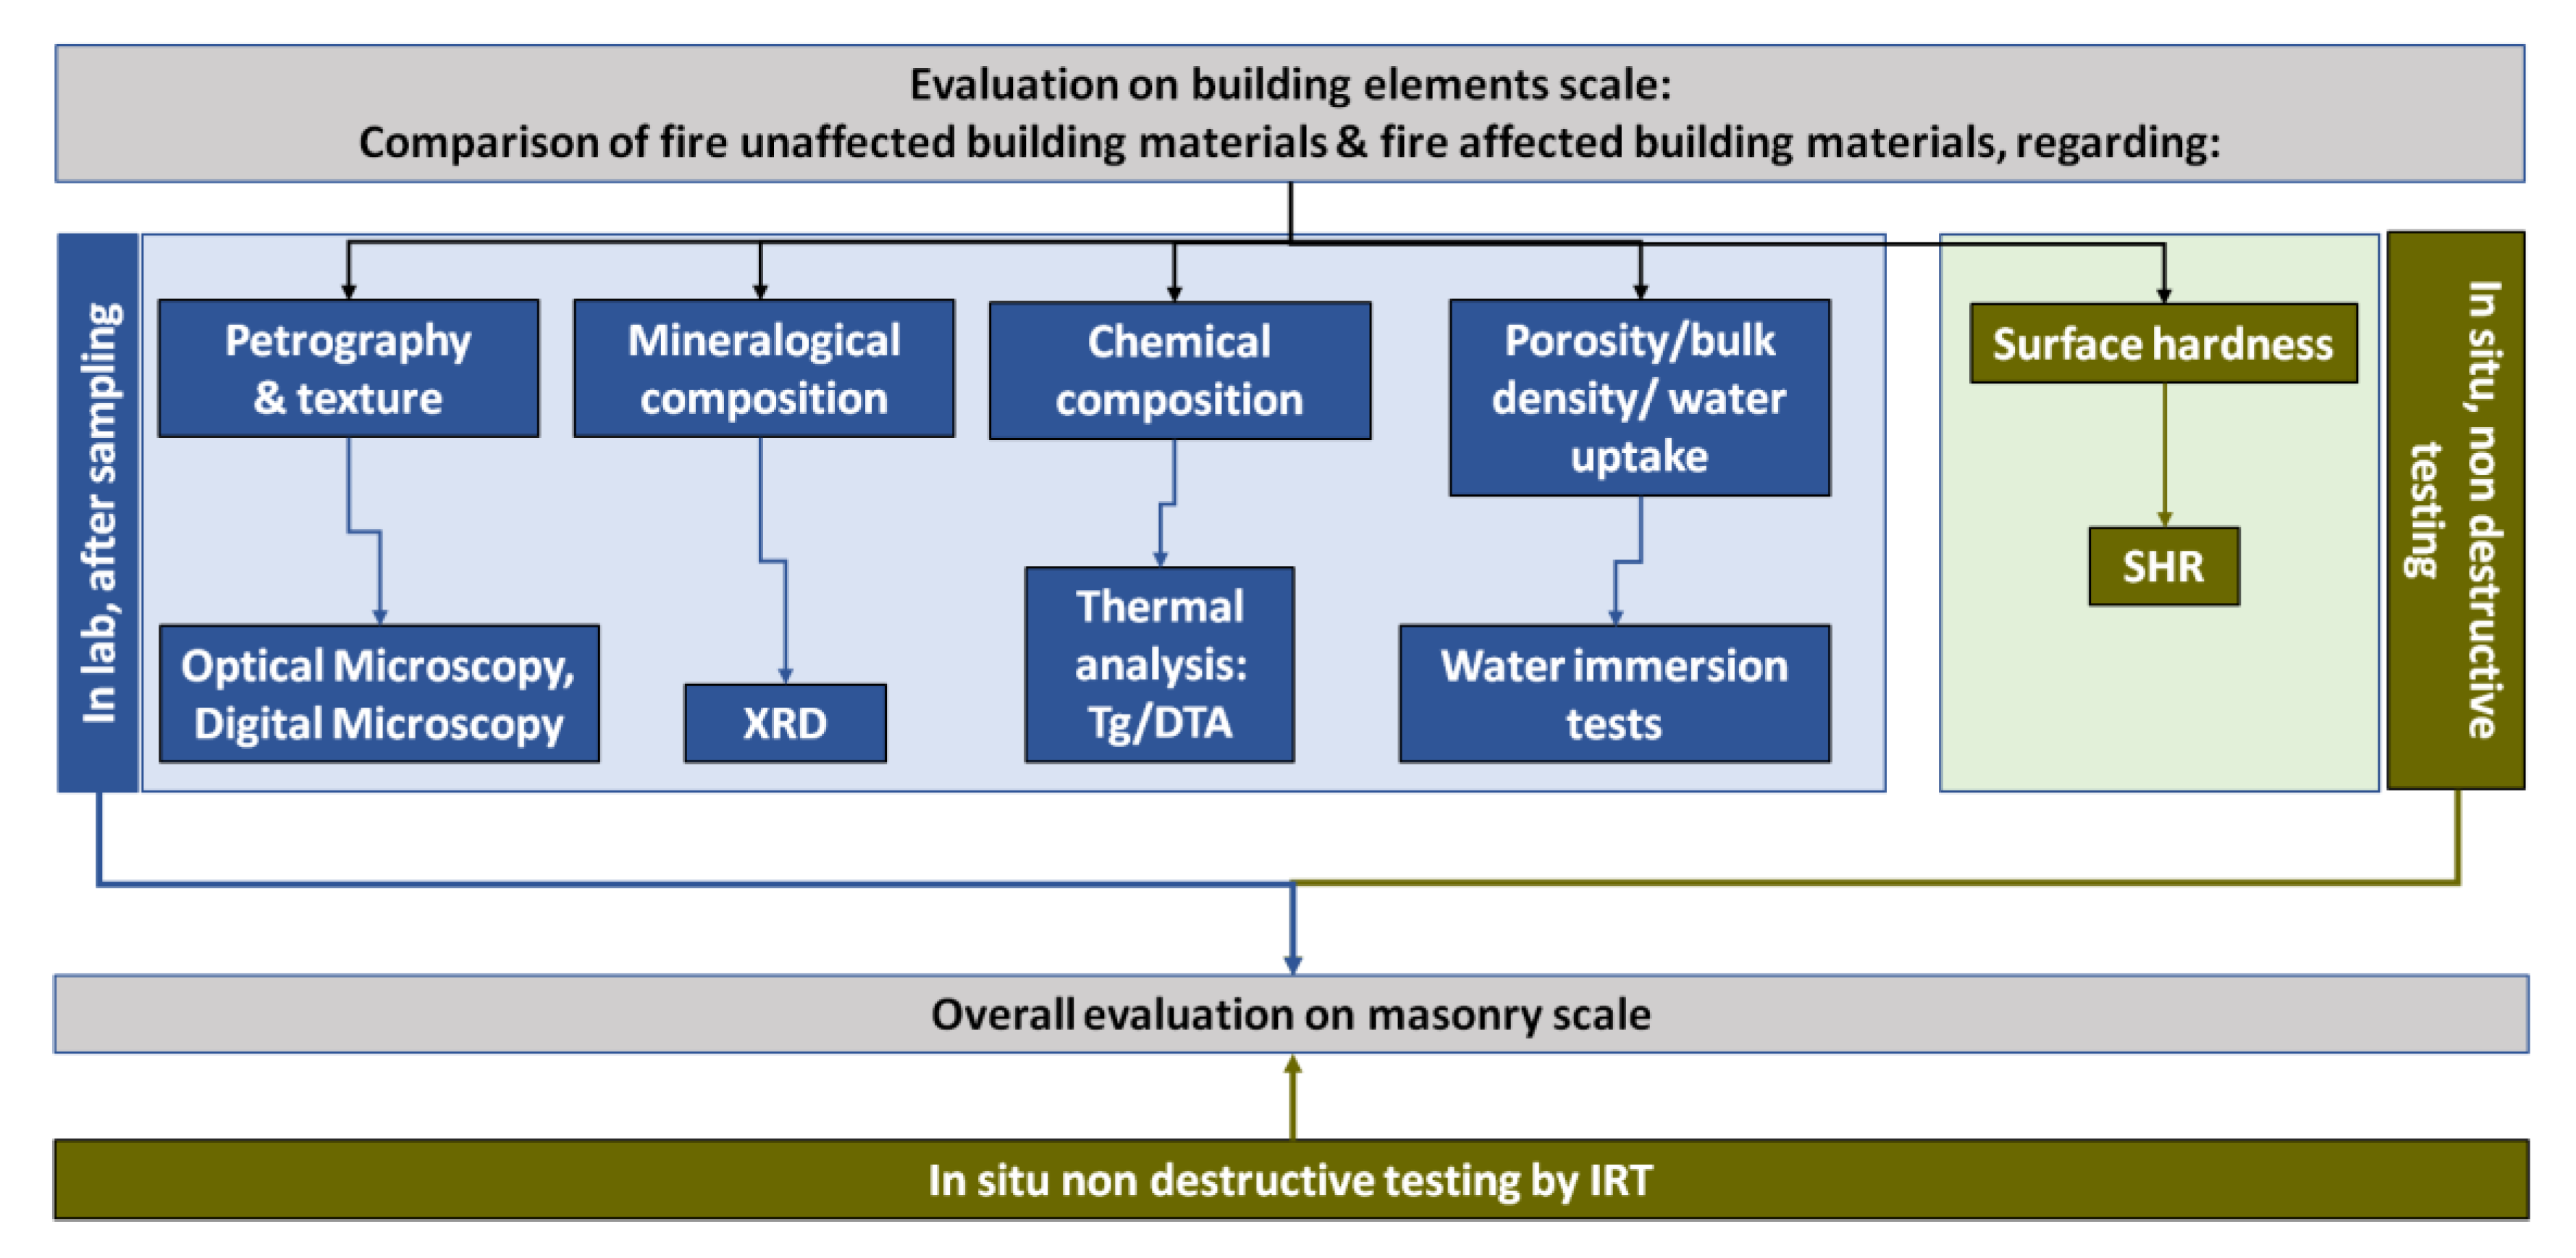
2.3. Investigation Techniques and Methodology
3. Results and Discussion
3.1. Characterization of the Building Materials
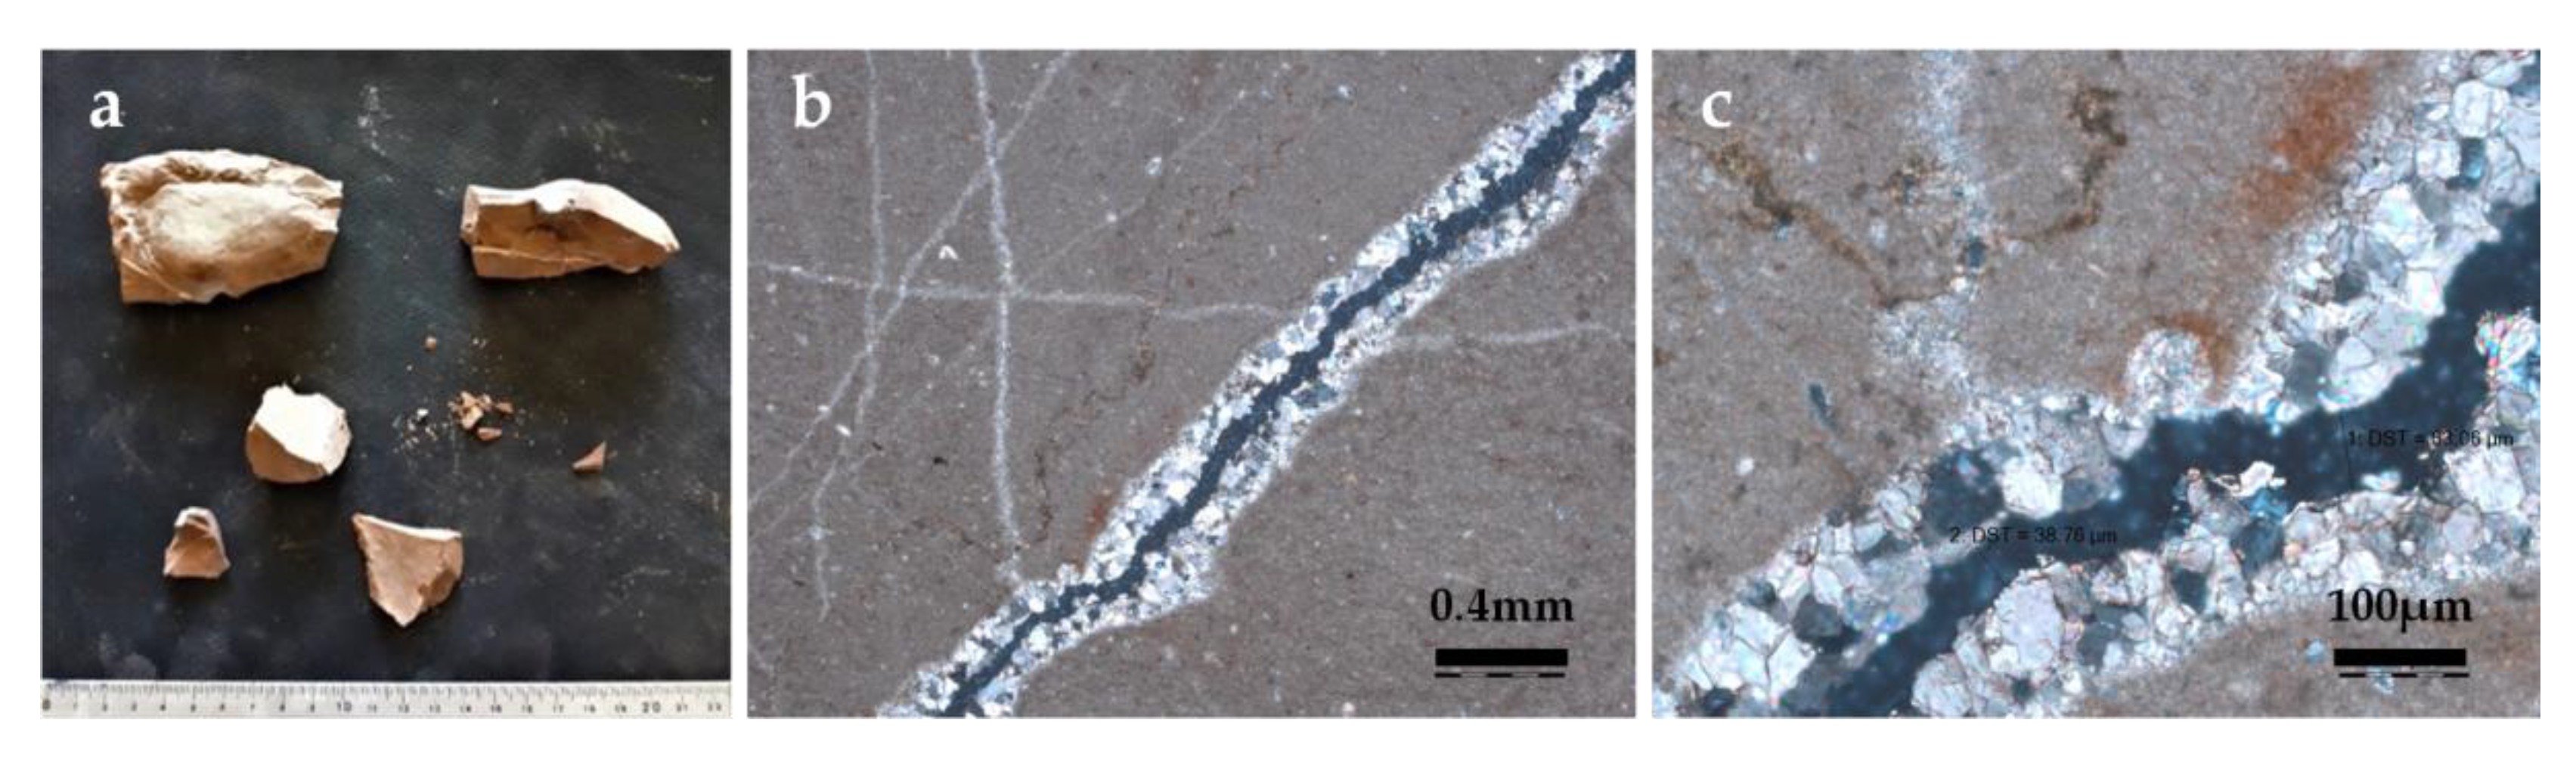
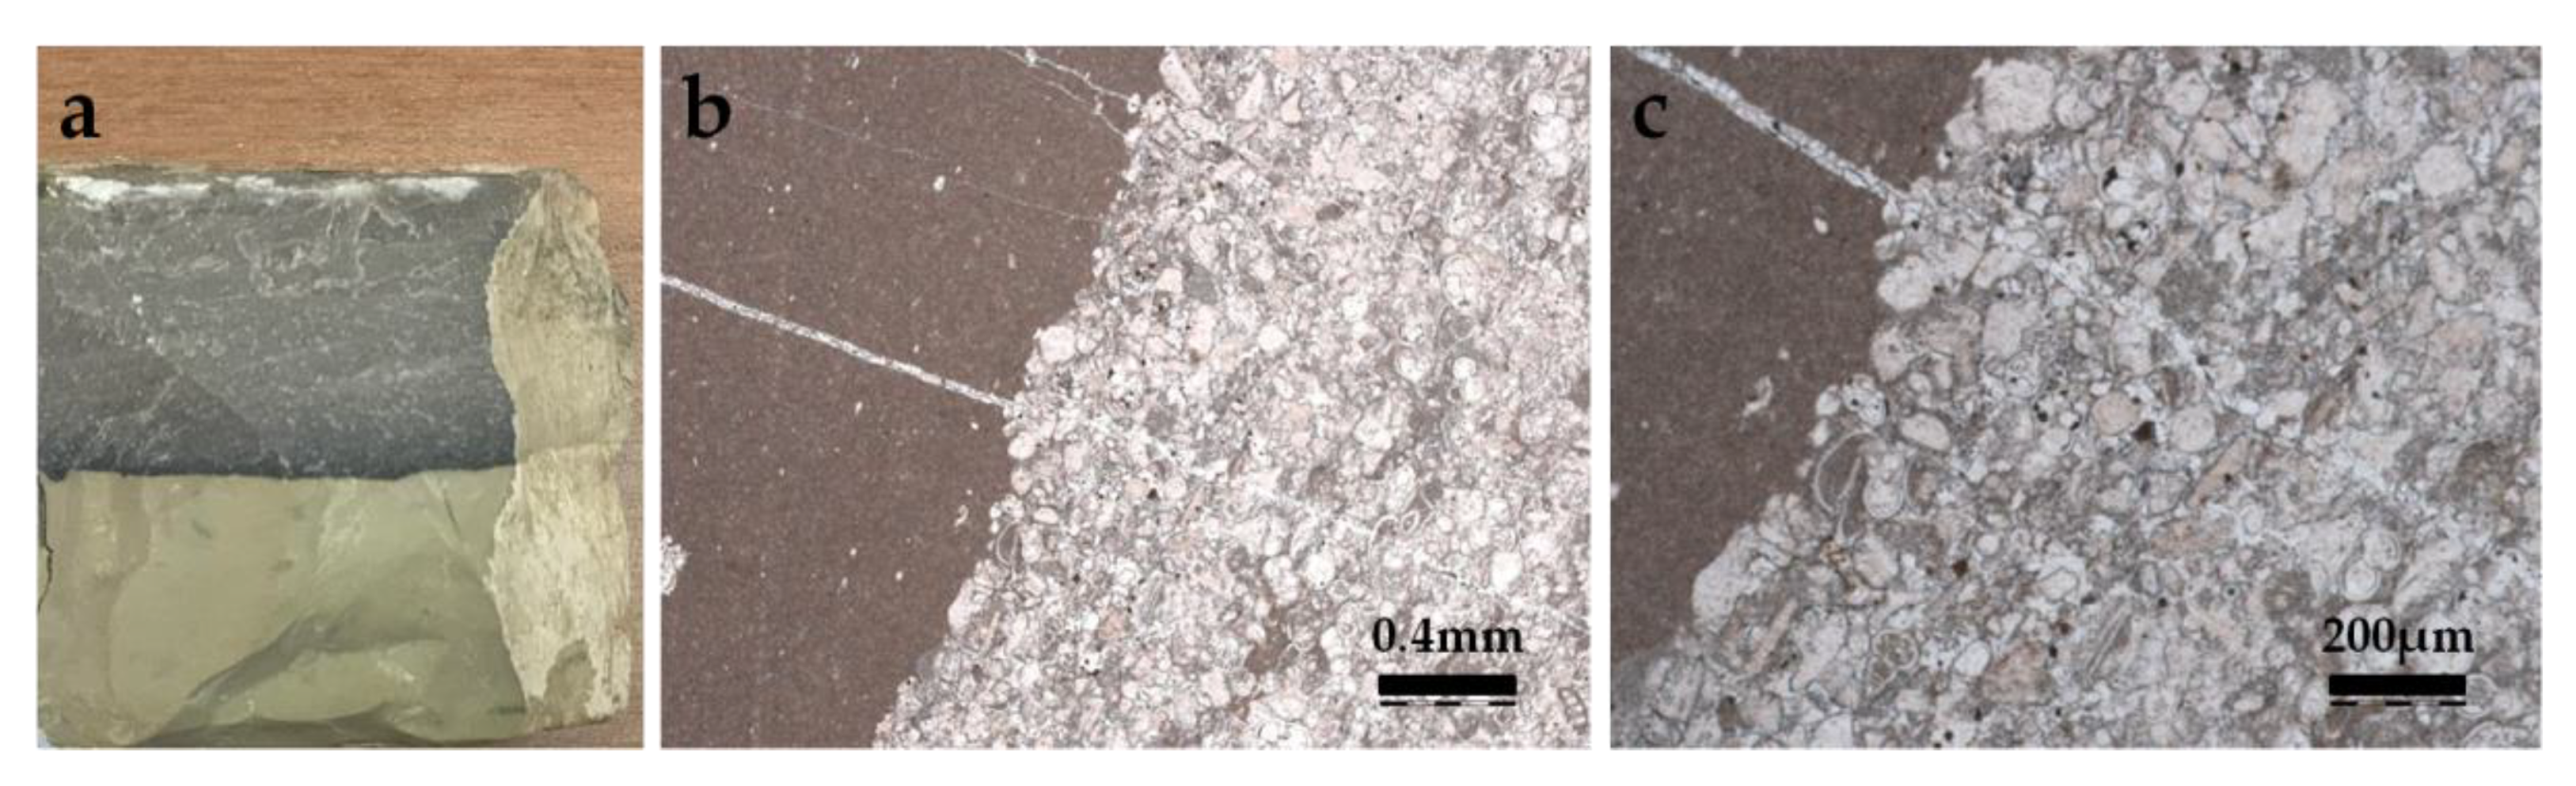
3.1.1. Investigation of the Building Stones
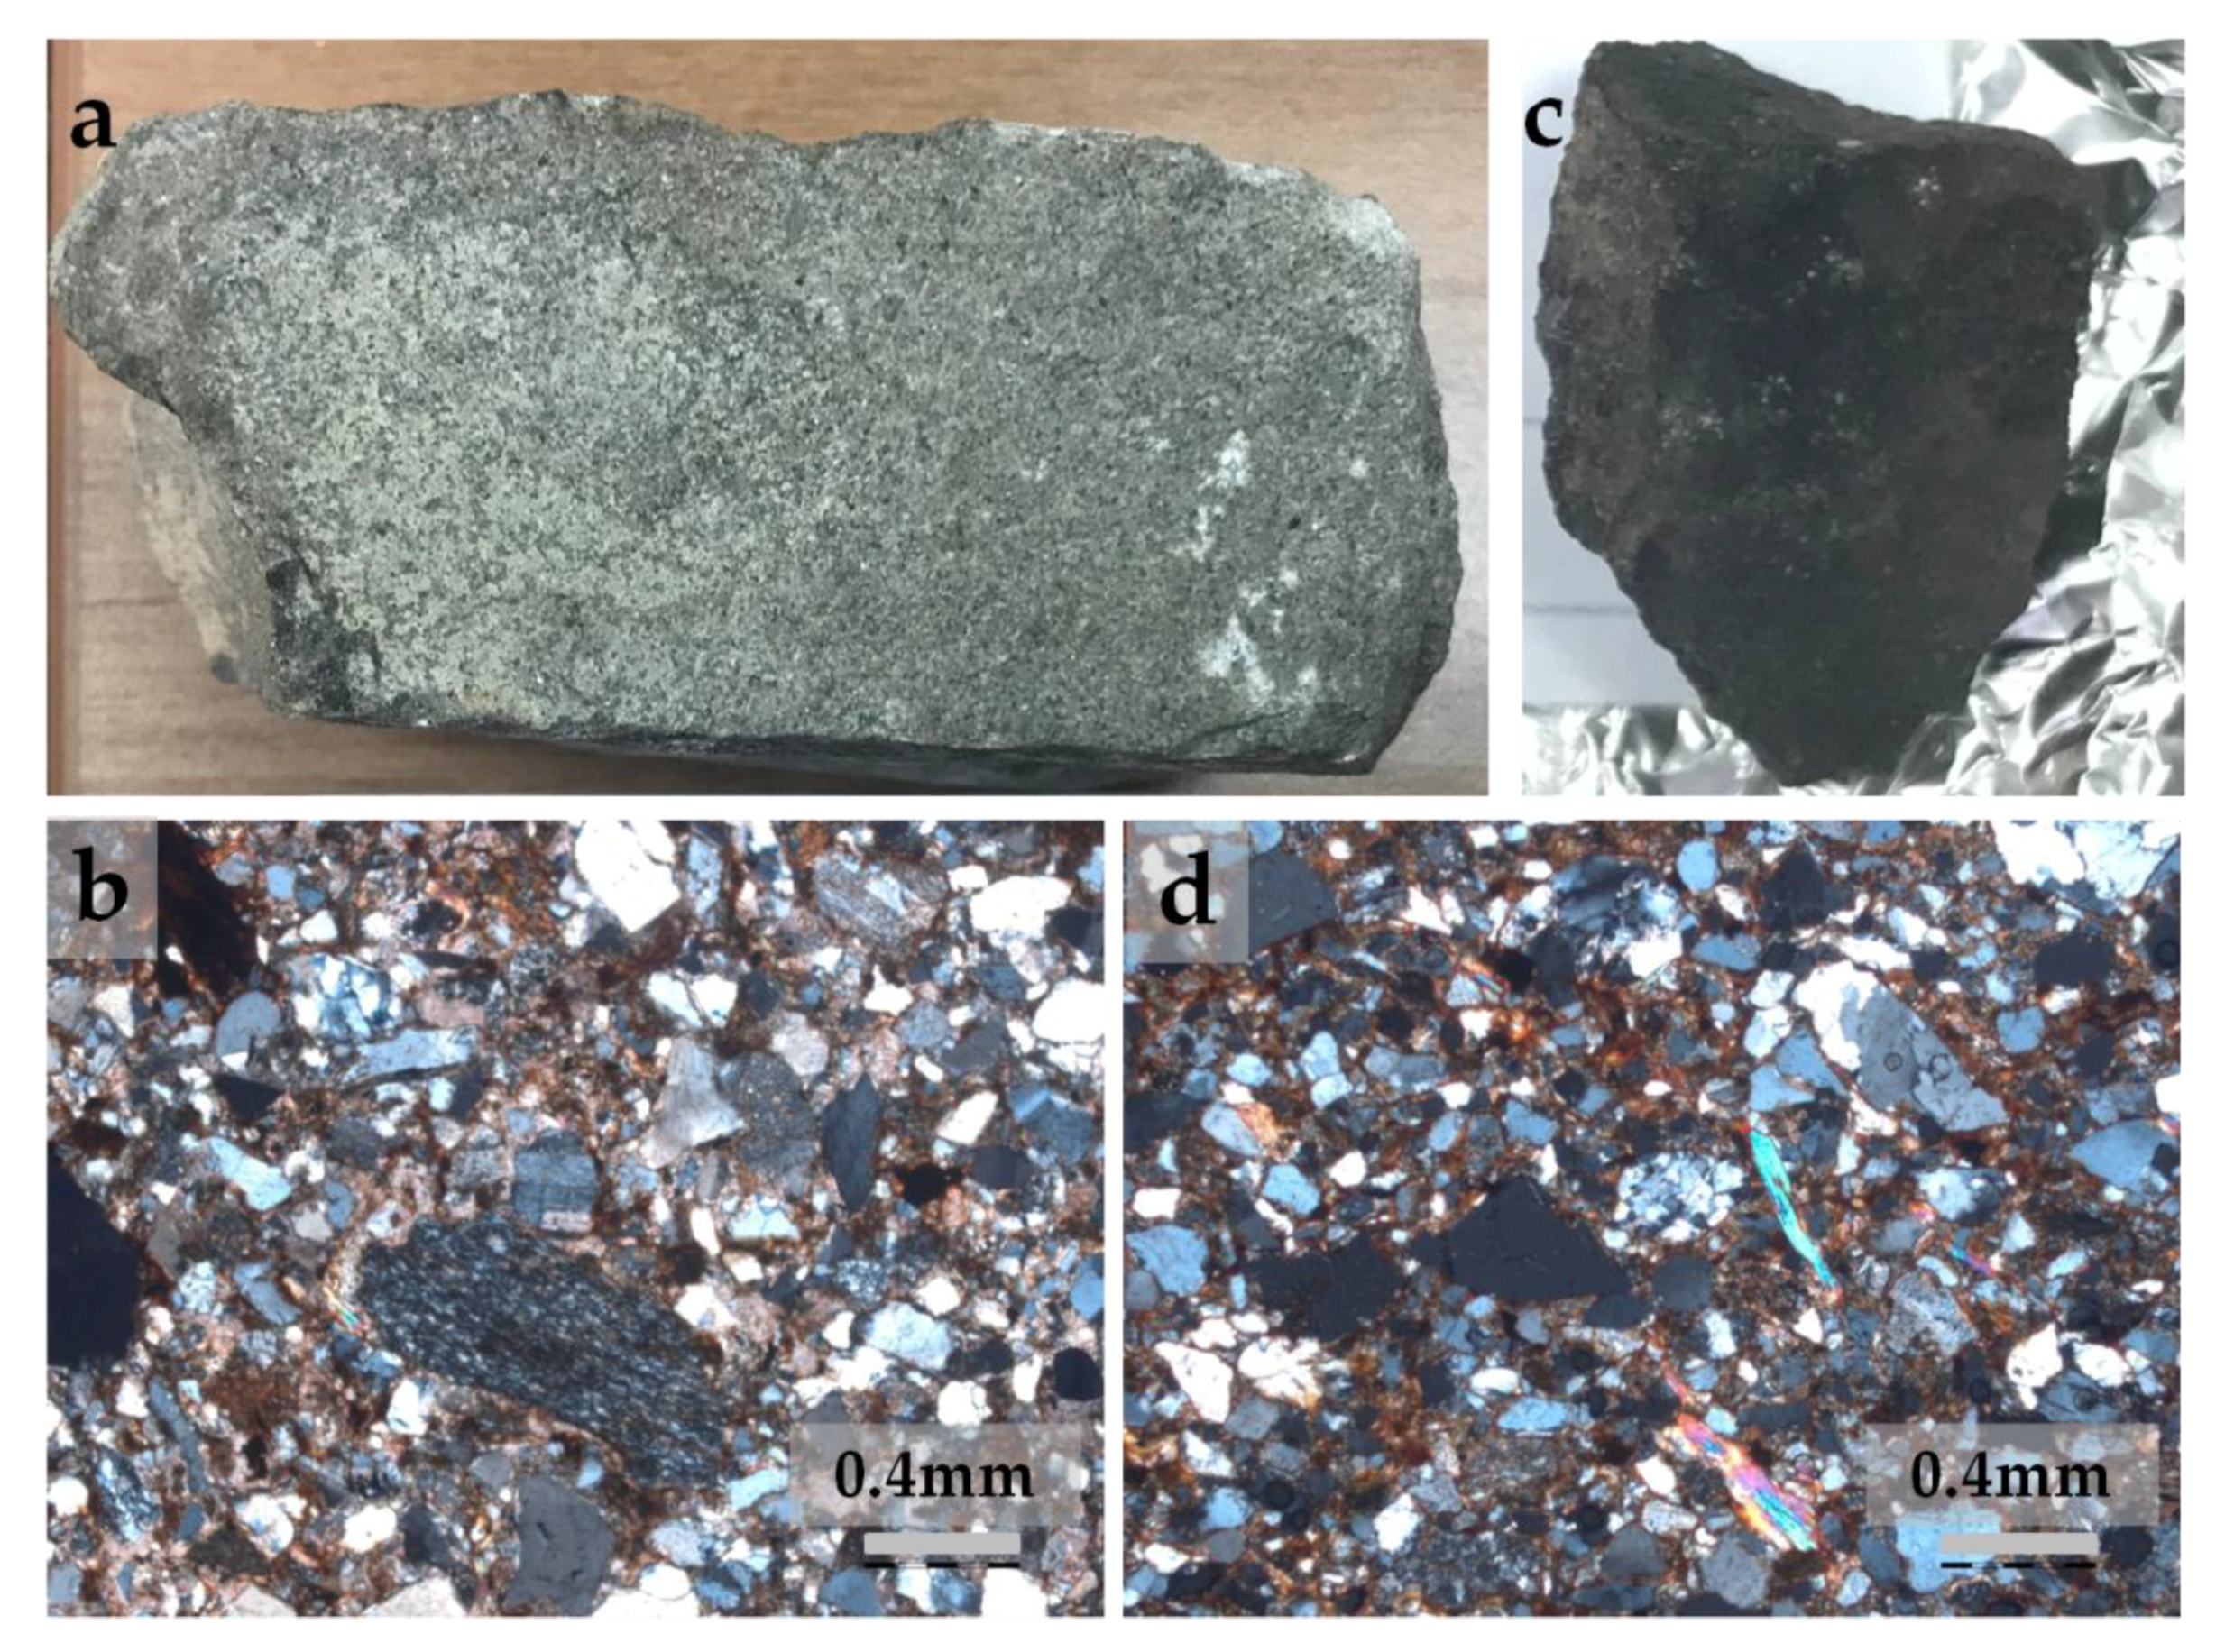
Petrographic Examination of the Lithotypes
Mineralogical Examination of the lithotypes through X-ray Diffraction
Compositional analysis of stone samples through simultaneous thermal analysis (TG/DTA)
Total Immersion Results on Stone Lithotypes
3.1.2. Investigation of the Mortars
3.1.3. Mineralogical Examination of the Mortar Samples through X-Ray Diffraction
3.1.4. Compositional Analysis of Mortar Samples through Simultaneous Thermal Analysis (TG/DTA)
3.1.5. Total Immersion Results on Mortar Samples
3.2. SHR Results
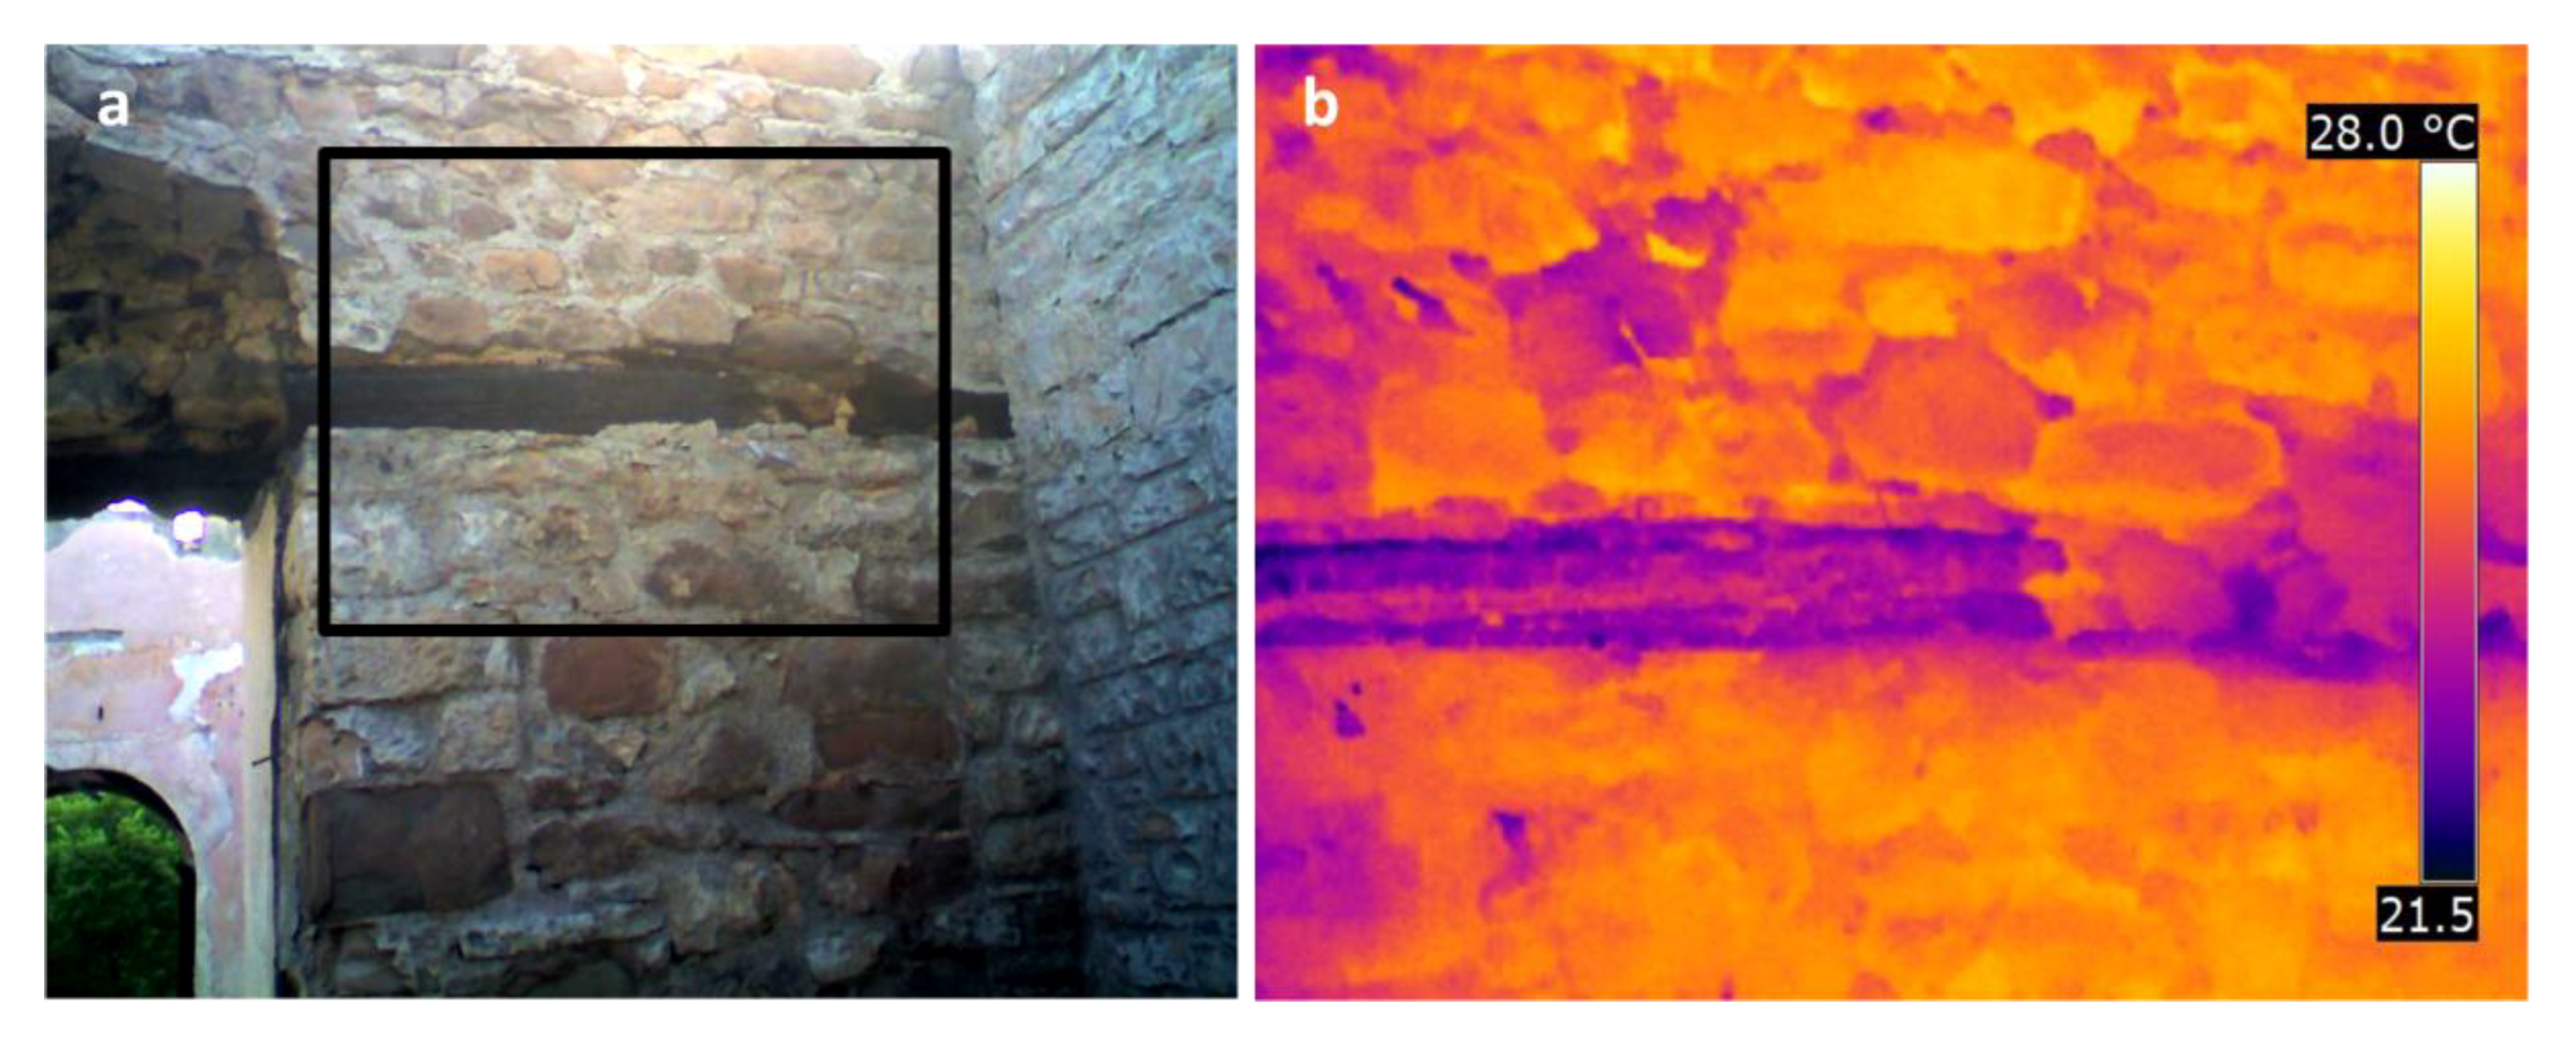
3.3. IRT Inspection
4. Conclusions
Author Contributions
Funding
Acknowledgments
Conflicts of Interest
References
- Brotóns, V.; Tomás, R.; Ivorra, S.; Alarcón, J.C. Temperature influence on the physical and mechanical properties of a porous rock: San Julian’s calcarenite. Eng. Geol. 2013, 167, 117–127. [Google Scholar] [CrossRef]
- Kompaníková, Z.; Gomez-Heras, M.; Michňová, J.; Durmeková, T.; Vlčko, J. Sandstone alterations triggered by fire-related temperatures. Environ. Earth Sci. 2014, 72, 2569–2581. [Google Scholar] [CrossRef]
- Ozguven, A.; Ozcelik, Y. Effects of high temperature on physico-mechanical properties of Turkish natural building stones. Eng. Geol. 2014, 183, 127–136. [Google Scholar] [CrossRef]
- Vázquez, P.; Shushakova, V.; Gómez-Heras, M. Influence of mineralogy on granite decay induced by temperature increase: Experimental observations and stress simulation. Eng. Geol. 2015, 189, 58–67. [Google Scholar] [CrossRef]
- Sanjurjo-Sánchez, J.; Gomez-Heras, M.; Fort, R.; Alvarez de Buergo, M.; Izquierdo Benito, R.; Angel Brud, M. Dating fires and estimating the temperature attained on stone surfaces. The case of Ciudad de Vascos (Spain). Microchem. J. 2016, 127, 247–255. [Google Scholar] [CrossRef]
- Calia, A.; Colangiuli, D.; Lettieri, M.; Quarta, G.; Masieri, M. Microscopic techniques and a multi-analytical approach to study the fire damage of the painted stuccoes from the Petruzzelli Theatre (Bari, Southern Italy). Microchem. J. 2016, 126, 42–53. [Google Scholar] [CrossRef]
- Freire-Lista, D.M.; Fort, R.; Varas-Muriel, M.J. Thermal stress-induced microcracking in building granite. Eng. Geol. 2016, 206, 83–93. [Google Scholar] [CrossRef]
- Peng, J.; Rong, G.; Cai, M.; Yao, M.; Zhou, C. Comparison of mechanical properties of undamaged and thermal-damaged coarse marbles under triaxial compression. Int. J. Rock Mech. Min. Sci. 2016, 83, 135–139. [Google Scholar] [CrossRef]
- Vazquez, P.; Acuñab, M.; Benavente, D.; Gibeaux, S.; Navarro, I.; Gomez-Heras, M. Evolution of surface properties of ornamental granitoids exposed to high temperatures. Constr. Build. Mater. 2016, 104, 263–275. [Google Scholar] [CrossRef]
- Ingham, J.P. Application of petrographic examination techniques to the assessment of fire-damaged concrete and masonry structures. Mater. Character. 2009, 60, 700–709. [Google Scholar] [CrossRef]
- Martinho, E.; Mendes, M.; Dionísio, A. 3D imaging of P-waves velocity as a tool for evaluation of heat induced limestone decay. Constr. Build. Mater. 2017, 135, 119–128. [Google Scholar] [CrossRef]
- McCabe, S.; Smith, B.J.; Warke, P.A. Exploitation of inherited weakness in fire-damaged building sandstone: The ‘fatiguing’ of ‘shocked’ stone. Eng. Geol. 2010, 115, 217–225. [Google Scholar] [CrossRef]
- Murru, A.; Freire-Lista, D.M.; Fort, R.; Varas-Muriel, M.J.; Meloni, P. Evaluation of post-thermal shock effects in Carrara marble and Santa Caterina di Pittinuri limestone. Constr. Build. Mater. 2018, 186, 1200–1211. [Google Scholar] [CrossRef]
- Haaland, M.M.; Friesem, D.E.; Miller, C.E.; Henshilwood, C.S. Heat-induced alteration of glauconitic minerals in the Middle Stone Age levels of Blombos Cave, South Africa: Implications for evaluating site structure and burning events. J. Arch. Sci. 2017, 86, 81–100. [Google Scholar] [CrossRef]
- Felicetti, R. The drilling resistance test for the assessment of fire damaged concrete. Cem. Concr. Compos. 2006, 28, 321–329. [Google Scholar] [CrossRef]
- Khoury, G.A. Effect of fire on concrete and concrete structures. Prog. Struct. Eng. Mater. 2000, 2, 429–447. [Google Scholar] [CrossRef]
- Kardamitsi-Adami, M. The Catholikon of the Monastery Varnakova and the Architect Andreas Gasparis Kalandros. Archaiologia 2011, 6, 78–84. [Google Scholar]
- Bouras, Ch.; Boura, L. Church Architecture in Greece around the 12th Century; Commercial Bank of Greece: Athens, Greece, 2002. [Google Scholar]
- Zacharopoulos, S. Topographical Study of the Holy Monastery of Panagia Varnakova, Field Report; Greece, 2002.
- Moropoulos, N. World Monuments Watch: Holy Monastery of Panagia Varnakova. 2019. submitted. [Google Scholar]
- Orlandos, A. The Monastery of Virgin Mary of Varnakova; Doric Association of Athens: Athens, Greece, 1922. [Google Scholar]
- Available online: https://www.newsit.gr/topikes-eidhseis/naypaktos-megali-fotia-tora-stin-iera-moni-varnakovas/1085140/ (accessed on 10 September 2018).
- Borelli, E. ARC Laboratory Handbook: Conservation of Architectural Heritage, Historic Structures and Materials. 2. Porosity; International Centre for the Study of the Preservation and the Restoration of Cultural Property: Rome, Italy, 1999. [Google Scholar]
- Demirdag, S.; Yavuz, H.; Altindag, R. The effect of sample size on Schmidt rebound hardness value of rocks. Int. J. Rock Mech. Min. Sci. 2009, 46, 725–730. [Google Scholar] [CrossRef]
- Fort, R.; Alvarez de Buergo, M.; Perez-Monserrat, E.M. Non-destructive testing for the assessment of granite decay in heritage structures compared to quarry stone. Int. J. Rock Mech. Min. Sci. 2013, 61, 296–305. [Google Scholar] [CrossRef]
- Matthews, J.A.; Owen, G.; Winkler, S.; Vater, A.E.; Wilson, P.; Mourne, R.W.; Hill, J.L. A rock-surface microweathering index from Schmidt hammer R-values and its preliminary application to some common rock types in southern Norway. Catena 2016, 143, 35–44. [Google Scholar] [CrossRef]
- Proceq. Operating Instructions Beton Prüfhammer N/NR-L/LR; Proceq SA: Schweizenbach, Zurich, Switzerland, 2006. [Google Scholar]
- Vasanelli, E.; Sileo, M.; Calia, A.; Aiello, M.A. Non-destructive techniques to assess mechanical and physical properties of soft calcarenitic stones. Procedia Chem. 2013, 8, 35–44. [Google Scholar] [CrossRef]
- Vasanelli, E.; Calia, A.; Colangiuli, D.; Micelli, F.; Aiello, M.A. Assessing the reliability of non-destructive and moderately invasive techniques for the evaluation of uniaxial compressive strength of stone masonry units. Constr. Build. Mater. 2016, 124, 575–581. [Google Scholar] [CrossRef]
- Alexakis, E.; Delegou, E.T.; Lampropoulos, K.C.; Apostolopoulou, M.; Ntoutsi, I.; Moropoulou, A. NDT as a monitoring tool of the works progress and the assessment of materials and rehabilitation interventions at the Holy Aedicule of the Holy Sepulchre. Constr. Build. Mater. 2018, 189, 512–526. [Google Scholar] [CrossRef]
- Borg, R.P.; Hajpál, M.; Torok, Á. The fire performance of limestone. In Applications of Structural Fire Engineering 2013; Czech Technical University: Prague, Czech Republic, 2013. [Google Scholar]
- Sirdesai, N.N.; Mahanta, B.; Ranjith, P.G.; Singh, T.N. Effects of thermal treatment on physico-morphological properties of Indian fine-grained sandstone. Bull. Eng. Geol. Environ. 2019, 78, 883–897. [Google Scholar] [CrossRef]
- Moropoulou, A.; Bakolas, A.; Anagnostopoulou, S. Composite materials in ancient structures. Cem. Concr. Compos. 2005, 27, 295–300. [Google Scholar] [CrossRef]
- Moropoulou, A.; Polikreti, K.; Bakolas, A.; Michailidis, P. Correlation of physicochemical and mechanical properties of historical mortars and classification by multivariate statistics. Cem. Concr. Res. 2003, 33, 891–898. [Google Scholar] [CrossRef]


| Stone Sample Code | Sample Description |
|---|---|
| V1 | Sandstone of green hue. Collected from intermediate historic masonry, which is seemingly unaffected by the fire area (based on visual inspection). Second most abundant stone type used in the monument. |
| V2 | Sandstone sample, collected from intermediate historic masonry, from a fire-affected area of the masonry. |
| V5 | Compact black stone collected from a severely fire-affected area of the intermediate masonry. |
| V6 | Grey-beige limestone from the new masonry (internal wall), which is a seemingly unaffected by the fire area. |
| V7 | Grey-beige limestone from the historic intermediate masonry, affected by the fire. |
| V8 | Grey-beige limestone from the new masonry (internal wall), affected by the fire. |
| V9 | Limestone, with two distinct zones, one black and one grey-beige, the later similar to V7, unaffected by the fire (based on visual inspection). |
| V10 | Limestone, with two distinct zones (beige-gray and black), severely affected by fire. |
| Sample Code | Mineralogical Composition (XRD Analysis) | |
|---|---|---|
| Principal mineralogical components | Accessory mineralogical components | |
| V1 | Quartz | calcite, albite, microcline, muscovite, chlorite |
| V2 | Quartz | calcite, albite, muscovite, and chlorite |
| V6 | Calcite | quartz |
| V7 | Calcite | quartz |
| V8 | Calcite | quartz |
| Stone Sample Code | Mass Loss (%) per Temperature Range (°C) | |||
|---|---|---|---|---|
| <120 °C | 120–200 °C | 200–600 °C | >600 °C | |
| V1 | 0.20 | 0.04 | 1.19 | 5.44 |
| V2 | 1.11 | 0.13 | 1.04 | 1.64 |
| V6 | 0.14 | 0.03 | 0.23 | 39.30 |
| V7 | 0.17 | 0.02 | 0.36 | 38.99 |
| V8 | 0.12 | 0.01 | 0.16 | 38.92 |
| Stone Sample Code | Porosity (%) | Bulk Density (g/cm3) | W.A.C. (%) |
|---|---|---|---|
| V1 | 3.7 | 2.4 | 1.5 |
| V2 | 6.1 | 2.2 | 2.8 |
| V6 | 2.6 | 2.3 | 1.1 |
| V7 | 2.9 | 2.1 | 1.4 |
| V8 | 2.1 | 2.3 | 0.9 |
| Mortar Sample Code | Sample Description | DM Image |
|---|---|---|
| Vm1 | Structural soft mortar of clay texture and light-orange hue with blackened external surface due to the smoke deposition-upper part of the historical intermediate masonry (above 2 m). |  |
| Vm2 | Joint mortar of cementitious texture from a severely fire-affected area from the middle part of the new masonry (~1.5 m). |  |
| Vm3 | Structural soft mortar of clay texture and dark-orange hue from the upper part of the historical intermediate masonry (above 2 m). |  |
| Vm4 | Structural soft mortar of clay texture and yellow hue from the upper part of the historical intermediate masonry (above 2 m). |  |
| Vm5 | Structural soft mortar of clay texture and yellow hue from the upper part of the historical intermediate masonry (above 2 m). |  |
| Vm6 | In-depth mortar of mixed cementitious and clay texture from a severely fire-affected area at the lower part of the historical intermediate masonry (<1 m). |  |
| Vm7 | Joint mortar of cementitious texture from a severely fire-affected area with blackened external surface due to smoke deposition - lower part of the historical intermediate masonry (same sampling area with Vm6, <1 m) |  |
| Vm8 | Structural soft mortar of clay texture and yellow hue from the upper part of the historical intermediate masonry (above 2 m). |  |
| Vm9 | Joint mortar of cementitious texture and pinkish hue from a severely fire-affected area at the lower part of the new masonry (<1 m). |  |
| Sample Code | Mineralogical Composition (XRD Analysis) | |
|---|---|---|
| Principal mineralogical components | Accessory mineralogical components | |
| Vm1 | Quartz | Calcite, albite, muscovite |
| Vm2 | Calcite | Quartz, albite |
| Vm3 | Quartz | Calcite, muscovite, albite |
| Vm4 | Quartz | Calcite, muscovite, chlorite |
| Vm5 | Quartz | Microcline, albite, calcite, muscovite, chlorite, |
| Vm6 | Quartz, calcite | Muscovite |
| Vm7 | Calcite, quartz | albite |
| Vm8 | Quartz | calcite, muscovite, microcline, chlorite |
| Vm9 | Calcite, quartz | - |
| Mortar Sample Code | Mass Loss (%) per Temperature Range (°C) | CO2/H2OCBW | |||
|---|---|---|---|---|---|
| <120 °C | 120–200 °C | 200–600 °C | >600 °C | ||
| Vm1 | 1.17 | 0.44 | 4.02 | 7.96 | 1.98 |
| Vm2 | 0.54 | 0.22 | 1.49 | 20.19 | 13.55 |
| Vm3 | 1.00 | 0.25 | 2.84 | 8.32 | 2.93 |
| Vm4 | 1.17 | 0.45 | 4.32 | 8.41 | 1.95 |
| Vm5 | 1.23 | 0.43 | 3.81 | 7.33 | 1.92 |
| Vm6 | 1.23 | 0.27 | 3.31 | 14.45 | 4.37 |
| Vm7 | 1.37 | 0.51 | 2.99 | 20.93 | 7.00 |
| Vm8 | 1.28 | 0.47 | 4.04 | 6.62 | 1.64 |
| Vm9 | 1.50 | 0.62 | 3.11 | 18.57 | 5.97 |
| Mortar Sample Code | Porosity (%) | Bulk Density (g/cm3) | W.A.C. (%) |
|---|---|---|---|
| Vm2 | 17.00 | 1.45 | 14.33 |
| Vm4 | 31.18 | 1.63 | 25.38 |
| Vm9 | 22.00 | 1.34 | 17.15 |
| AREA 1 | |||
|---|---|---|---|
| Type of Lithotype | Rm | Rmedian | COV% |
| 1.Beige - grey limestone | 51.04 ± 1.97 | 50.00 ± 1.25 | 7.6 |
| 2. Sandstone | 43.96 ± 3.14 | 44.00 ± 2.25 | 7.14 |
| 3.Black chert inclusion | 56.92 ± 4.72 | 58.50 ± 5.3 | 8.30 |
| 4.Beige - grey limestone | |||
| 4a. Black calcite vein | 47.58 ± 14.20 | 42.75 ± 7.75 | 29.84 |
| 4b. Beige-grey limestone | 50.08 ± 5.22 | 49.50 ± 3.50 | 10.42 |
| AREA 2- Under 50 cm Height | |||
| Type of Lithotype | Rm | Rmedian | COV% |
| 1. Sandstone | 42.14 ± 2.67 | 42.00 ± 3.00 | 6.34 |
| 2. Black chert | 30.00 ± 3.96 | 30.50 ± 4.50 | 13.19 |
| 3. Beige-grey limestone | 15.79 ± 1.95 | 16.25 ± 2.00 | 12.38 |
| AREA 2 –above 1 m height | |||
| 4. Beige-grey limestone | 17.14 ± 1.52 | 17.00 ± 1.10 | 8.87 |
| 5. Sandstone | 36.87 ± 2.54 | 36.90 ± 2.5 | 6.88 |
| Sub-Area 6 | |||
| 6. Sandstone | 25.83 ± 5.29 | 28.00 ± 6.00 | 20.46 |
| AREA3 | |||
|---|---|---|---|
| Type of Lithotype | Rm | Rmedian | COV% |
| 1. Sandstone | 47.35 ± 1.33 | 47.00 ± 0.85 | 2.82 |
| 2. Sandstone | 34.57 ± 4.02 | 34.50 ± 4.50 | 11.64 |
| 3. Beige- grey limestone | 42.5 ± 5.62 | 43.00 ± 5.25 | 13.22 |
| 4. Beige-grey limestone | 46.16 ± 4.69 | 44.50 ± 5.30 | 10.17 |
| AREA 4 | |||
|---|---|---|---|
| Type of Fire-Affected Zone | Rm | Rmedian | COV% |
| Fire Affected Zone (FAZ) | |||
| FAZ burnt front | 23.86 ± 1.95 | 23.50 ± 2.50 | 8.18 |
| FAZ burnt zone | 32.57 ± 1.99 | 33.50 ± 2.50 | 6.10 |
| Zone between FAZ & FUZ | 48.93±3.67 | 48.50 ± 3.10 | 7.5 |
| Fire Unaffected Zone (FUZ) | |||
| FUZ middle side | 50.25 ± 4.80 | 49.50 ± 5.50 | 9.5 |
| FUZ outer side | 57.14 ± 3.38 | 56.00 ± 4.00 | 5.91 |
© 2019 by the authors. Licensee MDPI, Basel, Switzerland. This article is an open access article distributed under the terms and conditions of the Creative Commons Attribution (CC BY) license (http://creativecommons.org/licenses/by/4.0/).
Share and Cite
Delegou, E.T.; Apostolopoulou, M.; Ntoutsi, I.; Thoma, M.; Keramidas, V.; Papatrechas, C.; Economou, G.; Moropoulou, A. The Effect of Fire on Building Materials: The Case-Study of the Varnakova Monastery Cells in Central Greece. Heritage 2019, 2, 1233-1259. https://doi.org/10.3390/heritage2020080
Delegou ET, Apostolopoulou M, Ntoutsi I, Thoma M, Keramidas V, Papatrechas C, Economou G, Moropoulou A. The Effect of Fire on Building Materials: The Case-Study of the Varnakova Monastery Cells in Central Greece. Heritage. 2019; 2(2):1233-1259. https://doi.org/10.3390/heritage2020080
Chicago/Turabian StyleDelegou, Ekaterini T., Maria Apostolopoulou, Ioanna Ntoutsi, Marina Thoma, Vasileios Keramidas, Christos Papatrechas, George Economou, and Antonia Moropoulou. 2019. "The Effect of Fire on Building Materials: The Case-Study of the Varnakova Monastery Cells in Central Greece" Heritage 2, no. 2: 1233-1259. https://doi.org/10.3390/heritage2020080
APA StyleDelegou, E. T., Apostolopoulou, M., Ntoutsi, I., Thoma, M., Keramidas, V., Papatrechas, C., Economou, G., & Moropoulou, A. (2019). The Effect of Fire on Building Materials: The Case-Study of the Varnakova Monastery Cells in Central Greece. Heritage, 2(2), 1233-1259. https://doi.org/10.3390/heritage2020080