Integrating Non-Destructive Testing, Laser Scanning, and Numerical Modeling for Damage Assessment: The Room of the Elements


Abstract
1. Introduction
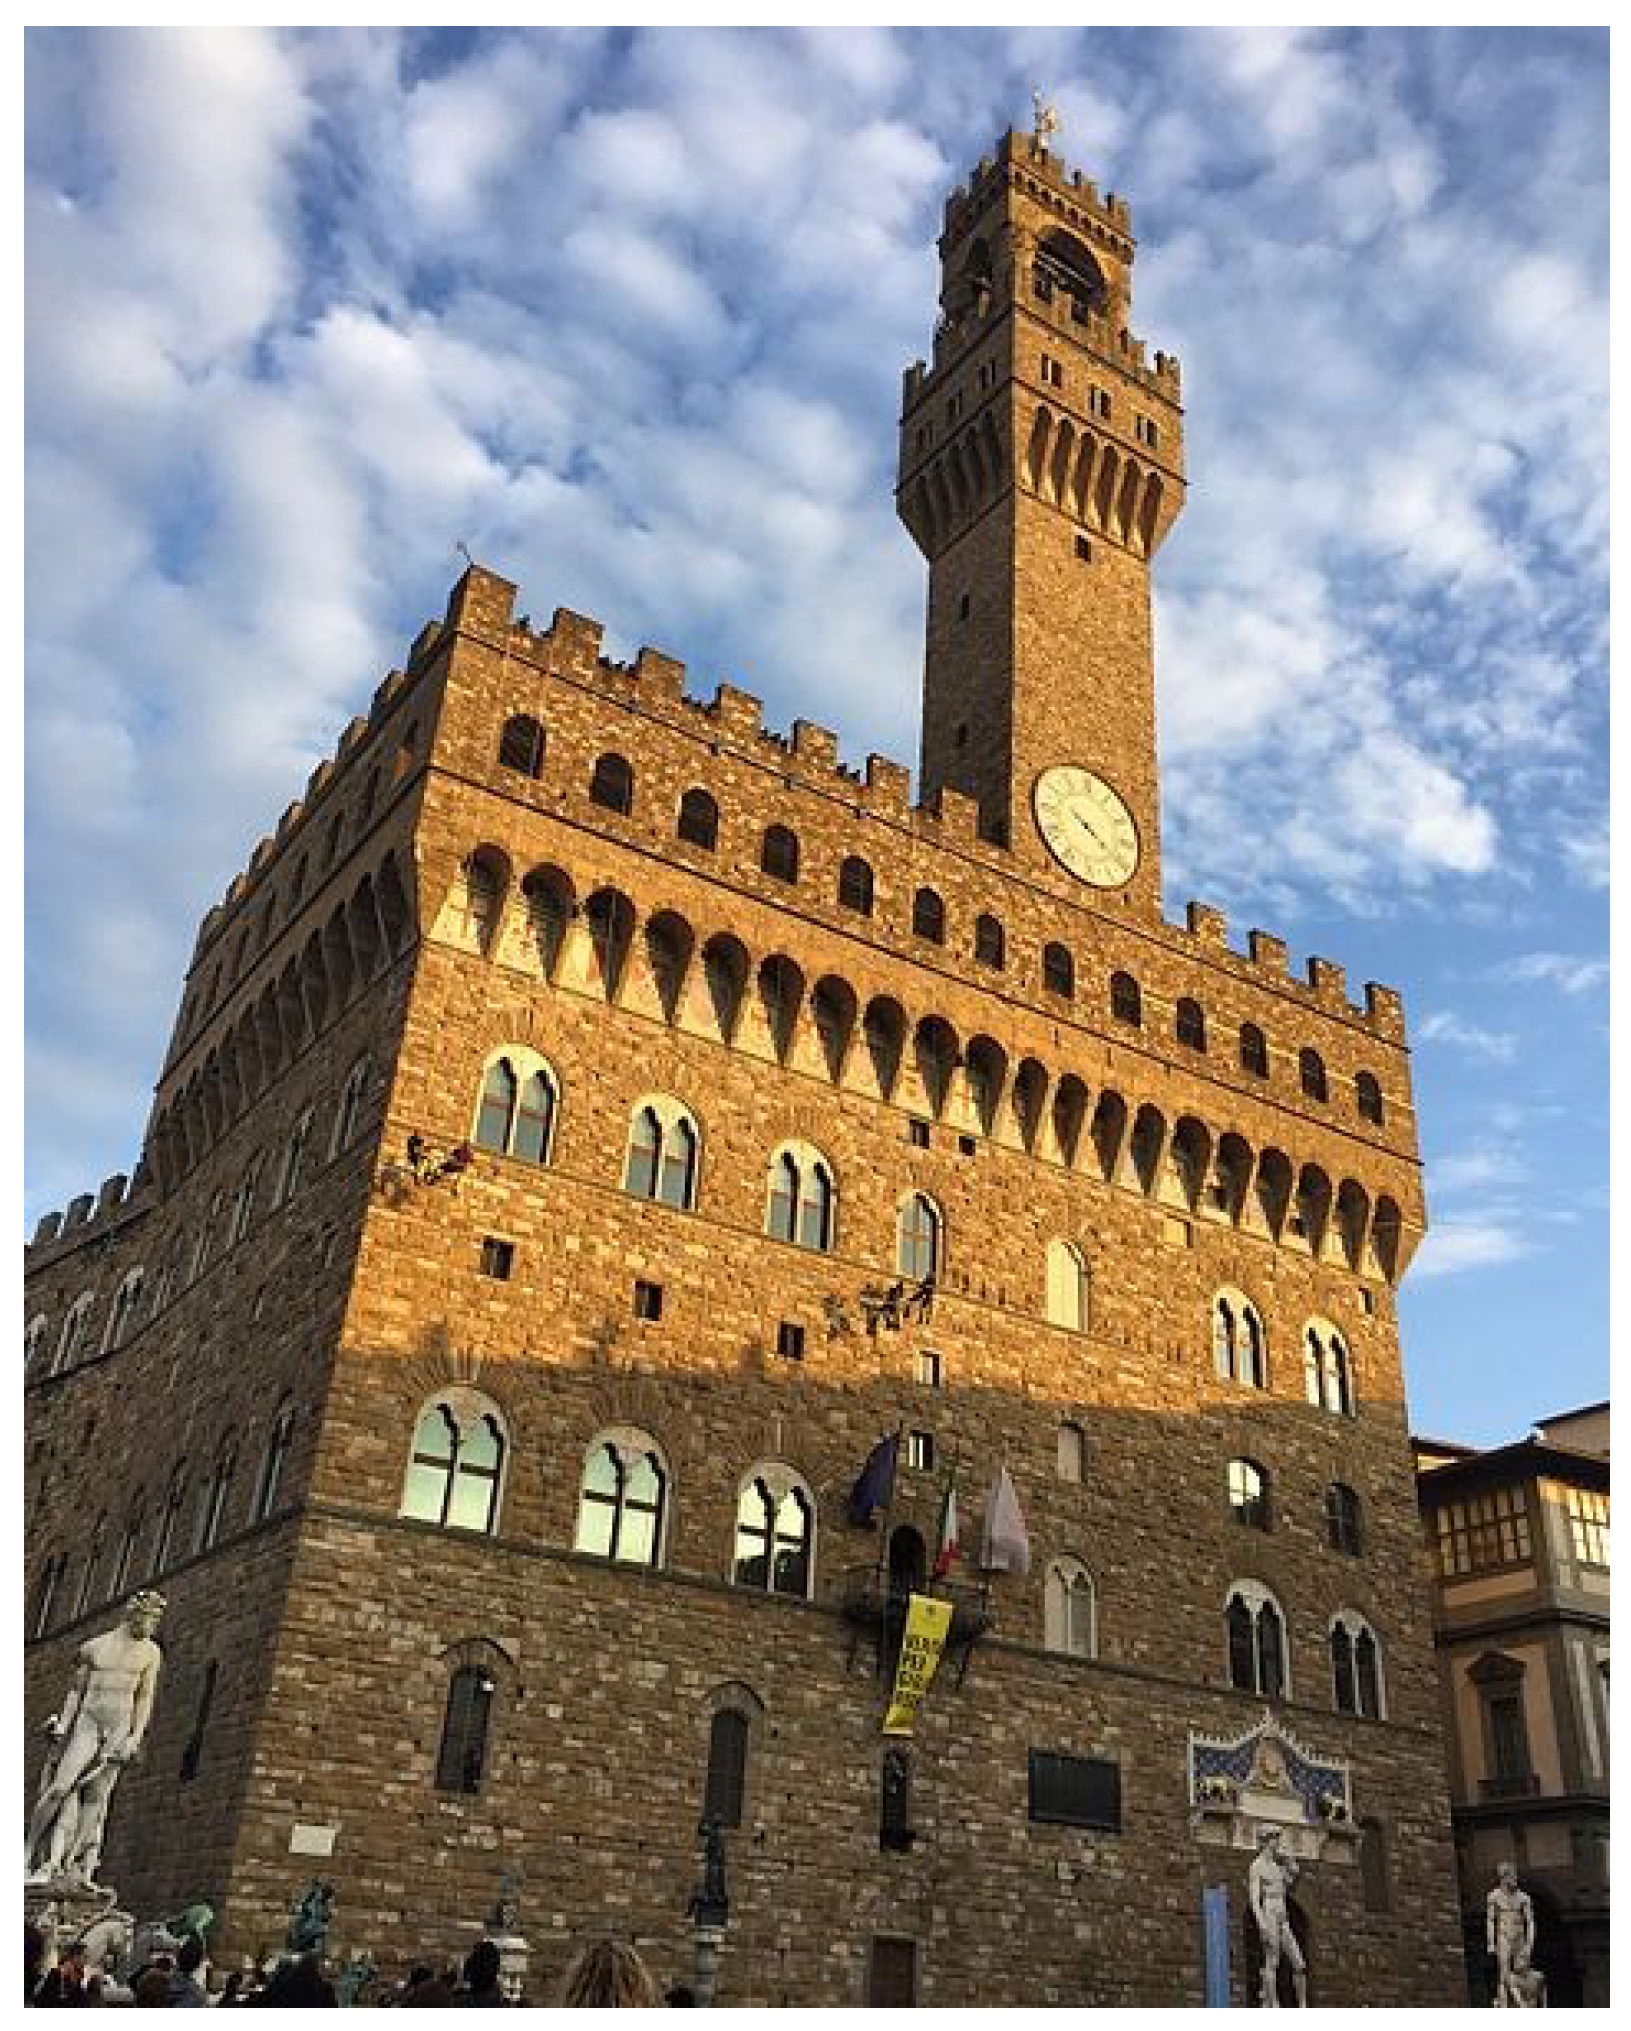
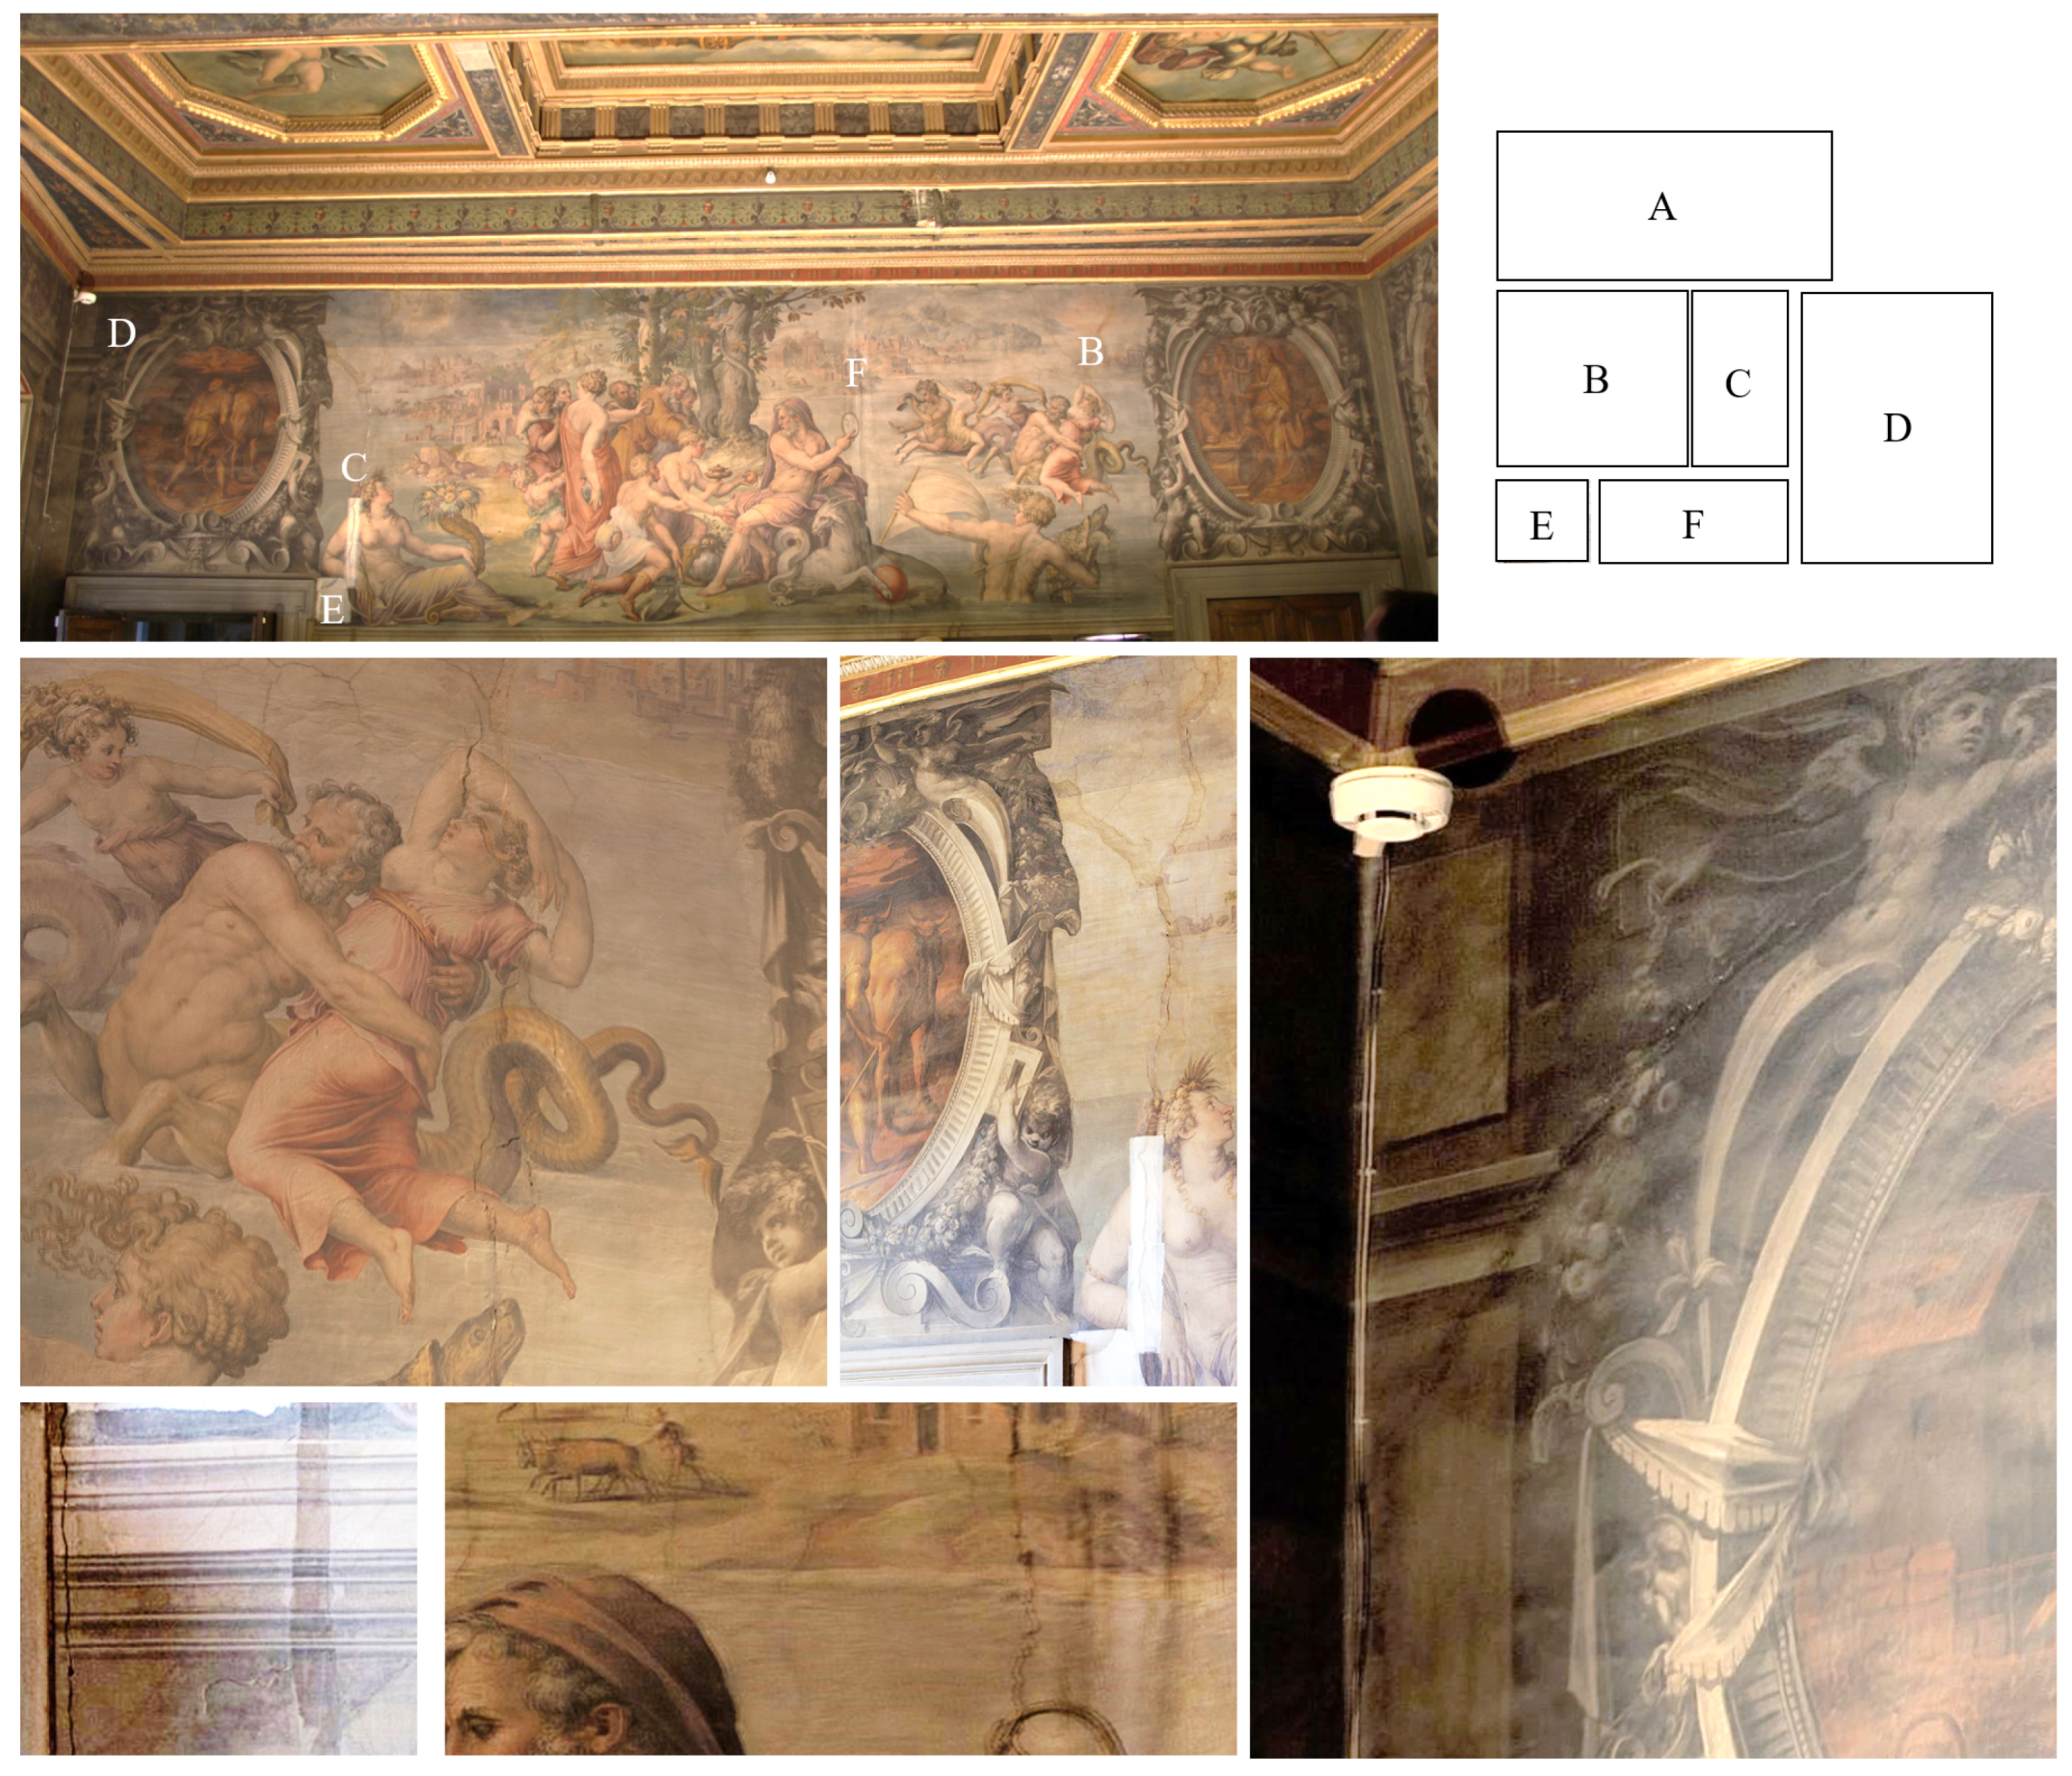
2. Case Study
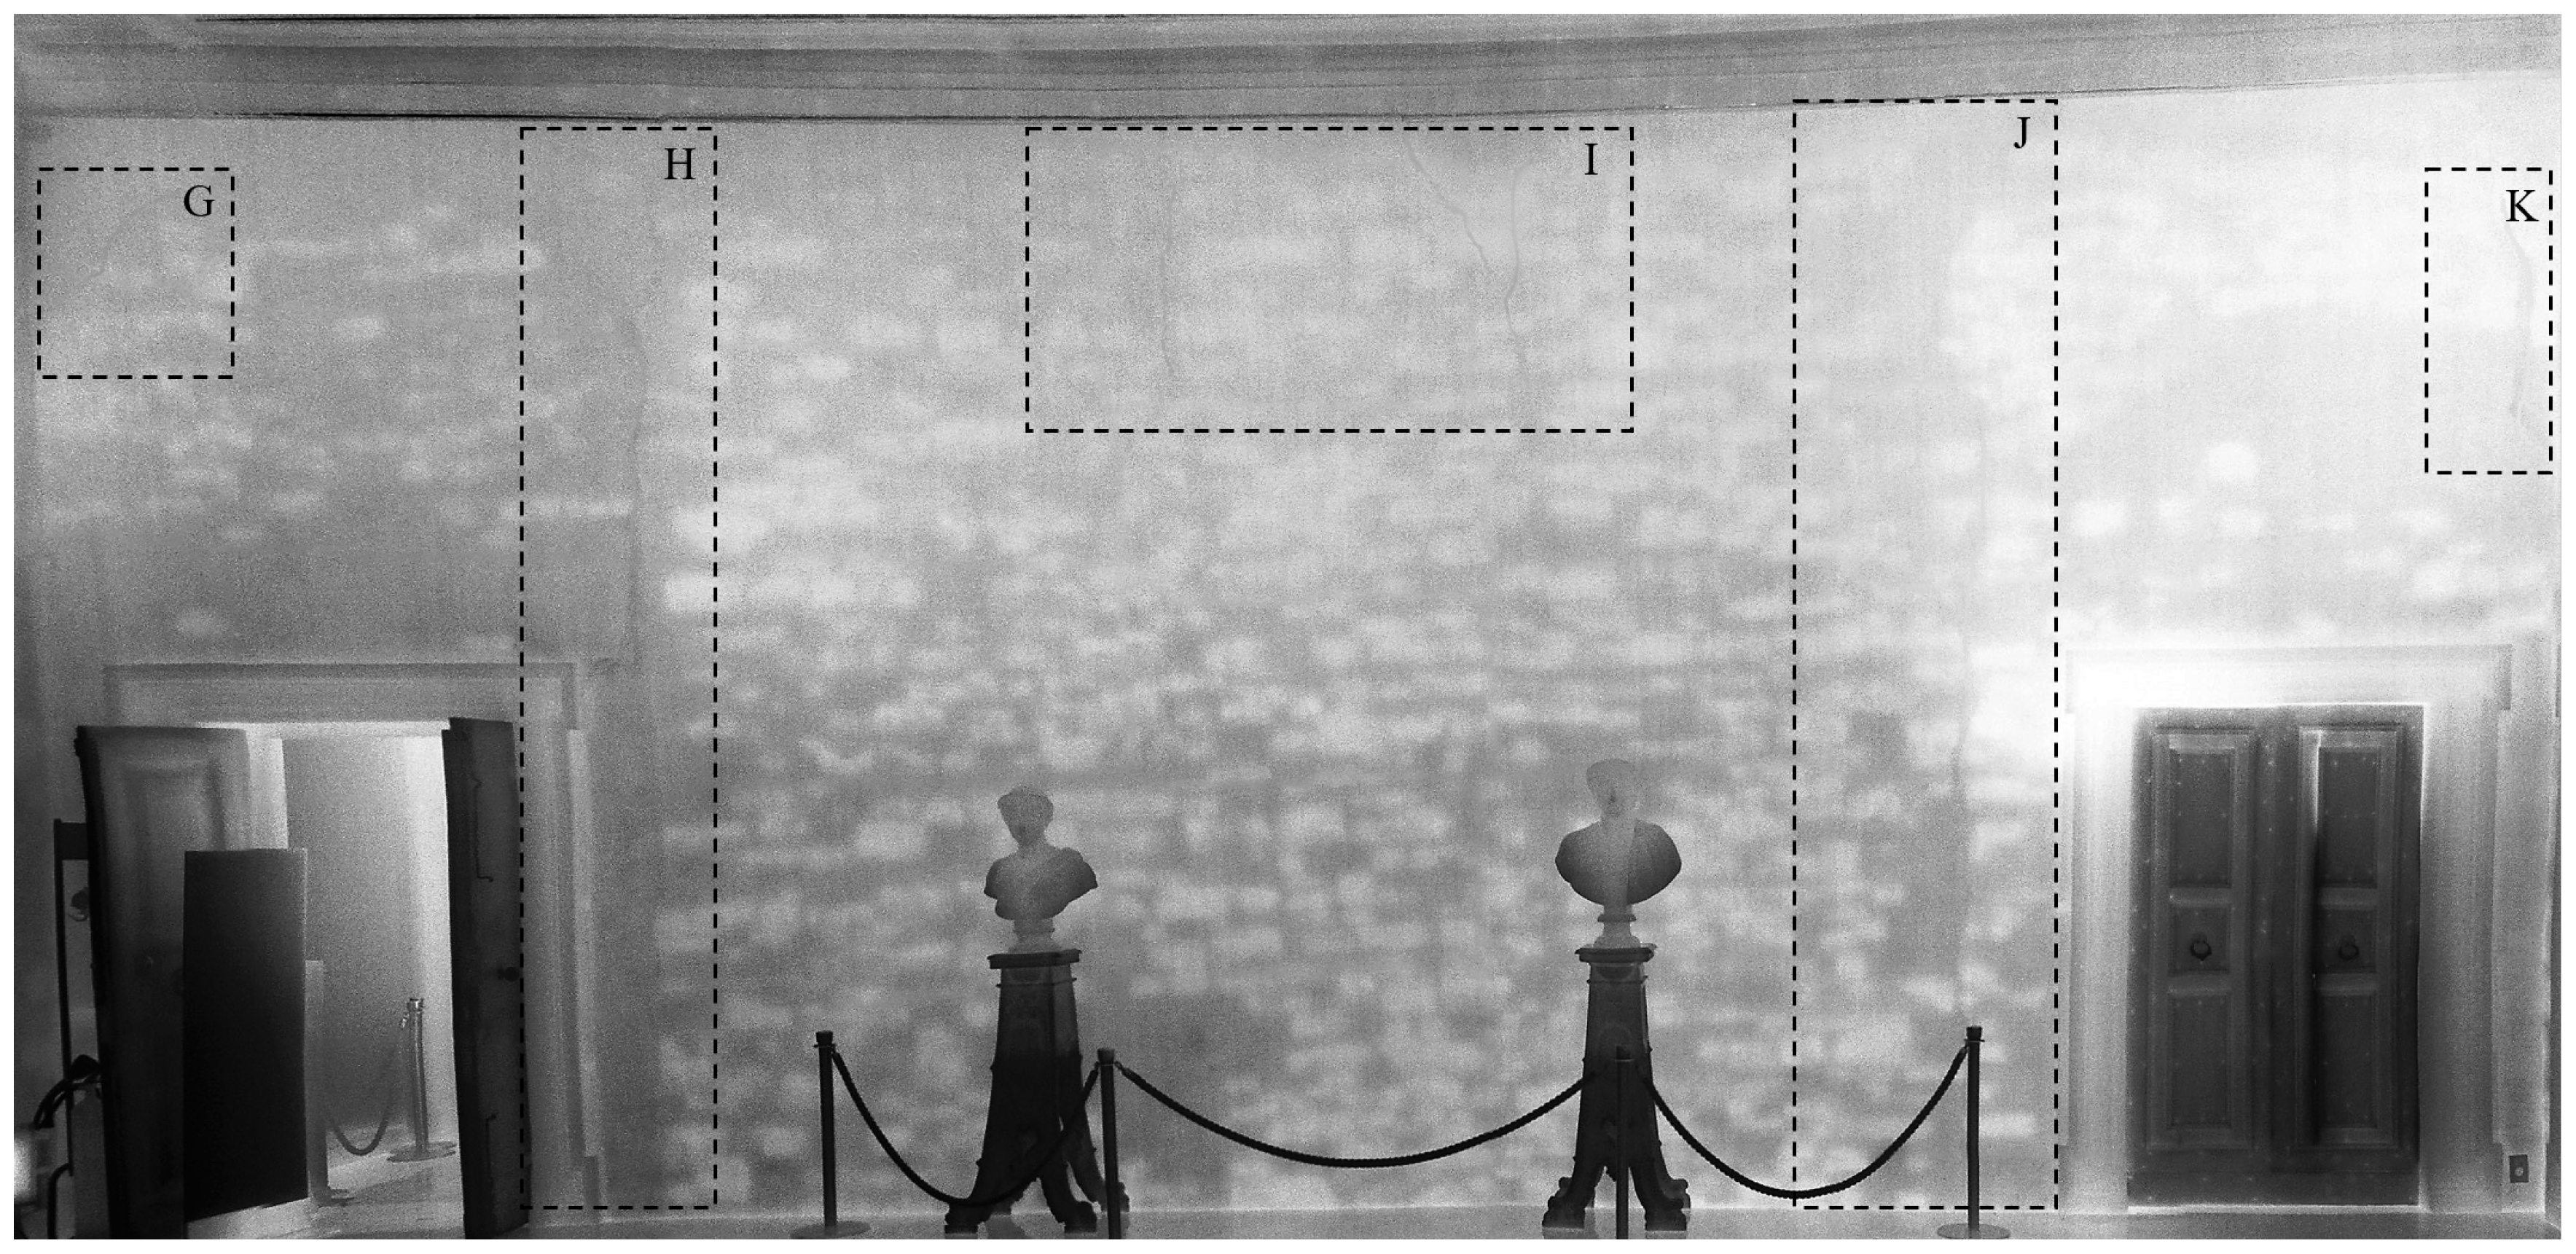
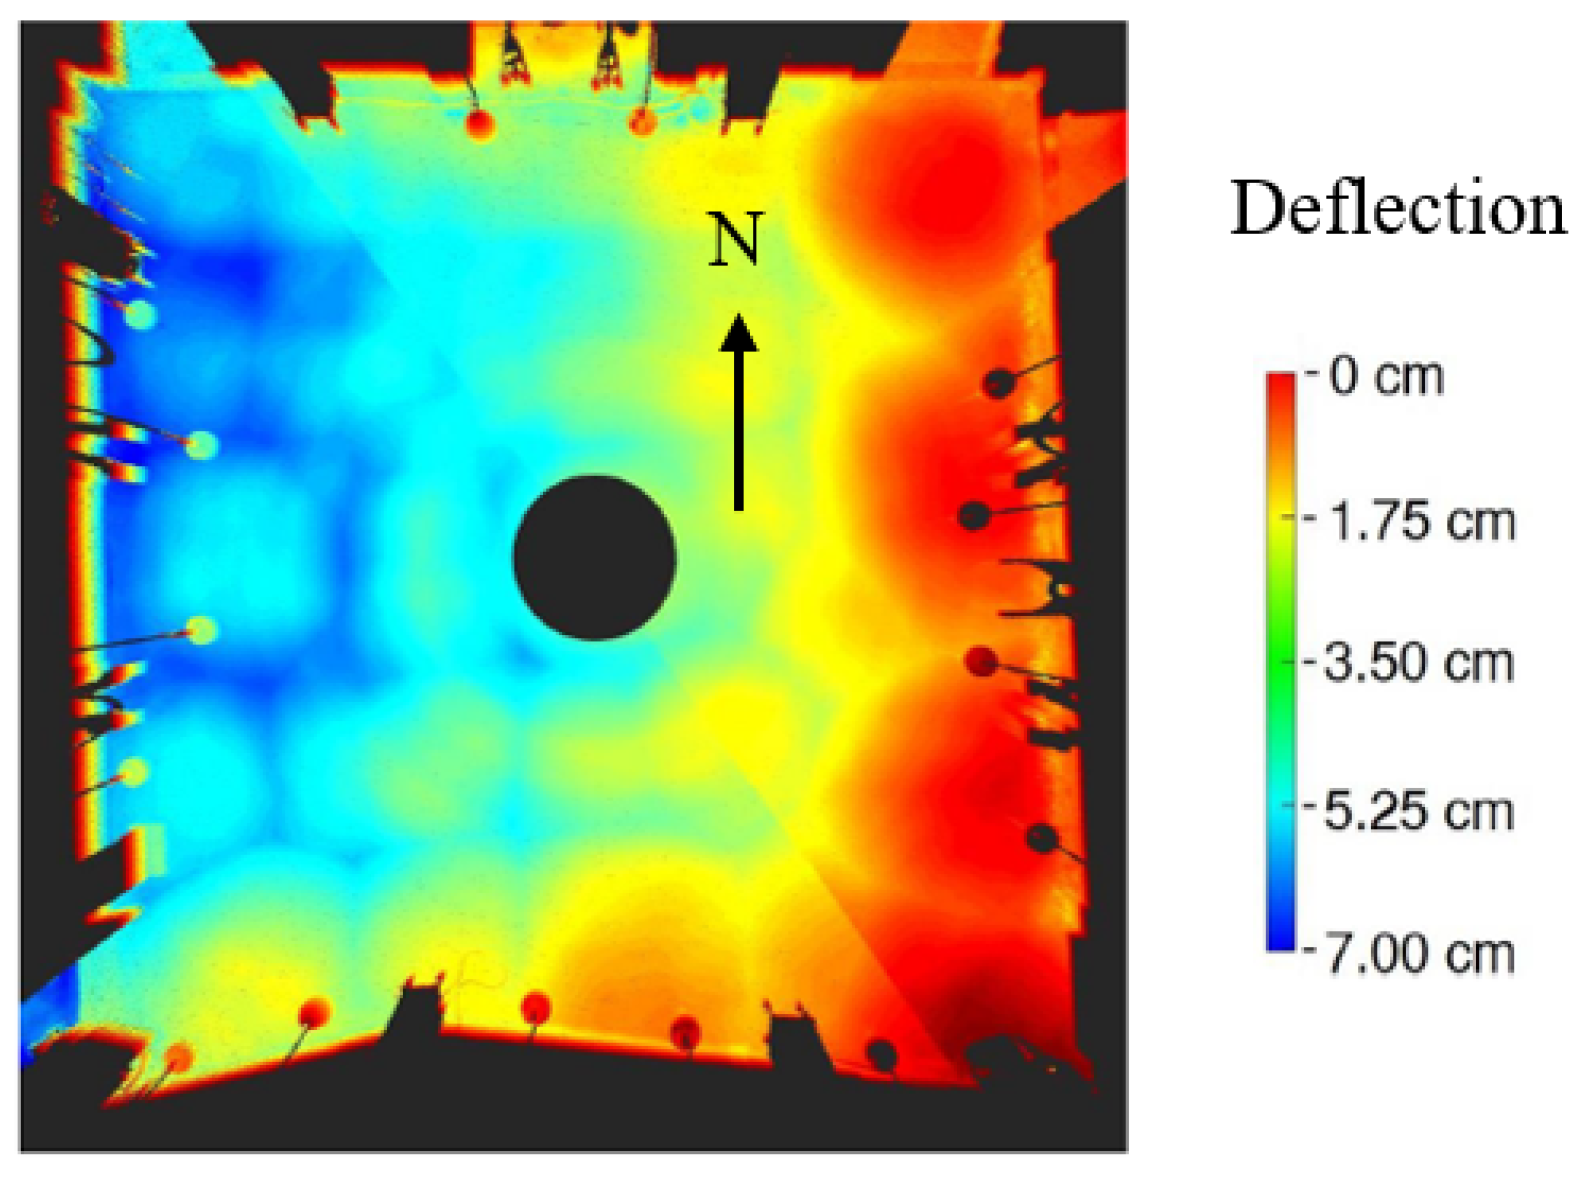
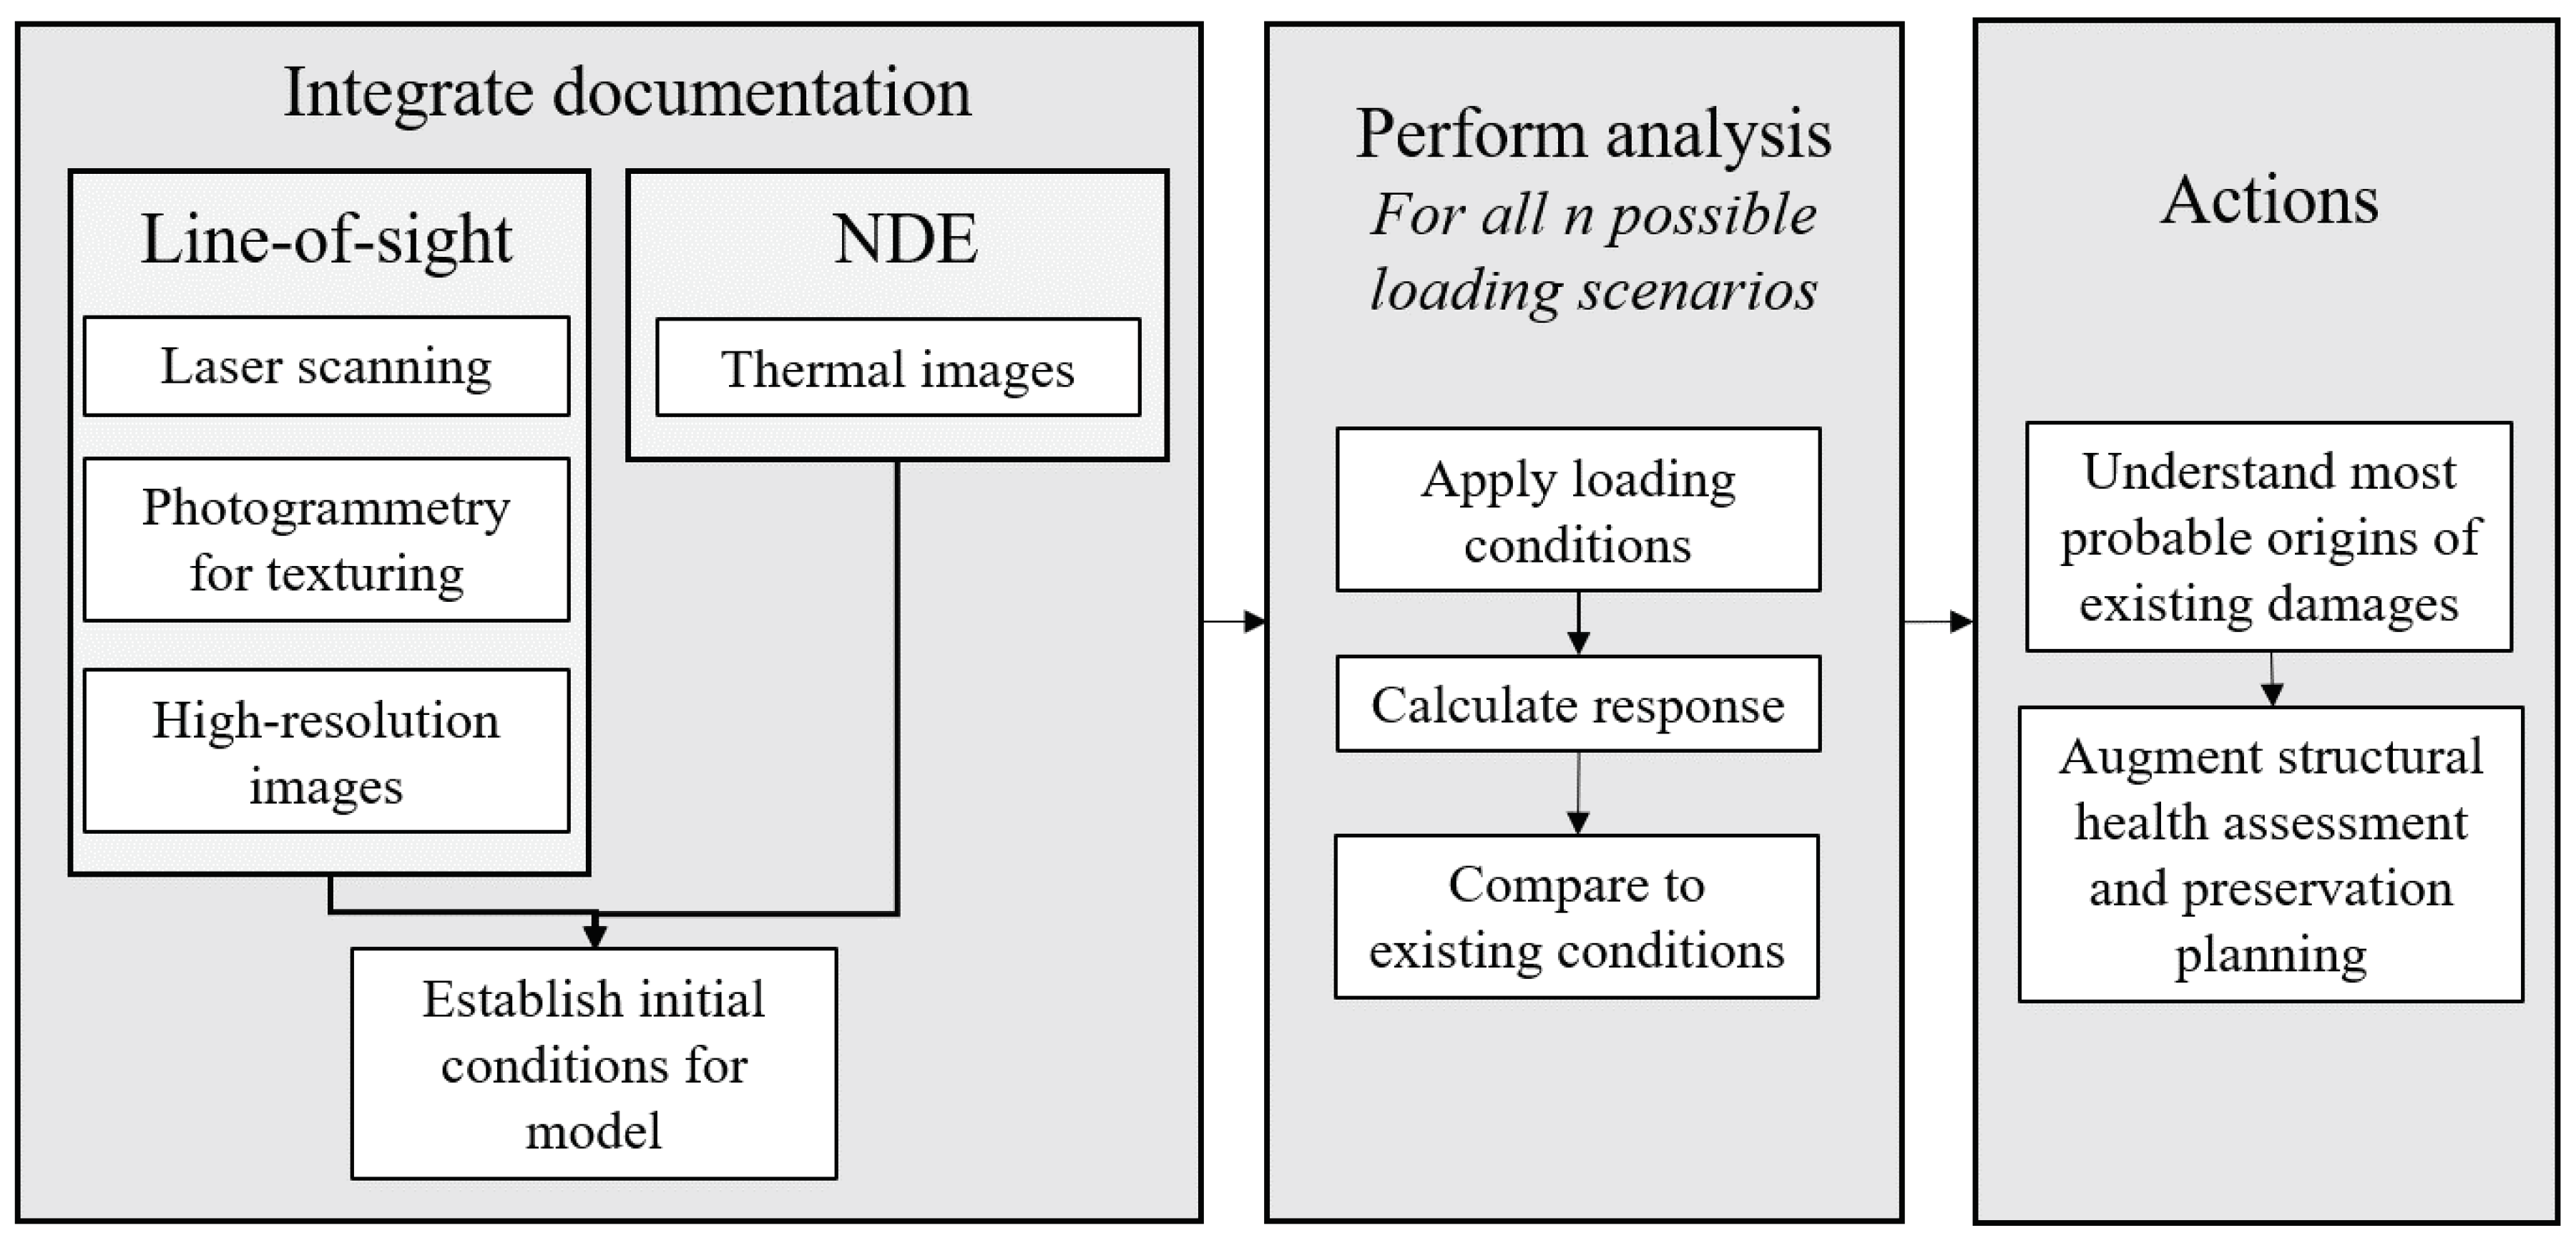
3. Line-Of-Sight Methods for Documentation
4. Non-Destructive Evaluation
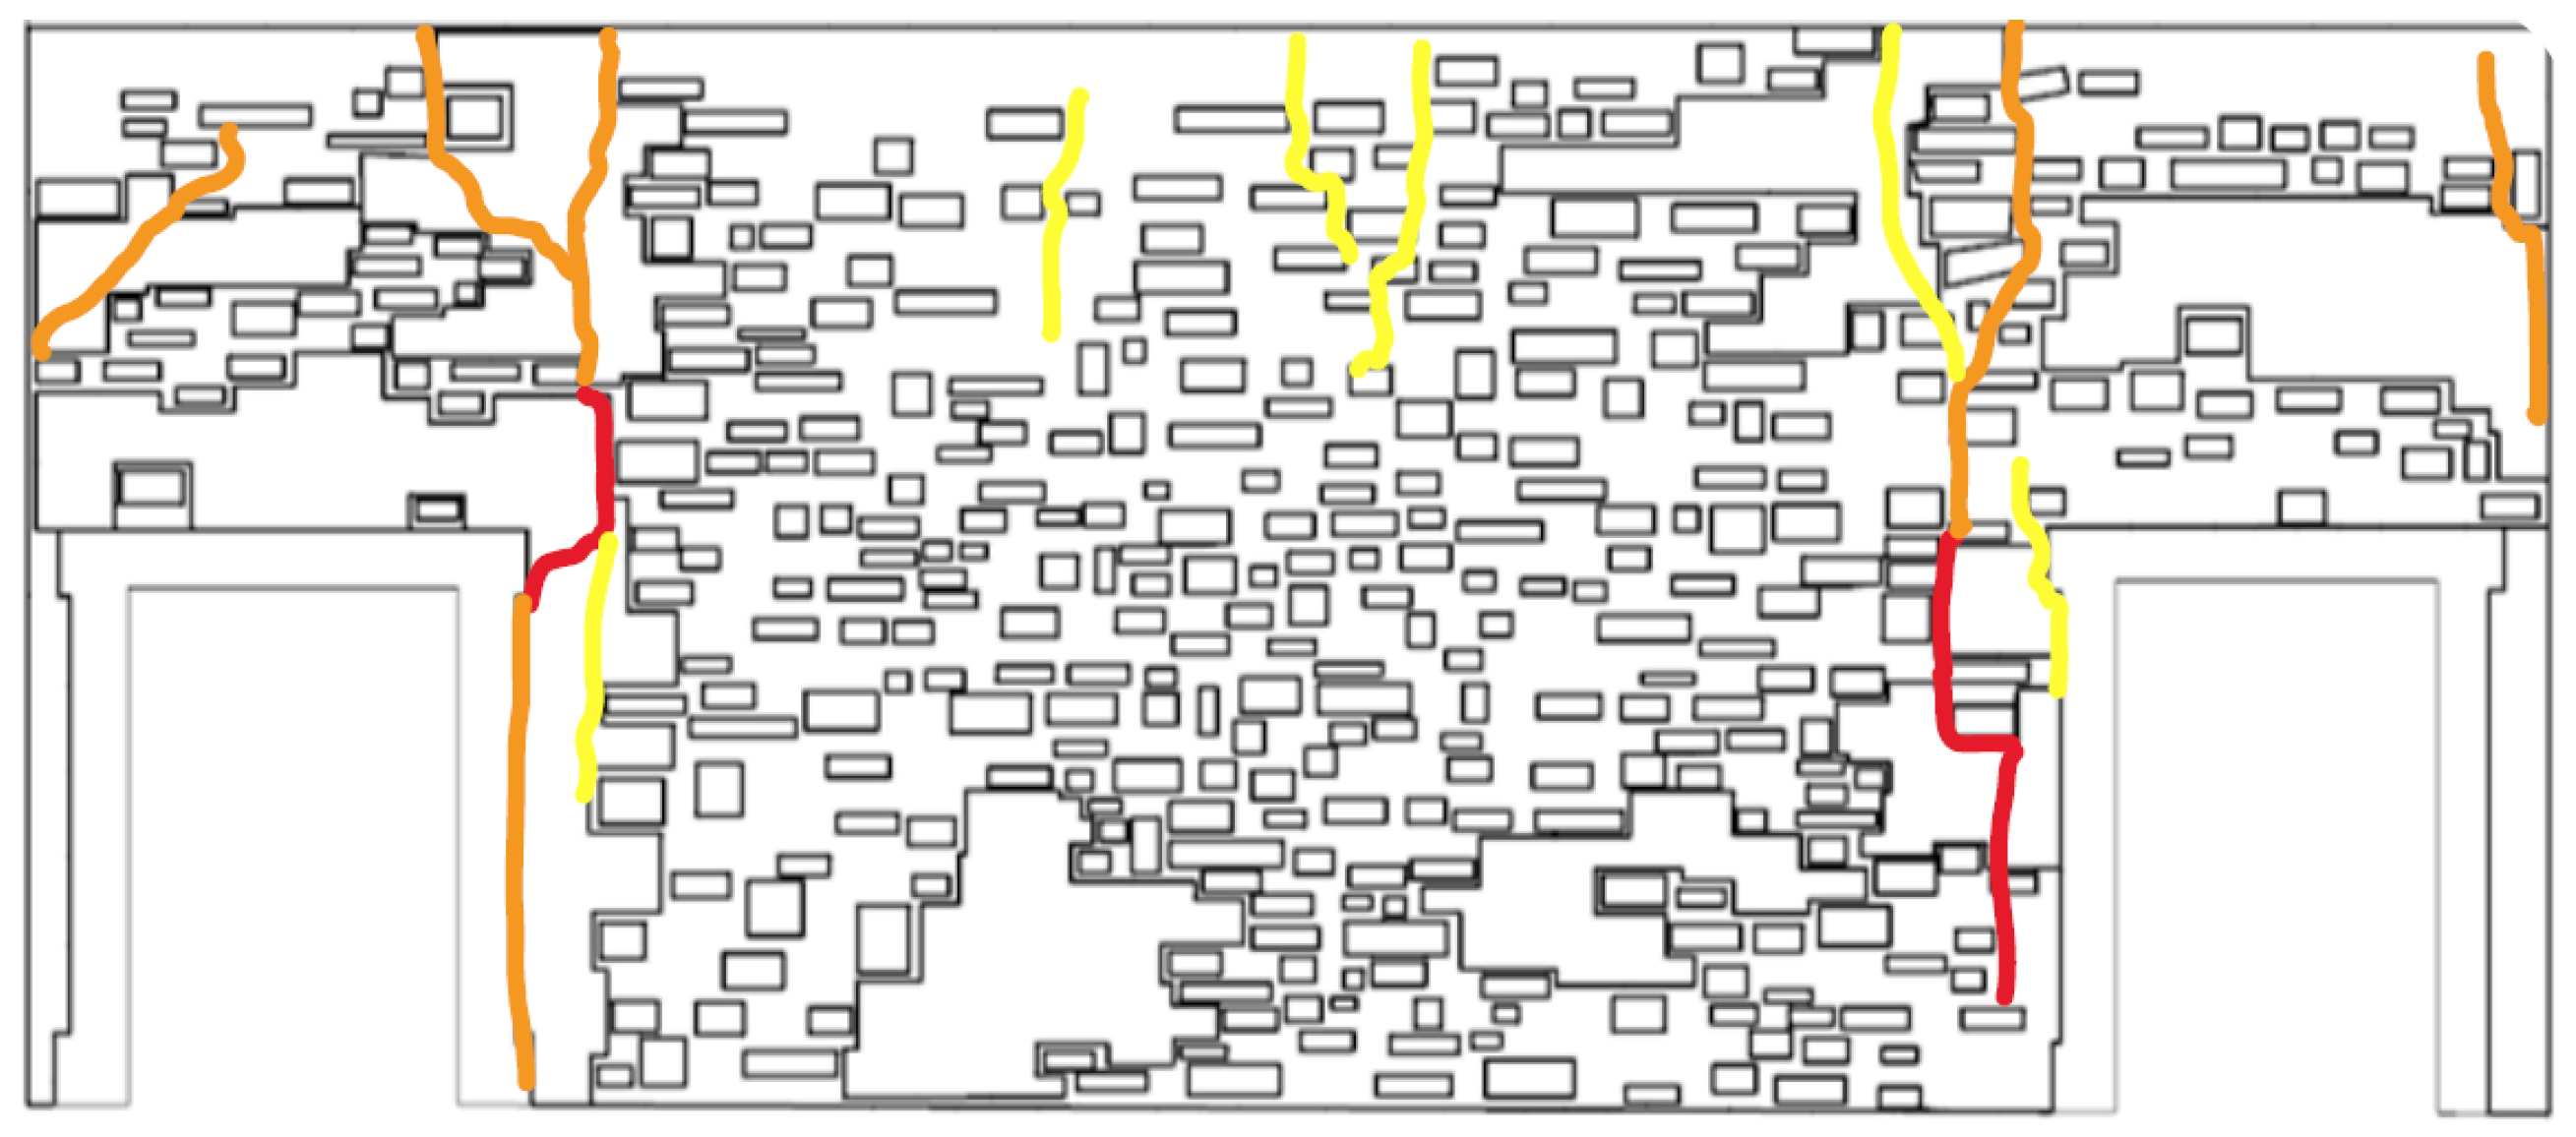
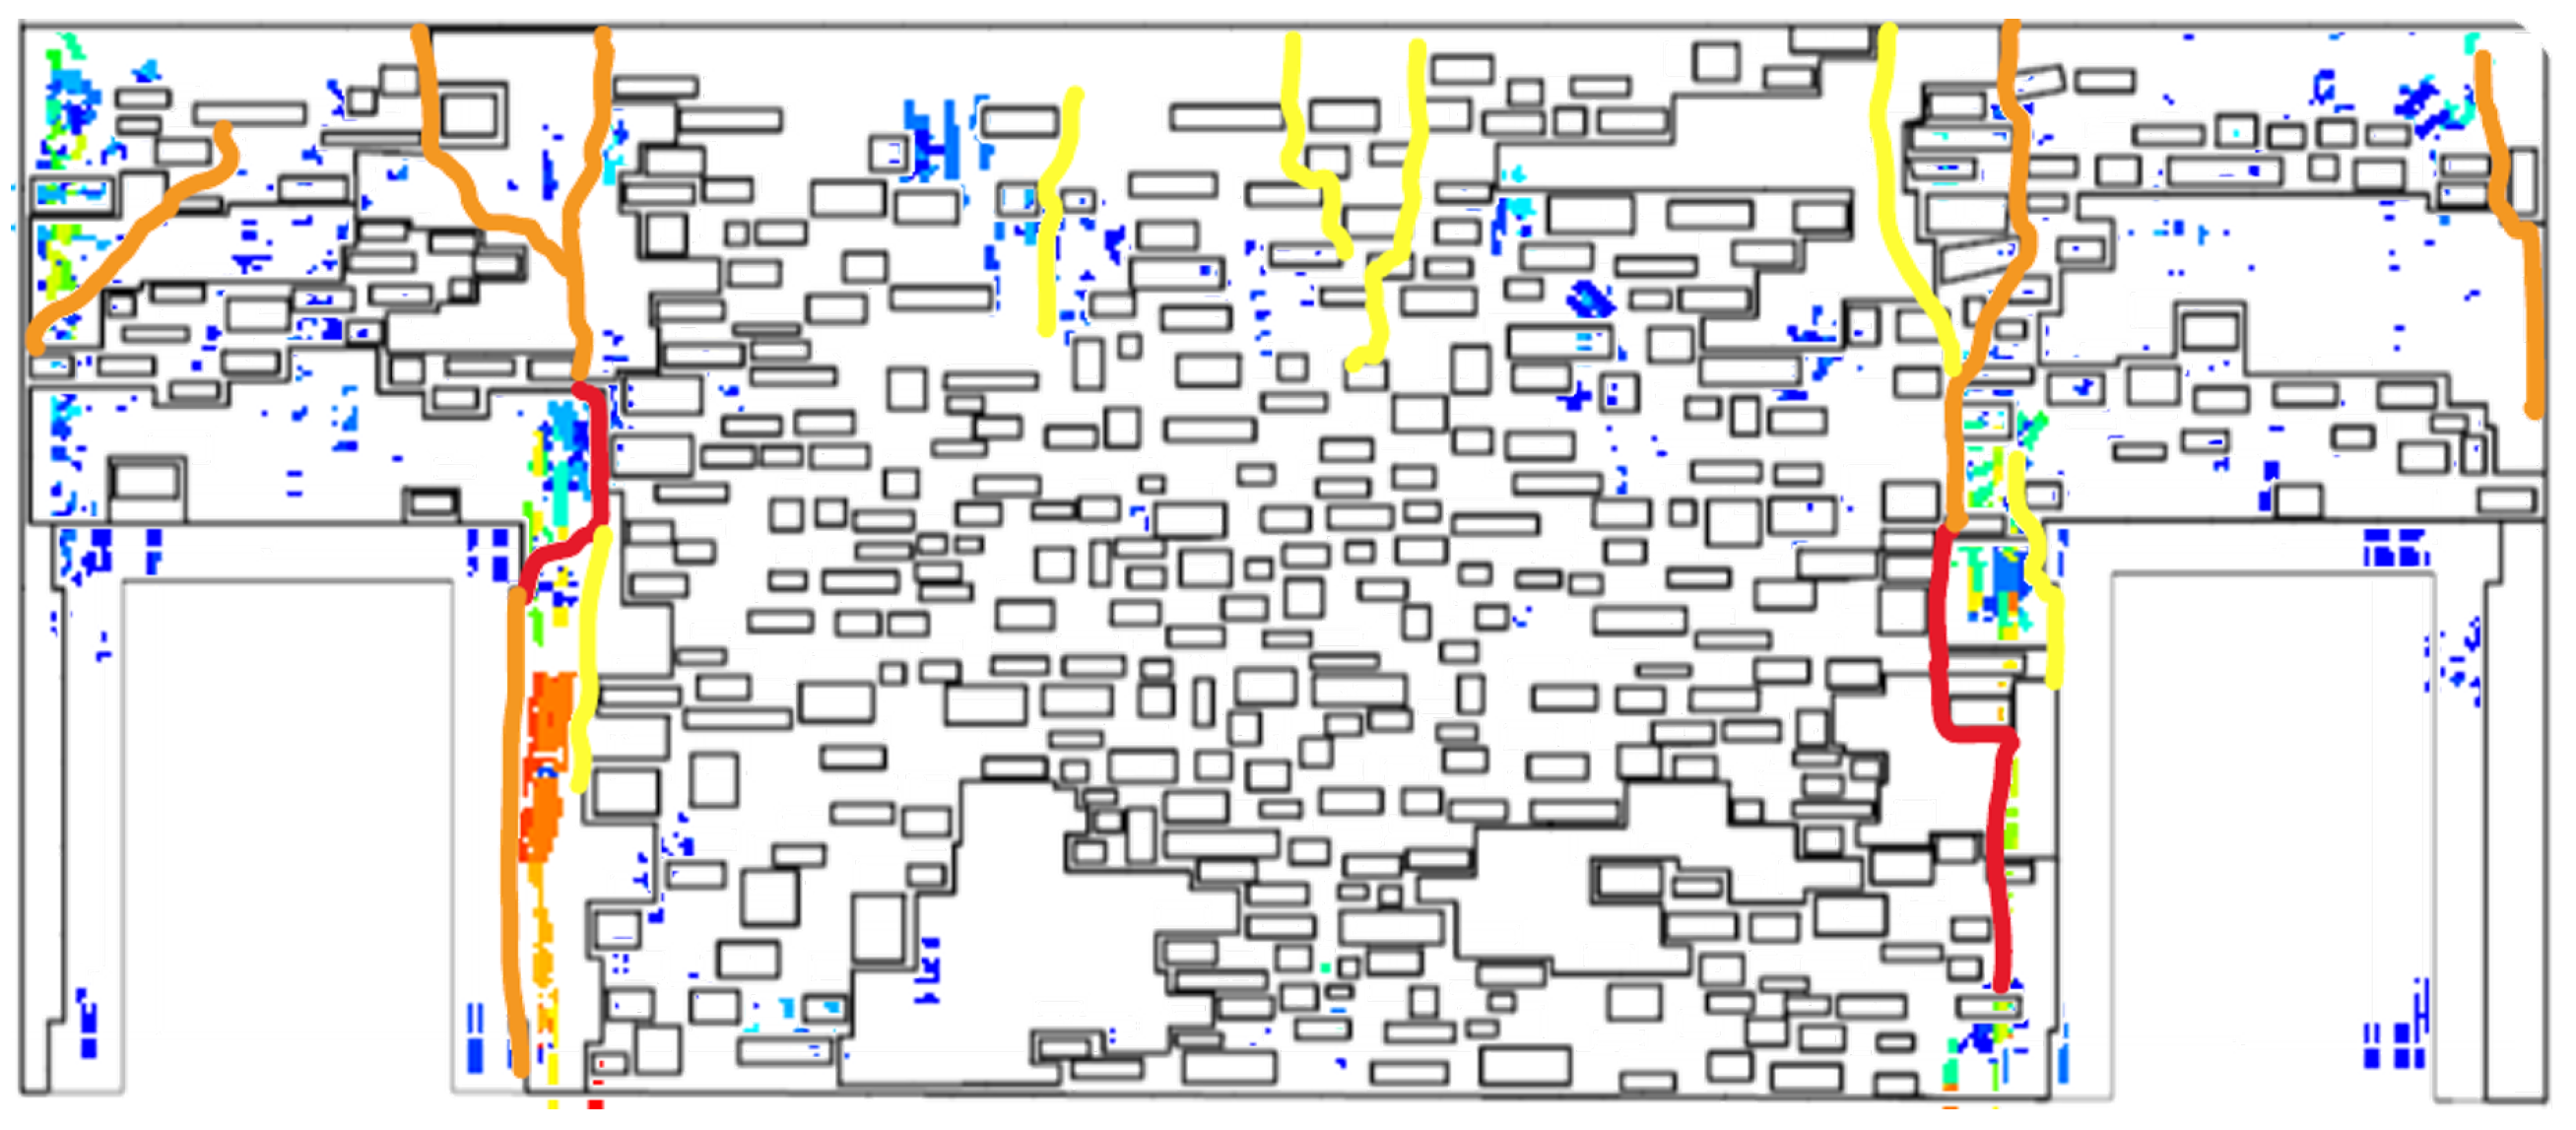
5. Mapping Existing Crack Patterns
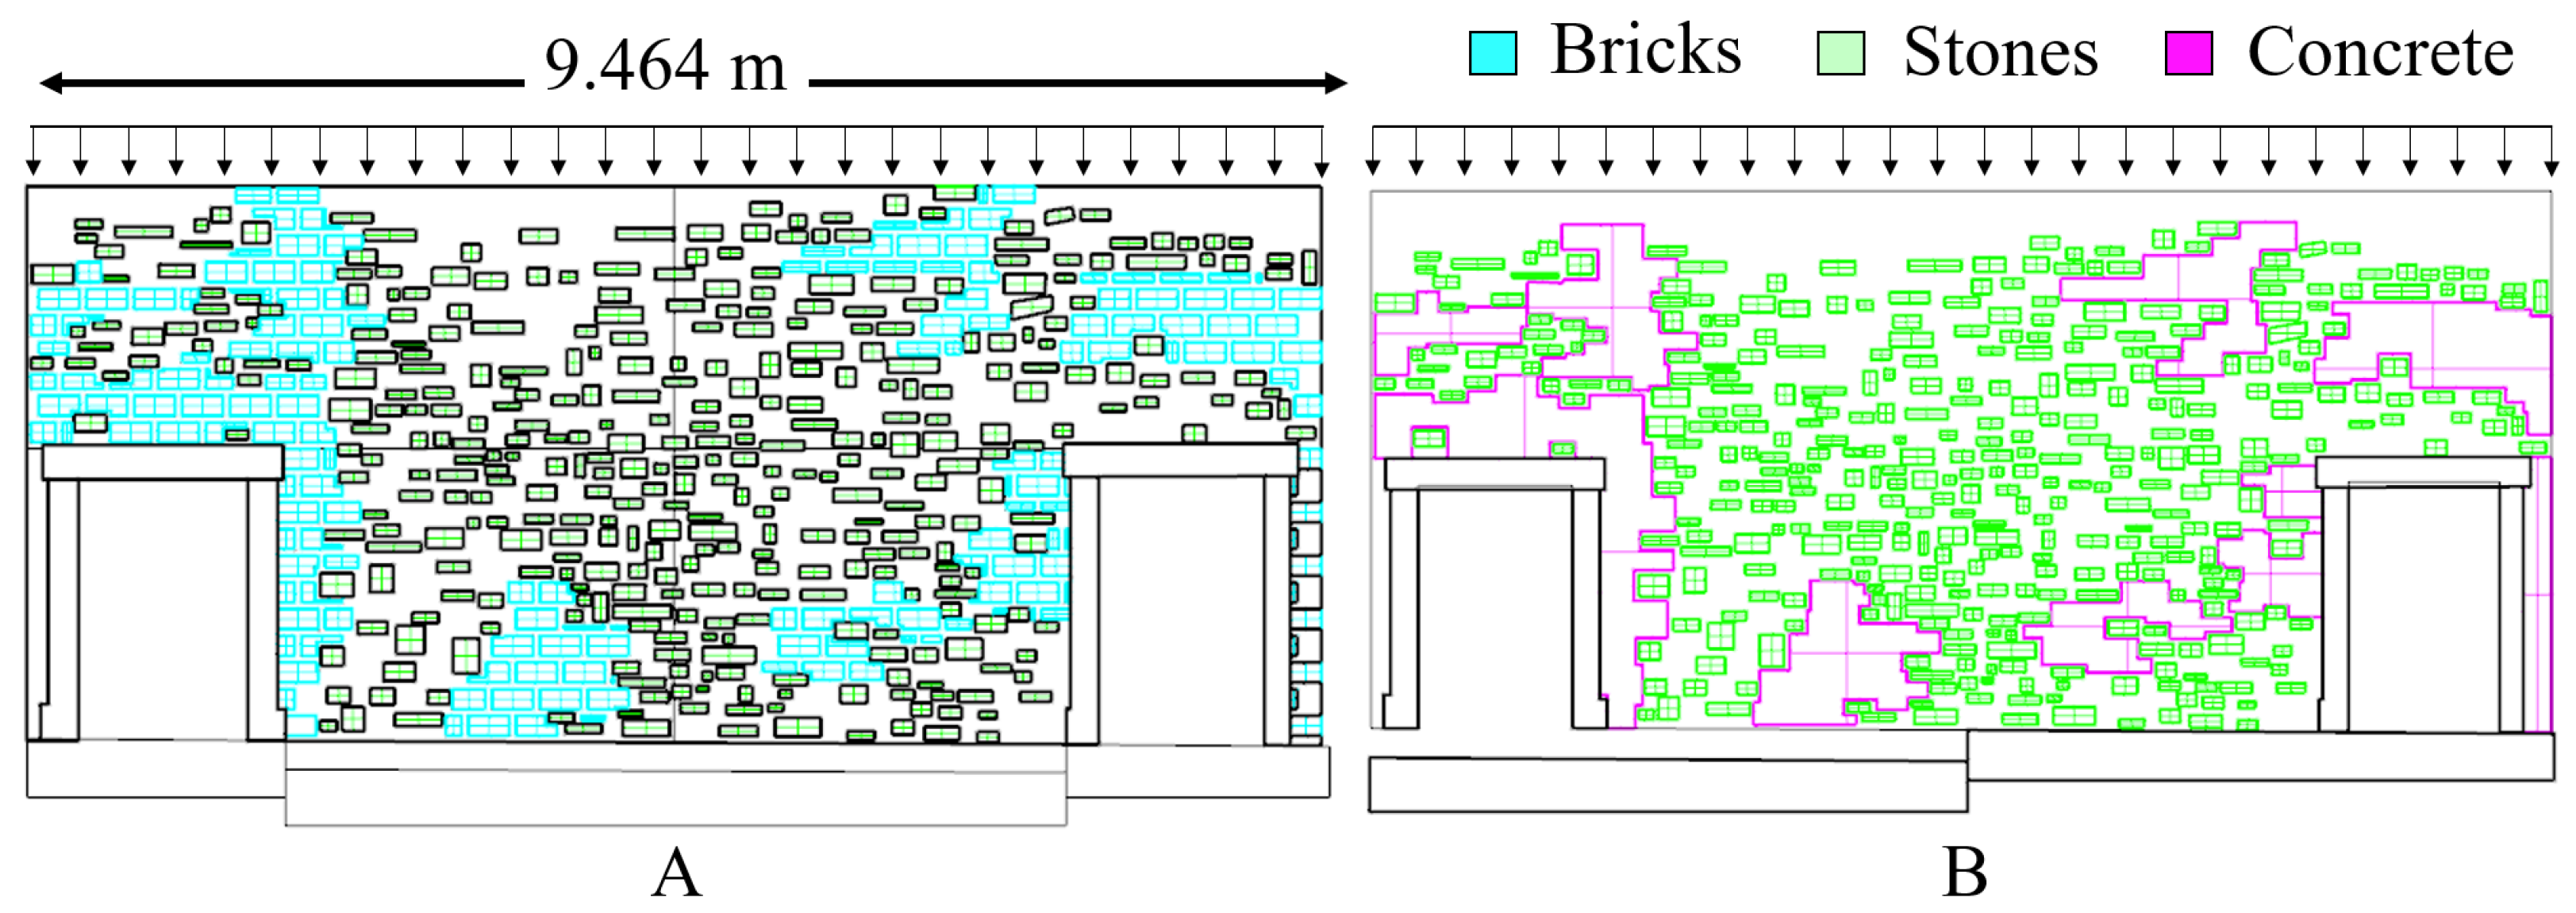
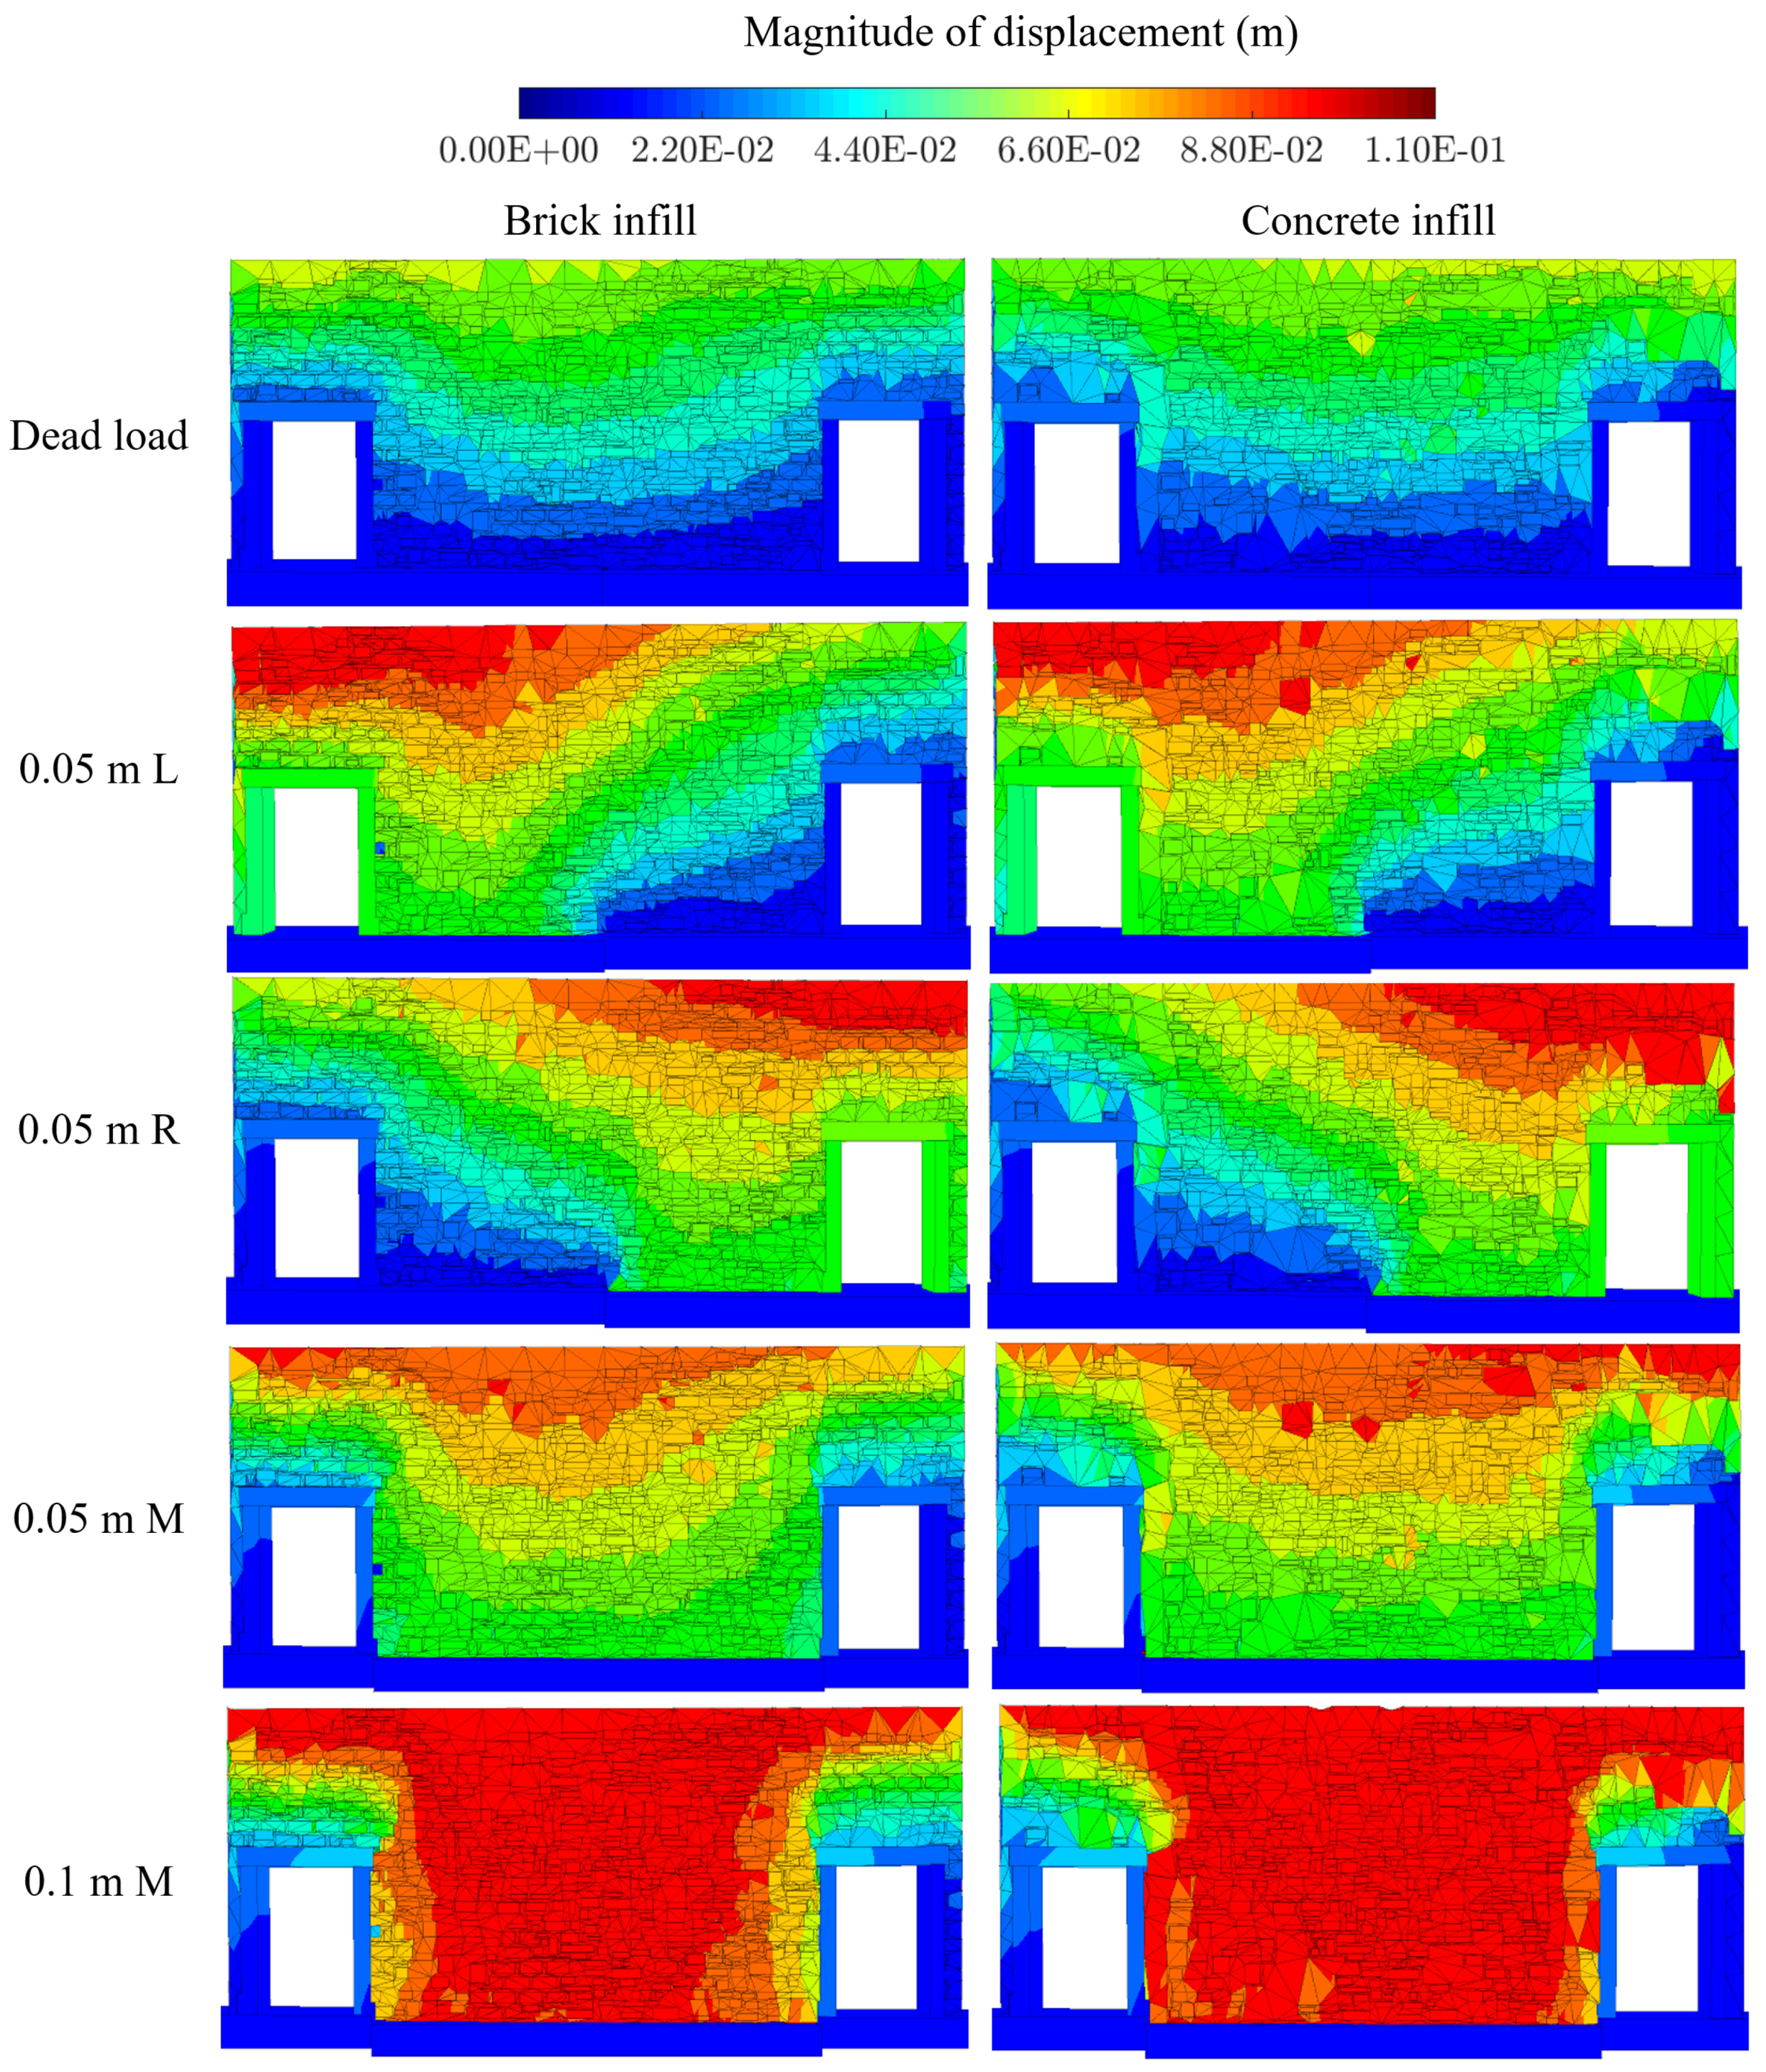
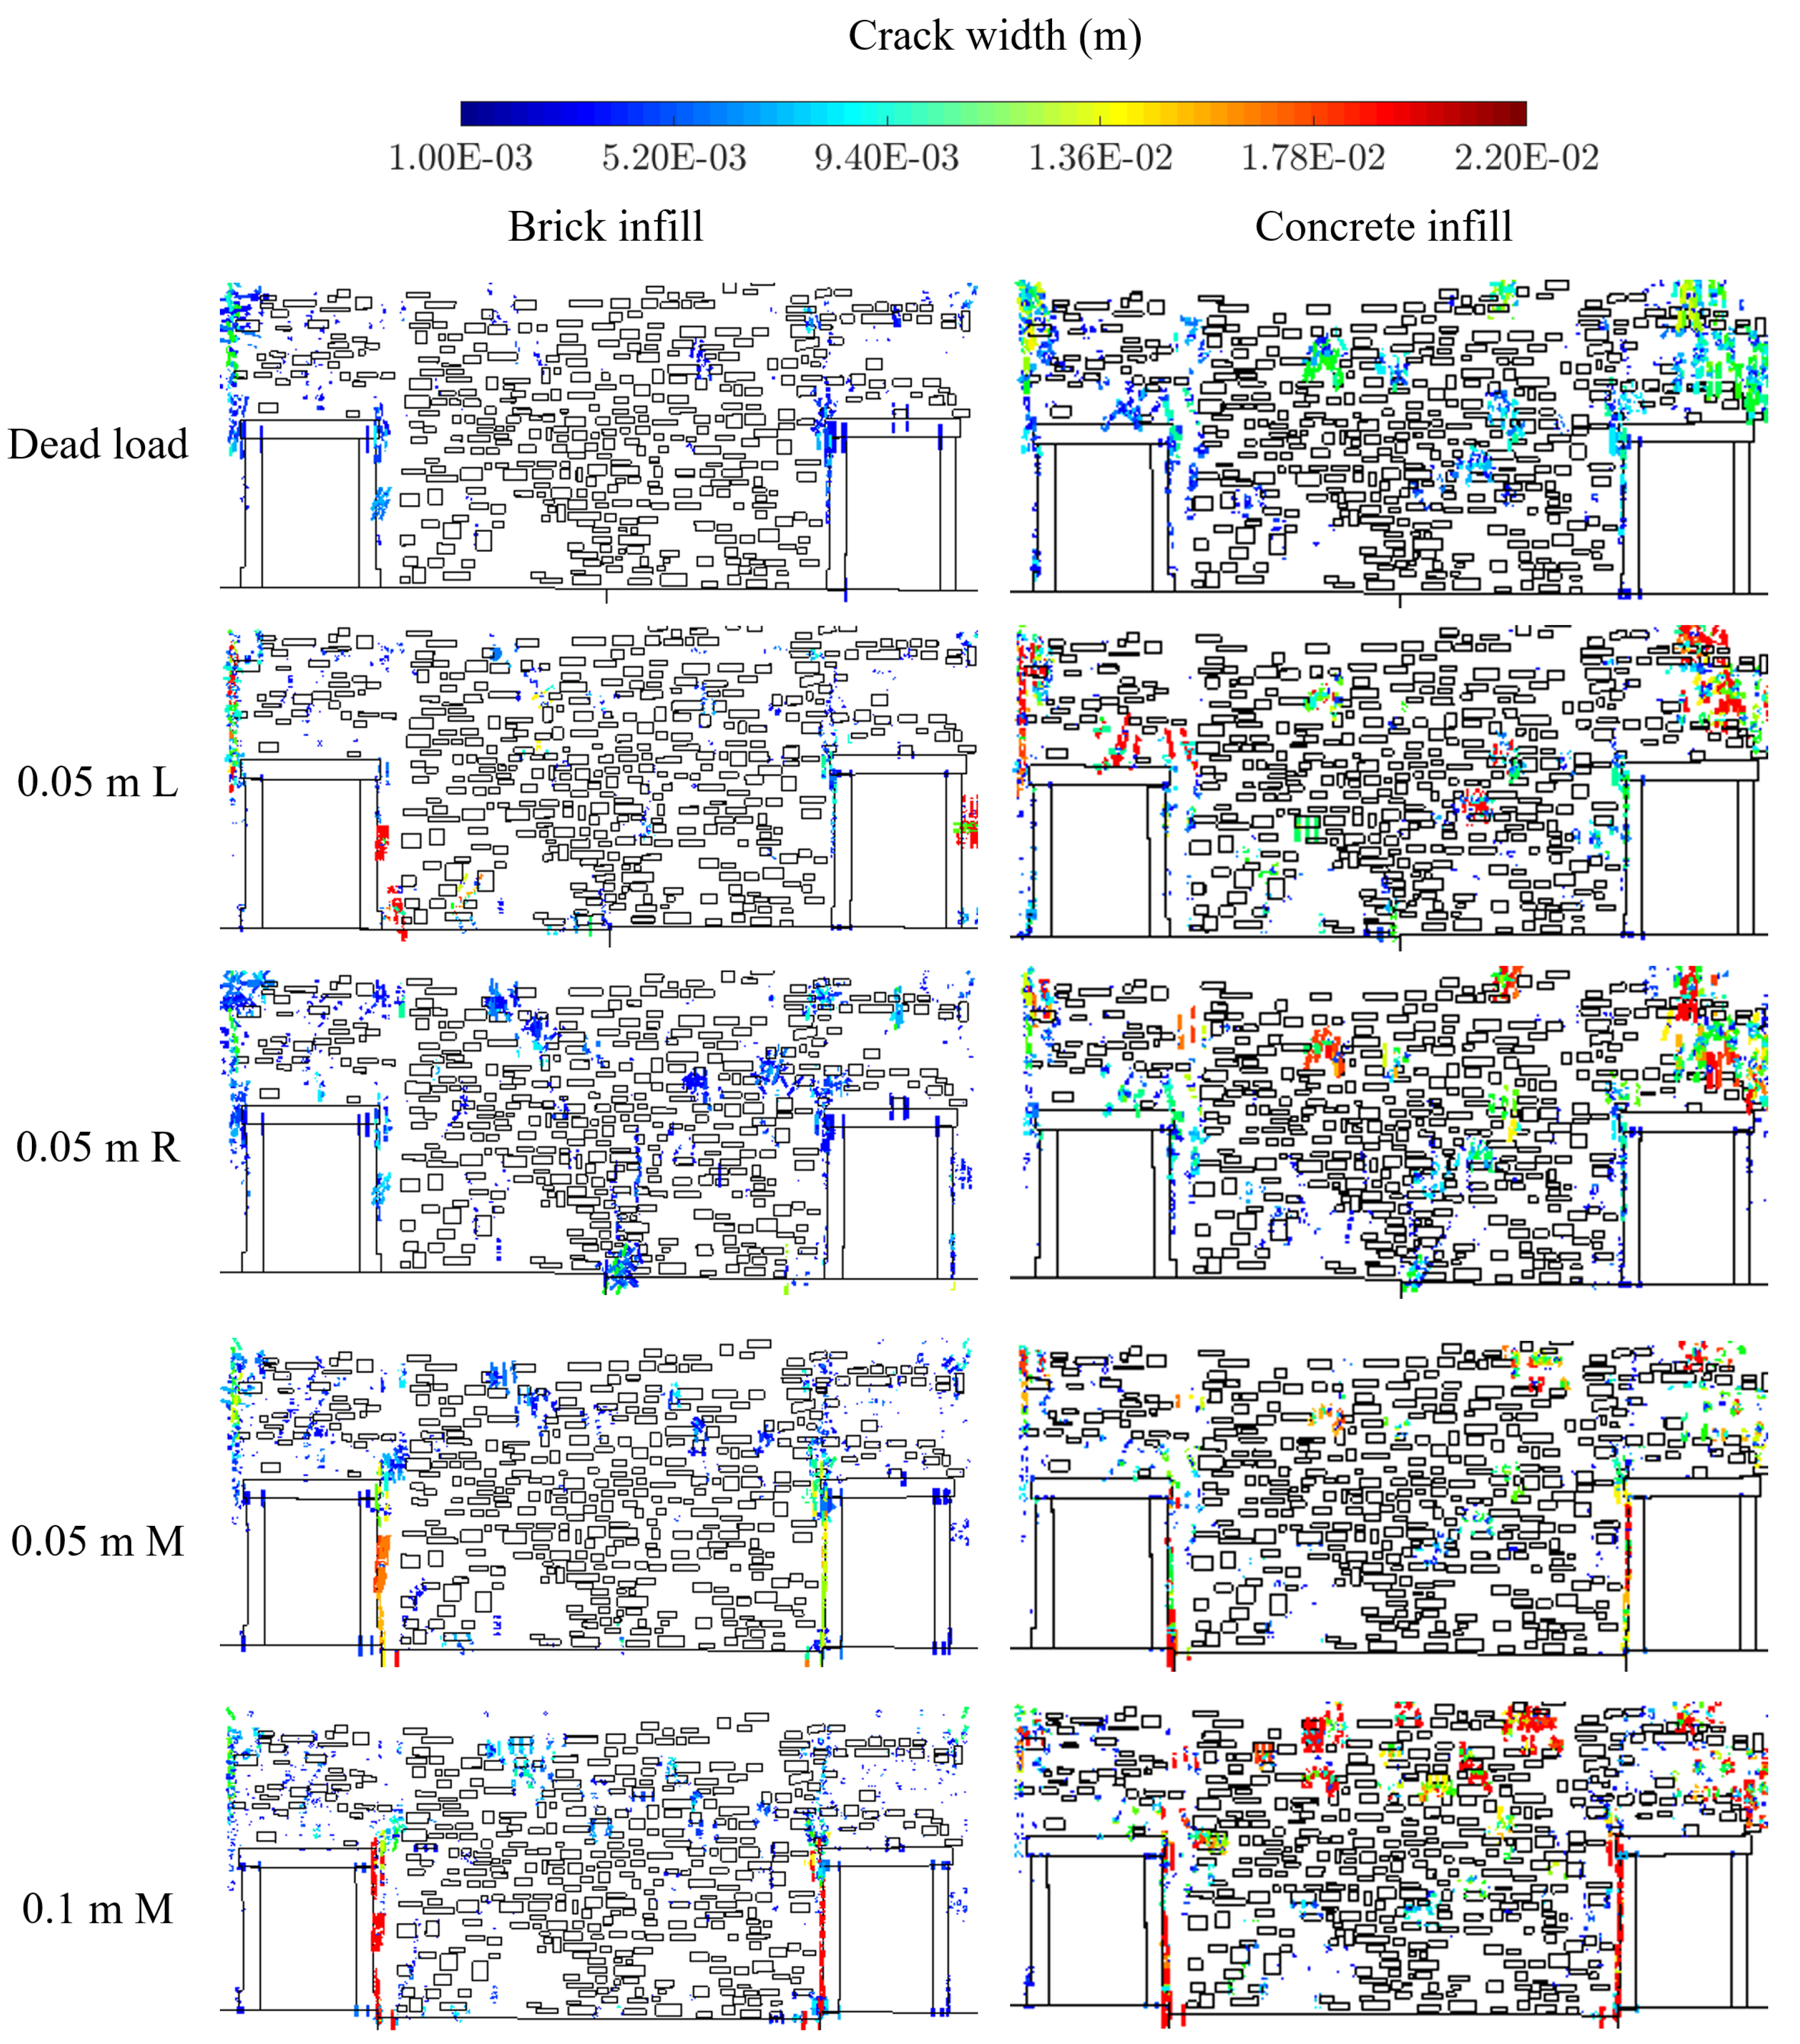
6. Numerical Modeling
6.1. Levels of Modeling and Analysis
6.2. Theory and Background for Numerical Modeling
- i = block number
- = acceleration of the block centroid
- = velocity of the block centroid
- = the viscous (mass-proportional) damping constant
- = sum of forces acting on the block
- m = block mass
- gravitational acceleration vector, and
- = angular acceleration about the principal axis
- = angular velocity about the principal axis
- = principal moment of inertia
- I = total torque
- s = surface enclosing the mass, m, which is concentrated at the grid point
- = zone stress tensor
- = unit outward normal from the surface
6.3. Model Parameters
- = density of the simulated slender block
- = volume of the simulated slender block
- = density of the true, adjacent masonry wall
- = volume of the true, adjacent masonry wall
6.4. Loading Conditions for the Numerical Model
7. Diagnosing Crack Patterns
8. Conclusions
Author Contributions
Funding
Acknowledgments
Conflicts of Interest
References
- Baskaran, B. Guideline for Structural Condition Assessment of Existing Buildings; American Society of Civil Engineers: Reston, VA, USA, 1999. [Google Scholar]
- Yung, E.H.; Chan, E.H. Implementation challenges to the adaptive reuse of heritage buildings: Towards the goals of sustainable, low carbon cities. Habitat Int. 2012, 36, 352–361. [Google Scholar] [CrossRef]
- Bullen, P.A. Adaptive reuse and sustainability of commercial buildings. Facilities 2007, 25, 20–31. [Google Scholar] [CrossRef]
- Shipley, R.; Utz, S.; Parsons, M. Does adaptive reuse pay? A study of the business of building renovation in Ontario, Canada. Int. J. Herit. Stud. 2006, 12, 505–520. [Google Scholar] [CrossRef]
- Glisic, B.; Inaudi, D. Fibre Optic Methods for Structural Health Monitoring; John Wiley & Sons: Hoboken, NJ, USA, 2008. [Google Scholar]
- Olsen, M.J. In situ change analysis and monitoring through terrestrial laser scanning. J. Comput. Civ. Eng. 2013, 29, 04014040. [Google Scholar] [CrossRef]
- Pesci, A.; Bonali, E.; Galli, C.; Boschi, E. Laser scanning and digital imaging for the investigation of an ancient building: Palazzo d’Accursio study case (Bologna, Italy). J. Cult. Herit. 2012, 13, 215–220. [Google Scholar] [CrossRef]
- Pesci, A.; Casula, G.; Boschi, E. Laser scanning the Garisenda and Asinelli towers in Bologna (Italy): Detailed deformation patterns of two ancient leaning buildings. J. Cult. Herit. 2011, 12, 117–127. [Google Scholar] [CrossRef]
- Letellier, R.; Eppich, R. Recording, Documentation and Information Management for the Conservation of Heritage Places; Routledge: Abingdon, UK, 2015. [Google Scholar]
- Kadobayashi, R.; Kochi, N.; Otani, H.; Furukawa, R. Comparison and evaluation of laser scanning and photogrammetry and their combined use for digital recording of cultural heritage. Int. Arch. Photogramm. Remote Sens. Spat. Inf. Sci. 2004, 35, 401–406. [Google Scholar]
- Georgopoulos, A.; Ioannidis, C. Photogrammetric and surveying methods for the geometric recording of archaeological monuments. In Proceedings of the FIG Working Week, Athens, Greece, 22–27 May 2004; pp. 22–27. [Google Scholar]
- Bonali, E.; Pesci, A.; Casula, G.; Boschi, E. Deformation of Ancient Buildings inferred by Terrestrial Laser Scanning methodology: The Cantalovo church case study (Northern I taly). Archaeometry 2014, 56, 703–716. [Google Scholar] [CrossRef]
- Napolitano, R.; Hess, M.; Coe-Scharff, R.; Glisic, B. Numerical Modeling of Crack Propagation in Masonry Structures. In Structural Analysis of Historical Constructions; Springer: Berlin, Germany, 2019; pp. 826–834. [Google Scholar]
- International Organization for Standardization. 13822 Bases for Design of Structures-Assessment of Existing Structures; CEN Brussels: Bruxelles, Belgium, 2005. [Google Scholar]
- Carpinteri, A.; Invernizzi, S.; Lacidogna, G. In situ damage assessment and nonlinear modelling of a historical masonry tower. Eng. Struct. 2005, 27, 387–395. [Google Scholar] [CrossRef]
- Meola, C.; Di Maio, R.; Roberti, N.; Carlomagno, G.M. Application of infrared thermography and geophysical methods for defect detection in architectural structures. Eng. Fail. Anal. 2005, 12, 875–892. [Google Scholar] [CrossRef]
- Kilic, G. Using advanced NDT for historic buildings: Towards an integrated multidisciplinary health assessment strategy. J. Cult. Herit. 2015, 16, 526–535. [Google Scholar] [CrossRef]
- Costanzo, A.; Minasi, M.; Casula, G.; Musacchio, M.; Buongiorno, M.F. Combined use of terrestrial laser scanning and IR thermography applied to a historical building. Sensors 2014, 15, 194–213. [Google Scholar] [CrossRef] [PubMed]
- Scaioni, M.; Rosina, E.; L’Erario, A.; Dìaz-Vilariño, L. Integration of infrared thermography and photogrammetric surveying of built landscape. Int. Arch. Photogramm. Remote Sens. Spat. Inf. Sci. 2017, 42, 153–160. [Google Scholar] [CrossRef]
- Wang, C.P.; Huang, Y.; Hsu, S.C.; Hong, J.J. Identifying the Defects Presented on the Exterior Layers of a Structure by Employing 3D Point Clouds and Thermography. In Civil Infrastructures Confronting Severe Weathers and Climate Changes Conference; Springer: Berlin, Germany, 2018; pp. 101–108. [Google Scholar]
- Fais, S.; Cuccuru, F.; Ligas, P.; Casula, G.; Bianchi, M.G. Integrated ultrasonic, laser scanning and petrographical characterisation of carbonate building materials on an architectural structure of a historic building. Bull. Eng. Geol. Environ. 2017, 76, 71–84. [Google Scholar] [CrossRef]
- Lagüela, S.; Solla, M.; Puente, I.; Prego, F.J. Joint use of GPR, IRT and TLS techniques for the integral damage detection in paving. Construct. Build. Mater. 2018, 174, 749–760. [Google Scholar] [CrossRef]
- Huang, Y.; Chiang, C.H.; Hsu, K.T. Combining the 3D model generated from point clouds and thermography to identify the defects presented on the facades of a building. In Nondestructive Characterization and Monitoring of Advanced Materials, Aerospace, Civil Infrastructure, and Transportation XII; SPIE: Denver, CO, USA, 2018; Volume 10599. [Google Scholar]
- Laefer, D.F.; Gannon, J.; Deely, E. Reliability of crack detection methods for baseline condition assessments. J. Infrastruct. Syst. 2010, 16, 129–137. [Google Scholar] [CrossRef]
- Binda, L.; Modena, C.; Casarin, F.; Lorenzoni, F.; Cantini, L.; Munda, S. Emergency actions and investigations on cultural heritage after the L’Aquila earthquake: The case of the Spanish Fortress. Bull. Earthq. Eng. 2011, 9, 105–138. [Google Scholar] [CrossRef]
- Shrestha, S.; Reina Ortiz, M.; Gutland, M.; Napolitano, R.; Morris, I.; Santana Quintero, M.; Erochko, J.; Kawan, S.; Shrestha, R.; Awal, P.; et al. Digital recording and non-destructive techniques for the understanding of structural performance for rehabilitating historic structures at the kathmandu valley after gorkha earthquake 2015. In Proceedings of the ISPRS Annals of the Photogrammetry, Remote Sensing and Spatial Information Sciences, 2017 26th International CIPA Symposium, Ottawa, ON, Canada, 28 August–1 September 2017; Volume IV-2/W2. [Google Scholar] [CrossRef]
- Braganti, F. Florence–Palazzo Vecchio with the Firemen. Available online: https://commons.wikimedia.org/wiki/File:Florence_-_Palazzo_Vecchio_with_the_firemen_2016-11-04.jpg (accessed on 15 August 2017).
- Dei Ministri, P.D.C. Valutazione e Riduzione del Rischio Sismico del Patrimonio Culturale con Riferimento alle Norme Tecniche per le Costruzioni di cui al DM 14 Gennaio 2008; Direttiva PCM: Rome, Italy, 2011. [Google Scholar]
- Hess, M.; Vanoni, D.; Petrovic, V.; Kuester, F. High-resolution thermal imaging methodology for non-destructive evaluation of historic structures. Infrared Phys. Technol. 2015, 73, 219–225. [Google Scholar] [CrossRef]
- Wood, R.L.; Hutchinson, T.C.; Wittich, C.E.; Kuester, F. Characterizing Cracks in the Frescoes of Sala degli Elementi within Florence’s Palazzo Vecchio. In Proceedings of the Euro-Mediterranean Conference, Limassol, Cyprus, 29 October–3 November 2012; Springer: Berlin, Germany, 2012; pp. 776–783. [Google Scholar]
- Quintero, M.; Genechten, B.; Bruyne, M.; Ronald, P.; Hankar, M.; Barnes, S. Theory and practice on terrestrial laser scanning. In Learning Tools for Advanced Three-Dimensional Surveying in Risk Awareness Project (3DRiskMapping); Ed. UPV Univ. Politecnica de Valencia: Valencia, Spain, 2008. [Google Scholar]
- Sapirstein, P. Accurate measurement with photogrammetry at large sites. J. Archaeol. Sci. 2016, 66, 137–145. [Google Scholar] [CrossRef]
- Napolitano, R.K.; Glisic, B. Minimizing the adverse effects of bias and low repeatability precision in photogrammetry software through statistical analysis. J. Cult. Herit. 2018, 31, 46–52. [Google Scholar] [CrossRef]
- Agisoft LLC. Agisoft PhotoScan User Manual: Professional Edition; Agisoft PhotoScan: St. Petersburg, Russia, 2014. [Google Scholar]
- Remondino, F.; Stylianidis, E. 3D Recording, Documentation and Management of Cultural Heritage; Whittles Publishing: Dunbeath, UK, 2016; Volume 2. [Google Scholar]
- Georgiadis, C.; Tsioukas, V.; Sechidis, L.; Stylianidis, E.; Patias, P. Fast and accurate documentation of archaeological sites using in the field photogrammetric techniques. Int. Arch. Photogramm. Remote Sens. 2000, 33, 28–32. [Google Scholar]
- Pepe, M.; Ackermann, S.; Fregonese, L.; Achille, C. 3D Point cloud model color adjustment by combining terrestrial laser scanner and close range photogrammetry datasets. In Proceedings of the ICDH 2016: 18th International Conference on Digital Heritage, London, UK, 24–25 November 2016; Volume 10, pp. 1942–1948. [Google Scholar]
- Cadelano, G.; Bison, P.; Bortolin, A.; Ferrarini, G.; Peron, F.; Girotto, M.; Volinia, M. Monitoring of historical frescoes by timed infrared imaging analysis. Opto-Electron. Rev. 2015, 23, 102–108. [Google Scholar] [CrossRef]
- Kordatos, E.; Exarchos, D.; Stavrakos, C.; Moropoulou, A.; Matikas, T. Infrared thermographic inspection of murals and characterization of degradation in historic monuments. Construct. Build. Mater. 2013, 48, 1261–1265. [Google Scholar] [CrossRef]
- Cotič, P.; Jagličić, Z.; Bosiljkov, V. Validation of non-destructive characterization of the structure and seismic damage propagation of plaster and texture in multi-leaf stone masonry walls of cultural-artistic value. J. Cult. Herit. 2014, 15, 490–498. [Google Scholar] [CrossRef]
- Carlomagno, G.M.; Meola, C. Comparison between thermographic techniques for frescoes NDT. NDT E Int. 2002, 35, 559–565. [Google Scholar] [CrossRef]
- American Society for Testing and Materials (ASTM International). C1153-10 Standard Practice for Location of Wet Insulation in Roofing Systems Using Infrared Imaging; ASTM International: West Conshohocken, PA, USA, 2010; Volume 13. [Google Scholar] [CrossRef]
- Emissivity Values for Common Materials. Available online: http://www.infrared-thermography.com/material-1.htm (accessed on 2 November 2018).
- Psycharis, I.N.; Lemos, J.; Papastamatiou, D.; Zambas, C.; Papantonopoulos, C. Numerical study of the seismic behaviour of a part of the Parthenon Pronaos. Earthq. Eng. Struct. Dyn. 2003, 32, 2063–2084. [Google Scholar] [CrossRef]
- Fang, D.L.; Napolitano, R.K.; Michiels, T.L.; Adriaenssens, S.M. Assessing the stability of unreinforced masonry arches and vaults: A comparison of analytical and numerical strategies. Int. J. Archit. Herit. 2018, 1–15. [Google Scholar] [CrossRef]
- Kavanaugh, C.; Morris, I.M.; Napolitano, R.; Jorquera-Lucerga, J.J. Validating the use of graphical thrust line analysis for pier buttresses: The case study of amiens cathedral. Int. J. Archit. Herit. 2017, 11, 859–870. [Google Scholar] [CrossRef]
- Cundall, P.; Hart, R. Theory and Background: 3DEC 3 Dimensional Distinct Element Code; Technical Report; Itasca Consulting Group: Minneapolis, MN, USA, 2015. [Google Scholar]
- Bui, T.; Limam, A.; Sarhosis, V.; Hjiaj, M. Discrete element modelling of the in-plane and out-of-plane behaviour of dry-joint masonry wall constructions. Eng. Struct. 2017, 136, 277–294. [Google Scholar] [CrossRef]
- Pulatsu, B.; Erdogmus, E.; Lourenço, P.B. Comparison of in-plane and out-of-plane failure modes of masonry arch bridges using discontinuum analysis. Eng. Struct. 2019, 178, 24–36. [Google Scholar] [CrossRef]
- Napolitano, R.; Glisic, B. Methodology for diagnosing crack patterns in masonry structures using photogrammetry and distinct element modeling. Eng. Struct. 2019, 181, 519–528. [Google Scholar] [CrossRef]
- Roca, P. Considerations on the significance of history for the structural analysis of ancient constructions. In Structural Analysis of Historical Constructions IV; Taylor and Francis Group: Amsterdam, The Netherlands, 2004; pp. 63–73. [Google Scholar]
- Clemente, R. Structural Analysis of Historical Buildings by Localized Cracking Models. Ph.D. Thesis, Universitat Politècnica de Catalunya, Barcelona, Spain, 2006. [Google Scholar]
- Asteris, P.G.; Sarhosis, V.; Mohebkhah, A.; Plevris, V.; Papaloizou, L.; Komodromos, P.; Lemos, J.V. Numerical modeling of historic masonry structures. In Handbook of Research on Seismic Assessment and Rehabilitation of Historic Structures; IGI Global: Hershey, PA, USA, 2015; pp. 213–256. [Google Scholar]
- Hess, M. Diagnostic Structural Health Assessment through Layered Integration of Non-destructive Imaging Data. Ph.D. Thesis, University of California, San Diego, CA, USA, 2018. [Google Scholar]
- DeJong, M.J.; Vibert, C. Seismic response of stone masonry spires: Computational and experimental modeling. Eng. Struct. 2012, 40, 566–574. [Google Scholar] [CrossRef]
- Autodesk. Cut, Rough Granite. Available online: https://www.autodesk.com/ (accessed on 10 August 2017).
- Walker, R. Density of Materials. Available online: https://www.simetric.co.uk/si_materials.htm (accessed on 10 August 2017).
- Napolitano, R.; Lansing, L.; Glisic, B. Understanding the Function of Roman Bonding Courses: A Numerical Approach. In Structural Analysis of Masonry Historical Constructions; Springer: Berlin, Germany, 2019; pp. 1798–1806. [Google Scholar]
- Sarhosis, V.; Garrity, S.; Sheng, Y. Influence of brick–mortar interface on the mechanical behaviour of low bond strength masonry brickwork lintels. Eng. Struct. 2015, 88, 1–11. [Google Scholar] [CrossRef]
- Gotti, E.; Oleson, J.; Bottalico, L.; Brandon, C.; Cucitore, R.; Hohlfelder, R. A comparison of the chemical and engineering characteristics of ancient Roman hydraulic concrete with a modern reproduction of Vitruvian hydraulic concrete. Archaeometry 2008, 50, 576–590. [Google Scholar] [CrossRef]
- Reccia, E.; Cazzani, A.; Cecchi, A. FEM-DEM modeling for out-of-plane loaded masonry panels: A limit analysis approach. Open Civ. Eng. J. 2012, 6, 231–238. [Google Scholar] [CrossRef]
- Brune, P.F.; Perucchio, R.; Ingraffea, A.; Jackson, M. The toughness of imperial roman concrete. In Proceedings of the 7th International Conference on Fracture Mechanics of Concrete and Concrete Structures, Seoul, Korea, 23–28 May 2010. [Google Scholar]


© 2019 by the authors. Licensee MDPI, Basel, Switzerland. This article is an open access article distributed under the terms and conditions of the Creative Commons Attribution (CC BY) license (http://creativecommons.org/licenses/by/4.0/).
Share and Cite
Napolitano, R.; Hess, M.; Glisic, B. Integrating Non-Destructive Testing, Laser Scanning, and Numerical Modeling for Damage Assessment: The Room of the Elements. Heritage 2019, 2, 151-168. https://doi.org/10.3390/heritage2010012
Napolitano R, Hess M, Glisic B. Integrating Non-Destructive Testing, Laser Scanning, and Numerical Modeling for Damage Assessment: The Room of the Elements. Heritage. 2019; 2(1):151-168. https://doi.org/10.3390/heritage2010012
Chicago/Turabian StyleNapolitano, Rebecca, Michael Hess, and Branko Glisic. 2019. "Integrating Non-Destructive Testing, Laser Scanning, and Numerical Modeling for Damage Assessment: The Room of the Elements" Heritage 2, no. 1: 151-168. https://doi.org/10.3390/heritage2010012
APA StyleNapolitano, R., Hess, M., & Glisic, B. (2019). Integrating Non-Destructive Testing, Laser Scanning, and Numerical Modeling for Damage Assessment: The Room of the Elements. Heritage, 2(1), 151-168. https://doi.org/10.3390/heritage2010012