1. Introduction
The large-scale renewable energy sources (RES) integration, driven by their key role in achieving the decarbonisation targets for the energy sector, has significantly altered the operating conditions and requirements for power systems. This primarily concerns the variability and unpredictability of solar and wind power plants, driven by natural meteorological and seasonal factors. Even with modern forecasting models, uncertainty remains significant, which complicates dispatch operations [
1]. An increase in electricity generation from RES, such as solar power plants (SPPs) and wind power plants (WPPs), may lead to capacity curtailment if the power system lacks sufficient flexibility to maintain a balance between generation and consumption. According to a global assessment by the IEA [
2], delays in implementing measures to support RES integration could jeopardise up to 15% of wind and solar power generation by 2030 and are likely to result in a 20%-less-than-expected reduction in CO
2 emissions in the energy sector. The successful integration of such variable RES (VRES) maximises the amount of energy that can be obtained safely and affordably, minimises costly measures to ensure system stability, and reduces dependence on fossil fuels [
2].
The IEA study outlines six phases of growth in the SPPs and WPPs impact, corresponding to their level of integration [
2]. The low integration of VRES in phases 1 through 3 can be ensured with a negligible impact on the operation of the power system, and can be resolved by increasing flexibility through the optimisation of dispatch processes, improved forecasting accuracy, the introduction of greater flexibility and system services, ensuring an industrial response to demand, and the improvement of grid infrastructure. Phases 4 to 6, with significant integration of VRES, where their generation can cover almost the entire demand, are characterised by a substantial increase in their impact on system operation, requiring a fundamental transformation of the power system. From phase 4 onwards, when VRES generation is sufficient to meet a significant portion of electricity demand, problems with excess power arise during periods of high generation and low demand. During these periods, the power from these RES must be curtailed, reducing economic efficiency.
Such forced reduction (known as “curtailment”) of VRES power is implemented to maintain balance in the power system due to operational constraints on other generators and the absence of demand response, grid expansion, storage or export [
3]. International experience with wind and solar power curtailment [
3,
4] indicates three primary causes: excess generation, grid constraints, and operational or market factors.
To avoid curtailment, key measures include deploying energy storage systems, expanding interregional interconnectors, implementing demand response, and optimising the generation mix [
5]. Storage (electrochemical, pumped hydro, and thermal) allows excess generation to be stored and used during peak demand hours. Successful examples of countries’ strategies for reducing volatility when integrating VRES into their electricity grids have included advanced energy storage technologies, grid modernisation and flexible power balancing [
1]. A study for Japan [
6] showed that increasing interregional flows could reduce forced curtailment by 79%, as surplus generation can be exported to regions with power deficits. Demand-side management ensures that consumption is shifted to hours of high VRES generation. Optimisation of the capacity mix aims to reduce the share of generation that creates “hard” constraints. Modelling using Japan as an example showed that reducing installed nuclear capacity could reduce constraints by 95–97% in certain scenarios. Grid modernisation should aim to eliminate local “bottlenecks” that create constraints. This is particularly relevant for regions with rapid growth in solar generation.
The most effective measure for reducing VRES constraints is sectoral coupling, integrating RES with sectors such as district heating and transport. Brown et al. [
7] emphasise that focusing on the electricity sector not only means ignoring significant greenhouse gas emissions in other energy-consuming sectors, such as heating and transport, but also neglecting important sources of flexibility in these sectors.
The integration of the electricity and heat supply sectors is often considered a particularly promising direction, given the relatively low costs of producing heat from electricity and storing it [
8]. The use of renewable electricity for heating purposes can help decarbonise the heating sector and facilitate the integration of RES into the power system, providing additional flexibility. A study [
9] demonstrated the advantages of the integration of Ukraine’s power system and the centralised heat supply system through the electrification of the centralised heat supply system using autonomous renewable energy sources and nuclear power plant capacity, which provides high technological capability, economical efficiency, reliability, and ecological sustainability for each component.
Power-to-Heat (PtH) technology is a comprehensive flexibility system that integrates the electricity and heating sectors and is one of the key mechanisms for reducing constraints in systems with a high share of VRES [
5]. Combining renewable energy sources with PtH technology and seasonal thermal energy storage can significantly increase the flexibility of district heating systems, reducing the restrictions on renewable energy production [
10]. DHS systems can help support PtH technologies, enabling thermal demand to respond flexibly to system requirements [
11]. PtH technology employs electric heat generators (EHGs) that convert surplus electricity from RES into heat, thereby increasing system flexibility and reducing balancing costs. The key benefits of using PtH include utilising surplus generation during periods of high VRES output, replacing fossil-fuel-based thermal energy in district heating, and reducing the need for thermal power plants (TPPs) to manoeuvre, which alleviates system constraints [
12].
Studies show that PtH technology can reduce RES power curtailments by 30–70% [
8], cover up to 40% of heat demand [
13], and be more cost-effective than electrochemical storage for daily surpluses [
5]. This technology is particularly effective in countries with high heat demand (e.g., Finland, where over 80% of household energy is spent on heating).
One of the most common and economically attractive solutions for converting electricity into heat in municipal and industrial processes is electric boilers, which are characterised by low initial cost, compactness, flexibility, no chimney required, zero emissions when using renewable electricity, quiet operation, and ease of maintenance [
14].
Furthermore, combined heat and power plants (CHPPs) play a significant role in integrating the electricity and heat sectors, providing centralised and industrial process heat supply. The optimal combination of CHP plants with PtH technologies and thermal energy storage systems in district heating systems (DHSs) can facilitate the flexible integration of the electricity and heating sectors, contributing to an increase in the share of renewable energy sources in the power system and the decarbonisation of the heating sector [
8,
12,
13,
15].
Developing pathways towards a sustainable power system with a high level of renewable energy integration requires the use of energy modelling tools that account for key factors, such as the evolution of fossil fuel prices and technologies, as well as the natural dynamics of renewable resources [
16]. In long-term power system development models, power curtailments are typically accounted for by an optimisation variable representing the difference between available and utilised renewable generation, which allows for the modelling of excess renewable generation [
17], whilst PtH is treated as a flexible demand that utilised part of this surplus [
8,
12]. In long-term planning models, PtH is typically used to optimise RES integration, reduce peak loads and improve the efficiency of heat supply. This reduces RES curtailments and system costs, as the curtailment variable is typically incorporated into the model’s objective function as a penalty or opportunity cost, allowing the optimisation to find an economic trade-off between investments in flexibility and an acceptable level of unused generation [
5,
8]. A comparative study of eight power system models [
18] shows that the differences in the obtained results occur mainly through the different model scope, rather than through mathematical formulations or technology parameters. The key source of differences in the results is the structure of the model and the coverage of sectors. Variations in sectoral integration within the models significantly reduce constraints and alter the structure of investments.
A systematic review of solutions for ensuring flexibility in 100% renewable energy systems confirms that RES curtailment is an integral part of an economically optimal solution in scenarios with a high share of renewables [
14]. Around a quarter of the studies reviewed [
14] model curtailment as a low-cost form of flexibility that avoids excessive investment in energy storage or grid reinforcement. In this context, PtH acts as one of the key flexibility tools, capable of absorbing excess generation over time scales ranging from hours to days, reducing the need for expensive electrochemical storage and improving the efficiency of RES integration. Thus, in modern long-term optimisation models, curtailment and PtH are viewed as complementary mechanisms that ensure the economically optimal integration of high shares of renewable generation.
At the same time, the use of PtH technologies and BESSs requires detailed consideration of their operational dynamics over a 24 h period, as well as the utilisation of thermal energy from EHGs in the DHS. This necessitates the development of an approach to modelling the long-term optimal operation of the power system by considering the DHS’s thermal energy balance.
The aim of this paper is to model the balanced integration of VRES in forecasting the long-term development of the power system, considering technological measures to prevent curtailment of their output and the synergies from joint operation of the power system and the district heating system.
2. Materials and Methods
To model the balanced integration of a significant volume of VRES into the power system, a study was conducted using a mixed-integer model of the long-term development of the power system’s generation capacity [
19]. As previously noted, to avoid forced limitation of renewable energy supply when the flexibility of the power system is insufficient to ensure its well-balanced operation, it is appropriate to apply storage systems to shift excess renewable energy generation from periods of surplus output to periods of peak electricity consumption, as well as PtH technologies that convert excess renewable-generated electricity into heat energy. The model, therefore, required refinement to incorporate the heat output of PtH technology in line with the available demand from district heating systems.
In the mathematical model for forecasting the long-term development of the generation capacity structure of the electric power system [
19], the power variables included in the balance of load coverage of the power system for new installations sheets are derived using integer variables
Xnt representing the number of units of each type
n available at each stage
t, forward-looking period
T and their unit capacity
Pn, taking into account the technical limitations of their operation:
where
Ynsdzt—variable representing the total power of new generating units of type
n at time
t, used to cover
z zone of the typical day
d of season
s of the electricity load schedule (ELS), MW;
S—typical seasons,
D—typical days, and
Z—zones of daily ELS;
,
—the coefficients that account for the minimum and maximum allowable operating load of the unit,
0 ≤ <
1 and
0 < ≤ 1.
Existing type units at the beginning of the forecasting period are also represented in the model by their unit capacity
Pe and the exogenous parameter
Net, which represent their numbers at stage
t. In the ELS coverage balances, existing type units are represented by the variable
Yeszt, which is limited by their total installed capacity, similar to Formula (1):
This modelling approach allows for the dynamics of capacity commissioning and decommissioning over the forecast period to be considered, subject to the duration of their life cycles, investment conditions and constraints, as well as changes in forecast electricity demand. The criterion for the optimal long-term development of the power system’s generation capacity structure is the minimisation of the total costs of new generating plants and the operating costs of existing capacity, whilst meeting typical daily electricity load schedules. The costs of new plants are calculated through commissioning, considering the dynamics of their components, in particular changes in unit capital investment, fuel prices, and charges for emissions of pollutants and greenhouse gases (GHGs).
To account for the role of BESS in the mathematical model of the long-term development of the power generation capacity structure of the electricity system, a transition was made from the traditional separate coverage of the three-zone daily schedule to its representation as successive time intervals throughout the day [
20]. To achieve that, the hourly profile of the daily load schedule is divided into intervals (segments) of constant power and a specified duration, which, when aggregated over the daily energy volume, must correspond to the actual 24 h ELS. This is formalised as follows:
where
Dsdτ is the power of the ELS at hour
τ of a typical day
d in season
s, in MW;
Δτ is the hour of the day;
Z is the total number of hourly segments of the ELS;
Dsdz is the power during time interval
z of a typical daily ELS, in MW; and
hdz is the duration of segment
z of the daily ELS
d, in hours.
This enabled the modelling of the charge–discharge dynamics of the storage system, accounting for its state of charge and available capacity. A similar approach was used to model the participation of pumped-storage hydroelectric plants (PSHPs). The use of storage systems involves transferring surplus power from wind- and solar-power plants [
21].
To account for the variability of renewable energy generation and electricity demand, the model considers consecutive time intervals (segments) across typical days of the year, reflecting the need for flexible technologies and energy storage. The load and power of RES in these segments are assumed constant and determined by averaging their actual hourly data [
21]. Based on the obtained averaged values, loads and RES power profiles are determined for each of the segments of typical days, which are used to generate loads and power parameters for WPPs and SPPs for each time of the forecast period in accordance with the total annual electricity demand and the forecast installed capacities of these RES.
Ensuring the flexibility of the power system when integrating significant volumes of non-guaranteed wind and solar power capacity is achieved by including in the balances the generation technologies capable of rapidly adjusting their power output and start operation (gas turbine and gas reciprocating engine units), using BESS to shift surplus RES generation to peak consumption hours, and PtH technologies to convert it into thermal energy consumed in district heating systems.
The application of PtH technology for the balanced integration of significant amounts of renewable energy requires the consideration of their heat output into district heating systems. To address this, heat demand balances have been incorporated into the mathematical model to forecast the long-term development of the power system’s structure. The link between the electricity and heat energy balances is ensured through combined heat and power technologies (CHPPs, cogeneration units) and PtH technology.
PtH technology in the segment coverage balances of daily ELSs is determined by variable electricity consumption:
where
aksfz—coefficients that take into account possible operating modes
f of technologies within a specific range from the minimum operating power to the rated capacity (thermal power plants (TPPs), combined heat and power plants (CHPPs), and nuclear power plants (NPPs));
Yksdzt—hydropower plants (HPPs) variable power, MW;
—water discharge power of HPPs for a typical day
d of season
s [
19], MW;
aksdz—WPP and SPP power profile in the corresponding segment
z of the daily generation schedule;
Nkt—the number of WPPs and SPPs with unit capacity
Pk for each stage of the forecast period [
21];
Rksdzt,
Zksdzt—PSHP or storage system (grid-connected BESSs or those operating in conjunction with RES (AB)) generation-consumption power variables when covering
z segment of the ELS of day
d in season
s [
20], MW;
ZEBsdzt—consumption power variable of PtH technology, MW; and
,
—import-export power variables, MW. New and existing technologies of the same type, denoted by the indexes
n and
e in Equations (1) and (2), are indicated by the index
k in this equation.
The model considers two types of energy storage systems—grid-connected BESS, used for power system balancing, and storage systems within hybrid RES power plants, which utilise their surplus generation in energy arbitrage mode.
To ensure the balanced operation of the power system when integrating RES, the energy they generate can be fed directly into the grid or, in the event of a surplus in the power system, be charged by the storage system within its available energy capacity, current state of charge and anticipated demand during subsequent time segments of the day. Unused surplus generation from RES must be fed into the grid [
21]. That is, the total generated power from WPPs and SPPs consists of three variables—power fed directly into the grid
YGksdzt, power stored in the storage system
YAksdzt, and power not fed into the grid
YCksdzt:
Forced curtailment of power output from WPPs and SPPs into the grid can be avoided by using electric heat generators (EHG) PtH technologies that convert renewable electricity surplus into thermal energy for DHS:
If it is not possible to fully consume the excess VRES power using PtH technology, the remaining power to be curtailed is added to the power balances of ELS with a negative value and to the functional with a specific curtailment cost coefficient, which corresponds to the payments made to RES producers when their generation is curtailed.
The most suitable technology for this is electric boilers, which require a low capital investment and can operate in variable-load modes at low operating costs. In the model, the variable power consumption of EHG in each segment of the daily ELS is limited by their available installed capacity, which for each stage of the forecast period is determined according to the unit capacity
PEB and the available quantity
nEBt:
The coverage balances of the segments of the daily thermal load schedules (TLSs) of the DHS are formed in a similar manner to the coverage balances of the ELSs, using thermal energy generation technologies, the supply of thermal energy from CHPPs and cogeneration units, as well as excess electricity from RES converted into EHG. The coverage balance for each segment of the daily TLS is recorded as:
where
YHksdzt—TPPs, CHPPs and cogeneration units heat supply power, MW;
Hksdzt—heat supply power of type
k heat generation units from the
HB set (fossil fuel boilers, biofuel boilers, etc.), MW;
HEBsdzt—EHG heat supply power, MW;
zHIsdzt—artificial variable for balancing the heat production-consumption imbalance, defining the amount of power deficit during segment
z, MW; and
DHsdzt—heat consumption power in the corresponding segment
z of the daily TLS, MW.
The variability in heat output power across different heat generation technologies is limited by the number and individual capacity at the relevant stage of the forecast period, considering the seasonal availability of their use:
where
PHk—unit capacity of heat generation technology of type
k, MW;
nkt—number of units of type
k at stage
t; and
kks—availability coefficient of units of type
k in season
s.The heat output power variable from combined production technologies is limited in accordance with the electrical power of their operation in the ELSs, considering the technological ratio between thermal and electrical power:
where
κE2H—the ratio between electrical and thermal power.
The EHG thermal energy is utilised in the corresponding segment of the daily TLS in accordance with power consumption in the ELS, considering the efficiency
ηEB of converting electrical energy into thermal energy:
The condition for the use of electric boilers in modelling is the conversion of all consumed electrical energy into thermal energy over a day:
where
hsdz—duration of the ELS segment
z on a typical day
d of the season
s, hours. Since, in accordance with the modelling assumptions, the typical day must be divided into segments in the same way in the electrical and thermal load schedules, the same duration parameters are used for both.
The use of energy storage systems is modelled based on values such as nominal available energy capacity, maximum permissible charge and discharge rates, round trip efficiency, and the state of charge of the storage. The battery’s state of charge at the beginning of each time segment is determined based on the energy accumulated at the beginning of the previous segment and the energy charged or discharged during that period [
20]:
where
SoCksdzt—variable representing the amount of charged energy in the storage at the start of the
z-th time segment, MWh and
ηkRT—round trip efficiency of the storage unit. The amount of charged energy in each storage unit segment is limited by its available capacity. The state of charge of the storage unit at the start of the first segment of the day is set according to the modelling conditions—the storage unit is either empty or charged to a specified percentage of its nominal capacity. The PSHPs use is modelled in a similar manner.
Prevention of simultaneous charging and discharging of the storage unit in the corresponding segment of the daily ELS is modelled using Boolean variables in the charging and discharging power constraints:
where
bksdztR,
bksdztZ—Boolean variables (0 or 1);
PkR and
PkZ—the maximum discharge/charge powers of the storage unit, MW.
In the model, it is assumed that all the energy stored during the day will be used within the same time period:
In accordance with the thermal energy balance modelling DHS, the costs of heat production—including EHG PtH technology—have been added to the model’s functional [
21], which minimises system-wide costs:
where
Cckt—levelized specific fixed costs of technologies,
$/MW;
XNkt—the number of new type
k units installed at time
t;
Cvksfzt—levelized specific variable operating costs of the units, adjusted to the stage
t at the start of their operation,
$/MWh;
Tsd—number of typical days
d in the season
s;
cgkt—coefficients corresponding to the current green tariff levels and the maximum projected auction price levels for the appropriate WPPs and SPPs,
$/MWh;
carkt,
czrkt,—cost of discharging/charging energy storage systems,
$/MWh;
cit,
cet—prices of imported/exported electricity,
$/MWh;
cEBCt,
cEBHt—cost of electricity consumption/heat supply by EHG,
$/MWh;
cGHt—the cost of heat supplied by combined-cycle power plants,
$/MWh;
cHkt—the cost of heat generation at boiler houses,
$/MWh; and
kHIt—coefficient of the balanced variable for conditionally imported thermal energy,
$/MWh.
3. Results and Discussion
The model was tested using forecasts of electricity and heat consumption from the draft update of the National Energy and Climate Plan (NECP) [
22].
The development of renewable energy capacity within the power system is based on the figures set out in the National Action Plan for the Development of Renewable Energy by 2030 [
23], with projected growth trends up to 2040 [
24], which are consistent with the data presented in the NECP draft.
The development of nuclear capacity envisages using the existing nine NPPs with an installed capacity of 7.8 GW, completing two units at the Khmelnytskyi NPP, and bringing the four nuclear power units into operational service.
Existing thermal generation, following extensive damage and partial restoration, can provide around 3.8 GW of available capacity. The assumptions for testing the model are that coal-fired power units at thermal power plants and coal-fired combined heat and power plants will be decommissioned after 2035, in accordance with Ukraine’s declared commitments to phase out coal-fired generation by 2035.
Given the current shortage of domestic capacity, electricity imports from EU countries are crucial for balancing demand; this depends on the transmission capacity of Ukraine’s cross-border interconnections with ENTSO-E countries, which has been estimated in line with the forecast trends set out in the draft update of the NECP. The limits on electricity export/import variables for the IPS have been established in accordance with the baseline scenario of the projected dynamics of interconnection capacity [
22]. Export capacity remains unchanged until 2040 at 650 MW, whilst import capacity increases from 2100 MW to 3350 MW.
Increasing the flexibility of the power system to ensure the proper integration of power plants with non-guaranteed capacity based on VRES (SPPs and WPPs) is envisaged using highly manoeuvrable capacity with rapid start-up capability and BESS. System balancing is also achieved through HPPs, PSHPs and manoeuvrable TPPs.
The BESS development is growing rapidly, driven by legislative initiatives and the need to RES balance, particularly SPPs. Currently, 600 MW BESS are connected to the grid, whereas in 2024, there were only 2 MW [
25], and technical specifications have been issued for the connection of a further 1.4 GW of new energy storage. A significant contribution to the growth of energy storage has been made by DTEK RES, which, in partnership with the American company Fluence Energy, has launched an energy storage complex with a power capacity of 200 MW and a storage capacity of 400 MWh across six sites, and by KNESS, which in 2025 completed the construction of eight energy storage parks with a total capacity of over 140 MWh [
26].
The characteristic ELSs for winter and summer days were derived from the actual hourly loads of typical days based on 2019 data, converted into six-segment daily ELS with each time interval lasting 4 h. Based on the determined segment-specific load factors (
Table 1) and forecast annual electricity consumption, the load for each segment on a typical day of the year during the forecast period was calculated. Typical working days for the heating and non-heating seasons were selected, with a transition from hourly power to the average power for each 4 h segment of the day (six segments in total).
The specific capacity factor (CF) of SPP and WPP were also calculated for typical days in the two seasons based on data on their actual total power output IPS in 2019 (
Table 2).
The specific heat load was determined in accordance with the established daily hourly TLSs of the DHS. The methodology described in [
27] was used to construct these graphs. With its use, the annual share of heat energy supplied by Ukraine’s DHS and its distribution across the months of the year were determined. The average daily thermal output of the boiler houses was then determined in accordance with the formula:
where
Pi—average thermal power of boiler houses in the
i-th month, MW; 1.163—conversion factor between MW and Gcal/h;
Qi—the amount of thermal energy produced by the boiler houses in the
i-th month, Gcal/h;
Ni—the number of days in the
i-th month; and 24—the number of hours in a day.
To construct an hourly graph of boiler house power during the non-heating period, the results of a statistical analysis of hourly hot water consumption in DHS, as presented in [
28], were used. For each hour of the working and non-working day, based on the data presented in [
28], the ratio was determined as follows:
where
Vj—volume of hot water consumption in the
j-th hour;
Vavg—average volume of hot water consumption per day.
The distribution of boiler house power output over a 24 h period was determined using the formula:
where
Pj—boiler house power at the
j-th hour of the day, MW.
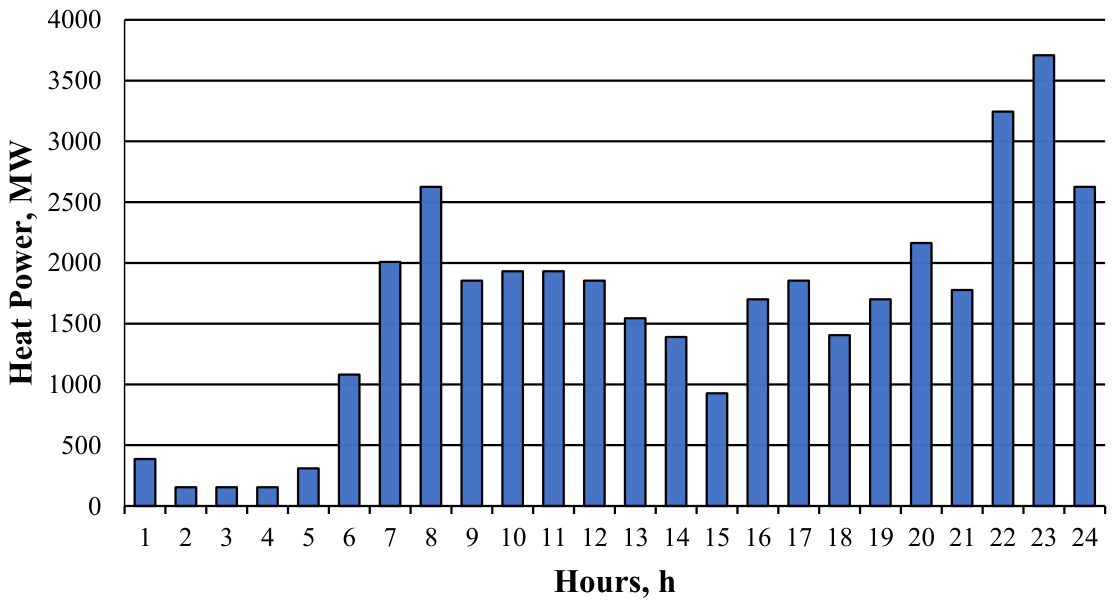
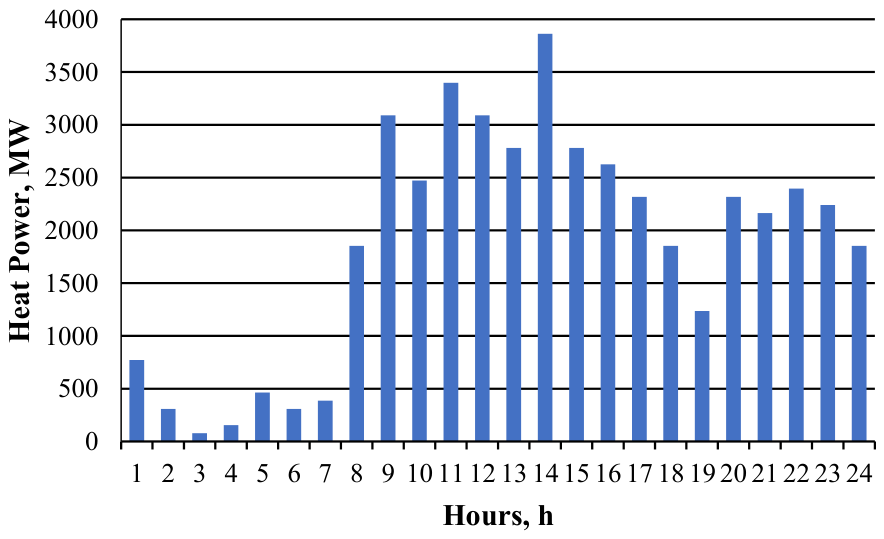
The results of the calculations of hourly heat power outputs for an average day in May are shown in
Figure 1 and
Figure 2.
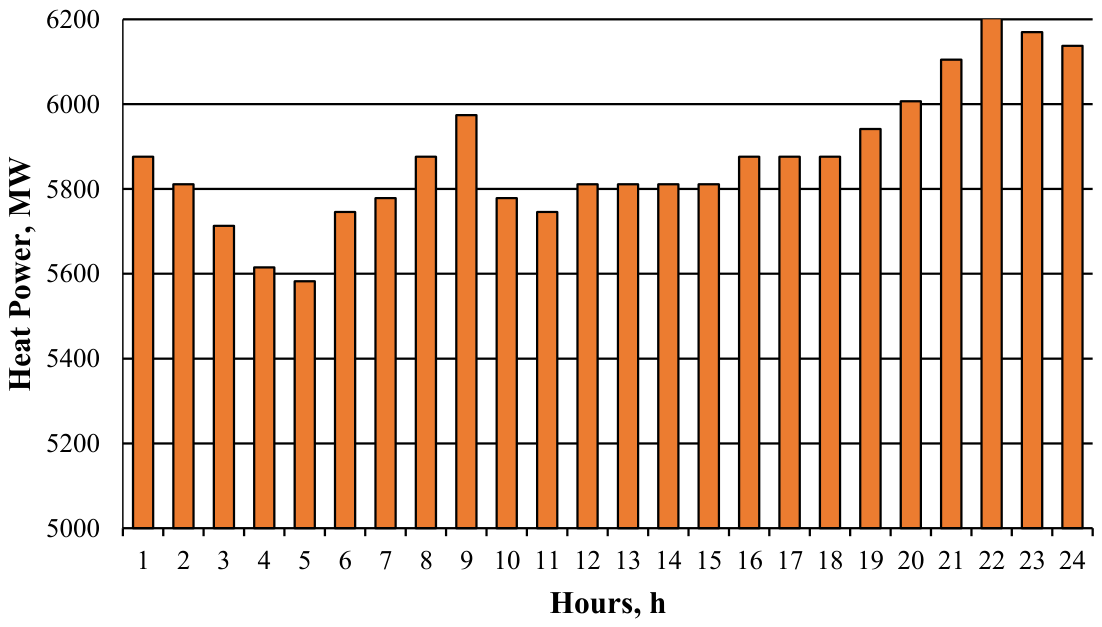
January was selected as the representative month for the hourly capacity of boiler houses during the heating season. In this month, the average thermal capacity was 5876.2 MW. The hourly capacity was calculated using Equations (17) and (19). The coefficient
k was determined from the actual daily hourly capacity schedule for Kharkiv CHP-3 during the heating season. The results of the calculations are shown in
Figure 3.
Power fluctuations between 1 and 10 a.m. are due to fluctuations in hot water consumption, whilst those between 6 p.m. and midnight are due to fluctuations in hot water consumption and a drop in outdoor air temperature.
The hourly power outputs of boiler houses for typical days in the heating and non-heating seasons, shown in
Figure 2 and
Figure 3, were converted into six-segment heat load profiles for the DHS using Formula (2). The results are presented in
Table 3.
The resulting forecast structure of IPS capacities, obtained from an optimisation calculation based on the criterion of minimising system-wide costs whilst meeting the ELSs and TLSs, is presented in
Table 4.
The operation of energy storage systems, pumped storage power stations, cogeneration units and electric boilers is illustrated by the results of modelling the coverage of heating and electricity demand for typical days in the heating and non-heating seasons of 2040 in
Table 5 and
Table 6.
In
Table 5 and
Table 6, all values are given in MW; negative values indicate consumption powers in the load-coverage balances. All powers are considered constant for each segment of the daily load schedule.
The results of the daily power balancing, shown in
Table 5 and
Table 6, indicate that PtH-technology electric boilers are used only during the non-heating season, at times of day when SPPs generate significant amounts of electricity; the powers of these plants, combined with that of WPPs, account for almost half of the load capacity. At the same time, more than half of the load demand is covered by inflexible NPPs. This necessitates the use of electric boilers to consume the surplus of these VRES, with heat being supplied to DHS, thereby displacing natural gas-fired technologies from in TLS coverage. The reduction in thermal load during the middle of the day leads to a decrease in the use of electric boilers in ELS coverage, with PSHPs being utilised to meet electricity demand. On a typical day during the heating season, NPPs power accounts for more than half of electrical power consumption, which leads to the PSHP use in traditional consumption mode during nighttime load dips, with subsequent electricity supply during periods of peak demand.
To compare the advantages of using PtH technology, a model calculation was performed in which the capacities of the electric boilers were not considered, and the storage systems’ capacities were set to match the values obtained in the previous model calculation. The results for covering the electrical and thermal loads on a typical day of the heating season were almost identical to those from the preliminary calculation. In a typical day during the non-heating season, storage systems operate at maximum power to cover the segments of the daily electricity load schedule (
Table 7). However, the total energy storage capacity of energy storage systems remains insufficient to achieve balance, and during periods of peak solar power generation, their output is limited. In addition, the lack of heat output from electric boilers has led to an increased use of natural gas-fired capacity (at CHP plants and boiler houses). Their increased heat production over the course of a day—by 8.6 thousand MWh—led to a 2.8 thousand metric ton increase in CO
2 emissions per day.
The test modelling results demonstrated the feasibility of using PtH technology as an added source of power system flexibility when integrating a significant amount of renewable energy sources, by converting their excess generation into thermal energy, which is then supplied to the district heating system. The lower time resolution of the daily load curves used in long-term period modelling does not allow for full consideration of short-term changes in renewable energy generation and consumption, which requires an additional assessment of whether the resulting power system forecast capacity structures are adequate to balance such changes. The further modelling involves using the developed UC model for Ukraine’s power system to stage-by-stage verify and adjust the adequacy of the obtained long-term power capacity structures to meet daily load schedules throughout the year.
The resulting power system capacity structure is the output of a test calculation based on a single illustrative scenario of external conditions for the development of electricity and heat supply systems and does not constitute a final forecast. Determining the long-term development paths for the Ukraine power system’s capacity structure requires both the development of scenarios for the external conditions of its operation and development (scenarios of projected demand for electricity and thermal energy, fuel prices and environmental charges, changes in the regulatory and legal framework governing the operation and development of both the power system as a whole and individual technologies, etc.), as well as the extension of the model itself through the simulation of balances and conditions for meeting load schedules on other typical days.
4. Conclusions
It has been shown that integrating large-scale SPPs and WPPs with poorly predictable stochastic electricity output places stringent demands on the power system’s flexibility. When this flexibility is insufficient, operators resort to forced curtailment of their power, leading to economic losses and a reduction in the expected level of greenhouse gas emission reductions.
It has been established that the key measures to avoid curtailment are the development of energy storage, the expansion of interregional interconnectors, demand response and the optimisation of the capacity mix. Forced curtailment of RES can be prevented through synergy between the electricity and heating sectors using PtH technology. The use of renewable electricity for heating purposes can help decarbonise the heating sector and facilitate the integration of VRES into the power system, providing additional flexibility. PtH systems can utilise surplus electricity from VRES to meet heating needs, thereby avoiding the curtailment of VRES generation and contributing to the decarbonisation of the electricity and district heating sectors.
The development of a long-term forecasting model for the evolution of the power system’s capacity structure, combining the balances of coverage of the electrical load of the power system and the thermal load of the district heating system for typical days of the year, ensured the consideration of energy storage systems and PtH technology for the consumption of surplus energy from SPPs and WPPs.
The results of testing the model using forecasts of electricity demand in Ukraine’s IPS and heat consumption by DHS up to 2040, covering typical daily electrical and heat load profiles consisting of six four-hour segments, demonstrated the feasibility of using PtH electric boilers during the non-heating season when there is significant renewable energy generation, particularly solar generation, and the significant baseload power of NPPs. The use of EHGs to consume surplus energy from these renewables by supplying heat to DHS, thereby replacing heat from natural gas-fired technologies, contributes to the decarbonisation of both the electricity and heat supply. Without the use of PtH-technology electric boilers, the available capacity of storage systems proved insufficient to cover a typical daily electricity load profile and balance electricity production and consumption; as a result, a significant share of renewable energy generation was restricted during peak solar power plant generation periods.
An 8.6 thousand MWh increase in heat production by natural gas-fired CHP plants and boiler houses over a 24 h period, with no heat supplied by electric boilers, led to a 2.8 thousand ton increase in CO2 emissions per day.