1. Introduction
Digital transformation is widely regarded as an important catalyst for accelerating the transfer of scientific and technological achievements and for supporting the development of knowledge-based productive forces [
1]. The digital transformation of businesses today increasingly builds on the synergy of IoT and AI, which together help transform static data into strategic value and are frequently discussed in connection with improvements in business performance [
2,
3,
4].
The synergy between AI and IoT is increasingly discussed as an important component of enterprise digital transformation and business performance [
5,
6,
7]. This technological convergence enables the development of intelligent organizational systems in which data generated from the physical environment (IoT) inform algorithm-supported decision-making processes [
7,
8]. Its relevance can be observed across several key dimensions of business activities, including: production and logistics [
9,
10]; marketing, sales, and customer experience [
11,
12]; financing and risk management [
13,
14]; human resources and internal operational efficiency [
15,
16]; information technology and cybersecurity [
17,
18]. The integration of AI and IoT, therefore, represents an increasingly important strategic direction for firms. Firms that successfully connect operational data with advanced analytical capabilities may achieve greater organizational agility, reduced operating costs, and a stronger competitive position in the market [
3].
While the issue of corporate performance in relation to business competitiveness is an extensively debated field among researchers, supported by numerous quantitative empirical studies, there is currently a notable lack of firm-level evidence on how enterprise characteristics, performance context, AI/IoT scope, organizational readiness, implementation barriers, and domain-specific use patterns are associated with the reported success of IoT and AI initiatives. To address this gap, the article develops a concise conceptual framework that links these predictor blocks to an enterprise-level reported success outcome and then evaluates their predictive relevance in a consistent out-of-sample modeling design. The empirical findings presented in this article aim to offer practical implications for business owners and managers, particularly in strategic management and enterprise risk management, by identifying variables that are informative for predicting reported AI/IoT success in enterprise settings.
The article structure is as follows. The Introduction and Literature Review summarize the broader business-performance context of AI and IoT and introduce the conceptual logic of the study. The Methodology section outlines the research objectives, data collection procedures, questionnaire design, variable operationalization, and predictive modeling workflow. The Results section presents model performance, diagnostics, and interpretation using graphical and tabular outputs. The Discussion compares the findings with prior international evidence. The Conclusion summarizes the main findings, study limitations, and future research directions.
2. Literature Review
2.1. Business Performance in the Context of IoT and AI Era
The level of use of AI and IoT has been linked in prior research to differences in business performance [
19]. Several researchers are inclined to believe that this relationship is non-linear [
20,
21]. With the increasing integration of these technologies, the benefits multiply due to their mutual synergy. Companies with a lower level of digitalization tend to address problems more reactively, often only after they arise [
22,
23,
24]. Higher levels of AI and IoT use have been associated with lower machine downtime and longer equipment lifespan [
25].
Verma demonstrates that the integration of IoT capabilities, smart technologies (STs), and green corporate practices serves as a vital determinant in enhancing both supply chain and enterprise performance. Ultimately, the adoption of technology-driven strategies not only optimizes operational efficiency but also builds strategic resilience, ensuring business continuity and performance stability in volatile market environments [
9].
Pyra et al. (2025) [
10] demonstrate a statistically significant positive correlation between the adoption of smart technologies and the advancement of sustainable development practices within the Polish logistics sector. Key findings indicate that warehouse automation, real-time data analysis, and optimized route planning not only improve resource efficiency but also serve as primary predictors for enhanced environmental commitment and corporate social responsibility (CSR). This relationship is particularly pronounced in large-scale enterprises and companies operating in international markets, suggesting that digital maturity is a fundamental driver of sustainability [
10].
Pino et al. (2024) [
26] identify IoT maturity models as essential strategic tools for organizational decision-making and resource allocation. Through a systematic review of 36 primary studies, the research reveals that these models typically evaluate maturity across five core dimensions: technological, organizational, human, performance, and security. While these frameworks provide a graded path for increasing IoT sophistication-enhancing productivity and real-time analytics, the findings highlight significant gaps in the current landscape. Specifically, there is a lack of empirical validation and standardized improvement frameworks. The researchers conclude that while diverse models exist, the enterprise domain requires more adaptable, user-friendly, and comprehensive tools to effectively bridge the gap between initial technology adoption and high-level digital maturity [
26].
The research introduces ATLANTIS, a specialized maturity model designed to bridge the gap between technical potential and practical implementation of the Internet of Things (IoT) within small- and medium-sized industrial enterprises (SMEs). Unlike generic frameworks, ATLANTIS employs a holistic taxonomy that integrates organizational, human, and technological dimensions across seven key components. Validated by 44 international experts via the Delphi method, the model provides granular rubrics that allow SMEs to move beyond mere technical installation toward true organizational readiness. The findings underscore that successful IoT adoption in the industrial sector is contingent upon workforce adaptation and structured progress tracking. Ultimately, ATLANTIS serves as a robust diagnostic tool for managers to identify specific maturity gaps and align digital transformation with overall business performance [
27].
2.2. Application Areas of IoT and AI
The integration of the IoT and AI represents a fundamental technological paradigm that significantly reshapes contemporary organizational processes and value creation mechanisms [
28]. Through the continuous generation and processing of real-time data, IoT-enabled infrastructures provide the informational foundation upon which AI-driven analytical models operate, thereby facilitating more efficient, data-informed managerial decision-making [
29].
In the domain of production and operations management, IoT sensors enable continuous monitoring of machine conditions and operational parameters. These data streams are subsequently analyzed by AI algorithms to support predictive maintenance strategies, which reduce unexpected equipment failures, minimize operational downtime, and extend the lifecycle of industrial assets. Furthermore, AI-based systems are capable of dynamically optimizing production processes and resource allocation in response to fluctuations in demand and operational conditions [
3,
5,
7].
Within logistics and supply chain management, IoT technologies provide end-to-end visibility of goods movement through advanced track-and-trace mechanisms. AI-driven analytical models can process these data to identify inefficiencies in transportation routes, predict potential delays caused by traffic congestion or adverse weather conditions, and propose alternative logistical scenarios. Such capabilities contribute to enhanced supply chain resilience, improved operational efficiency, and reduced inventory and storage costs [
9,
30].
The convergence of AI and IoT also fundamentally transforms marketing and customer relationship management practices [
31]. By analyzing data generated through smart devices and digital consumer interactions, AI systems enable highly granular customer segmentation and behavioral analysis. These insights support the development of personalized marketing strategies, targeted product recommendations, and adaptive pricing mechanisms, thereby enhancing customer experience and strengthening competitive positioning [
32].
In the area of business intelligence (BI) and organizational reporting, traditional analytical frameworks are increasingly evolving toward augmented analytics. Contemporary AI-driven analytical platforms are capable of autonomously generating dashboards and analytical reports that visualize organizational performance indicators in real time [
33,
34]. Moreover, these systems can automatically identify anomalies, emerging trends, and hidden patterns within large-scale datasets without requiring direct manual intervention by analysts.
The financial management function also benefits substantially from the integration of AI and IoT technologies. In financial operations, these technologies enhance data integrity, transparency, and security while supporting strategic decision-making related to financial risk management [
19]. AI-based analytical models can detect suspicious transactions or irregularities in supplier invoices almost instantaneously, thereby strengthening fraud detection mechanisms [
13]. Additionally, predictive analytical models enable more accurate cash-flow forecasting and facilitate the optimization of investment portfolios based on continuously updated market data [
35,
36].
The ongoing digital transformation is also reshaping human capital management practices. AI technologies increasingly support recruitment and talent acquisition processes through automated curriculum vitae screening, candidate profiling, and the evaluation of organizational cultural compatibility [
16]. Simultaneously, IoT-enabled smart office environments allow organizations to monitor workspace utilization and environmental conditions, thereby optimizing workplace design and contributing to improved employee well-being and productivity [
37].
Another emerging dimension of AI deployment involves the application of generative artificial intelligence (GenAI) tools within organizational knowledge management and consulting functions [
38]. Internal digital assistants based on large language models (LLMs) increasingly function as integrated corporate knowledge systems, enabling employees to rapidly access internal guidelines, technical documentation, and organizational knowledge bases [
39]. These systems can also assist in the automated generation of preliminary drafts of reports, analytical summaries, and internal communications, thereby significantly reducing administrative workload and enhancing organizational efficiency [
40].
However, the rapid expansion of IoT infrastructures simultaneously increases the potential attack surface for cyber threats. In this context, AI-based cybersecurity systems play a crucial role in ensuring organizational resilience [
41]. Advanced AI-driven security frameworks continuously monitor network traffic, detect patterns associated with malicious activities such as malware infiltration or distributed denial-of-service (DDoS) attacks, and can autonomously isolate compromised IoT nodes before sensitive organizational data are exposed [
42]. Consequently, the integration of AI within cybersecurity architectures represents a critical prerequisite for the secure and sustainable implementation of IoT ecosystems in modern enterprises.
2.3. Conceptual Framework and Rationale for the Reported AI/IoT Success Outcome
The literature increasingly conceptualizes AIoT as its functional integration, in which sensing, connectivity, real-time data flows, and intelligent analytics are combined into architectures capable of supporting adaptive decisions and, in some contexts, autonomous action [
43,
44]. Across domains, success is not reduced to technical deployment itself. Rather, it is linked to whether this integration produces meaningful organizational outcomes such as better decision-making, higher efficiency, resilience, interoperability, sustainability, and stakeholder acceptance [
43,
44,
45]. In this sense, enterprise AI/IoT success should be understood as a multidimensional implementation outcome rather than as a purely technological event.
On this basis, the present study organizes the predictors into six conceptually linked blocks. The first block captures firm profile and contextual positioning, represented by company size, age, industry, country, and market internationalization. These variables define the structural conditions under which AI/IoT is introduced. The second block reflects relative performance context, because firms operating from stronger competitive positions may have more room to invest, absorb uncertainty, and stabilize digital initiatives. The third block covers AI/IoT scope and value realization, represented by use history, project count, and especially the share of competitive advantage attributed to AI/IoT. This block reflects the idea that implementation outcomes depend not only on technology presence, but also on whether firms connect AI/IoT to meaningful business value and strategic relevance [
42,
43].
The fourth block comprises organizational readiness and implementation capacity. In line with the literature, AIoT success depends on whether firms possess adequate infrastructure, openness to experimentation, investment momentum, and human-resource capacity to embed these technologies into everyday organizational processes [
42,
45]. The fifth block captures implementation barriers, because even technically promising initiatives may fail to generate organizational benefits when governance is weak, coordination is insufficient, capabilities are limited, or trust in AI-supported systems is fragile [
46,
47]. The sixth block addresses use-domain heterogeneity. AI/IoT initiatives in manufacturing, logistics, finance, HR, IT, or cybersecurity differ in maturity requirements, implementation complexity, and expected value logic; therefore, the same overall technological effort may translate into different levels of reported success depending on the organizational domain in which the technology is deployed [
43,
44,
45].
Within this framework, ai_iot_success_rate is treated as an enterprise-level reported outcome summarizing how successful the firm’s AI/IoT initiatives have been overall. This operationalization is appropriate for the present study because the literature frames AIoT success as a broad organizational result emerging from the interaction of architecture quality, value realization, readiness, governance, and stakeholder acceptance rather than from one isolated performance indicator [
43,
45,
46,
47,
48]. In a cross-firm survey setting, a reported success rate therefore provides a pragmatic summary proxy of realized implementation success. At the same time, it should be interpreted as a managerial assessment of outcomes, not as an audited objective metric or as direct evidence of causality.
3. Aim, Methodology, and Methods
The aim of this study is to develop and evaluate a quantitative, firm-level predictive model of the reported success rate of AI/IoT initiatives in business practice, operationalized as the share of successful AI/IoT initiatives reported by enterprises (ai_iot_success_rate, 0–100). Rather than estimating causal effects, the study focuses on out-of-sample predictive performance, the relative predictive relevance of candidate firm characteristics, and the presence of nonlinear patterns captured by complementary model families. The analysis addresses three research questions:
RQ1: Which company characteristics, performance-related variables, and AI/IoT-related capabilities are most informative for predicting reported AI/IoT success rates?
RQ2: Do nonlinear machine-learning models improve out-of-sample predictive performance relative to a regularized linear baseline?
RQ3: What nonlinear patterns and interactions in model predictions can be identified for the most informative predictors using interpretable model-inspection tools?
The analytical part is based on primary data obtained through a standardized online questionnaire. The collection was organizationally provided by an external research agency (MNFORCE). Quantitative analysis was carried out in the Python programming language (vers. 3.12.1) using libraries for data processing (pandas, numpy), modeling (scikit-learn) and visualization (matplotlib and seaborn).
Data collection took place in the period October 2025–January 2026 and covered the Slovak Republic and the Czech Republic. After cleaning, the dataset represented 1250 observations (750 from the Czech Republic, 500 from the Slovak Republic). The unit of observation is the enterprise; the dataset is not the panel in nature and does not contain repeated measurements.
Respondents were people with decision-making competence in the enterprise (owner, director, or manager), i.e., respondents were able to assess the implementation of AI/IoT and project results in a qualified manner. The selection was mainly focused on organizations with practical experience with AI and/or IoT (including pilot/test projects). The questionnaire was pilot tested before deployment (September 2025; n = 20) to verify the understandability of the items and the consistency of the scales.
At the same time, the questionnaire-based design entails important measurement limitations. Several predictors, as well as the dependent variable, rely on managerial self-reports and simplified single-indicator summaries, which may not capture the full multidimensionality of constructs such as implementation quality, organizational readiness, or realized AI/IoT success. In addition, because the main variables were collected from the same respondent within the same survey instrument, the study cannot fully rule out common-source inflation (common method bias), and the reported relationships should therefore be interpreted with appropriate caution.
3.1. Dataset Structure, Cleaning, and Preprocessing
The resulting dataset consists of one table created by merging the national datasets (SR and CR; see also
Supplementary Materials). After merging, a binary variable Slovakia (1 = SR, 0 = CR) was created. The online form of collection allowed for checking the ranges (e.g., 0–100 for scales), which reduced the occurrence of illogical values. As part of additional cleaning, isolated inconsistencies were removed, and a correction was made to the variable firm_age_years (e.g., cases where the calendar year was mistakenly stated). The dataset is anonymized, and the collection took place with the consent of the respondents.
For modeling purposes, categorical variables were encoded using one-hot encoding (drop_first = True), which created dummy variables with the reference category omitted. In tree models and SVR, these dummy variables were used directly, while in the linear part (Elastic Net), such a procedure is necessary for the numerical representation of categories.
Given the questionnaire nature of the data, it is important to explicitly consider the limitation of the dependent variable to the interval 0–100, the possible presence of floor/ceiling effects, and potential slight deviations from classical assumptions (e.g., normality of residuals). For these reasons, diagnostic graphs and robustness control of performance are part of the methodology. Missing value occurrence was prevented by online form of the questionnaire.
3.2. Questionnaire-Based Variables and Operationalization
The variables were constructed directly from the questionnaire items and then organized into thematic blocks derived from the conceptual framework presented in
Section 2.3. Specifically, the model distinguishes between:
firm profile and contextual positioning.
relative performance context.
AI/IoT scope and value realization.
organizational capacities, readiness, and implementation conditions.
domain-specific areas of AI/IoT use.
This organization reflects the theoretical logic that reported AI/IoT success is shaped by the joint configuration of firm context, value realization, implementation capacity, barriers, and deployment domains rather than by technology presence alone.
3.2.1. Variables–Company Profile
firm_size_employees–number of employees (min 1, max 5000), indicates the size of the company.
firm_age_years–number of years the company has been operating on the market (min 1, max 200), after cleaning, isolated errors were corrected.
Industry–industry of operation; encoded with one-hot encoding (drop_first = True). Dummy variables in the final data: Industry_IT, Industry_Other, Industry_Production, Industry_Public_Sector, Industry_Sales, Industry_Services, Industry_Transport (reference category: finance).
market_internationalization–market operation: local market/occasional export/significant part of activities abroad/part of TNK; encoded with one-hot encoding (reference category: Local_market).
slovakia–country (1 = Slovakia; 0 = Czech Republic).
3.2.2. Variables–Relative Firm Performance
revenue_growth_rel–revenue growth vs. the most important competitor (scale 0–100, 50 ≈ equal level).
profitability_rel–profitability vs. the most important competitor (scale 0–100, 50 ≈ equal level).
productivity_rel–productivity and cost-effectiveness vs. the most important competitor (scale 0–100, 50 ≈ equal level).
3.2.3. Variables–AI/IoT Project Scope and Success
ai_iot_use_years–number of years of use of AI/IoT solutions (including pilot testing).
ai_iot_project_count_5y–number of AI/IoT projects implemented in the last 5 years (including smaller pilot tests).
ai_iot_success_rate–estimated percentage of successful AI/IoT initiatives (0–100), used in this study as the main dependent variable. Conceptually, this variable captures an enterprise-level reported summary of realized implementation success across the firm’s AI/IoT initiative portfolio as assessed by an informed managerial respondent. It should not be interpreted as an audited objective performance metric, but rather as a reported organizational success proxy suitable for cross-firm comparative modeling in a survey setting.
ai_iot_advantage_share–share of competitive advantage attributed to AI/IoT (0–100). In conceptual terms, this variable is treated as a value-realization signal indicating the extent to which respondents perceive AI/IoT as contributing to competitive advantage.
3.2.4. Variables–Capacities, Readiness, and Organization
it_reskilling_share_3y–estimate of the share of IT employees requiring retraining in the next 3 years due to AI/IoT (0–100).
ai_iot_fte–number of full-time equivalents (FTE) dedicated to AI/IoT activities.
outsourcing_share–share of AI/IoT work performed by external partners (0–100).
infra_readiness_pct–share of available infrastructure required for full-fledged use of AI/IoT (0–100).
tech_openness–openness of the company to experiment with new technologies (ordinal scale 1–5, higher = greater openness).
ai_iot_investment_trend–change in investments in AI/IoT over the last 3 years (ordinal scale 1–5, 1 = significantly decreased, 3 = no change, 5 = significantly increased).
barrier_score–overall measure of barriers limiting the potential of AI/IoT (0–100, higher = greater barriers).
3.2.5. Variables–Areas of AI/IoT Use (Binary)
Respondents could indicate multiple areas in which the company uses AI/IoT. Binary variables (0/1) were created from the answers:
use_manufact–use in manufacturing.
use_supply_chain–use in logistics/supply chain.
use_marketing_sales–use in marketing and sales.
use_finance_risk–use in finance and risk management.
use_hr–use in human resources.
use_it_cyber–use in IT and cybersecurity.
use_consult_genai–use of consulting/GenAI tools (internal assistants, etc.).
use_data_analytics–use in data analytics/BI/reporting processes.
use_other–other areas of use.
3.2.6. Descriptive Statistics of Model Variables
Table 1 reports full descriptive statistics for all numeric and ordinal variables used in the predictive modeling framework.
The sample consists of 1250 enterprises. In structural terms, the dataset is heterogeneous: firm size shows a mean of 166.69 employees but a median of 59, indicating a right-skewed distribution with the presence of larger firms, while firm age averages 17.84 years (median = 16). Relative performance indicators are centered slightly above the neutral benchmark, with mean values of 55.51 for revenue growth, 55.43 for profitability, and 55.06 for productivity relative to the most important competitor.
The AI/IoT-related variables indicate a moderate but nontrivial level of practical experience in the sample. The average length of AI/IoT use is 4.41 years (median = 4), and firms reported on average 5.42 AI/IoT initiatives over the last 5 years (median = 4). The mean reported AI/IoT success rate is 53.26 (median = 61.00), while the mean share of competitive advantage attributed to AI/IoT is 52.55 (median = 50.00). Readiness- and capacity-related variables also show substantial dispersion, including infrastructure readiness (mean = 55.07), outsourcing share (mean = 39.14), IT reskilling needs (mean = 40.35), and AI/IoT FTE capacity (mean = 7.85). Technological openness and AI/IoT investment trend, both measured on ordinal 1–5 scales, reached mean values of 3.18 and 3.35, respectively. The mean barrier score is 41.16, suggesting that implementation constraints are present in a meaningful part of the sample.
Given the bounded nature of the dependent variable, the distribution of ai_iot_success_rate is particularly important for model interpretation. The variable spans the full 0–100 interval, with 2.48% of firms reporting a value of 0 and 7.12% reporting a value of 100. More broadly, 24.40% of observations fall at or below 10, while 26.48% fall at or above 90. These descriptive results confirm that the outcome variable contains a non-negligible concentration of observations near the lower and upper bounds, which is consistent with the bounded-outcome issue discussed later in the methodological limitations and model diagnostics. Frequencies for binary variables, including sector, market internationalization, country, and AI/IoT use domains, are reported in
Appendix A.1 Table A1.
3.3. Modeling Workflow and Evaluation Protocol
Modeling was performed consistently across methods. Data were split into training and testing sets in a ratio of 75%/25% with random_state = 42 to ensure a reproducible split. Hyperparameters were tuned using 5-fold cross-validation (KFold, shuffle = True). The optimization metric within the tuning was the coefficient of determination R2. The metrics TEST R2, TEST MAE, and TEST RMSE (optionally also MSE) were reported on the test set so that the performance could be interpreted in units of the dependent variable (percentage points on a scale of 0–100).
For models sensitive to the scale of variables (Elastic Net, SVR), scaling was performed using StandardScaler embedded in the Pipeline. This ensured that scaling was always performed only on the training part within individual validation folds, thus eliminating the risk of data leakage. In tree methods (Decision Tree, Random Forest, Gradient Boosting, XGBoost), scaling is not methodologically necessary, since decision-making is based on thresholds on individual variables.
Considering the predictive goal of this study, the methodology was designed to compare linear and nonlinear predictive approaches, provide an interpretable baseline (Elastic Net), assess potential nonlinearities (SVR, tree methods), and enable detailed inspection of the best-performing model in terms of out-of-sample generalization. As a bounded-outcome sensitivity check, an additional fractional logit model was estimated on the rescaled dependent variable (ai_iot_success_rate/100). This supplementary model was included because the dependent variable is bounded on the 0–100 interval and exhibits a noticeable concentration of observations near the lower and upper boundaries. The sensitivity analysis was evaluated using the same repeated 75/25 train/test split design and the same performance metrics (R2, MAE, RMSE), with predictions converted back to the original 0–100 scale for comparability with the main models.
3.3.1. Linear Baseline: Elastic Net Regression
Regularization regressions and primarily Elastic Net were used as an interpretable baseline. The motivation is the higher number of predictors (including dummy variables) and the presence of correlated blocks of variables, where classic OLS regression can estimate unstable coefficients.
Elastic Net combines L1 penalty (supports sparsity and variable selection) and L2 penalty (stabilizes coefficients in the event of multicollinearity). The key hyperparameters are l1_ratio (relative weight of L1 vs. L2) and alpha (strength of penalty).
Before estimation, the nature of multicollinearity was tentatively assessed using VIF. The highest VIFs appeared for technological and performance variables, which is expected from the content. VIF was not used for mechanical elimination of variables, but as support for the choice of a regularized approach. The entire table with VIF is presented in
Appendix A.2.
Hyperparameters were tuned in the first phase using ElasticNetCV, which identified the performance-optimal setting (minimizing validation MSE): l1_ratio = 0.9 and alpha ≈ 0.648. Such a setting is close to Lasso and can lead to sharper selection for correlated predictors. Also, the stability of the estimated coefficients may be lower due to the size of the entire dataset, and, therefore, also the validation and testing subsets. In the context of the goals of the article (predictor effects + interpretation), a more conservative approach was therefore chosen. In the second phase, l1_ratio = 0.5 was fixed (a compromise between sparsity and stability, strengthened ridge component), and, subsequently, several alpha values were tested in a wider interval (alpha approximately from 0.65 to 10). The selection was made based on a trade-off between performance and stability: a higher penalty reduces the risk of results being sensitive to correlated blocks and, at the same time, reduces the risk of overfitting but may also slightly reduce R2 (move closer to underfitting). The final baseline settings for interpretation were alpha = 1.5 and l1_ratio = 0.5. Higher settings of the alpha hyperparameter caused the residual histograms to significantly differ from the normal distribution, R2 to drop sharply, and rapid underfitting occurred.
3.3.2. Nonlinear Models and Hyperparameter Tuning
To capture possible nonlinearities and interactions, nonlinear approaches were tested: SVR, regression decision tree, and ensemble tree methods (Random Forest, Gradient Boosting, XGBoost). For consistency, the same data partitioning and cross-validation protocol and explicit range of hyperparameters tested (grid) are given for each model.
Support Vector Regression (SVR) was estimated in Pipeline with scaling. Given the questionnaire nature of the data, a nonlinear relationship between predictors and success is assumed (e.g., threshold phenomena, saturation of effects, and interactions). SVR with RBF or sigmoid kernel is a good candidate for capturing smooth nonlinearities.
Tested hyperparameter grid:
kernel: [“rbf”, “sigmoid”]
C: [0.5, 1, 2, 5, 10, 25, 50, 75, 100]
epsilon: [0.1, 0.25, 0.5, 0.75, 1.0, 1.25, 1.5, 2.0, 3.0]
gamma: [“scale”, 0.01, 0.05, 0.1, 0.2]
The decision tree was estimated using DecisionTreeRegressor. The tree provides interpretation in the form of rules and thresholds but has a natural tendency to overfitting. Therefore, regularization was implemented via depth parameters, minimum node sizes, and post-pruning.
Tested grid (full range):
max_depth: [2, 3, 4, 5, 6, 8, 10, None]
min_samples_split: [2, 5, 10, 20, 50]
min_samples_leaf: [1, 2, 5, 10, 20]
max_features: [None, “sqrt”, “log2”]
ccp_alpha: [0.0, 0.0005, 0.001, 0.002, 0.005, 0.01]
Random Forest combines predictions from a large number of trees by averaging. Due to bootstrap sampling and random selection of predictors at nodes, it reduces variance compared to a single-tree model and typically improves generalization.
Tested hyperparameter grid:
n_estimators: [400, 800, 1200]
max_depth: [None, 8, 12, 16]
min_samples_split: [2, 5, 10]
min_samples_leaf: [1, 2, 5, 10]
max_features: [“sqrt”, “log2”, 0.5]
max_samples: [None, 0.8]
Gradient Boosting is a sequential ensemble approach where each subsequent tree corrects the errors of the previous model. The key trade-off is between learning_rate and n_estimators, with a lower learning_rate often increasing stability but requiring more trees.
Tested hyperparameter grid:
n_estimators: [300, 600, 1000]
learning_rate: [0.03, 0.05, 0.1]
max_depth: [2, 3, 4]
min_samples_leaf: [1, 2, 5, 10]
subsample: [0.8, 1.0]
XGBoost is a modern boosting approach with explicit regularization and subsampling of both observations and predictors. These mechanisms can reduce overfitting and increase robustness, especially for heterogeneous data.
Tested hyperparameter grid:
n_estimators: [400, 800, 1200]
learning_rate: [0.03, 0.05, 0.1]
max_depth: [3, 4, 5]
subsample: [0.8, 1.0]
colsample_bytree: [0.8, 1.0]
min_child_weight: [1, 5]
reg_lambda: [1.0, 5.0]
3.3.3. Interpretation, Diagnostics, and Robustness Checks
Interpretable tools and diagnostic procedures were used for the best-performing model. The goal was not only to determine the performance, but also to understand the mechanisms that the model captures and identify situations in which it may fail.
Permutation importance on the test set: decrease in performance (ΔR2) after random variable permutation.
PDP + ICE: average marginal effect vs. heterogeneity of effects (nonlinearities, thresholds, saturation).
2D PDP: visualization of interactions of the dominant predictor with other significant variables.
Group ICE curves: test for heterogeneity of effect between groups (e.g., low vs. high barrier_score).
Error diagnostics: residuals, residual histogram, ECDF of absolute error, identification of TOP extreme errors.
Performance robustness: repeated refits (30 different random splits) and report of mean/variability metrics.
In the error analysis, it was additionally considered whether extreme errors are related to multivariate outliers in the predictor space. One option was to use a z-score distance, which allows us to distinguish cases where the problem is caused by an atypical combination of inputs vs. cases where relevant information in the predictors may be missing.
4. Research Results
The results are presented in a logical sequence: 4.1. Comparison of prediction performance across models and selection of the best-performing model according to TEST R2. 4.2. Interpretable baseline Elastic Net for identification of significant predictors. 4.3. Decision Tree as a complementary tool for segmentation and threshold effects. 4.4. Detailed interpretation of the best-performing Random Forest model, including diagnostics, importance, and PDP/ICE.
4.1. Predictive Performance Across Models
A summary of the performance of all tested models is presented in
Table 2. The comparison was performed consistently (same split, same CV scheme, same metrics).
The selection of the best-performing model was based on TEST R2. Random Forest achieved the highest performance (0.7639), with XGBoost being very close (0.7566) and having the lowest MAE. From a practical perspective, this suggests that both models are competitive. RF was chosen as the main model for interpretation because the optimization criterion was R2. Source: own data evaluation.
4.1.1. Statistical Model Comparison
To strengthen the inferential support for the model ranking, an additional repeated holdout comparison was performed using 30 repeated 75/25 train/test splits with identical random seeds across all model classes. For each split, the previously selected fixed hyperparameter settings were retained, and model performance was evaluated using R2, MAE, and RMSE. This design makes it possible to compare models not only descriptively, but also through paired split-level differences and confidence intervals.
Across repeated splits, Random Forest (see
Table 3) achieved the highest mean R
2 (0.8119) and the lowest mean RMSE (16.4214), indicating the strongest overall predictive performance under the study’s primary selection criterion. XGBoost (R
2 = 0.8038; RMSE = 16.7690) and Gradient Boosting (R
2 = 0.7995; RMSE = 16.9509) followed closely, while SVR remained clearly behind the leading tree-based ensembles in terms of explained variance and RMSE. At the same time, MAE results show a more nuanced pattern: XGBoost and Gradient Boosting achieved lower mean MAE values than Random Forest, which suggests that Random Forest is not uniformly best across all error metrics, but it is the strongest model when judged primarily by out-of-sample R
2 and secondarily by RMSE.
The paired comparisons provide formal support for the ranking of Random Forest as the best-performing model under the primary criterion used in this study. Relative to all competing models, Random Forest achieved significantly higher R
2 and significantly lower RMSE, with all corresponding 95% confidence intervals excluding zero. The largest margins were observed against Elastic Net and Decision Tree, while the differences relative to XGBoost and Gradient Boosting were smaller but still statistically significant (see
Table 4). By contrast, MAE comparisons indicate that Random Forest significantly outperformed Elastic Net and Decision Tree, did not differ significantly from SVR (
p = 0.538), and was significantly worse than Gradient Boosting and XGBoost on this metric. Taken together, these results support the conclusion that Random Forest provides the strongest overall out-of-sample performance in this study when model selection is based primarily on TEST R
2 and supported by RMSE while also showing that alternative ensemble models remain competitive under MAE.
4.1.2. Bounded-Outcome Sensitivity Analysis
To examine whether the bounded nature of the dependent variable materially alters the model comparison, a supplementary fractional logit model was estimated as a sensitivity check. The results are reported in
Appendix A.3 Table A3 and
Appendix A.4 Table A4. Across 30 repeated train/test splits, the fractional logit model outperformed Elastic Net on all three metrics (R
2, MAE, RMSE), indicating that a bounded-response specification improves the performance of the linear baseline when the dependent variable is treated as a fraction rather than as an unrestricted continuous variable. However, Random Forest still achieved the strongest predictive performance overall, with a higher mean R
2 (0.8119 vs. 0.7779) and lower mean error than fractional logit across both MAE and RMSE. Paired comparisons confirmed that these differences were statistically significant, with all 95% confidence intervals excluding zero. Importantly, the supplementary bounded-response model produced predictions that remained strictly within the feasible outcome range, with predicted values across repeated splits lying approximately between 1.66% and 98.70%. Taken together, these results indicate that the bounded-outcome issue is statistically relevant and that a dedicated bounded-response specification improves upon the unrestricted linear baseline, but the Random Forest retains the strongest overall out-of-sample performance.
4.2. Elastic Net Baseline: Predictor Patterns and Performance
Elastic Net provides an interpretable baseline and enables the identification of predictor patterns related to the reported AI/IoT success rate on a uniform scale. A list of all estimated coefficients (standardized and back-converted to original units) is presented in the
Appendix A.5 Table A5.
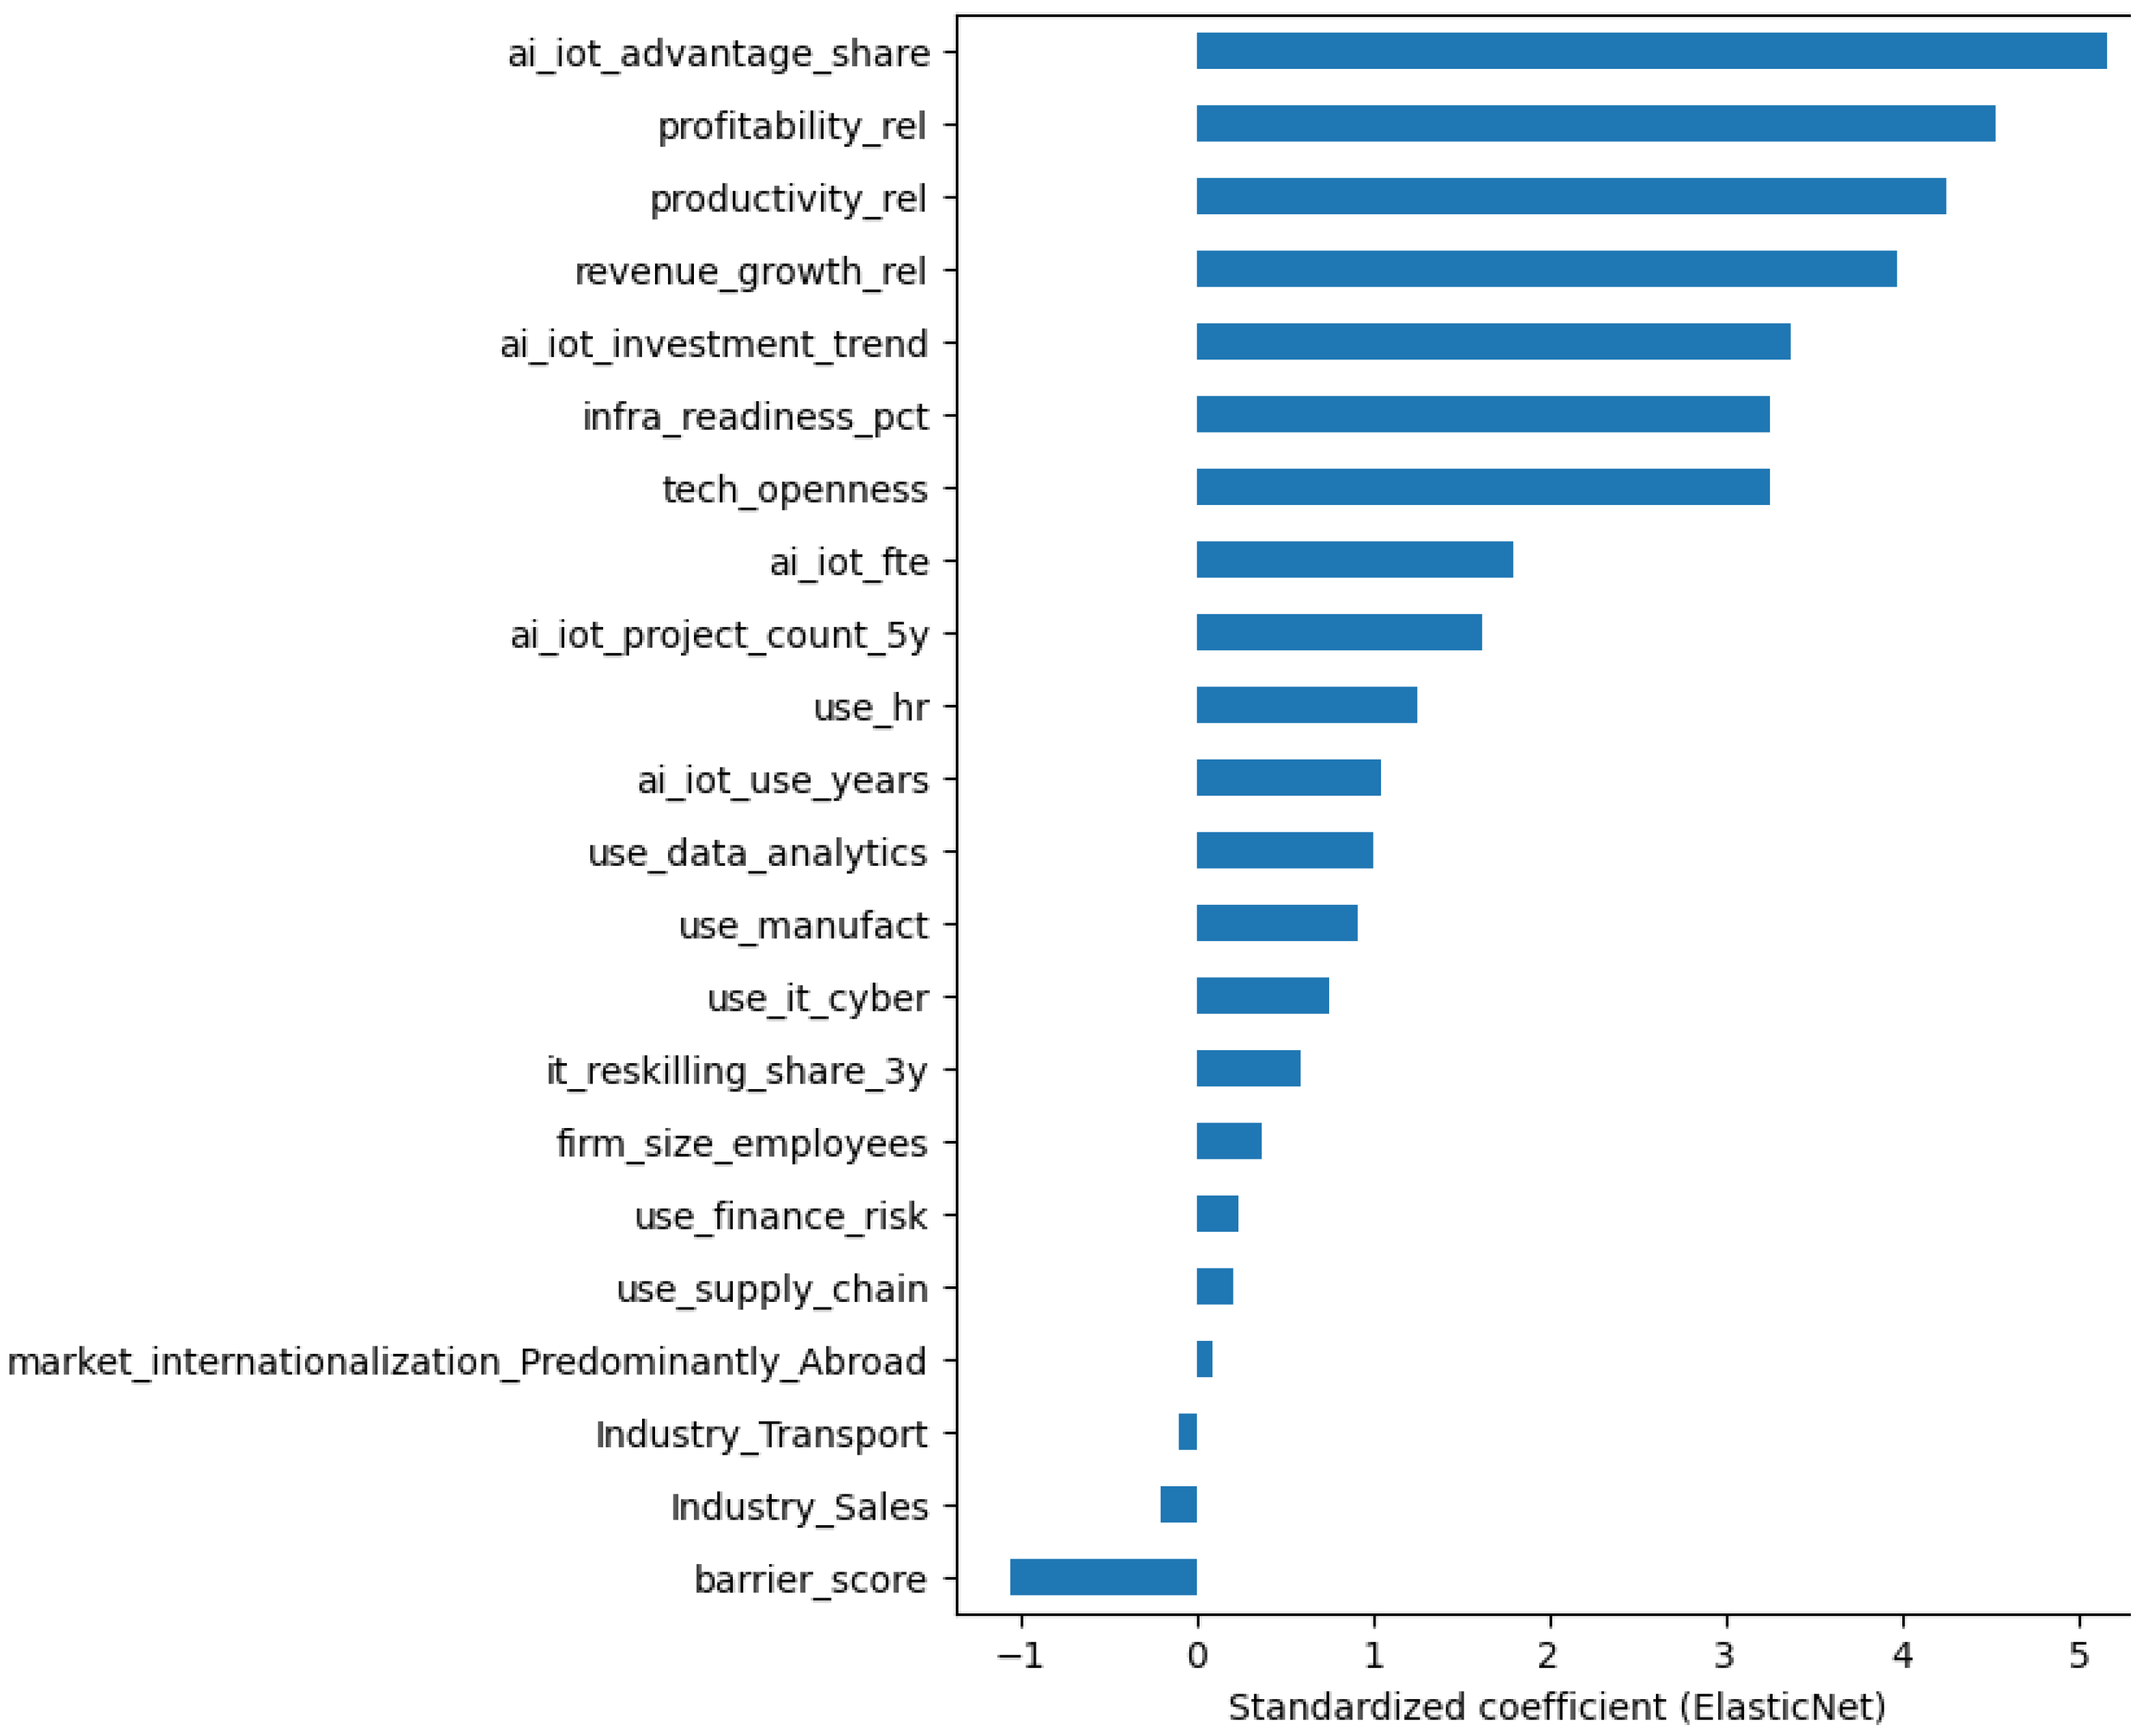
The strongest positive predictor is ai_iot_advantage_share. Relative performance variables (profitability_rel, productivity_rel, revenue_growth_rel) and the technological-organizational block (ai_iot_investment_trend, infra_readiness_pct, tech_openness) also have significant positive effects. The only negative predictor is barrier_score, which is content-consistent with the expectation that barriers dampen the ability of companies to realize the potential of AI/IoT.
Since technological-organizational variables and performance indicators can form correlated blocks, the Elastic Net coefficients must be interpreted cautiously as regularized estimates while simultaneously controlling for other predictors. From a practical point of view, we therefore place particular emphasis on the direction of the effect (sign), the relative strength of the predictors, and the consistency of the findings compared to nonlinear models. A visualization of the relative strength of the predictors is shown in
Figure 1.
Baseline model performance on the test set: TEST R
2 = 0.6893; TEST MAE = 16.8204 p. b.; TEST RMSE = 21.1667 p. b. More detailed diagnostic is in
Figure 2.
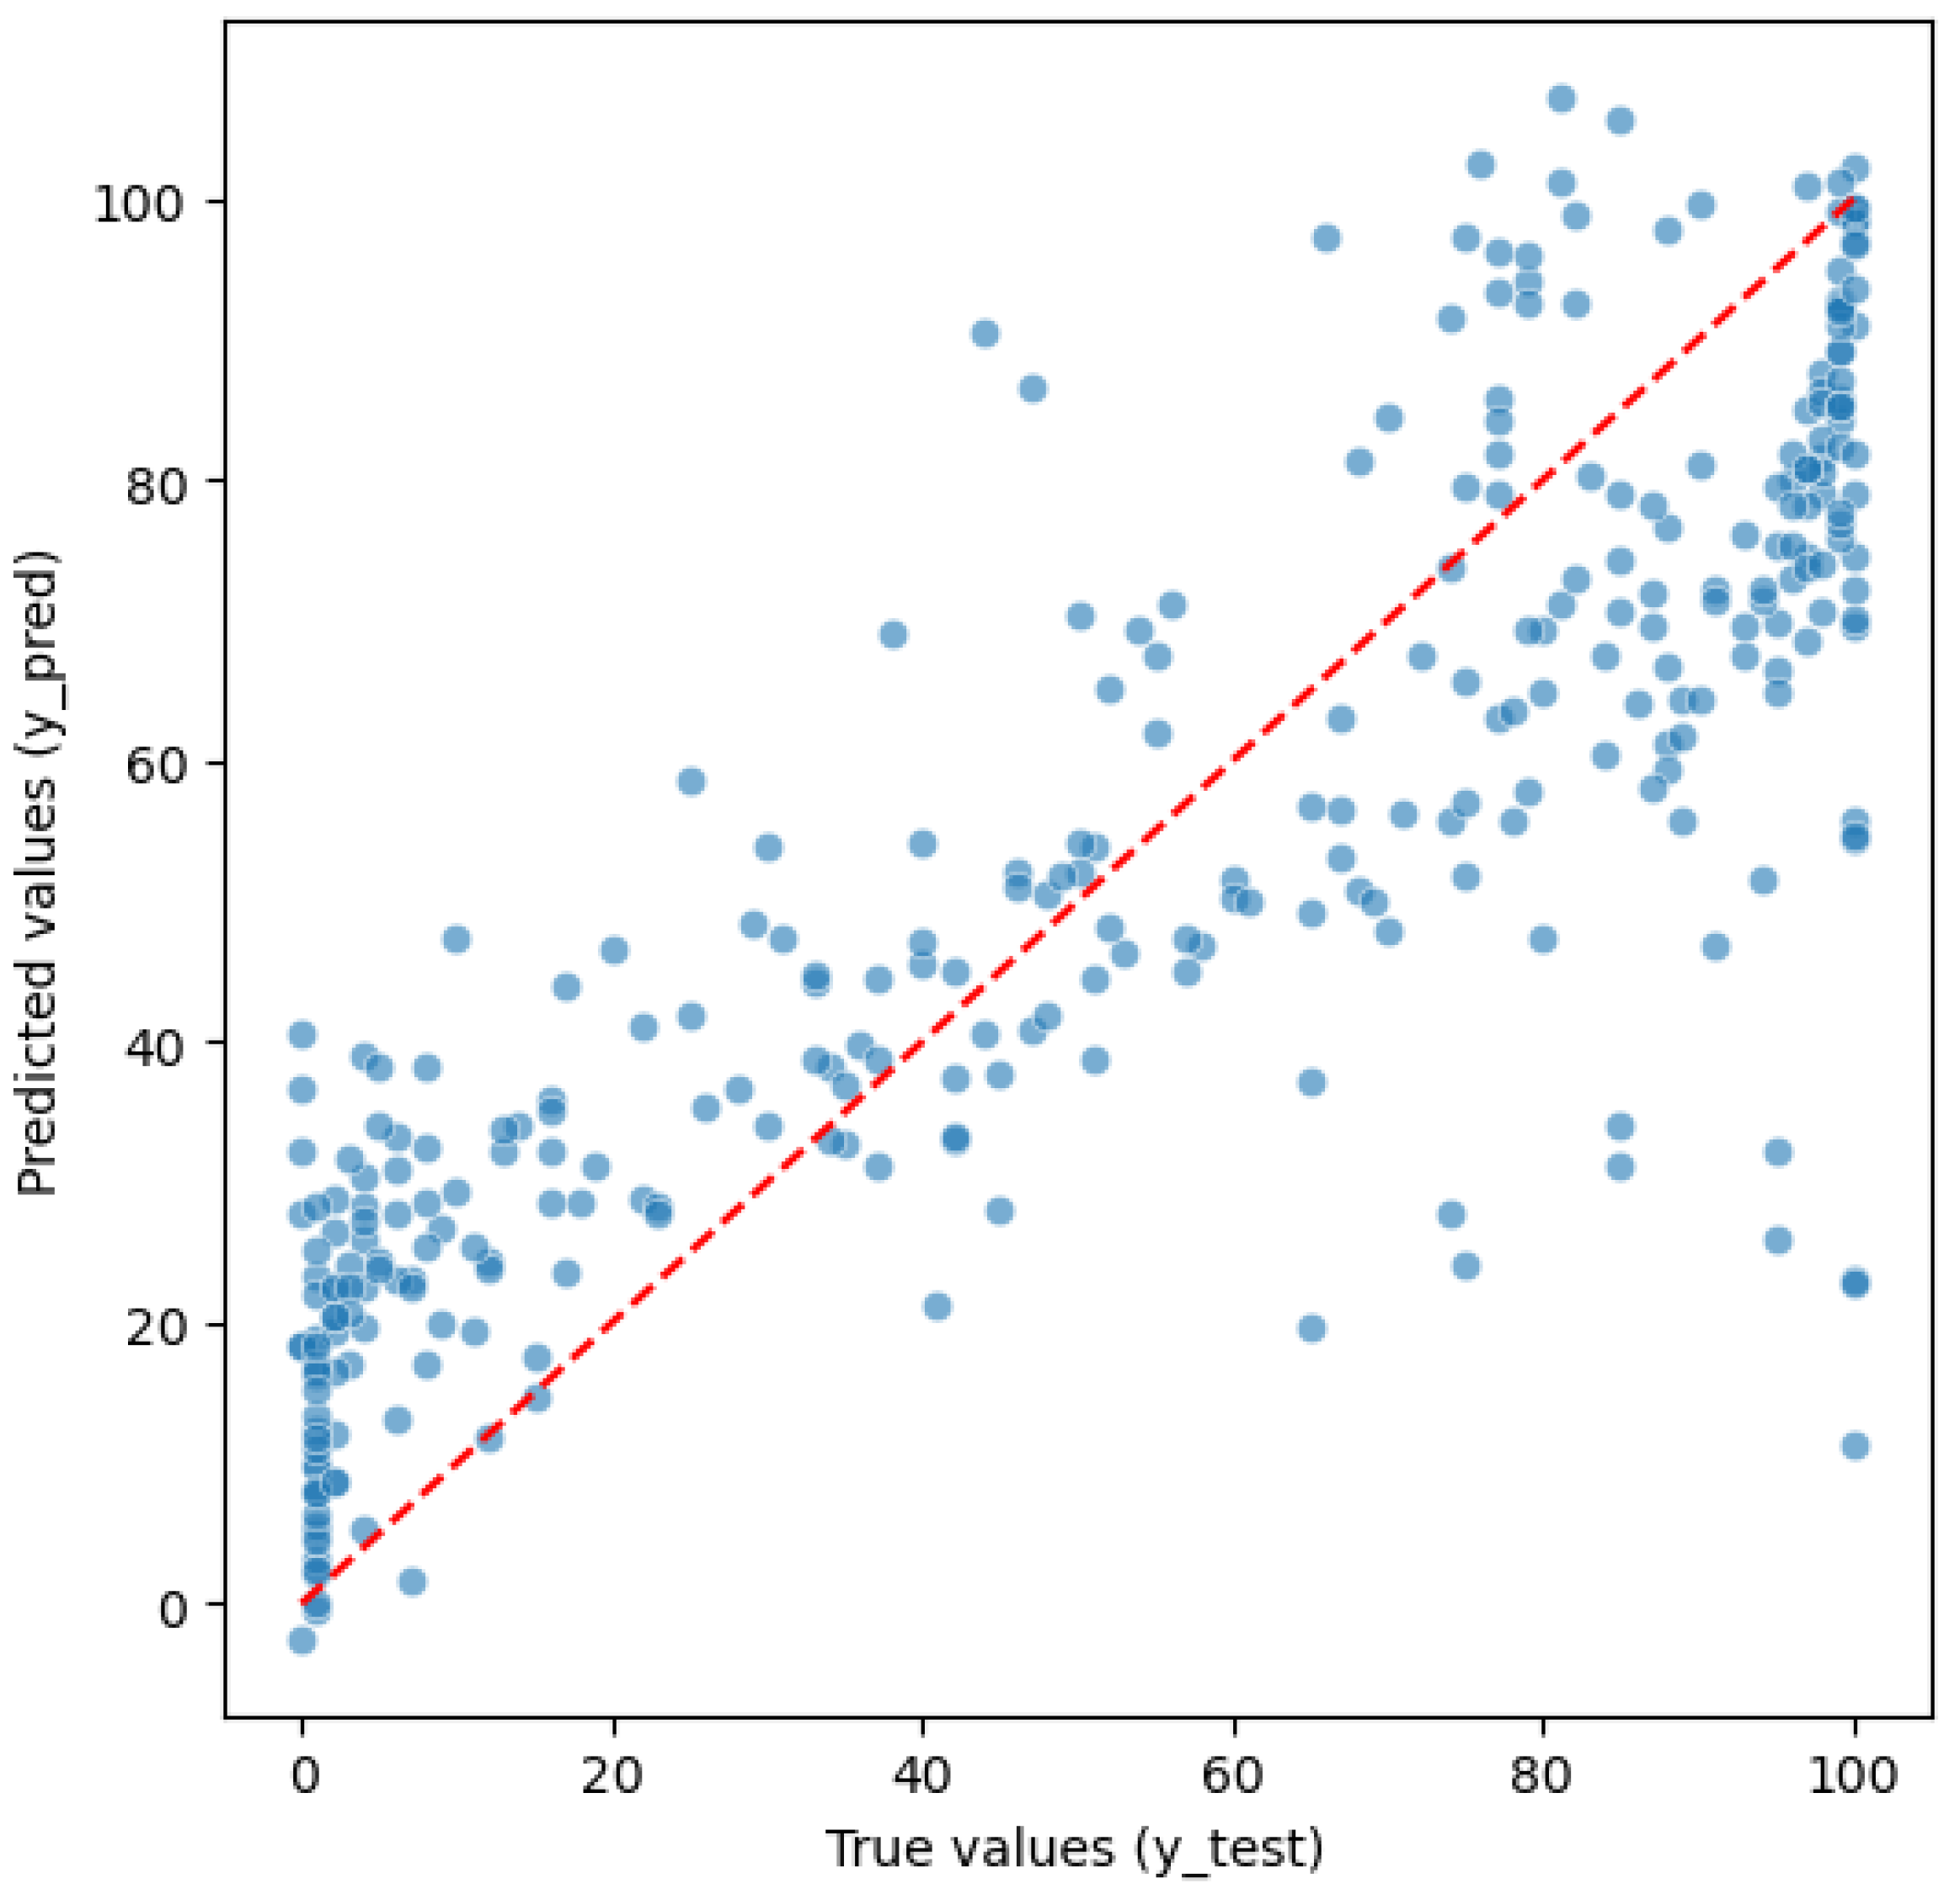
The actual vs. predicted plot confirms that Elastic Net captures the central range of the outcome reasonably well but also illustrates a typical “regression-to-the-mean” pattern. Predictions are compressed toward mid values, with a tendency to overestimate very low true-success rates and underestimate very high true-success rates (ceiling bias), which is particularly visible near boundaries of the 0–100 scale. This systematic structure suggests that some relationships are nonlinear and/or interaction-driven, motivating a closer look at residual behavior and, subsequently, the use of nonlinear models. A closer diagnostic of residuals is in
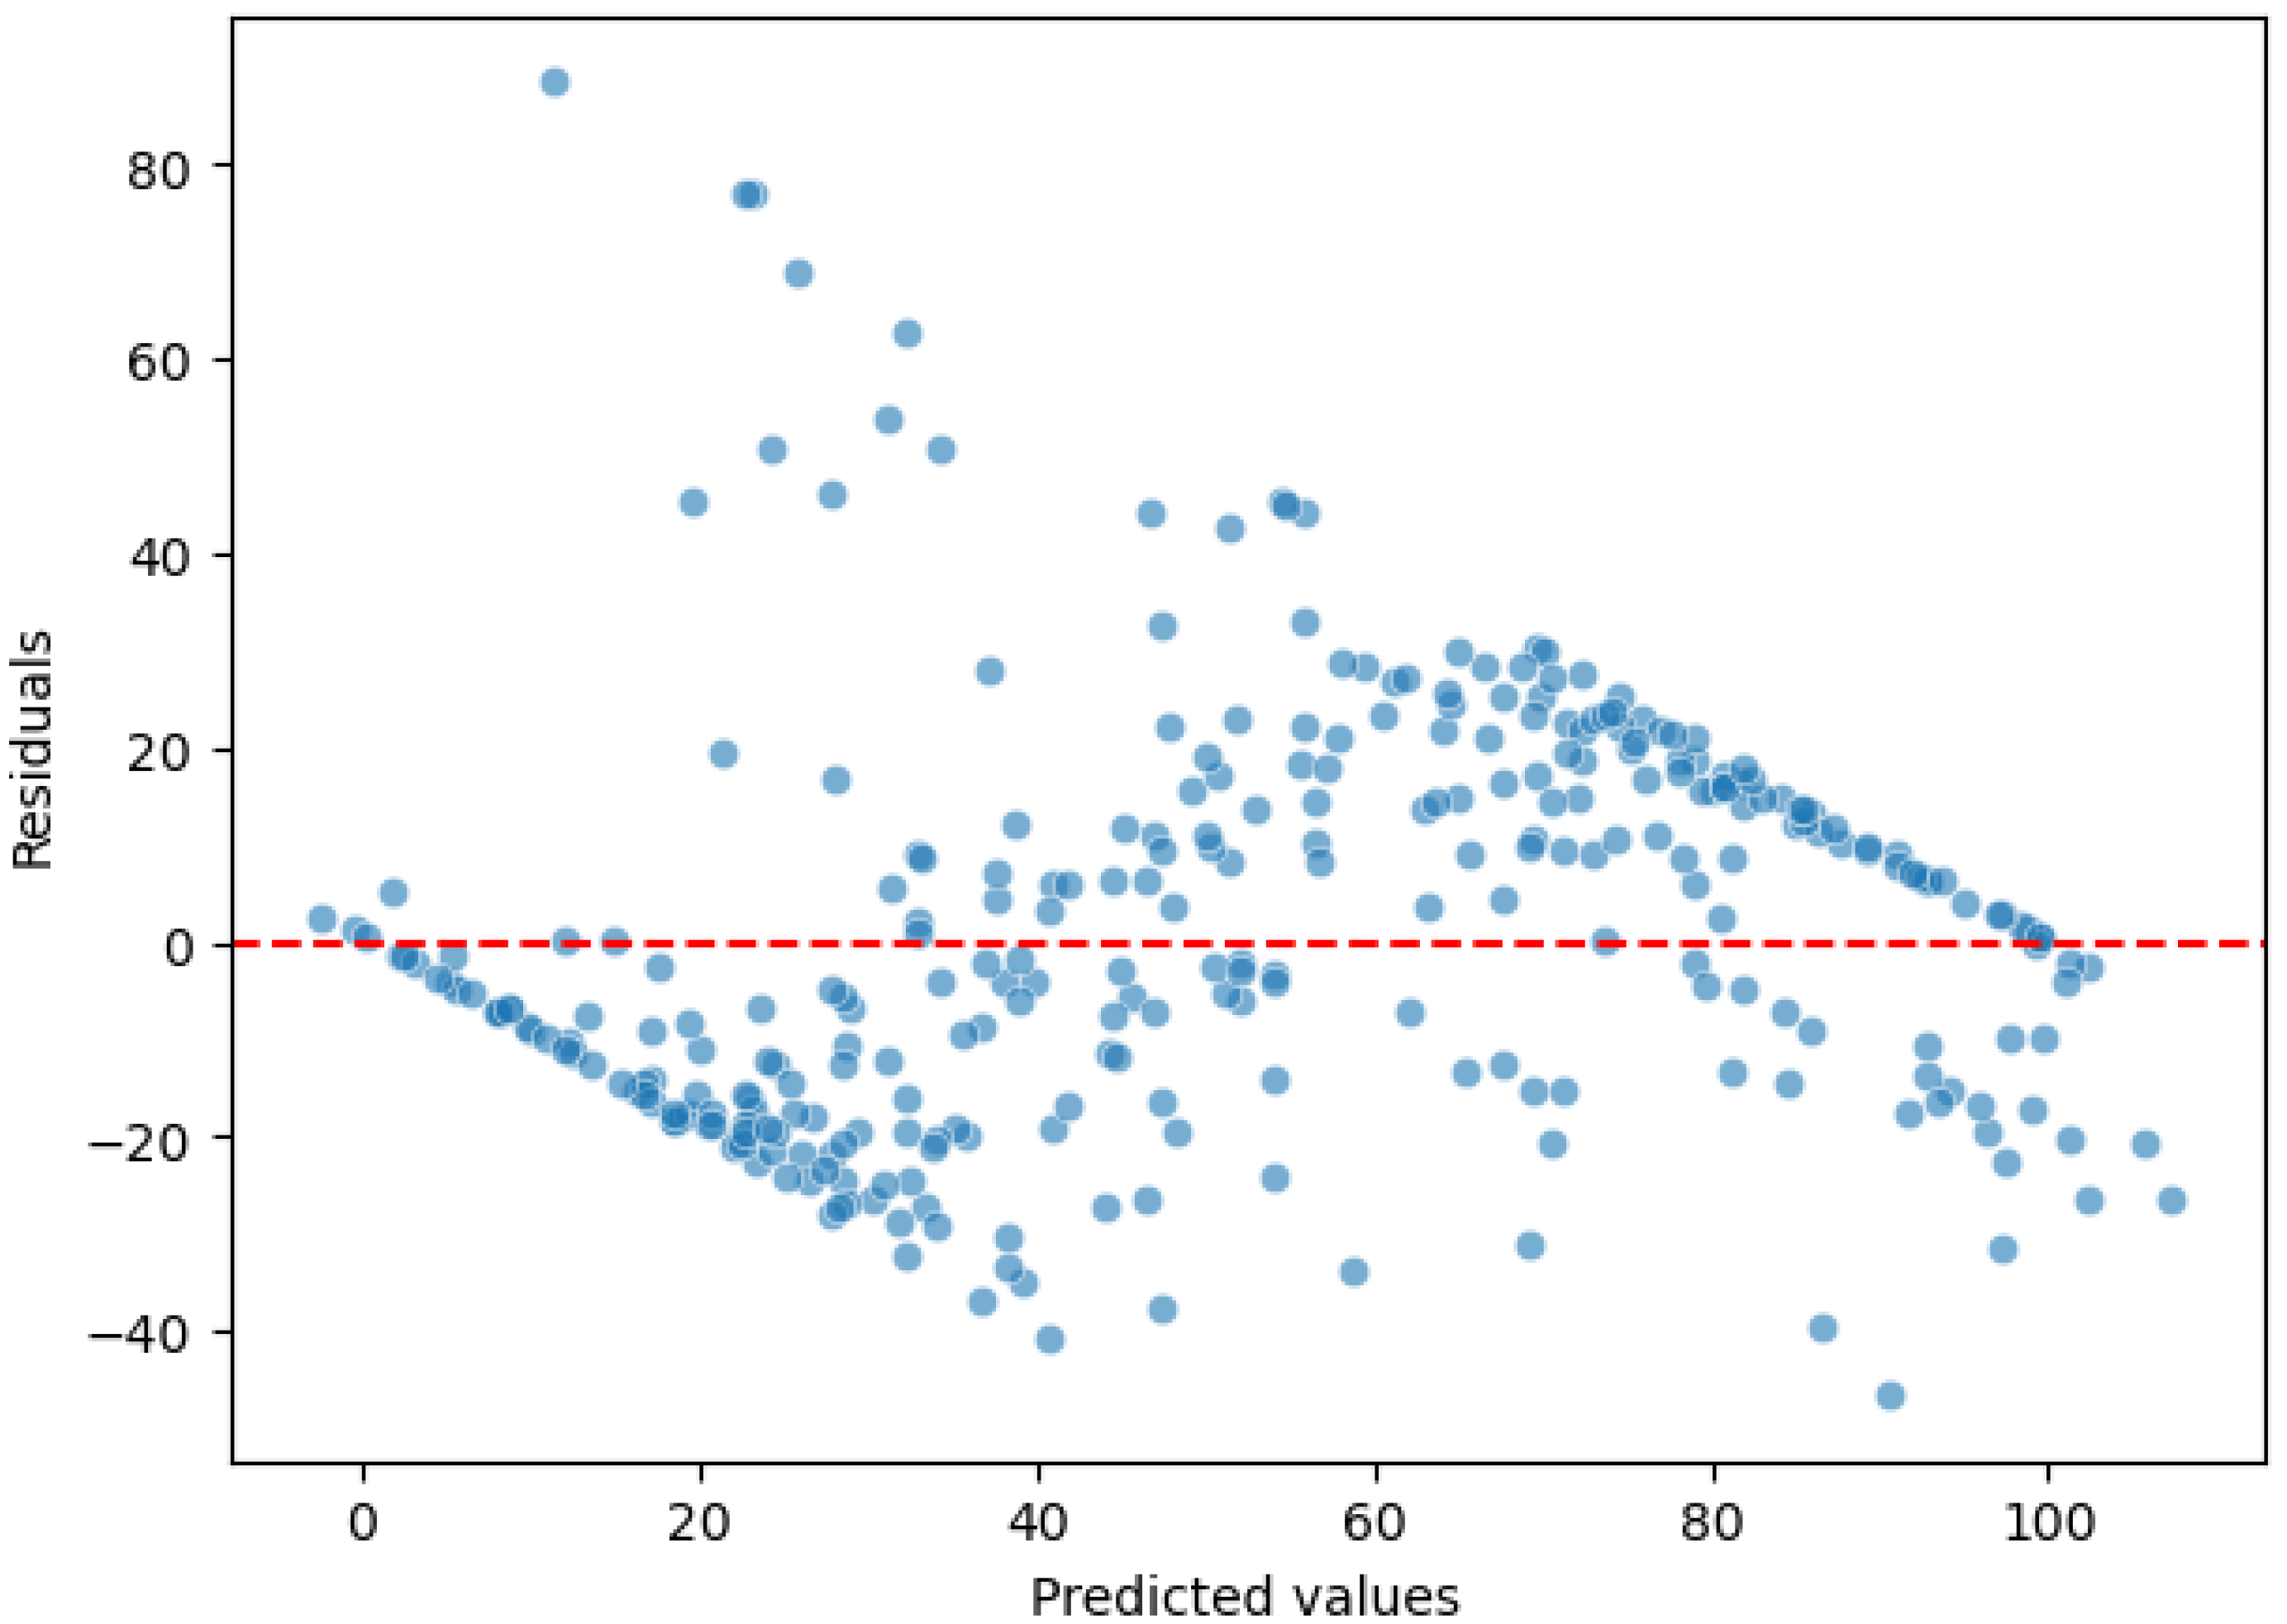
Figure 3.
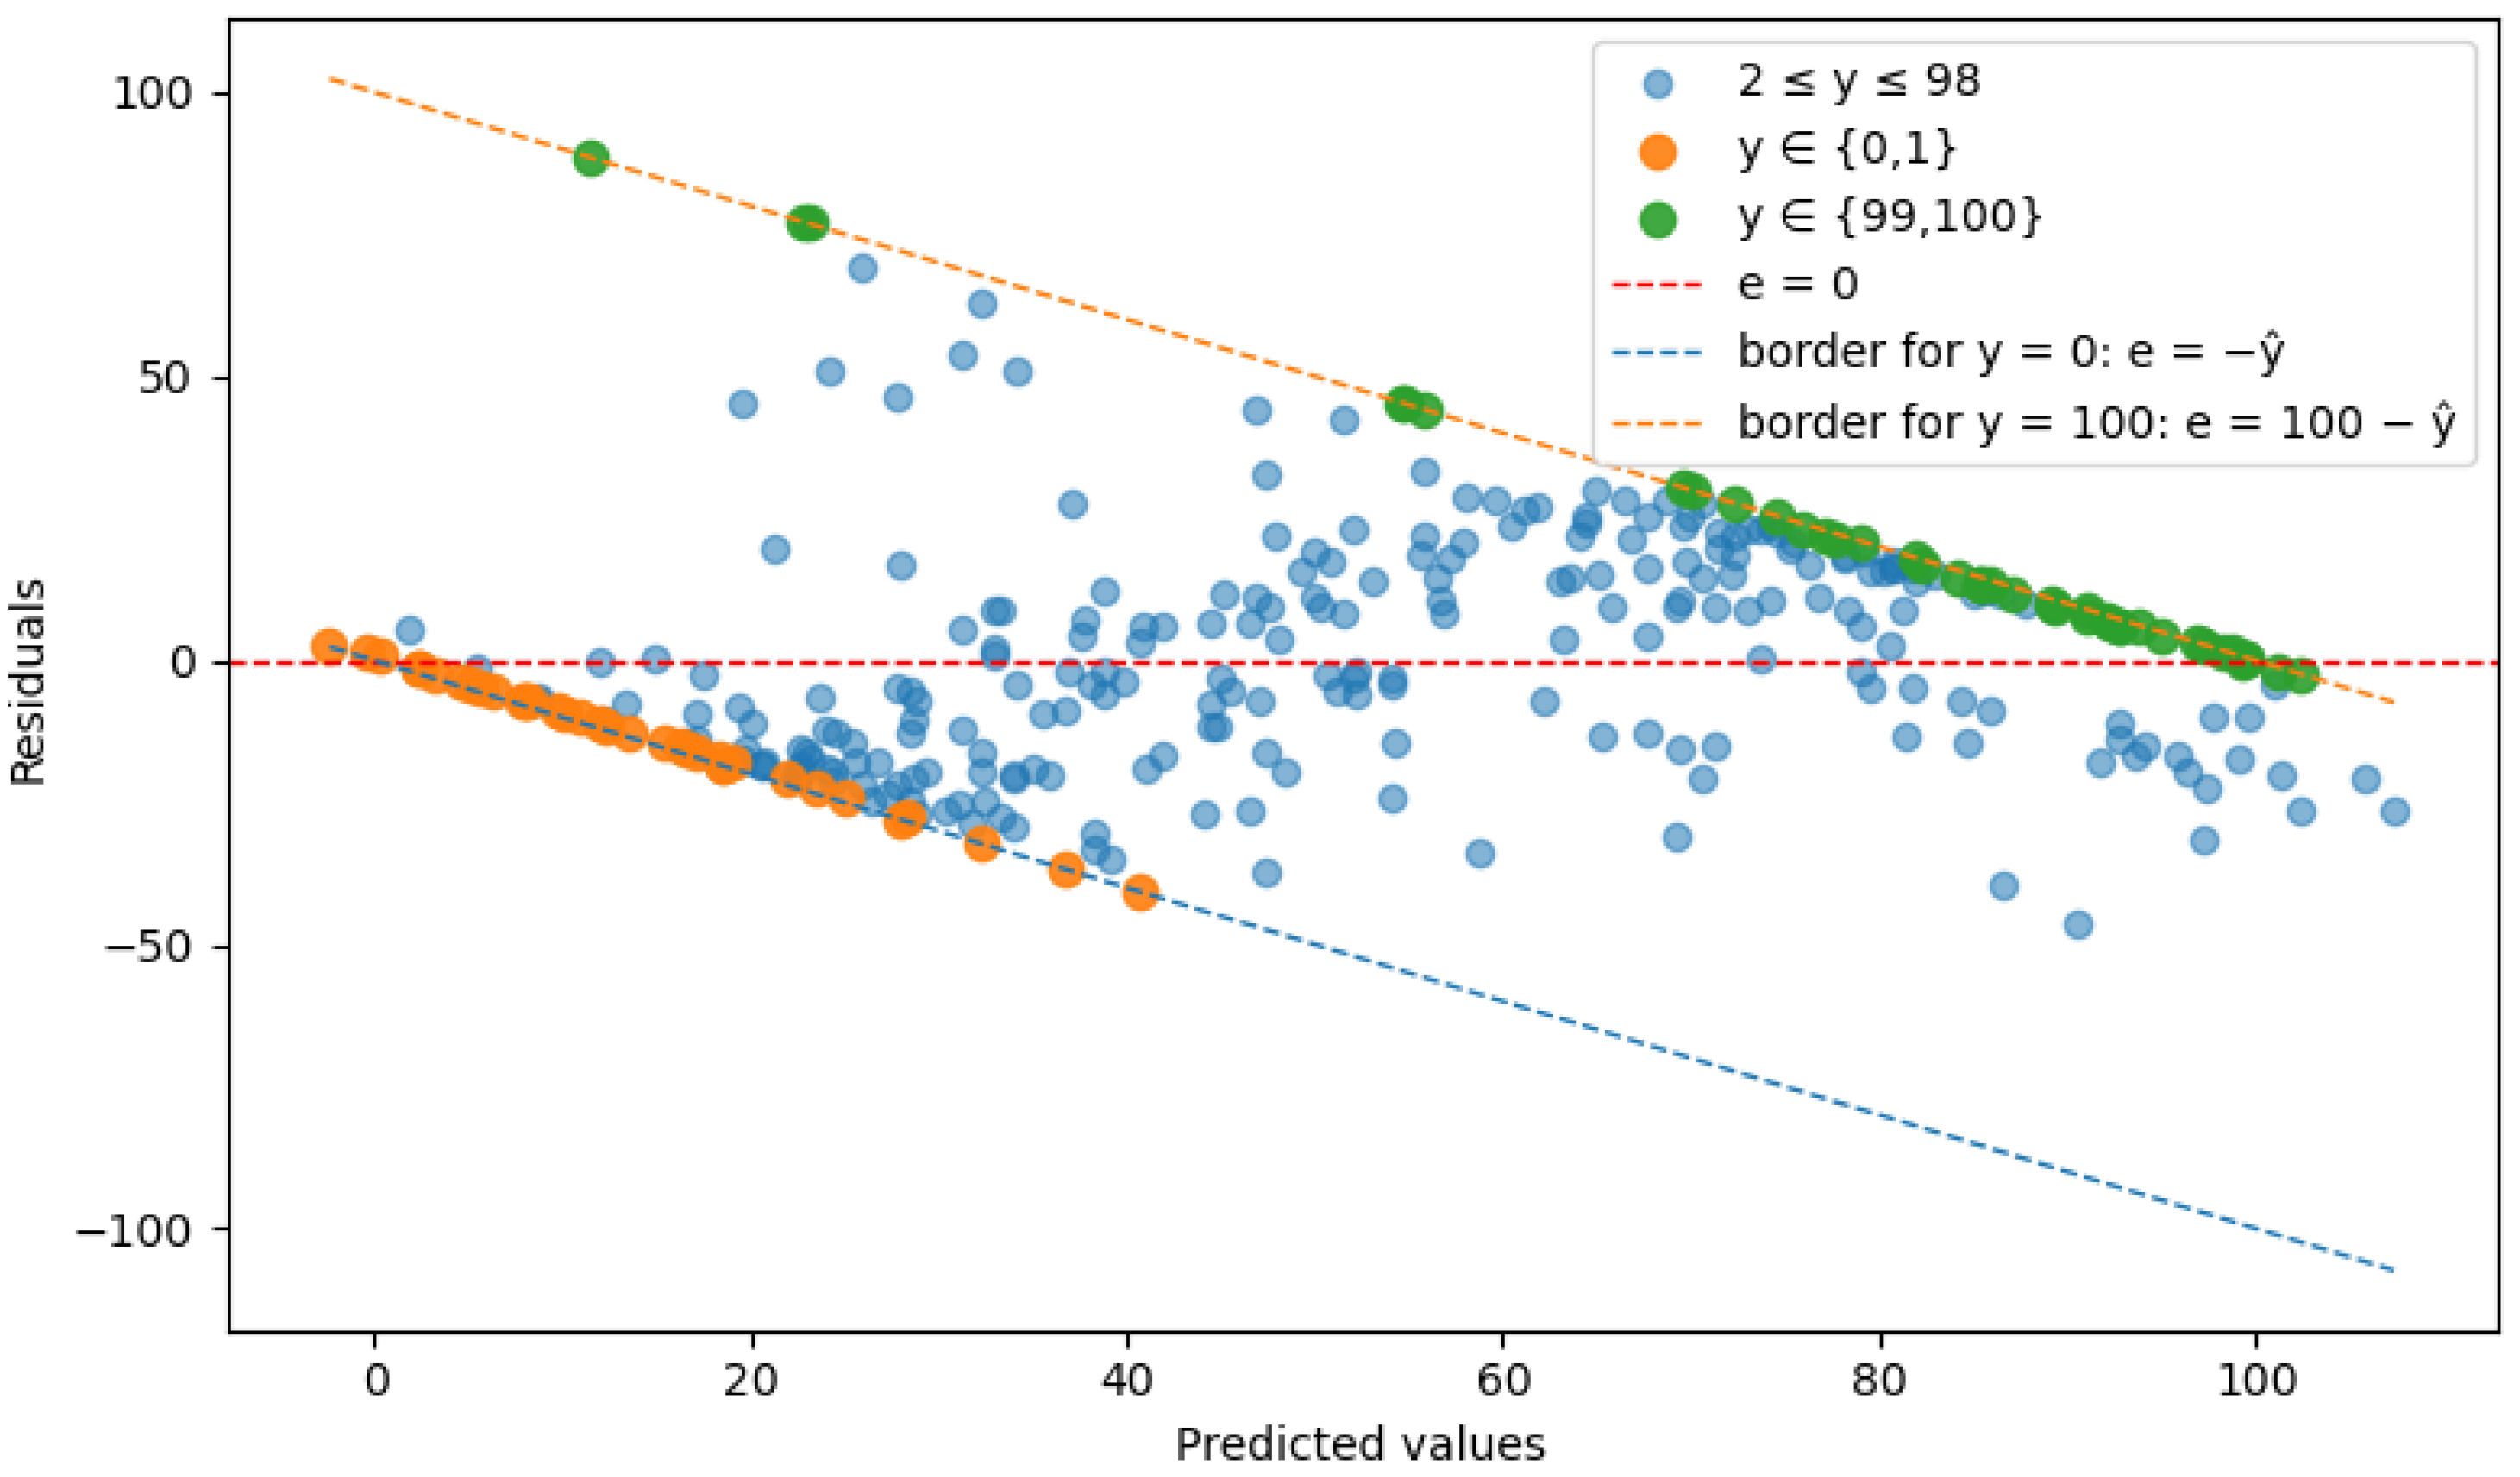
The residuals vs. fitted plot indicates that errors are not purely random across the prediction range: residual variance changes with fitted values, and the point cloud exhibits visible structure rather than a homogeneous band around zero. This is consistent with mild heteroskedasticity and remaining systematic bias in specific regions of the outcome (notably at the extremes). To better understand whether these patterns are partly driven by the bounded nature of the dependent variable, the next figure explicitly highlights observations at the lower and upper boundaries.
Figure 4 extends the residual diagnostics by explicitly distinguishing boundary observations of the dependent variable (y ∈ {0, 1} and y ∈ {99, 100}) from the interior band (2 ≤ y ≤ 98) and by overlaying the theoretical limits of feasible residuals implied by the bounded 0–100 scale. The boundary observations systematically concentrate along these limits, which provides clear evidence of pronounced floor/ceiling effects typical for questionnaire-based bounded outcomes. Importantly, once the extreme values are set aside, the residuals in the 2–98 band appear more symmetrically scattered around zero with a markedly more stable spread, indicating that the model captures the dominant linear structure reasonably well in the central range and that homoskedasticity is substantially better approximated there. Therefore, the observed deviations from classical homoskedasticity are not primarily a signal of severe model misspecification but are, to a large extent, mechanically driven by the bounded measurement scale and the elevated incidence of extreme outcomes. To complement the conditional view of errors in
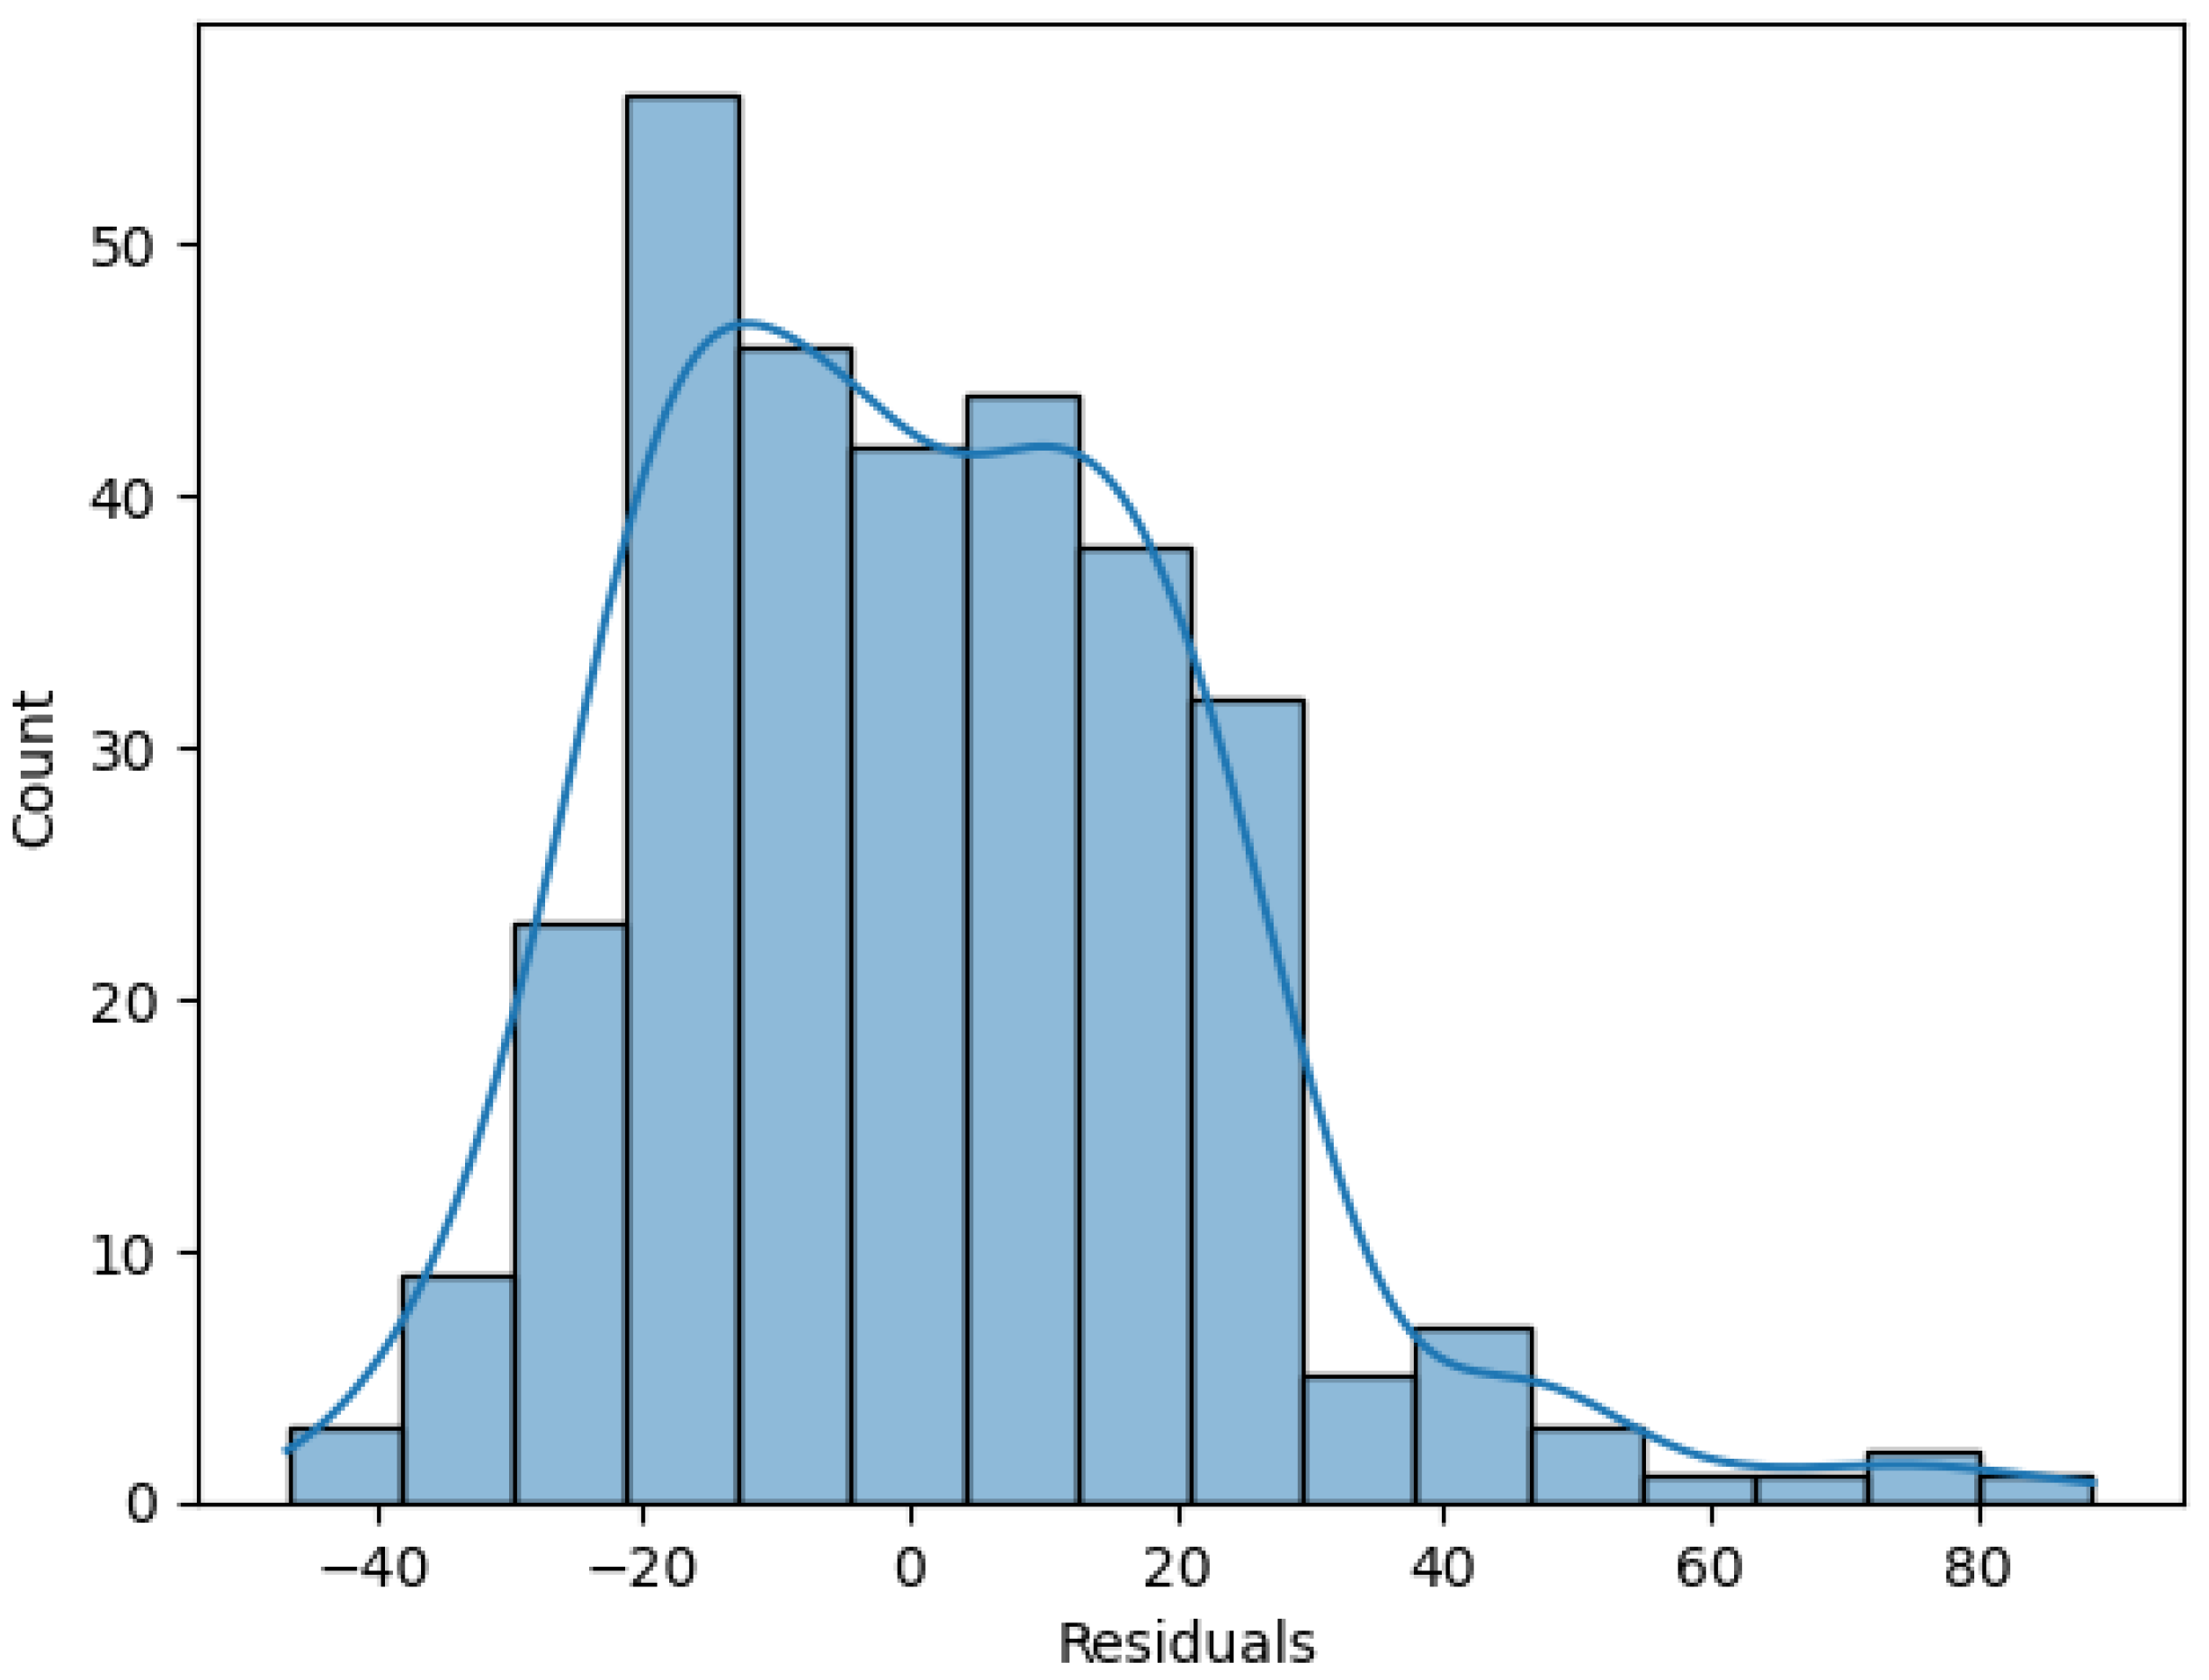
Figure 3, the next figure summarizes the overall distribution of residuals using a histogram with a kernel density estimate, providing additional insight into typical error magnitude and tail behavior.
The residual histogram with kernel density estimate (
Figure 5) provides a compact summary of the error distribution. Residuals are strongly concentrated around zero, with the dominant mass lying approximately within the interval −20 to +20 percentage points, which indicates that the typical prediction error is relatively controlled for the majority of enterprises. At the same time, the distribution is clearly asymmetric, exhibiting a visible right-hand tail. This tail is consistent with the extreme observations identified in the residual plots: a small subset of cases produces unusually large positive residuals, corresponding to situations where the model substantially underestimates very high realized success rates. Importantly, the number of such cases is relatively low, yet their magnitude implies a non-negligible “tail risk” of severe underprediction. Taken together with the residual-structure diagnostics (including the improved behavior in the interior band 2–98 once boundary effects are set aside), the histogram supports the interpretation that Elastic Net captures the main linear signal in the central range but still struggles with extreme regimes and potentially nonlinear/interaction-driven patterns, motivating the subsequent use of nonlinear approaches.
4.3. Decision Tree: Segmentation and Threshold Effects
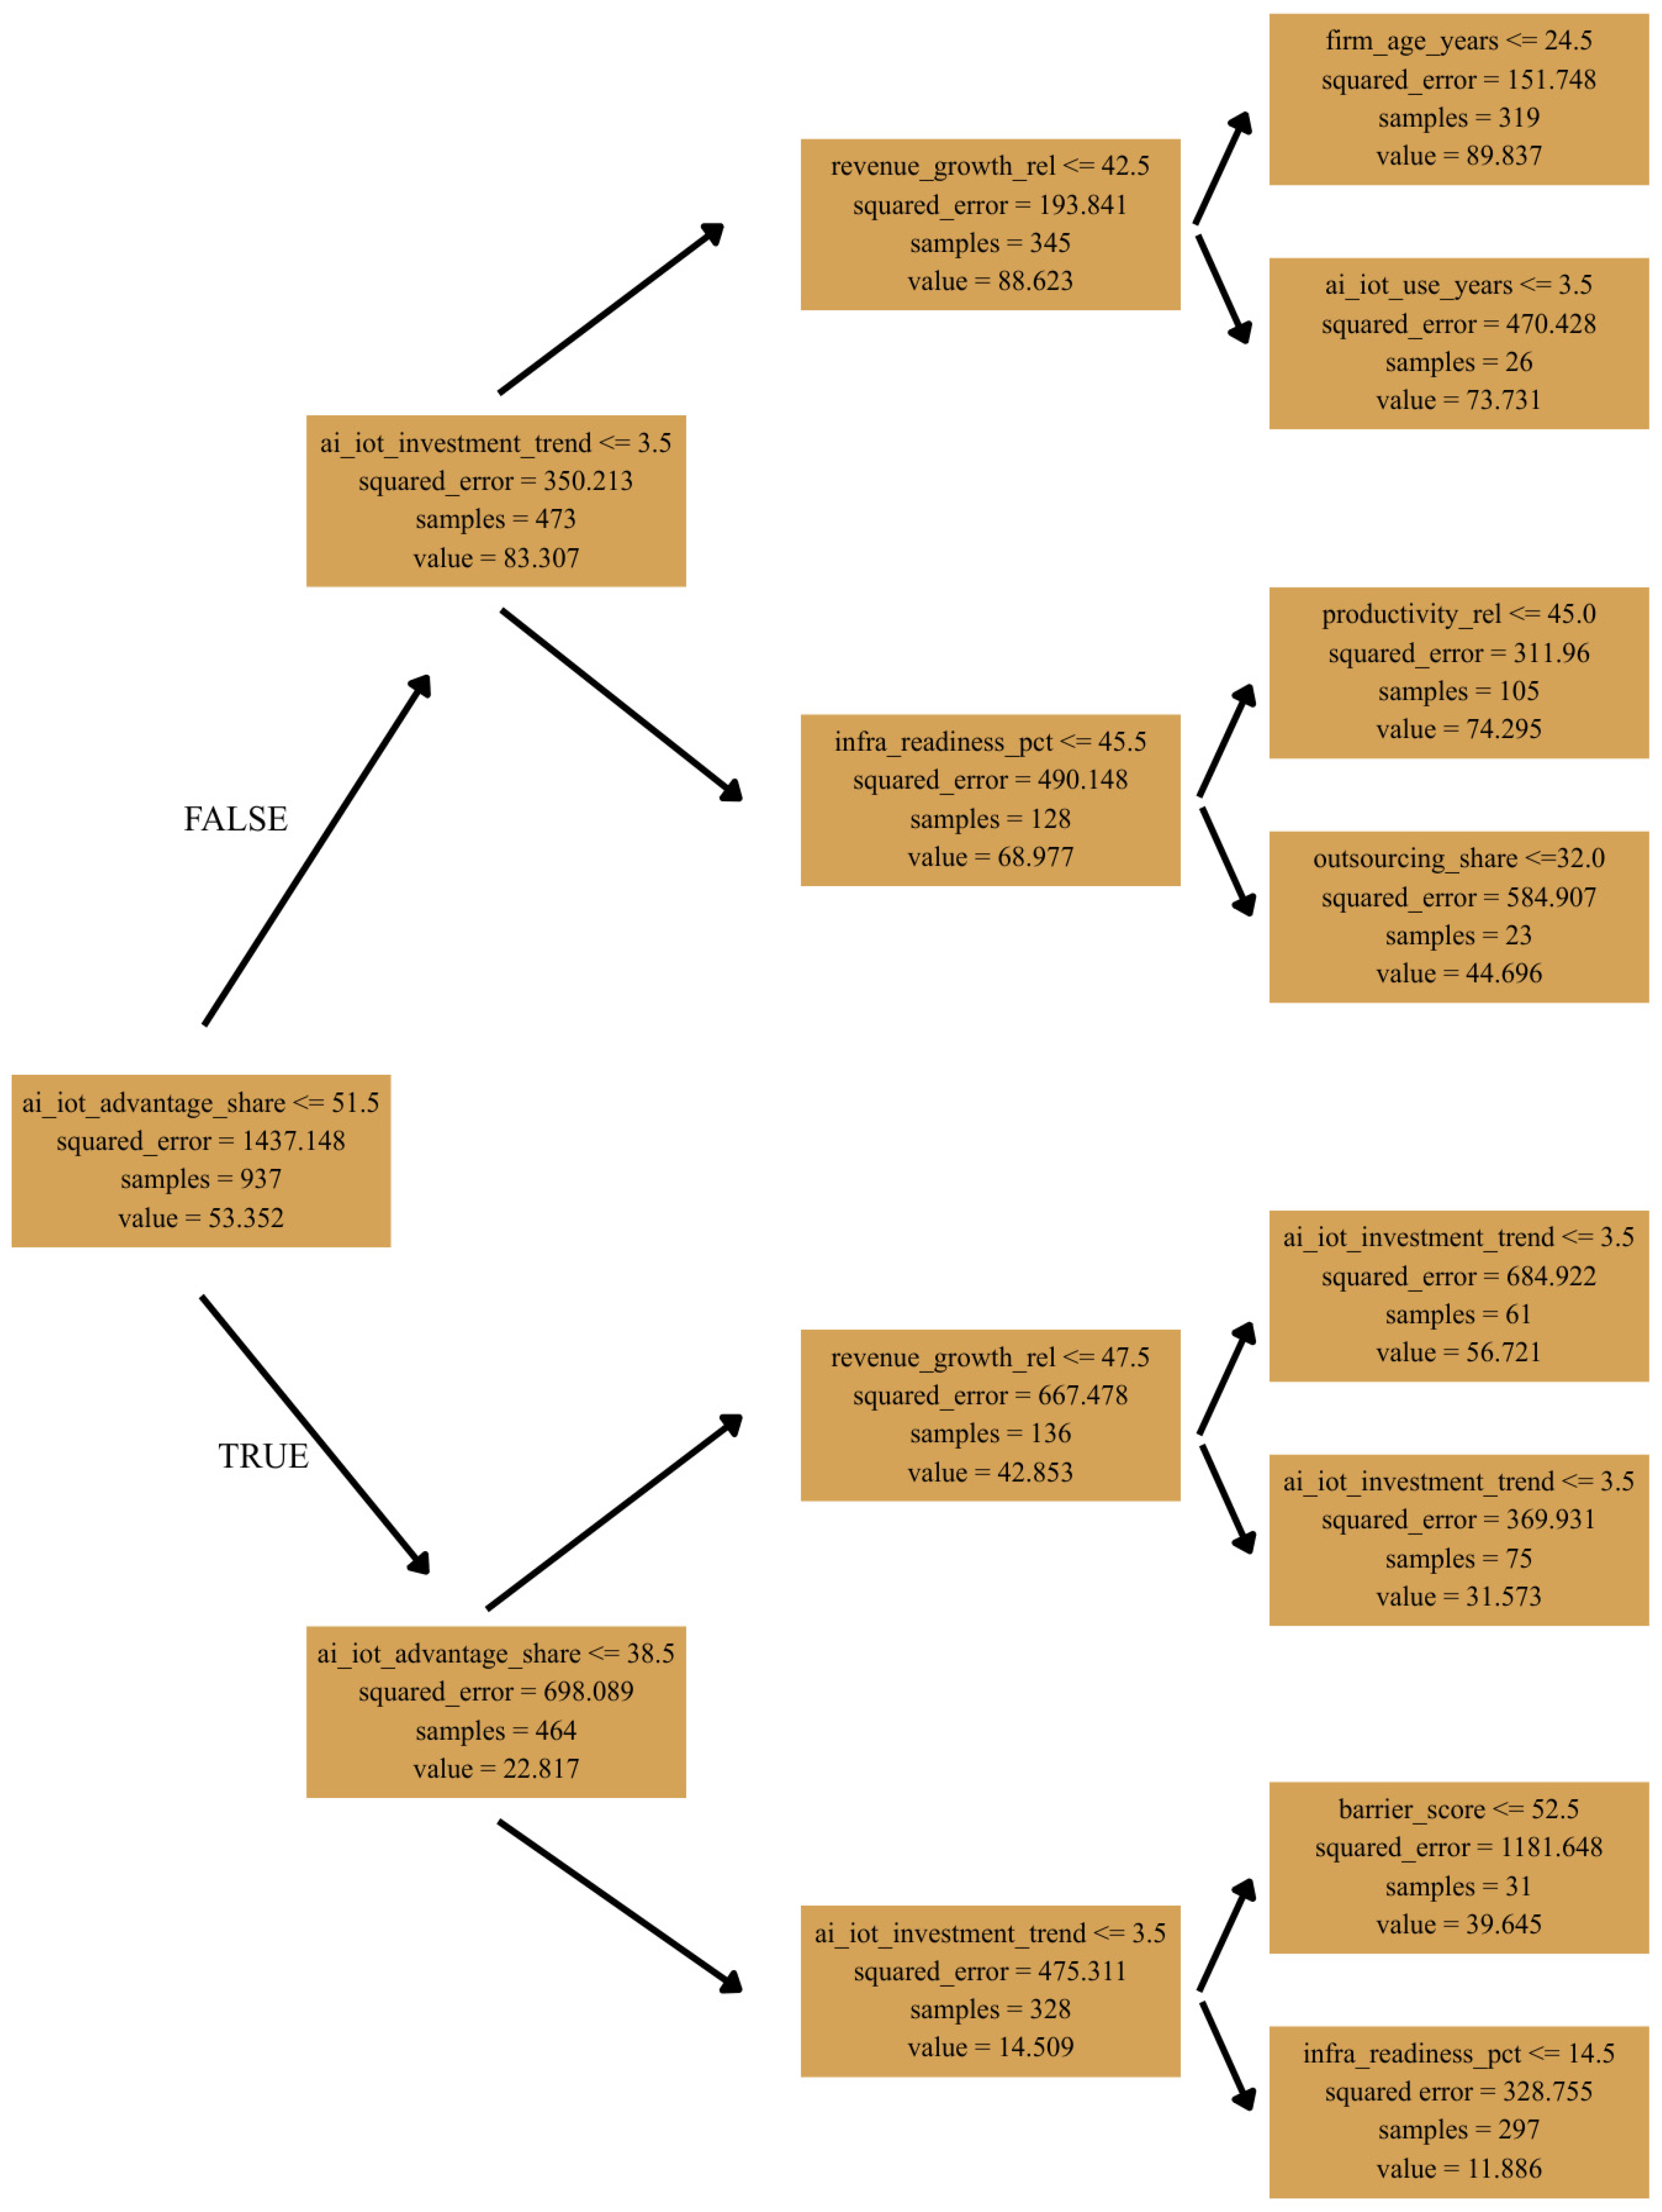
The decision tree was mainly used for segmentation and identification of threshold values of predictors.
Figure 6 visualizes the first three levels of the tree.
The root split was determined by the variable ai_iot_advantage_share, which confirms its dominant significance. At the next levels, the variables of investment trend, relative performance, and readiness appear, which is consistent in content. The practice of trees shows that such rules can serve as simple managerial heuristics for quick diagnosis of the risk of low success. Top segmentation rules extracted from Decision Tree are presented in the table below (see
Table 5).
4.4. Random Forest: Diagnostics and Interpretation
This section provides a detailed diagnostic and interpretative assessment of the best-performing Random Forest model, selected based on the highest TEST R2 in the model comparison. The evaluation is performed on the held-out test set (25% of the sample) to assess prediction quality and residual structure, quantify and localize extreme errors (“tail risk”), and interpret key predictors using model-agnostic explainability tools (permutation importance, PDP/ICE, and interaction-focused diagnostics). The goal is to complement performance reporting with an understanding of where the model succeeds, where it fails, and which mechanisms drive its predictions.
4.4.1. Prediction Quality and Residual Structure
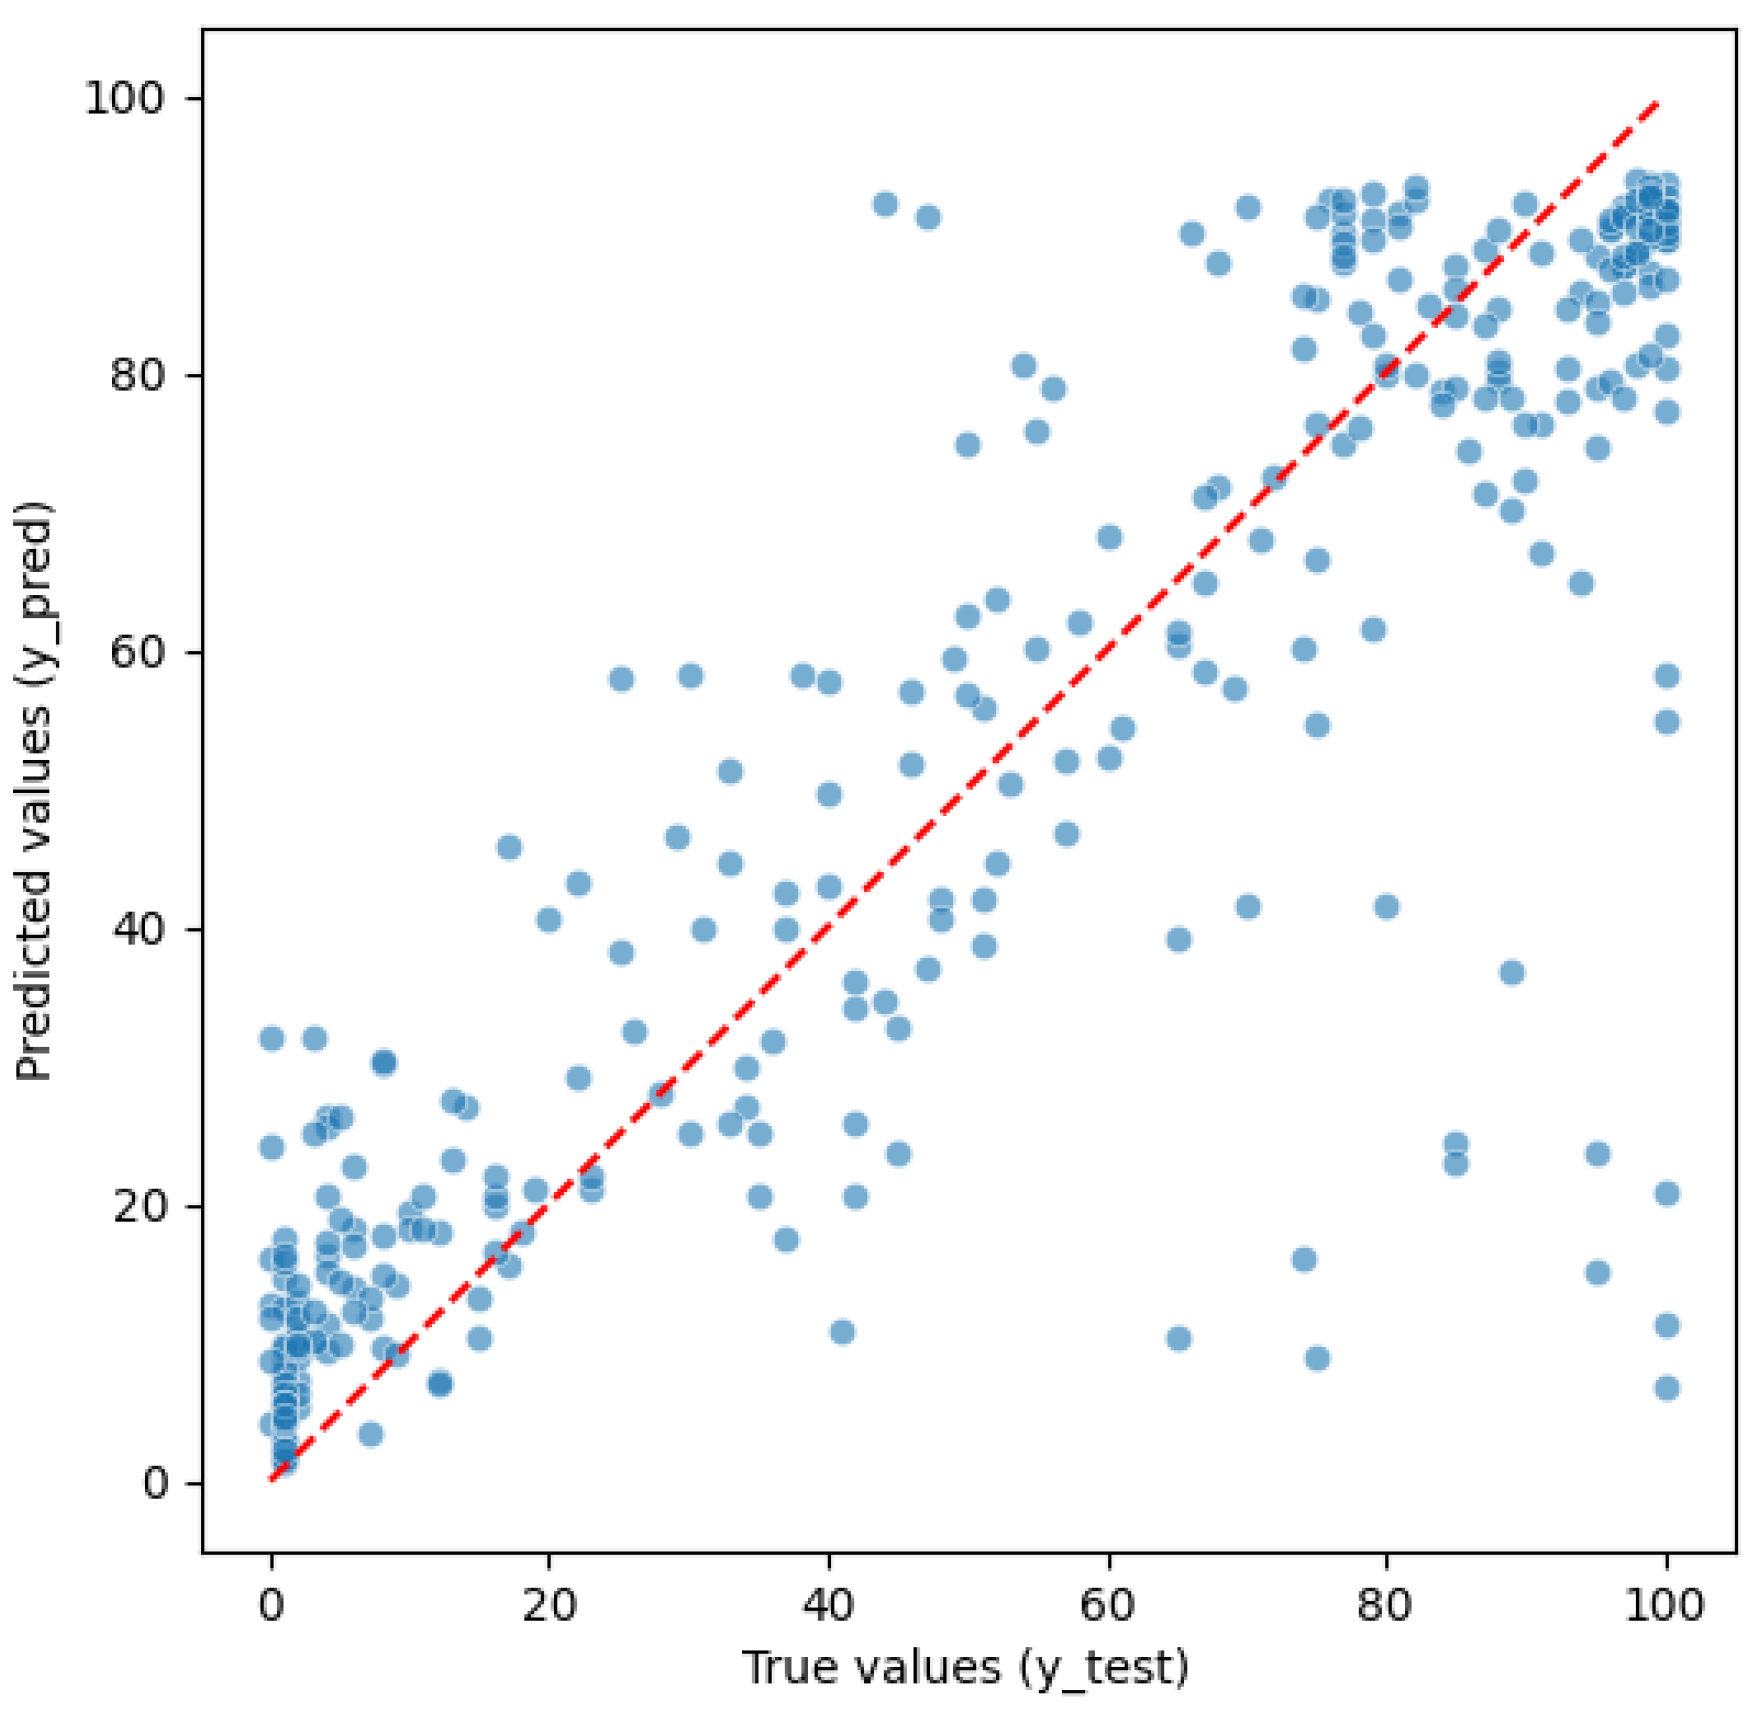
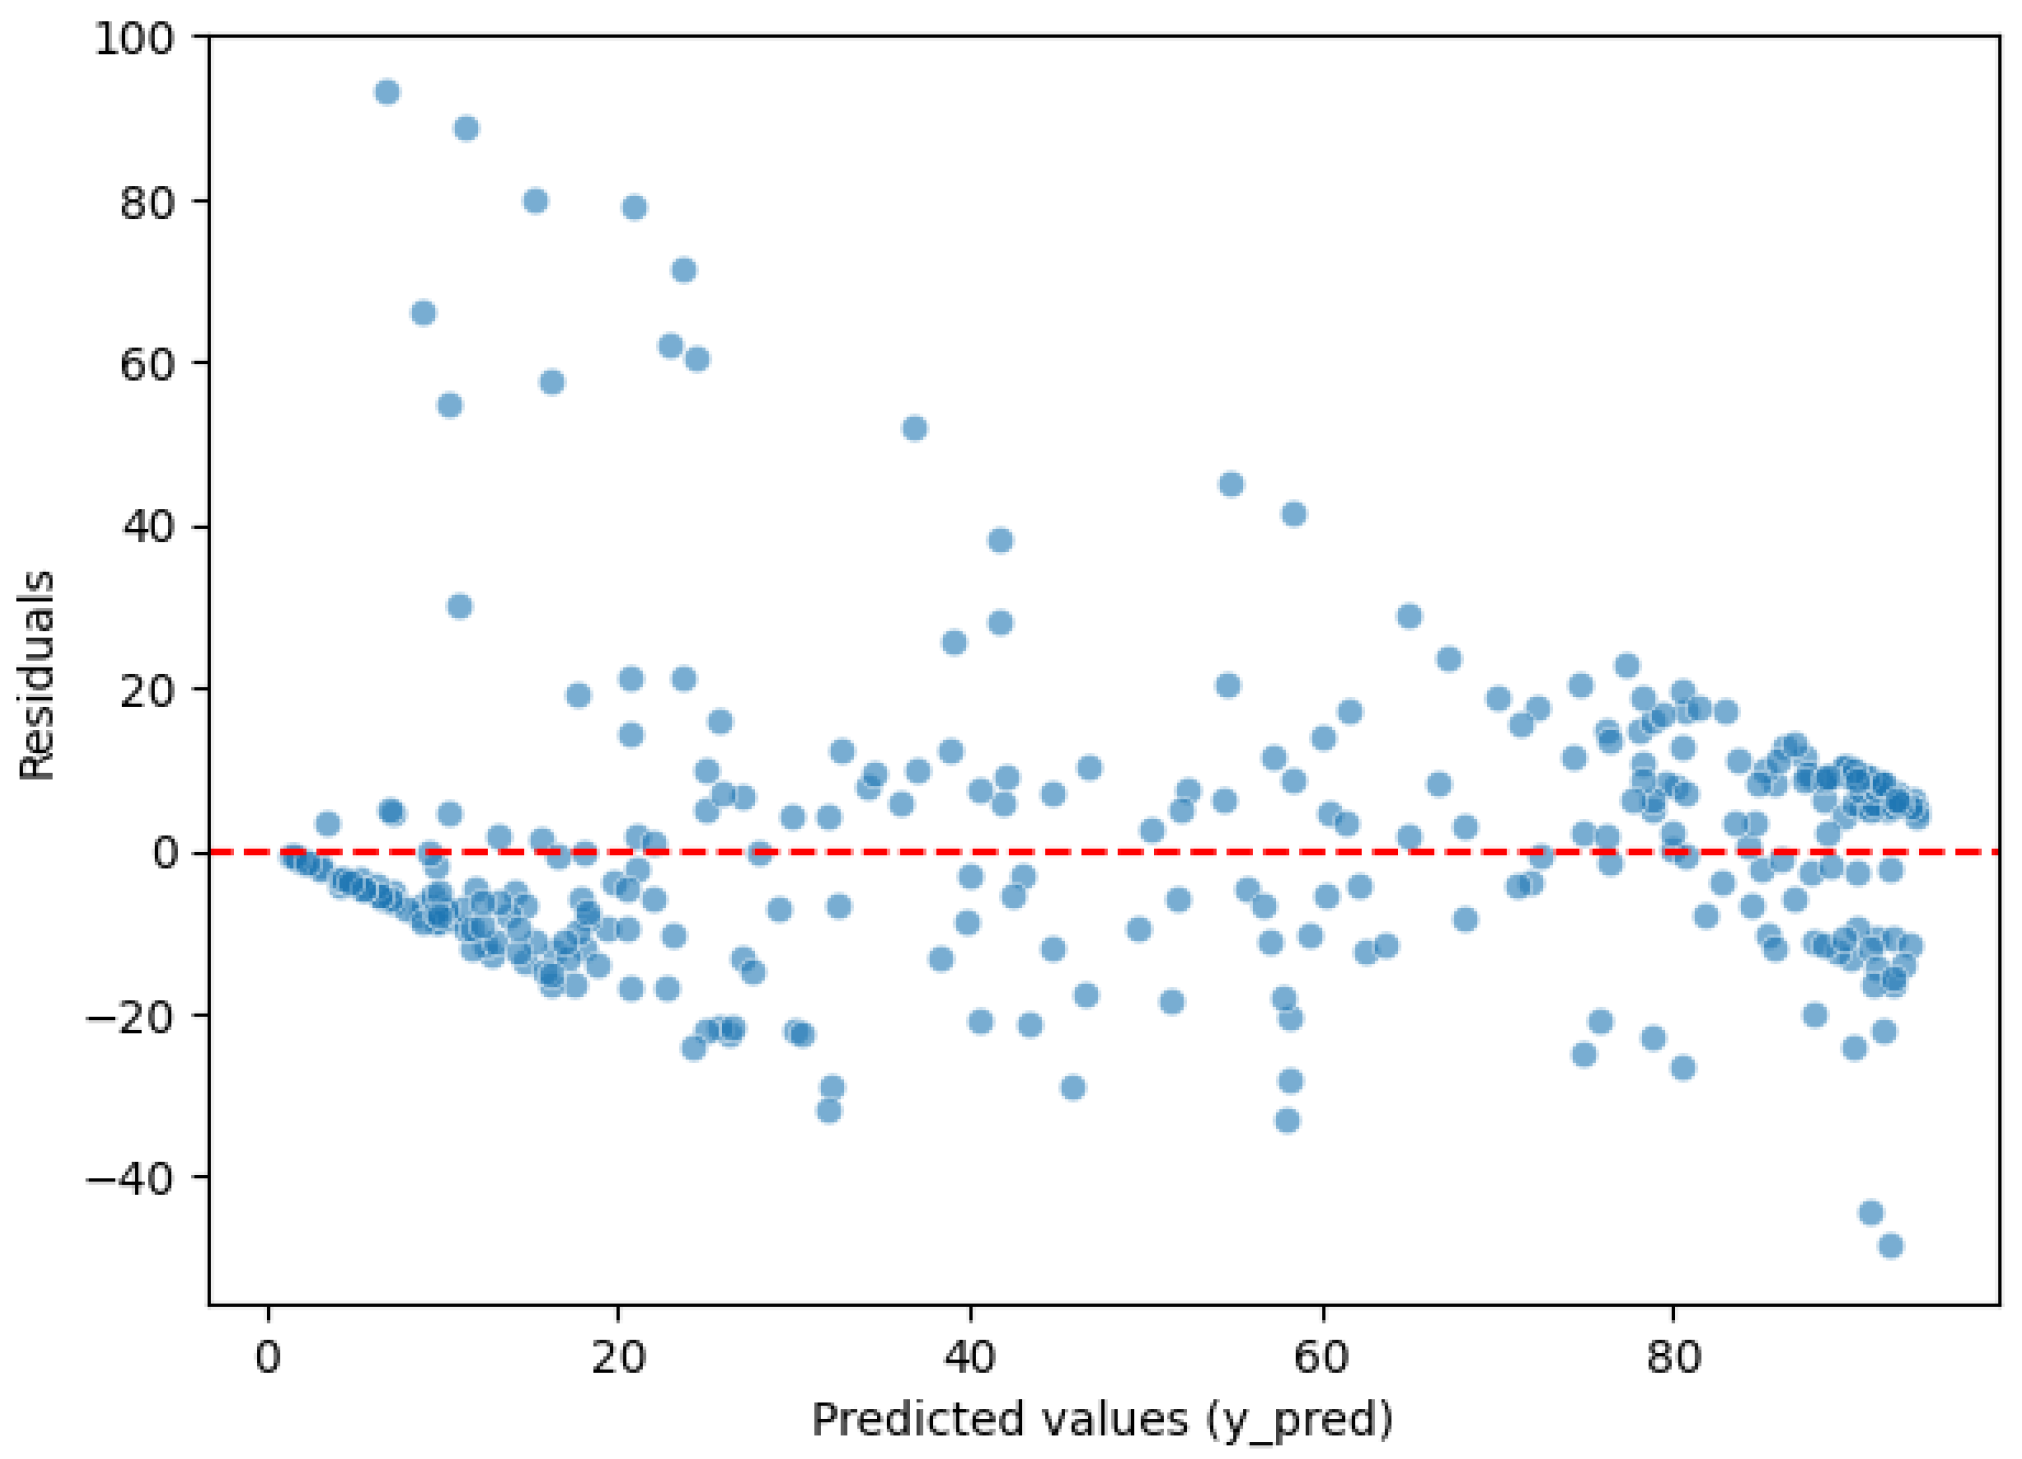
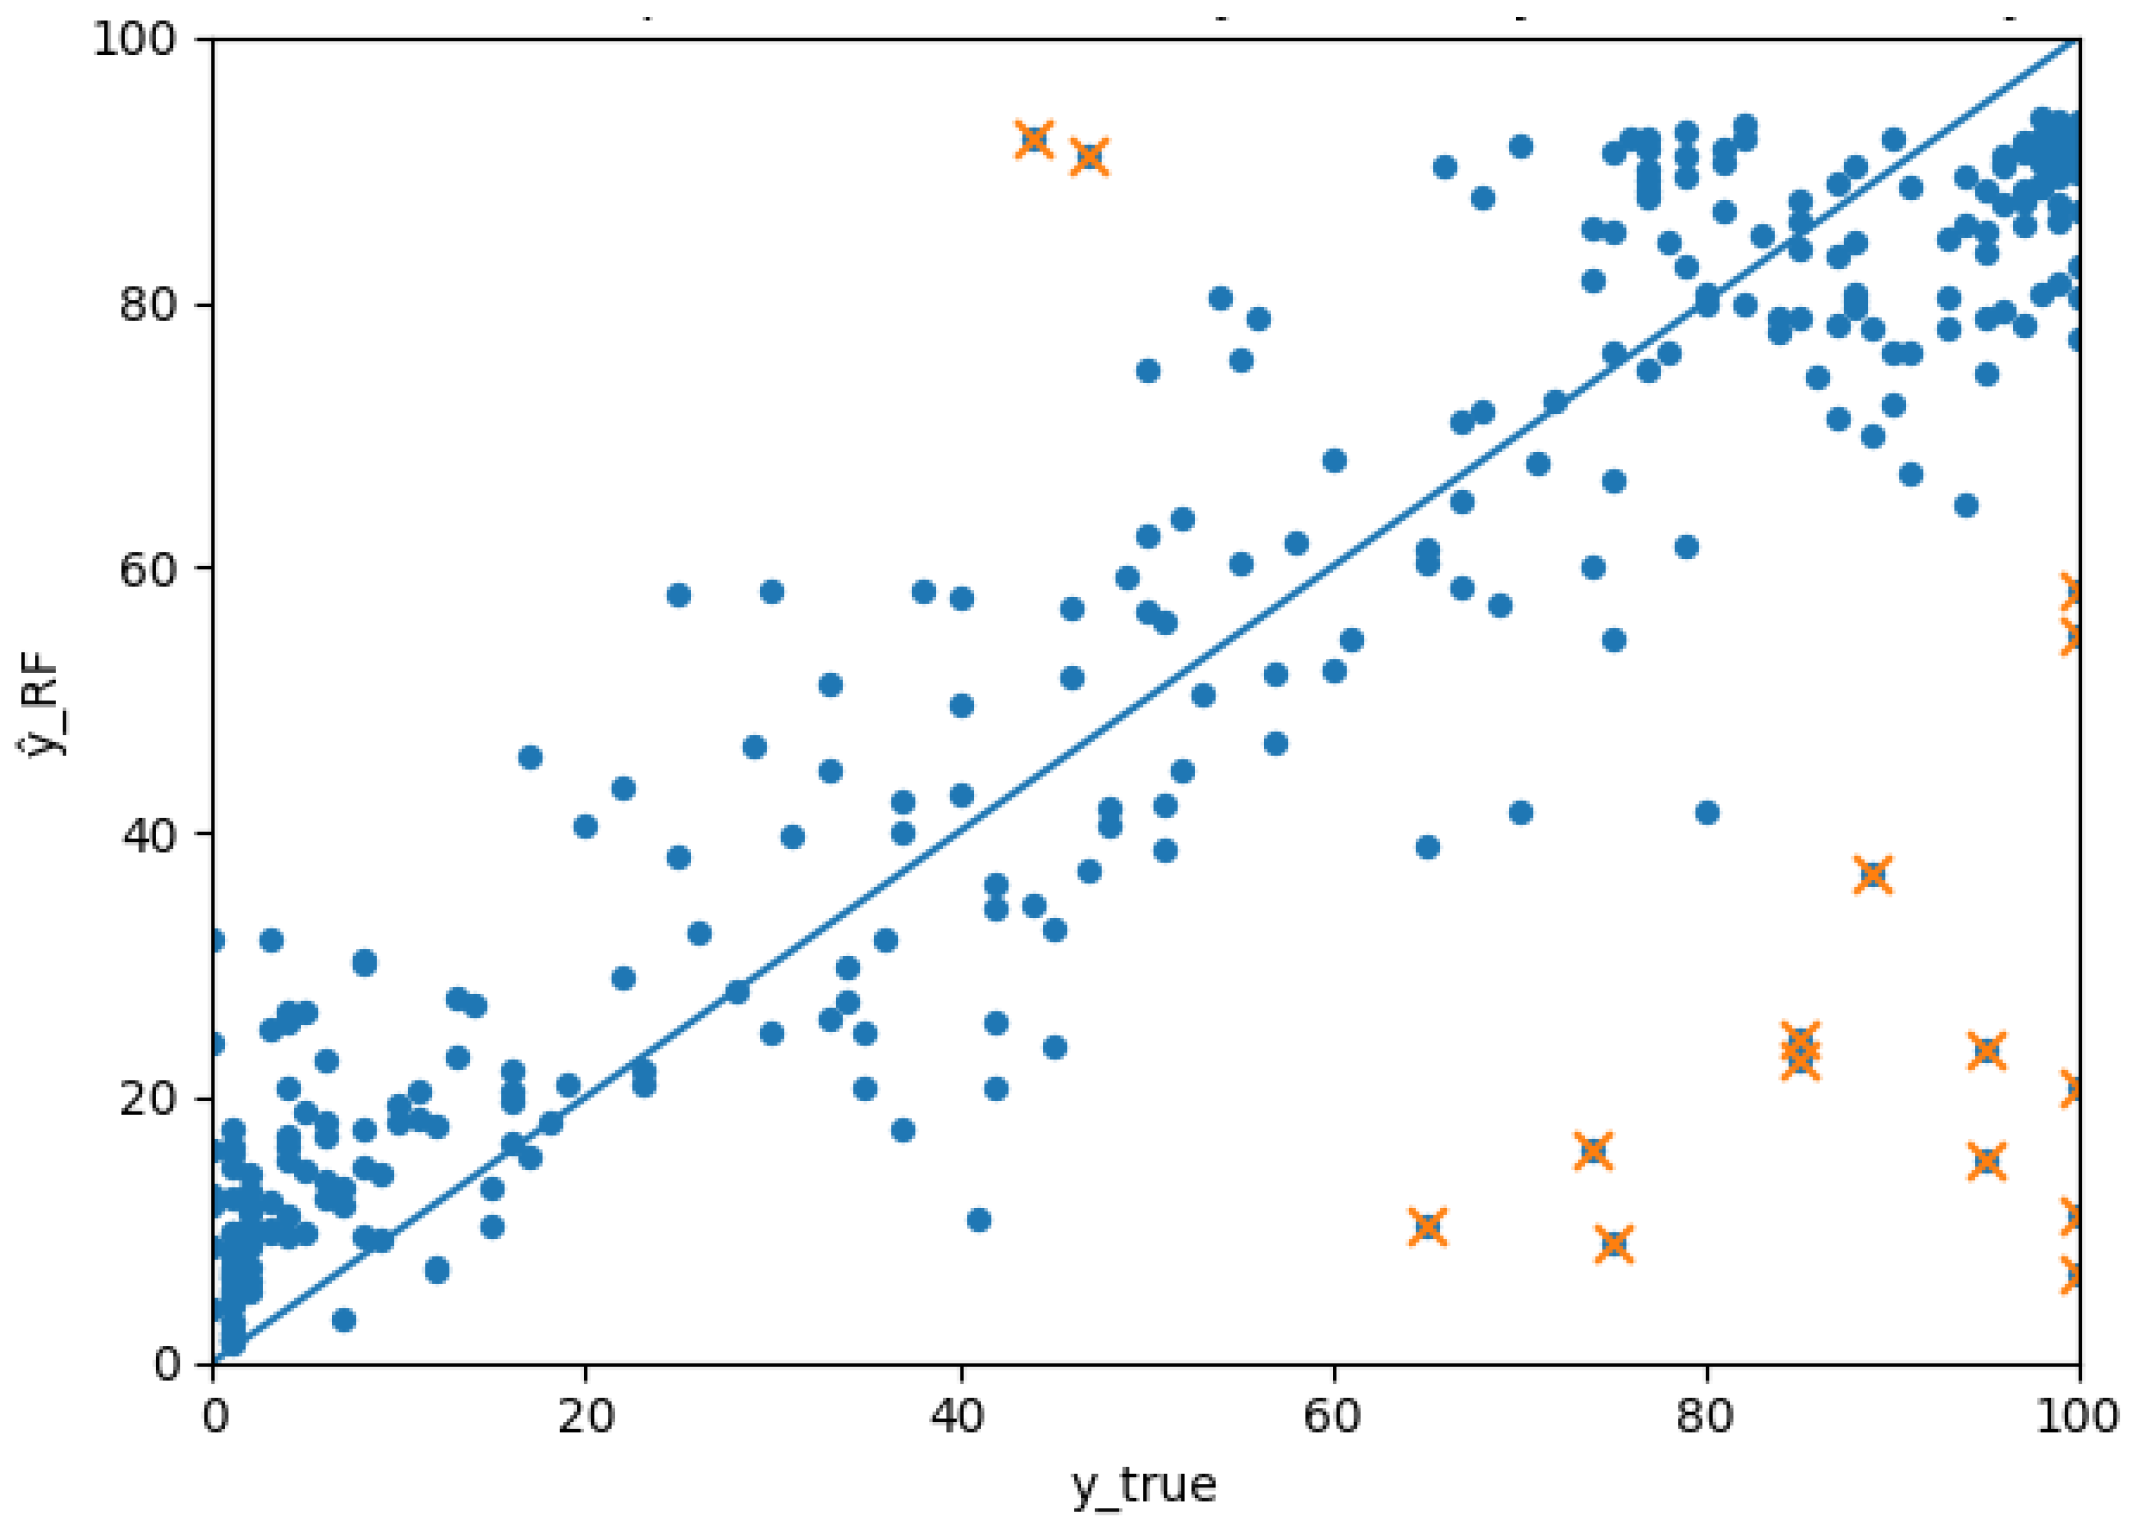
Figure 7 shows a comparison of the actual and predicted values on the test set. Compared to Elastic Net, the systematic error structure at high values is reduced, indicating that RF captures nonlinearities and interactions.
Overall, the scatter is tightly aligned around the diagonal, consistent with the strong test performance (R2 ≈ 0.764). Compared to the Elastic Net baseline, the model reduces systematic underestimation in the upper range (“ceiling bias”) and improves fit in heterogeneous mid–high regions. At the same time, a small set of observations remains problematic, most notably cases with very high true-success rates but unexpectedly low predictions (points in the right-lower area). These patterns motivate residual-based diagnostics to distinguish global bias from localized extreme failures.
The residual plot in
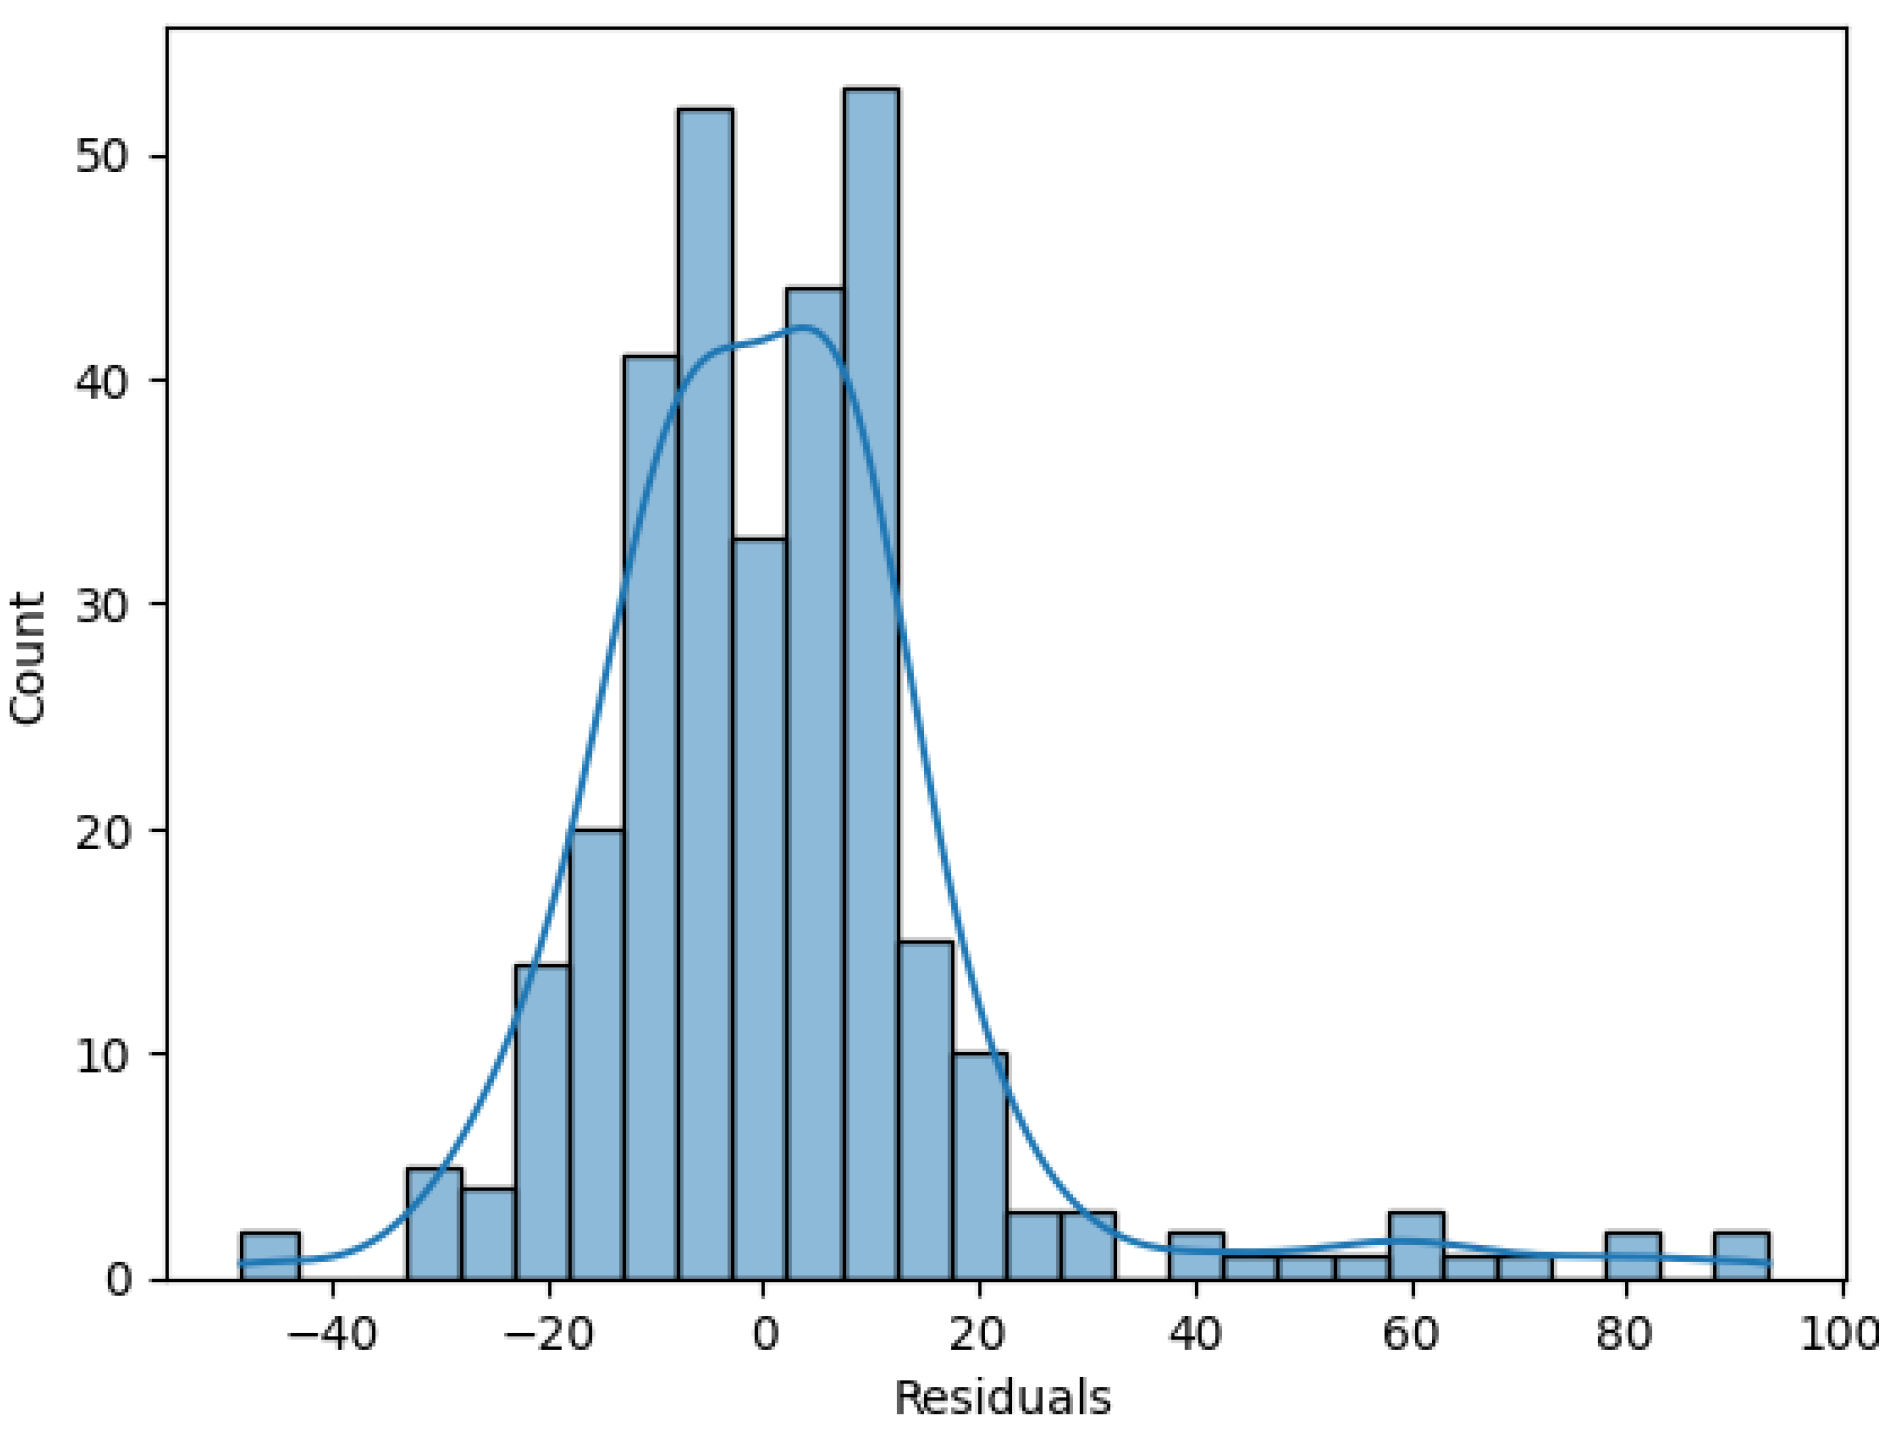
Figure 8 allows the assessment of heteroskedasticity and bias. The residual histogram in
Figure 9 summarizes the typical error size and tails of the distribution.
The residual plot (
Figure 8) suggests that Random Forest mitigates the most visible systematic structure observed in the linear baseline, especially in the high-prediction region, indicating that the model captures part of the nonlinearities and interactions present in the data. A mild pattern can still be observed at very low fitted values, consistent with slight overestimation in the lower tail. The residual histogram (
Figure 9) is concentrated around zero, implying that most predictions are reasonably accurate, but the distribution retains heavier tails driven by a small number of large errors. This naturally leads to a “tail-risk” view of performance, summarized next via the ECDF of absolute errors.
4.4.2. Tail Risk: Extreme Errors, ECDF, and Profiling
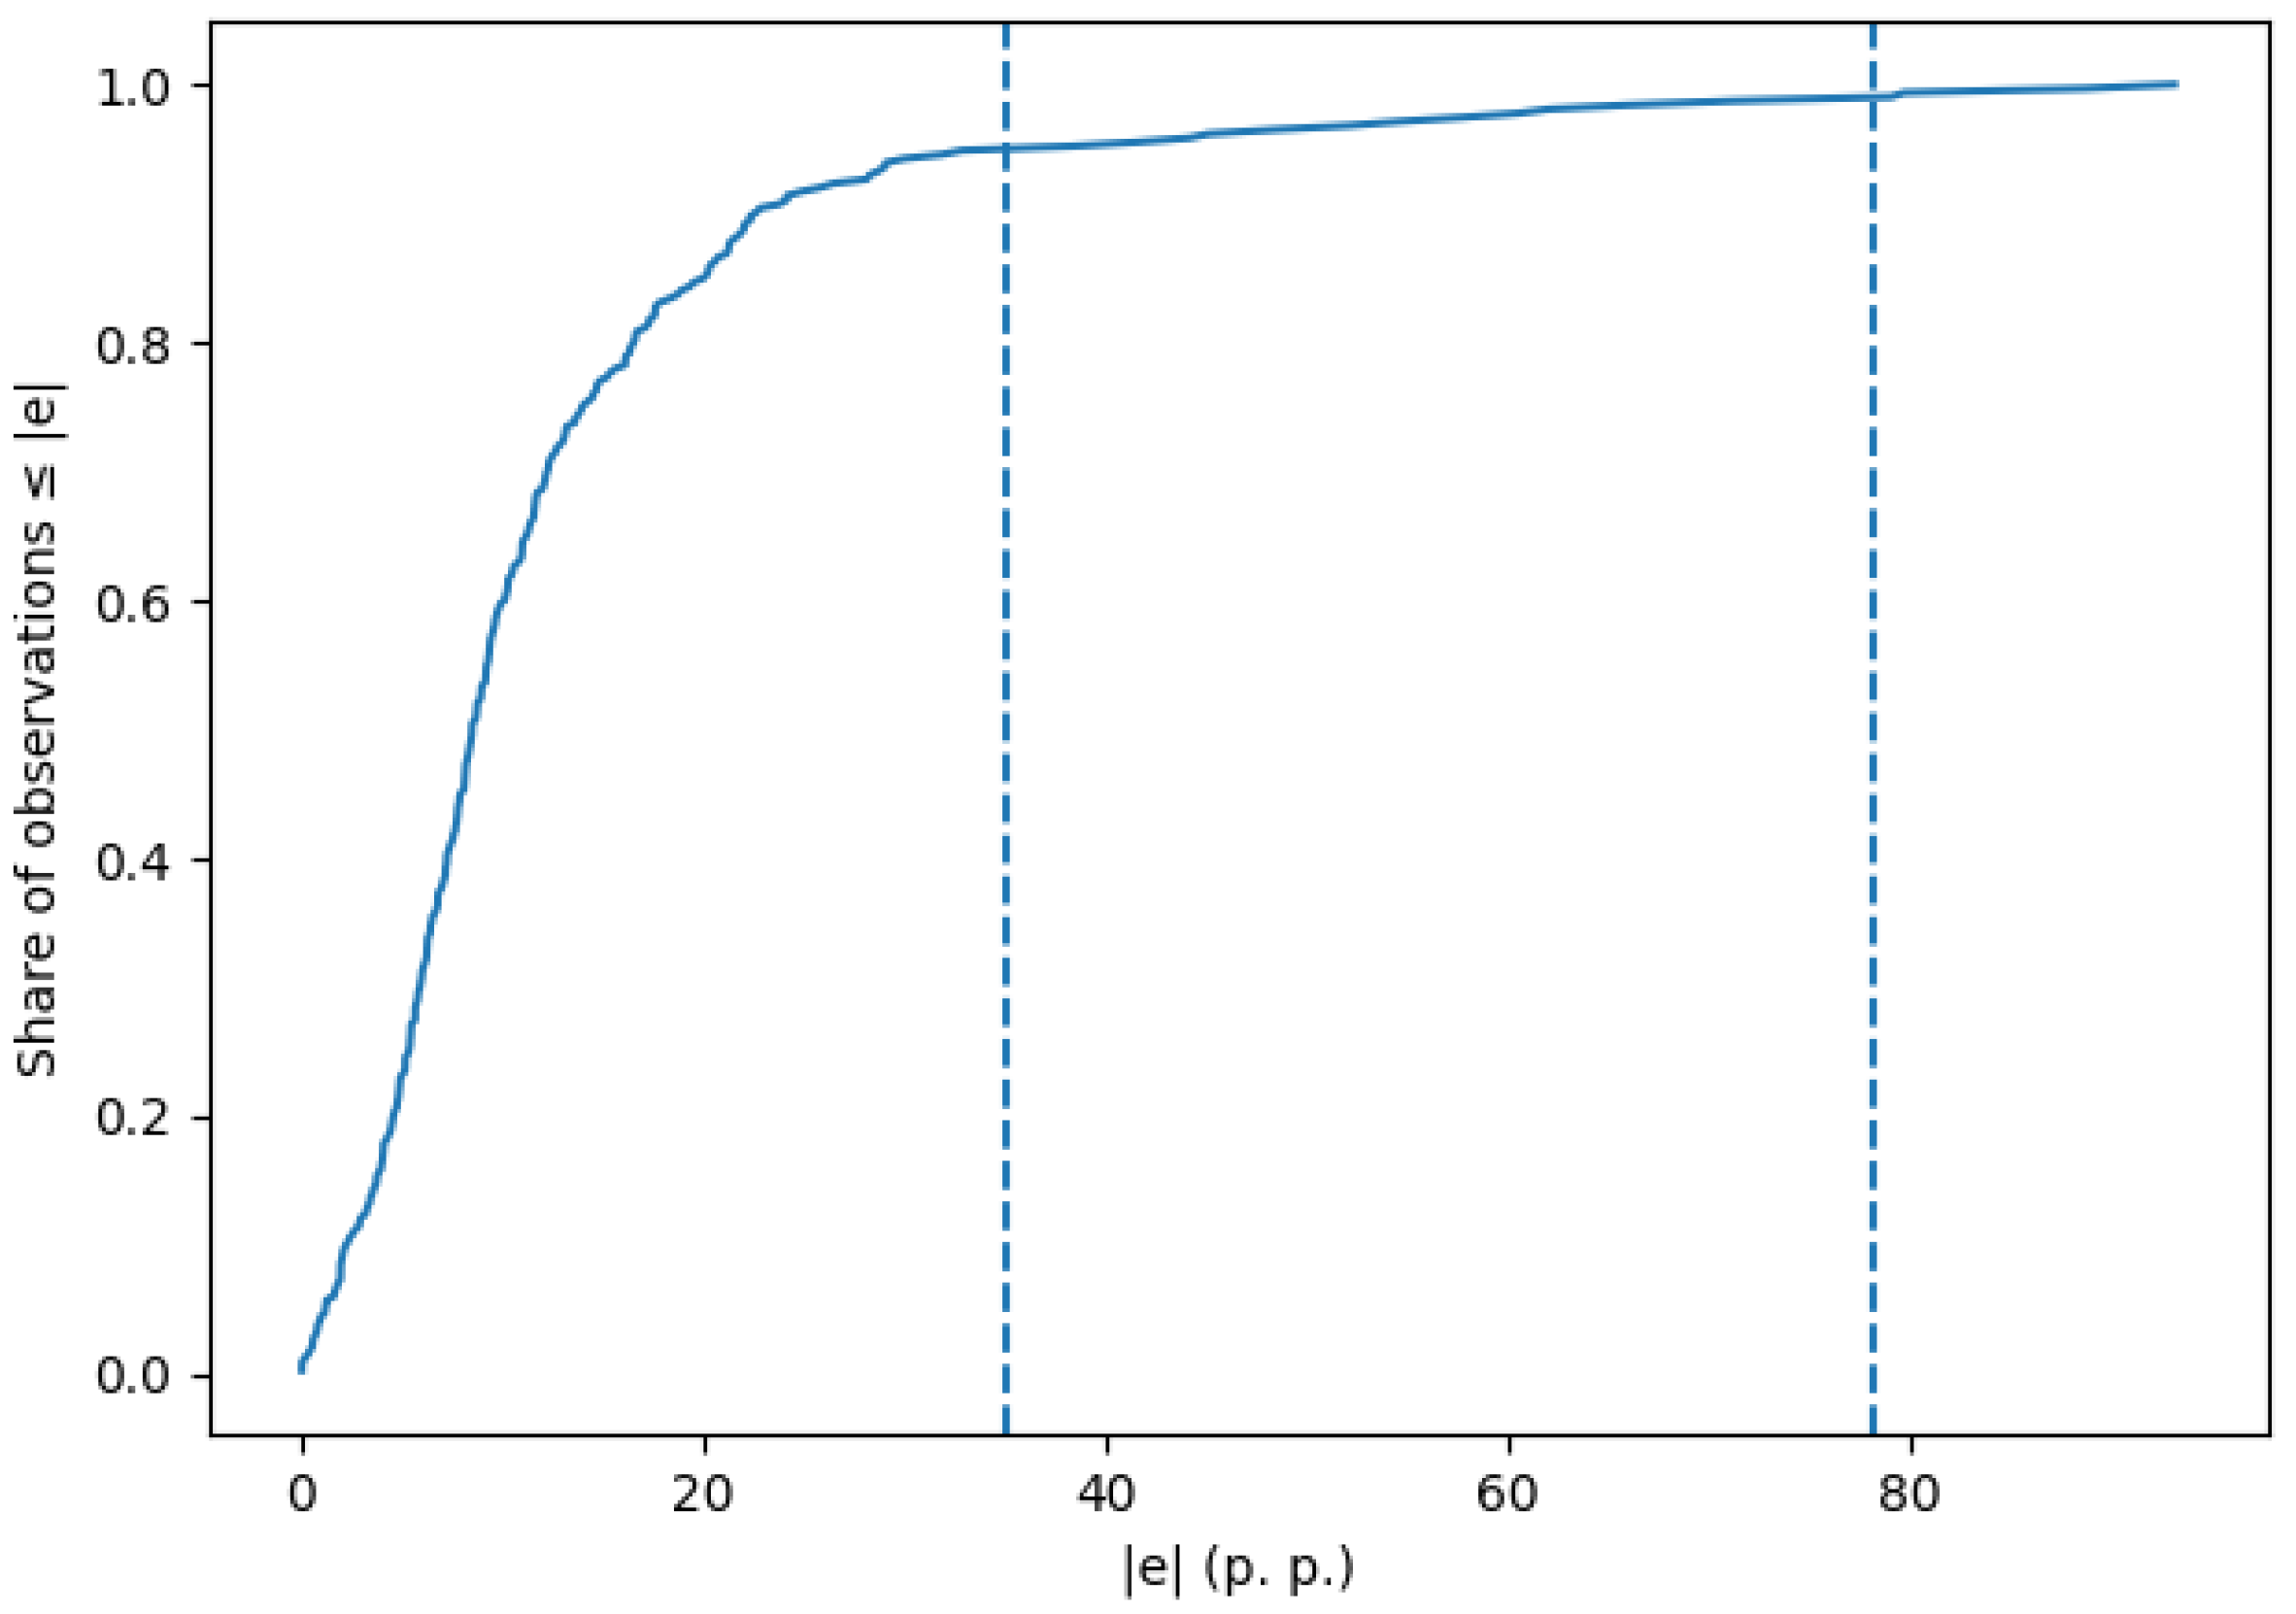
The ECDF of the absolute error in
Figure 10 allows reading percentile boundaries and directly answers the question of what proportion of observations have an error less than or equal to the chosen value.
The ECDF shows that the majority of predictions have controlled error magnitude, while a small tail of observations exhibits very large deviations. In particular, approximately 95% of test observations fall below an absolute error of about 35 p.p., whereas the 99th percentile reaches roughly 78.2 p.p. In threshold terms, about 6.07% of observations have |e| > 30 p.p., 4.79% have |e| > 40 p.p., and 3.51% exceed 50 p.p. These results indicate strong typical performance but a non-negligible extreme-error tail, which is examined next by listing the most problematic cases.
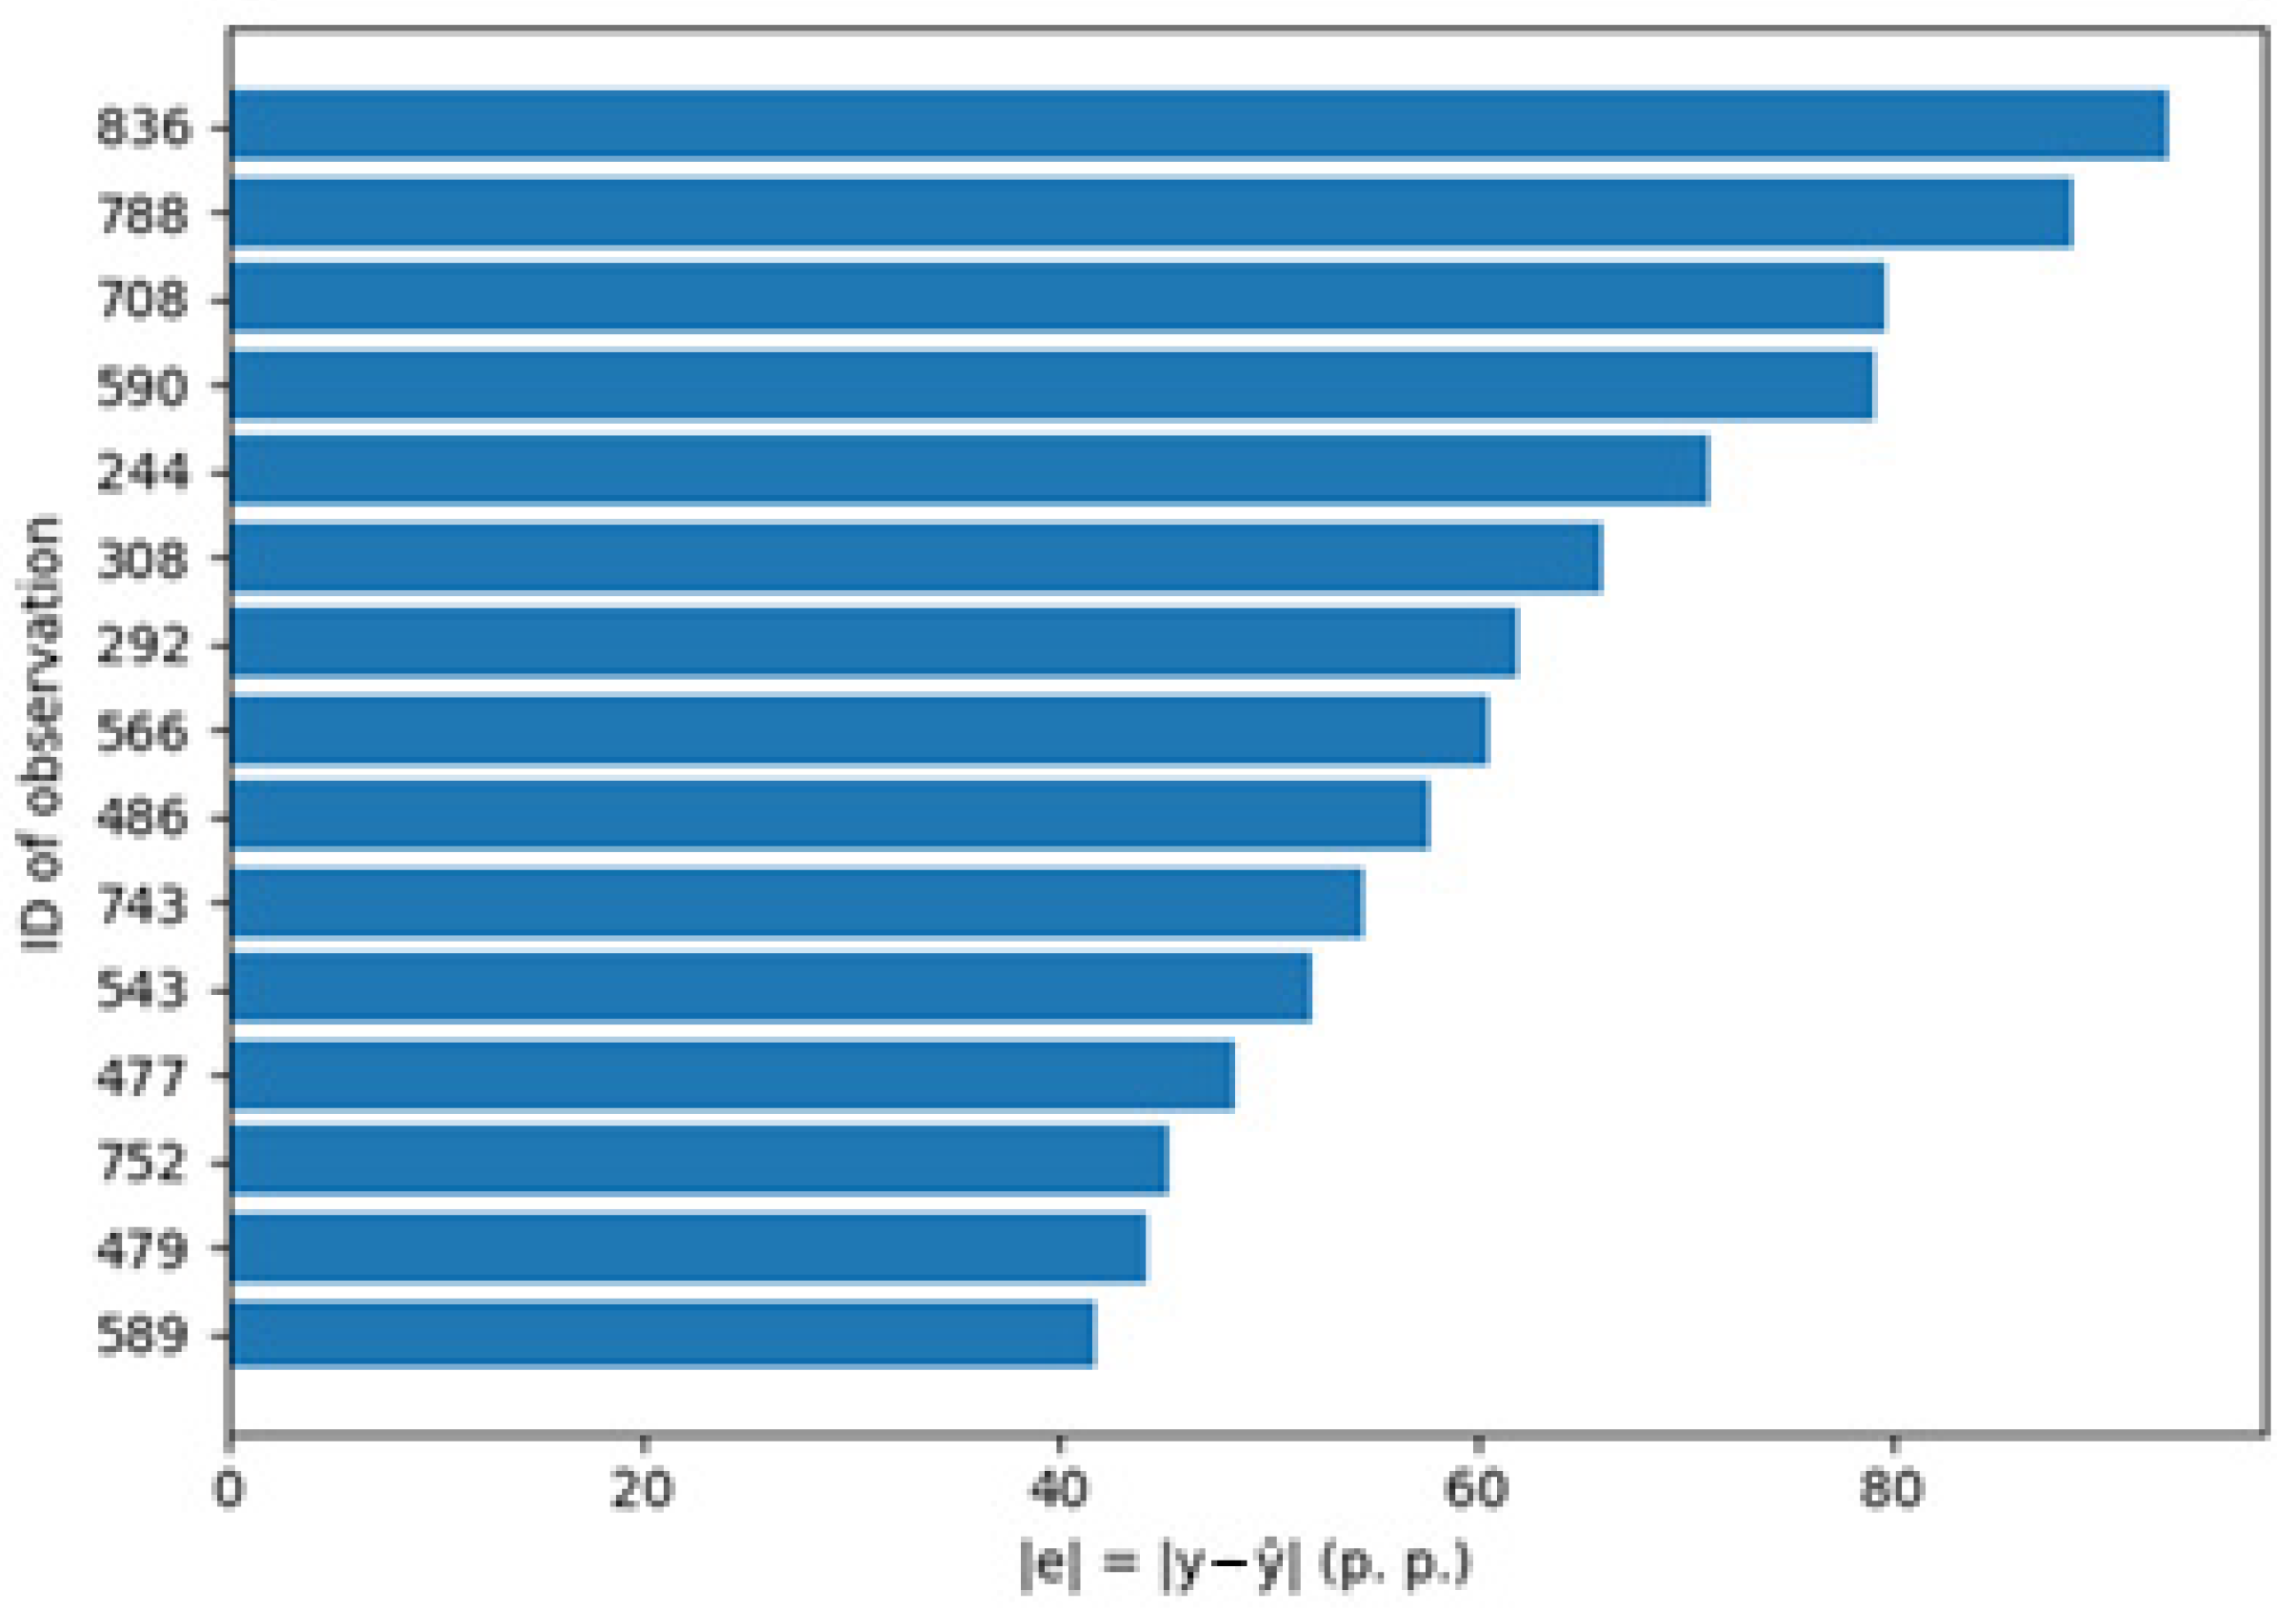
The following is the identification of the TOP 15 highest absolute errors in
Figure 11.
The TOP-15 ranking confirms that extreme failures are highly concentrated: the largest absolute errors reach approximately 93 p.p. and 88 p.p. and then decline toward the 40–45 p.p. range. While these cases represent only a small fraction of the test set, they are practically important because they correspond to scenarios where the model may deliver “catastrophic” underestimation or overestimation. To interpret the direction and geometry of these failures, the next figure highlights these extreme observations directly in the actual-predicted scatter.
Figure 12 shows the highlighting of extreme errors in the actual vs. predicted values graph.
The highlighted scatter reveals a clear asymmetry in the most severe errors. The dominant failure mode is located in the right-lower quadrant, where true outcomes are very high (often close to 90–100), while the model predicts unusually low values—i.e., extreme underestimation. A smaller subset of extremes corresponds to overestimation, where mid-range true values are paired with predictions close to the upper range. Importantly, these cases are not random noise around the diagonal. They follow recognizable patterns, suggesting either atypical combinations of predictors or missing latent drivers (e.g., implementation quality, project type, managerial practices) not captured by the questionnaire. This motivates a simple profiling comparison of key predictor averages for outliers versus the remaining test set.
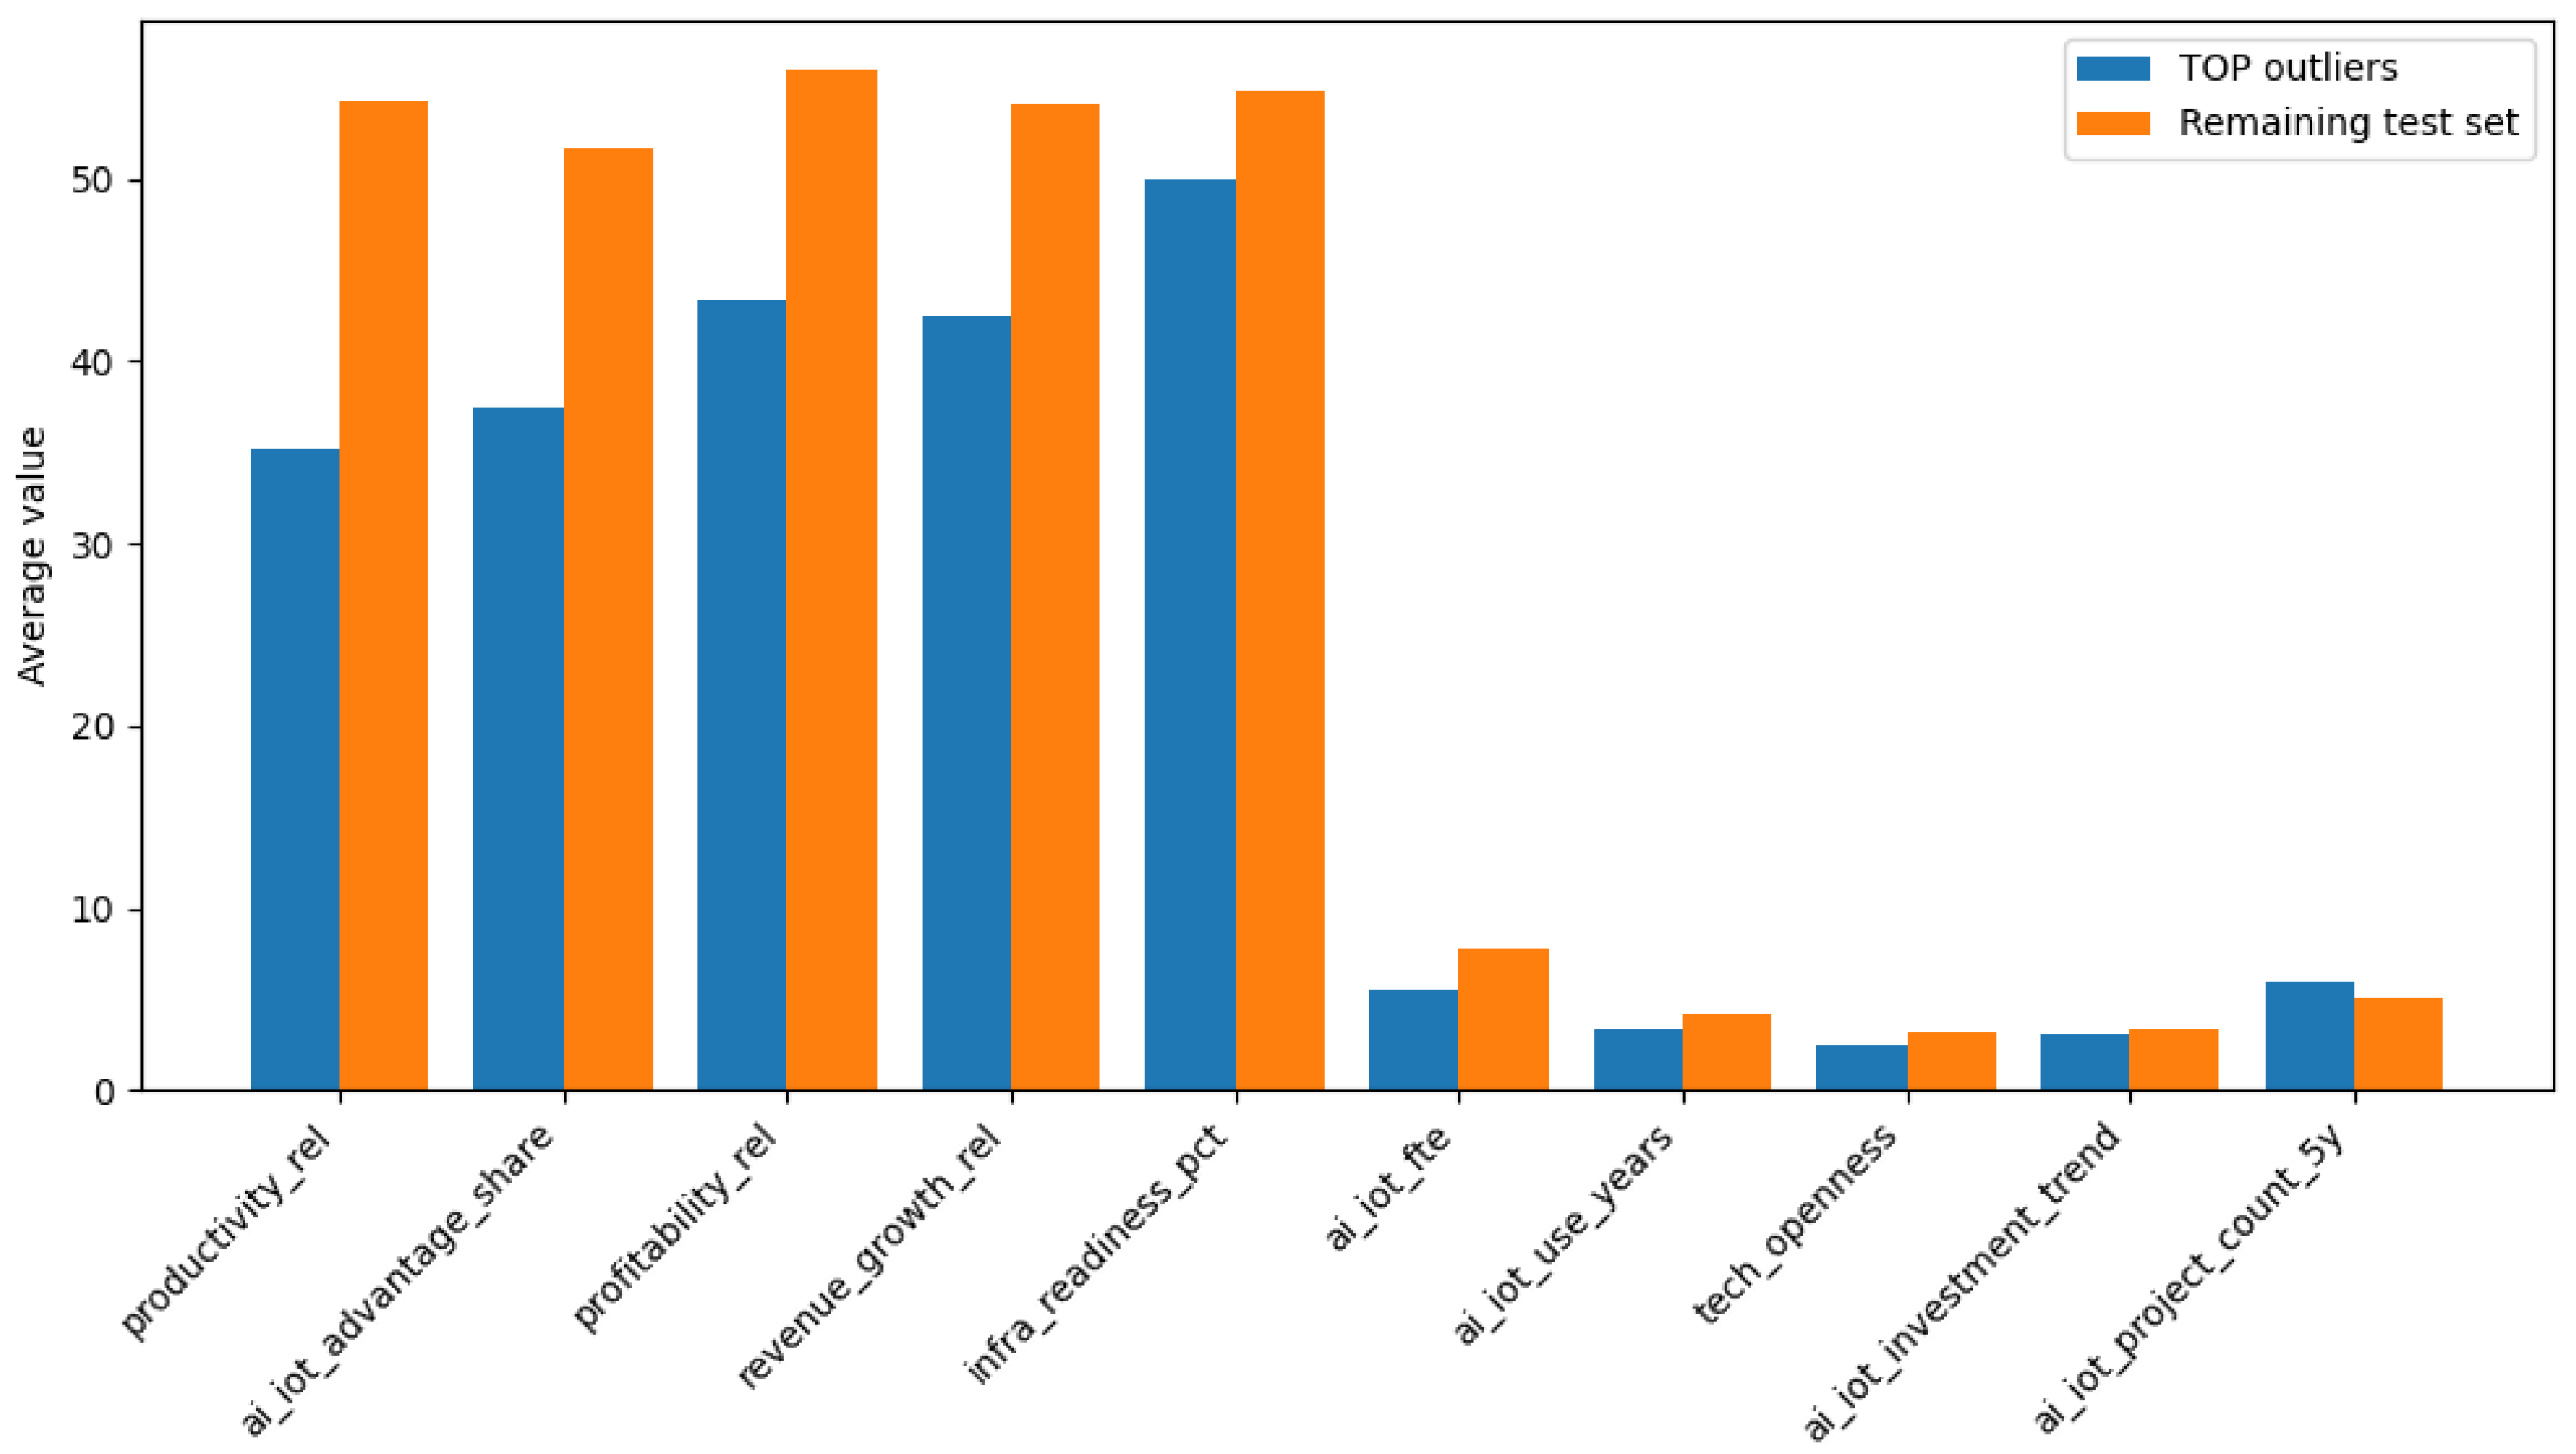
To understand the mechanism, it is appropriate to supplement outlier profiling: compare the average of selected top predictors between the group of outliers and the rest of the test, which is captured in
Figure 13.
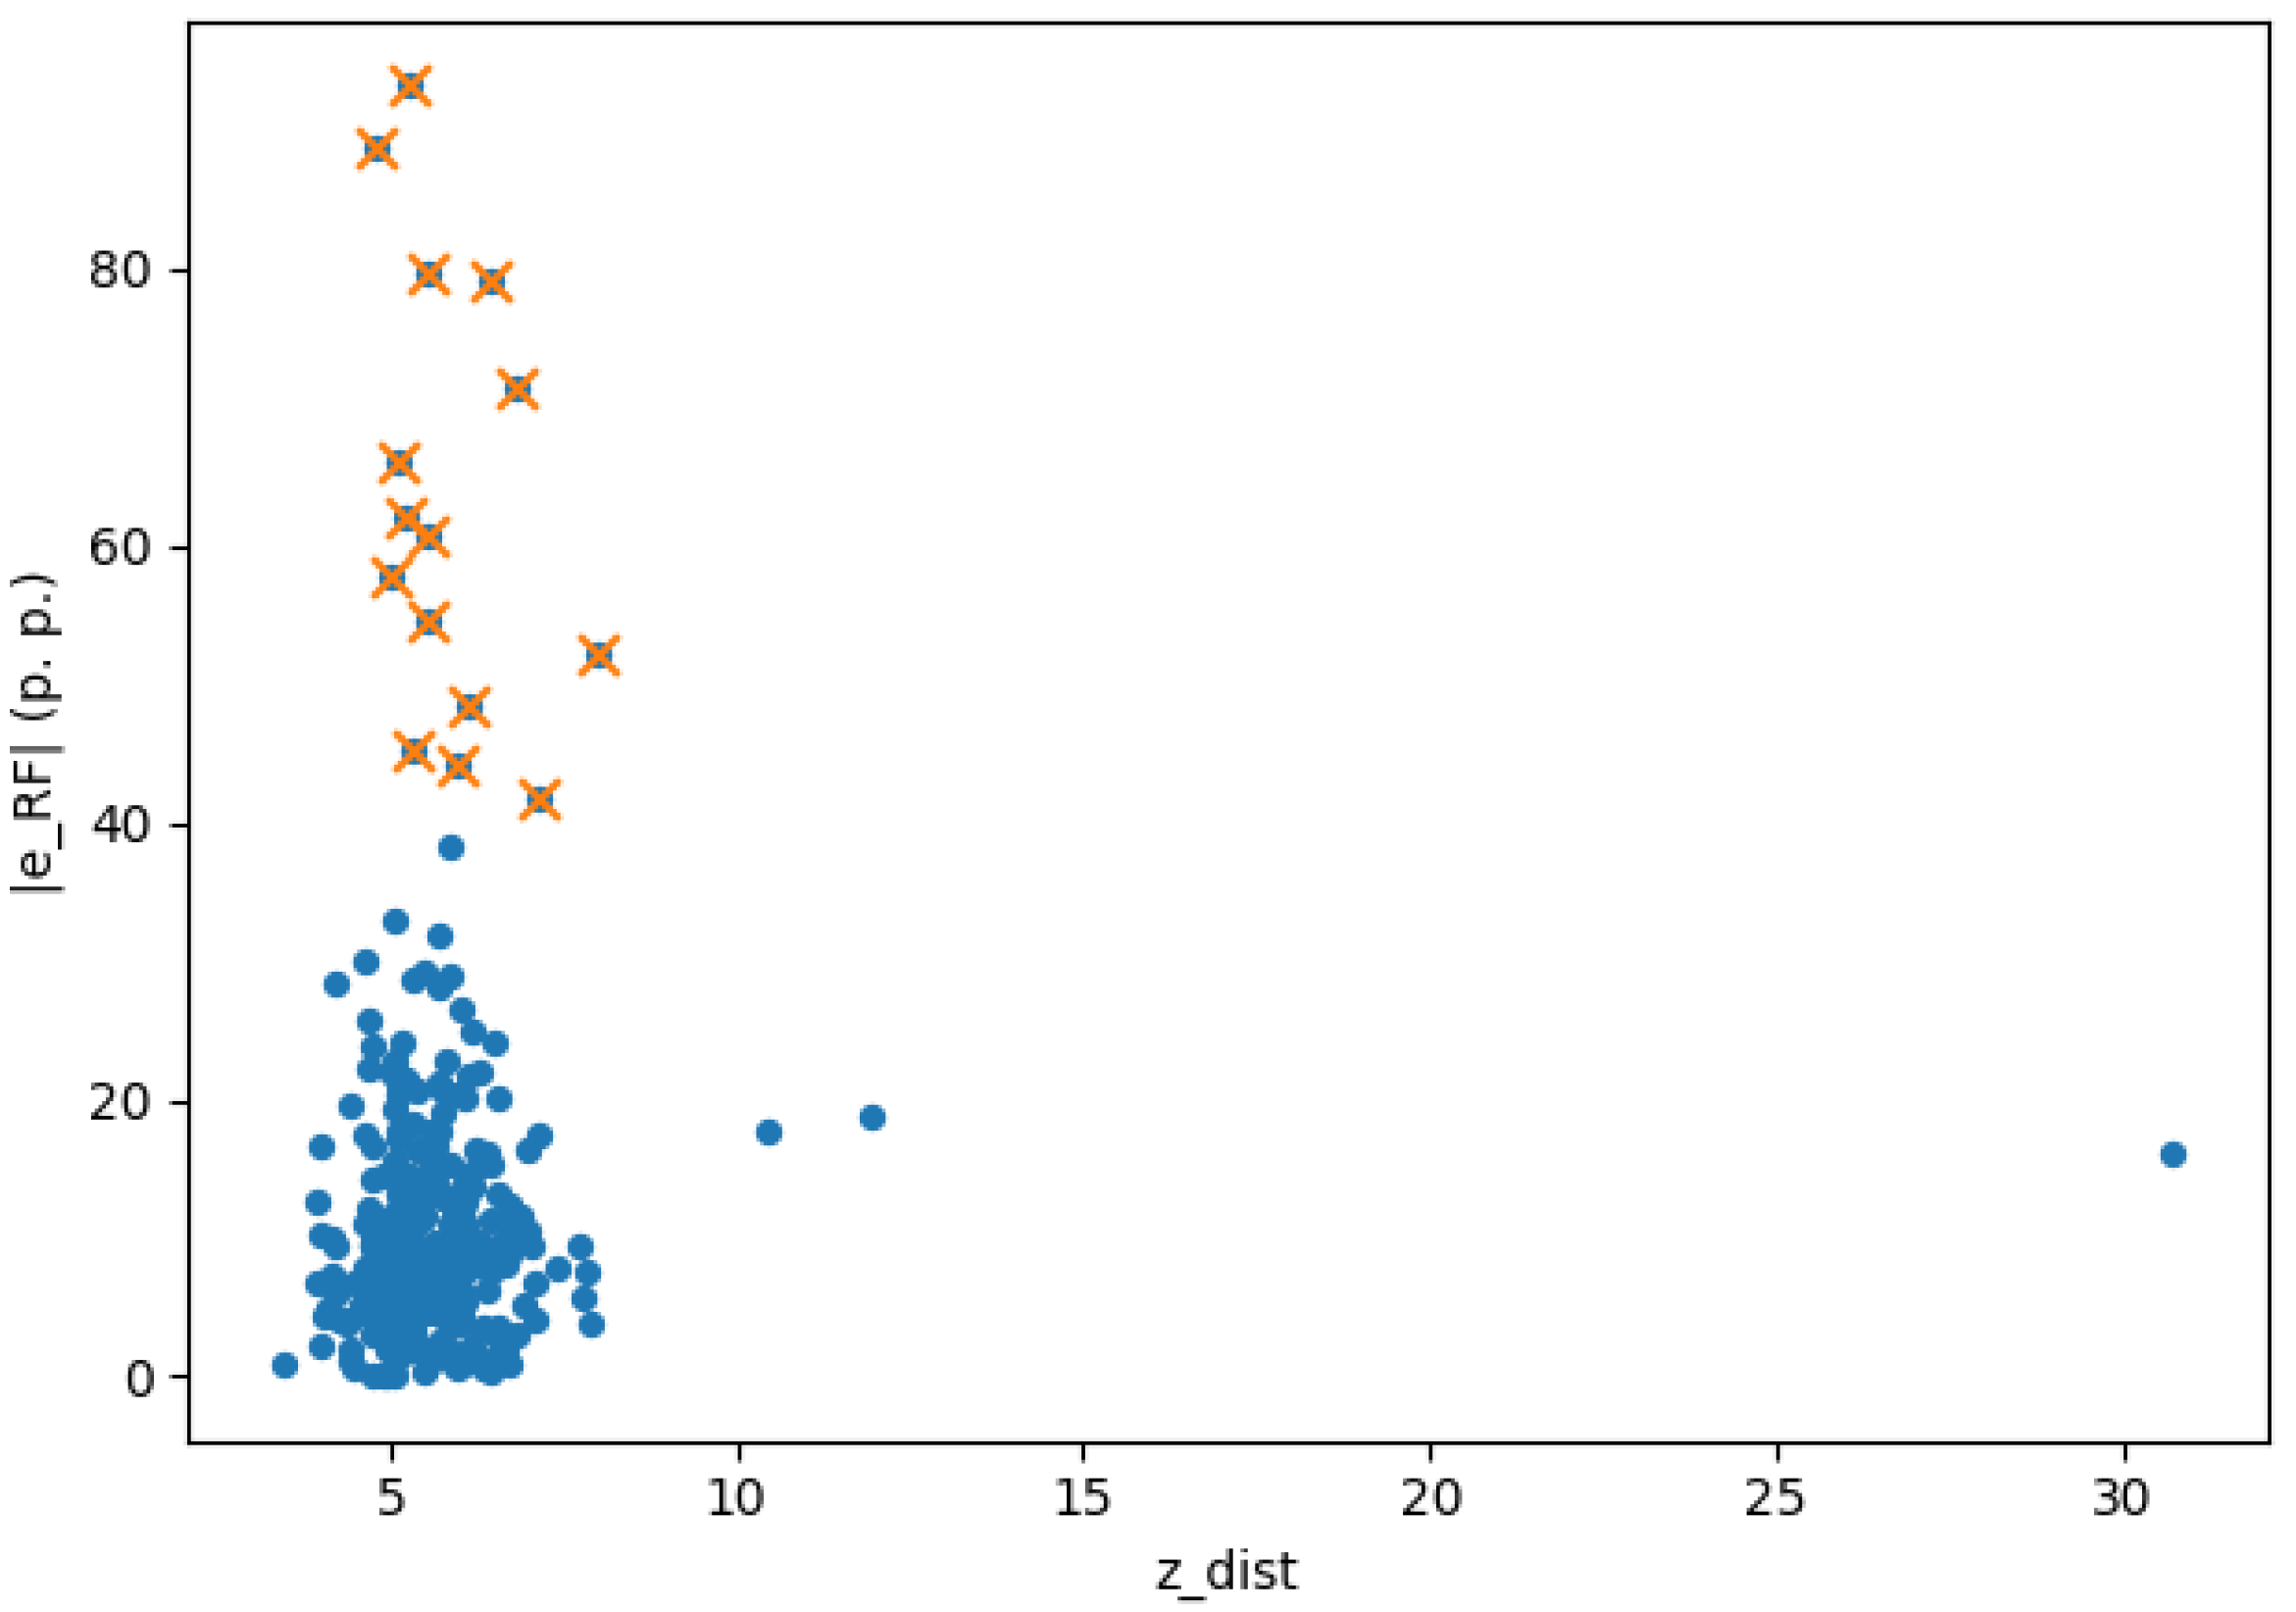
The outlier profiling indicates that the extreme-error group does not differ from the remaining test set by a single “obvious” factor. Rather, it tends to display a distinct combination of values across multiple important predictors. In practical terms, this suggests that the most problematic observations may reflect mechanisms not well represented in the predictor set (latent factors) or idiosyncratic project contexts. To test whether these cases are simply multivariate outliers in the predictor space (i.e., unusual X-combinations), the next diagnostic relates absolute error to an outlierness measure (z-score distance).
The |e| vs. z_dist plot shows that extreme errors are not concentrated at very high multivariate distances (see
Figure 14). Most large-error observations appear at relatively typical z_dist values, while at least one highly distant point exhibits only moderate error. This suggests that “being an X-outlier” is not a sufficient explanation for the largest prediction failures; instead, the errors likely arise from missing explanatory information (unobserved factors) rather than from purely atypical predictor combinations. A related question is whether these difficult observations are specific to Random Forest or persist across modeling approaches; hence, the next comparison between Random Forest and Elastic Net.
4.4.3. Comparison of RF and Elastic Net Errors
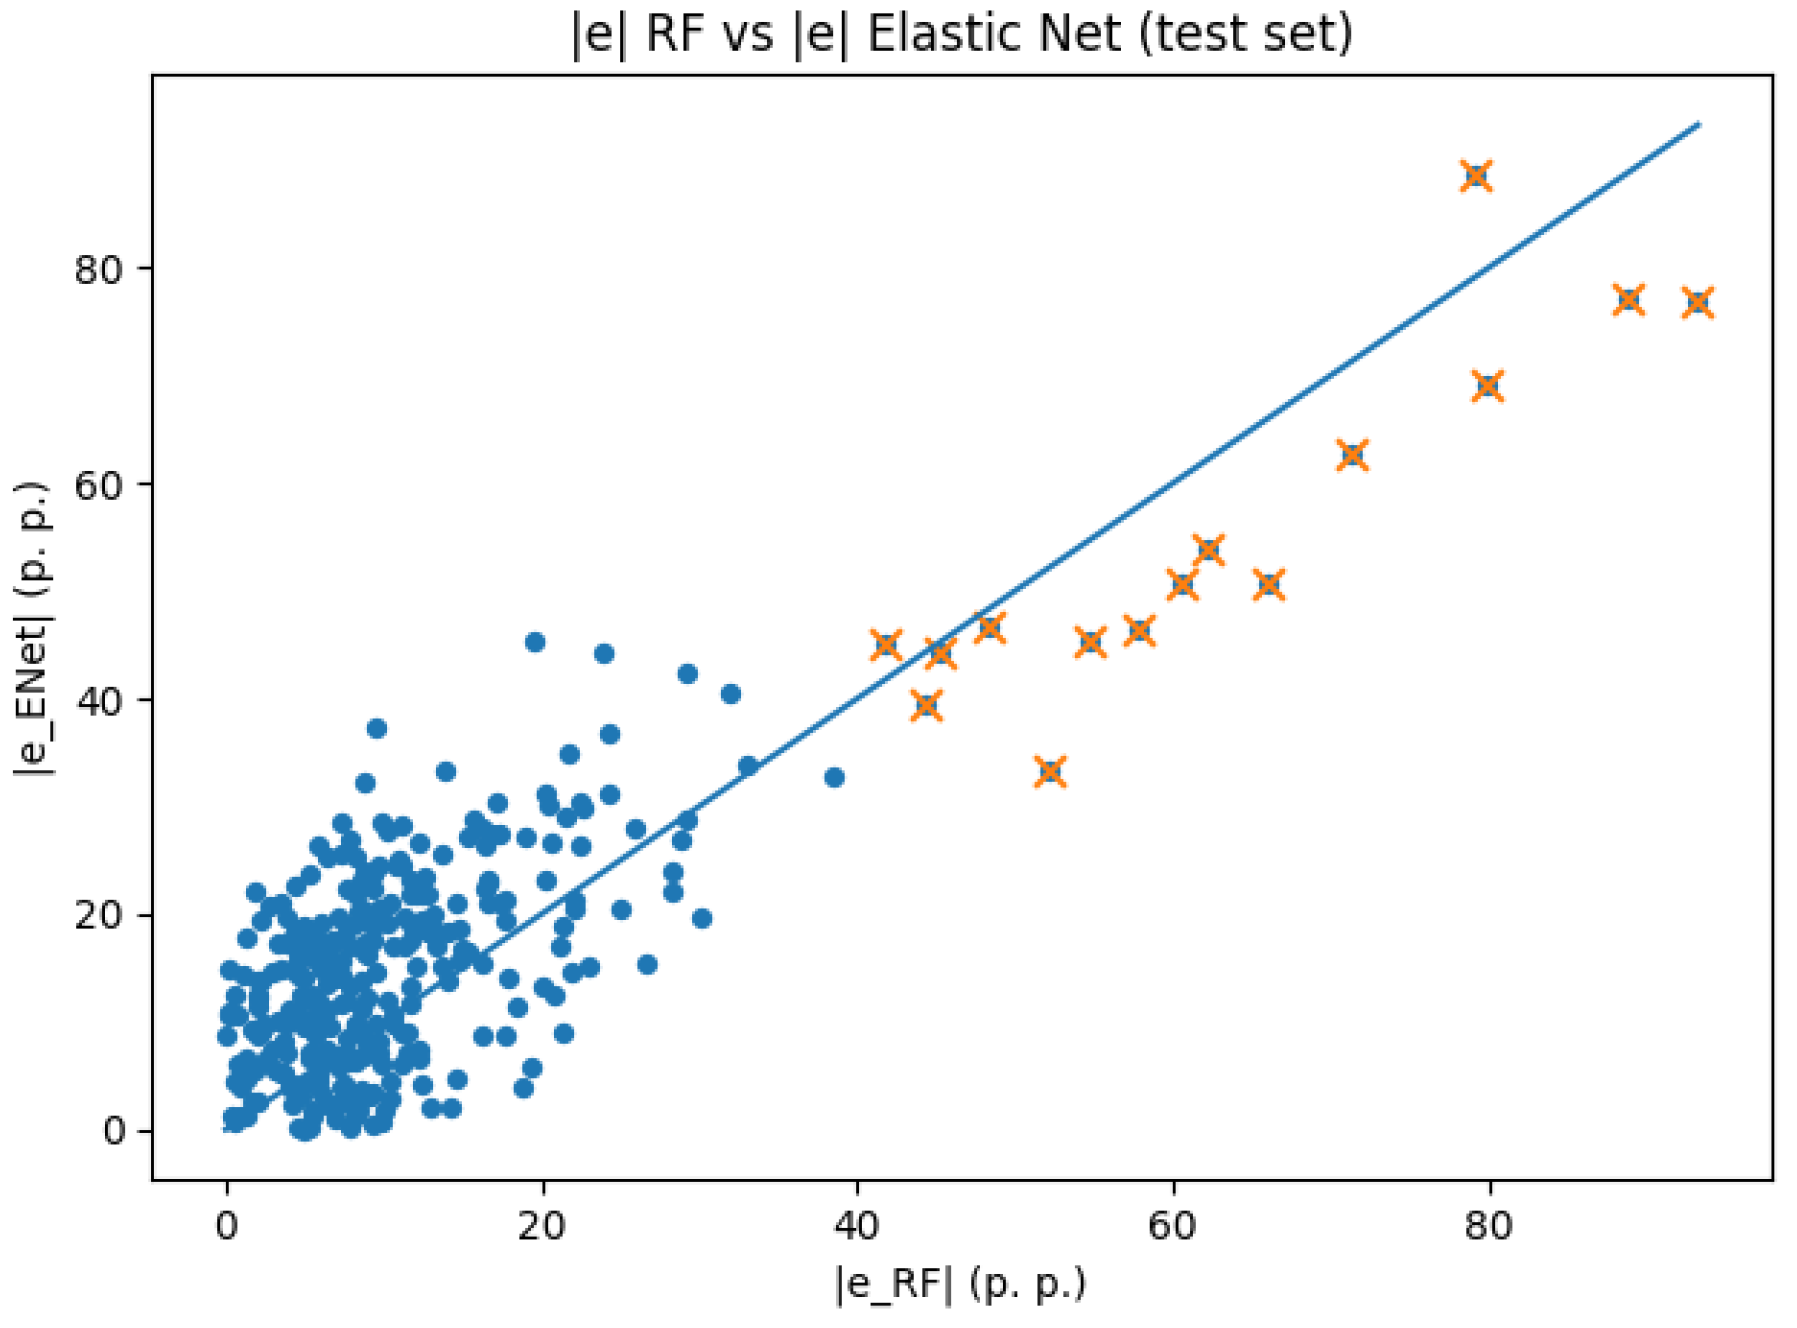
Figure 15 compares the absolute error (AE) of RF and Elastic Net at the level of individual observations.
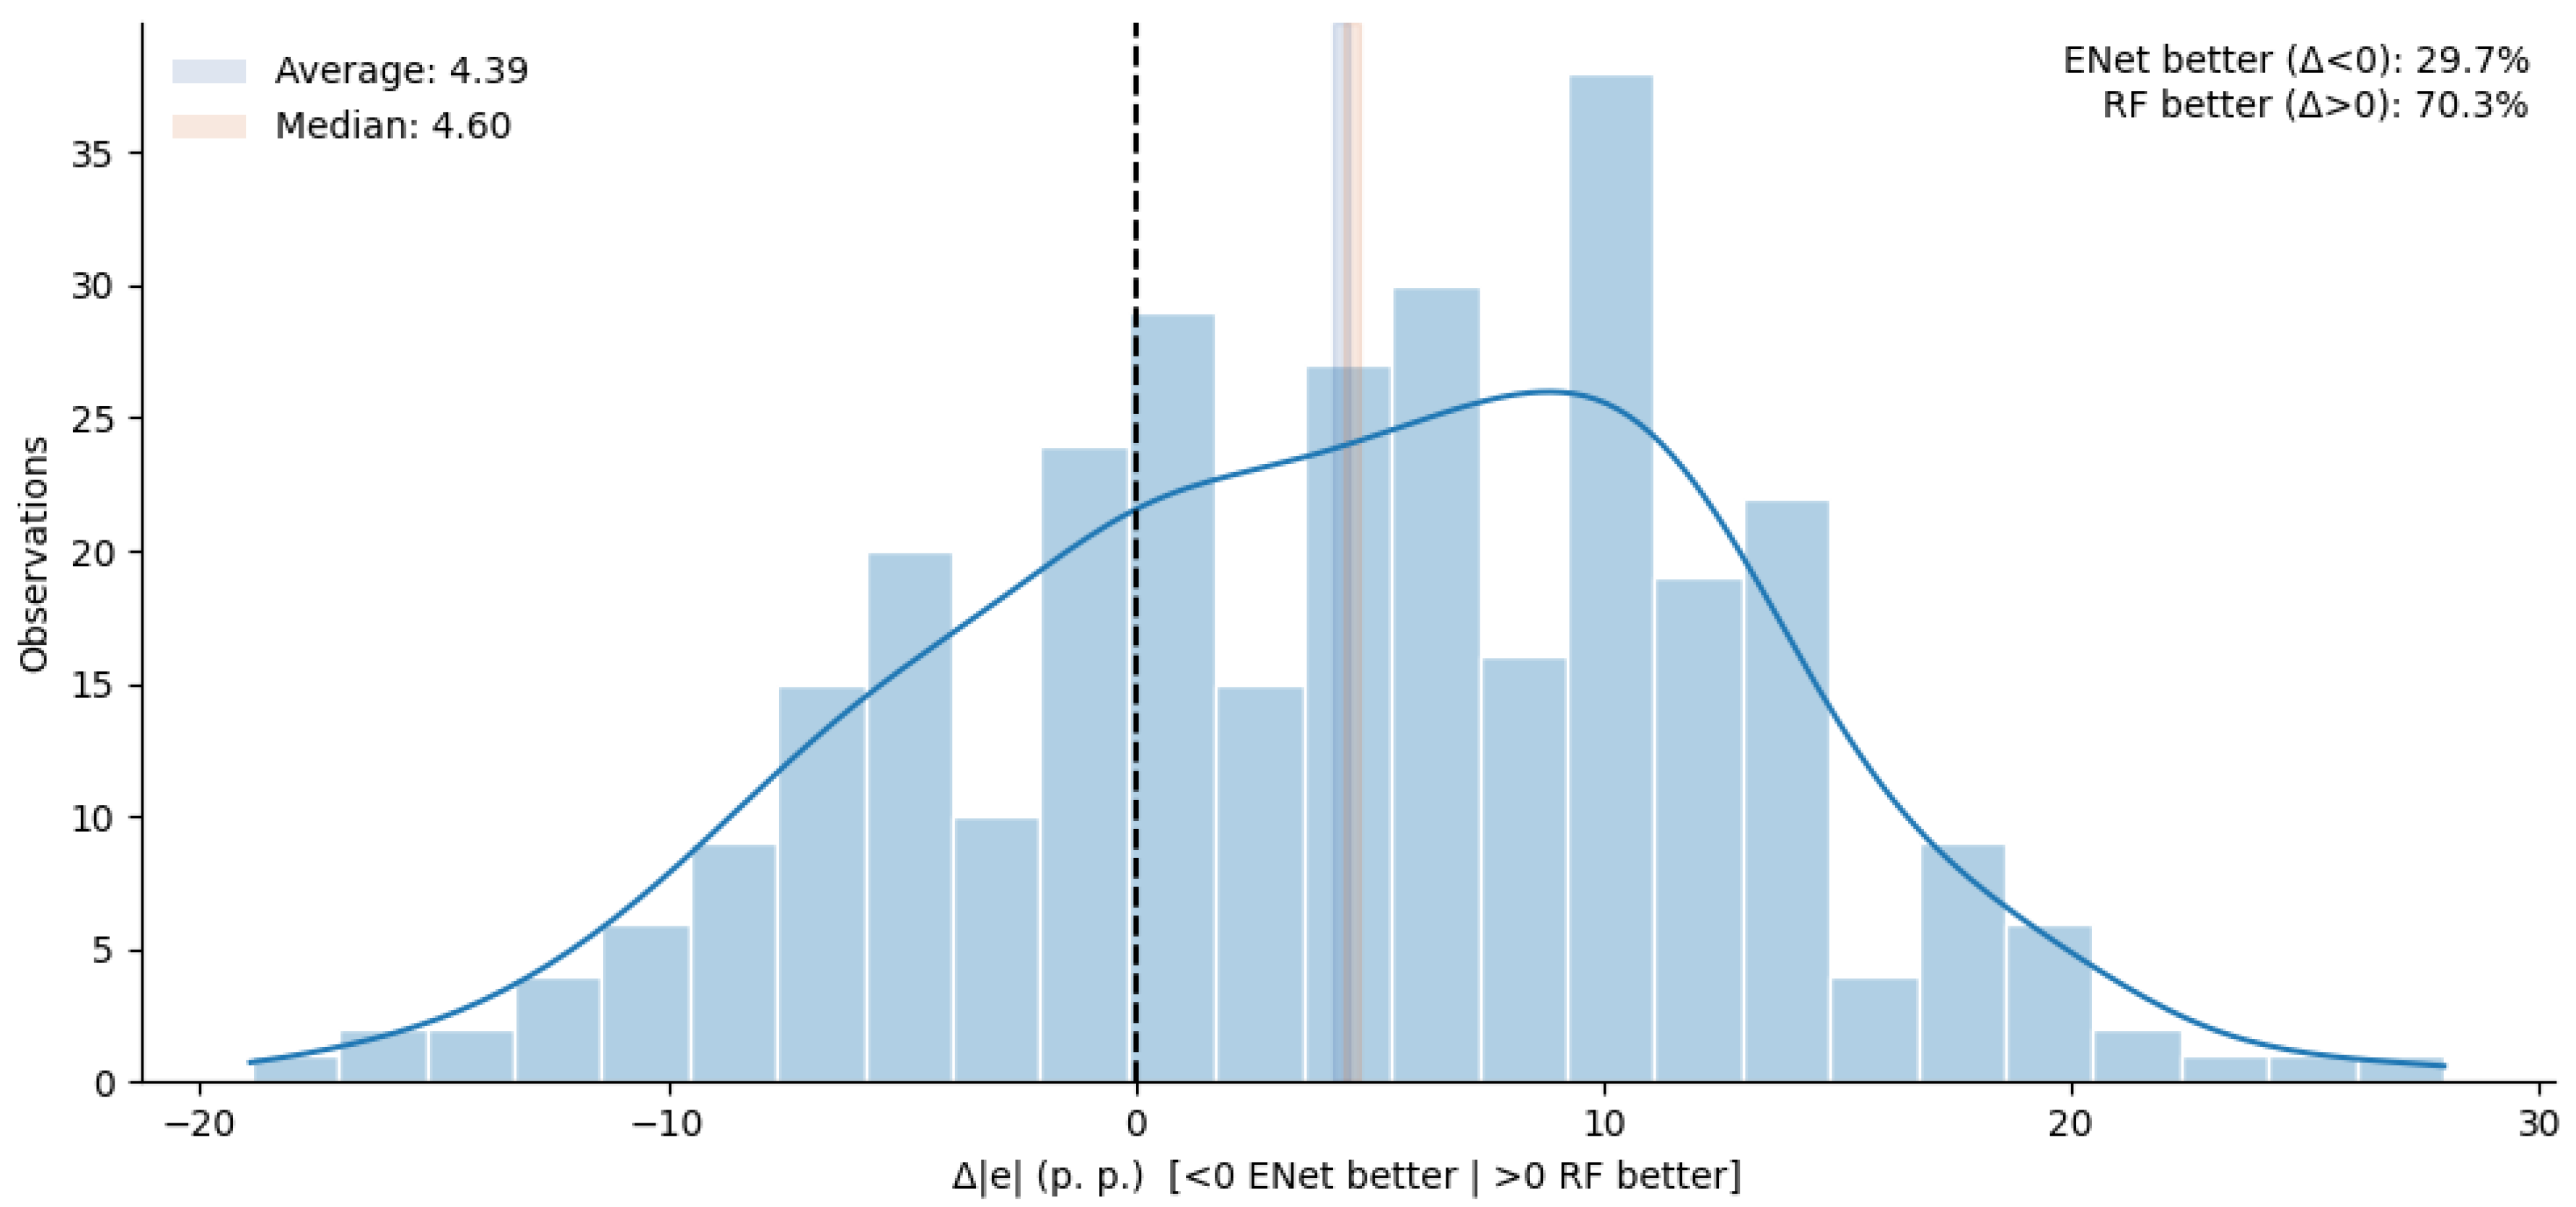
Points above the diagonal indicate lower RF error, below the diagonal lower Elastic Net error. An important finding is that the most problematic observations often remain challenging for both models, indicating either missing information in the predictors or specific factors that the questionnaire does not capture. While Random Forest is generally more accurate, the plot also reveals a meaningful trade-off in the extremes: in a subset of the most severe underestimation cases, Elastic Net occasionally reduces the error (sometimes by several percentage points), although this improvement is not systematic and does not overturn the overall dominance of RF. Crucially, the cluster of the most problematic observations remains located in a region of high error for both models, indicating that these cases are difficult given the available predictors rather than being a weakness of one specific algorithm. This comparison is quantified more directly in the next figure by analyzing the distribution of the error difference Δ|e| = |e_ENet| − |e_RF| across the full test set.
The Δ|e| distribution confirms that Random Forest improves accuracy for the majority of observations: RF achieves lower absolute error in approximately 70.3% of test cases, whereas Elastic Net is better in 29.7% (see
Figure 16). The average improvement is about 4.39 p.p. (median 4.60 p.p.), implying that RF typically reduces absolute error by roughly 4–5 percentage points relative to the linear baseline. At the same time, the existence of a non-trivial minority where Elastic Net better highlights residual heterogeneity and motivates an interpretability-focused analysis of the RF model—i.e., identifying which predictors dominate predictions and how their effects behave across the feature space.
4.4.4. Predictor Relationship Diagnostics
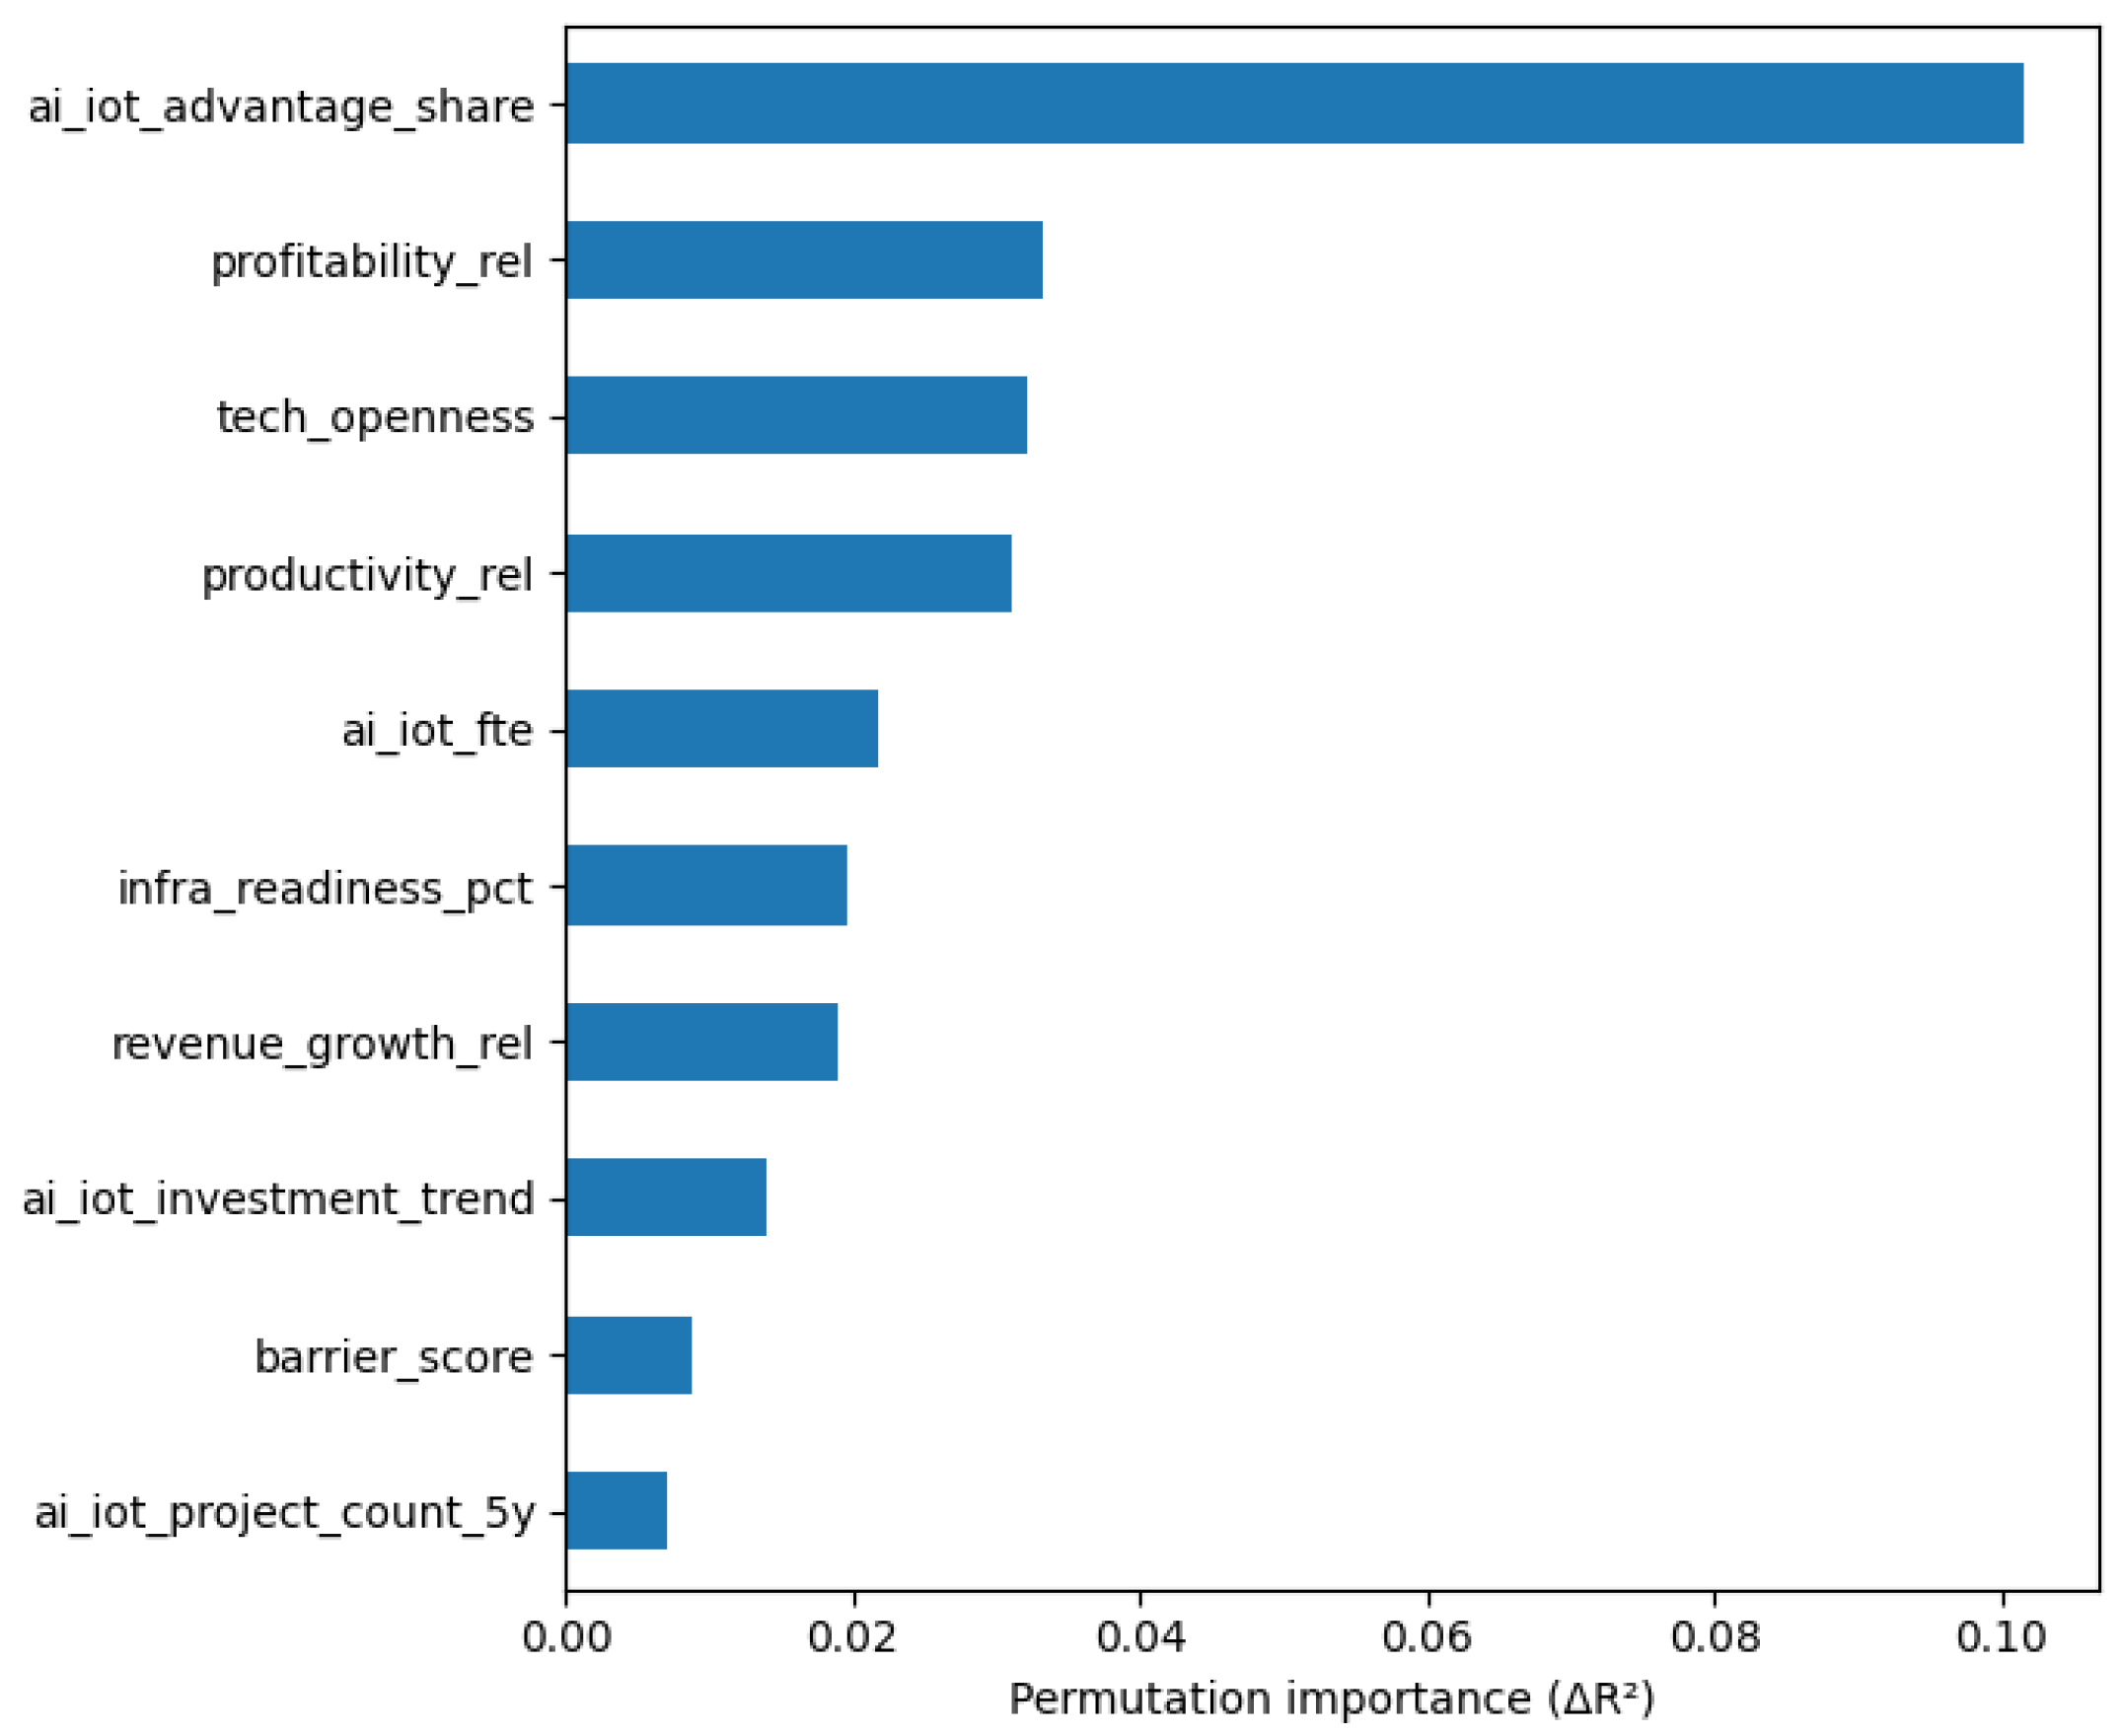
Permutation importance in
Figure 17 expresses the performance decline (ΔR
2) after permuting the variable.
The results consistently highlight the importance of ai_iot_advantage_share. Other important predictors include relative performance and profitability, technological openness, investment trend, technological readiness, and barriers.
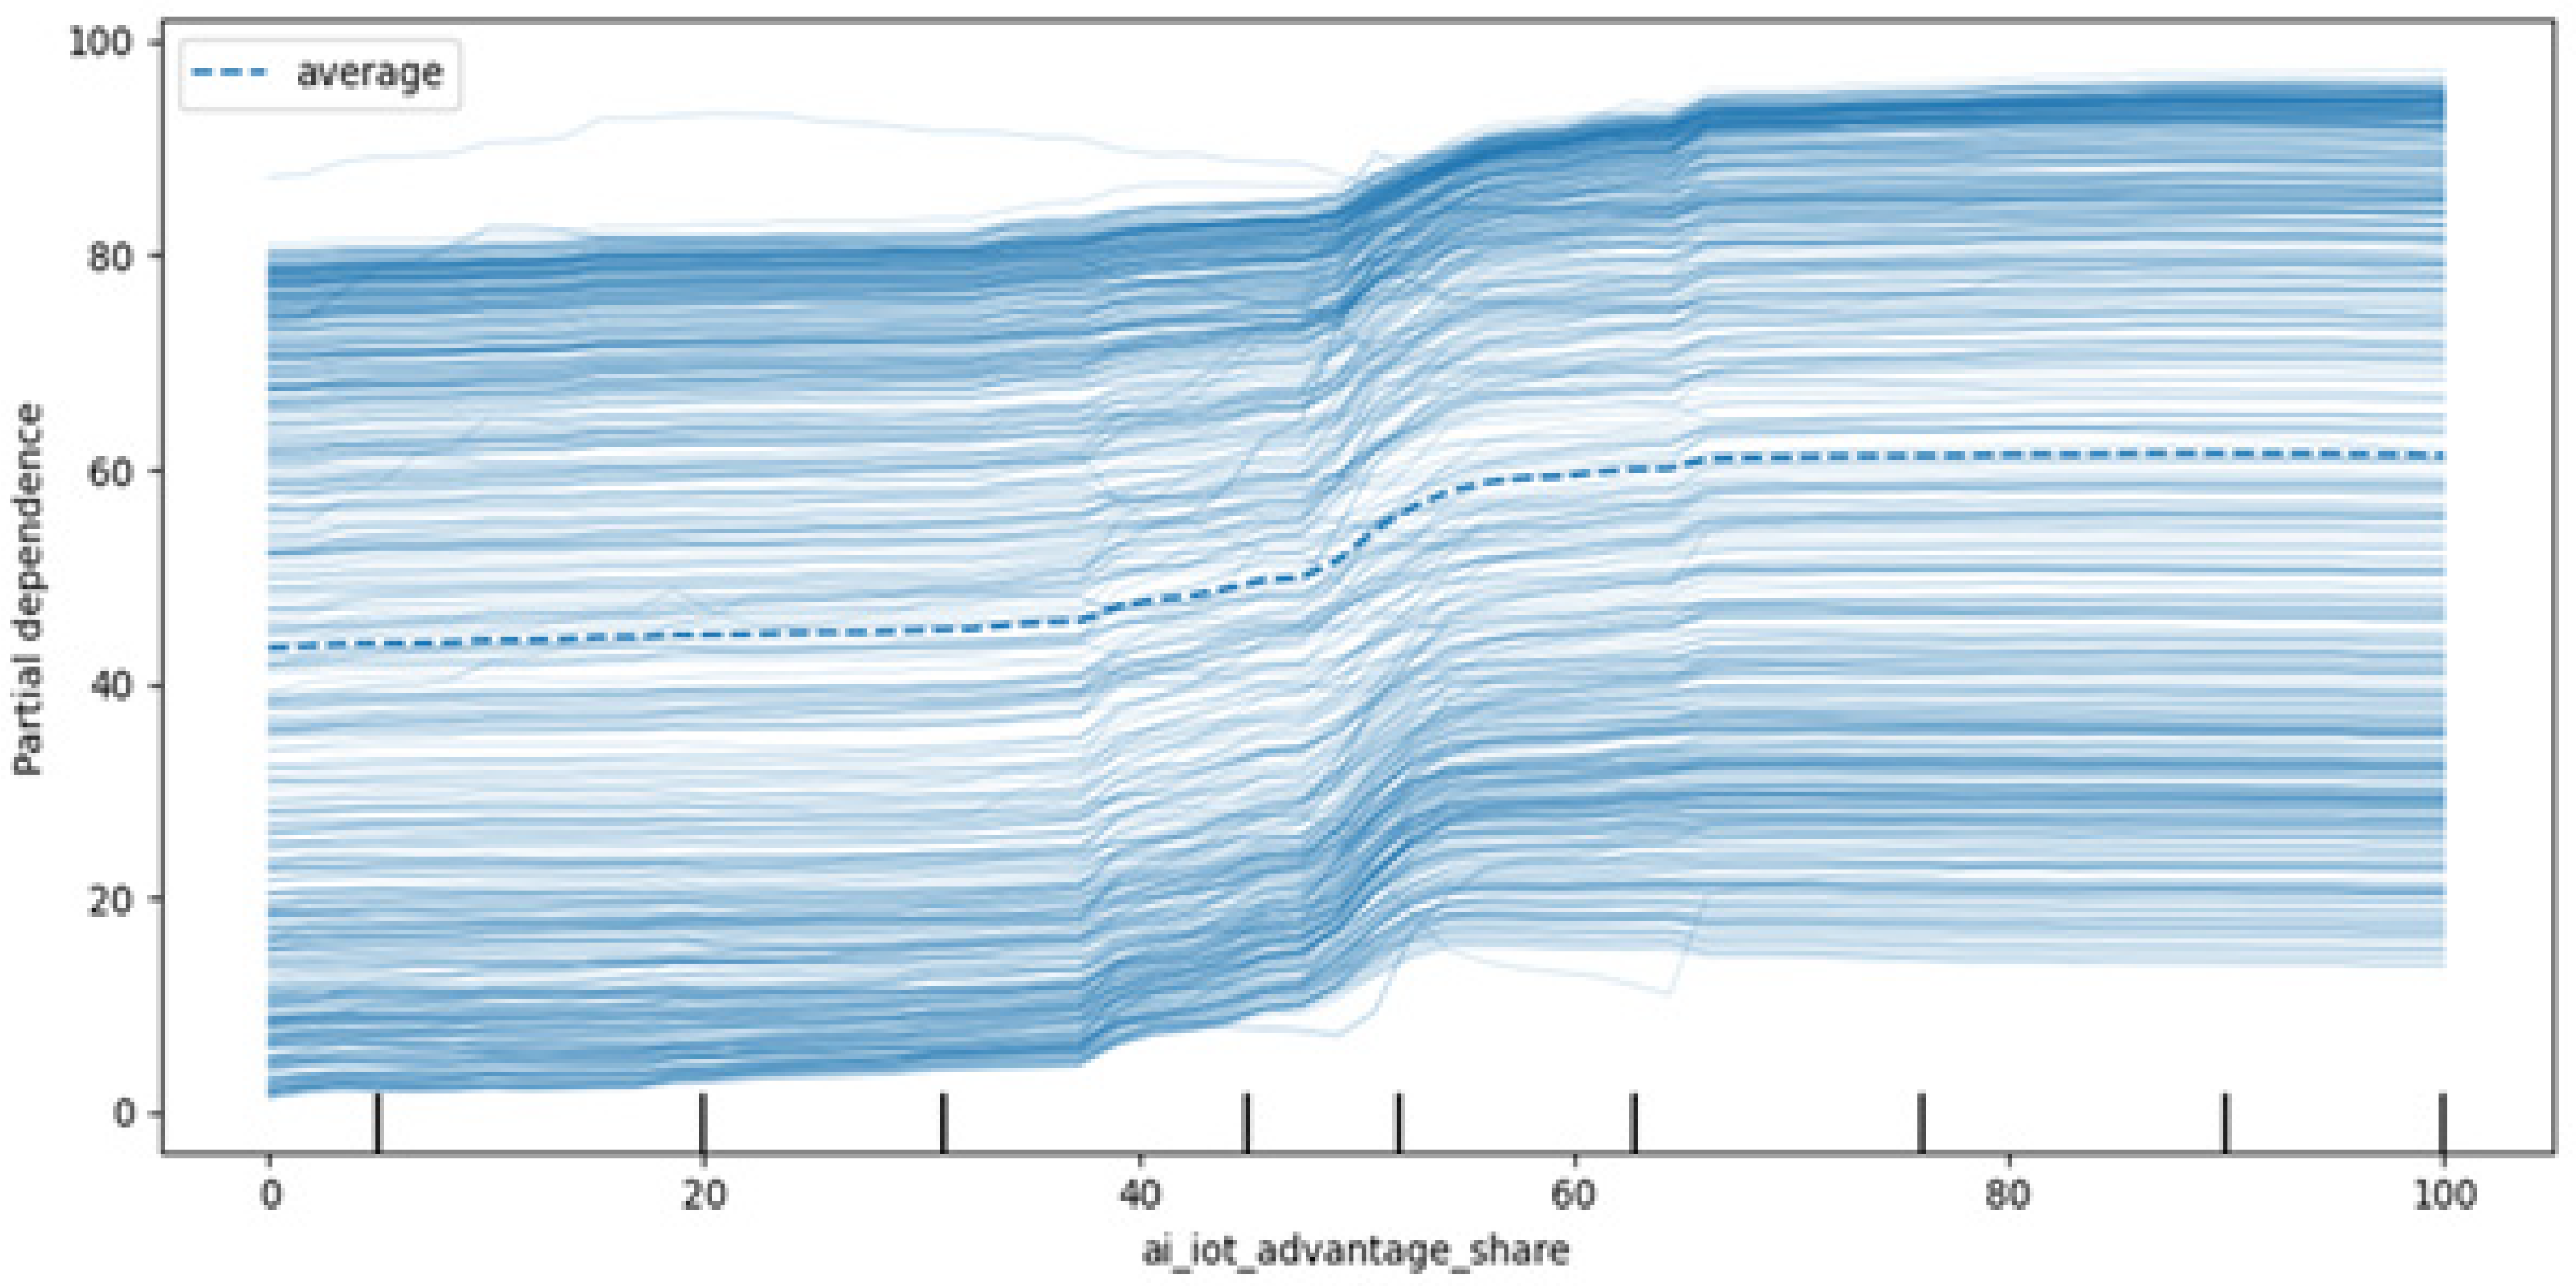
Figure 18 shows PDP + ICE for ai_iot_advantage_share.
The key phenomenon is the threshold shift in the mid-range (around 50–60) and saturation at higher values (diminishing returns). ICE curves reveal the heterogeneity in the predictive relationship: for the same advantage_share, companies can have different predicted levels, which is an indicator of interactions with other variables.
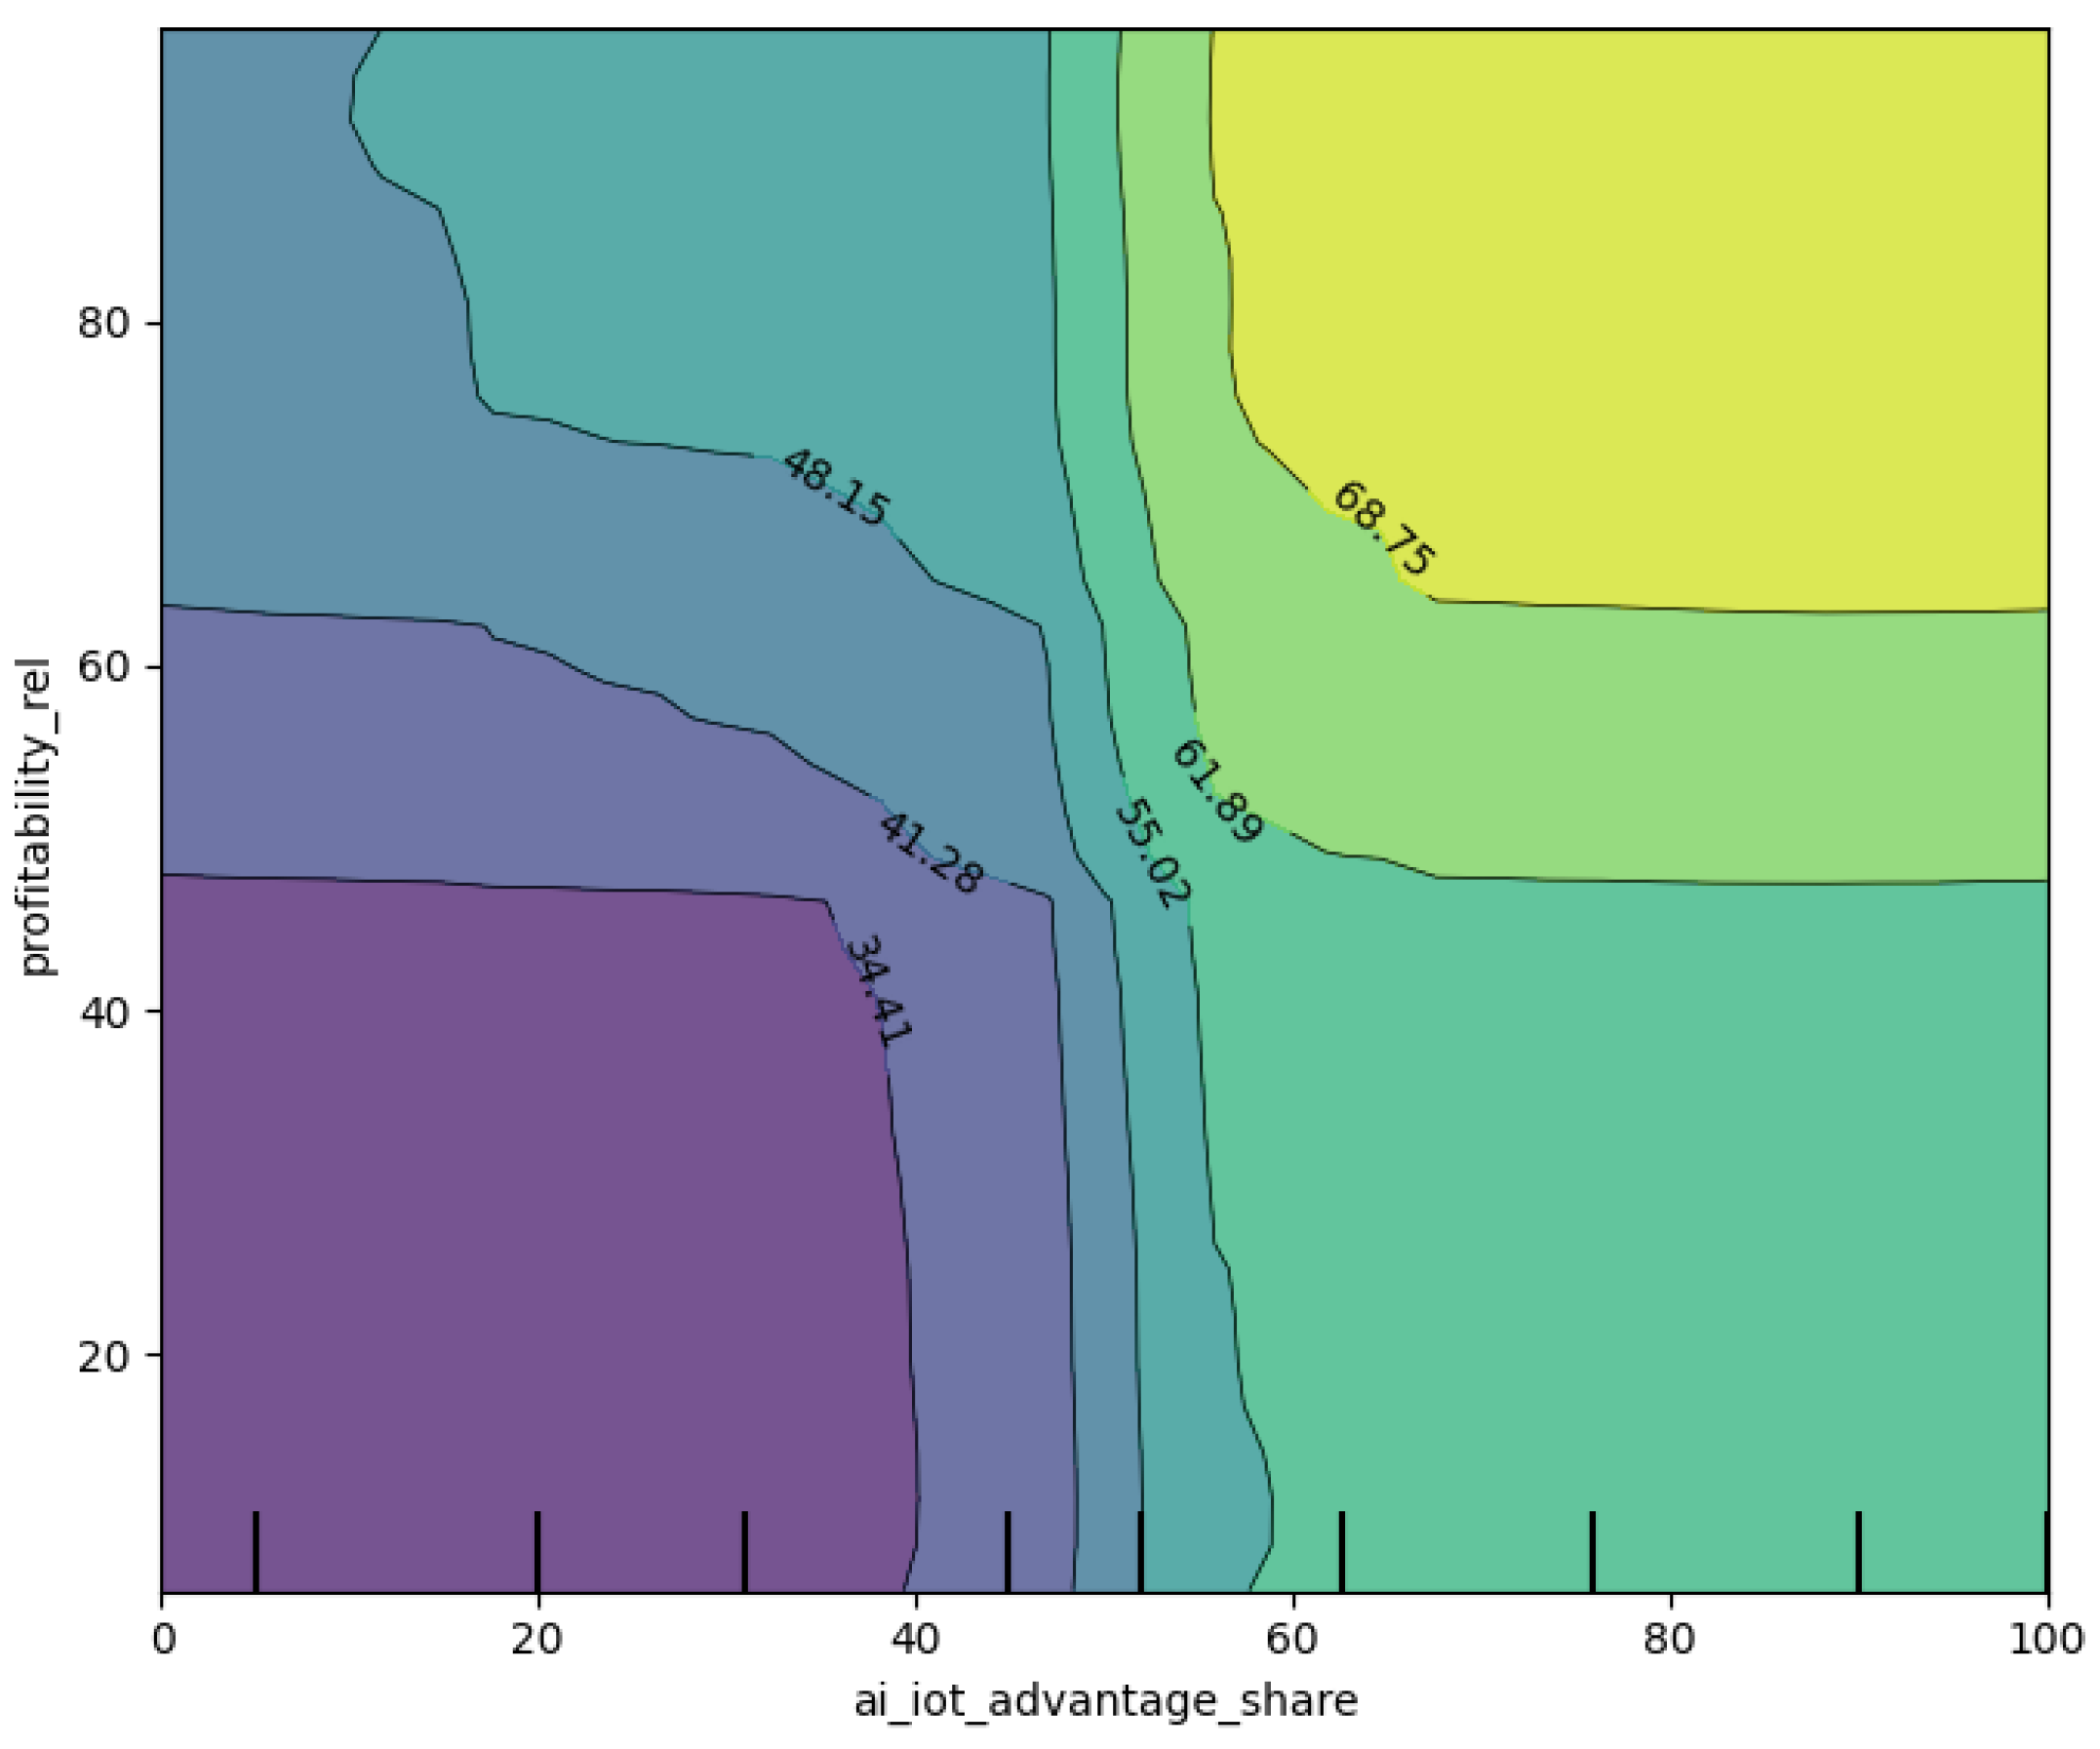
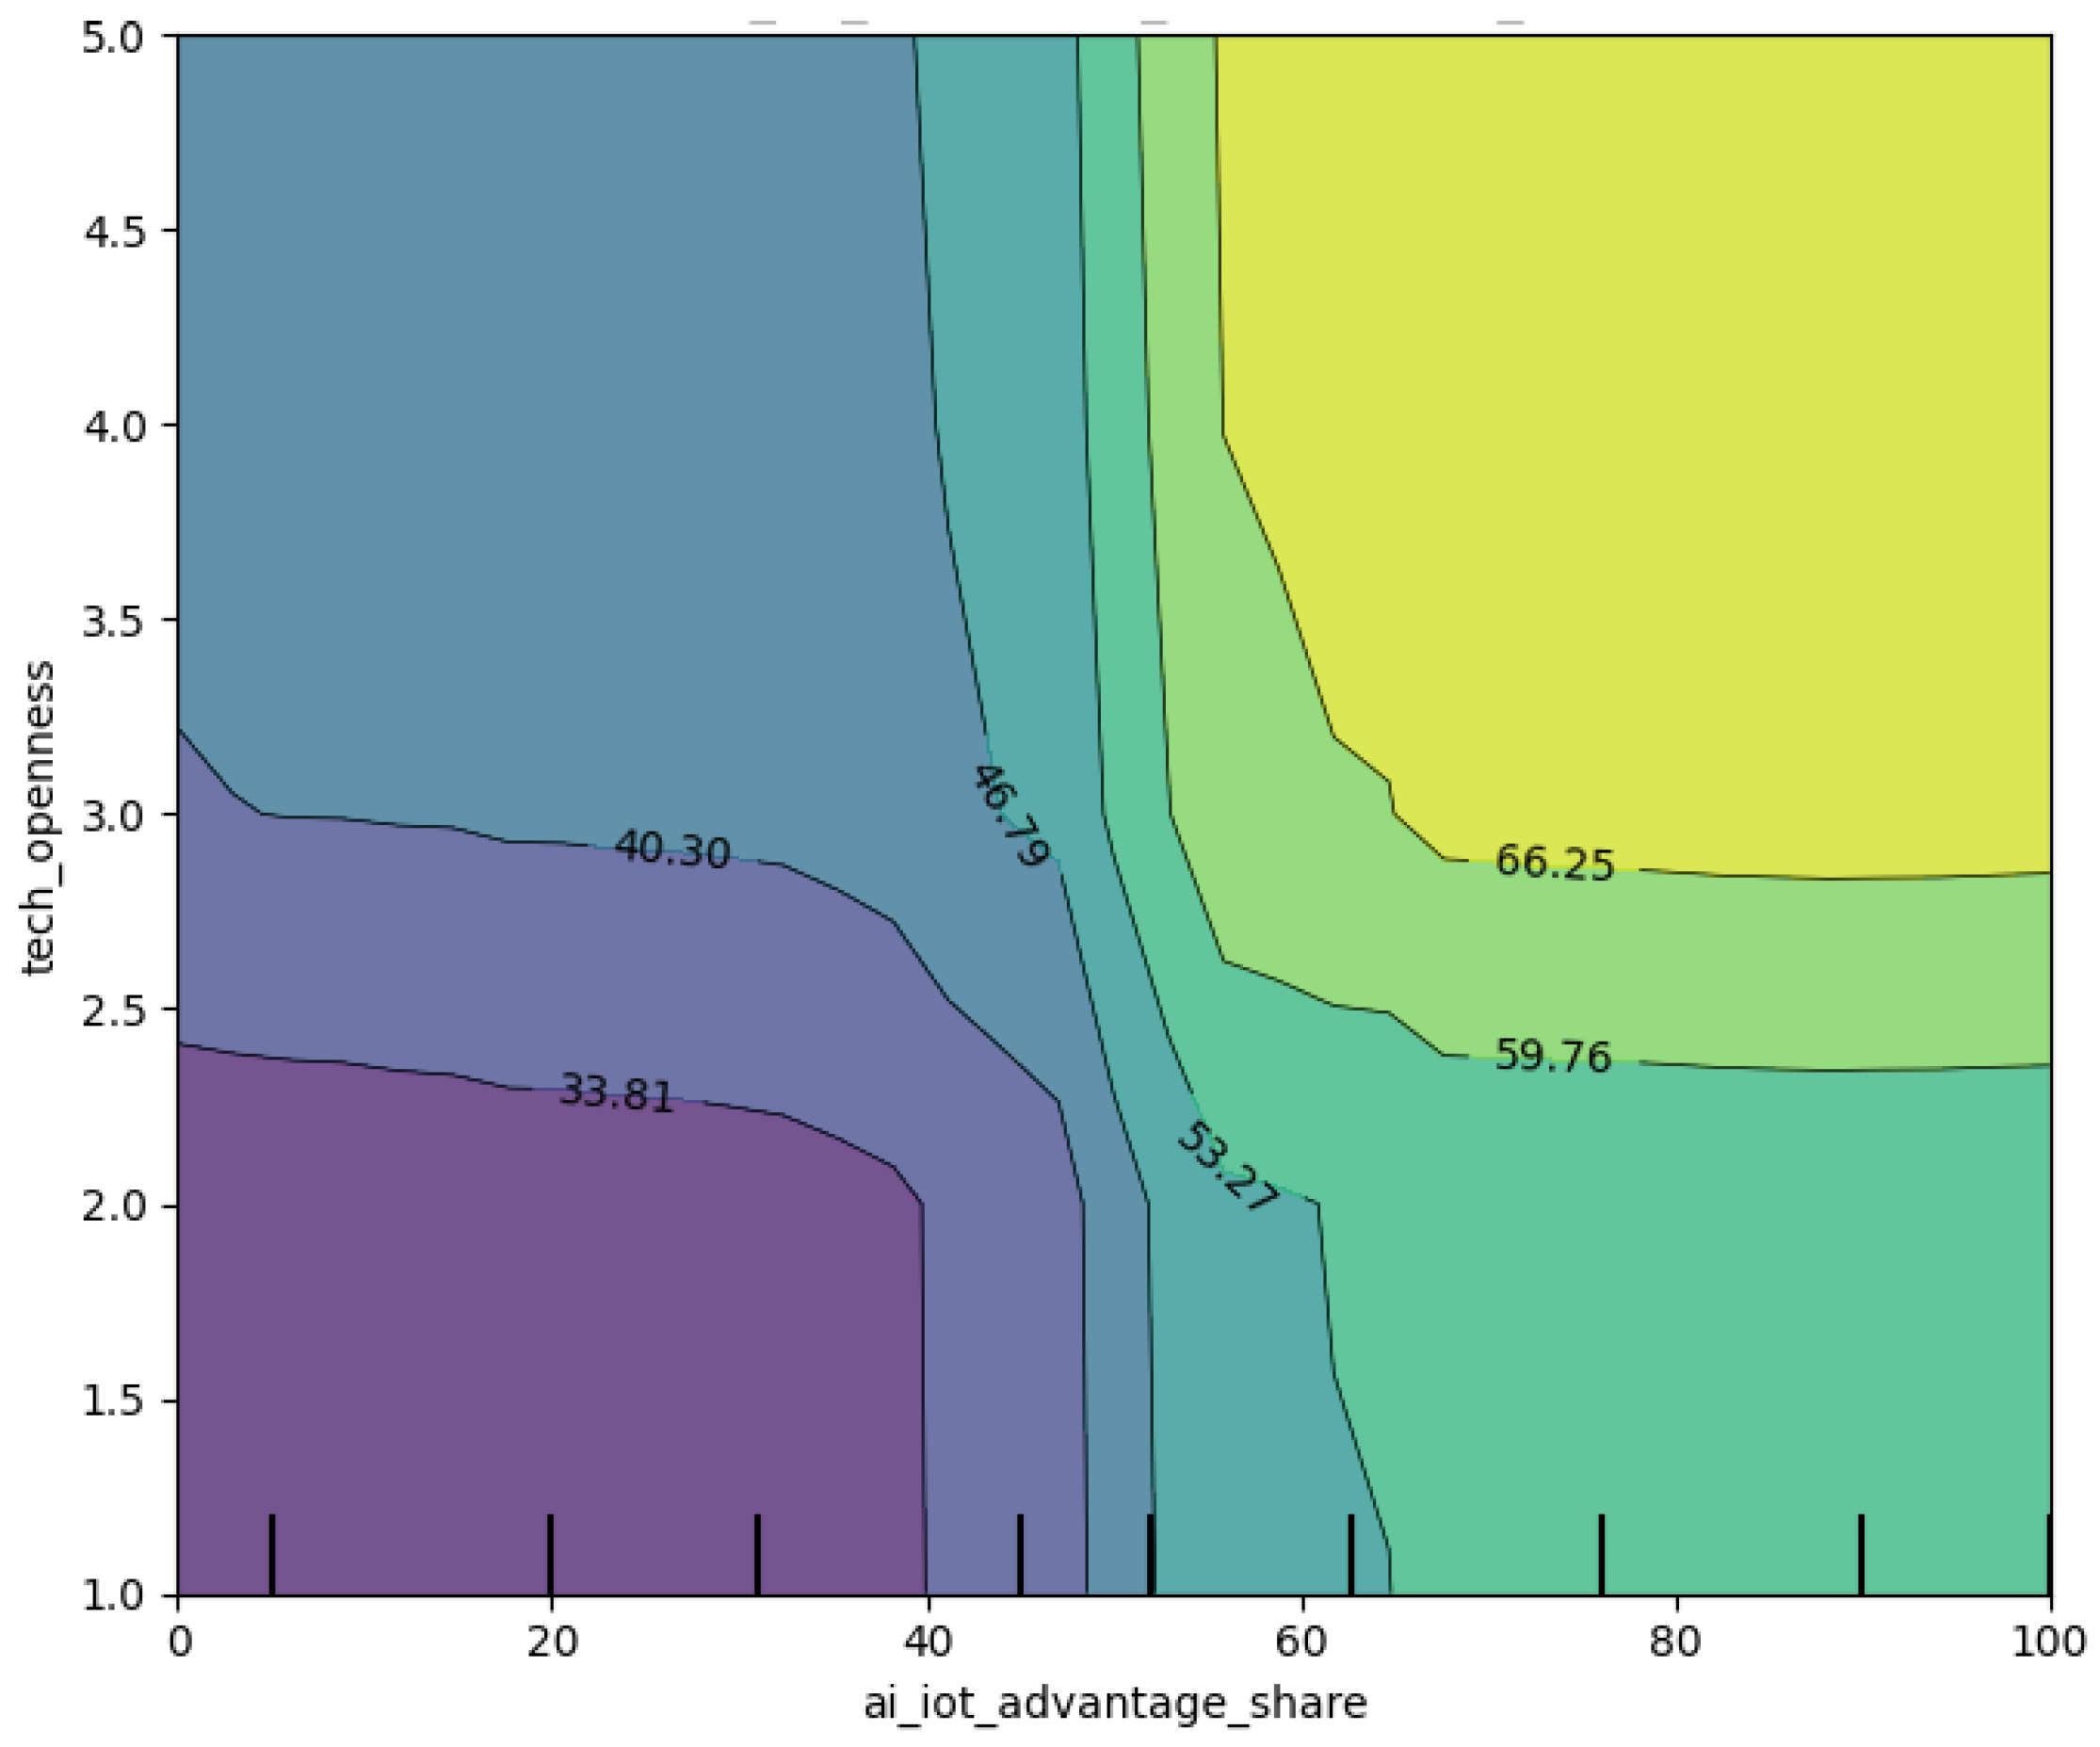
The 2D PDP (
Figure 19 and
Figure 20) demonstrates how the advantage_share threshold-like pattern varies with profitability_rel and tech_openness.
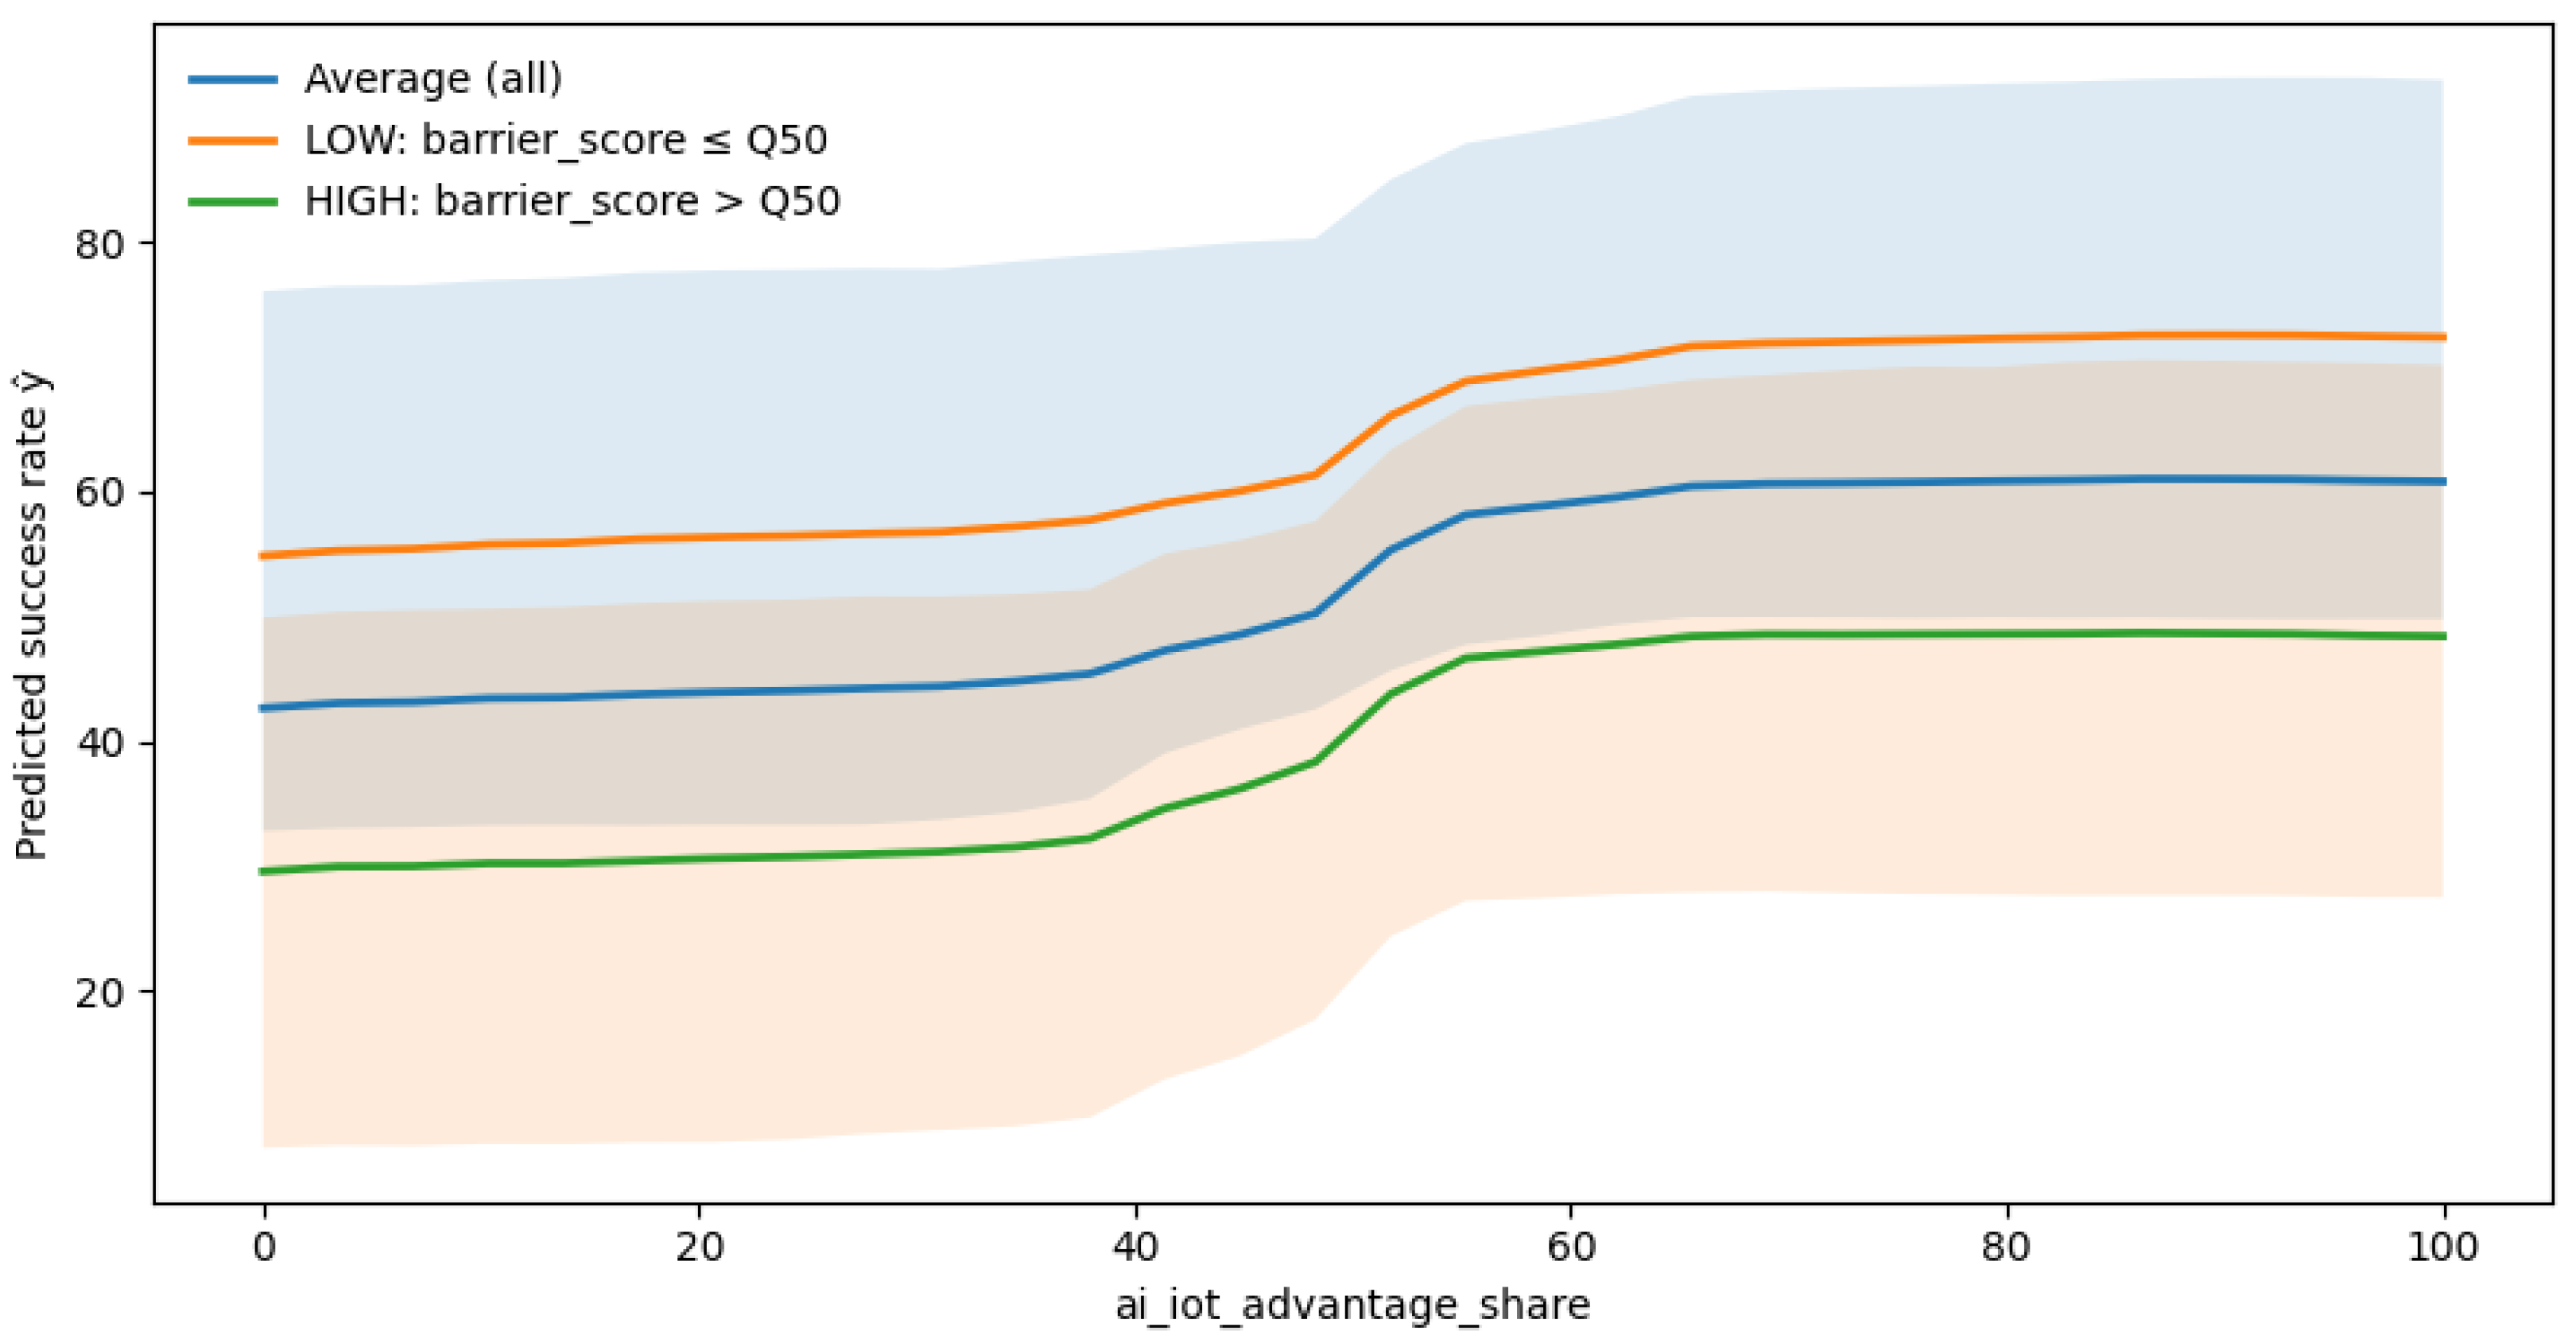
Across both interaction plots, the dominant feature of the response surface is the threshold-like transition in ai_iot_advantage_share around the mid-range (approximately 50–60) in which predicted success increases markedly and then gradually saturates. The second variable in each 2D PDP primarily acts as a level shifter: higher profitability_rel and higher tech_openness raise the predicted success rate across a wide range of advantage values, with the effect becoming most visible once the firm has already crossed the advantage threshold. In other words, profitability and technological openness amplify the “high-success regime,” but the key switch between low and high predicted success remains anchored in ai_iot_advantage_share. Group ICE curves by barrier_score (top negative predictor) are in
Figure 21.
The grouped ICE curves show that the barrier_score systematically differentiates predicted success: firms with higher barriers (HIGH group) exhibit a consistently lower predicted success rate across almost the entire range of ai_iot_advantage_share. Importantly, the threshold-like pattern in ai_iot_advantage_share is visible in each group, indicating that barriers do not remove the advantage-related transition pattern. Instead, they operate mainly as a downward shift of the curve, effectively limiting the attainable success level even when advantage attribution is high. This pattern supports an interpretation of barriers as a practical bottleneck associated with lower predicted outcomes rather than with a change in the general direction of the advantage–success relationship.
The robustness of the performance was verified by repeatedly refitting the model on multiple random splits. Average metrics: R2 = 0.8119 ± 0.0276; MAE = 11.7907 ± 0.5171 p. p.; RMSE = 16.4214 ± 1.1890 p. p. The result indicates stability of the performance and supports generalization beyond one specific split.
5. Discussion
The results consistently identify ai_iot_advantage_share as the most informative predictor of the reported AI/IoT success rate. This consistency is visible across complementary perspectives: Elastic Net assigns it the strongest positive coefficient among all retained predictors, the Decision Tree uses it as the root split, and Random Forest permutation importance identifies it as the single most influential variable for out-of-sample prediction. At the level of interpretation, this pattern suggests that enterprises reporting clearer business value from AI/IoT also tend to report higher AI/IoT success rates. This interpretation is consistent with empirical studies conducted in the French [
49] and Indonesian [
50] entrepreneurial environments, which also emphasize the importance of linking digital technologies to business value and strategic decision-making.
Beyond the ranking of predictors, the best-performing Random Forest model reveals an important nonlinear structure in the predictive relationship linked to ai_iot_advantage_share. PDP/ICE analyses indicate a critical transition zone in the mid-range (approximately 50–60), where predicted success increases most steeply, followed by a saturation region where additional increases in advantage attribution generate only marginal gains. From a managerial perspective, this suggests that moving from low or unclear value attribution toward more credible and measurable value realization may be associated with the largest change in predicted outcomes, whereas further increases at already high levels are linked to diminishing incremental changes [
51,
52,
53,
54].
The broader predictive structure also suggests that perceived advantage does not operate in isolation. Relative performance indicators (profitability, productivity, and growth) and readiness-related variables (technological openness, infrastructure readiness, investment dynamics, and capacity proxies such as AI/IoT FTE) appear among the most informative predictors in the models. Conversely, higher barrier_score values are associated with lower predicted success across a wide range of advantage values. In this sense, the results are compatible with an interpretation in which reported success patterns in the data are associated with value realization, organizational readiness, and implementation constraints. This reading is also broadly in line with prior evidence from the V4 region [
16,
23].
However, the present findings are only partly aligned with studies that emphasize primarily industry-specific AI/IoT benefits and application-level differences. Prior research shows that AI/IoT may create value through different mechanisms across industries and functions, while manufacturing evidence further suggests that adoption varies by production area, company size, and Industry 4.0 readiness [
48,
55]. By contrast, our models do not identify sectoral or use-domain affiliation as the dominant predictive signal. Instead, the strongest and most stable predictors are cross-cutting factors-perceived value realization, organizational readiness, and lower barriers, which are more consistent with enterprise IoT maturity research stressing technological, organizational, and human preparedness [
26,
27]. Nevertheless, industry still matters, though mainly through the maturity, resource base, and implementation conditions it brings rather than as an automatic guarantee of AI/IoT success.
At the same time, these findings should be interpreted as predictive and associational rather than causal. The models identify variables that are informative for predicting reported AI/IoT success within the available enterprise survey data, although they do not establish causal effects or temporal forecasting of future project outcomes. Therefore, the practical value of the findings lies primarily in screening, benchmarking, and structured managerial reflection rather than in causal attribution.
6. Conclusions
This study developed and evaluated a company-level predictive framework for the reported success rate of AI/IoT initiatives in business practice, operationalized as ai_iot_success_rate on a bounded 0–100 scale. Using a structured out-of-sample evaluation design that combines a transparent regularized linear baseline (Elastic Net) with nonlinear machine-learning models (Decision Tree and ensemble approaches), the analysis shows that the reported success of AI/IoT initiatives can be predicted more accurately when nonlinear patterns are taken into account. Across model families, ai_iot_advantage_share emerges as the most informative and most stable predictor, while Random Forest achieves the strongest out-of-sample predictive performance among the tested models.
The model-inspection results further suggest that the association between perceived AI/IoT advantage and predicted success is not purely linear. The largest changes in predicted success are concentrated around a mid-range transition zone (approximately 50–60), after which the relationship gradually saturates. In addition, readiness-related and performance-related variables, such as profitability, productivity, growth, infrastructure readiness, technological openness, investment trend, and capacity-related variables, also contribute meaningfully to prediction. Higher barrier levels, by contrast, are associated with lower predicted success across a broad range of advantage values.
Taken together, these findings provide a useful basis for enterprise-level screening and managerial reflection. In practical terms, firms may benefit from monitoring whether AI/IoT initiatives are linked to clearly perceived business value, whether the organizational environment is sufficiently prepared for implementation, and whether major barriers are constraining reported outcomes. In this sense, the predictive framework may serve as a decision-support and risk-screening tool rather than as a basis for causal claims about what definitively produces success.
Several limitations follow from the nature of the data and the measurement of the dependent variable. First, the outcome (ai_iot_success_rate) is reported on a bounded 0–100 scale, and diagnostic results indicate pronounced floor/ceiling effects and residual structures that are, to a meaningful extent, mechanically induced by the bounded scale and the higher incidence of extreme values typical for questionnaire data. Second, the study relies on a cross-sectional, self-reported enterprise survey, which limits both causal interpretation and measurement precision. Several predictors and the dependent variable are based on managerial self-assessments and simplified questionnaire indicators, which may not fully capture the multidimensional nature of constructs such as implementation quality, organizational readiness, governance maturity, or realized AI/IoT success. As a result, the identified relationships should be interpreted as predictive and associational patterns conditional on the available indicators rather than as precise estimates of underlying causal effects. In addition, because key predictors and the outcome were collected from the same respondents using the same survey instrument, the study cannot fully exclude common-source inflation (common method bias). This means that some observed relationships may be amplified by shared response tendencies, perceptual consistency, or respondent-specific evaluation styles rather than solely by the underlying organizational reality. Reverse causality also cannot be ruled out. Third, the error analysis revealed a small subset of extreme failures, particularly cases where companies report very high realized success while models predict low values. These observations are not explained solely by multivariate outlierness and likely reflect latent success mechanisms not captured by the questionnaire (e.g., implementation quality, project type, governance maturity, or specific managerial practices).
Future research should therefore expand the predictor set toward variables capturing implementation quality and process maturity (e.g., governance and change-management practices, data quality and integration maturity, project portfolio characteristics, and contextual sector/technology specifics). A longitudinal or panel extension would be particularly valuable for clarifying the temporal direction of relationships. From a methodological standpoint, it would also be useful to test alternative models tailored to bounded outcomes and to validate the predictive framework in additional countries or regions in order to strengthen external validity.