Article

Spatio-Temporal Analysis of Satellite Imagery (NDVI) to Identify Terroir and Vineyard Yeast Differences according to Appellation of Origin (AOP) and Biogeographic Origin

1
Instituto Tecnológico Agrario de Castilla y León (ITACyL), Unidad de Cultivos Leñosos y Hortícolas, 47071 Valladolid, Spain
2
Estación de Viticultura e Enoloxía de Galicia (EVEGA-AGACAL), Ponte San Clodio s/n, 32428 Leiro-Ourense, Spain
*
Authors to whom correspondence should be addressed.
J 2021, 4(3), 244-256; https://doi.org/10.3390/j4030020
Submission received: 31 May 2021 / Revised: 18 June 2021 / Accepted: 24 June 2021 / Published: 28 June 2021
(This article belongs to the Section Engineering)

Abstract

:
Terroir is one of the core concepts associated with wine and presumes that the land from which the grapes are grown, the plant habitat, imparts a unique quality that is specific to that growing site. Additionally, numerous factors can influence yeast diversity, and terroir is among the most relevant. Therefore, it can be interesting to use Remote Sensing tools that help identify and give helpful information about the terroir and key characteristics that define the AOP (Appellation of Origin). In this study, the NDVI (Normalized Difference Vegetation Index) calculated from Landsat 8 imagery was used to perform a spatio-temporal analysis during 2013, 2014, and 2015 of several vineyards belonging to four different AOP in Galicia (Spain). This work shows that it is possible to use Remote Sensing for AOP delimitation. Results suggest: (i) satellite imagery can establish differences in terroir, (ii) the higher the NDVI, the higher the yeast species richness, (iii) the relationship between NDVI, terroir, and yeasts shows a stable trend over the years (Pearson’s r = 0.3894, p = 0.0119).

Graphical Abstract

1. Introduction

Worldwide, the average climatic conditions of wine regions determine, to a large degree, the grape cultivars that can be grown there, while wine production and quality are chiefly influenced by site-specific factors, production practices, and short-term climate variability [1]. These factors can be captured within the terroir definition. Terroir (terruño, in Spanish) is one of the core concepts associated with wine. It is a French term that describes how the environment, farming practices, crop characteristics, and cultural elements of a place affect grape and wine production, combined in a specific way that cannot be replicated in any other place. This concept is the basis of the French wine appellation d’origine contrôlée (AOC) system, which is a model for wine appellation and regulation in France and around the world. It is also known as Apelación d’Origine Protégée (AOP, Appellation of Origin) in the European Union, as Designation of Origin (in English), and as Denominación de Origen (DO, Denomination of Origin) in Spanish. This system presumes that the land from which the grapes are grown, the plant habitat, imparts a unique quality specific to that growing site [2].
According to European Union regulations, any group of wine producers can apply to establish an AOP by giving reasons and proofs for the request, including full details of the terroir, among others. Terroir seems to play a critical role in the quality of wines, and AOP boundaries are fixed according to geological, topographical, morphological, and agro-pedological criteria. Terroir affects the chromatic characteristics of wines and clearly affects the phenolic composition [3]. Furthermore, tasting confirms, without doubt, these differences according to the nature of the terroir [4]. Therefore, it could be interesting to develop and use tools that help to identify and give helpful information about the terroir and key characteristics that define the AOP, not only for the European production model, mainly based on Appellations of Origin, but also for the emerging wine grape-producing countries, whose production is much more liberalized [5].
Remote sensing can be a valuable tool to achieve this goal, since it allows obtaining information quickly, accurately, objectively, and non-destructively [6]. Algebraic combinations of spectral information bands are helpful, such as the NDVI (Normalized Difference Vegetation Index) [7], which has proved to be a valuable tool in precision viticulture to classify vineyards according to their characteristics [8], monitor table grape quality characteristics [9], differentiate zones with respect to biomass, vine water status, and fruit and wine character [10], or estimate different specific zones according to grape maturity and quality parameters [11]. The NDVI has also been used to assess other crop parameters, including LAI [12], amount of vegetation [13], and even fruit quality parameters such as phenols [14].
Imagery can be obtained from various sources, such as UAV (unmanned aerial vehicle), aircraft, satellites, or proximal sensing. Each approach has its advantages and disadvantages. Aiming to work at the AOP scale level, satellite information can be handy because it can capture a large image of the entire area at once, so vineyards can be compared simultaneously. Moreover, sensors mounted on satellites usually have a better spectral and radiometric resolution and, as they are not usually repairable once launched, they have better electronics and redundancy [15]. Even a breakpoint was placed slightly above 5 ha, meaning that satellite images may be more convenient above such scale size [16]. Furthermore, some satellite images can be downloaded for free, such as Landsat 8 imagery, equipped with the Operational Land Imager (OLI) instrument. OLI is a visible and near-infrared (VNIR) multispectral sensor that operates from 400 to 2500 nm and provides reflectance products with a spatial resolution of 30 m and a revisit time of 16 days [17].
As previously stated, terroir gives wines their complexity [18]. It also affects yeast diversity by linking yeasts to a geographical area [19,20]; therefore, it is interesting to properly monitor the variables that compose terroir, such as yeast diversity, to improve wine quality [21]. The influence of a greater diversity of indigenous yeasts, especially non-Saccharomyces, has been amply demonstrated [22,23], and these biogeographical patterns of indigenous yeasts, specific to a given region, can improve the chemical–sensory characteristics of wines [20,24]. However, few studies have developed and related the concept of microbial terroir or yeast terroir to other disciplines, since this concept is controversial because it is still unclear how microbes contribute to terroir [25].
The oenological potential of non-Saccharomyces autochthonous yeasts has been reported, comparing yeast diversity in musts from organic and conventional production in four Denominations of Origin (AOP) from Galicia [26,27]. However, to our knowledge, this is the first work that aims to identify a spatio-temporal relationship between NDVI calculated from satellite imagery, terroir, and, more specifically, the biogeographic patterns of yeasts in vineyards of the northwest Iberian Peninsula.
The objective of the present study was to analyze the potential use of satellite multispectral imagery to detect differences in terroir and yeast population due to AOP according to NDVI variations, studying: (i) if satellite imagery can establish differences in terroir, (ii) the relationship between NDVI and yeast species richness, (iii) the temporal stability over the years between NDVI, terroir, and yeasts. Considering the inherent relationship between the terroir and the AOP, a spatio-temporal analysis was carried out between 14 vineyards belonging to 4 different AOP in Galicia (Spain). Several open-access multispectral images obtained from the Landsat satellite in 2013, 2014, and 2015 were used to calculate the NDVI (Normalized Difference Vegetation Index), which provides information about the vegetation within the vineyards, including vine canopy.

2. Materials and Methods

2.1. Satellite Imagery

Free-cloud Landsat 8 images from the study area (Figure 1) of 2013, 2014, and 2015 were downloaded and atmospherically corrected using the DOS1 algorithm. The selected months were July and August due to the proximity of veraison since, at this phenological stage (or even after), the relationship between leaf area and NDVI is greater [14,28]. Unfortunately, the image of august 2014 had to be changed to the immediately previous ones (25 July 2014) due to clouds.
The NDVI was used to perform the spatio-temporal analysis. NDVI is an index that allows quantifying the amount of vegetation of an area and its health. It relates the reflected radiation in the Red and Near-Infrared (NIR) bands of the electromagnetic spectrum (1).
N D V I = NIR Red NIR + Red

2.2. Vineyards

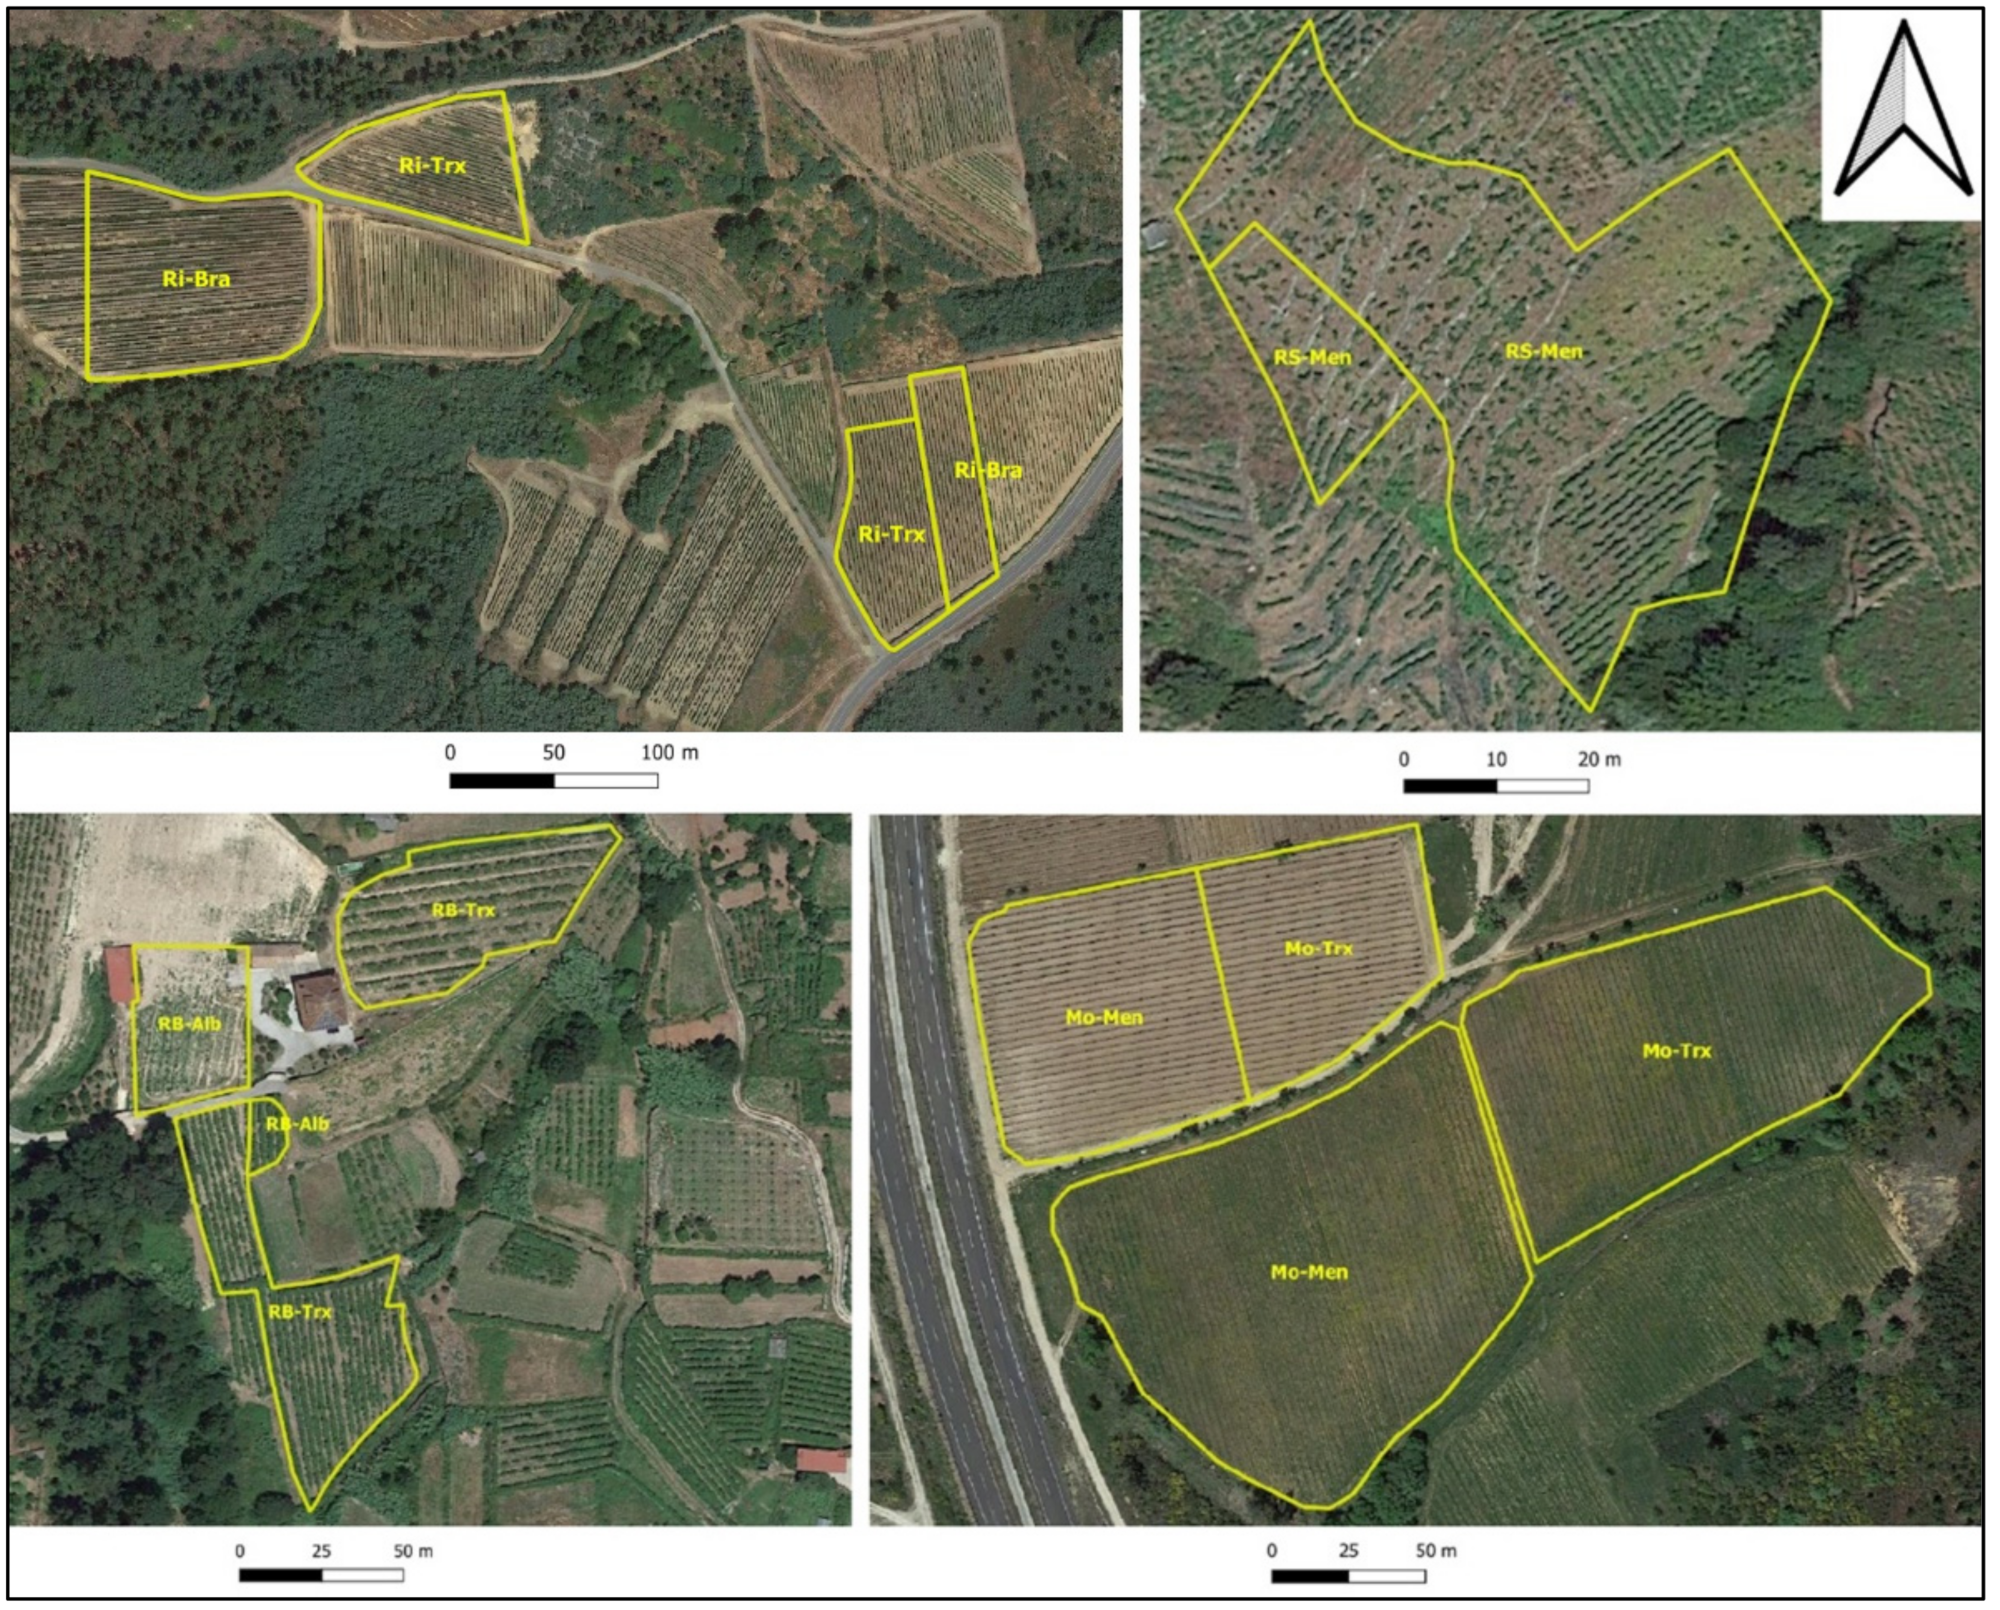
Grapes were harvested from 14 commercial vineyards planted with representative grapevine cultivars within 4 different AOP during 3 consecutive years (2013, 2014, 2015) in Galicia (Figure 1 and Figure 2). Table 1 shows the characteristics of the vineyards and grapevine cultivars used in this study. The vineyards have different characteristics and were under two different farming systems: organic and conventional There were one organic and one conventional vineyard per AOP and cultivar. Regular phytosanitary treatments were used depending on rainfall and management system: copper and plant extract treatments in organic, without herbicides, and traditional fungicides and herbicides in conventional management, in both cases managed according to each AOP protocol and legislation in force. Regarding soil and canopy management, there was non-irrigated vegetation cover in all vineyards, except in Ribeira Sacra, with adventitious vegetation without mowing, vertical trellis training system in Monterrei and Ribeiro, no vegetation management in Ribeira Sacra, and pergola/overhead trellising in Rías Baixas.
In addition, climate data were collected from the closest weather station to each vineyard during the three years of the study. The average values for the three-year study for monthly average temperature (T), monthly average rainfall (R), monthly average wind speed (WS), and monthly average relative humidity (RH) were 14.40 °C, 242.67 L/mm2, 3.08 m/s, and 77.00% for Ribeiro; 14.93 °C, 331.67 L/m2, 6.78 m/s, 77.33% for Rias Baixas; 13.67 °C, 225.00 L/m2, 5.82 m/s, 79.00% for Ribeira Sacra; 12.83 °C, 162.33 L/m2, 4.88 m/s, 77.67% for Monterrei. The weather information can be found on the web service of the Meteorological Observation and Prediction Unit of Galicia (https://www.meteogalicia.gal/web/inicio.action, accessed on 28 May 2021).

2.3. Sample Processing and Yeast Isolation

A total of 42 samples per year were collected and processed. The obtained must (grape juice) was separated for different analyses, including isolation and yeast diversity identification. The materials and methods used for sample processing and yeast identification at the species level consisted of PCR amplification of the 5.8S rRNA gene and the ITS1 and ITS2 spacers, and sequencing of the D1/D2 region of 26S rDNA gene was used to confirm yeast identity, as described in Castrillo et al. [27].

2.4. Statistical and Data Analysis

Differences in NDVI and yeast population due to AOPs, production system, cultivars, and years were tested using one-way and two-way Bray-Curtis PERMANOVA. In addition, Principal Component Analysis (PCA) and Two-block Partial Least squares (TB-PLS) were carried out to separate richness of yeast species (S) and NDVI samples according to AOPs, production systems, cultivars, and years. Finally, Canonical Correlation Analysis (CCA) and a bilateral Pearson correlation were carried out to evaluate the correlation between NDVI and yeast species richness (S).
Additionally, a CCA was performed to determine the influence of terroir on NDVI and yeasts during the years of the study concerning the different AOPs. Several factors that characterize terroir were assessed in the analysis: monthly average temperature (T); canopy (C); monthly average rainfall (R); monthly average wind speed (WS); soil management (SM); monthly average relative humidity (RH); altitude (A); orientation.
All image, statistical, and data analyses were carried out using customized codes written in R statistical program (version 3.6.X, R Foundation for Statistical Computing, R Core Team 2019, https://www.R-project.org/, accessed on 21 May 2021, Vienna, Austria), Python (version 3.9.X, Python Software Foundation, https://www.python.org/, accessed on 21 May 2021, Wilmington, DE, USA), and PAST software (version 4.04, Hammer & Harper, Oslo, Norway).

3. Results

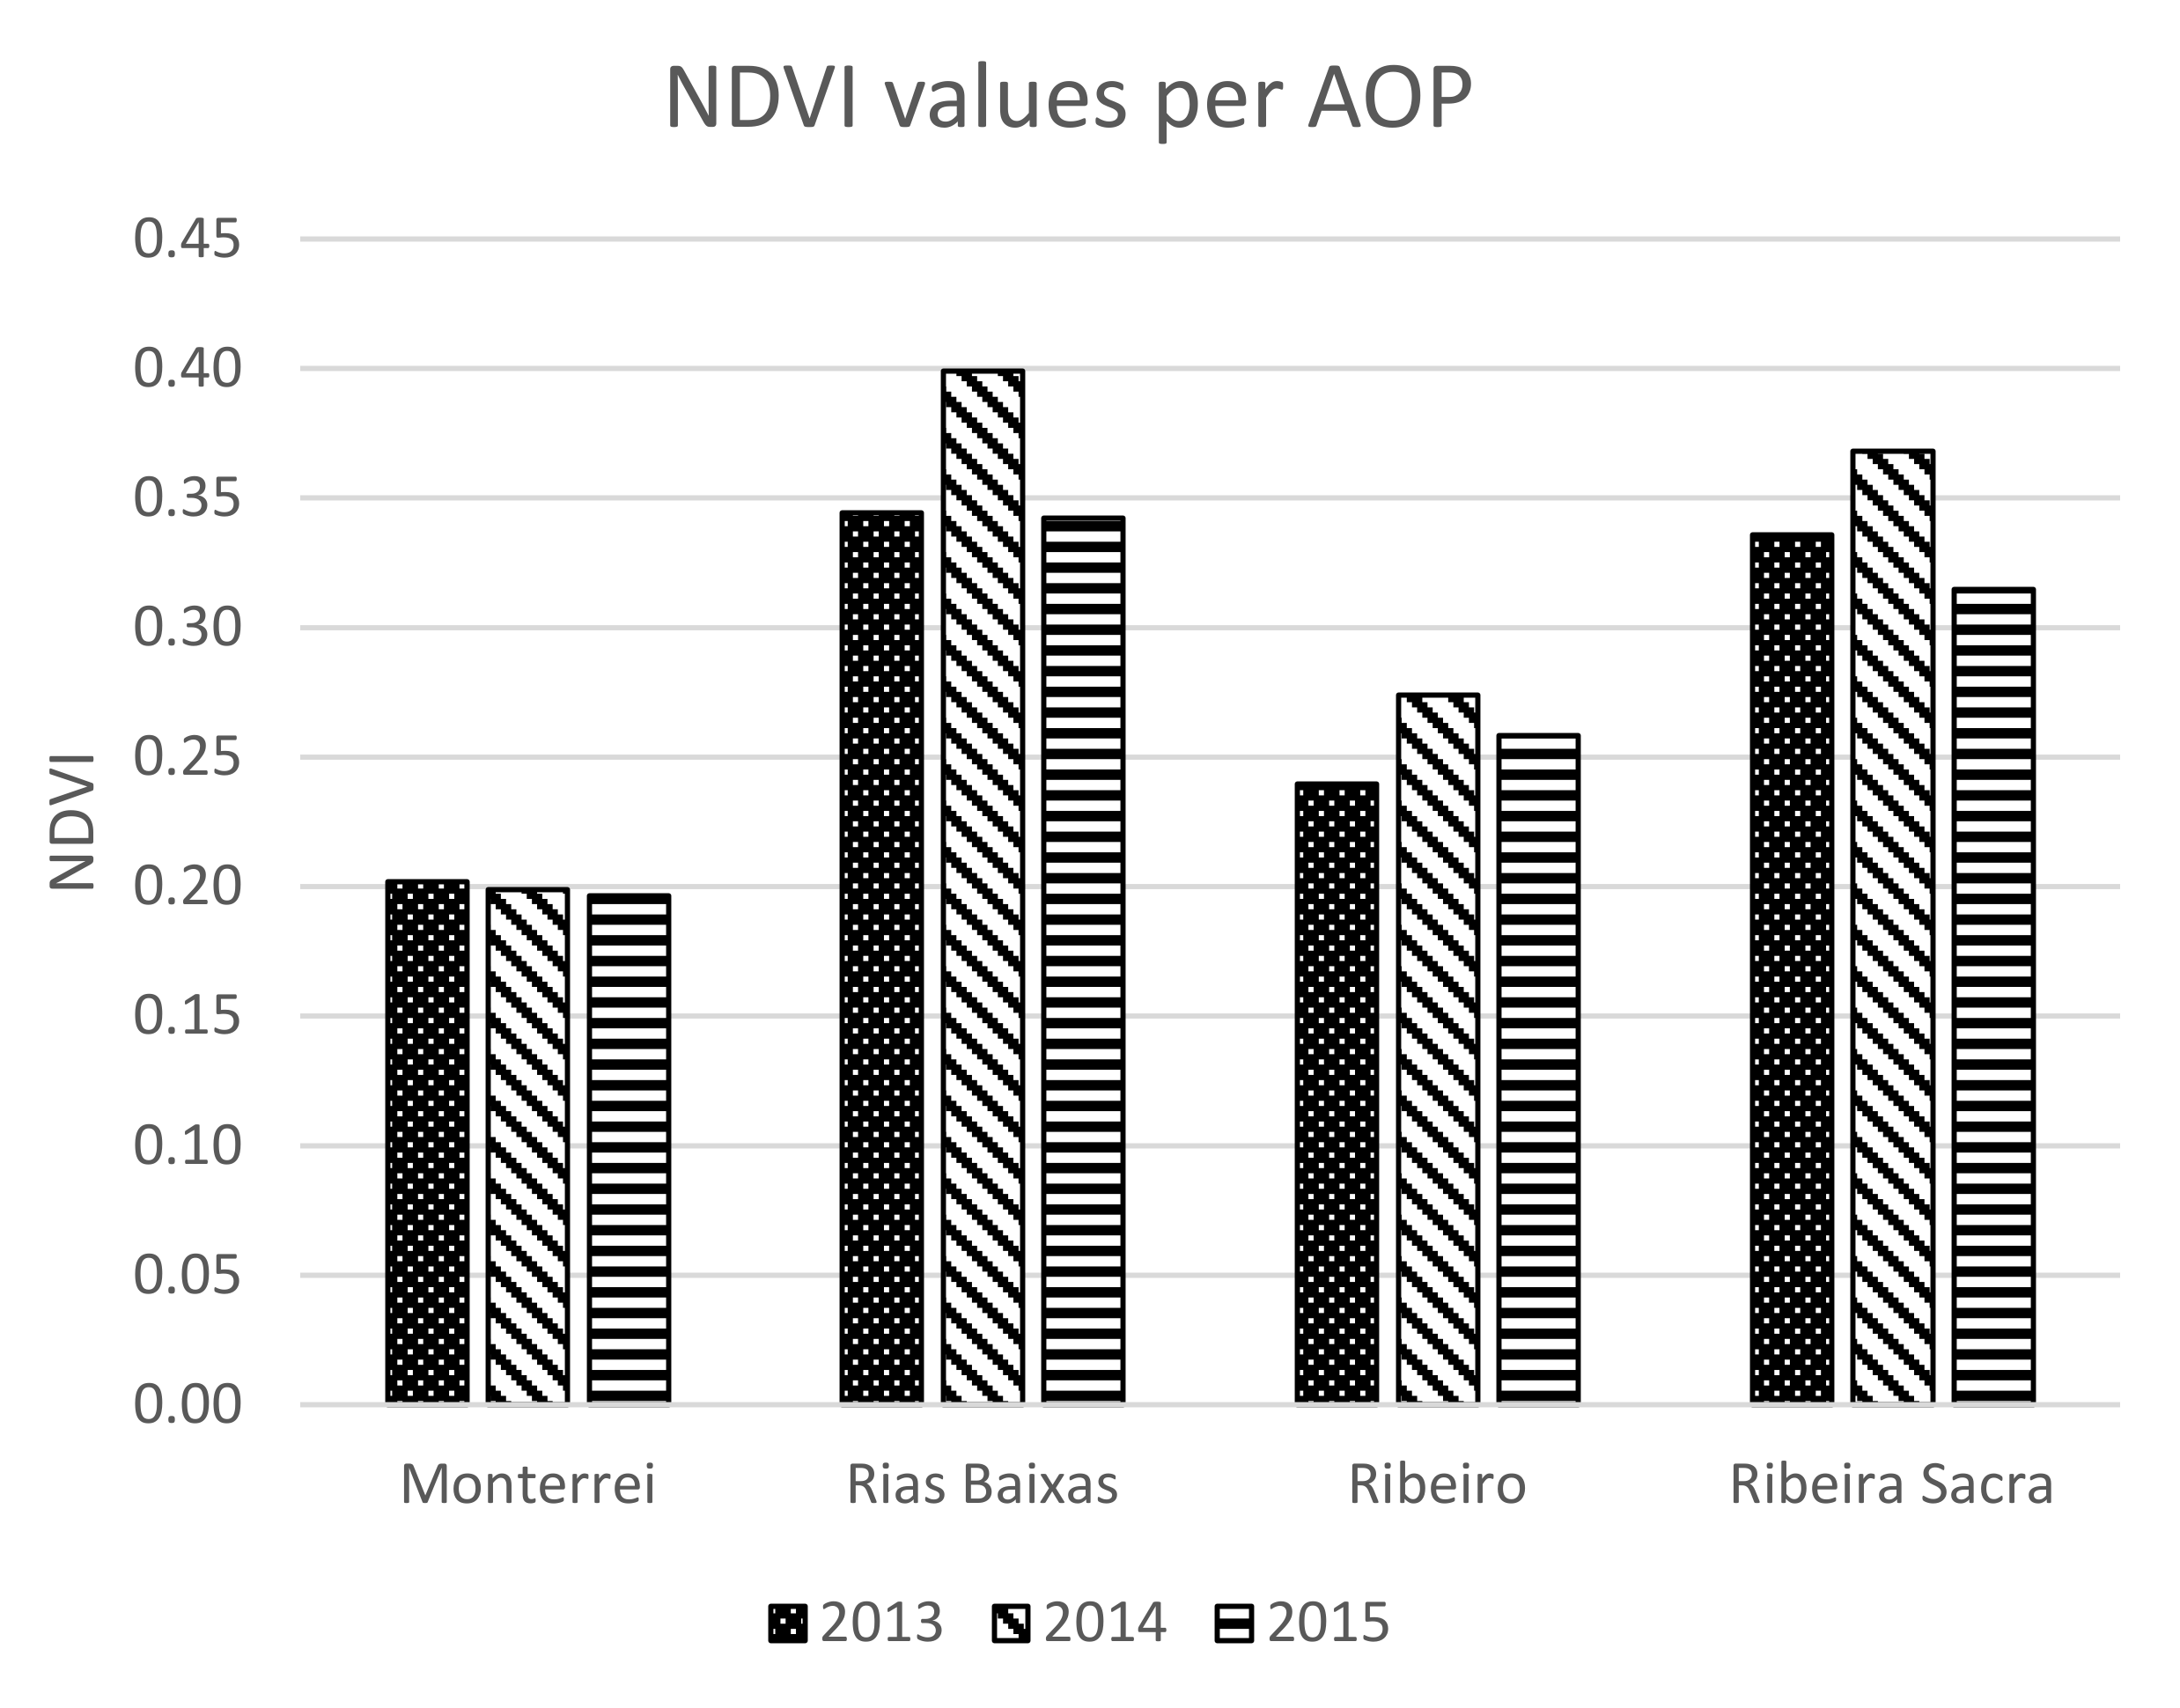
Table 2 shows NDVI values calculated using free-cloud Landsat 8 images in the chosen dates. Figure 3 shows that NDVI was relatively stable over the years in all vineyards, although the trend shows that maximum values were reached during 2014 and minimum values during 2015, except in Ribeiro. When analyzing NDVI per AOP, Rias Baixas had the highest values during the three years, with maximum values of 0.49 and minimum values of 0.24, followed by Ribeira Sacra AOP, with 0.45 and 0.24, respectively. On the other hand, the lowest NDVI values were in Monterrei AOP, with maximum and minimum values of 0.25 and 0.13, followed by Ribeiro AOP, with values of 0.32 and 0.19, respectively. In addition, the NDVI ranged from a maximum of 0.49 to a minimum of 0.13 for all AOPs and years. Each year, the maximum and minimum values were similar: for 2015, between 0.43 and 0.13, for 2014, between 0.49 and 0.14, and for 2013, between 0.48 and 0.14.
The statistical analysis confirmed the previous analysis. PERMANOVA was used to evaluate differences in NDVI between years, cultivars, AOPs, and culture systems. The NDVI only showed significant differences between AOPs (p = 0.0040, F = 7.2530) but not between years (p = 0.3353, F = 1.374), farming systems (p = 0.4865, F = 0.5193), and cultivars (p = 0.9309, F = 0.2096). In addition, significant differences were found in the RB-Mo pairwise (p = 0.0311, F = 13.2700), and in the Mo-Ri pairwise (p = 0.0208, F = 5.2270). In RS-Mo pairwise, the values were F = 9.621 at p = 0.0637. However, in the RS-RB pairwise, no significant differences were found, with the lowest F = 0.1310 and the highest p = 0.7971. Therefore, this paper focused on the AOPs.
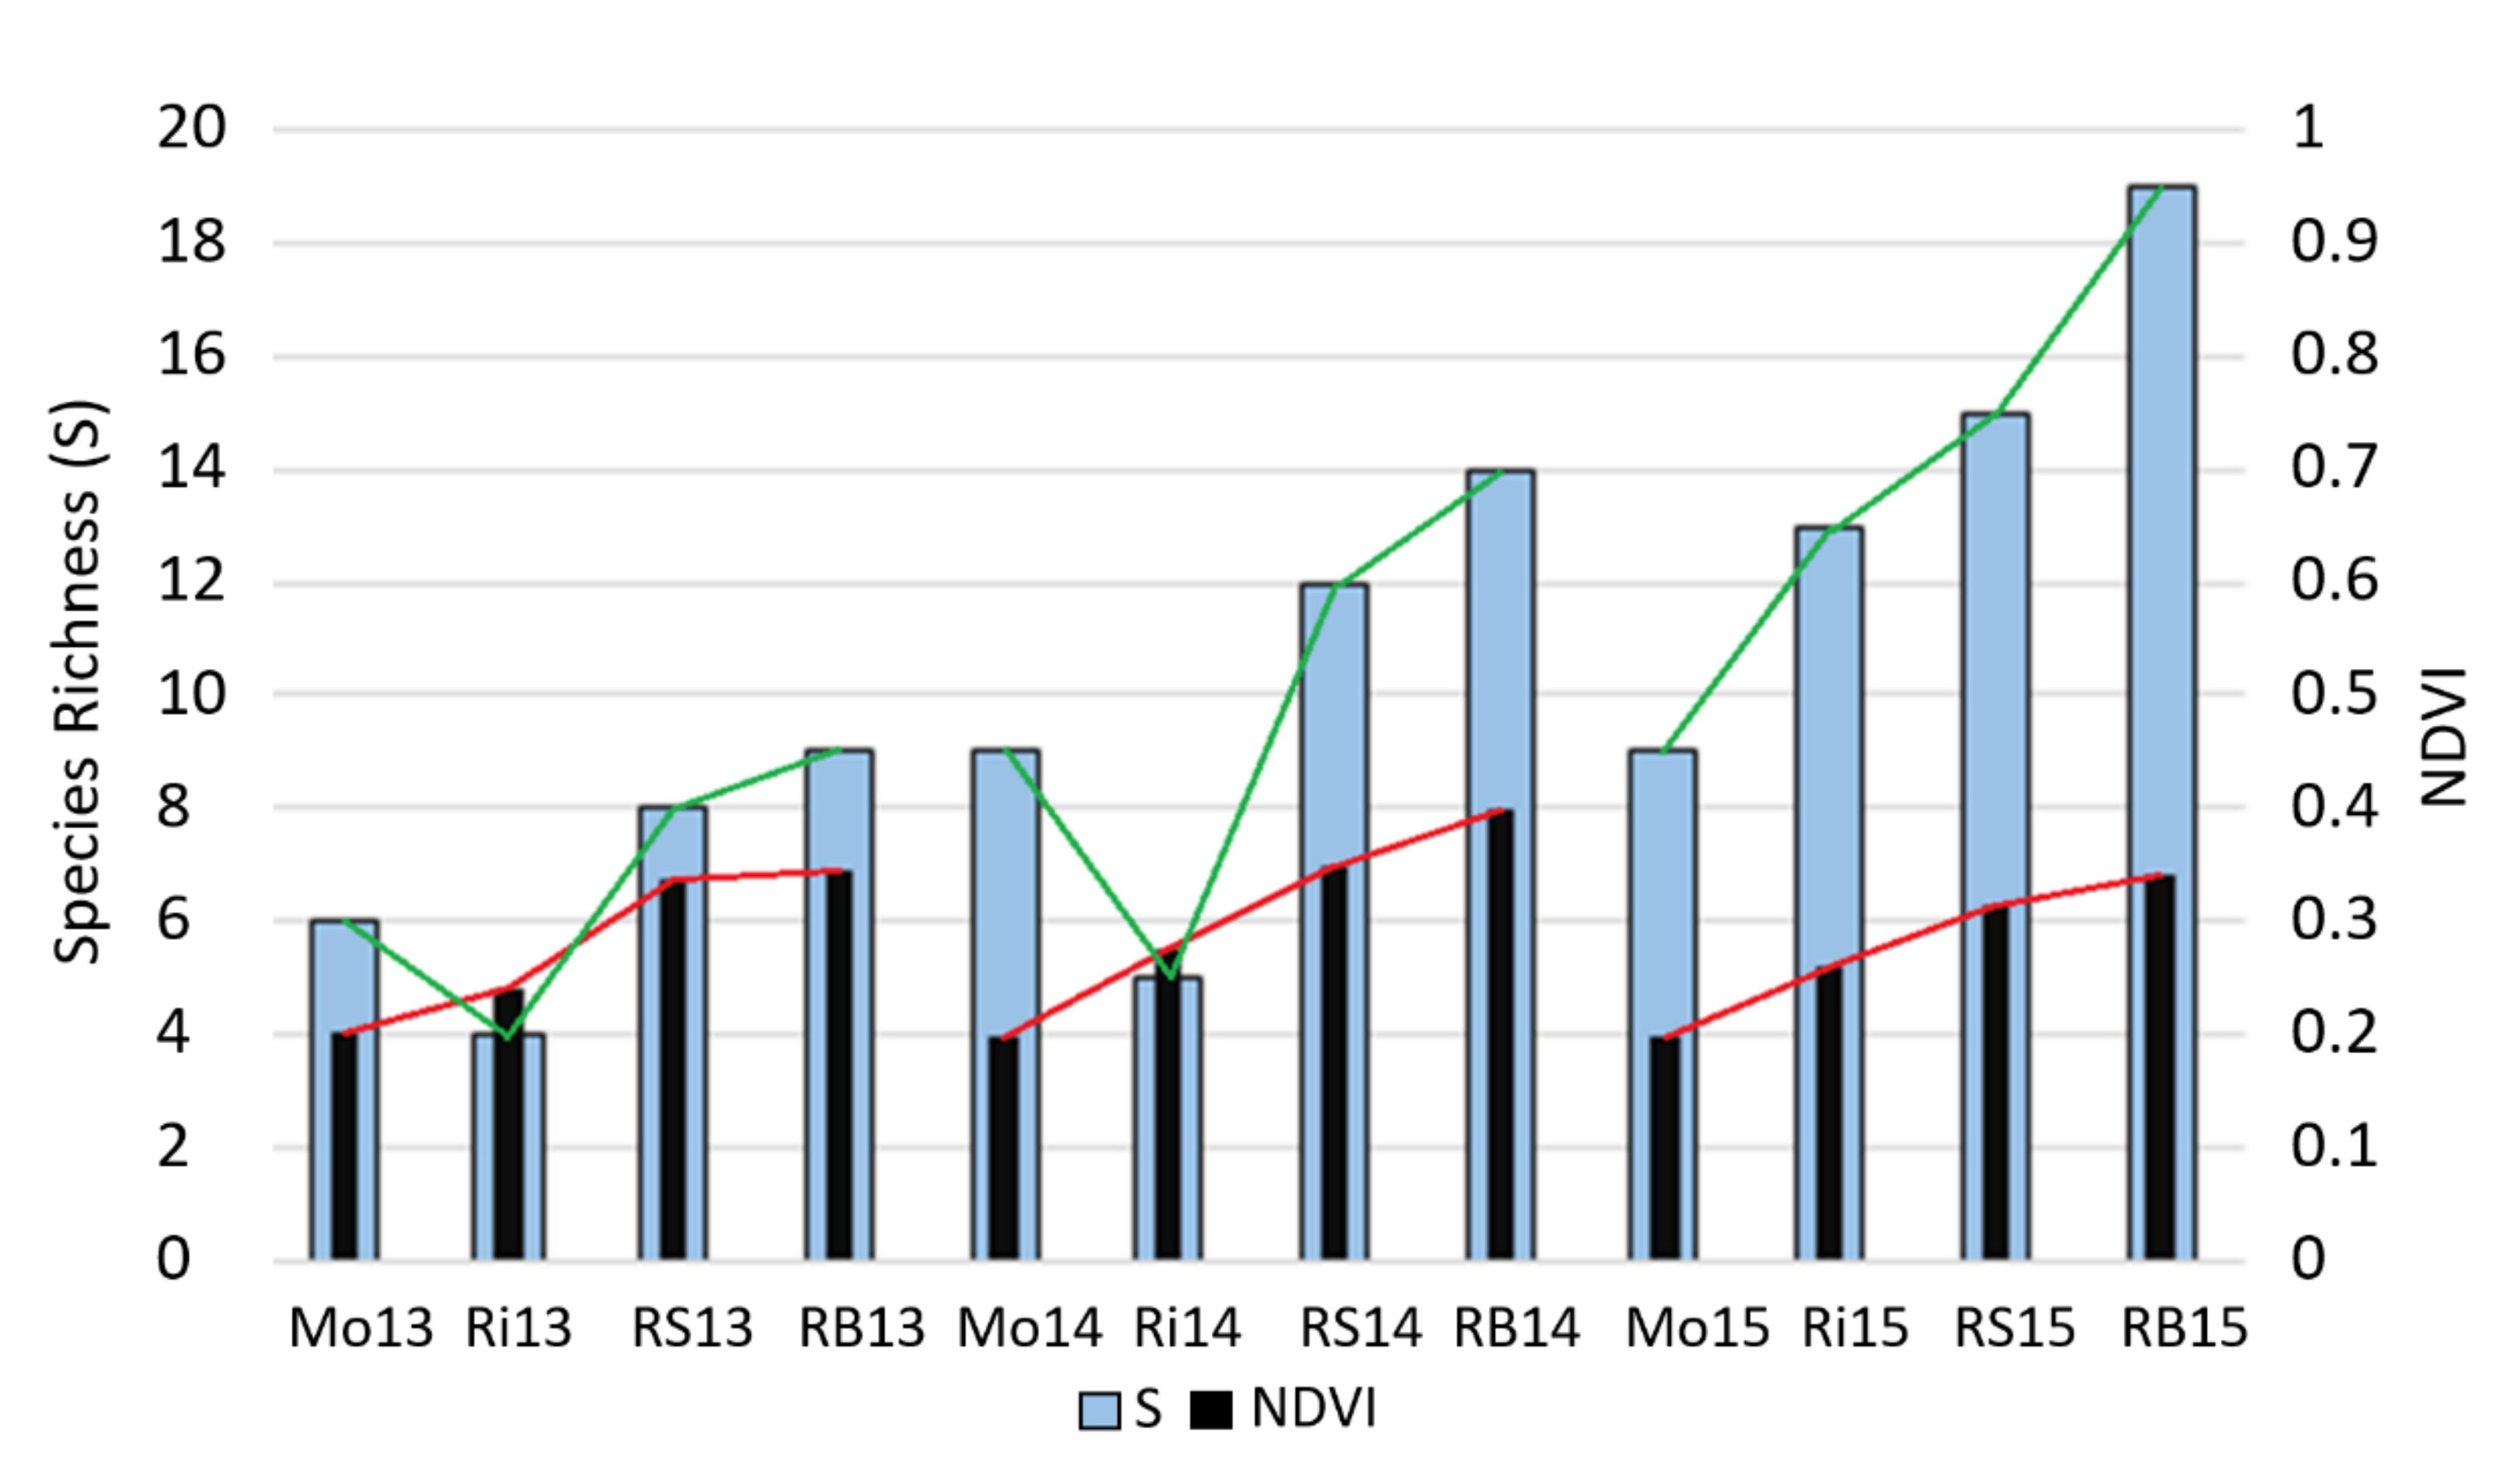
Figure 4 shows a different NDVI and a different yeast species richness for each AOP, being in both cases higher in the Rías Baixas and Ribeira Sacra AOPs than in the Ribeiro and Monterrei AOPs for each vintage during the three years.
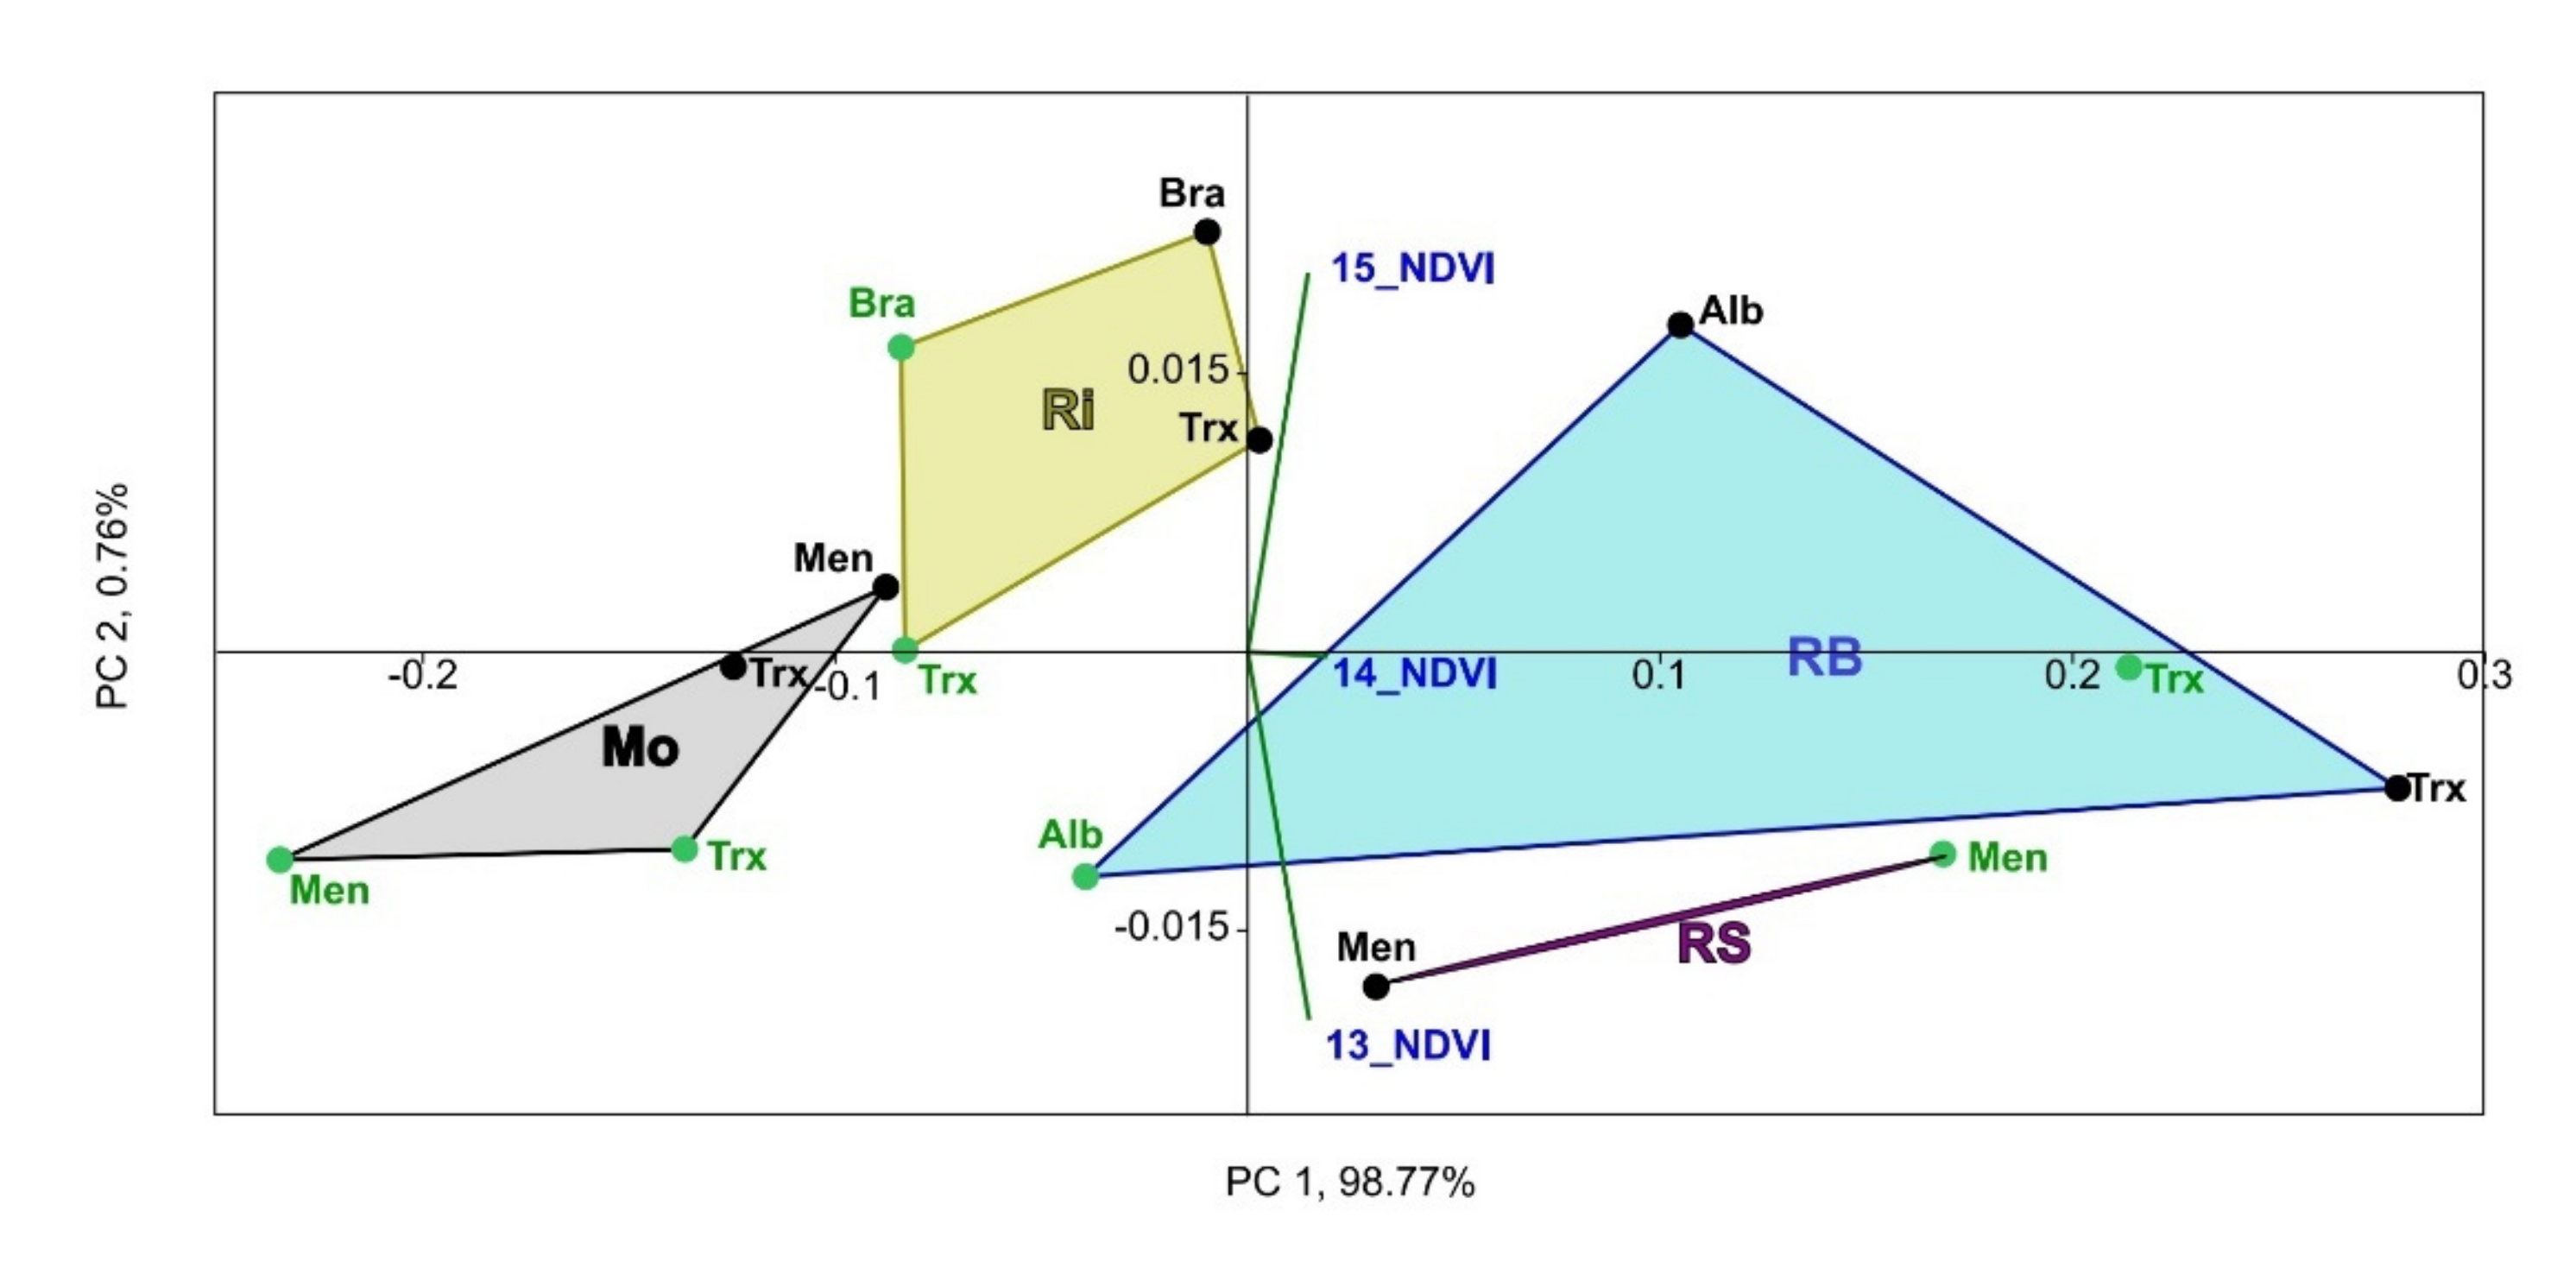
PERMANOVA was also used to assess differences in yeast population (species richness) between campaigns, cultivars, AOPs and farming systems. Species richness presented significant differences among AOPs [27,29]. Regarding yeast diversity in musts, in terms of species richness, different yeast species were identified during the three years of study, distributed as shown in Figure 4. A PCA of NDVI of the vineyards (Figure 5) was used to analyze both data sets separately between the different AOPs, considering all grapevine cultivars, farming systems, and years. Furthermore, Axis1 separated Rías Baixas and Ribeira Sacra from Ribeiro and Monterrei AOP samples on both sides of the Y-axis. However, the separation between NDVI values was not clear, considering the different farming systems and cultivars.
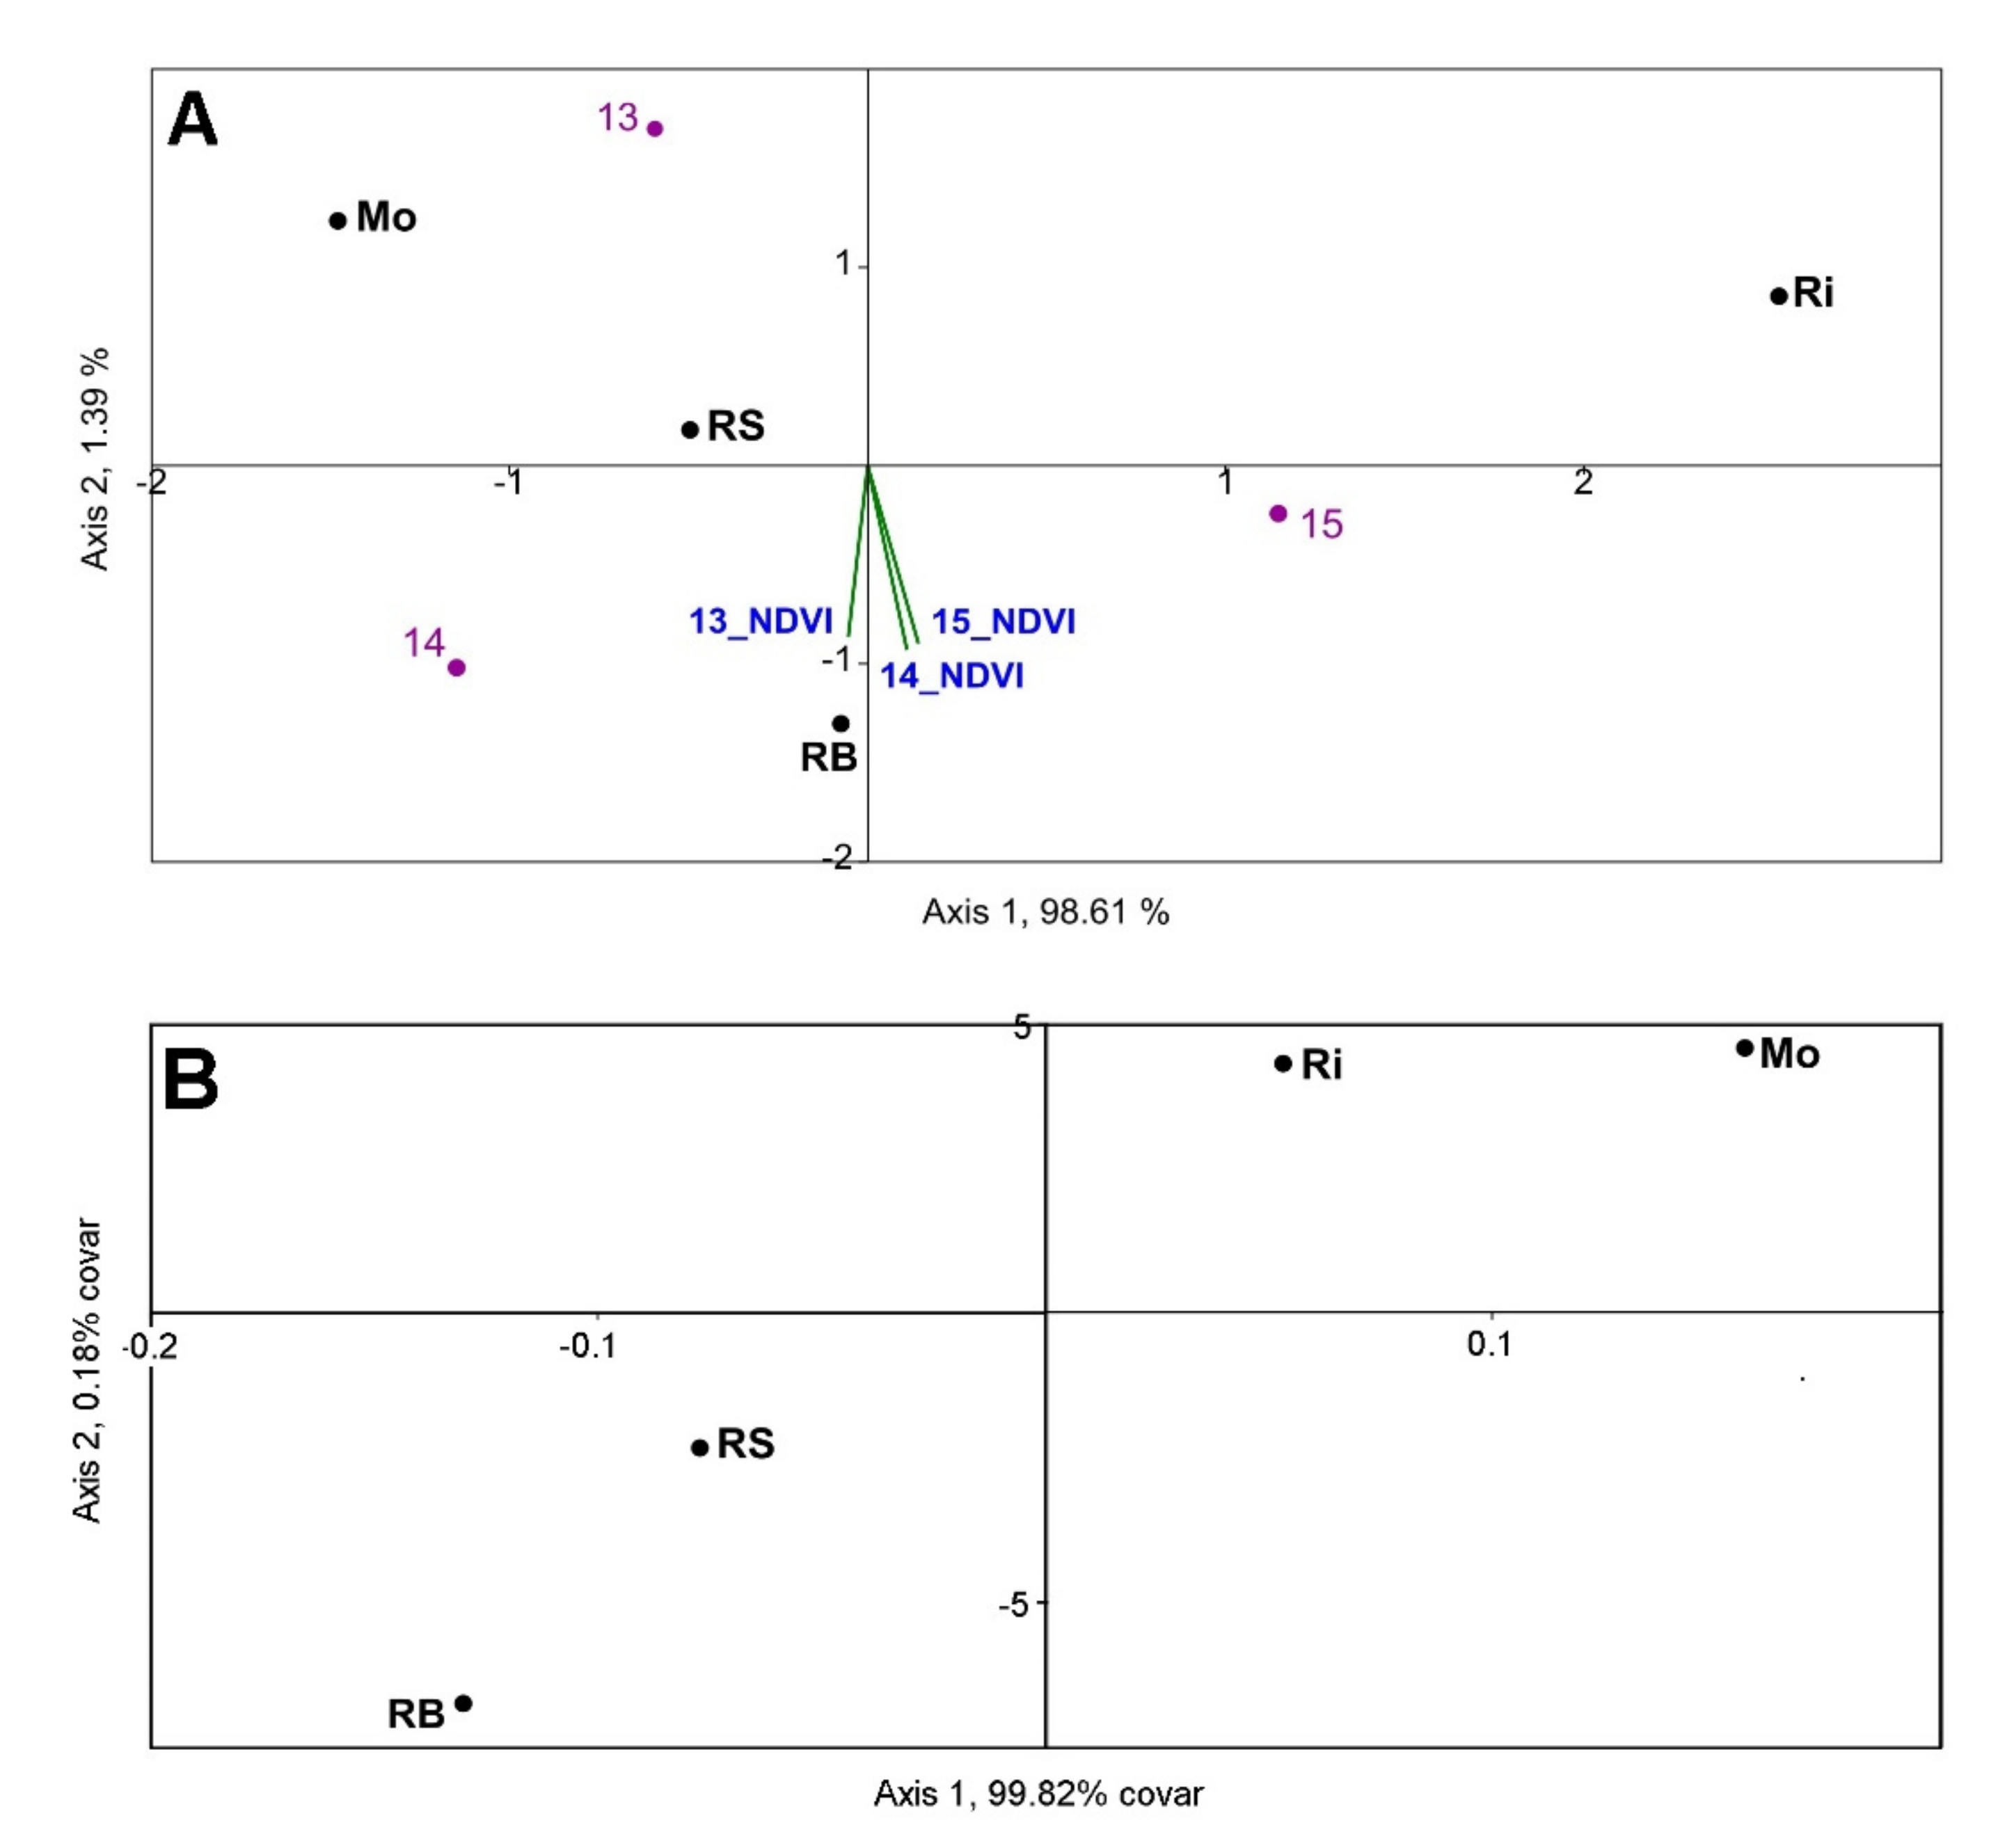
To study if there was a significant correlation between NDVI and species richness in the vineyards of the different AOPs, a CCA (Figure 6A), a TB-PLS (Figure 6B), and a Pearson’s correlation test were performed on both data sets combined. The TB-PLS also separated AOPs like PCA (Figure 5: NDVI data set separately). Regarding the CCA, the NDVI triplot was not grouped by year, but the NDVI values of each year were grouped closely, pointing towards the Rías Baixas AOP and the 2015 and 2014 quadrats. Accordingly, taking the whole data set over the three years, Pearson’s linear correlation test results showed significant differences (p = 0.0119) in the correlation NDVI–S (r = 0.3894). Furthermore, this correlation between NDVI and species richness increased to a value of r = 0.6804 (p = 0.0105) when comparing the 2014 data. However, no significant differences in Pearson’s linear correlation were found in 2013 and 2015 separately, although, in the latter year, the Pearson’s r value was 0.4903, and the p-value was remarkably close to significance (p = 0.0751).
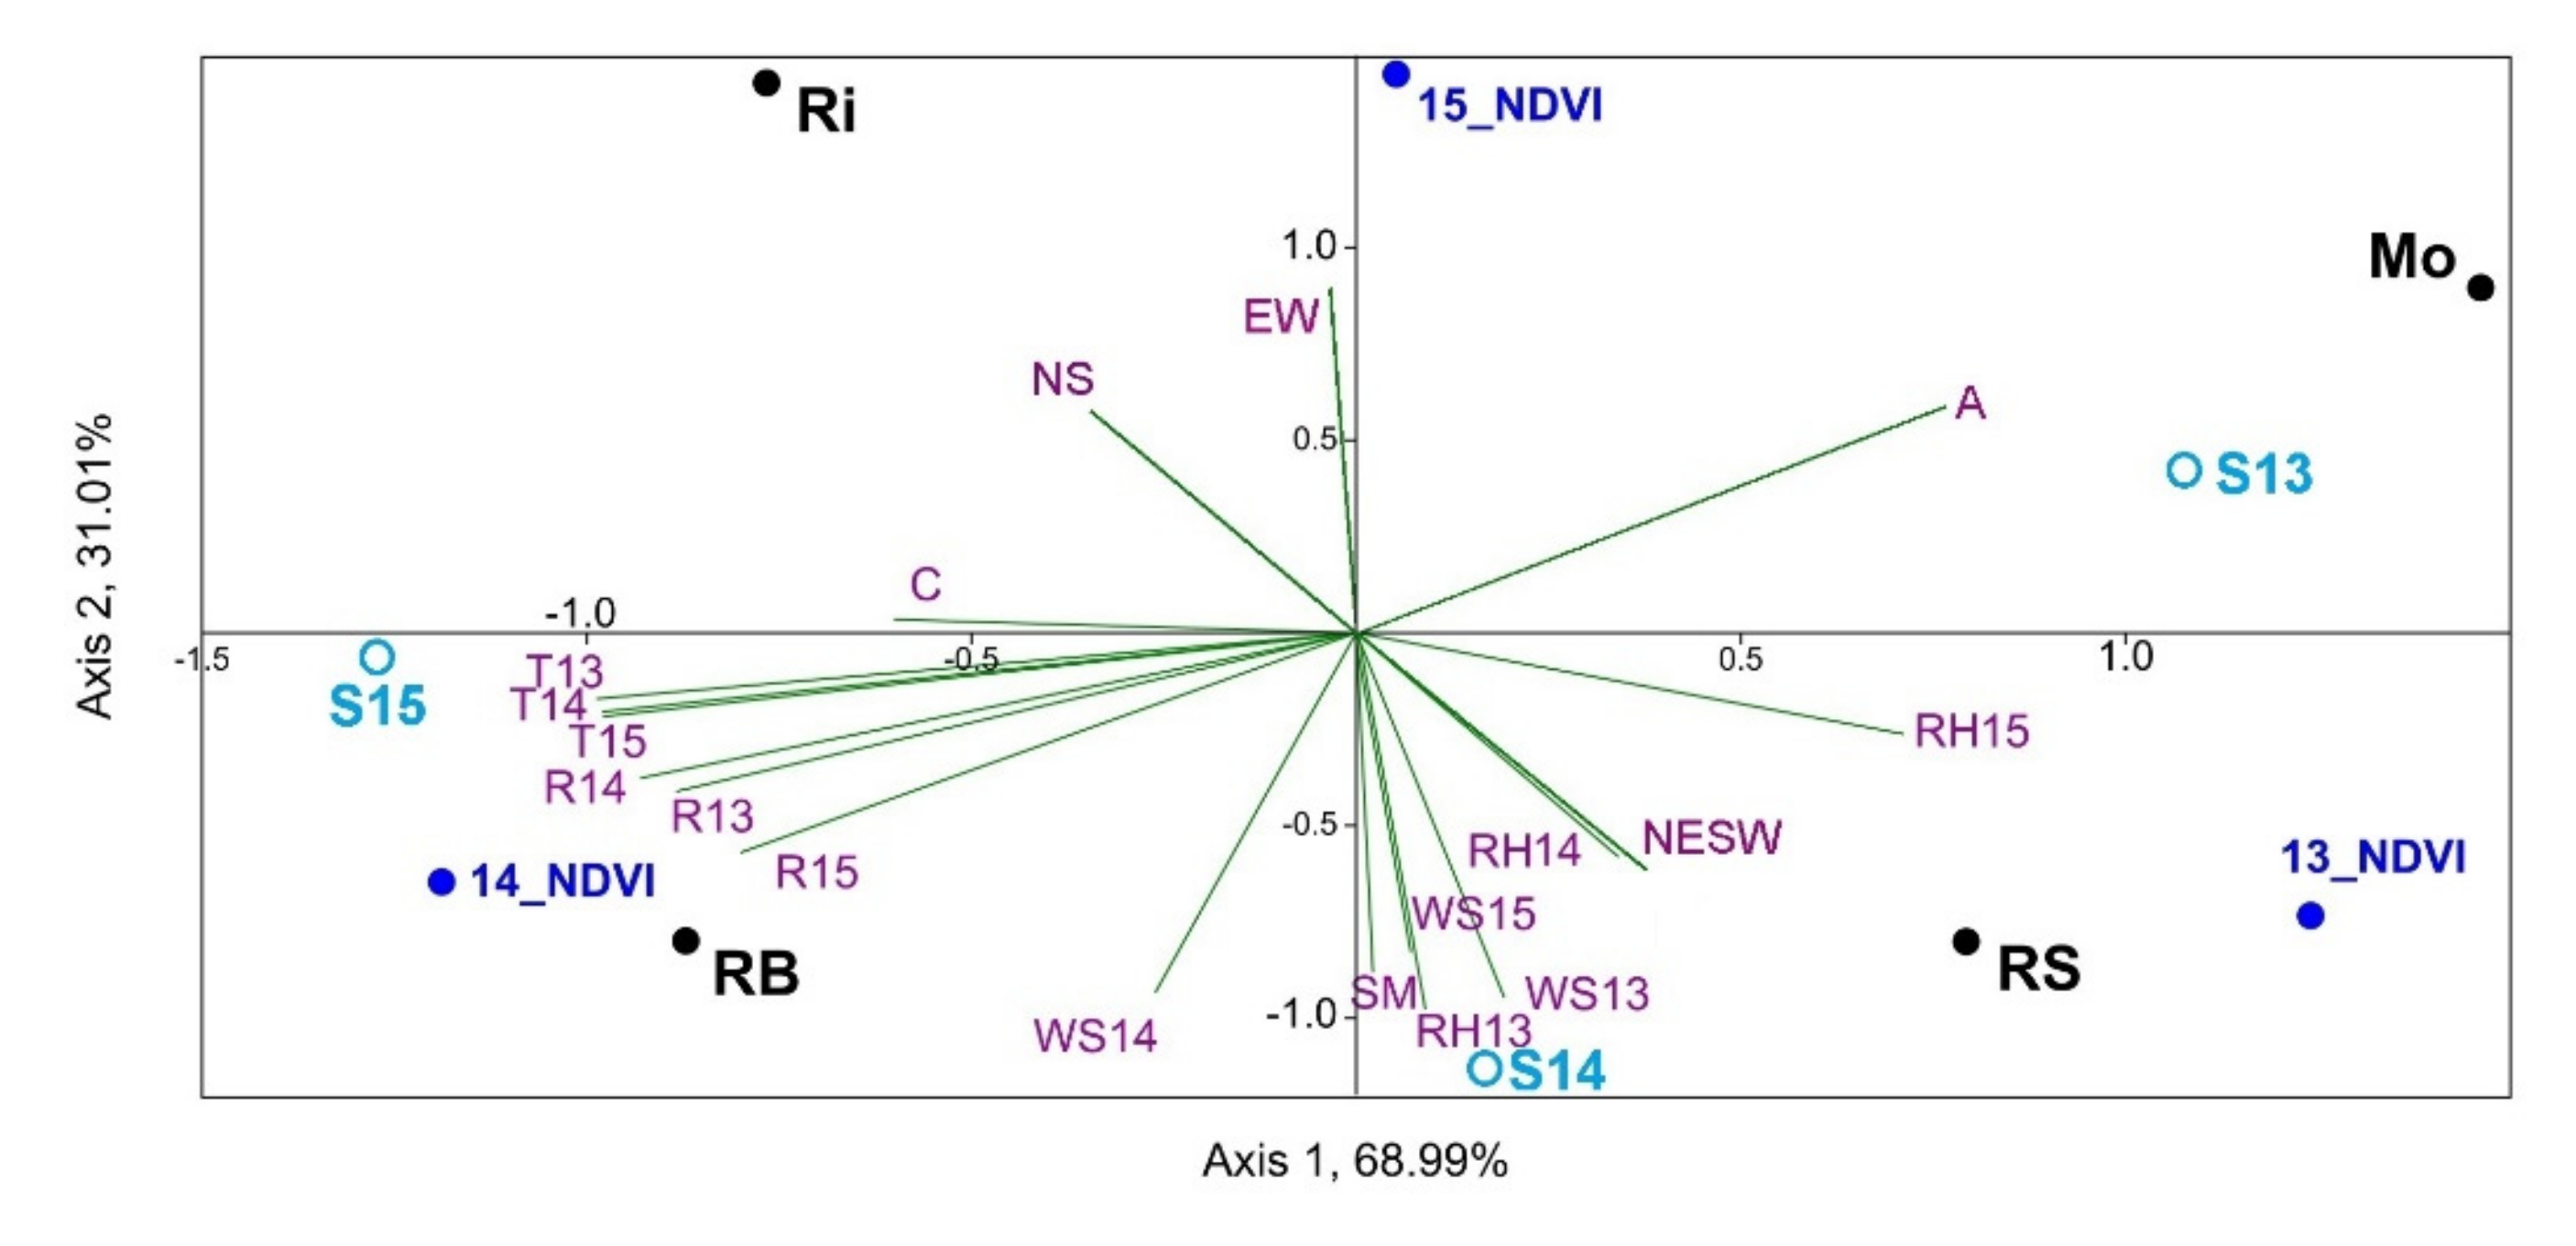
Finally, to further assess the influence of terroir on NDVI for each year concerning the different AOPs, we performed a CCA of the influence of several factors that characterize terroir, such as climatic factors, altitude, orientation, canopy, and soil management on the NDVI for each year in relation to the different AOPs during the years of the study (Figure 7). The results showed the factors that most influenced or presented the highest correlation between NDVI and species richness were temperature (T) and rainfall (R), as the triplot of these factors point to 2014 and RB (year and AOP with the highest NDVI) and S15, with 2015 and BR the year and the DO showing the highest species richness.

4. Discussion

Firstly, the TB-PLS (Figure 6B) confirmed the separation between AOPs determined in the PCA (Figure 5) with identical biogeographical separation by pairwise RS-RB and Mo-Ri. Besides, a correlation between NDVI and S was confirmed, since the NDVI of the three years in the CCA triplot pointed to the year with higher species richness (2015, together with 2014) and to the AOP with a higher S (Rías Baixas AOP), without the need to use the vintage variable. Consequently, Pearson’s correlation, which establishes not only if there exists a correlation (at p < 0.05) but also a measure of this correlation according to the r value, showed a moderate and positive correlation between NDVI and species richness for the whole data set (r = 0.3894, p = 0.0119). Furthermore, Figure 7 results showed that, relative to NDVI and yeast species richness, the most influential terroir factors studied in this research were temperature (T) and rainfall (R). It was not surprising, since these factors increase vegetation and greenness, which affects the NDVI [13], and these factors are optimal for the development of yeasts as well [19]. Additionally, it is worth noticing that there is a clear separation between AOPs.
Secondly, to explore the temporal stability in the relationship between NDVI and yeasts, each year data were analyzed separately. There was a good and positive correlation in 2014 (r = 0.6804, p = 0.0105), the year of the highest rainfall (Table 1). Although no significant differences were found in 2013 and 2015, the r value was high, and the p-value close to significance (r = 0.4903, p = 0.0751 in 2015). Furthermore, Figure 4 and Figure 6A seem to reveal a stable trend each year, showing that the higher the NDVI value, the higher the yeast species richness, except for the Ribeiro samples in 2013 and 2014. This result can be explained since the NDVI represents the vegetative development of a specific group of grapevines within each pixel [13] and, as well as the NDVI, yeasts are affected by factors such as human intervention [30] or variations in groundcover vegetation and soil [31]. Moreover, plant growth and development depend on the terroir, i.e., the plant environment, linked to different factors such as soil, crop management, climate, and others. This fact is already included in the European legislation in force [32], showing that plant growth and development within an AOP (and therefore, the quality and characteristics of the grapes) are exclusively due to a particular geographical environment with its inherent natural and human factors and depend on a specific place, region, or country. Therefore, it is reasonable to suggest that (i) NDVI can identify changes in yeasts species, since a larger leaf surface could generate a microclimate or the most appropriate conditions in the stages of higher yeast proliferation due to several factors such as the greater presence of birds and insect vectors, a better regulation and conservation of optimal temperature and humidity, shading or healthier vegetation, air-wind passage, and machinery [19,33,34,35] and (ii) these changes have an effect on terroir since microbial populations are part of it [19,20,21].
Additionally, it must be noted that vineyards are different and can present different characteristics such as groundcover vegetation or more soil proportion that affect the NDVI values, but also the vegetation and characteristics within the pixel area and, therefore, the plant environment and yeast population [36], being consistent with the central hypothesis of the study. For example, RS and RB had the highest S and NDVI values, although for totally different reasons: RS has adventitious vegetation, and the grapevines are isolated without trellising, whereas the grapevines in RB are trained using overhead trellis and cover almost the whole area. In pairwise RS–RB, the PERMANOVA test of the NDVI found no significant differences, which statistically supports this conclusion.
Furthermore, higher species richness was found in Rías Baixas and Ribeira Sacra, the AOPs with the highest NDVI values (Figure 4). The separation between AOPs in the PCA and the PLS grouped the samples in the pairwise RB–RS, and Mo–Ri reinforced the biogeographical approach or differentiation of the Galician terroir. These findings are consistent with what has already been reported in previous works, which showed the different distribution of yeasts in the four AOPs in the same vineyards [27,29], but they also add a correlation between NDVI (terroir) and yeasts. This result is important since the contribution of the microbiota in defining terroir is currently in the spotlight of scientific research due to the abundance, equilibrium, and predominance of certain yeast species during the fermentation are essential [37]. Furthermore, the association of certain species with specific conditions such as farming systems or regions, and even beyond anthropogenic factors, has also been studied by other authors [30,38,39,40,41,42].
Finally, it is interesting to note that although the NDVI varies from year to year, the difference between vineyards remains relatively constant (Figure 3); therefore, NDVI seems to be a stable factor over time. This feature is critical for developing a valuable Remote Sensing tool for monitoring and defining parameters related to terroir [43], such as AOP or yeast level.
Other authors have reported the presence of regionally differentiated communities of yeasts associated with grapes and terroir and the importance of microbial populations for the regional identity of wine [44], and our results support the existence of biogeographical patterns in yeast populations linked to terroir factors implicit in the NDVI (such as climate, soils, or agronomic practices of each region) as a regional discriminator capable of providing unique quality and typicity to wines [20,24,37,44,45]. Therefore, the importance of predicting and better understanding the existence of regionally differentiated communities of yeasts associated with grapes and terroir and the possible existence of a microbial terroir warrant further research and support the need for the present research.

5. Conclusions

The main objective of this work was to analyze the potential use of spatio-temporal analysis of satellite multispectral imagery to detect differences in terroir and yeast population due to AOP according to NDVI variations. The results suggest that it is possible to use Remote Sensing for AOP delimitation, showing that: (i) satellite imagery can establish differences in terroir and can help to predict it at yeast species richness level, (ii) the higher the NDVI, the higher the yeast species richness during the same year, probably linked to the a higher vegetation in the pixel area, and (iii) although there was no significance in the differences in the years, the relationship between NDVI, terroir, and yeasts seems to show a stable trend over the years. In addition, the most influential terroir factors regarding NDVI and species richness were temperature and rainfall. This study is valuable, since terroir affects grapevines and wine differentiation and characterization, so it is worth analyzing these factors using new technologies.
Although the results are promising, it is necessary to validate these results in more vineyards within each AOP. Furthermore, it might be worthwhile to analyze whether these results can be extended to other AOP in Spain, Europe, or worldwide. In further studies, it might be interesting to explore the potential of other satellite imagery sources such as Sentinel-2, the use of other vegetation indices that include a background adjustment factor, such as SAVI, or even develop new indexes that help to classify AOP or yeast characteristics.

Author Contributions

Conceptualization, S.V. and D.C.; Data curation, S.V. and D.C.; Formal analysis, S.V. and D.C.; Funding acquisition, E.B., P.B., and J.A.R.; Investigation, S.V. and D.C.; Methodology, S.V. and D.C.; Project administration, P.B. and D.C.; Resources, S.V., E.B., P.B., and D.C.; Software, S.V. and D.C.; Supervision, S.V., E.B., P.B., J.A.R., and D.C.; Validation, S.V. and D.C.; Visualization, S.V. and D.C.; Writing—original draft, S.V. and D.C.; Writing—review & editing, S.V., E.B., P.B., J.A.R., and D.C. All authors have read and agreed to the published version of the manuscript.

Funding

This work has been made possible thanks to the economic support of Junta de Castilla y León (Spain), Instituto Tecnológico Agrario de Castilla y León (ITACyL), and Xunta de Galicia (Axencia Galega da Calidade Alimentaria), projects INIA RTA2014-00077-C02 and RTA2012–00021-C03–01, co-financed with FEDER funds (European Regional Development Fund). SV and DC thank INIA and European Social Fund for their FPI predoctoral contracts FPI-INIA2016-017 and FPI-INIA2014-32, respectively.

Acknowledgments

We would like to thank the producers: Esther Teixeiro Lemos, Roberto Regal, Cooperativa Cume do Avia, Víctor Diéguez, Begoña Troncoso, María del Carmen Álvarez, José Luis Mateo and José dos Santos Diz, for allowing us to collect samples from their vineyards.

Conflicts of Interest

The authors declare no conflict of interest.

References

  1. Jones, G.V.; Hellman, E. Site Assessment. In Oregon Viticulture, 5th ed.; Hellman, E., Ed.; Oregon State University Press: Corvallis, OR, USA, 2003; pp. 44–50. [Google Scholar]
  2. Robinson, J. The Oxford Companion to Wine; Oxford University Press (OUP): Oxford, UK, 2006; pp. 693–695. [Google Scholar]
  3. Cosme, F.; Vilela, A.; Moreira, L.; Moura, C.; Enríquez, J.; Filipe-Ribeiro, L.; Nunes, F. Terroir Effect on the Phenolic Composition and Chromatic Characteristics of Mencía/Jaen Monovarietal Wines: Bierzo D.O. (Spain) and Dão D.O. (Portugal). Molecules 2020, 25, 6008. [Google Scholar] [CrossRef] [PubMed]
  4. Seguin, G. ‘Terroirs’ and pedology of wine growing. Cell. Mol. Life Sci. 1986, 42, 861–873. [Google Scholar] [CrossRef]
  5. Vivas, C.; Sousa, A. La globalización en el sector del vino: Nuevo mundo, viejo mundo y Portugal. In XXVII AEDEM Annual Meeting; ESIC Editorial: Huelva, Spain, 2013. [Google Scholar]
  6. Krishna, K.R. Push Button Agriculture: Robotics, Drones, Satellite-Guided Soil and Crop Management; Apple Academic Press: Palm Bay, FL, USA; CRC Press: Boca Raton, FL, USA; Taylor & Francis Group: Milton Park, UK, 2016; ISBN 13978-1-77188-305-4. [Google Scholar]
  7. Rouse, J.W., Jr.; Haas, R.H.; Schell, J.A.; Deering, D.W. Monitoring Vegetation Systems in the Great Plains with ERTS; NASA: Washington, DC, USA, 1973. [Google Scholar]
  8. Vélez, S.; Rubio, J.A.; Andrés, M.I.; Barajas, E. Agronomic classification between vineyards (‘Verdejo’) using NDVI and Sen-tinel-2 and evaluation of their wines. Vitis J. Grapevine Res. 2019, 58, 33–38. [Google Scholar] [CrossRef]
  9. Anastasiou, E.; Balafoutis, A.; Darra, N.; Psiroukis, V.; Biniari, A.; Xanthopoulos, G.; Fountas, S. Satellite and Proximal Sensing to Estimate the Yield and Quality of Table Grapes. Agriculture 2018, 8, 94. [Google Scholar] [CrossRef] [Green Version]
  10. Johnson, L.F.; Bosch, D.F.; Williams, D.C.; Lobitz, B.M. Remote sensing of vineyard management zones: Implications for wine quality. Appl. Eng. Agric. 2001, 17, 557–560. [Google Scholar] [CrossRef]
  11. Martinez-Casasnovas, J.A.; Agelet-Fernandez, J.; Arnó, J.; Ramos, M.C. Analysis of vineyard differential management zones and relation to vine development, grape maturity and quality. Span. J. Agric. Res. 2012, 10, 326. [Google Scholar] [CrossRef] [Green Version]
  12. Johnson, L.F. Temporal stability of an NDVI-LAI relationship in a Napa Valley vineyard. Aust. J. Grape Wine Res. 2003, 9, 96–101. [Google Scholar] [CrossRef]
  13. Vélez, S.; Barajas, E.; Rubio, J.A.; Vacas, R.; Poblete-Echeverría, C. Effect of Missing Vines on Total Leaf Area Determined by NDVI Calculated from Sentinel Satellite Data: Progressive Vine Removal Experiments. Appl. Sci. 2020, 10, 3612. [Google Scholar] [CrossRef]
  14. Lamb, D.; Weedon, M.; Bramley, R. Using remote sensing to predict grape phenolics and colour at harvest in a Cabernet Sauvignon vineyard: Timing observations against vine phenology and optimising image resolution. Aust. J. Grape Wine Res. 2004, 10, 46–54. [Google Scholar] [CrossRef] [Green Version]
  15. Vélez, S.; Barajas, E.; Rubio, J.A.; Poblete-Echeverría, C.; Olmedo, G.F. Chapter 10. Remote Sensing: In the Digital Viticulture Era. In Vitis: Biology and Species; Nova Publishers: Hauppauge, NY, USA, 2020; ISBN 978-1-53618-308-5. [Google Scholar]
  16. Matese, A.; Toscano, P.; Di Gennaro, S.F.; Genesio, L.; Vaccari, F.P.; Primicerio, J.; Belli, C.; Zaldei, A.; Bianconi, R.; Gioli, B. Intercomparison of UAV, Aircraft and Satellite Remote Sensing Platforms for Precision Viticulture. Remote. Sens. 2015, 7, 2971–2990. [Google Scholar] [CrossRef] [Green Version]
  17. Markham, B.; Storey, J.; Morfitt, R. Landsat-8 Sensor Characterization and Calibration. Remote. Sens. 2015, 7, 2279–2282. [Google Scholar] [CrossRef] [Green Version]
  18. Hall, C.M.; Mitchell, R. Wine Marketing: A Practical Guide, 1st ed.; Elsevier: Amsterdam, The Netherlands; Boston, MA, USA, 2008; ISBN 978-0-7506-5420-3. [Google Scholar]
  19. Barata, A.; Malfeito-Ferreira, M.; Loureiro, V. The microbial ecology of wine grape berries. Int. J. Food Microbiol. 2012, 153, 243–259. [Google Scholar] [CrossRef] [PubMed]
  20. Bokulich, N.A.; Thorngate, J.H.; Richardson, P.M.; Mills, D.A. PNAS Plus: From the Cover: Microbial biogeography of wine grapes is conditioned by cultivar, vintage, and climate. Proc. Natl. Acad. Sci. USA 2014, 111, E139–E148. [Google Scholar] [CrossRef] [Green Version]
  21. Ribéreau-Gayon, P.; Dubourdieu, D.; Donèche, B. Handbook of Enology, 2nd ed.; John Wiley: Chichester, UK; Hoboken, NJ, USA, 2006; ISBN 978-0-470-01034-1. [Google Scholar]
  22. Ciani, M.; Comitini, F.; Mannazzu, I.; Domizio, P. Controlled mixed culture fermentation: A new perspective on the use of non-Saccharomyces yeasts in winemaking. FEMS Yeast Res. 2010, 10, 123–133. [Google Scholar] [CrossRef] [PubMed] [Green Version]
  23. Tofalo, R.; Patrignani, F.; Lanciotti, R.; Perpetuini, G.; Schirone, M.; Di Gianvito, P.; Pizzoni, D.; Arfelli, G.; Suzzi, G. Aroma profile of Montepulciano d’Abruzzo wine fermented by single and co-culture starters of autochthonous Sac-charomyces and Non-Saccharomyces yeasts. Front. Microbiol. 2016, 7, 610. [Google Scholar] [CrossRef]
  24. Bokulich, N.A.; Collins, T.S.; Masarweh, C.; Allen, G.; Heymann, H.; Ebeler, S.E.; Mills, D.A. Associations among Wine Grape Microbiome, Metabolome, and Fermentation Behavior Suggest Microbial Contribution to Regional Wine Characteristics. mBio 2016, 7, e00631-16. [Google Scholar] [CrossRef] [Green Version]
  25. Alexandre, H. Wine Yeast Terroir: Separating the Wheat from the Chaff—For an Open Debate. Microorganisms 2020, 8, 787. [Google Scholar] [CrossRef]
  26. Castrillo, D.; Rabuñal, E.; Neira, N.; Blanco, P. Oenological potential of non-Saccharomyces yeasts to mitigate effects of climate change in winemaking: Impact on aroma and sensory profiles of Treixadura wines. FEMS Yeast Res. 2019, 19, foz065. [Google Scholar] [CrossRef]
  27. Castrillo, D.; Rabuñal, E.; Neira, N.; Blanco, P. Yeast diversity on grapes from Galicia, NW Spain: Biogeographical patterns and the influence of the farming system. OENO One 2018, 53. [Google Scholar] [CrossRef]
  28. Hall, A.; Lamb, D.; Holzapfel, B.P.; Louis, J.P. Within-season temporal variation in correlations between vineyard canopy and winegrape composition and yield. Precis. Agric. 2010, 12, 103–117. [Google Scholar] [CrossRef]
  29. Castrillo Cachón David (2018) Study of Yeast Diversity in Organic and Conventional Grapes from GALICIA: Biogeographic Patterns and Influence on the Chemical and Sensory Characteristics of Wine. Available online: https://www.educacion.gob.es/teseo/imprimirFicheroTesis.do?idFichero=ifNKOOHc9YI%3D (accessed on 25 June 2021).
  30. Drumonde-Neves, J.; Franco-Duarte, R.; Lima, T.; Schuller, D.; Pais, C. Yeast Biodiversity in Vineyard Environments Is Increased by Human Intervention. PLoS ONE 2016, 11, e0160579. [Google Scholar] [CrossRef] [Green Version]
  31. Botha, A. Yeasts in Soil. In Biodiversity and Ecophysiology of Yeasts; Springer Science and Business Media LLC: Berlin/Heidelberg, Germany, 2006; pp. 221–240. [Google Scholar]
  32. Consolidated text: Regulation (EU) No 1151/2012 of the European Parliament and of the Council of 21 November 2012 on Quality Schemes for Agricultural Products and Foodstuffs. Available online: http://data.europa.eu/eli/reg/2012/1151/2019-12-14 (accessed on 14 June 2021).
  33. Francesca, N.; Canale, D.E.; Settanni, L.; Moschetti, G. Dissemination of wine-related yeasts by migratory birds. Environ. Microbiol. Rep. 2011, 4, 105–112. [Google Scholar] [CrossRef] [Green Version]
  34. Schuller, D.; Alves, H.; Dequin, S.; Casal, M. Ecological survey of Saccharomyces cerevisiae strains from vineyards in the Vinho Verde Region of Portugal. FEMS Microbiol. Ecol. 2005, 51, 167–177. [Google Scholar] [CrossRef] [Green Version]
  35. Mortimer, R.; Polsinelli, M. On the origins of wine yeast. Res. Microbiol. 1999, 150, 199–204. [Google Scholar] [CrossRef]
  36. Ramírez, M.; López-Piñeiro, A.; Velázquez, R.; Muñoz, A.; Regodón, J.A. Analysing the vineyard soil as a natural reservoir for wine yeasts. Food Res. Int. 2020, 129, 108845. [Google Scholar] [CrossRef]
  37. Belda, I.; Zarraonaindia, I.; Perisin, M.; Palacios, A.; Acedo, A. From Vineyard Soil to Wine Fermentation: Microbiome Approximations to Explain the “terroir” Concept. Front. Microbiol. 2017, 8, 821. [Google Scholar] [CrossRef] [PubMed] [Green Version]
  38. Comitini, F.; Ciani, M. Influence of fungicide treatments on the occurrence of yeast flora associated with wine grapes. Ann. Microbiol. 2008, 58, 489–493. [Google Scholar] [CrossRef]
  39. Drumonde-Neves, J.; Franco-Duarte, R.; Lima, T.; Schuller, D.; Pais, C. Association between Grape Yeast Communities and the Vineyard Ecosystems. PLoS ONE 2017, 12, e0169883. [Google Scholar] [CrossRef]
  40. Grangeteau, C.; Roullier-Gall, C.; Rousseaux, S.; Gougeon, R.; Schmitt-Kopplin, P.; Alexandre, H.; Guilloux-Benatier, M. Wine microbiology is driven by vineyard and winery anthropogenic factors. Microb. Biotechnol. 2017, 10, 354–370. [Google Scholar] [CrossRef] [PubMed]
  41. Setati, M.E.; Jacobson, D.; Andong, U.-C.; Bauer, F. The Vineyard Yeast Microbiome, a Mixed Model Microbial Map. PLoS ONE 2012, 7, e52609. [Google Scholar] [CrossRef] [Green Version]
  42. Bagheri, B.; Bauer, F.F.; Setati, M. The Diversity and Dynamics of Indigenous Yeast Communities in Grape Must from Vineyards Employing Different Agronomic Practices and their Influence on Wine Fermentation. S. Afr. J. Enol. Vitic. 2016, 36, 243–251. [Google Scholar] [CrossRef] [Green Version]
  43. Pierce, F.J.; Clay, D. GIS Applications in Agriculture; CRC Press: Boca Raton, FL, USA, 2007; ISBN 978-0-8493-7526-2. [Google Scholar]
  44. Knight, S.; Klaere, S.; Fedrizzi, B.; Goddard, M.R. Regional microbial signatures positively correlate with differential wine phenotypes: Evidence for a microbial aspect to terroir. Sci. Rep. 2015, 5, 14233. [Google Scholar] [CrossRef] [PubMed] [Green Version]
  45. Mezzasalma, V.; Sandionigi, A.; Guzzetti, L.; Galimberti, A.; Grando, M.S.; Tardaguila, J.; Labra, M. Geographical and Cultivar Features Differentiate Grape Microbiota in Northern Italy and Spain Vineyards. Front. Microbiol. 2018, 9, 946. [Google Scholar] [CrossRef] [PubMed]
Figure 1. Location of the Landsat imagery and commercial vineyards in Galicia (Spain).
J 04 00020 g001
Figure 2. Commercial vineyards. Codes are shown in Table 1. Scales are different to ease visualization.
J 04 00020 g002
Figure 3. NDVI values per AOP calculated using Landsat imagery close to veraison. Years 2013, 2014, and 2015.
J 04 00020 g003
Figure 4. Species richness and NDVI in the four AOPs during 2013, 2014, and 2015. AOPs: Mo: Monterrei, Ri: Ribeiro, RS: Ribeira Sacra, RB: Rías Baixas.
J 04 00020 g004
Figure 5. PCA of NDVI during 2013, 2014, and 2015 in vineyards planted with four representative cultivars within four Galician AOPs. AOPs: Mo: Monterrei, Ri: Ribeiro, RS: Ribeira Sacra, RB: Rías Baixas; grape cultivars (in green: organic, in black: conventional): Trx: Treixadura, Alb: Albariño, Bra: Brancellao, Men: Mencía.
J 04 00020 g005
Figure 6. CCA (A) and TB-PLS (B) of the correlation between NDVI and regional yeast species diversity in the four AOPs during the three consecutive years examined. AOPs: Mo: Monterrei, Ri: Ribeiro, RS: Ribeira Sacra, RB: Rías Baixas.
J 04 00020 g006
Figure 7. CCA of the influence of climatic factors, altitude, orientation, canopy, and soil management on the NDVI concerning the different AOPs during the three consecutive years examined. Factors: T, monthly average temperature; C canopy; R, monthly average rainfall; WS, monthly average wind speed; SM, soil management; RH, monthly average relative humidity; A, altitude; NS, north–south orientation; EW, east–west orientation; NESW, northeast–southwest orientation. S13, S14, and S15: yeast species richness in 2013, 2014, and 2015, respectively.
J 04 00020 g007
Table 1. Characteristics of vineyards and grapevine cultivars used in this study. Average annual rainfall during the three years of the study, obtained from the closest weather station to each vineyard (MeteoGalicia). AOP: Appellation of Origin.
AOPCultivarCodeCoordinatesElevation (m)Average Annual Rainfall (L/m2)
2013-2014-2015
Row Orientation
MonterreiTreixaduraMo-Trx41°52′11.9″ N, 7°25′49.7″ W
41°52′12.8″ N, 7°25′54.5″ W
406
402
787-928-595N–S
E–W
MencíaMo-Men41°52′11.0″ N, 7°25′51.9″ W
41°52′12.5″ N, 7°25′56.9″ W
404
399
N–S
E–W
RibeiroBrancellaoRi-Bra42°19′24.8″ N, 8°6′7.8″ W
42°19′22.3″ N, 8°5′51,7″ W
270
290
1211-1351-752E–W
N–S
TreixaduraRi-Trx42°19′27.6″ N, 8°6′2.0″ W
42°19′22.0″ N, 8°5′52.4″ W
278
289
E–W
N–S
Ribeira SacraMencíaRS-Men42°34′11.5″ N, 7°43′3.4″ W
42°34′11.4″ N, 7°43′3.5″ W
243
244
1075-1197-719NE–SW
NE–SW
Rías BaixasAlbariñoRB-Alb42°5′47.9″ N, 8°21′18.1″ W
42°5′46.8″ N, 8°21′16.9″ W
74
72
1489-1649-1071N−S
N−S
TreixaduraRB-Trx42°5′48.2″ N, 8°21′15.1″ W
42°5′46.2″ N, 8°21′17.7″ W
75
71
E–W
N–S
Table 2. NDVI (Normalized Difference Vegetation Index) values calculated using free-cloud Landsat 8 images from the study area taken in 2013, 2014, and 2015. July and August were selected due to the proximity of veraison.
Vineyard6 July 201323 August 20139 July 201425 July 201412 July 201529 August 2015
Mo-Men-A0.250.220.220.240.230.24
Mo-Men-B0.170.140.140.150.150.13
Mo-Trx-A0.230.200.190.220.200.23
Mo-Trx-B0.230.180.230.200.200.17
RB-Alb-A0.360.260.390.360.360.32
RB-Alb-B0.270.250.300.260.250.24
RB-Trx-A0.480.380.490.480.430.41
RB-Trx-B0.390.360.460.470.370.37
Ri-Bra-A0.260.240.310.290.310.26
Ri-Bra-B0.250.190.230.250.260.22
Ri-Trx-A0.290.240.320.290.290.27
Ri-Trx-B0.230.230.250.250.240.22
RS-Men-A0.310.290.330.310.310.24
RS-Men-B0.390.350.450.380.390.31
Publisher’s Note: MDPI stays neutral with regard to jurisdictional claims in published maps and institutional affiliations.