2.1. Goal and Scope Definition
This study assessed the environmental impacts of a demonstration-scale biorefinery that processes OFMSW into three energy products: bio-oils, bioethanol, and biogas. The assessment was conducted in accordance with the ISO 14040 [
25] and ISO 14044 [
26] standards for LCA. A summary of the goal and scope parameters is provided in
Table 1.
Avoided products were selected for the closest product-for-product equivalence to the biorefinery outputs using available ecoinvent datasets. Bio-oil is credited against crude rapeseed oil (the demonstration lipid requires further refining before it could substitute biodiesel); bioethanol against maize ethanol (the standard first-generation reference); and biogas CHP electricity against marginal biogas electricity, a deliberately conservative choice that avoids overstating the credit. See
Section 2.5.
The functional unit (FU) was defined as the processing of 1 tonne (1000 kg) of wet source-separated food waste with an initial moisture content of 75.9%. This FU reflects the as-received condition of the feedstock at the biorefinery gate and is consistent with the companion cost analysis and energy assessment [
23].
The system boundaries were defined as gate-to-gate [
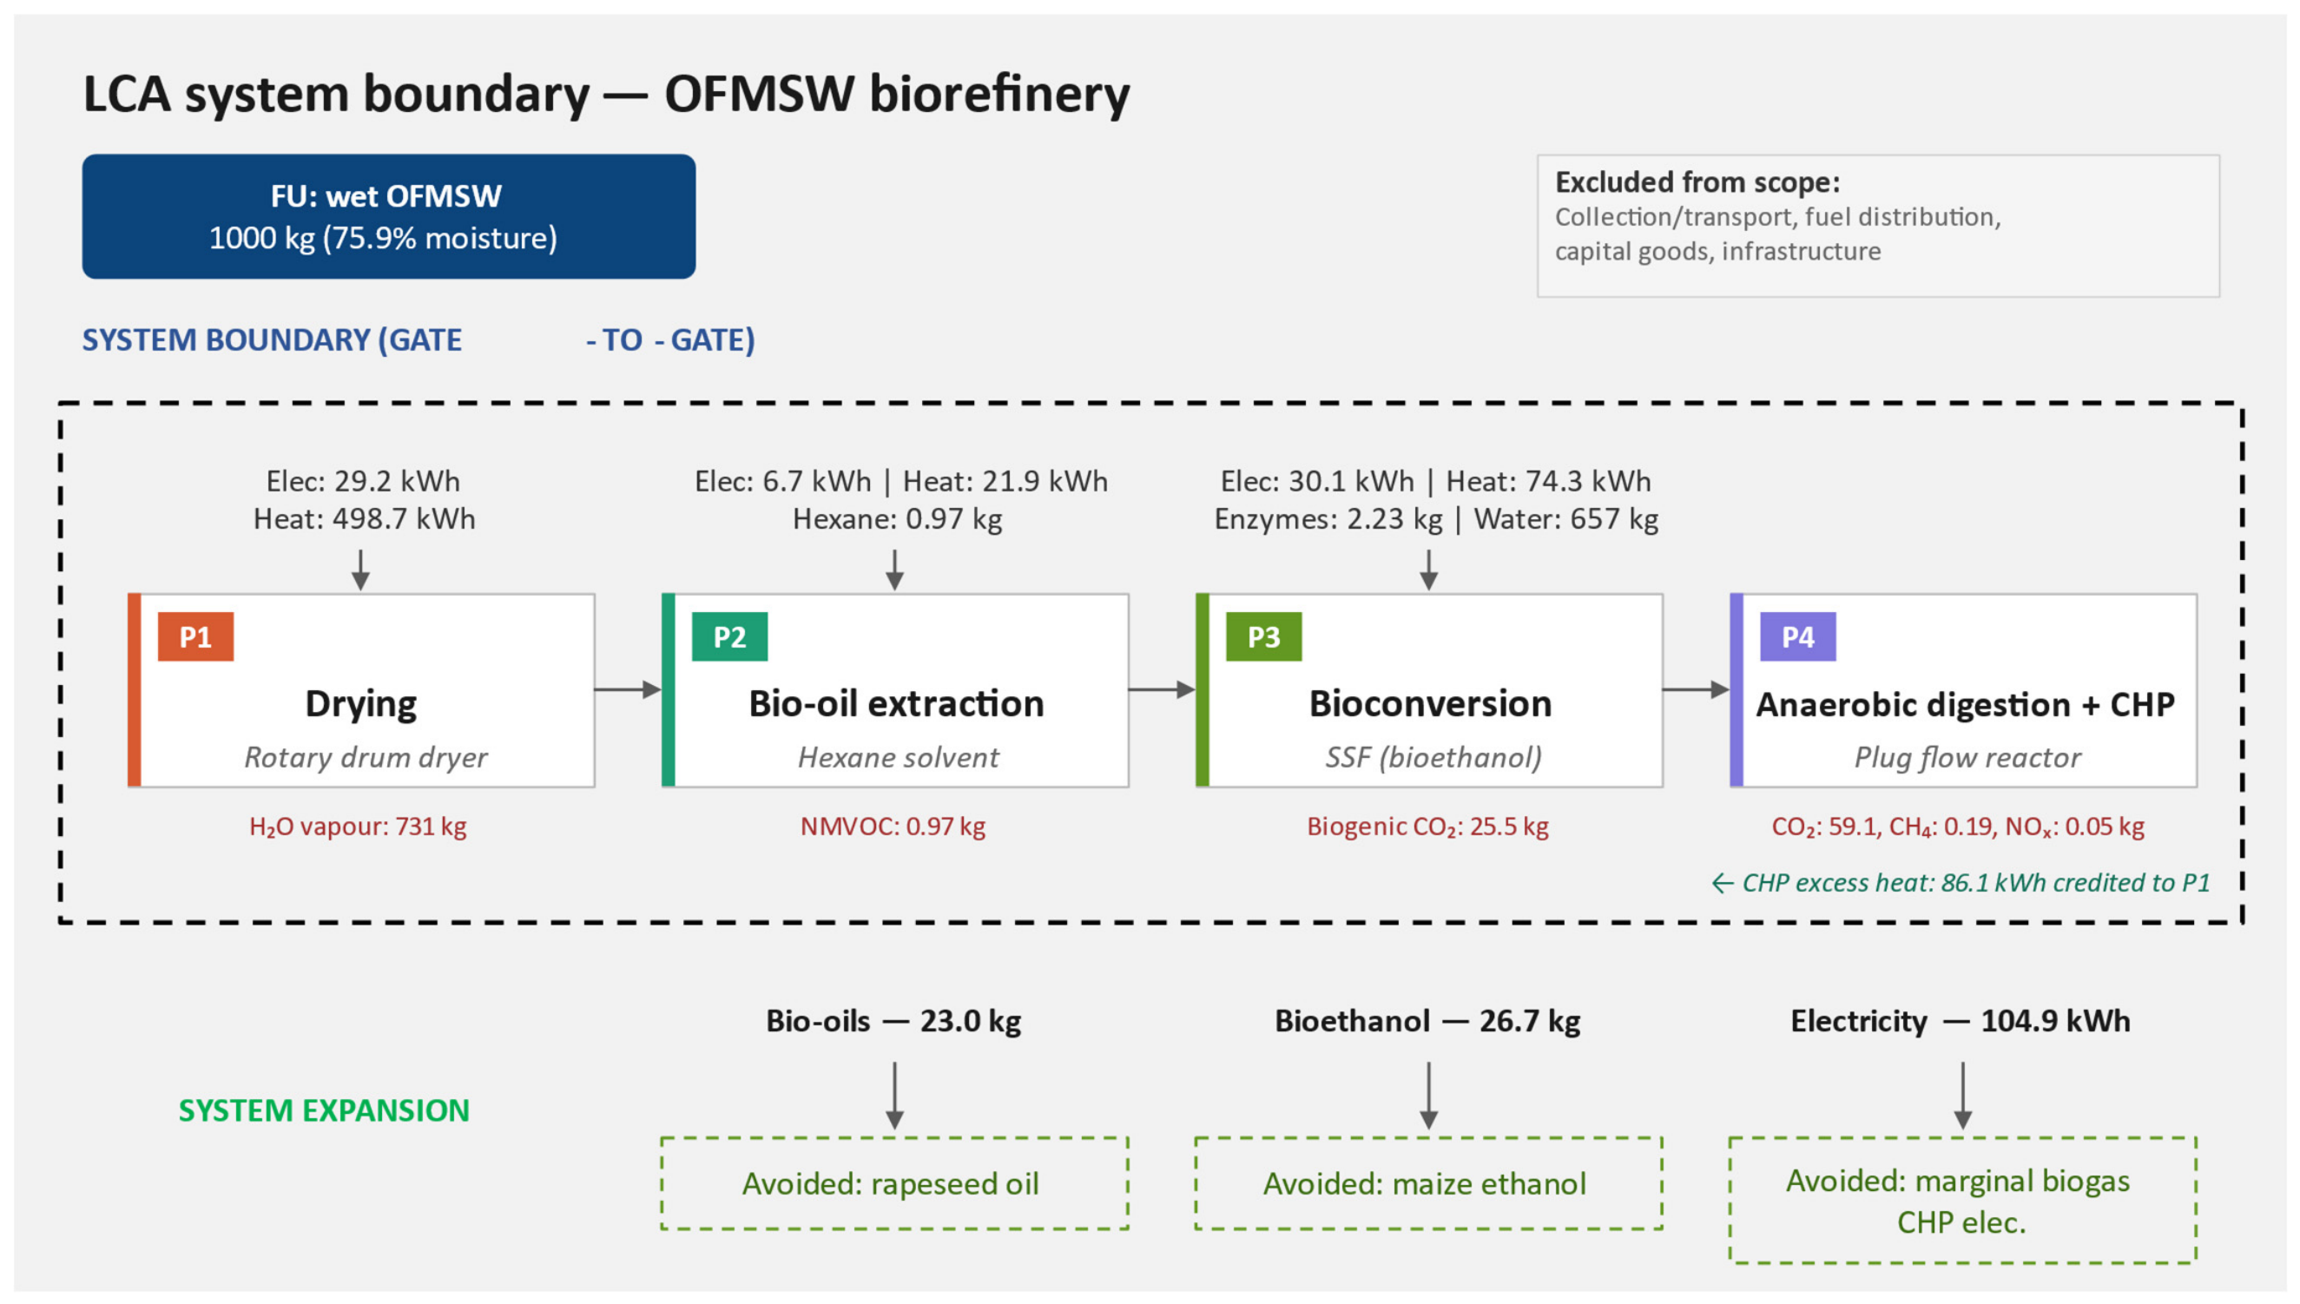
27], encompassing all conversion processes from the reception of wet food waste at the biorefinery to the production of the three energy co-products. The system comprised four process units: (P1) drying, (P2) bio-oil extraction, (P3) bioconversion to bioethanol, and (P4) AD with Combined Heat and Power (CHP) generation. The system boundaries and process flows are illustrated in
Figure 1. Upstream waste collection and transport to the plant, downstream fuel distribution, capital goods, and infrastructure were excluded from the system boundaries, consistent with the companion study [
23]. The fate of the digestate produced by AD was not explicitly modelled as a separate end-of-life scenario; however, the ecoinvent process for biowaste treatment by anaerobic digestion (RoW) used to model the AD unit inherently includes default assumptions for digestate handling as part of the ecoinvent system model. The environmental burdens associated with digestate management reported in the results therefore reflect these embedded ecoinvent assumptions rather than site-specific digestate management practices. Within this dataset the fermented residue (digestate) is de-watered and stabilised by post-composting (aerobic maturation), with the associated rotting and conditioning emissions included in the inventory; under the cut-off system model no credit is taken for the resulting compost as a fertiliser or soil amendment, and direct field application of raw digestate is not separately represented.
The LCA was performed using SimaPro 10.3.0.1 software. Background data were sourced from the ecoinvent 3.10 database using the cut-off by classification system model [
28]. Life cycle impact assessment was carried out using the ReCiPe 2016 Midpoint (H) V1.12/World (2010) H method [
29]. Long-term emissions were excluded from the assessment. In
Figure 1 the system’s boundaries are presented.
2.2. System Description
The biorefinery analysed in this study is a demonstration-scale facility established in the premises of NTUA at the Lavrion Technological and Cultural Park in Greece. The plant processes source-separated household food waste collected from the Municipality of Vari-Voula-Vouliagmeni (VVV) in Attica, Greece. A detailed description of the plant configuration, equipment specifications, and operational data is provided in Passadis et al. [
23]; the following subsections summarise the four process units as modelled in the LCA. Because the present LCA draws on the same operational dataset as that companion techno-economic and EROI assessment [
23], the environmental and economic analyses of the plant rest on a common inventory basis and can be read together.
P1. Drying unit. The first stage of the biorefinery employed a conventional rotary drum dryer with a processing capacity of 1 tonne per day of wet food waste. The drying unit integrates mechanical size reduction (shredding) as part of the feeding process; the electrical energy consumption reported (29.244 kWh per FU) includes the energy demand for both shredding and drying. The food waste, received at an initial moisture content of approximately 76% on a wet basis, was subjected to thermal drying to reduce its moisture content to below 10%. The physicochemical characterisation of the food waste feedstock, as determined from 23 batches totalling approximately 3 tonnes collected from VVV municipality [
23], is presented in
Table S4. These batches were collected across successive seasons during 2020–2021 to capture the seasonal variability of the source-separated feedstock; the corresponding seasonal characterisation is reported in detail by Tsafara et al. [
30], who found that, of the structural components, only the free-glucose content varied significantly between seasons, supporting the use of a single representative feedstock composition in the present assessment. The dryer operated in direct convection mode and was powered by a biomass burner using wood chips sourced from a certified sustainable supplier (represented in the LCA by a generic ecoinvent wood-chip dataset, a conservative choice that takes no credit for the certification), with inlet air temperatures in the range of 350–500 °C. Per functional unit, the drying stage produced 269 kg of dried biomass and evaporated 731 kg of water. Electrical consumption from the Greek medium-voltage grid amounted to 29.244 kWh per FU. The thermal energy requirement was governed by the SEC, defined as the total energy input to the drying unit per unit mass of water evaporated:
where SEC is the specific energy consumption [kWh/kg H
2O], ΣE is the total energy input to the drying unit [kWh], and ΣmH
2O is the total mass of water evaporated (kg).
The resulting thermal energy input was 498.73 kWh from the wood chips furnace. The drying process served as a shared preparatory step and did not itself generate a final product. Its energy consumption was therefore allocated between the bio-oil and bioethanol production lines, with 80% assigned to bio-oil extraction (P2) and 20% to bioconversion (P3). The allocation of drying energy between bio-oil extraction and bioethanol production was determined by physical causality. Bio-oil extraction via hexane solvent requires feedstock moisture below 10% (wet basis), necessitating deep drying through the energy-intensive falling-rate period. In contrast, SSF bioconversion operates at 25% solid loading and does not require moisture reduction to below 10%. During the falling-rate drying period, the energy required per unit mass of water evaporated increases non-linearly as the remaining moisture transitions from free water to bound water associated with the solid matrix [
31,
32]. Consequently, approximately 80% of the total drying energy is consumed in achieving the low moisture content required by extraction, whilst the remaining 20% is attributable to the partial drying sufficient for bioconversion. This physical causality-based allocation differs from the equal (50/50) cost allocation adopted in the companion cost analysis and energy assessment [
23], which did not distinguish between the energy demands of different drying endpoints.
P2. Bio-oil extraction. The extraction unit employed an integrated solid–liquid extraction process combined with a closed-loop solvent recovery system. Dried food waste was contacted with hexane as the extraction solvent under ambient conditions. The resulting mixture of hexane and oils (miscella) was separated by thermal distillation, with the vaporised hexane condensed and returned to dedicated storage tanks for reuse in subsequent extraction cycles. The system’s thermal energy requirements were met by a centralised steam boiler supplied by a wood chips furnace. The extraction efficiency was 85%, yielding 23.038 kg of bio-oils per FU. This efficiency was determined directly from the measured input–output mass balance of the demonstration-scale extraction unit, and therefore represents primary operational data rather than an assumed or theoretical value. Energy inputs comprised 6.65 kWh of grid electricity and 21.855 kWh of thermal energy. Hexane consumption was 0.966 kg per FU, which also represented the fugitive non-methane volatile organic compound (NMVOC) emissions to air from solvent losses [
33,
34]. This assumption represents a worst-case estimate, as a fraction of the make-up hexane may be retained as residual solvent in the extracted meal or bio-oil product rather than being emitted to air. No direct fugitive-emission measurements were available from the demonstration plant, so the full make-up hexane input (0.966 kg per FU) was conservatively assigned to air emissions.
P3. Bioconversion (bioethanol). Bioethanol production was based on SSF, a process combining enzymatic hydrolysis and anaerobic microbial fermentation in a single step [
24,
35]. The feedstock for the SSF stage was the defatted dried biomass following solvent extraction, which had undergone drying that reduced moisture content and altered the polysaccharide matrix in a manner analogous to the thermal pretreatments described for lignocellulosic feedstocks, thereby facilitating subsequent enzymatic access [
36]. The bioconversion unit consisted of a bioreactor with a working volume of approximately 1.5 m
3, equipped with indirect heating and cooling via a double-jacketed wall. The process employed Saccharomyces cerevisiae as the fermentation microorganism, supplemented with commercial enzyme preparations (CellicCTec3 cellulase and Spirizyme Excel HS amylase; both supplied by Novozymes A/S, Bagsværd, Denmark), at a total enzyme dosage of 2.231 kg per FU. The optimised operating conditions comprised a solid loading of 25%, a temperature of 35 °C, and a fermentation time of 18 h. Water input amounted to 657 kg per FU. The process yielded 26.656 kg of bioethanol per FU at a concentration subsequently suitable for recovery by distillation [
37], with energy inputs of 30.07 kWh of grid electricity and 74.326 kWh of thermal energy from a wood chips furnace. Fugitive emissions consisted of 25.508 kg of biogenic CO
2 released as fermentation off-gas.
P4. Anaerobic digestion. The stillage remaining after bioethanol recovery (873 kg) was directed to an AD unit consisting of a plug flow reactor (PFR) with a total volume of 5 m
3. The bioreactor operated under mesophilic conditions (approximately 40 °C) with a hydraulic retention time of 12–15 days. The AD process produced 60 kg of biogas per FU (equivalent to approximately 50 m
3), consistent with reported biogas yields from food waste in small-to-mid-scale digesters [
38,
39]. The biogas was assumed to be utilised in a CHP system operating at an overall efficiency of 86%, with an electrical efficiency of 37% and a thermal efficiency of 49%, consistent with literature values for biogas CHP applications [
23,
40]. This yielded 104.89 kWh of electricity per FU. The recovered excess thermal energy was considered to be available for use in the drying process. In the LCA model, 86.07 kWh of CHP excess heat was credited against the thermal energy demand of the drying unit, reducing the external wood chips heat requirement accordingly. Freight transport of 50 tkm (lorry 16–32 t, EURO 6) was included to account for internal material handling and logistics associated with the AD feedstock within the facility boundaries. Fugitive emissions from CHP combustion comprised 59.104 kg of biogenic CO
2, 0.19 kg of biogenic CH
4 (representing methane slip of approximately 1% of total methane mass flow), and 0.05245 kg of NO
x. The biogas was modelled as utilised on-site in the CHP unit to co-generate electricity and heat, consistent with the as-built plant configuration; biomethane upgrading is an alternative valorisation route with a different energy-substitution profile.
2.3. Life Cycle Inventory
The life cycle inventory (LCI) was compiled primarily from operational data obtained during demonstration-scale trials at the biorefinery, complemented by ecoinvent 3.10 background processes for upstream inputs. All mass and energy balances were normalised to the functional unit of 1 tonne of wet food waste. The complete LCI is presented in
Table S1.
Foreground data encompassed measured mass flows, energy consumption, material inputs, and product yields for all four process units. Where direct measurements were unavailable or deemed unrepresentative at the demonstration scale, the literature data and engineering assumptions were applied [
23]. The generic ecoinvent enzyme production process was used as a proxy for the specific commercial preparations (CellicCTec3 and Spirizyme Excel HS), as manufacturer-specific LCI data for these proprietary formulations are not publicly available. This proxy may over or underestimate the actual environmental footprint of the commercial preparations, and this uncertainty should be considered when interpreting the enzyme impact.
Fugitive emissions to air were modelled for three process units. In P2, NMVOC emissions of 0.966 kg per FU arose from hexane solvent losses during the extraction cycle. In P3, biogenic CO
2 emissions of 25.508 kg per FU were released as fermentation off-gas during the SSF process. In P4, CHP combustion generated 59.104 kg of biogenic CO
2, 0.19 kg of biogenic CH
4 from methane slip, and 0.05245 kg of NO
x. The total biogenic CO
2 emission across the biorefinery amounted to 84.612 kg per FU. Biogenic CO
2 was treated in accordance with the ReCiPe 2016 characterisation factors, which assign a global warming potential of zero to biogenic CO
2 from short-cycle biomass sources [
29]; we note that this convention has been contested on the grounds that atmospheric residence before biomass regrowth contributes to warming [
41]. All biomass inputs into the system are short-cycle biogenic carbon sources. The associated supply chain emissions, including any land-use related impacts, are captured within the respective ecoinvent background processes. Biogenic methane (CH
4) from CHP methane slip was characterised using the same global warming potential (GWP
100) characterisation factor as fossil methane under the ReCiPe 2016 (H) method.
Data quality varied across the inventory. Foreground data for mass flows, product yields, and direct energy consumption were obtained from demonstration-scale trials and are considered of high quality with respect to technological and temporal representativeness. Background data from ecoinvent 3 are geographically representative for European conditions, with the exception of the biowaste treatment and fodder yeast processes, which use rest-of-world (RoW) datasets. The ecoinvent enzyme production process is a generic proxy and may not fully represent the specific commercial preparations used. A complete list of all ecoinvent 3.10 datasets employed in the foreground and background systems is provided in
Table S3. Because these RoW datasets represent global-average rather than country-specific conditions, they may not fully reflect Greek or European biowaste-treatment and fermentation practice; the impacts attributed to these processes should therefore be read as approximate, a recognised geographic-representativeness limitation of the present inventory.
2.4. Life Cycle Impact Assessment
The environmental impacts were evaluated using the ReCiPe 2016 Midpoint (H) V1.12 method with the World (2010) H set of characterisation factors [
29]. This hierarchist perspective was selected as it represents a consensus time horizon and is widely adopted in waste management LCA studies [
42,
43]. The assessment covered all 18 midpoint impact categories: global warming potential (GWP, kg CO
2 eq); stratospheric ozone depletion potential (ODP, kg CFC-11 eq); ionising radiation potential (IRP, kBq Co-60 eq); ozone formation—human health (HOFP, kg NO
x eq); fine particulate matter formation potential (PMFP, kg PM
2.
5 eq); ozone formation—terrestrial ecosystems (EOFP, kg NO
x eq); terrestrial acidification potential (TAP, kg SO
2 eq); freshwater eutrophication potential (FEP, kg P eq); marine eutrophication potential (MEP, kg N eq); terrestrial ecotoxicity potential (TETP, kg 1,4-DCB); freshwater ecotoxicity potential (FETP, kg 1,4-DCB); marine ecotoxicity potential (METP, kg 1,4-DCB); human carcinogenic toxicity (HTPc, kg 1,4-DCB); human non-carcinogenic toxicity (HTPnc, kg 1,4-DCB); land use potential (LOP, m
2a crop eq); mineral resource scarcity (SOP, kg Cu eq); fossil resource scarcity (FFP, kg oil eq); and water consumption potential (WCP, m
3).
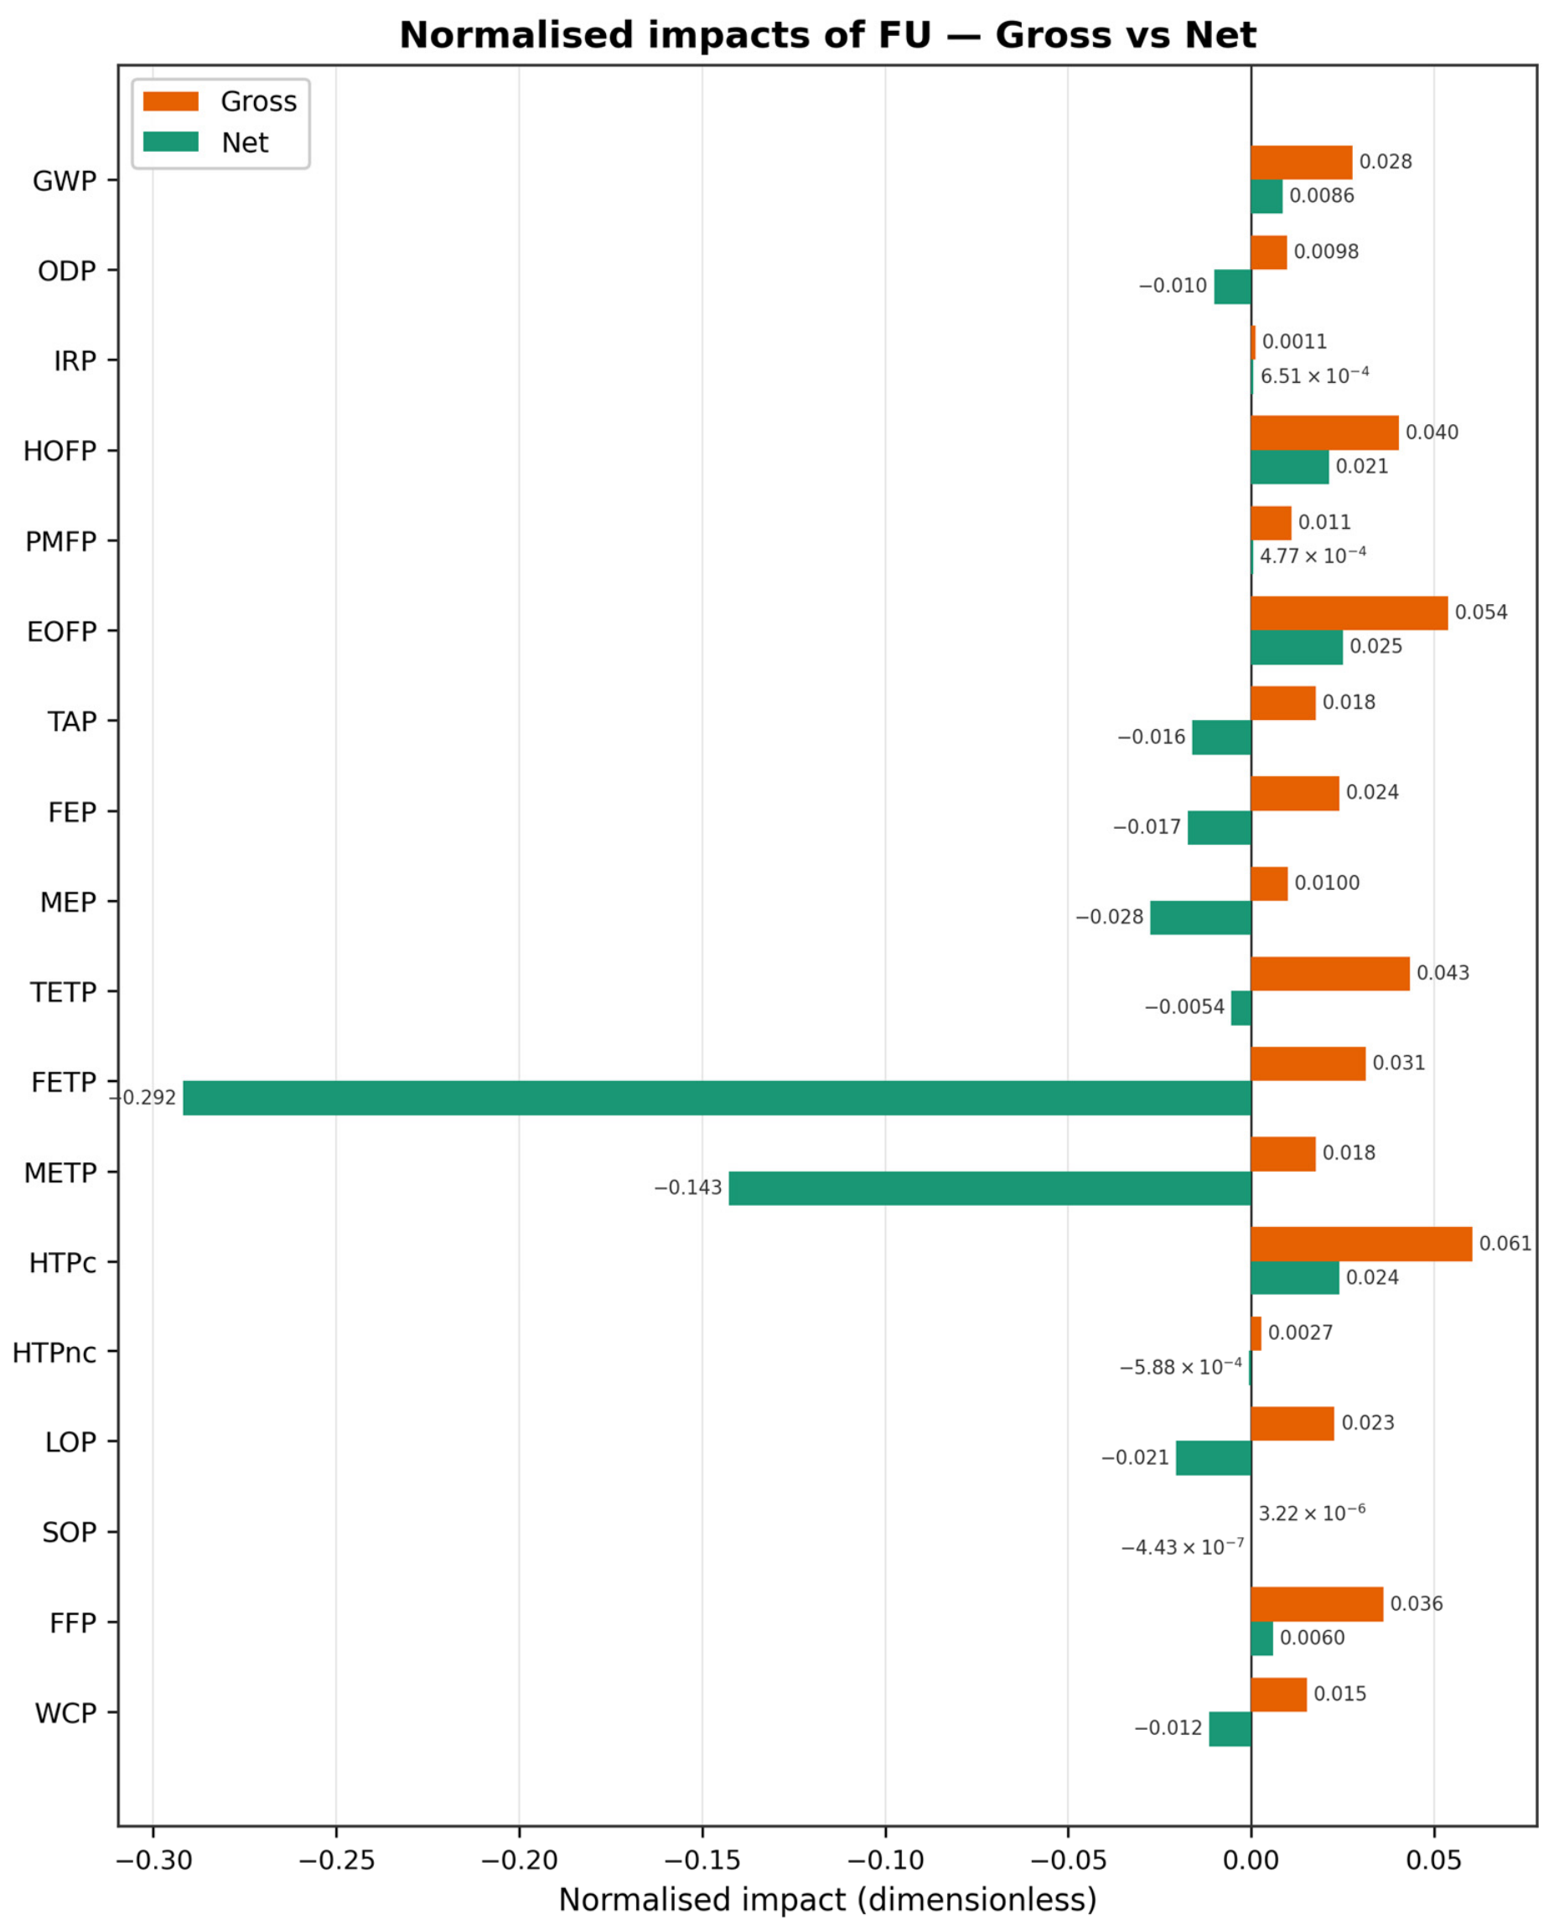
Normalisation was performed using World (2010) reference values [
44,
45] to identify the relative significance of the impact categories at the global scale. Long-term emissions were excluded from the characterisation step. This exclusion follows standard practice in waste management LCA and avoids the introduction of highly uncertain long-term emission estimates (typically exceeding 100-year time horizons) that can disproportionately affect toxicity categories without improving decision-making.
2.5. System Expansion
The multi-functionality of the biorefinery—producing three energy co-products from a single waste feedstock—was addressed through system expansion (avoided burden), in accordance with the ISO 14044 hierarchy for resolving co-product allocation [
26,
46,
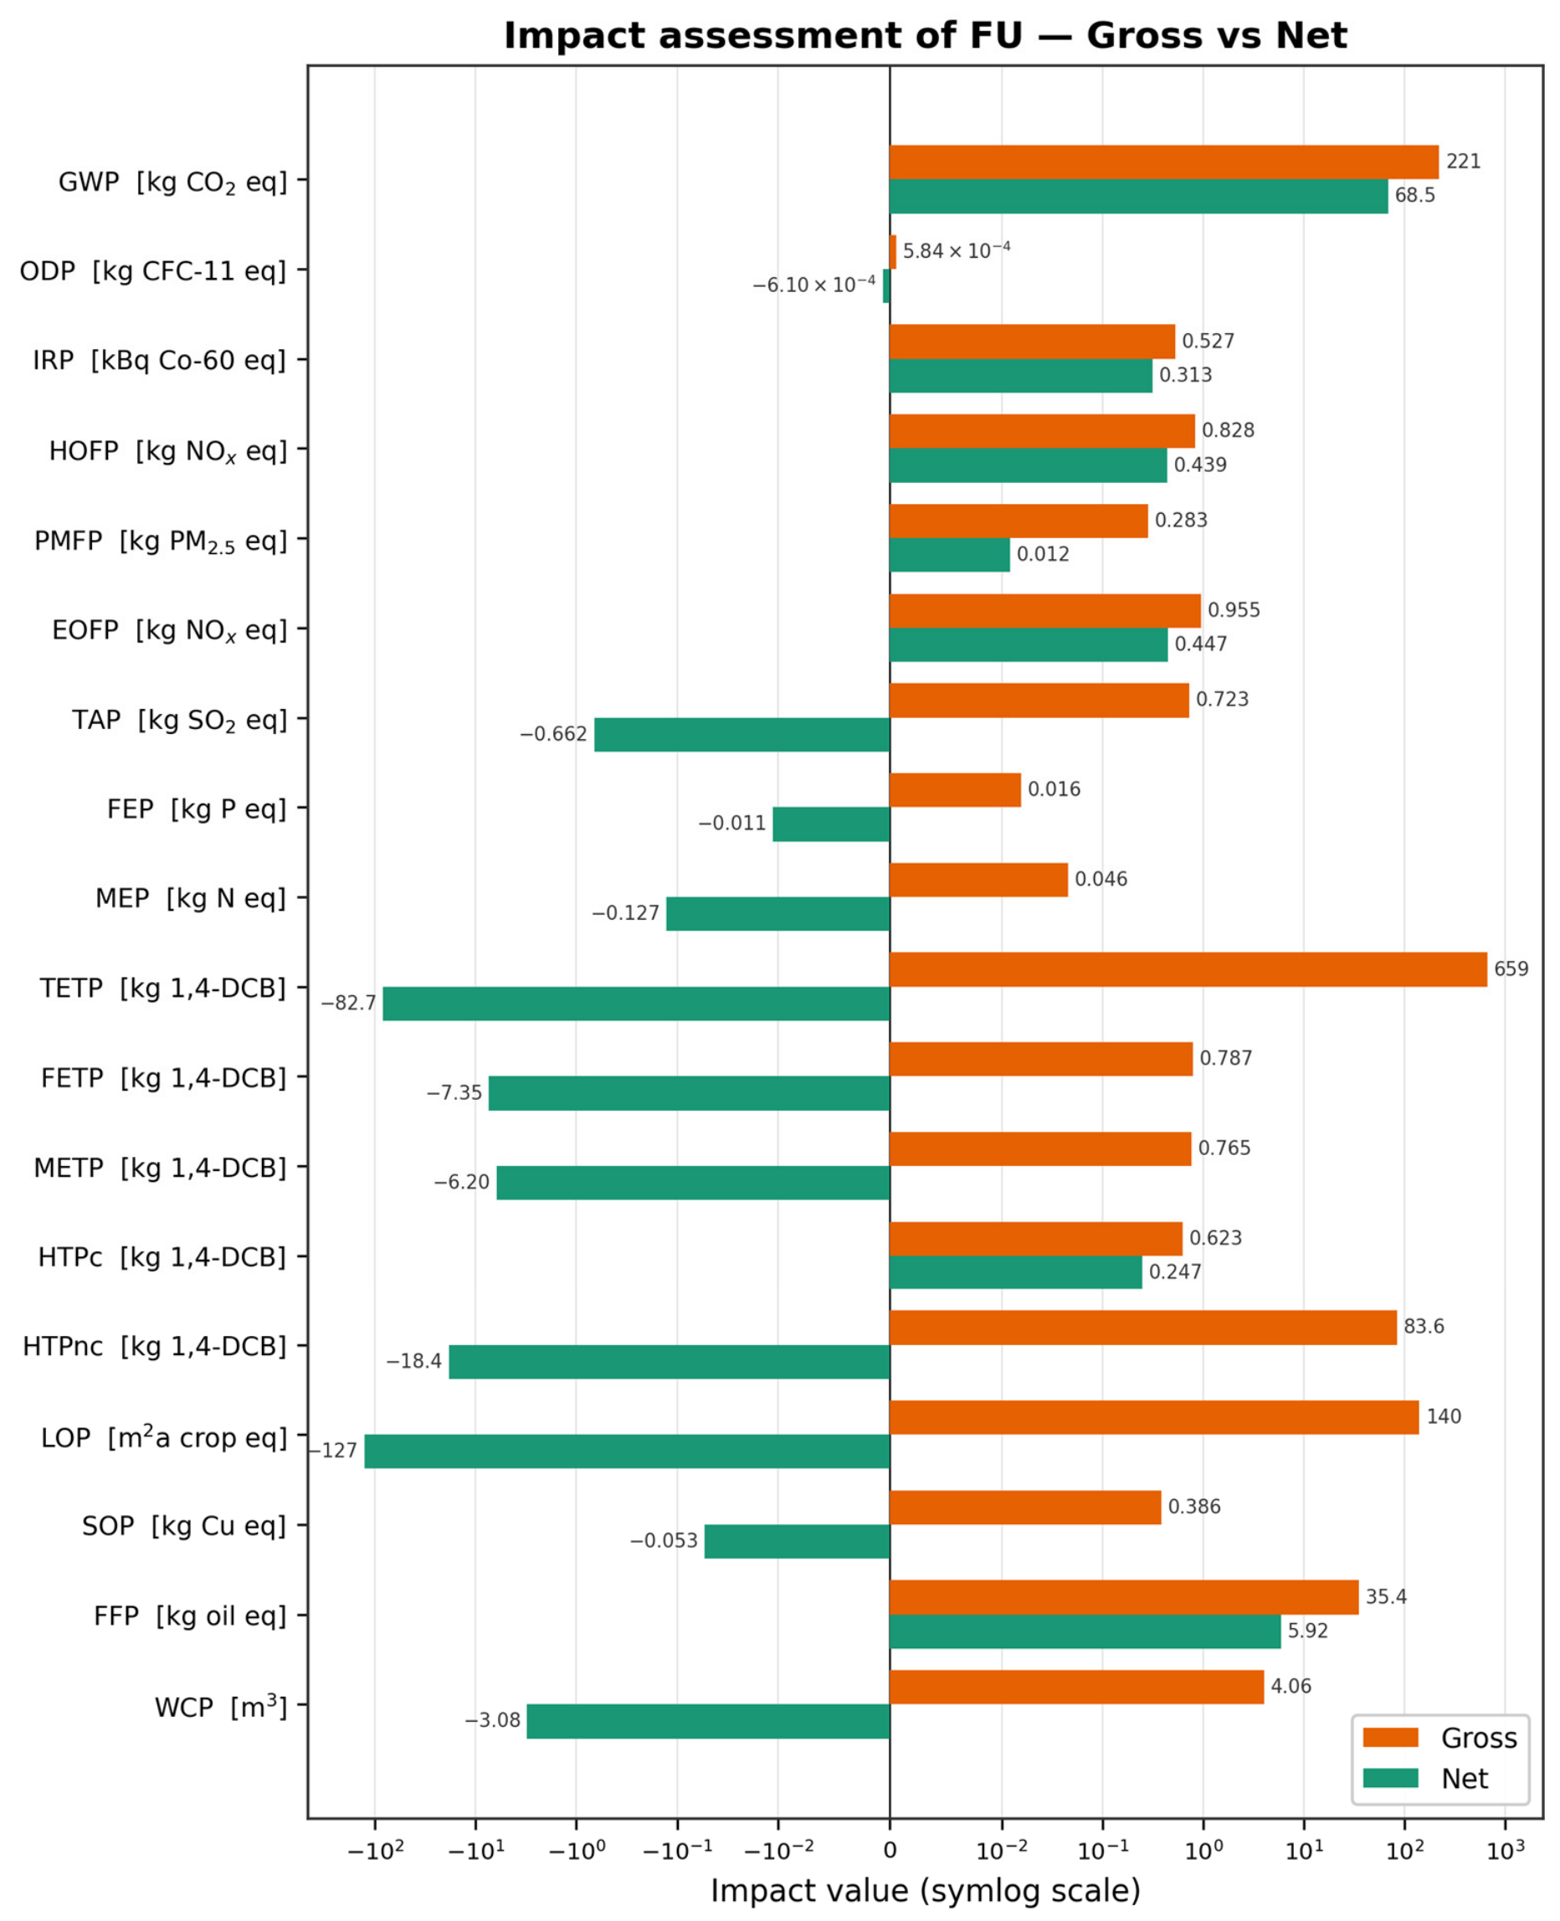
47]. Under this approach, the environmental burdens avoided by displacing conventional products were credited to the biorefinery system. The net environmental impact was calculated as:
where I_net is the net characterised impact for a given category, I_gross is the gross impact encompassing all burdens of the biorefinery without credits, and I_avoided is the characterised impact of the displaced conventional product.
Three avoided products were defined, with displacement quantities determined on the basis of product equivalence:
Bio-oils displacing rapeseed oil. The 23.038 kg of bio-oils produced per FU were credited as displacing an equivalent mass of crude rapeseed oil (solvent-grade, market mix, at regional storage, RER). Rapeseed oil was selected as the avoided product because the extracted lipids serve as a functional substitute for vegetable oil in solvent and chemical applications. This mass-based substitution reflects direct product equivalence rather than energy-equivalent displacement. The demonstration bio-oil is a crude extracted lipid that requires further refining and transesterification before it could serve as biodiesel; at this processing stage it is functionally equivalent to crude vegetable oil rather than to a finished fuel, which makes rapeseed oil the appropriate product-for-product substitute and the dominant vegetable-oil benchmark in the European market, allowing the waste-derived (second-generation) lipid to be compared against a conventional first-generation route. Food-waste derived bio-oil may nonetheless differ from refined rapeseed oil in properties such as oxidative stability, free fatty acid content, and impurity profile, so the substitution is made on a mass and primary-function basis rather than implying identical fuel quality.
Bioethanol displacing maize-derived ethanol. The 26.656 kg of bioethanol produced per FU were credited as displacing an equivalent mass of ethanol from maize fermentation (RoW). Maize ethanol was selected as the marginal conventional production route for fuel-grade ethanol, representing the product that OFMSW-derived bioethanol would most plausibly displace in the European market. Maize ethanol is the standard first-generation bioethanol reference, so this choice frames the waste-derived (second-generation) ethanol against the conventional first-generation route; wheat-based ethanol is a regional European alternative but is less established as a benchmark. The displaced ethanol is modelled using the ecoinvent “ethanol production from maize” (RoW) dataset, listed in full in
Table S3.
Biogas CHP electricity displacing marginal electricity. The 104.89 kWh of electricity generated by the biogas CHP system was credited as displacing an equivalent quantity of electricity from heat and power co-generation with biogas and gas engine (GR, high voltage). This avoided product was deliberately selected as the marginal technology rather than the average Greek grid mix. Since biogas-derived CHP electricity already possesses a low fossil carbon intensity, this substitution represents the most conservative system expansion choice and yields a smaller credit than displacing grid-average electricity or natural gas combined-cycle generation [
47,
48,
49].
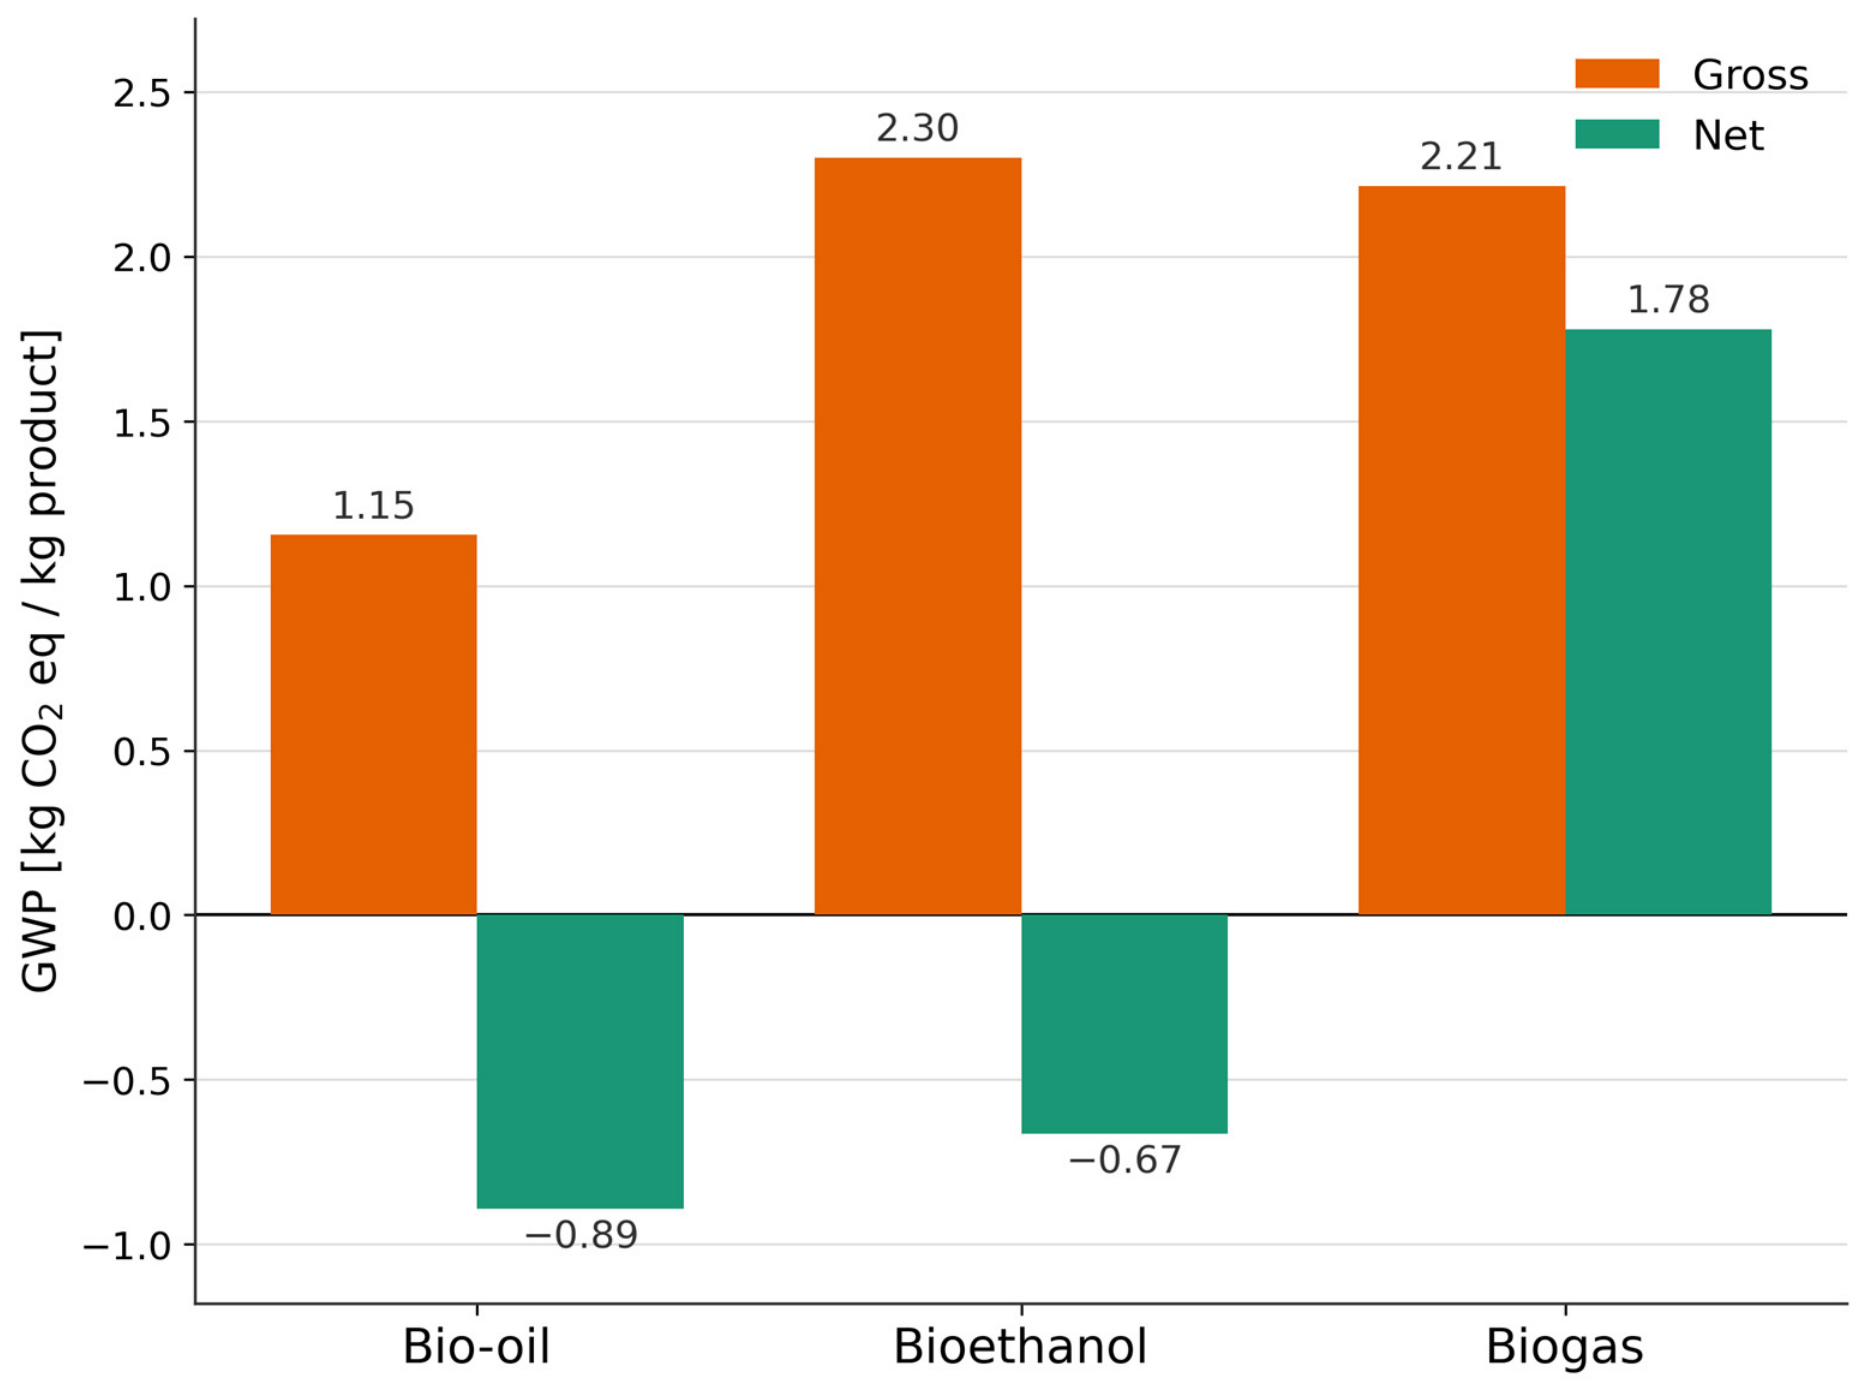
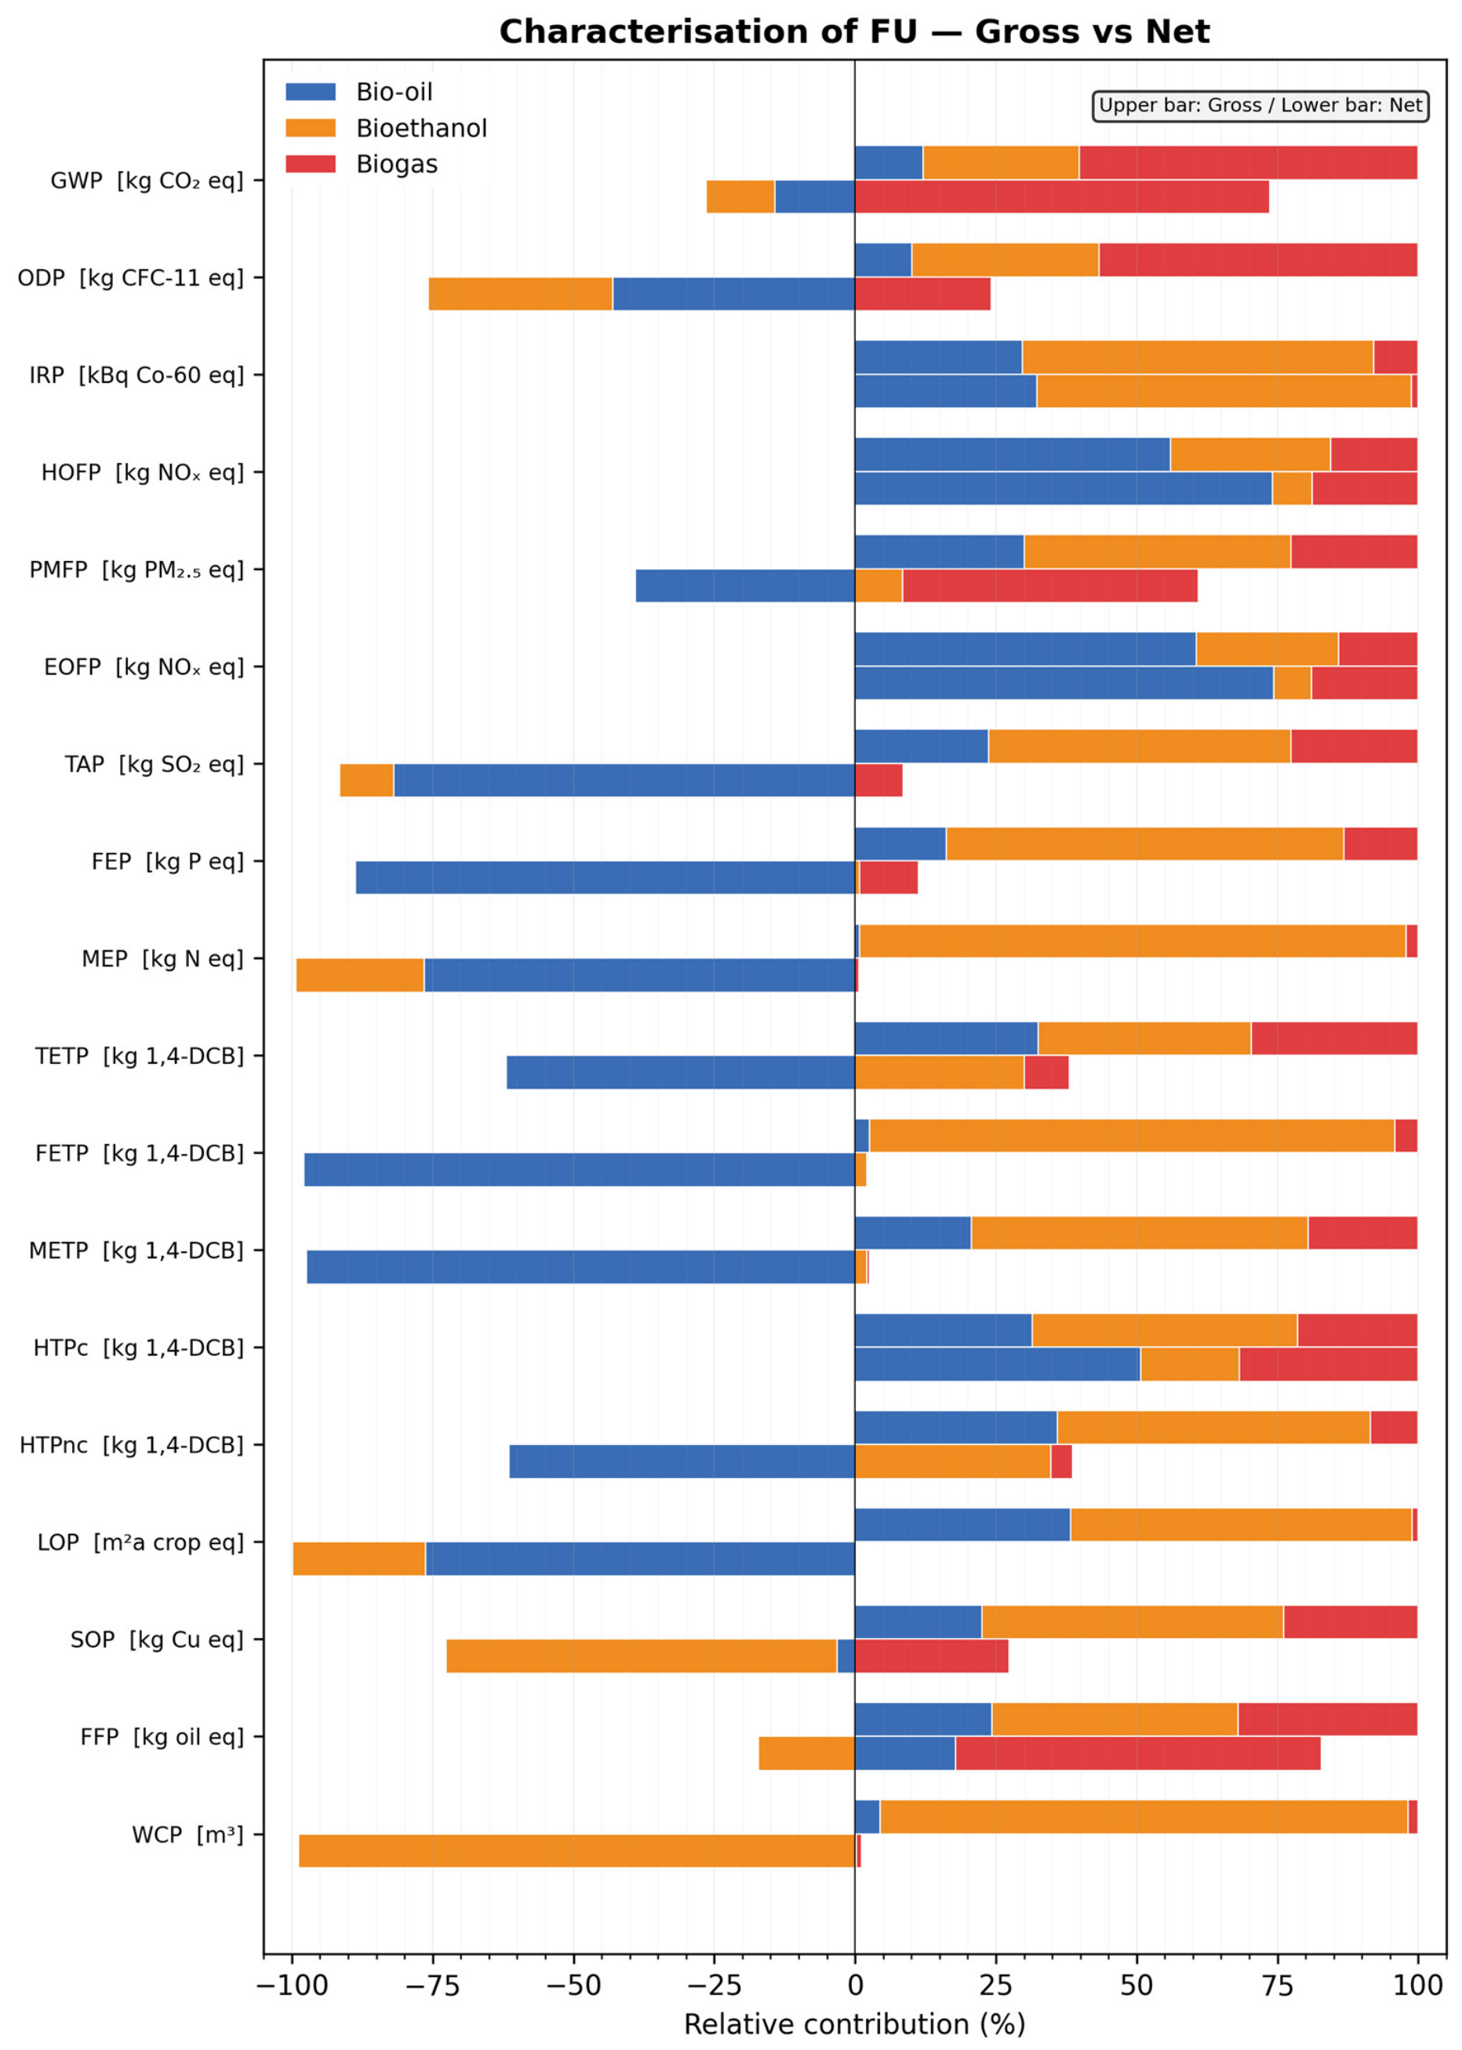
Throughout the study, results were reported under two complementary system views: “gross” (absolute burdens without credits) and “net” (with system expansion credits). This dual reporting enables transparent evaluation of both the intrinsic environmental performance and the substitution benefits of the system.
2.7. Monte Carlo Uncertainty Analysis
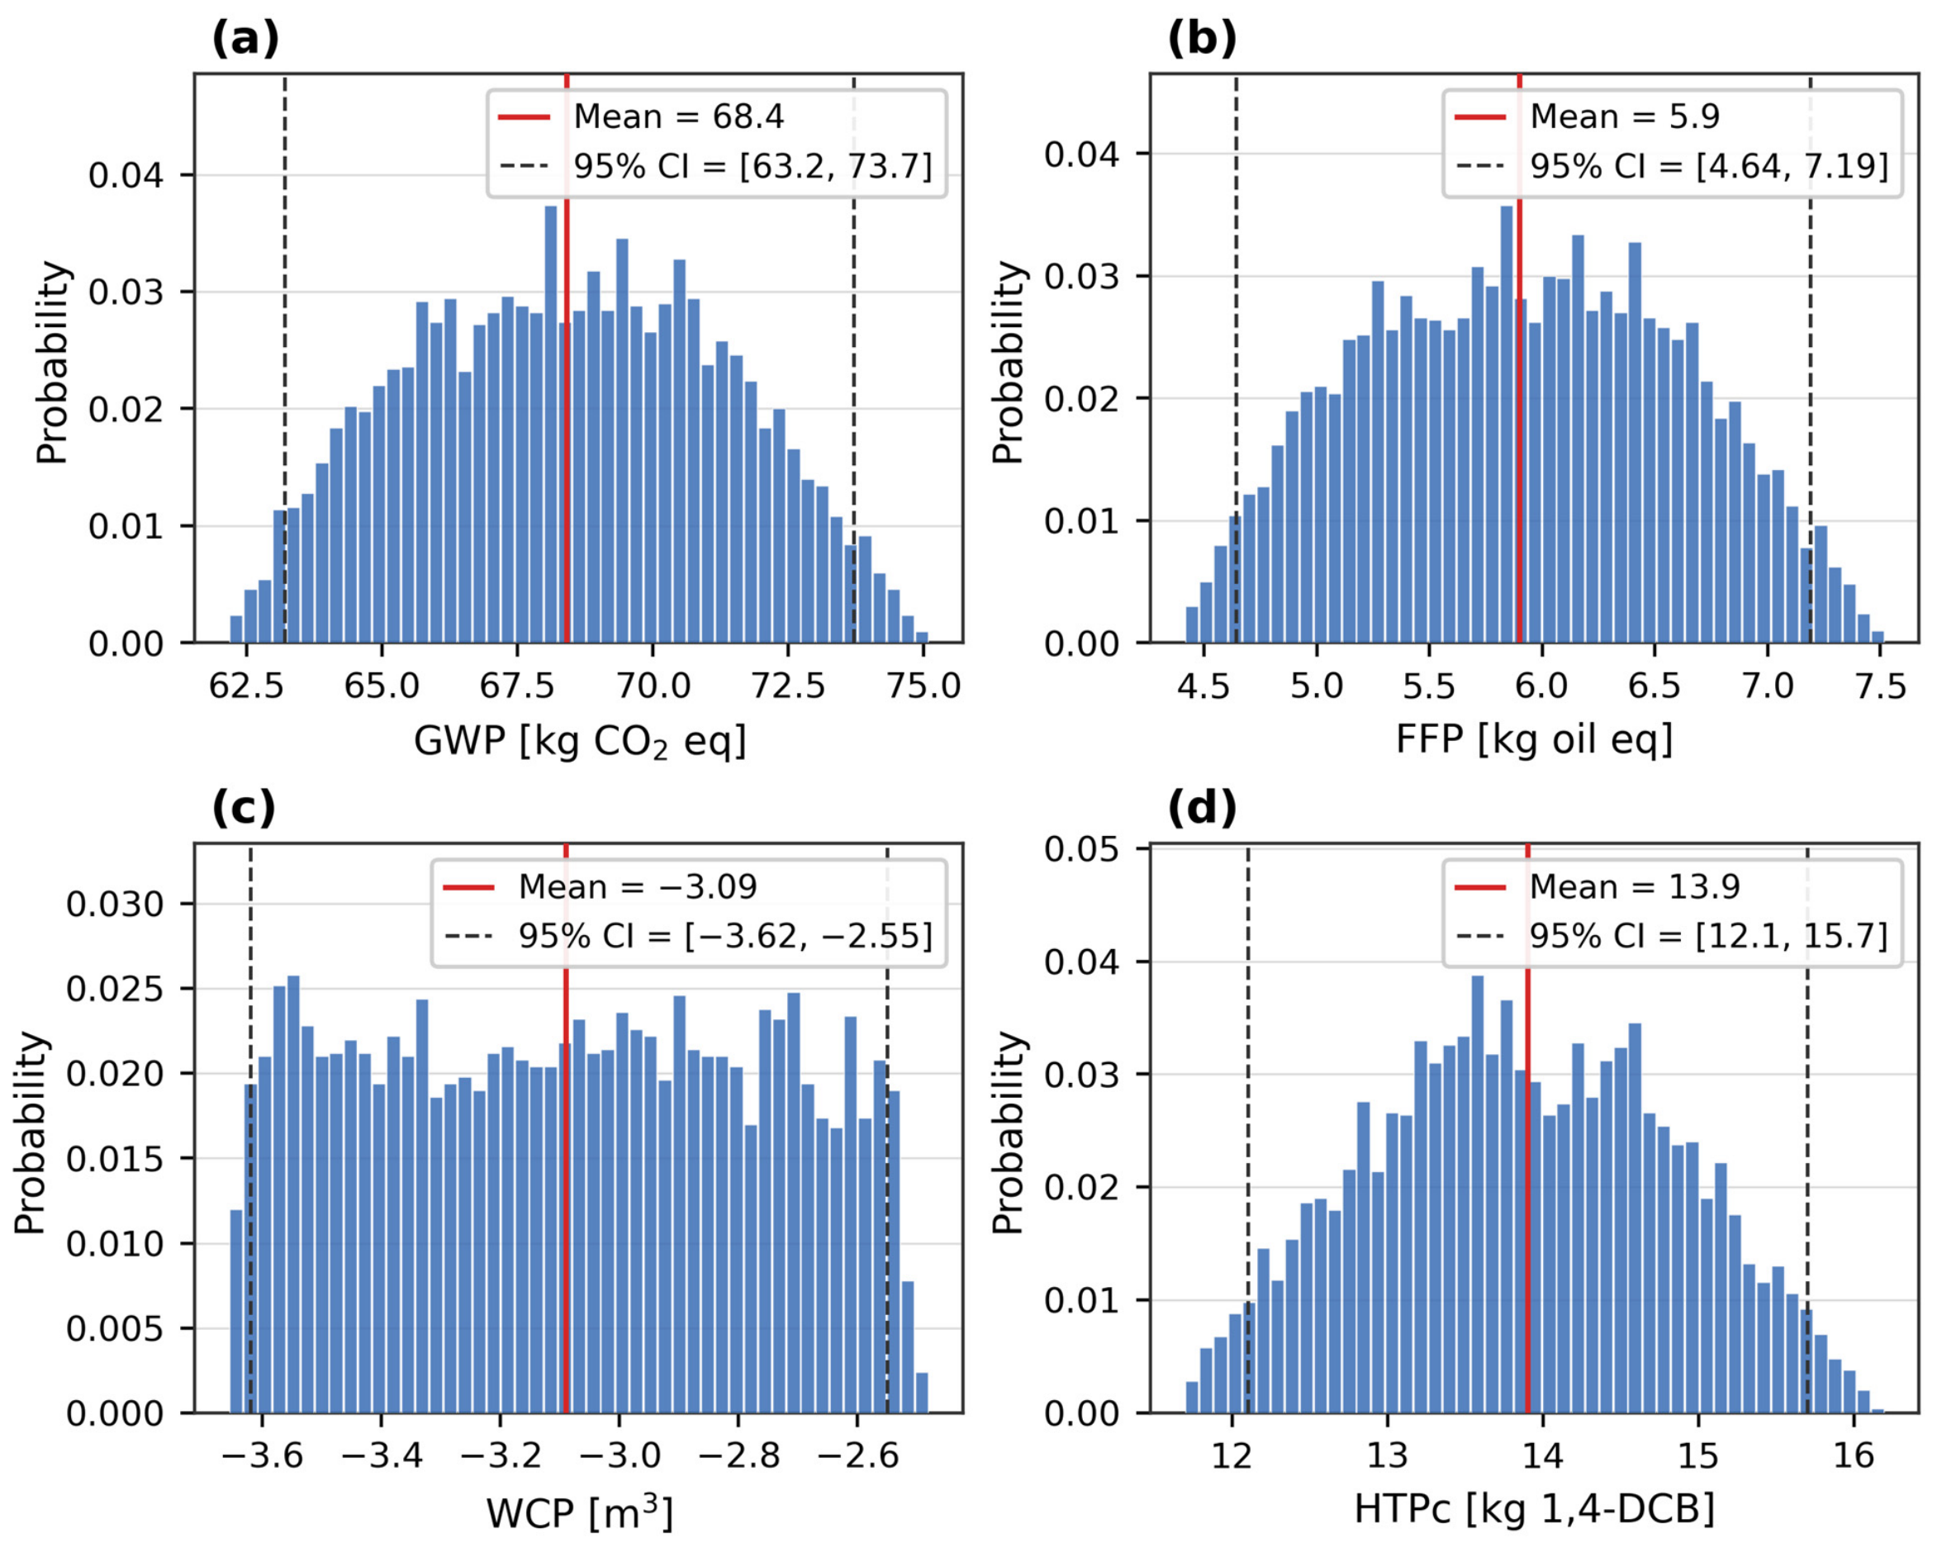
Stochastic uncertainty analysis was performed using Monte Carlo simulation to quantify the propagation of parameter uncertainty through the LCA model [
53]. A total of 5000 iterations were executed within SimaPro, with uncertainty propagated through all ecoinvent background processes using the default pedigree matrix uncertainty distributions, an approach widely adopted for stochastic uncertainty analysis in LCA [
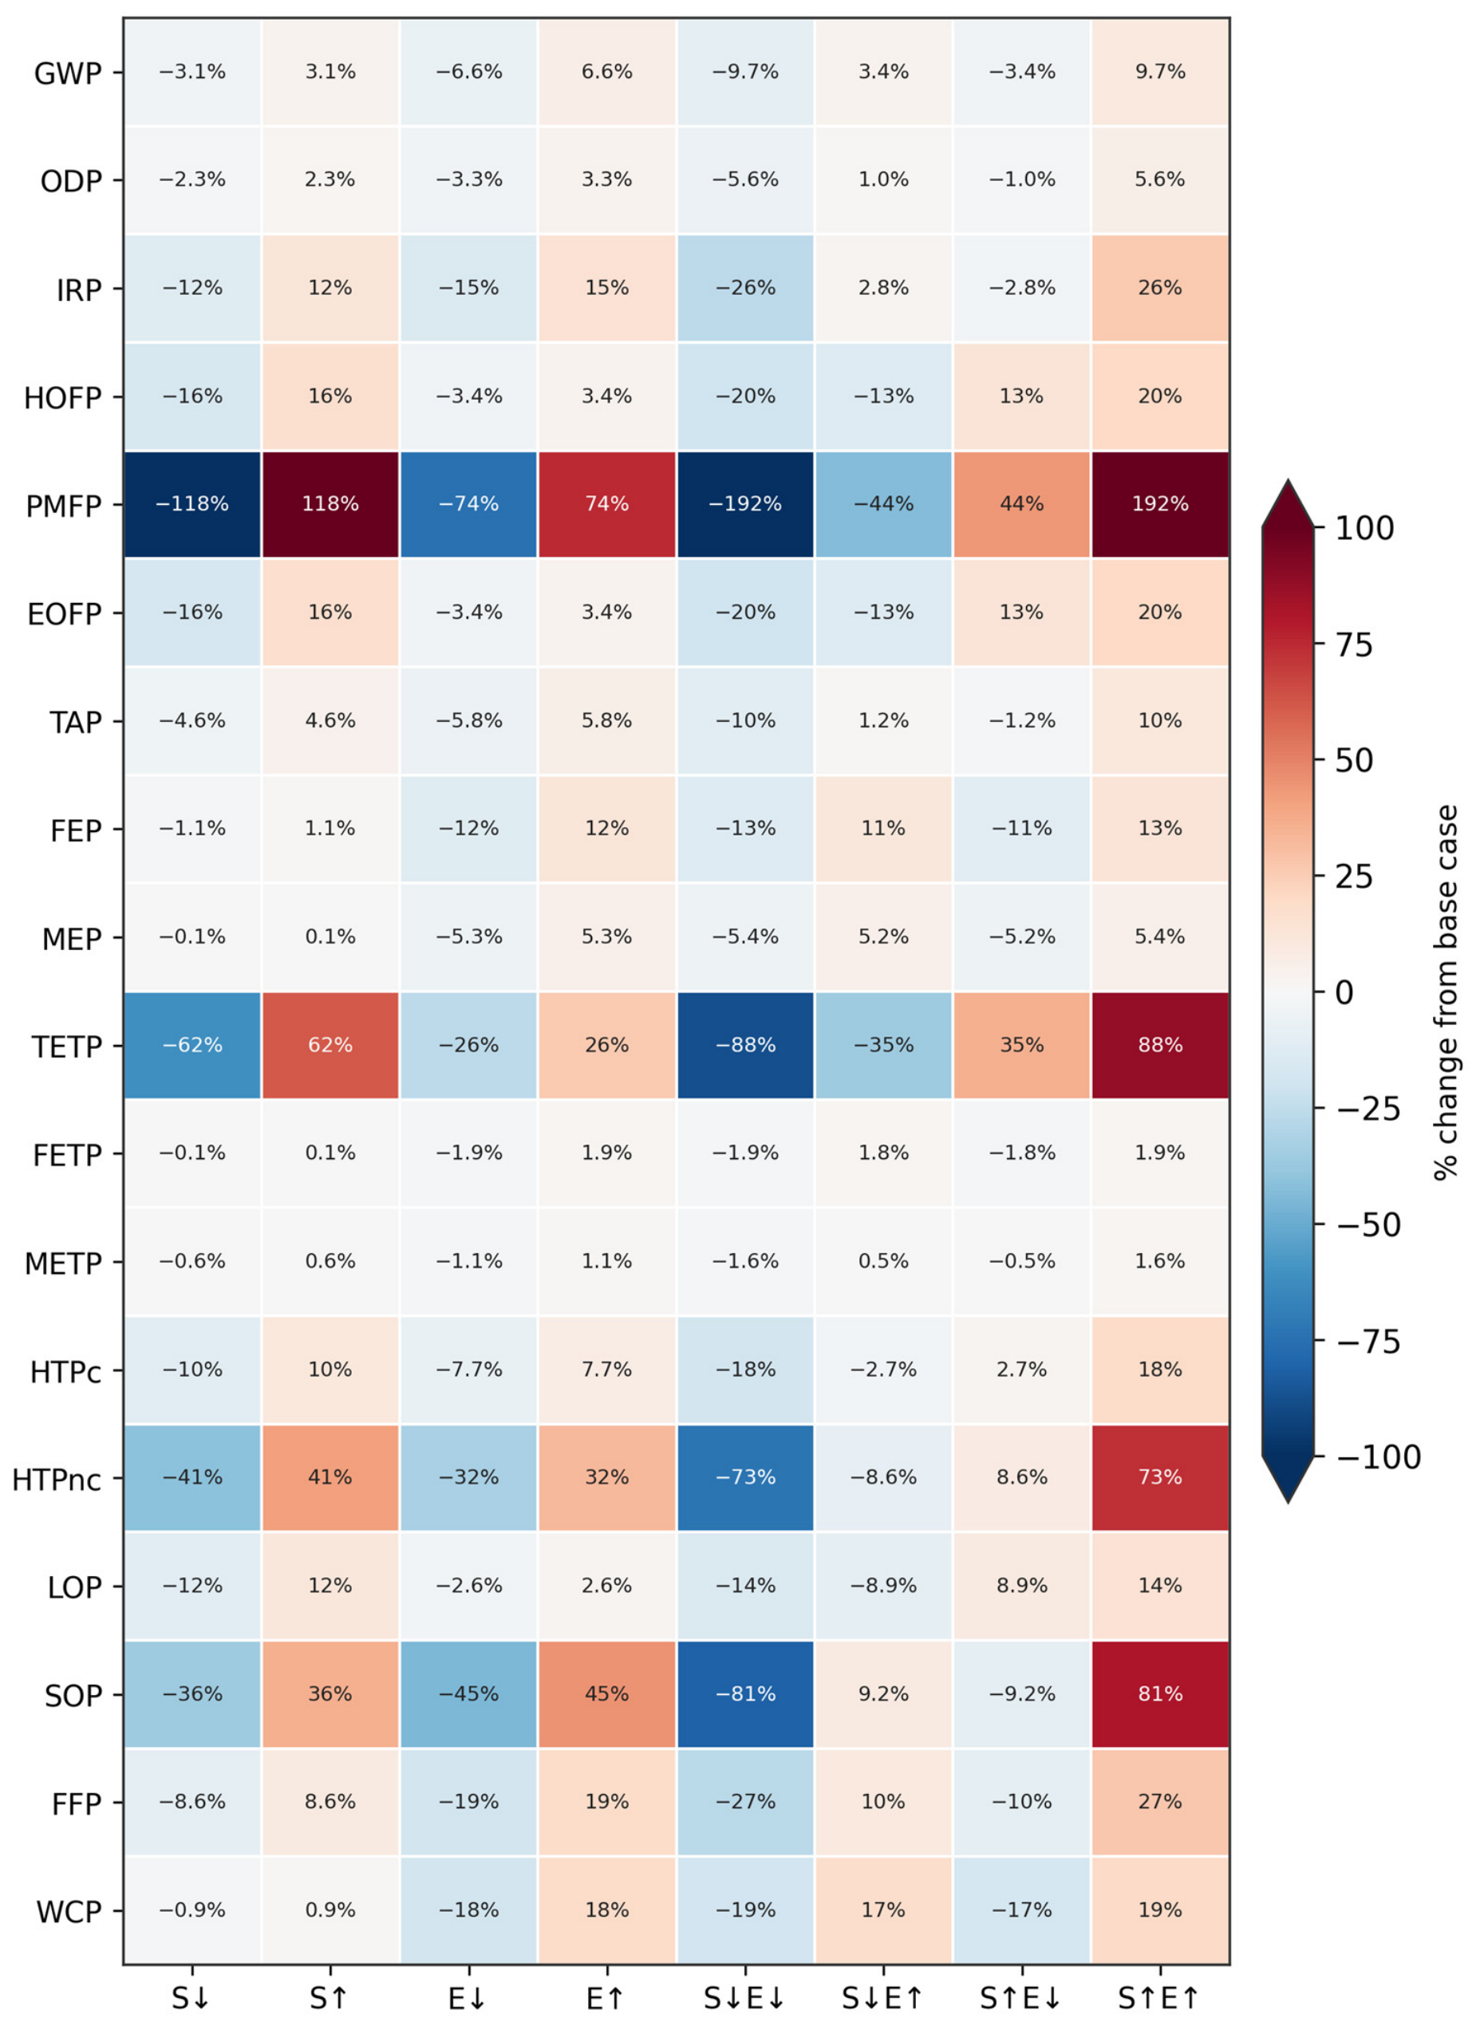
54]. The 95% confidence interval was adopted as the basis for reporting. The Monte Carlo simulation propagated uncertainty through the ecoinvent background processes only; foreground inventory parameters (SEC, enzyme dosage, CH4 slip) retained their deterministic base-case values during the simulation. Foreground parameter variability was instead addressed through the deterministic sensitivity analysis (
Section 2.6). The sensitivity analysis addresses foreground parameter influence; the Monte Carlo analysis addresses background data uncertainty.
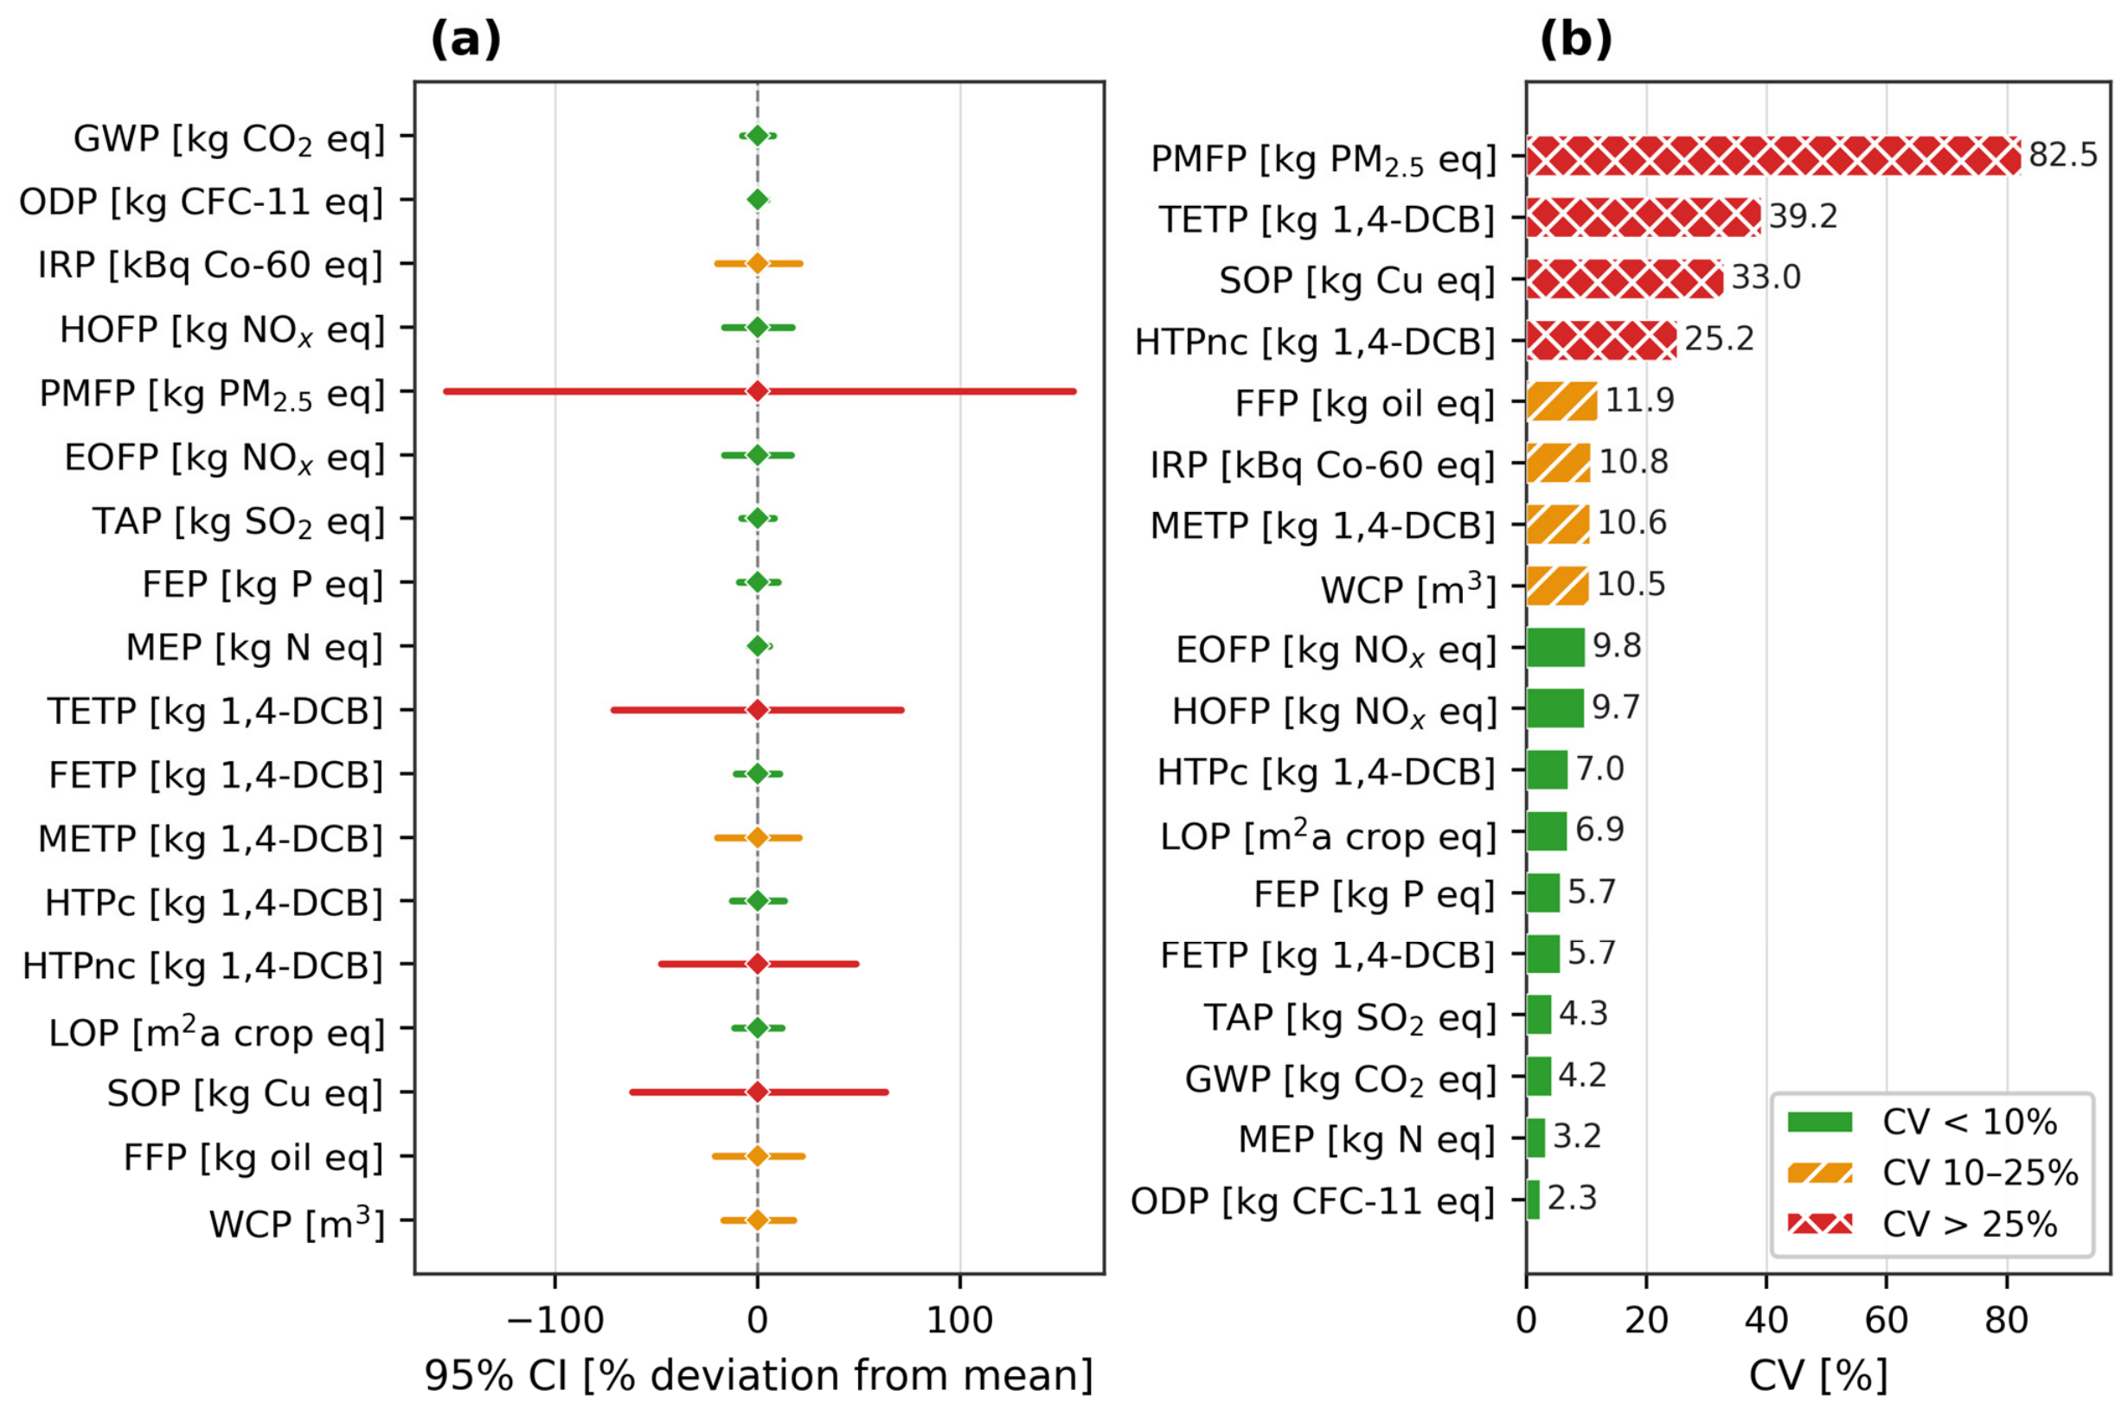
For each of the 18 midpoint impact categories, the following summary statistics were computed: mean, median, standard deviation (SD), and the 2.5th and 97.5th percentile values defining the 95% confidence interval. The coefficient of variation (CV) was calculated to provide a standardised measure of relative dispersion:
where CV is the coefficient of variation [%], SD is the standard deviation of the Monte Carlo distribution, and μ is the mean value. The CV enables comparison of uncertainty across impact categories irrespective of their absolute magnitudes, with lower values indicating greater robustness of the LCA results.