Article

The Influence of Synthesis Parameters on the Porous Structure of Biochars and Their Adsorption Performance


1
Department of Technology and Methods of Nanoproducts Manufacturing, Tambov State Technical University, 106 Sovetskaya St., Tambov 392000, Russia
2
Engineering and Technical Institute, Derzhavin Tambov State University, 33 Internatsionalnaya St., Tambov 392036, Russia
3
Department of Forest Genetics and Biotechnology, All-Russian Research Institute of Forest Genetics, Breeding and Biotechnology, 105 Lomonosov St., Voronezh 394087, Russia
4
Scientific and Educational Center for Environmental Science and Biotechnology, Derzhavin Tambov State University, 33 Internatsionalnaya St., Tambov 392000, Russia
*
Author to whom correspondence should be addressed.
Clean Technol. 2026, 8(4), 130; https://doi.org/10.3390/cleantechnol8040130
Submission received: 15 June 2026 / Revised: 1 August 2026 / Accepted: 11 August 2026 / Published: 13 August 2026
(This article belongs to the Topic CO2 Capture and Renewable Energy, 2nd Edition)

Abstract

The growing volume of crustacean shell waste generated during seafood processing poses a serious environmental problem. However, this type of biowaste remains underutilized, despite being a promising renewable raw material for the production of functional carbon materials. This study aims to investigate how synthesis parameters influence the formation of a hierarchical porous structure in shrimp shell-based carbon materials and to optimize these parameters to improve CO2 adsorption efficiency. Under optimal carbonization conditions (holding time: 2 h; temperature: 650 °C) and activation conditions (holding time: 2 h; temperature: 750 °C) with activator-to-carbon weight ratios (A/C) of 1/1, 2/1 and 4/1, the resulting porous carbon samples exhibited relatively high SBET values (1175, 2708 and 3052 m2/g, respectively) and VT (0.70, 1.55 and 2.60 cm3/g, respectively), as well as different pore size distributions. Notably, the resulting carbon materials demonstrated exceptional CO2 adsorption performance at 298 K, reaching a maximum adsorption capacity of 40.03 mmol/g at 40 bar for sample SS_652_41752, 15.12 mmol/g at 15 bar for SS_652_21752, and 3.41 mmol/g at 1 bar for SS_652_11752. These values rank among the highest ever reported for biomass-derived porous carbon materials. The adsorption behavior of the most efficient sorbent, SS_652_41752, was further analyzed using Langmuir and Freundlich isotherm models over the temperature range of 298–318 K and at pressures up to 40 bar, and the isosteric heats of adsorption were calculated to elucidate adsorbent–adsorbate interactions. It was found that the differential molar isosteric heat of CO2 adsorption decreased from approximately 20 to approximately 17 kJ/mol with increasing adsorption uptake, confirming the physisorption nature of the process. These results demonstrate that crustacean shell waste is a promising feedstock for producing carbon materials with tailored properties and significant potential for CO2 adsorption applications.

1. Introduction

The accumulation of seafood waste, particularly crustacean shell waste, is a complex problem with environmental, economic, and social implications. One promising approach to utilizing this waste and mitigating its environmental impact is to use it as a precursor for the synthesis of nanoporous carbon materials. The exoskeleton of crustaceans is formed through a biomineralization process involving an organic matrix composed primarily of chitin fibrils. Since crustacean shells contain 20–40% protein, 20–50% CaCO3, and 15–40% chitin, which is a polymer of (1 → 4)-β-linked N-acetyl-D-glucosamine [1], the bioconversion of this waste offers an opportunity to reduce the environmental burden while generating economic benefits by transforming problematic waste into a valuable product.
Over the past two decades, a substantial body of research worldwide has addressed the conversion of marine biomass waste into highly porous carbon materials [2]. Various types of carbon nanomaterials, such as carbon quantum dots, carbon nanotubes, porous carbon, carbon aerogels, and others, can be produced from crustacean waste [3,4,5]. However, the properties of the resulting materials depend on the synthesis methods and parameters [6,7]. Among the available methods, carbonization is the most studied and effective method for obtaining carbon materials from crustacean shell waste [8]. Carbonization is performed by heating in an inert atmosphere, typically in the temperature range of 400 °C to 900 °C. During this process, the organic components of the shells, primarily chitin and proteins, decompose to yield a carbon-rich residue. Thermal degradation of C–C bonds present in the organic fraction and removal of volatile species lead to the formation of carbon materials with an increased proportion of sp2-hybridized carbon atoms in the structures [9,10]. Carbonization of crustacean waste also induces pore formation, increases surface area [11], enlarges the size of polyaromatic ring systems [10], and promotes the development of graphitic structures [12]. Activation of the carbonized products obtained from crustacean shells is a crucial step for improving the characteristics of the final material, particularly for producing highly porous carbon structures. Activation enables carbon materials to attain a stable porous architecture and a well-developed specific surface area, thereby enhancing adsorption properties [13]. Compared with physical activation, chemical activation generally offers shorter reaction time, better control over the activation process, lower reaction temperatures, and higher activation efficiency [14]. In addition, chemical activation can effectively tailor the pore structure, pore size distribution, and specific surface area [15]. Various activating agents have been employed to produce carbon materials from crustacean waste, but the most common and effective agent for obtaining highly porous carbon materials is the alkaline activator KOH [16,17].
Previous studies have shown that biomass-derived carbon materials possess excellent characteristics for efficient CO2 adsorption. However, efforts to improve their performance still face challenges such as difficulty in controlling their structure [18]. In particular, changes in pore structure and pore volume significantly affect the properties of carbon materials. Therefore, in-depth investigation and optimization of the porous structure of biochars are crucial for further enhancement of their CO2 adsorption efficiency.
Thus, the conversion of crustacean shell waste into value-added carbon materials is an important contribution to the circular bioeconomy. It allows spent crustacean shells to be used as precursors for advanced functional materials rather than being treated as waste.
The objectives of this study were: (a) to evaluate crustacean shells as a precursor for KOH-activated biochar for CO2 adsorption; (b) to examine the influence of synthesis parameters, including pre-carbonization and alkali activation, on pore structure development; (c) to analyze the relationship between the pore structure of KOH-activated crustacean shell-derived biochar and its adsorption capacity; and (d) to investigate the adsorption mechanisms governing the performance of the biochar as a CO2 adsorbent. Overall, this study provides a framework for valorizing biomass waste and for producing carbon materials with tailored porosity for efficient CO2 adsorption.

2. Materials and Methods

2.1. Materials

The following materials and reagents were used to prepare the carbon materials: shrimp shells (SS), potassium hydroxide (KOH), hydrochloric acid (HCl), argon (Ar), and distilled water (H2O). High-purity gaseous carbon dioxide was used in the study.

2.2. Biochar Synthesis

The carbon material synthesis comprised two main stages: carbonization and activation. First, shrimp shells were repeatedly washed with deionized water, dried, ground into powder, and sieved. The resulting solid sample with particle size < 0.5 mm was placed in a reactor and carbonized in an argon atmosphere for various times (1, 2, 3 h) at different final temperatures (550, 650 and 750 °C).
The carbonizate exhibiting the best porous-structure parameters was activated with potassium hydroxide, while varying the following process conditions: duration (1, 2, 3 h), temperature (650, 750, 850 °C), and the weight ratio of activating agent (KOH) to carbonizate (1/1, 2/1, 4/1). Thus, the obtained carbonizate powder (particle size < 0.5 mm) and pellets of 85%-potassium hydroxide were loaded into the experimental reactor in the specified weight ratio of potassium hydroxide (converted to 100%-KOH)/carbonizate. Under an argon flow, the reaction mixture was heated to the target temperature, held for the prescribed time, and then cooled to room temperature. After cooling, the reaction mixture was poured into water, the precipitate was washed until the alkali was removed and neutral pH was achieved, then treated for 24 h in hydrochloric acid solution to dissolve metal-containing impurities, after which it was washed again with water and dried at 110 °C to constant weight.
The nomenclature of each sample includes the feedstock name (SS), the carbonization temperature (for example, 650 °C corresponds to 65), the carbonization time in hours, the activation temperature (for example, 500 °C corresponds to 50), the activation time in hours, and the KOH/carbonizate weight ratio (for example, 2/1 corresponds to 21). Thus, an activated biochar prepared by carbonization at 650 °C for 2 h followed by activation with a KOH/carbonizate ratio of 2/1 at 500 °C for 2 h would be designated SS_652_21502.

2.3. Characterization Methods

Characterization of the porous structure of all samples was performed by physical gas adsorption (N2 at 77 K) using the automated adsorption system Autosorb-iQ (Quantachrome Instruments, Boynton Beach, FL, USA). Samples (weight 0.02 g) were degassed at 350 °C for 5 h prior to porous structure analysis to remove air, free water, and other impurities. N2 adsorption isotherms were obtained at 77 K for relative pressure (P/P0) (gas pressure/saturated vapor pressure) in the range from 0.01 to 0.995. The specific surface area SBET was calculated using the BET (Brunauer–Emmett–Teller) equation. The distribution of pore size and the volumes of micropores and mesopores were calculated using the density functional theory (DFT) under the assumption of slit-shaped/cylindrical/spherical pores (QSDFT model).
CO2 adsorption–desorption isotherms were recorded on the iSorbHP gas adsorption analyzer (Anton Paar GmbH, Graz, Austria) at various temperatures (298.15, 303.15, 308.15, 313.15, 318.15 K) and pressures up to 40 bar. Prior to measurements, samples were degassed at 350 °C for 5 h to remove adsorbed water and impurities.
The fundamental difference between adsorption phenomena occurring in micropores and on mesopore surfaces requires different theoretical approaches for their description and interpretation. In this regard, the experimental CO2 adsorption isotherms were correlated with the Langmuir and Freundlich models according to the following equations [19,20]:
a L m o d = A k L p 1 + k L p
a F m o d = k F p 1 n
where a L m o d is the value of equilibrium CO2 adsorption; p is the equilibrium pressure of the gas phase; A is the limiting value of CO2 adsorption; k L is the Langmuir adsorption constant; where a F m o d is the equilibrium CO2 adsorption value; k F is the equilibrium constant of the Freundlich model; n is an empirical parameter characterizing the interaction energy in the adsorbent–adsorbate system.
The reliability of these models was assessed by the regression coefficient R2, which varies from 0 to 1, and by the normalized standard deviation Δ a (%), found by:
a = 100 i = 1 n a e x p a m o d / a e x p 2 N 1
where a e x p and a m o d are the CO2 adsorption values obtained from experiments and theoretical models, respectively, and N is the number of adsorption isotherm data points.
The differential molar isosteric heat of adsorption q s t is an important thermodynamic parameter that describes the thermal effects of adsorption processes. To determine the isosteric differential heat of CO2 adsorption on a sample with the best porous structure parameters, a method for calculating the heats of adsorption based on the Clausius–Clapeyron equation was used:
ln p 1 / T a = c o n s t = q s t R
where R is the gas constant; T is temperature; p is equilibrium pressure.
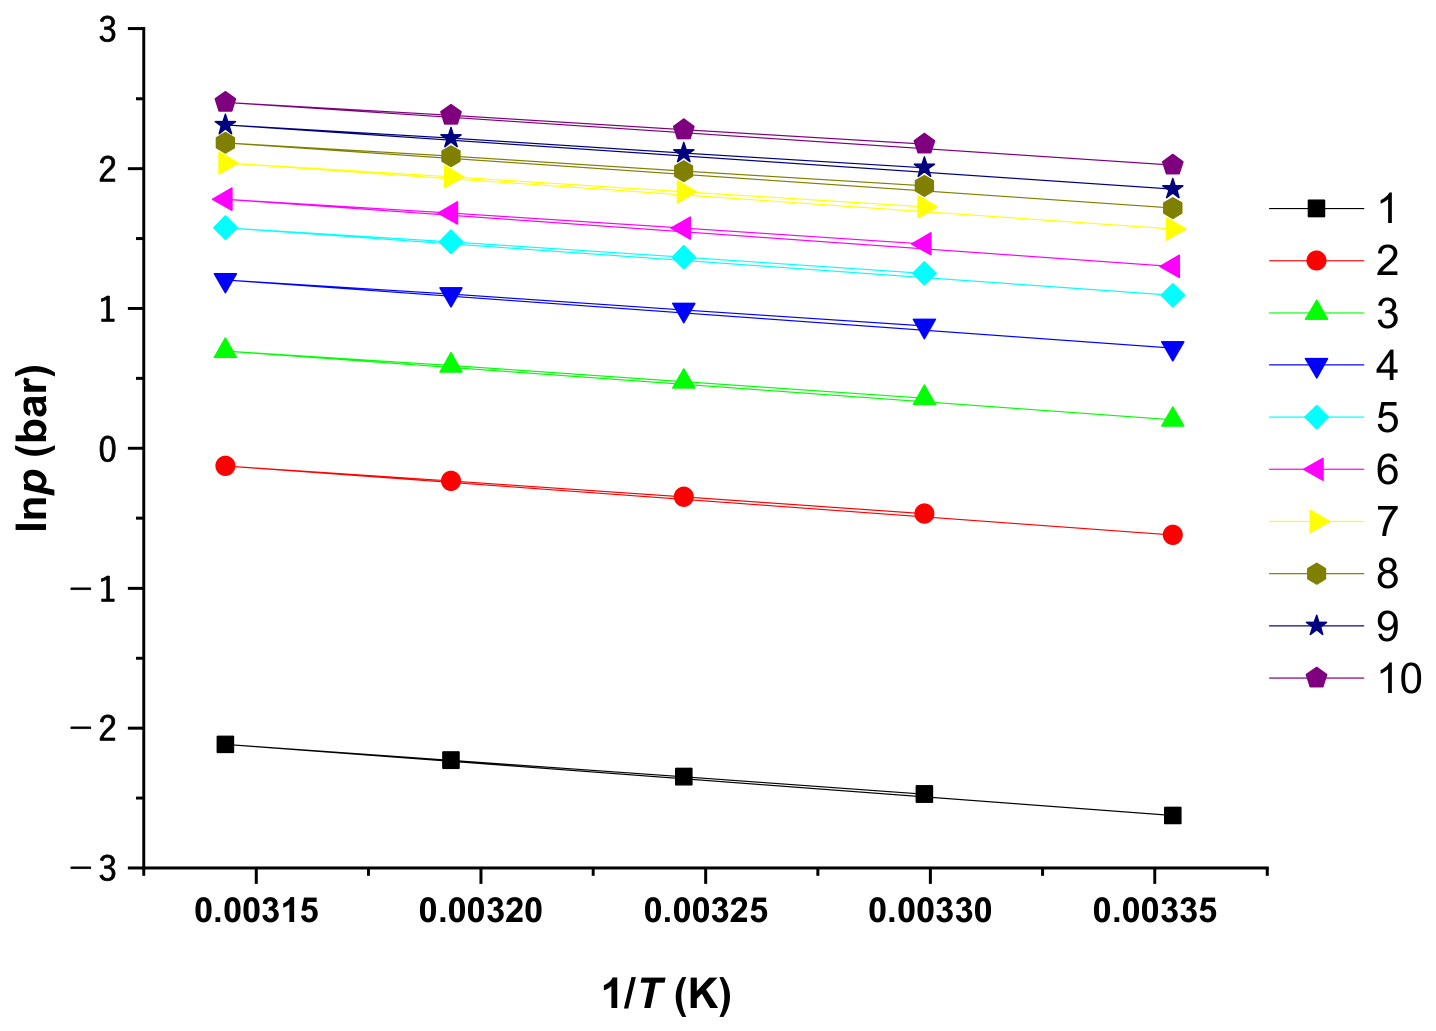
Specifically, the q s t value was found from the slope of the straight lines after plotting the dependence of l n   p C O 2   o n   1 / T for a fixed, specified adsorbed amount of carbon dioxide.

3. Results and Discussion

3.1. The Influence of Synthesis Parameters on the Porous Structure of Biochars

The efficiency of CO2 adsorption by activated biochar is determined primarily by its porous structure [21]. Activated biochar is synthesized in two main stages: carbonization and activation [22].
Carbonization is an important stage in the production of activated biochar. As a result of this stage, the biomass undergoes a very important modification, converting the feedstock (biomass) into a carbon-rich product. The choice of process parameters for the carbonization process, in particular temperature and time, has a significant impact on the porous structure of the final product and, consequently, on the efficiency of CO2 adsorption. However, without the activation stage, biomass-based carbonizate has a primitive porous structure and limited adsorption capacity compared to activated biochar [23]. The chemical activation method is an effective way to produce highly porous biochar, which involves controlled process parameters: (1) thermal treatment of the carbonizate in an inert atmosphere (time and temperature); (2) the weight ratio of the activating agent to the carbonate. During the decomposition process, the activating agent reacts with carbon, forming a well-defined porous structure [24]. The most effective activator for producing biochar with a given porous structure required for high CO2 adsorption is KOH [25]. Carbon (C) and KOH react at elevated temperatures, typically in the range of 550 °C to 850 °C, producing metallic potassium (K), which intercalates into the carbon matrix, increasing the porosity of the final product, and also affects the pore size distribution, which improves the efficiency of CO2 adsorption [26].

3.1.1. The Influence of Carbonization Parameters on the Porous Structure of Biochars

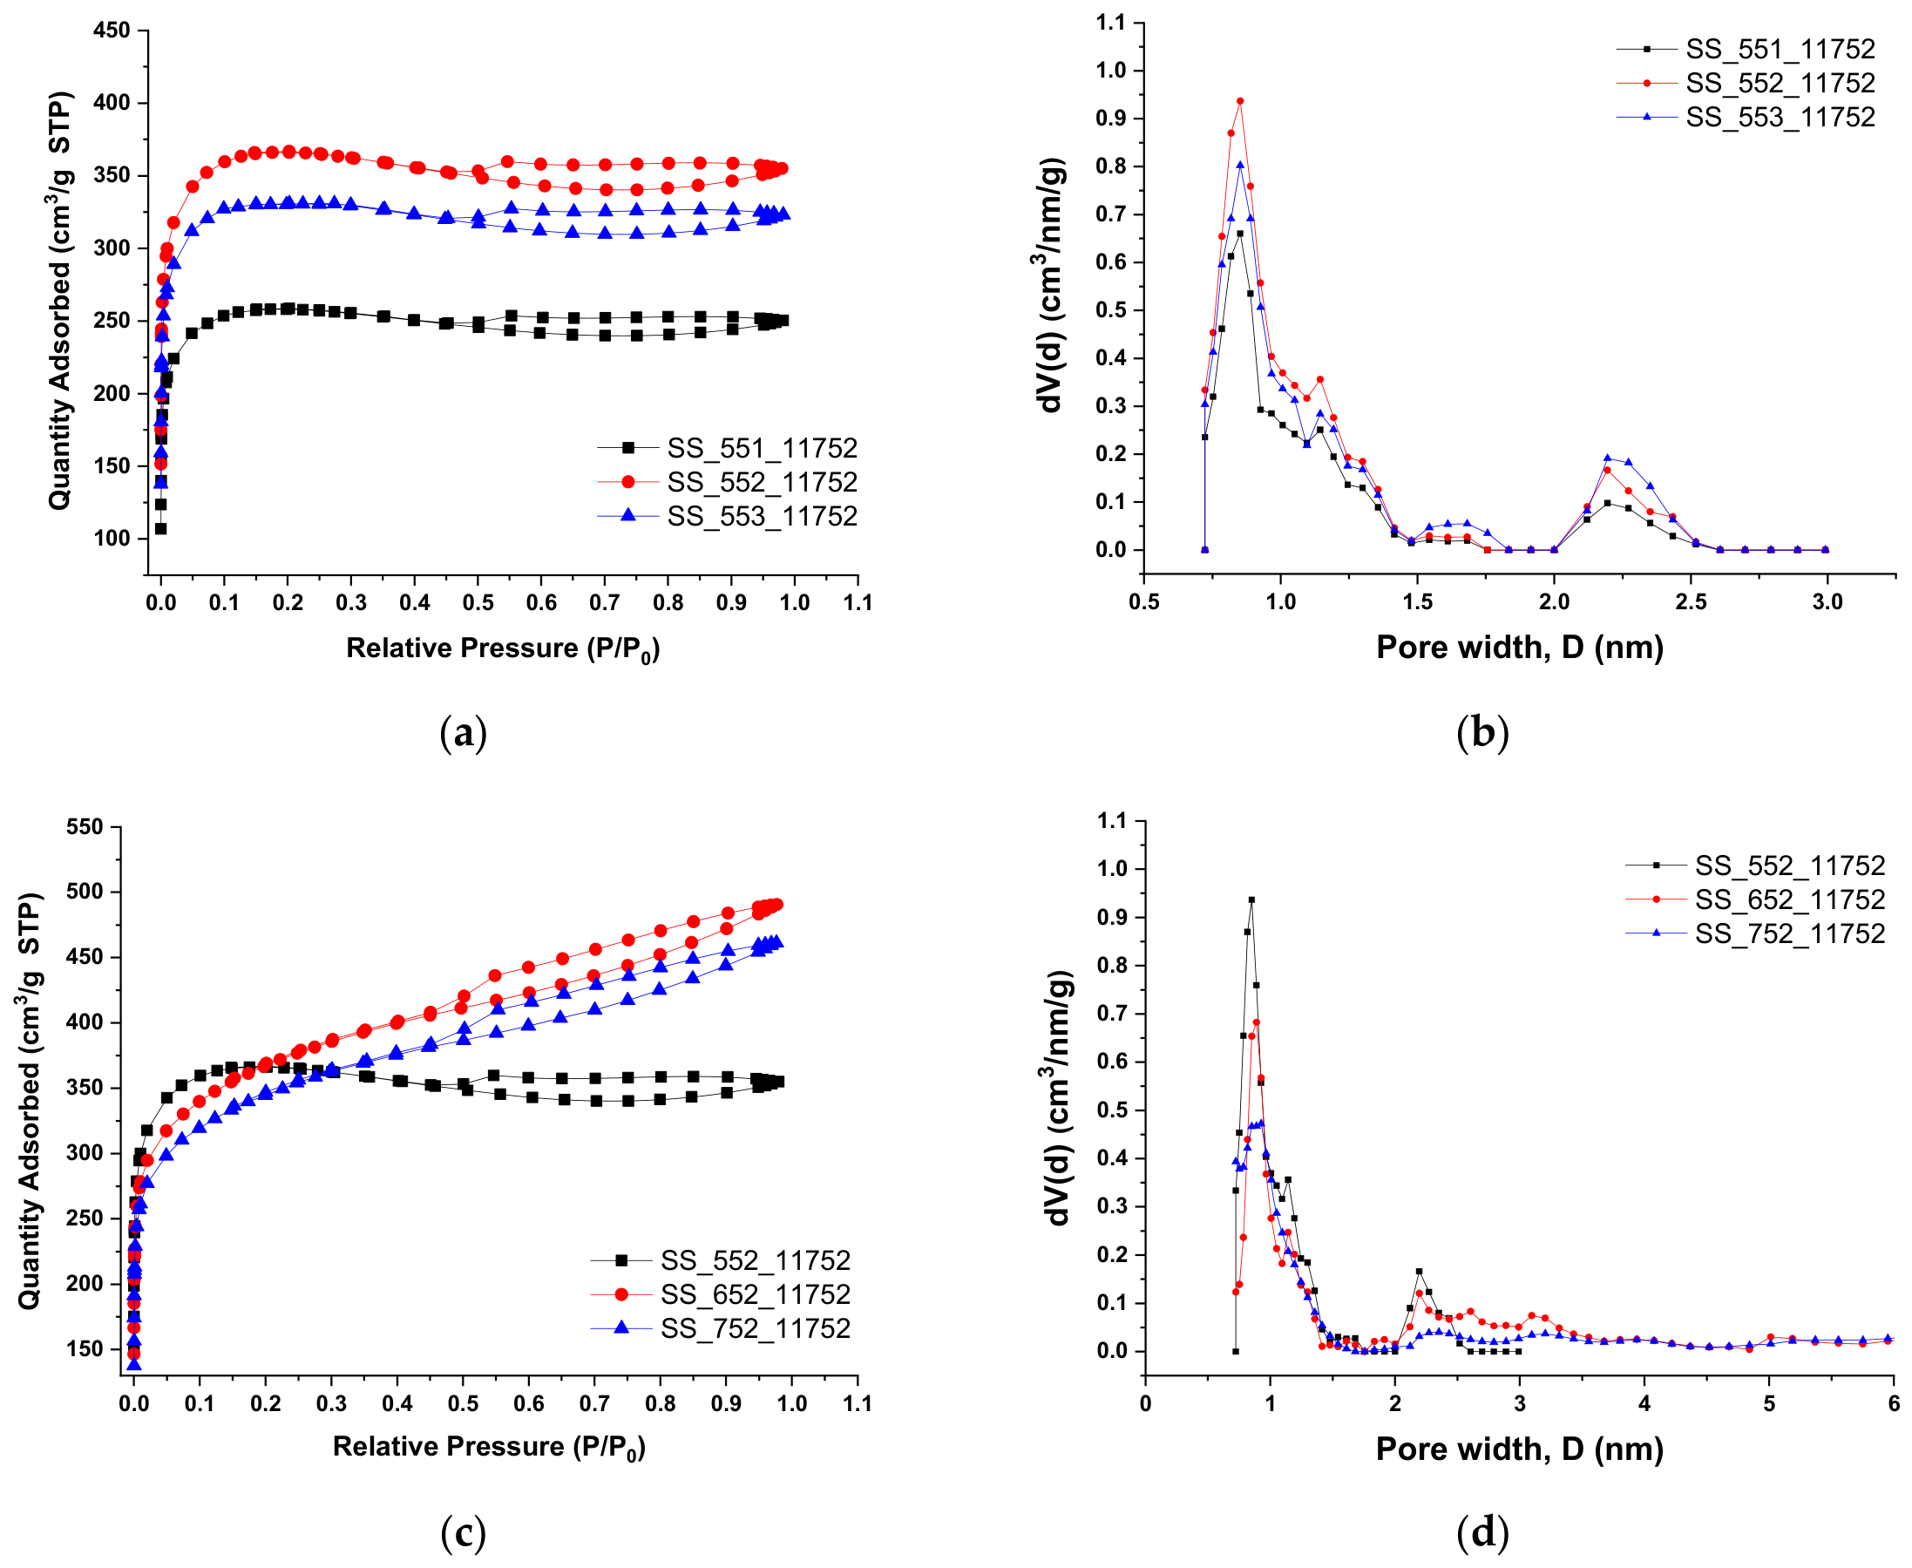
To study the effect of shrimp shell carbonization time on the porous structure of the final material, three types of samples were obtained at a fixed temperature and variable carbonization time, followed by KOH activation. Nitrogen adsorption–desorption isotherms were obtained for these samples at 77 K, shown in Figure 1a.
All isotherms for the samples obtained with different shrimp shell carbonization times exhibited type I hysteresis loops with hysteresis loops similar to type H4 according to the IUPAC classification [27]. This type of loop is confirmed by the micromesoporous structure of the obtained carbon materials (Figure 1b and Figure 2).
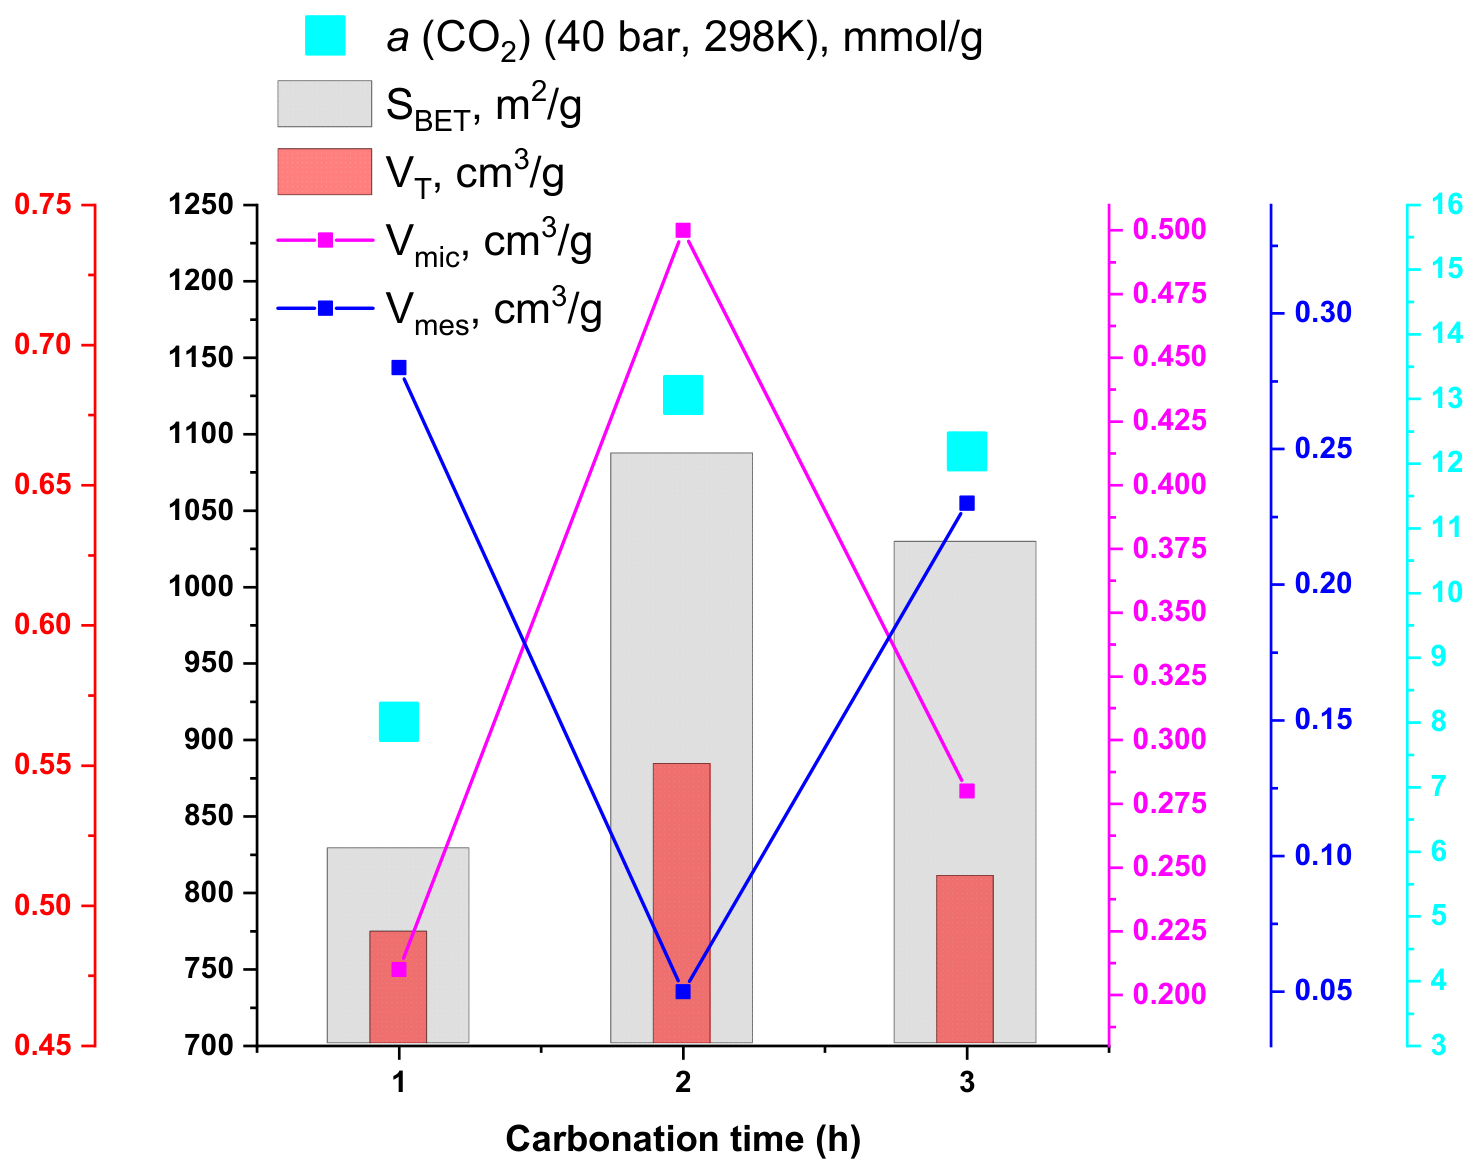
With an increase in carbonization time from 1 to 2 h, the nitrogen adsorption capacity increased significantly, but decreased after 3 h. According to the same scenario, all porosity parameters (specific surface area (SBET), total pore volume (VT) and micropore volume (Vmic)) changed, except for the mesopore volume (Vmes), the value of which, in turn, continuously increased with increasing exposure time (Figure 2). However, it should be noted that changing the carbonization duration did not have a significant effect on the type of porosity, which is confirmed by the pore size distribution curves (Figure 1b). Thus, 2 h is the optimal time for shrimp shell carbonization. Sample SS_552_11752 had the highest porosity parameters: SBET = 1087 m2/g, VT = 0.55 cm3/g, Vmic = 0.5 cm3/g and Vmes = 0.05 cm3/g. In addition, it can be seen from Figure 2 that this material exhibited the highest adsorption capacity (a) for CO2 (13.06 mmol/g) in comparison with the samples obtained with a carbonation time of 1 and 3 h.
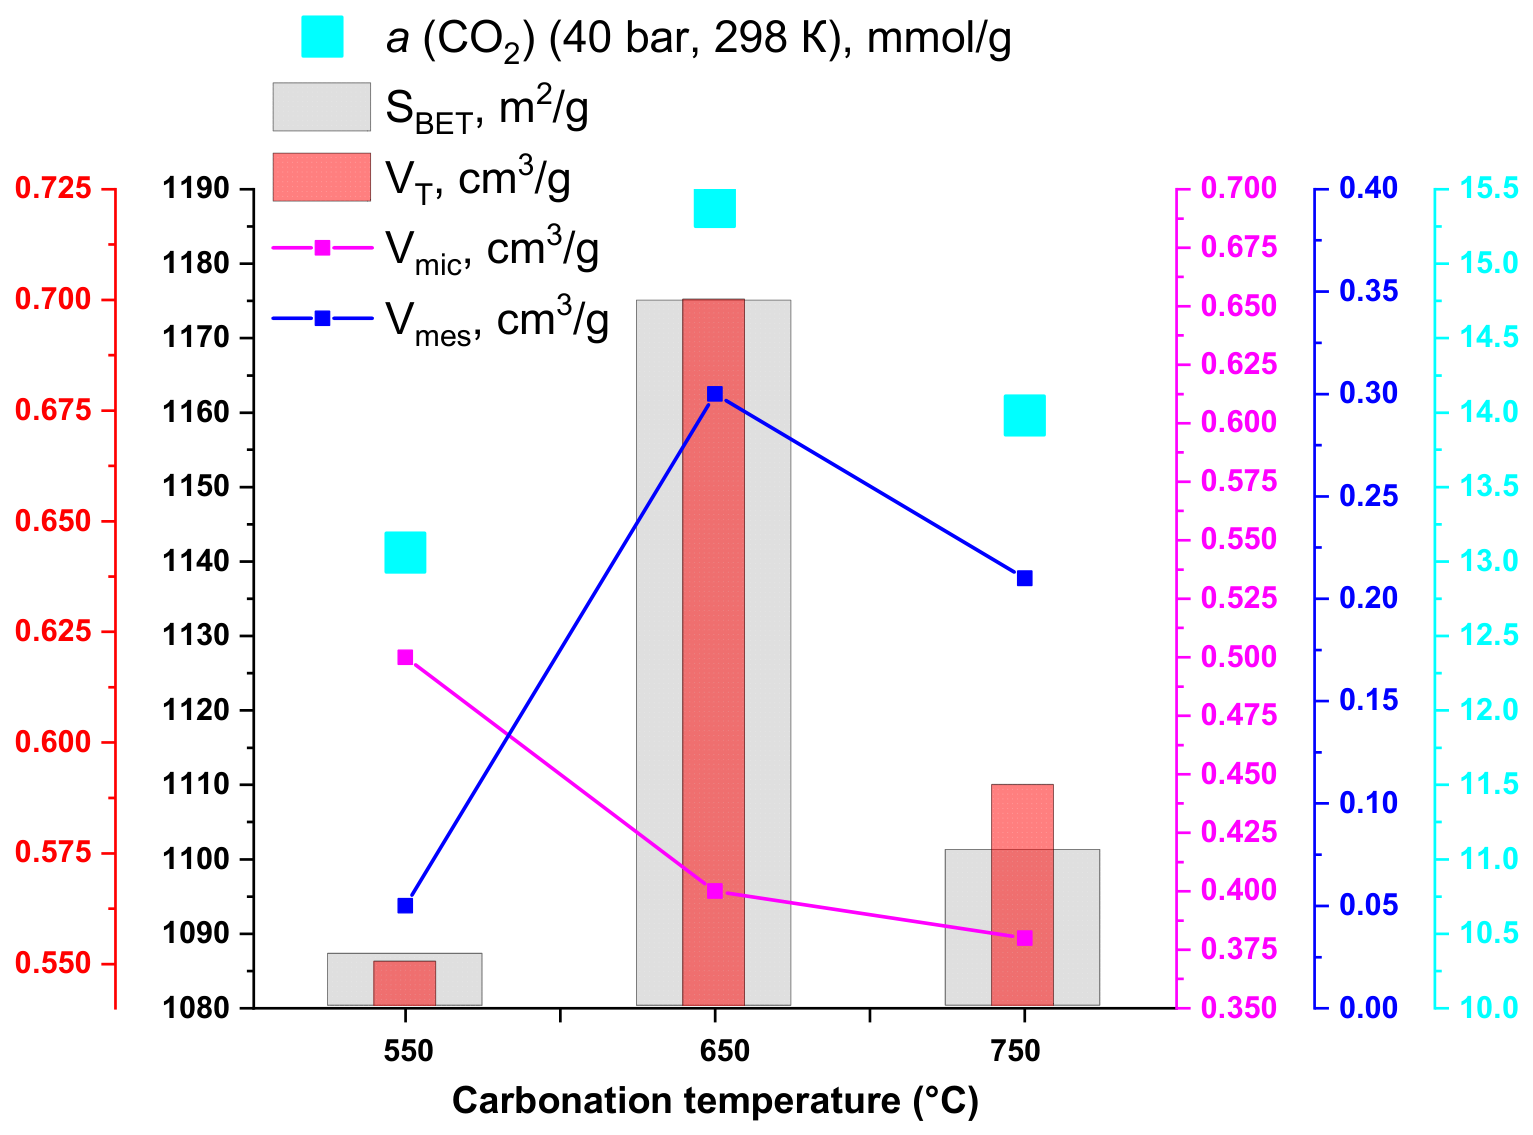
Increasing the shrimp shell carbonization temperature from 550 °C, at which the effect of carbonization time was assessed, to 650 °C affected the nature of both the nitrogen adsorption isotherms and the pore size distribution curves. Figure 1c shows that the SS_652_11752 and SS_752_11752 materials are characterized by similar reversible adsorption isotherms, corresponding to a combination of types I and II with an H4 hysteresis loop with different values of nitrogen adsorption uptake. This type is inherent to micromesoporous materials with a wide range of pore size distributions. This statement is confirmed by Figure 1d, which shows that with an increase in carbonization temperature from 550 to at least 650 °C, the pore size range becomes wider. With the increase in carbonization temperature from 550 to 650 °C, the SBET, VT and Vmes values increased, and those of Vmic decreased (Figure 3). The increase in carbonization temperature from 650 to 750 °C led to a decrease in all porosity parameters. Based on the above, it can be concluded that 650 °C is the optimal temperature for shrimp shell carbonization. Thus, the SS_652_11752 sample had the highest porosity parameters: SBET = 1175 m2/g, VT = 0.7 cm3/g, Vmic = 0.4 cm3/g and Vmes = 0.3 cm3/g. In addition, Figure 3 shows that this material exhibited the highest adsorption capacity (a) for CO2 (15.38 mmol/g) in comparison with the samples obtained at carbonization temperatures of 550 and 750 °C.

3.1.2. The Influence of Activation Parameters on the Porous Structure of Biochars

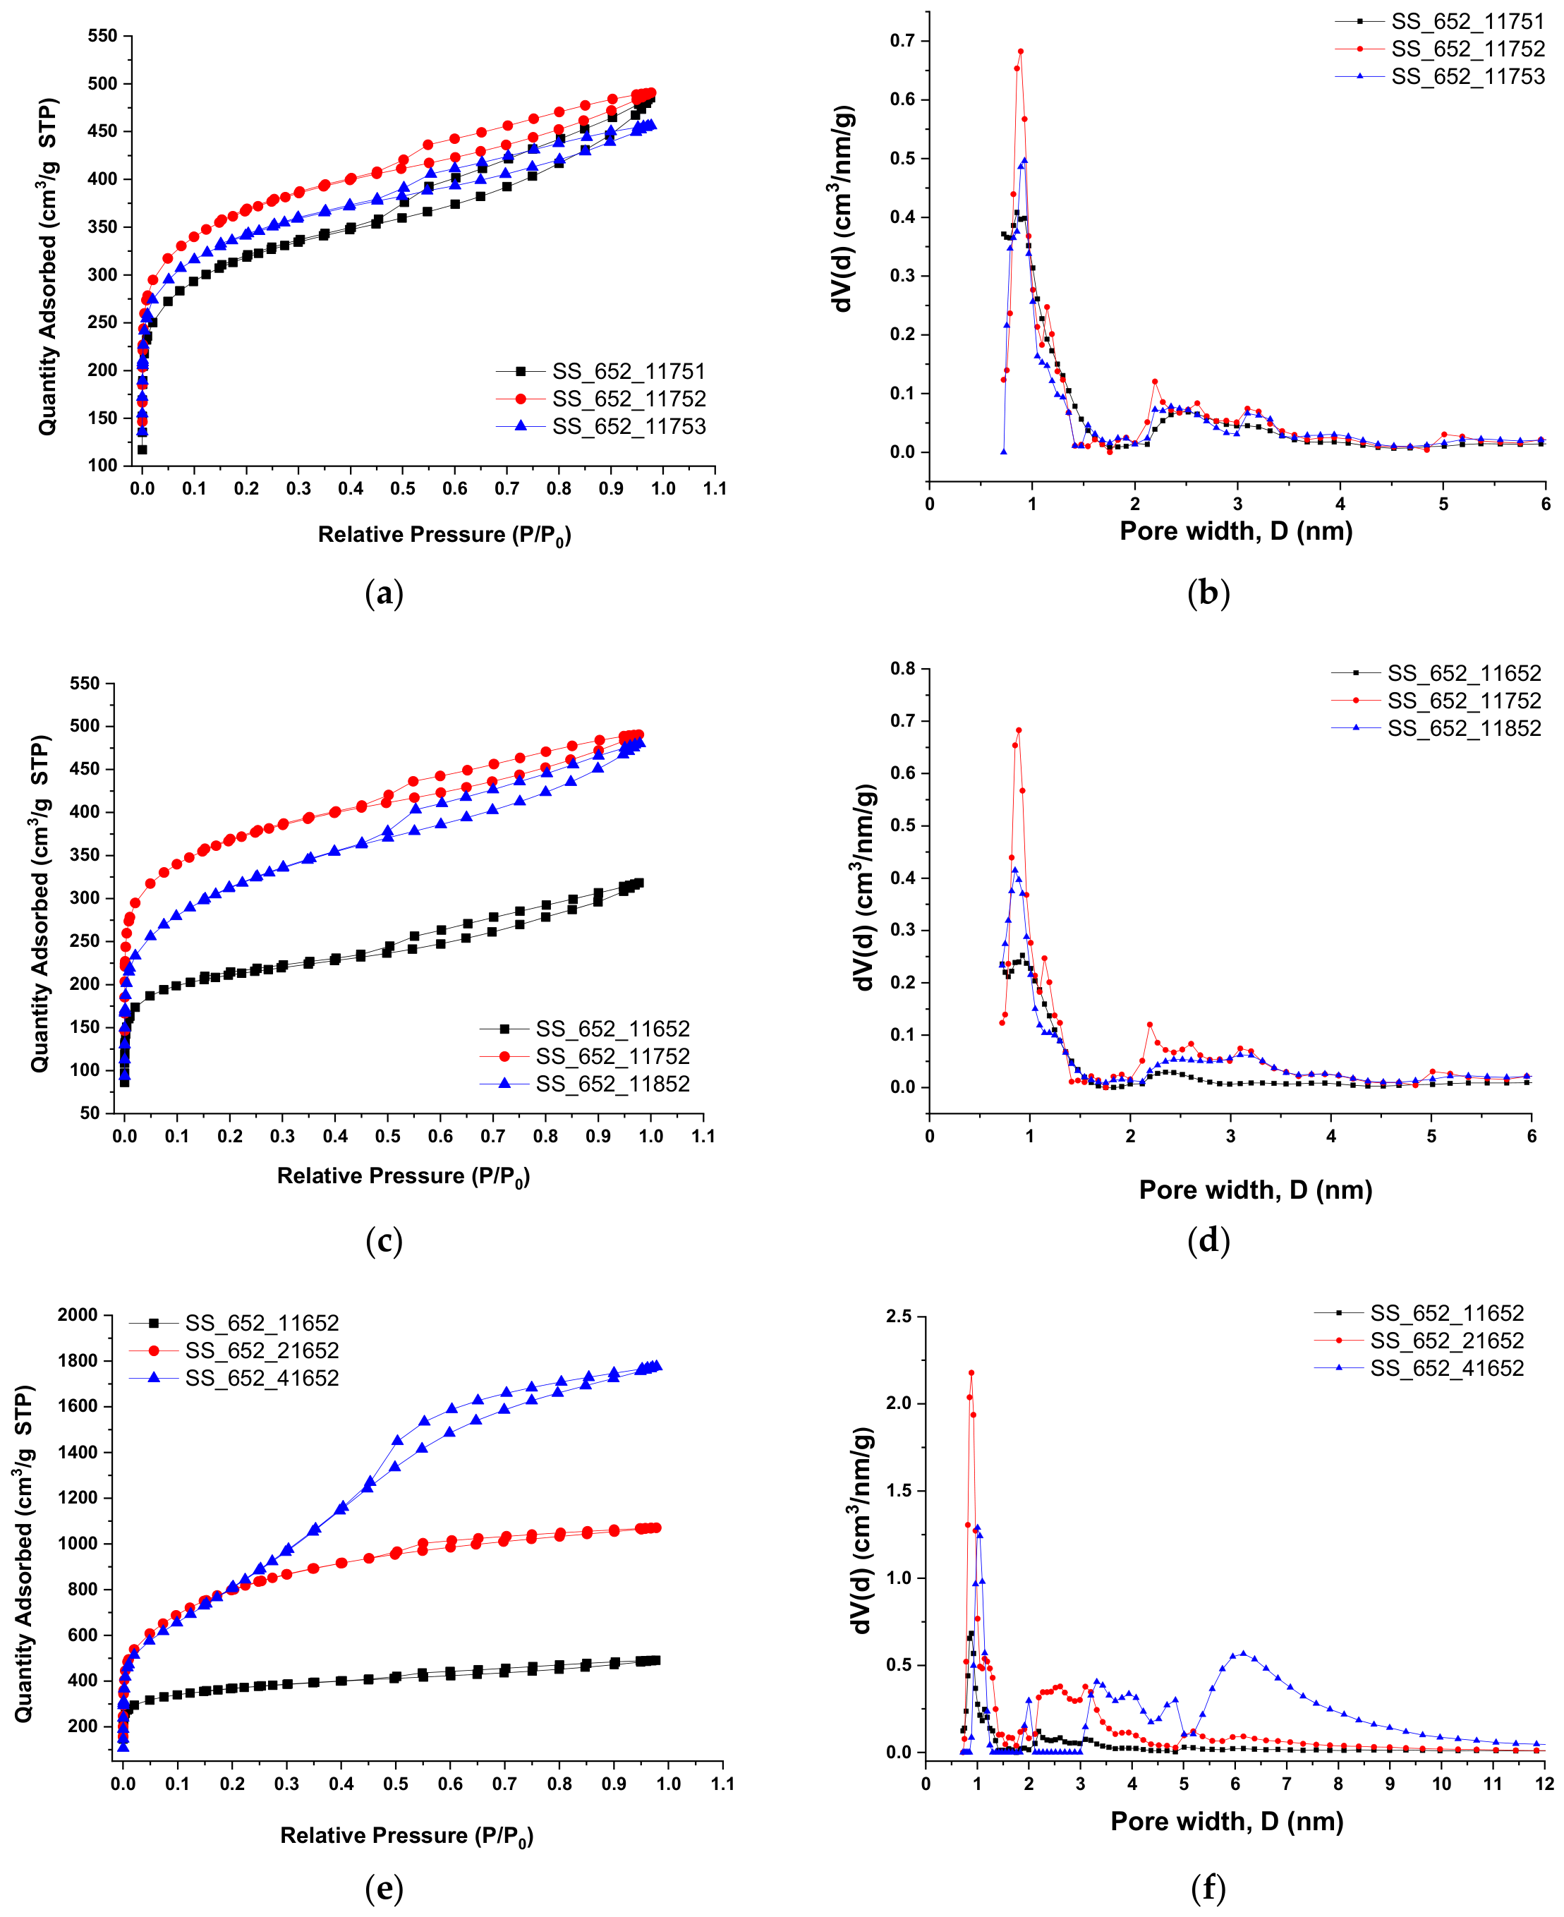
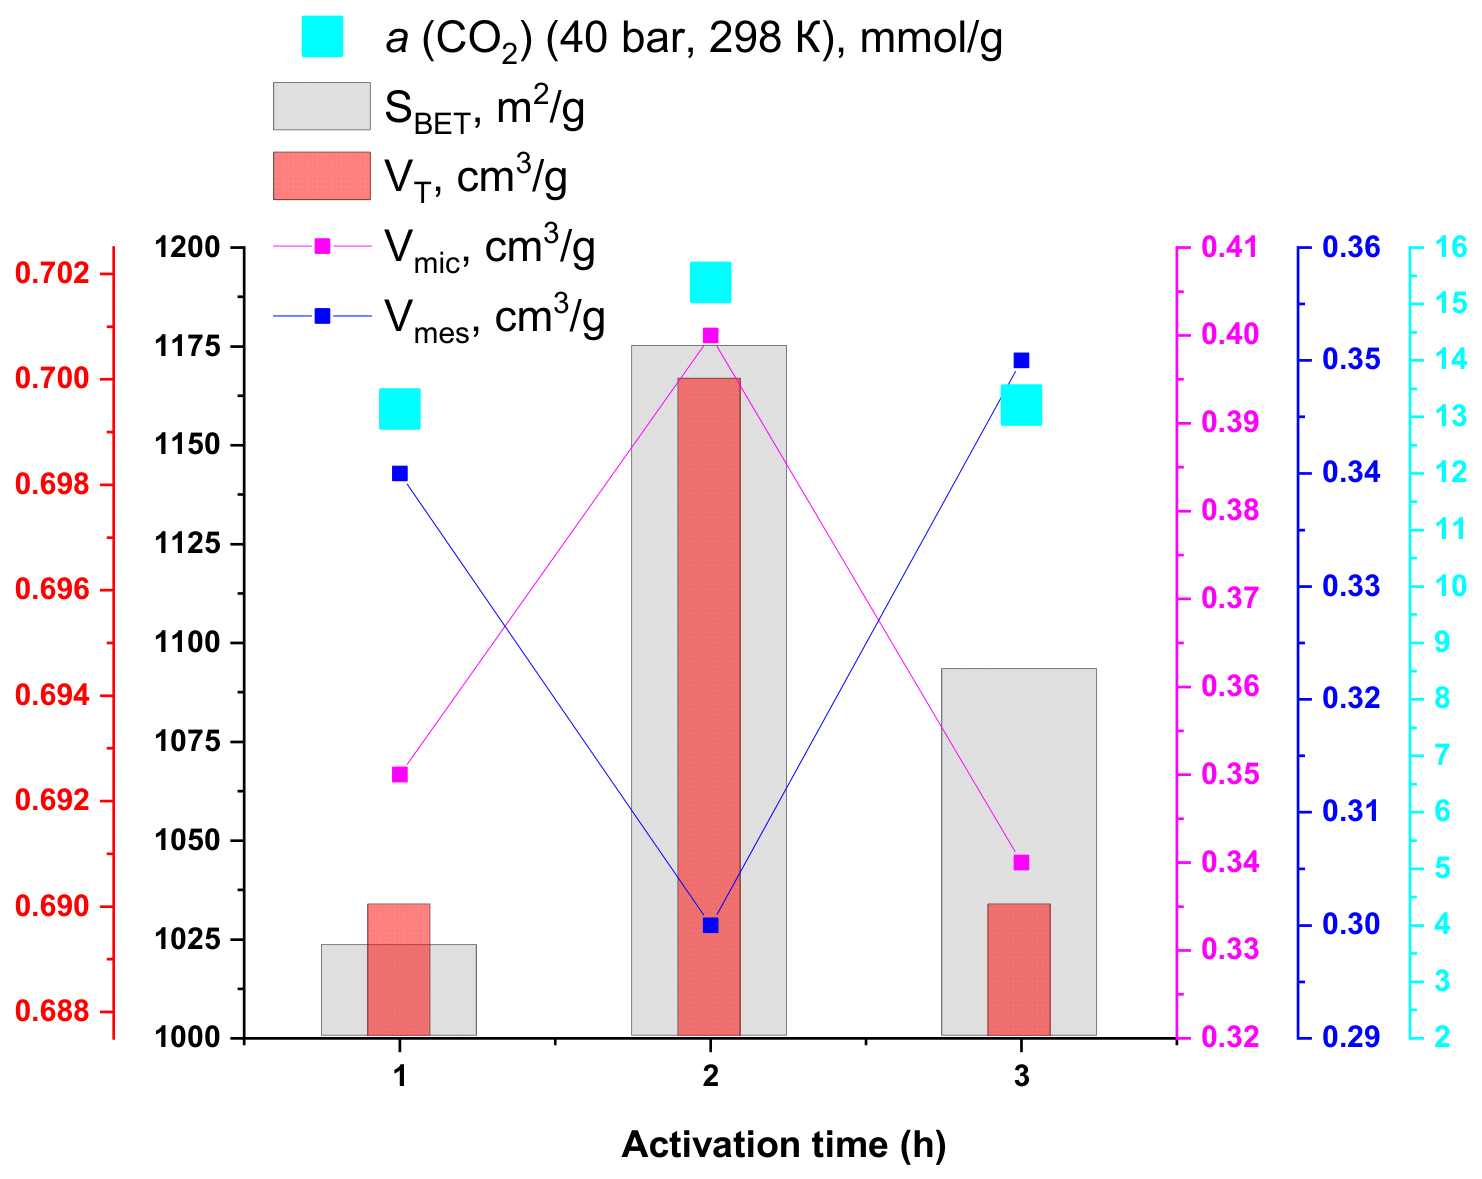
To study the effect of the carbonizate activation time on the porous structure of the final material, three types of samples were selected; all obtained at a fixed temperature and KOH/carbonizate weight ratio, but with a variable activation time. Nitrogen adsorption–desorption isotherms at 77 K were also obtained for these samples, shown in Figure 4a. All isotherms for the samples obtained with different carbonizate activation times demonstrated a combination of types I and II with an H4 hysteresis loop with different values of nitrogen adsorption uptake. With an increase in the activation time from 1 to 2 h, the nitrogen adsorption capacity showed a slight tendency to increase, and with an increase in the holding time to 3 h, it decreased. The porosity parameters (SBET, VT, Vmes) varied according to the same algorithm (Figure 5). The pore size distribution curves also had a similar nature (Figure 4b). Based on the highest values of porosity parameters and adsorption capacity for CO2, the optimal activation time is 2 h.
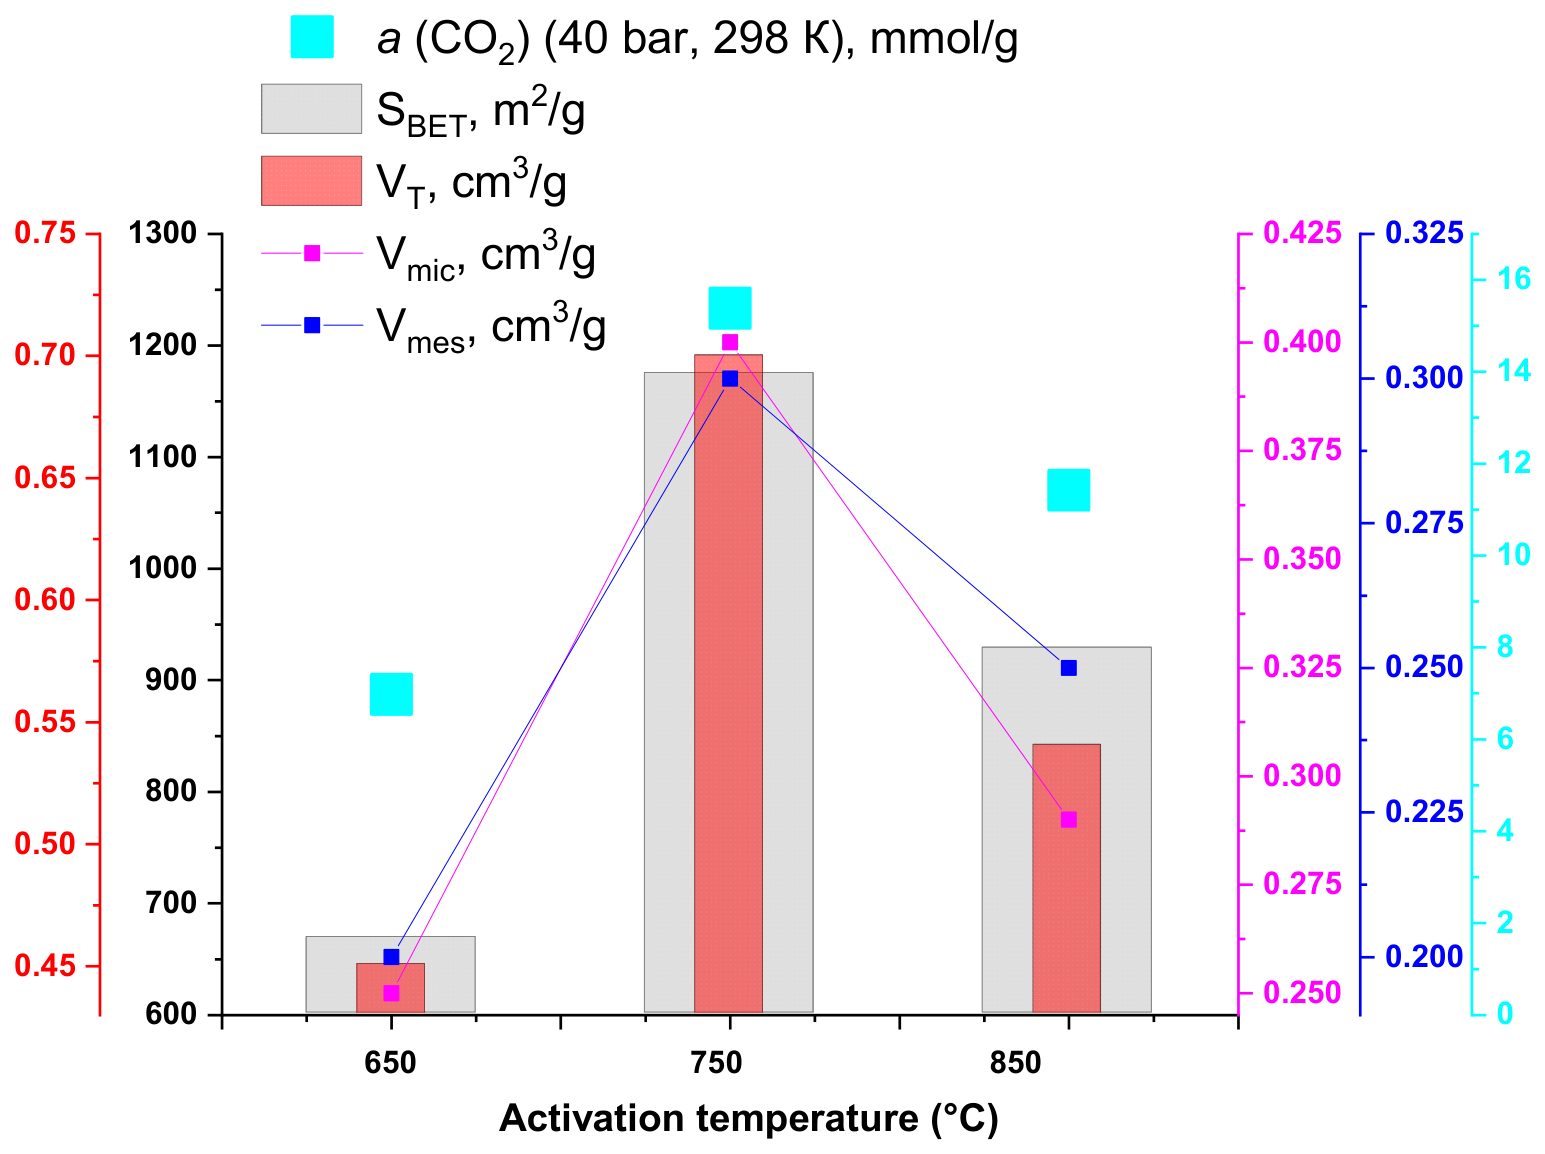
Changing the carbonizate activation temperature did not significantly affect the nature of the nitrogen adsorption isotherms or pore size distribution (Figure 4c,d). However, it did significantly affect the porosity parameters and the CO2 adsorption capacity of the samples (Figure 6). With an increase in activation temperature from 650 to 750 °C, the SBET, VT, Vmes, Vmic and a values increased by 43, 36, 33, 38, and 55%, respectively. However, a further increase in temperature (to 850 °C) led to a decrease in all porosity parameters (Figure 6). Based on the above, it can be concluded that 750 °C is the optimal carbonizate activation temperature.
It is known that changing the excess of the activating agent relative to carbon significantly affects not only the specific surface area and pore volume, but also their size distribution. Taking this fact into account, changes in the pore structure of biochars with an increase in the KOH/C ratio were studied.
Nitrogen adsorption–desorption isotherms and pore size distribution curves of biochar samples obtained by carbonization (2 h; 650 °C) followed by alkaline activation carried out for 2 h at 750 °C and different KOH/carbonate weight ratios (from 1/1 to 4/1) are shown in Figure 4e,f.
An increase in the alkali excess during carbonization promotes a significant increase in the nitrogen sorption capacity of the samples. Biochar samples obtained at KOH/carbonization ratios from 1/1 to 2/1 exhibited isotherms of a combination of types I and II with an H4-type hysteresis loop. The isotherm for the sample obtained at a higher alkali excess (4/1) had features inherent to H3-type hysteresis loops, since the adsorption branch resembles a type II isotherm, and the lower limit of the desorption branch was in a narrow P/P0 range (~0.4–0.5 for nitrogen at 77 K). This type of loop is often found in mesoporous carbon materials, as confirmed by the data in Figure 4f. As shown in Figure 4f, with an increase in the KOH/carbonizate ratio from 2/1 to 4/1, the micropore size of the first and second modes of biochar shifted from ~0.9 to ~1.1 nm and from 1.2 to 2.0 nm, respectively. The mesopore size also changed with an increase in the alkali from 2/1 to 4/1. First, modes 3–5 merged into a single mode, and the pore volume of these ranges increased from 0.779 to 2.069 m3/g. Second, this pore size shifted toward larger values from the range of ~2.0–6.0 nm to ~3.0–9.0 nm. Third, the peak intensity itself increased significantly.
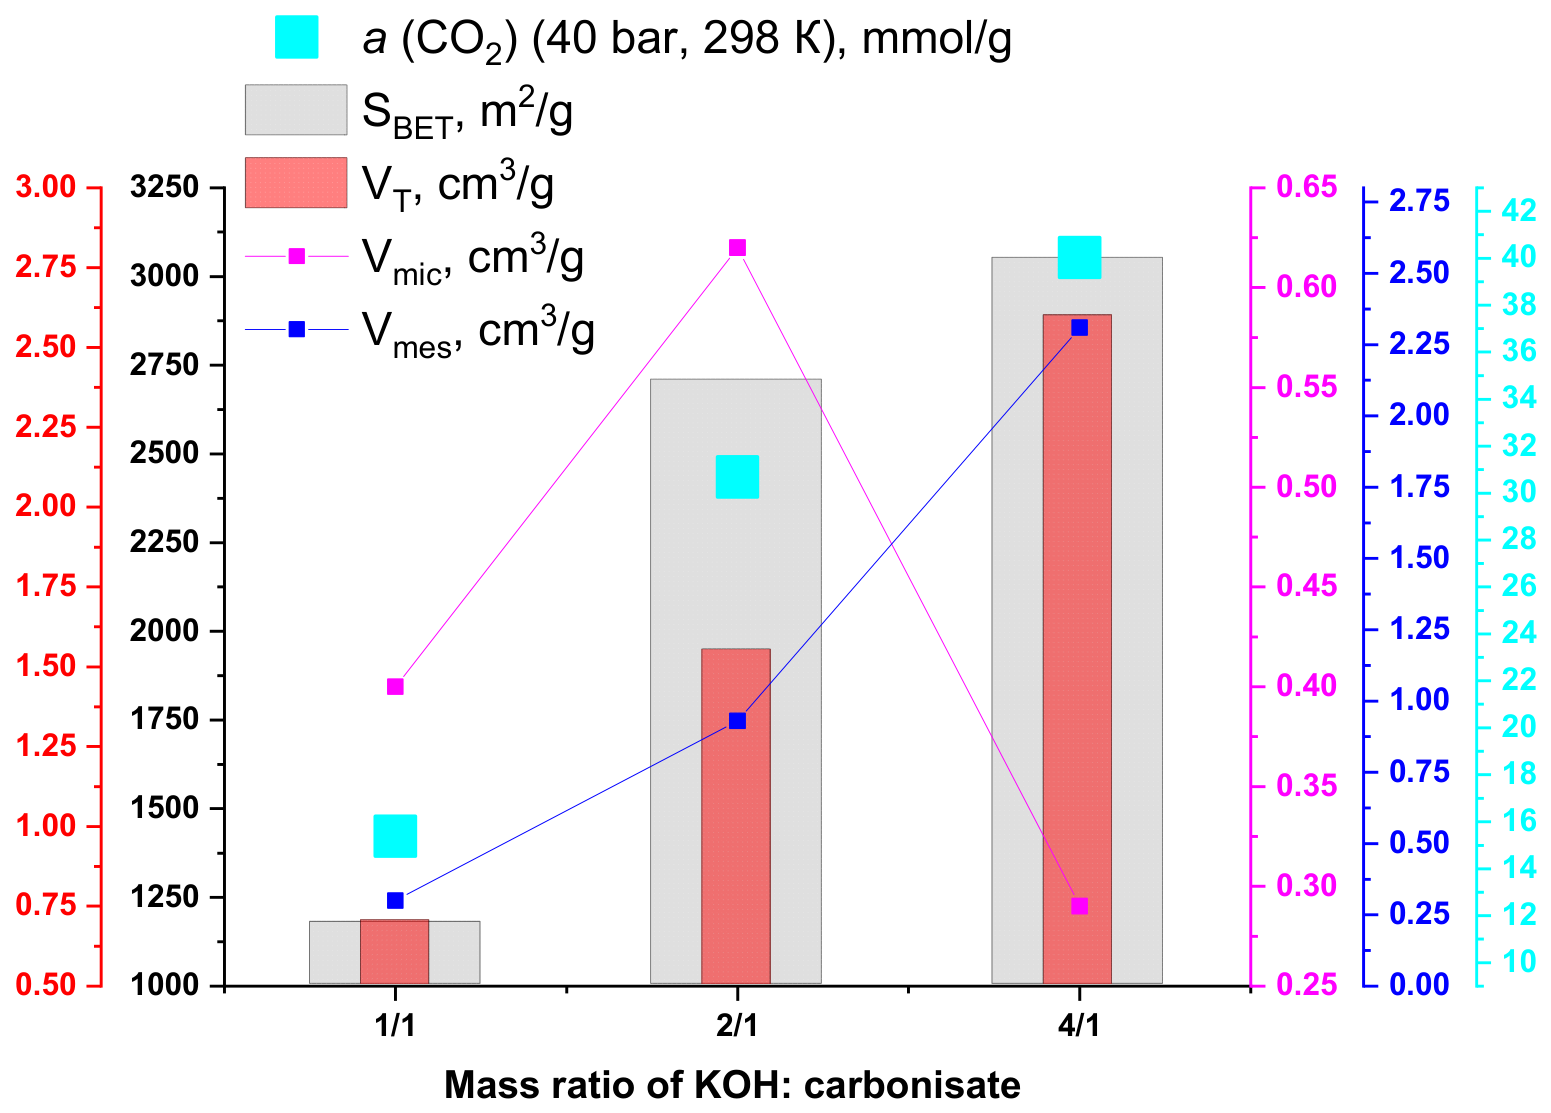
Thus, the SBET and VT of the biochar samples increased from 1175 to 3052 m2/g and from 0.707 to 2.614 cm3/g, respectively, as the KOH/carbonizate ratio increased from 1/1 to 4/1 (Figure 7).
The sample obtained with a KOH/carbonizate ratio of 2/1 was micromesoporous: the mesopore volume to the total pore volume was 60%. The material formed with a lower alkali excess was also micromesoporous (mesopore volume was 42% of the total pore volume) with a narrower pore size distribution (SBET: 1175 m2/g, VT: 0.707 cm3/g, SDFT: 1480 cm3/g, Vmic: 0.409 cm3/g (58%), Vmes: 0.298 cm3/g).
Biochar obtained with a KOH/carbonizate ratio of 4/1 was mesoporous (mesopore volume was 89% of the total pore volume) and also had the highest values of specific surface area and total pore volume (SBET: 3052 m2/g, VT: 2.614 cm3/g, SDFT: 2450 cm3/g, Vmic: 0.295 cm3/g, Vmes: 2.319 cm3/g).
Based on the highest values of the porosity parameters and adsorption capacity for CO2 (Figure 7), the optimal KOH/carbonizate weight ratio is 4/1 (a = 40.03 mmol/g).

3.2. CO2 Adsorption of Biochars

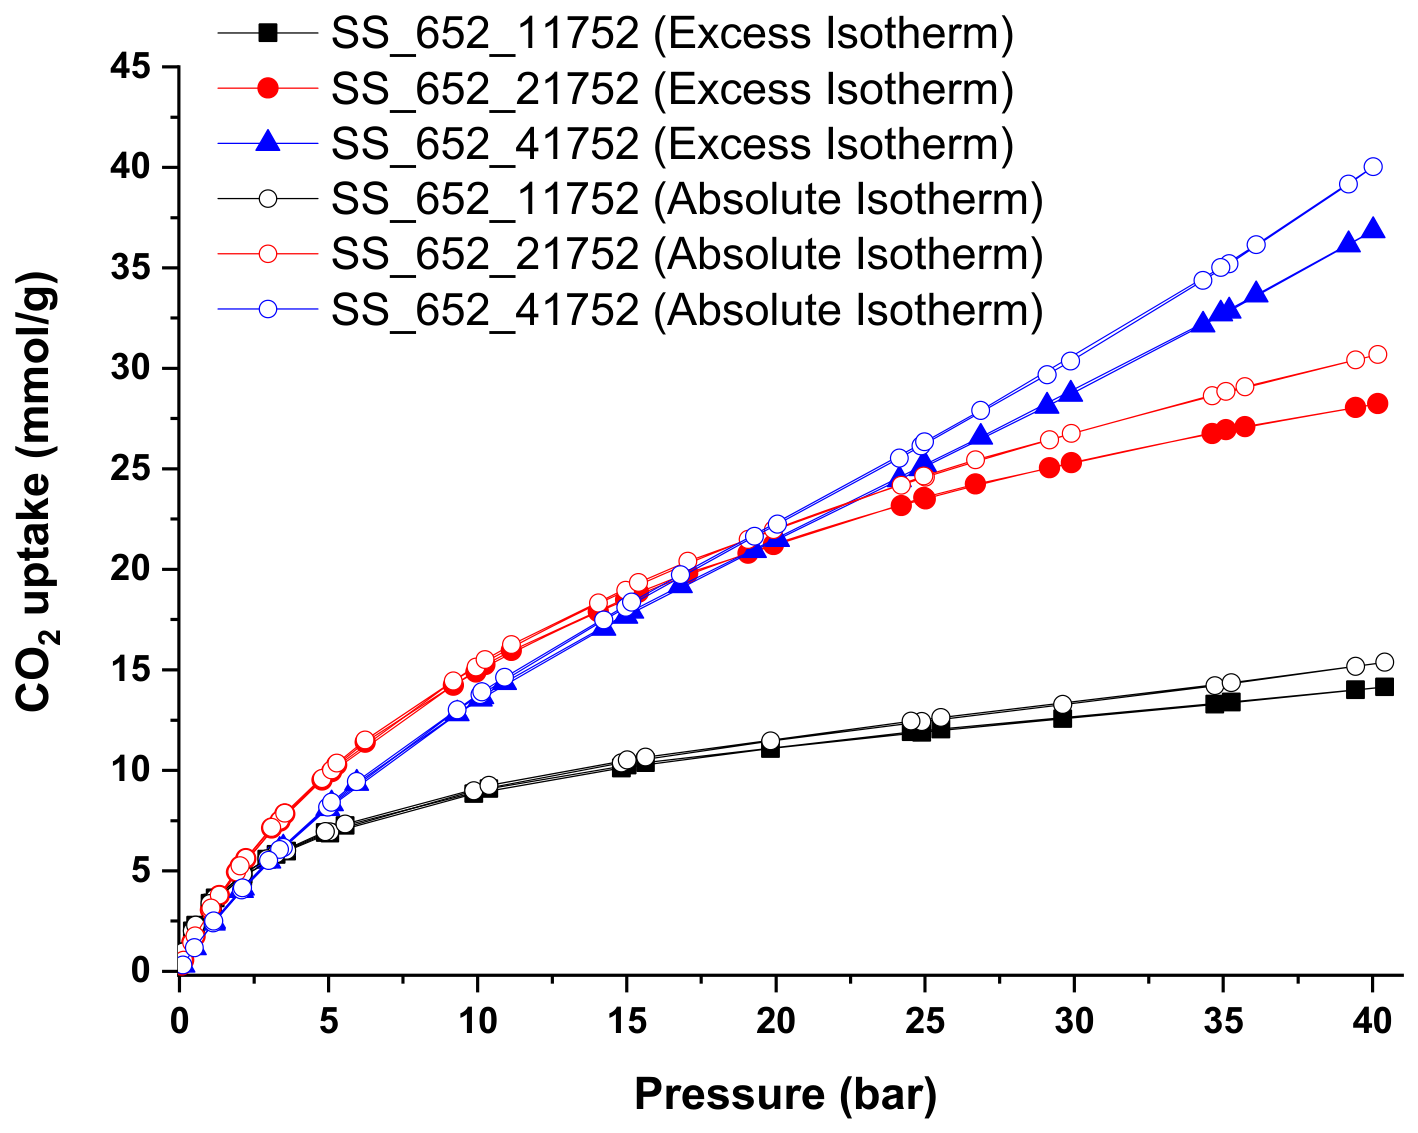
Since changing the excess of the activating agent relative to carbon significantly affected the specific surface area, volume, and pore structure, these samples were used to study the influence of these parameters on the adsorption process and their adsorption properties. Figure 8 shows the CO2 adsorption isotherms for the SS samples at 298 K and pressures up to 40 bar.
As noted above, the maximum CO2 adsorption (40.03 mmol/g at 40 bar and a temperature of 298 K) was demonstrated by the SS_652_41752 sample, obtained with a KOH/carbonizate ratio of 4/1. Notably, the SS_652_21752 sample demonstrated the highest CO2 adsorption in the pressure range from 2 to 10 bar (15.12 mmol/g). However, at low pressures (up to 1 bar), the SS_652_11752 sample (3.41 mmol/g) proved to be the most effective CO2 adsorbent. The effect of different adsorption capacities of the materials should be associated with their different porous structures. Thus, the SS_652_11752 sample had a bigger ultramicropore volume (less than 0.7 nm) than the SS_652_21752 and SS_652_41752 samples by 7 and 90%, respectively, which determined the sorption behavior at 1 bar. The SS_652_21752 sample had a bigger micropore volume (up to 2 nm) and narrower mesopore volume (from 2 to 3 nm) than the SS_652_11752 sample (by 37 and 92%, respectively) and the SS_652_41752 sample (by 54 and 94%, respectively), which determined the sorption behavior up to 10 bar. Finally, the SS_652_41752 sample had a bigger pore volume up to 10 nm (2.24 m3/g) than the SS_652_11752 sample (0.60 m3/g) and the SS_652_21752 sample (1.44 m3/g), which determined the sorption behavior at high pressure (up to 40 bar).
It should be noted that the adsorption capacities obtained for the SS_652_11752, SS_652_21752 and SS_652_41752 materials at 1, 10 and 40 bar, at a temperature of 298 K, are among the highest values in the existing literature and research.
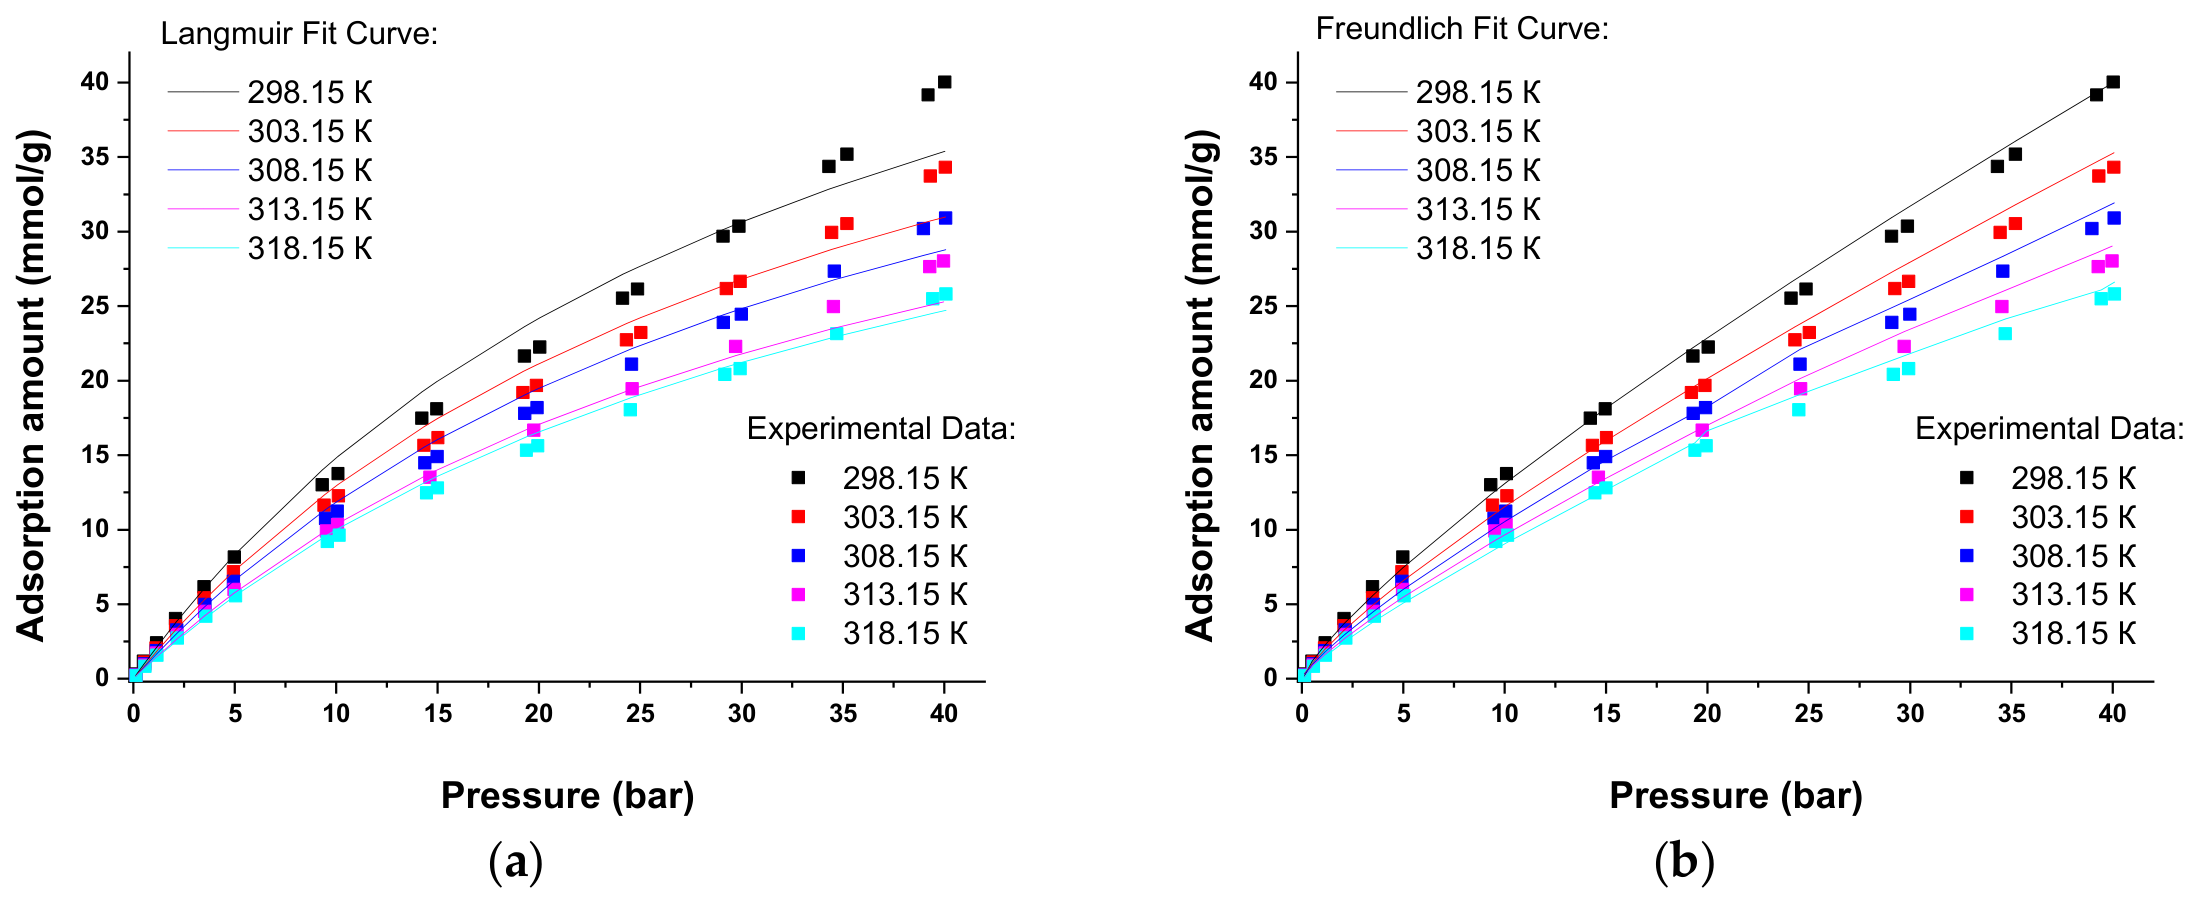
Having selected the carbon material with the highest adsorption capacity for CO2 at 40 bar, further research was focused on its change depending on temperature, as shown in Figure 9. According to the isotherm data, an increase in temperature contributed to a decrease in the adsorption value of CO2 on the SS_652_41752 sample, which indicates the exothermic nature of the process. The change in the adsorption capacity of biochar depending on pressure, approximated by the Langmuir and Freundlich models, is also shown. The parameters calculated using these models are presented in Table 1.
Taking into account the obtained values of normalized standard deviations ( Δ a = less than 10%) and correlation coefficients R 2 = (more than 0.9), it can be stated that both models provide an adequate description of the adsorption isotherms at the five studied temperatures. However, comparing the results, it is obvious that the experimental data for all temperatures studied are more consistent with the Freundlich model, with Δ a values below 5% and R 2 above 0.99 (Table 1, Figure 9).
In addition, Table 1 shows that the adsorption values ( a L m o d , a F m o d   ) and adsorption isotherm constants ( k L ,   k F ), calculated using the models, decreased with increasing temperature, which is due to the exothermic nature of CO2 adsorption on the sample and its greater thermodynamic favorability at low temperatures. Comparing the experimentally obtained values of the CO2 adsorption capacity with the values obtained using the models, it is evident that the deviations were less than 12 and 3% for Langmuir and Freundlich, respectively, which also indicates a good agreement between the models and the experimentally obtained data. The n parameter of the model is related to the affinity between the adsorbate and the adsorbent. Values of n greater than 1 indicate favorable adsorption, and the higher the n value, the stronger the adsorption. In all cases, n values greater than 1 were obtained, and they decreased with increasing temperature.
The isosteric heat of CO2 adsorption was calculated using the Clausius–Clapeyron equation for isothermal data at different temperatures.
Adsorption isosteres, the curves showing the equilibrium phase pressure versus temperature at a constant adsorption value, play an important role in adsorption thermodynamics. Figure 10 shows the adsorption isosteres of CO2 on SS_652_41752 sample for adsorption values of 0.5 (1), 3.0 (2), 6.0 (3), 9.0 (4), 12.0 (5), 14.0 (6), 17.0 (7), 19.0 (8), 21.0 (9), and 24.0 (10) mmol/g, which remain linear over the entire pressure range.
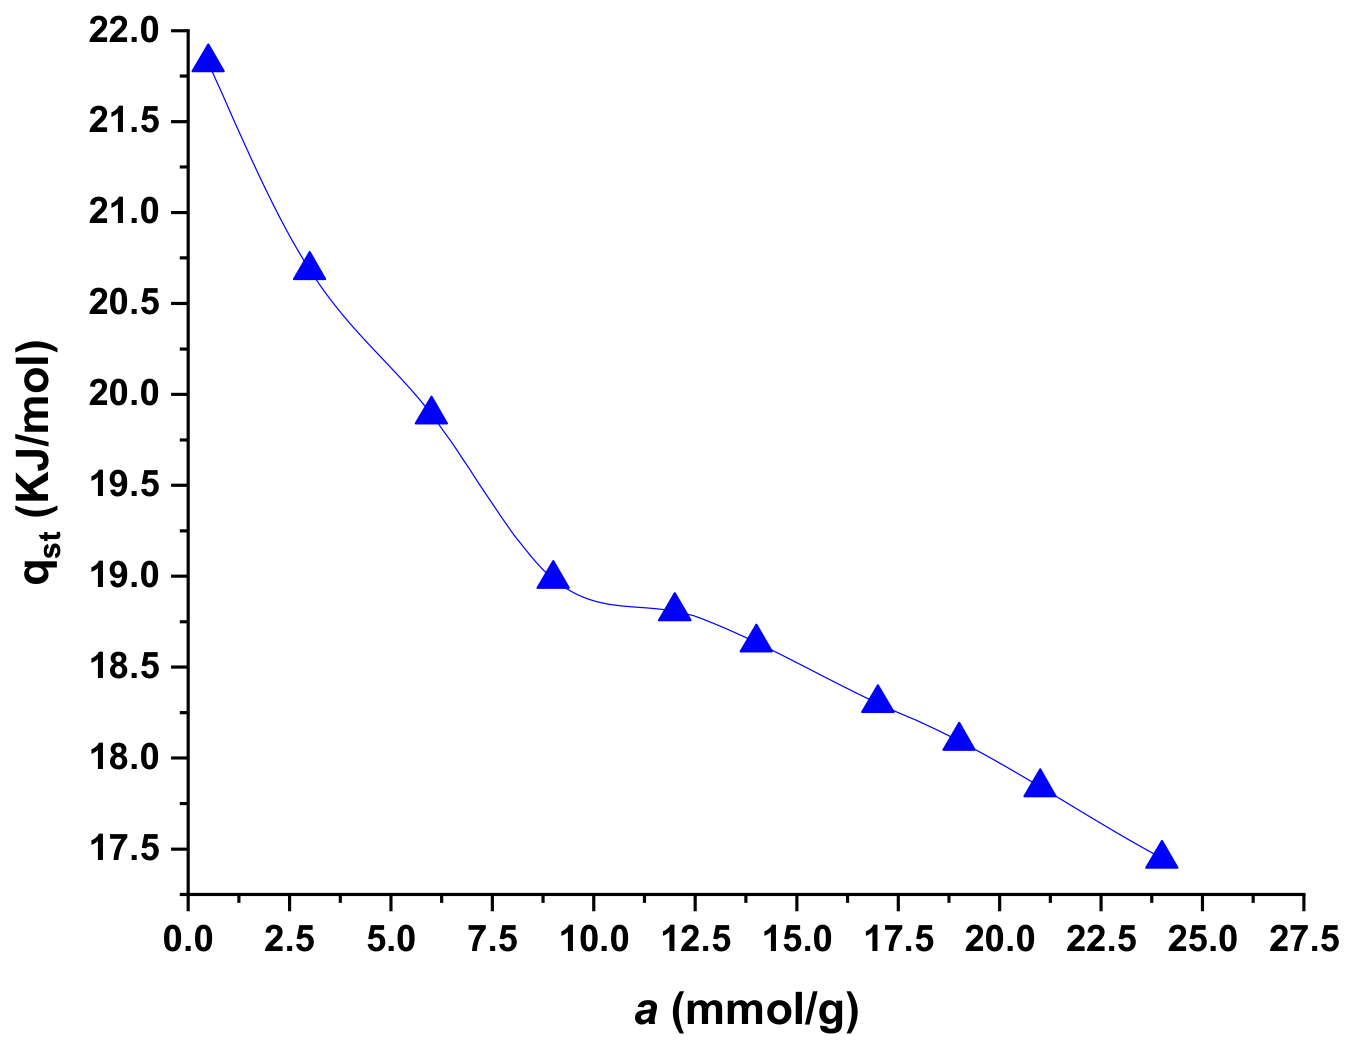
Figure 11 shows the dependence of the differential molar isosteric heat of CO2 adsorption on the adsorption value on the SS_652_41752 sample at pressures up to 40 bar.
The isosteric heat of CO2 adsorption decreased with increasing filling (Figure 11), indicating a heterogeneous distribution of site energy in the SS_652_41752 sample with high-energy sites being filled first and then, at higher filling levels, weaker sites becoming active. Low values of q s t (initial value ~20 kJ/mol) for the studied sample indicate a physisorption process of CO2 adsorption.
Table 2 and Table 3 present the results of CO2 adsorption, using the carbon adsorbent obtained in this study and the achievements of other research groups.
Based on the above discussion, it was found that the effective CO2 adsorption capacity is determined not only by the specific surface area but also by the pore volume and pore size distribution.

4. Conclusions

This study discusses the key role of pore structure in the significant CO2 adsorption capacity of biochars obtained from shrimp shell waste, a byproduct of the food industry. Furthermore, changes in the pore structure of the biochars were investigated by varying synthesis parameters, specifically the temperature and time of carbonization and activation, as well as the mass ratio of activating agent to carbonizate. The results showed that all studied parameters influenced the pore structure of the resulting biochars and, consequently, their CO2 adsorption capacity. It is noteworthy that changing the excess of activating agent relative to carbon significantly affected the specific surface area, volume, and pore structure of the resulting biochars. The relationship between the volume of ultramicropores (less than 0.7 nm) of biochar and the value of CO2 adsorption at 1 bar, the volume of micropores (up to 2 nm) and narrow mesopores (from 2 to 3 nm) of biochar with the value of CO2 adsorption up to 10 bar, as well as the volume of pores up to 10 nm of biochar with the value of CO2 adsorption up to 40 bar is shown.
The optimized SS_652_41752, SS_652_21752 and SS_652_11752 samples possessed high SBET (1175, 2708 and 3052 m2/g, respectively) and VT (0.70, 1.55 and 2.60 cm3/g, respectively) with an effective adsorption capacity for CO2 at 298 K of 40.03 (at 40 bar), 15.12 (at 15 bar) and 3.41 mmol/g (at 1 bar), respectively. Sorption processes on the surface of synthesized biochar exhibiting the highest CO2 adsorption capacity were simulated using the Langmuir and Freundlich adsorption models in the temperature range of 298–318 K up to a pressure of 40 bar. It was shown that the differential molar isosteric heat of CO2 adsorption decreases from ~20 to ~17 kJ/mol with increasing adsorption magnitude, demonstrating the physical nature of the adsorption process. In conclusion, this study confirmed the need for targeted production of the surface morphology of carbon materials obtained from crustacean shells by varying the synthesis parameters to achieve maximum adsorption capacity for CO2.
Due to the lack of data on changes in biochar morphology and structure with varying synthesis parameters, this study represents a preliminary investigation of the properties of biochars obtained from shrimp shell waste. Future research should utilize a range of modern analytical methods to thoroughly study the structural and physicochemical properties of the resulting biochars, allowing for a precise determination of the relationship between synthesis parameters, pore architecture, and the sorption capacity of the resulting material.

Author Contributions

Conceptualization, A.M. and N.M.; methodology, A.M. and N.M.; software, N.M.; validation, A.M., N.M., T.P., O.G. and O.Z.; formal analysis, A.M., N.M., T.P., O.G. and O.Z.; investigation, A.M. and N.M.; resources, A.M., N.M. and O.Z.; data curation, A.M., N.M., T.P., O.G. and O.Z.; writing—original draft preparation, A.M., N.M., T.P., O.G. and O.Z.; writing—review and editing, A.M., N.M., T.P., O.G. and O.Z.; visualization, A.M., N.M., T.P., O.G. and O.Z.; supervision, A.M., N.M. and O.Z.; project administration, A.M., N.M., T.P., O.G. and O.Z.; funding acquisition, A.M., N.M. and O.G. All authors have read and agreed to the published version of the manuscript.

Funding

The authors would like to give sincere thanks to the funding agencies that supported this research. The study was supported by project No. 26-16-20053 of the Russian Science Foundation.

Institutional Review Board Statement

Not applicable.

Informed Consent Statement

Not applicable.

Data Availability Statement

The data presented in this study are available on request from the corresponding author.

Conflicts of Interest

The authors declare no conflicts of interest.

References

  1. Yan, N.; Chen, X. Sustainability: Don’t Waste Seafood Waste. Nature 2015, 524, 155–157. [Google Scholar] [CrossRef] [Scilit] [PubMed]
  2. Matveeva, V.G.; Bronstein, L.M. From Renewable Biomass to Nanomaterials: Does Biomass Origin Matter? Prog. Mater. Sci. 2022, 130, 100999. [Google Scholar] [CrossRef] [Scilit]
  3. Guo, J.; Song, Y.; Ji, X.; Ji, L.; Cai, L.; Wang, Y.; Zhang, H.; Song, W. Preparation and Characterization of Nanoporous Activated Carbon Derived from Prawn Shell and Its Application for Removal of Heavy Metal Ions. Materials 2019, 12, 241. [Google Scholar] [CrossRef] [Scilit] [PubMed]
  4. Elango, D.; Packialakshmi, J.S.; Manikandan, V.; Jayanthi, P. Sustainable Synthesis of Carbon Quantum Dots from Shrimp Shell and Its Emerging Applications. Mater. Lett. 2022, 312, 131667. [Google Scholar] [CrossRef] [Scilit]
  5. Ding, B.; Huang, S.; Pang, K.; Duan, Y.; Zhang, J. Nitrogen-Enriched Carbon Nanofiber Aerogels Derived from Marine Chitin for Energy Storage and Environmental Remediation. ACS Sustain. Chem. Eng. 2018, 6, 177–185. [Google Scholar] [CrossRef] [Scilit]
  6. Gopi, J.A.; Parameswaranpillai, J. Conversion of Waste Crustacean Shells to Hetero Atom Doped Carbon Nanostructures for Potential Applications: A Comprehensive Review. Biomass Bioenergy 2026, 215, 109577. [Google Scholar] [CrossRef] [Scilit]
  7. Shen, Z.; Qian, C.; Liu, Y.; Ren, T.; Zhang, Y.; Xue, J.; Ruan, H.; Cheng, H. Dose-Dependent Effects of Hydrochar-Derived Dissolved Organic Matter on Soil Bacterial Communities Across Contrasting Soil Types. Agriculture 2026, 16, 922. [Google Scholar] [CrossRef] [Scilit]
  8. Sharma, A.; Sharma, R.K.; Kim, Y.-K.; Lee, H.-J.; Tripathi, K.M. Upgrading of Seafood Waste as a Carbon Source: Nano-World Outlook. J. Environ. Chem. Eng. 2021, 9, 106656. [Google Scholar] [CrossRef] [Scilit]
  9. Ilnicka, A.; Lukaszewicz, J.P. Marine and Freshwater Feedstocks as a Precursor for Nitrogen-Containing Carbons: A Review. Mar. Drugs 2018, 16, 142. [Google Scholar] [CrossRef] [Scilit] [PubMed]
  10. He, Z.; Lin, H.; Sui, J.; Wang, K.; Wang, H.; Cao, L. Seafood Waste Derived Carbon Nanomaterials for Removal and Detection of Food Safety Hazards. Sci. Total Environ. 2024, 929, 172332. [Google Scholar] [CrossRef] [Scilit] [PubMed]
  11. Mainali, K.; Mood, S.H.; Pelaez-Samaniego, M.R.; Sierra-Jimenez, V.; Garcia-Perez, M. Production and Applications of N-Doped Carbons from Bioresources: A Review. Catal. Today 2023, 423, 114248. [Google Scholar] [CrossRef] [Scilit]
  12. Shi, W.; Chang, B.; Yin, H.; Zhang, S.; Yang, B.; Dong, X. Crab Shell-Derived Honeycomb-like Graphitized Hierarchically Porous Carbons for Satisfactory Rate Performance of All-Solid-State Supercapacitors. Sustain. Energy Fuels 2019, 3, 1201–1214. [Google Scholar] [CrossRef] [Scilit]
  13. Liu, Y.; Shen, Z.; Huangliang, Y.; Ji, R.; Ruan, H.; Song, Y.; Xue, J.; Cao, F.; Shao, S.; Cheng, H. Tunable Nanoarchitectonics of Porous Biochar through Sequential Calcium and Potassium Salt Activation for High-Efficiency Removal of Emerging Pollutants. Bioresour. Technol. 2026, 456, 134904. [Google Scholar] [CrossRef] [Scilit] [PubMed]
  14. Zhang, Y.; Liu, Y.; Li, Y.; Cheng, H.; Zhu, C.; Shen, Y.; Shao, S.; Xue, J.; Zhou, D.; Cao, F. Cost-Effective Micro/Mesoporous Biochar Derived from Soda Residue-Assisted Hydrocarbonization and Activation of Crop Waste for Sulfamethoxazole Removal from Water Environments. Bioresour. Technol. 2025, 437, 133166. [Google Scholar] [CrossRef] [Scilit] [PubMed]
  15. Feng, Y.; Jiang, J.; Xu, Y.; Wang, S.; An, W.; Chai, Q.; Prova, U.H.; Wang, C.; Huang, G. Biomass Derived Diverse Carbon Nanostructure for Electrocatalysis, Energy Conversion and Storage. Carbon 2023, 211, 118105. [Google Scholar] [CrossRef] [Scilit]
  16. Qu, J.; Lv, S.; Peng, X.; Tian, S.; Wang, J.; Gao, F. Nitrogen-Doped Porous “Green Carbon” Derived from Shrimp Shell: Combined Effects of Pore Sizes and Nitrogen Doping on the Performance of Lithium Sulfur Battery. J. Alloys Compd. 2016, 671, 17–23. [Google Scholar] [CrossRef] [Scilit]
  17. Salawu, O.A.; Han, Z.; Adeleye, A.S. Shrimp Waste-Derived Porous Carbon Adsorbent: Performance, Mechanism, and Application of Machine Learning. J. Hazard. Mater. 2022, 437, 129266. [Google Scholar] [CrossRef] [Scilit] [PubMed]
  18. Bi, Y.; Bai, Y.; Meng, J.; Ji, R.; Zhang, Y.; Xue, J.; Zhu, C.; Lu, H.; Cao, F.; Feng, Y.; et al. Multiple Insights into the Molecular Heterogeneity of Artificial Humic Acids Derived from Alkali-Assisted Hydrothermal Humification of Real-World Biowastes. Ind. Crops Prod. 2026, 240, 122721. [Google Scholar] [CrossRef] [Scilit]
  19. Langmuir, I. The adsorption of gases on plane surfaces of glass, mica and platinum. J. Am. Chem. Soc. 1918, 40, 1361–1403. [Google Scholar] [CrossRef] [Scilit]
  20. Fatima, S.S.; Borhan, A.; Ayoub, M.; Ghani, N.A. Modeling of CO2 Adsorption on Surface-Functionalized Rubber-Seed Shell Activated Carbon: Isotherm and Kinetic Analysis. Processes 2023, 11, 2833. [Google Scholar] [CrossRef] [Scilit]
  21. Herawan, S.G.; Hadi, M.S.; Ayob, M.R.; Putra, A. Characterization of Activated Carbons from Oil-Palm Shell by CO2 Activation with No Holding Carbonization Temperature. Sci. World J. 2013, 2013, 624865. [Google Scholar] [CrossRef] [Scilit] [PubMed]
  22. Li, W.; Yang, K.; Peng, J.; Zhang, L.; Guo, S.; Xia, H. Effects of Carbonization Temperatures on Characteristics of Porosity in Coconut Shell Chars and Activated Carbons Derived from Carbonized Coconut Shell Chars. Ind. Crops Prod. 2008, 28, 190–198. [Google Scholar] [CrossRef] [Scilit]
  23. Zhang, J.; Duan, C.; Huang, X.; Meng, M.; Li, Y.; Huang, H.; Wang, H.; Yan, M.; Tang, X. A Review on Research Progress and Prospects of Agricultural Waste-Based Activated Carbon: Preparation, Application, and Source of Raw Materials. J. Mater. Sci. 2024, 59, 5271–5292. [Google Scholar] [CrossRef] [Scilit]
  24. Jawad, A.H.; Saud Abdulhameed, A.; Wilson, L.D.; Syed-Hassan, S.S.A.; ALOthman, Z.A.; Rizwan Khan, M. High Surface Area and Mesoporous Activated Carbon from KOH-Activated Dragon Fruit Peels for Methylene Blue Dye Adsorption: Optimization and Mechanism Study. Chin. J. Chem. Eng. 2021, 32, 281–290. [Google Scholar] [CrossRef] [Scilit]
  25. Kumar, D.P.; Ramesh, D.; Subramanian, P.; Karthikeyan, S.; Surendrakumar, A. Activated Carbon Production from Coconut Leaflets through Chemical Activation: Process Optimization Using Taguchi Approach. Bioresour. Technol. Rep. 2022, 19, 101155. [Google Scholar] [CrossRef] [Scilit]
  26. Tetteh, I.K.; Issahaku, I.; Tetteh, A.Y. Recent Advances in Synthesis, Characterization, and Environmental Applications of Activated Carbons and Other Carbon Derivatives. Carbon Trends 2024, 14, 100328. [Google Scholar] [CrossRef] [Scilit]
  27. Thommes, M.; Kaneko, K.; Neimark, A.V.; Olivier, J.P.; Rodriguez-Reinoso, F.; Rouquerol, J.; Sing, K.S.W. Physisorption of Gases, with Special Reference to the Evaluation of Surface Area and Pore Size Distribution (IUPAC Technical Report). Pure Appl. Chem. 2015, 87, 1051–1069. [Google Scholar] [CrossRef] [Scilit]
  28. Tang, Z.; Gao, J.; Dong, H.; Du, Q.; Feng, D.; Cheng, J.; Li, J.; Peng, Y.; Zhang, T.; Xie, M.; et al. Targeted Construction of Porous Biochar with Well-Developed Pore Structure for High-Performance CO2 Adsorption. J. Environ. Chem. Eng. 2024, 12, 114182. [Google Scholar] [CrossRef] [Scilit]
  29. Drage, T.C.; Kozynchenko, O.; Pevida, C.; Plaza, M.G.; Rubiera, F.; Pis, J.J.; Snape, C.E.; Tennison, S. Developing Activated Carbon Adsorbents for Pre-Combustion CO2 Capture. Energy Procedia 2009, 1, 599–605. [Google Scholar] [CrossRef] [Scilit]
  30. Oliveira, M.R.; Barboza, Y.T.; Santos, K.S.; Cecilia, J.A.; Rodríguez-Castellón, E.; Egues, S.M.; De Conto, J.F. High-Pressure CO2 Adsorption on MCM-41: Efficiency of Microwave-Assisted Synthesis. Sep. Purif. Technol. 2025, 360, 130871. [Google Scholar] [CrossRef] [Scilit]
  31. Inthawong, S.; Wongkoblap, A.; Intomya, W.; Tangsathitkulchai, C. The Enhancement of CO2 and CH4 Capture on Activated Carbon with Different Degrees of Burn-Off and Surface Chemistry. Molecules 2023, 28, 5433. [Google Scholar] [CrossRef] [Scilit] [PubMed]
  32. Marco-Lozar, J.P.; Kunowsky, M.; Suárez-García, F.; Linares-Solano, A. Sorbent Design for CO2 Capture under Different Flue Gas Conditions. Carbon 2014, 72, 125–134. [Google Scholar] [CrossRef] [Scilit]
  33. Yu, Q.; Bai, J.; Huang, J.; Demir, M.; Farghaly, A.A.; Aghamohammadi, P.; Hu, X.; Wang, L. One-Pot Synthesis of Melamine Formaldehyde Resin-Derived N-Doped Porous Carbon for CO2 Capture Application. Molecules 2023, 28, 1772. [Google Scholar] [CrossRef] [Scilit] [PubMed]
  34. Serafin, J.; Ouzzine, M.; Xing, C.; El Ouahabi, H.; Kamińska, A.; Sreńscek-Nazzal, J. Activated Carbons from the Amazonian Biomass Andiroba Shells Applied as a CO2 Adsorbent and a Cheap Semiconductor Material. J. CO2 Util. 2022, 62, 102071. [Google Scholar] [CrossRef] [Scilit]
  35. Yahia, E.H.; Serafin, J.; Román-Martínez, M.C.; Saidi, M.; Gallego, A.R.; Atlas, S.; Ouzzine, M. Valorization of Argan Paste Cake Waste: Enhanced CO2 Adsorption on Chemically Activated Carbon. J. Anal. Appl. Pyrolysis 2024, 181, 106637. [Google Scholar] [CrossRef] [Scilit]
  36. Sevilla, M.; Fuertes, A.B. Sustainable Porous Carbons with a Superior Performance for CO2 Capture. Energy Environ. Sci. 2011, 4, 1765. [Google Scholar] [CrossRef] [Scilit]
  37. Putri, A.M.H.; Ardiyati, T.; Mansur, D.; Hauli, L.; Ramadhoni, B.F.; Prasetia, H. Enhanced CO2 Adsorption Using Cu-MOF/Carbon Composites from Tea Twigs via One-Step Plasma Activation. Results Eng. 2026, 29, 108467. [Google Scholar] [CrossRef] [Scilit]
  38. Asmaly, H.A.; Elbager, M.A.; Iqbal, A.; Elkhider, S.M. Enhanced CO2 Capture Using Sustainable Biomass-Derived Activated Carbon from Desert Date Seed Husk: Adsorption Isotherms, Selectivity, and RSM Optimization. J. CO2 Util. 2026, 107, 103411. [Google Scholar] [CrossRef] [Scilit]
  39. Gorbounov, M.; Diaz-Vasseur, E.; Danaci, D.; Masoudi Soltani, S. Chemical Activation of Porous Carbon Extracted from Biomass Combustion Bottom Ash for CO2 Adsorption. Carbon Capture Sci. Technol. 2024, 10, 100151. [Google Scholar] [CrossRef] [Scilit]
  40. Talapaneni, S.N.; Lee, J.H.; Je, S.H.; Buyukcakir, O.; Kwon, T.; Polychronopoulou, K.; Choi, J.W.; Coskun, A. Chemical Blowing Approach for Ultramicroporous Carbon Nitride Frameworks and Their Applications in Gas and Energy Storage. Adv. Funct. Mater. 2017, 27, 1604658. [Google Scholar] [CrossRef] [Scilit]
  41. Yahia, E.H.; Serafin, J.; Román-Martínez, M.C.; Sreńscek-Nazzal, J.; Dziejarski, B.; Saidi, M.; Ouzzine, M. Preparation of Activated Carbon from Moroccan Argan Press Cake Using KOH Activation and Its Application for CO2 Adsorption. Fuel 2025, 393, 134922. [Google Scholar] [CrossRef] [Scilit]
  42. Wang, J.; Yin, Y.; Liu, X.; Liu, Y.; Xiao, Q.; Zhao, L.; Demir, M.; Alaş Çolak, M.Ö.; Wang, L.; Hu, X. Potassium Metaborate-Activated Boron-Doped Porous Carbons for Selective CO2 Adsorption. Sep. Purif. Technol. 2025, 376, 134079. [Google Scholar] [CrossRef] [Scilit]
  43. Sarkar, S.D.; Mukherjee, D.; Kuila, D. CO2 Capture Using Activated Carbon Derived from Avocado Seeds and Sawdust: A Comparative Study on Adsorption Performance and Surface Properties. J. Environ. Chem. Eng. 2025, 13, 117643. [Google Scholar] [CrossRef] [Scilit]
Figure 1. Nitrogen adsorption–desorption isotherms for SS samples obtained at different carbonization times (a) and temperatures (c); pore size distribution for SS samples obtained at different carbonization times (b) and temperatures (d).
Cleantechnol 08 00130 g001
Figure 2. The influence of carbonation time on SBET, VT, Vmic, Vmes, and the CO2 adsorption capacity of SS samples.
Cleantechnol 08 00130 g002
Figure 3. The influence of temperature of carbonation on SBET, VT, Vmic, Vmes, and on the CO2 adsorption capacity of SS samples.
Cleantechnol 08 00130 g003
Figure 4. Nitrogen adsorption–desorption isotherms for SS samples obtained at different times (a), activation temperatures (c), and KOH/carbonizate weight ratios (e); pore size distribution for SS samples obtained at different times (b), activation temperatures (d), and KOH/carbonizate weight ratios (f).
Cleantechnol 08 00130 g004
Figure 5. The influence of activation time on SBET, VT, Vmic, Vmes, and the adsorption capacity of SS samples for CO2.
Cleantechnol 08 00130 g005
Figure 6. The influence of activation temperature on SBET, VT, Vmic, Vmes, and the adsorption capacity of SS samples for CO2.
Cleantechnol 08 00130 g006
Figure 7. The influence of KOH/carbonizate weight ratio on SBET, VT, Vmic, Vmes, and the adsorption capacity of SS samples for CO2.
Cleantechnol 08 00130 g007
Figure 8. CO2 adsorption–desorption isotherms on SS obtained at different KOH/carbonizate weight ratios.
Cleantechnol 08 00130 g008
Figure 9. CO2 adsorption isotherms on the SS_652_41752 sample at different temperatures adapted to the Langmuir (a) and Freundlich (b) models.
Cleantechnol 08 00130 g009
Figure 10. Isosteres of CO2 on the SS_652_41752 sample for adsorption values of 0.5 (1), 3.0 (2), 6.0 (3), 9.0 (4), 12.0 (5), 14.0 (6), 17.0 (7), 19.0 (8), 21.0 (9), and 24.0 (10) mmol/g.
Cleantechnol 08 00130 g010
Figure 11. Isosteric heat of CO2 adsorption on SS_652_41752.
Cleantechnol 08 00130 g011
Table 1. Results of processing CO2 adsorption isotherms on the SS_652_41752 sample using the Langmuir and Freundlich models.
Temperature (K)298.15303.15308.15313.15318.15
a e x p 40.0334.3130.9228.0225.82
Langmuir constants
a L m o d 35.3630.9828.7925.2824.72
A 65.7957.8054.9548.7848.54
k L 0.02900.02880.02740.02690.0258
R 2 0.98100.98380.98290.98230.9844
Δ a 9.018.608.568.998.17
Freundlich constants
a F m o d 40.0035.2931.9229.0226.62
k F 2.04731.79881.62481.46961.3406
n 1.2411.2391.2311.2231.205
R 2 0.99790.99760.99740.99710.9970
Δ a 4.634.524.584.894.79
Table 2. Comparison of CO2 adsorption characteristics at 40 bar by different carbon adsorbents.
MaterialBET Surface Area (m2/g)Total Pore Volume (cm3/g)Temperature (°C)Adsorption Pressure (bar)CO2 Uptake (mmol/g)Reference
SS_652_4175230522.60254040.0This study
AC-2–70015690.812540~8.5[28]
MC-B-4017221.212540~8.5[29]
MCM-41_MW60-0.59410.84255012.8[30]
LACO17731.072640~5.1[31]
NaSB3130241.302540∼26.0[32]
KL3125401.022540∼21.0[32]
KA2121561.022540∼17.5[32]
Table 3. Comparison of CO2 adsorption characteristics at 1 bar by different carbon adsorbents.
MaterialBET Surface Area (m2/g)Total Pore Volume (cm3/g)Temperature (°C)Adsorption Pressure (bar)CO2 Uptake (mmol/g)Reference
SS_652_1175211750.702513.41This study
MFC-700-0.216580.662513.30[33]
AC-AND-10 h19370.932513.20[34]
APC-500–70012110.632512.89[35]
PC23700.912512.90[36]
Cu-MOF/AC(700)11110.852512.58[37]
HDDS-AC (850−120)20001.242513.0[38]
ChAB6430.292511.93[39]
Ultramicroporous carbon1580-2513.05[40]
APC-300-80017500.772512.63[41]
WSCPM-900-26830.302513.15[42]
AC-AV-P12720.752513.30[43]
Disclaimer/Publisher’s Note: The statements, opinions and data contained in all publications are solely those of the individual author(s) and contributor(s) and not of MDPI and/or the editor(s). MDPI and/or the editor(s) disclaim responsibility for any injury to people or property resulting from any ideas, methods, instructions or products referred to in the content.