3.1. Modelling Results
The MATLAB model was validated using experimental results from SEG tests conducted on a bench-scale gasifier [
24].
Table 7 presents the comparison between experimental data and simulation results in terms of gas yield and total tar concentration, while
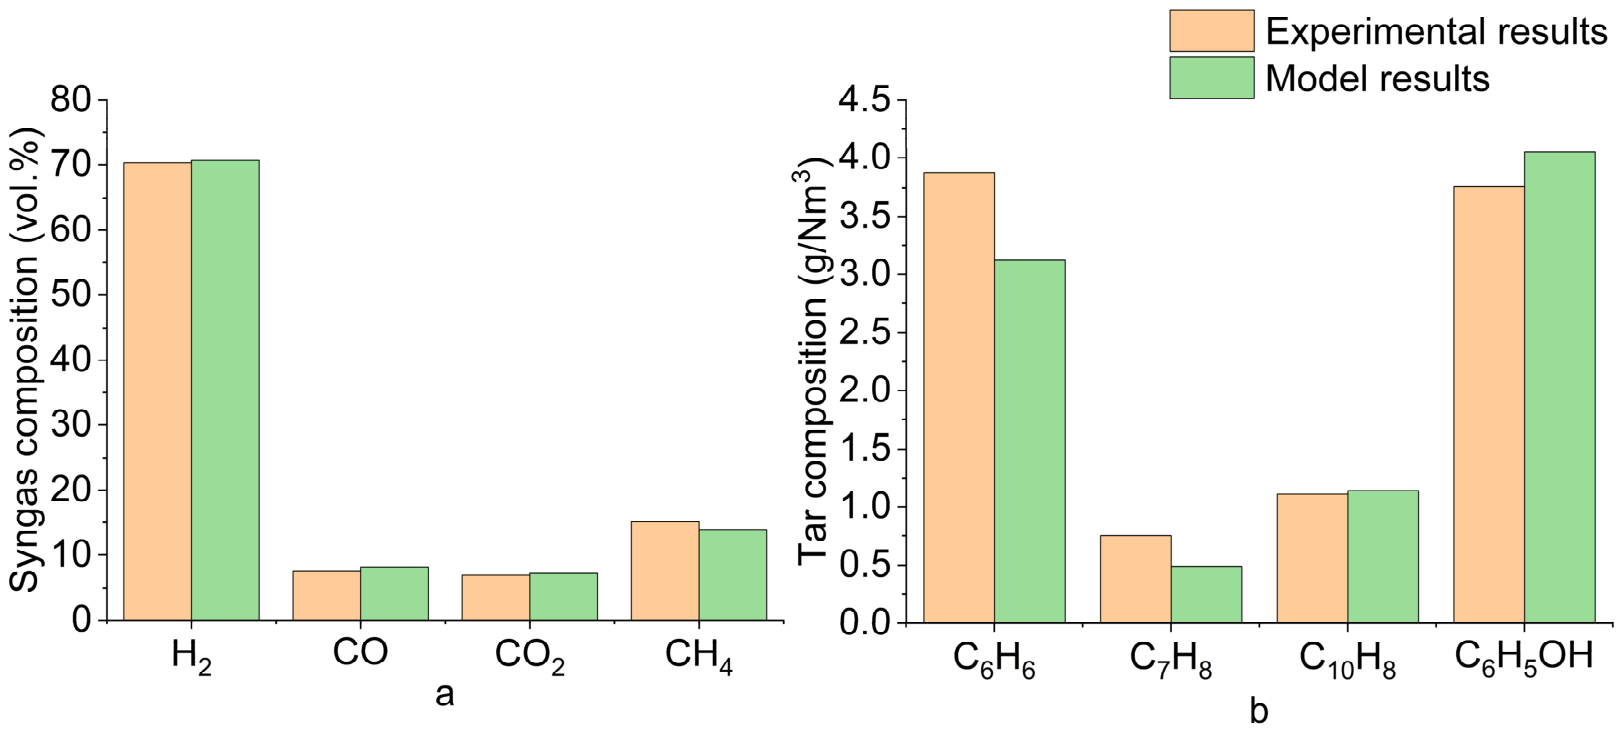
Figure 4 compares the composition of the dry, nitrogen-free gas and the tar distribution obtained from both experiments and simulations.
The results demonstrate that the proposed model accurately reproduces the main features of the SEG process, yielding a syngas composition in good agreement with experimental data. The largest deviation is observed in the model’s underestimation of the C
6H
6 and C
7H
8 concentrations. This discrepancy is reflected in the lower total tar concentration predicted in the simulation compared to experimental measurements, with an overall deviation of approximately 8%. In the previous study [
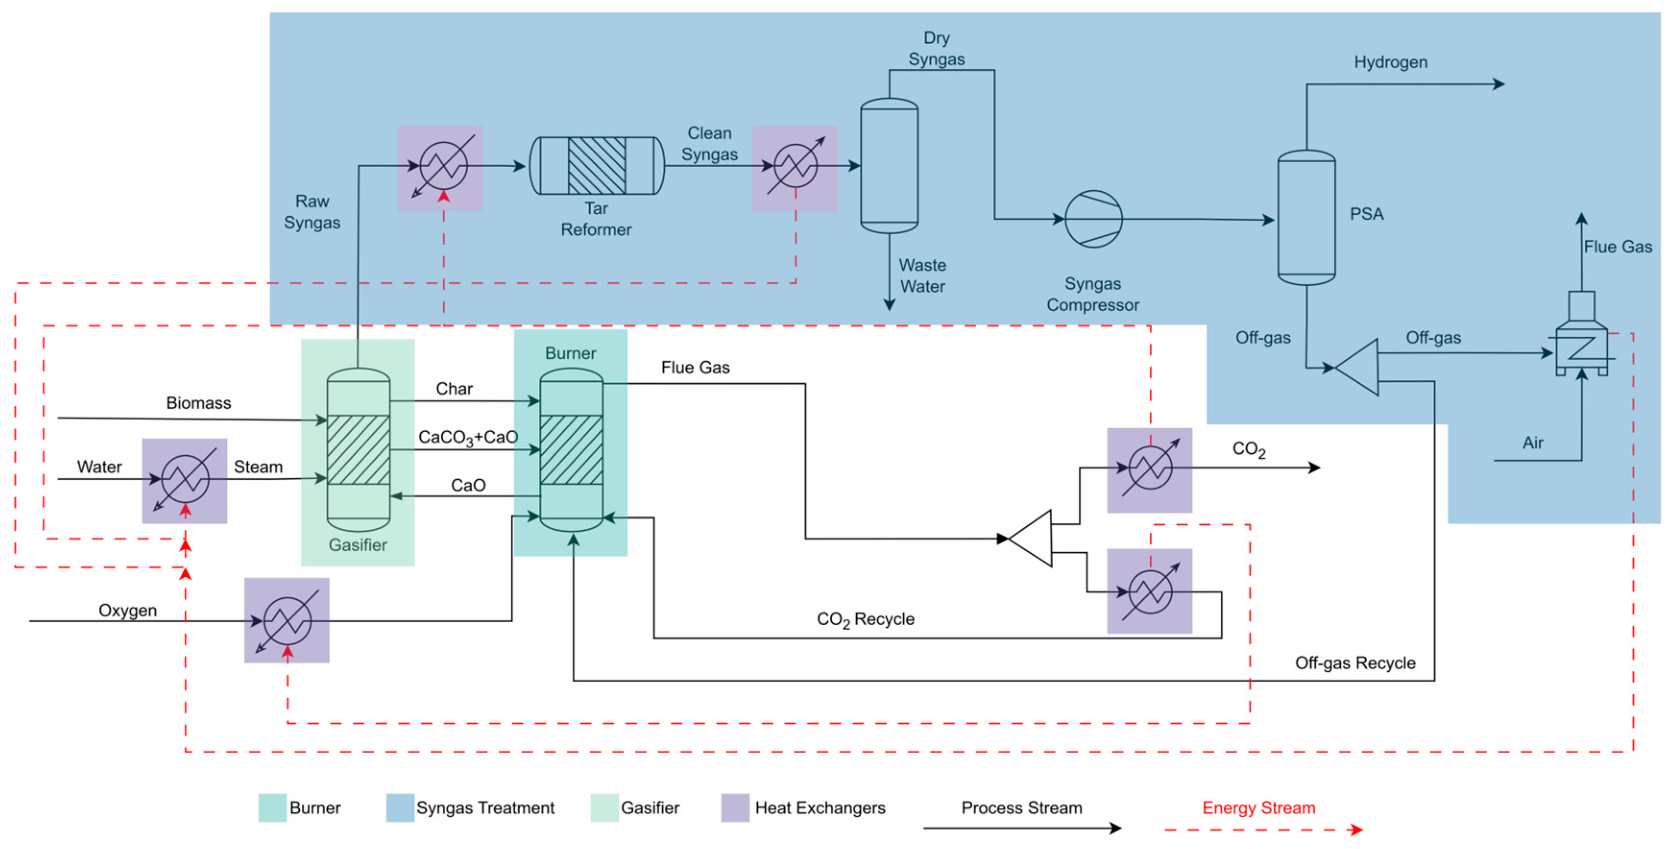
24], a limited conversion of methane and tar was observed; enhancing their conversion could further improve gas quality and hydrogen yield. Therefore, the tar reformer is included in the present simulation (TARREF in
Figure 3).
Starting from the validated model, three different plant sizes (100 kWth, 1 MWth, and 10 MWth) were simulated and analyzed. This multi-scale approach enables the identification of configurations capable of achieving a LCOH competitive with state-of-the-art hydrogen production technologies.
In accordance with the economies of scale principle, the CAPEX is calculated according to Equation (25) [
50].
where
n < 1.
As a result, larger plants benefit from a relative reduction in specific capital costs, making it possible to identify the plant size that minimizes the LCOH and ensures economic competitiveness.
Table 8 shows the fluid dynamics and operating conditions of the gasification subsystem. The simulation is carried out at constant temperature (670 °C), pressure (1 bar), steam-to-biomass ratio (S/B = 1) and residence time (τ
gas) defined as the ratio between the reactor volume and syngas volumetric flow rate.
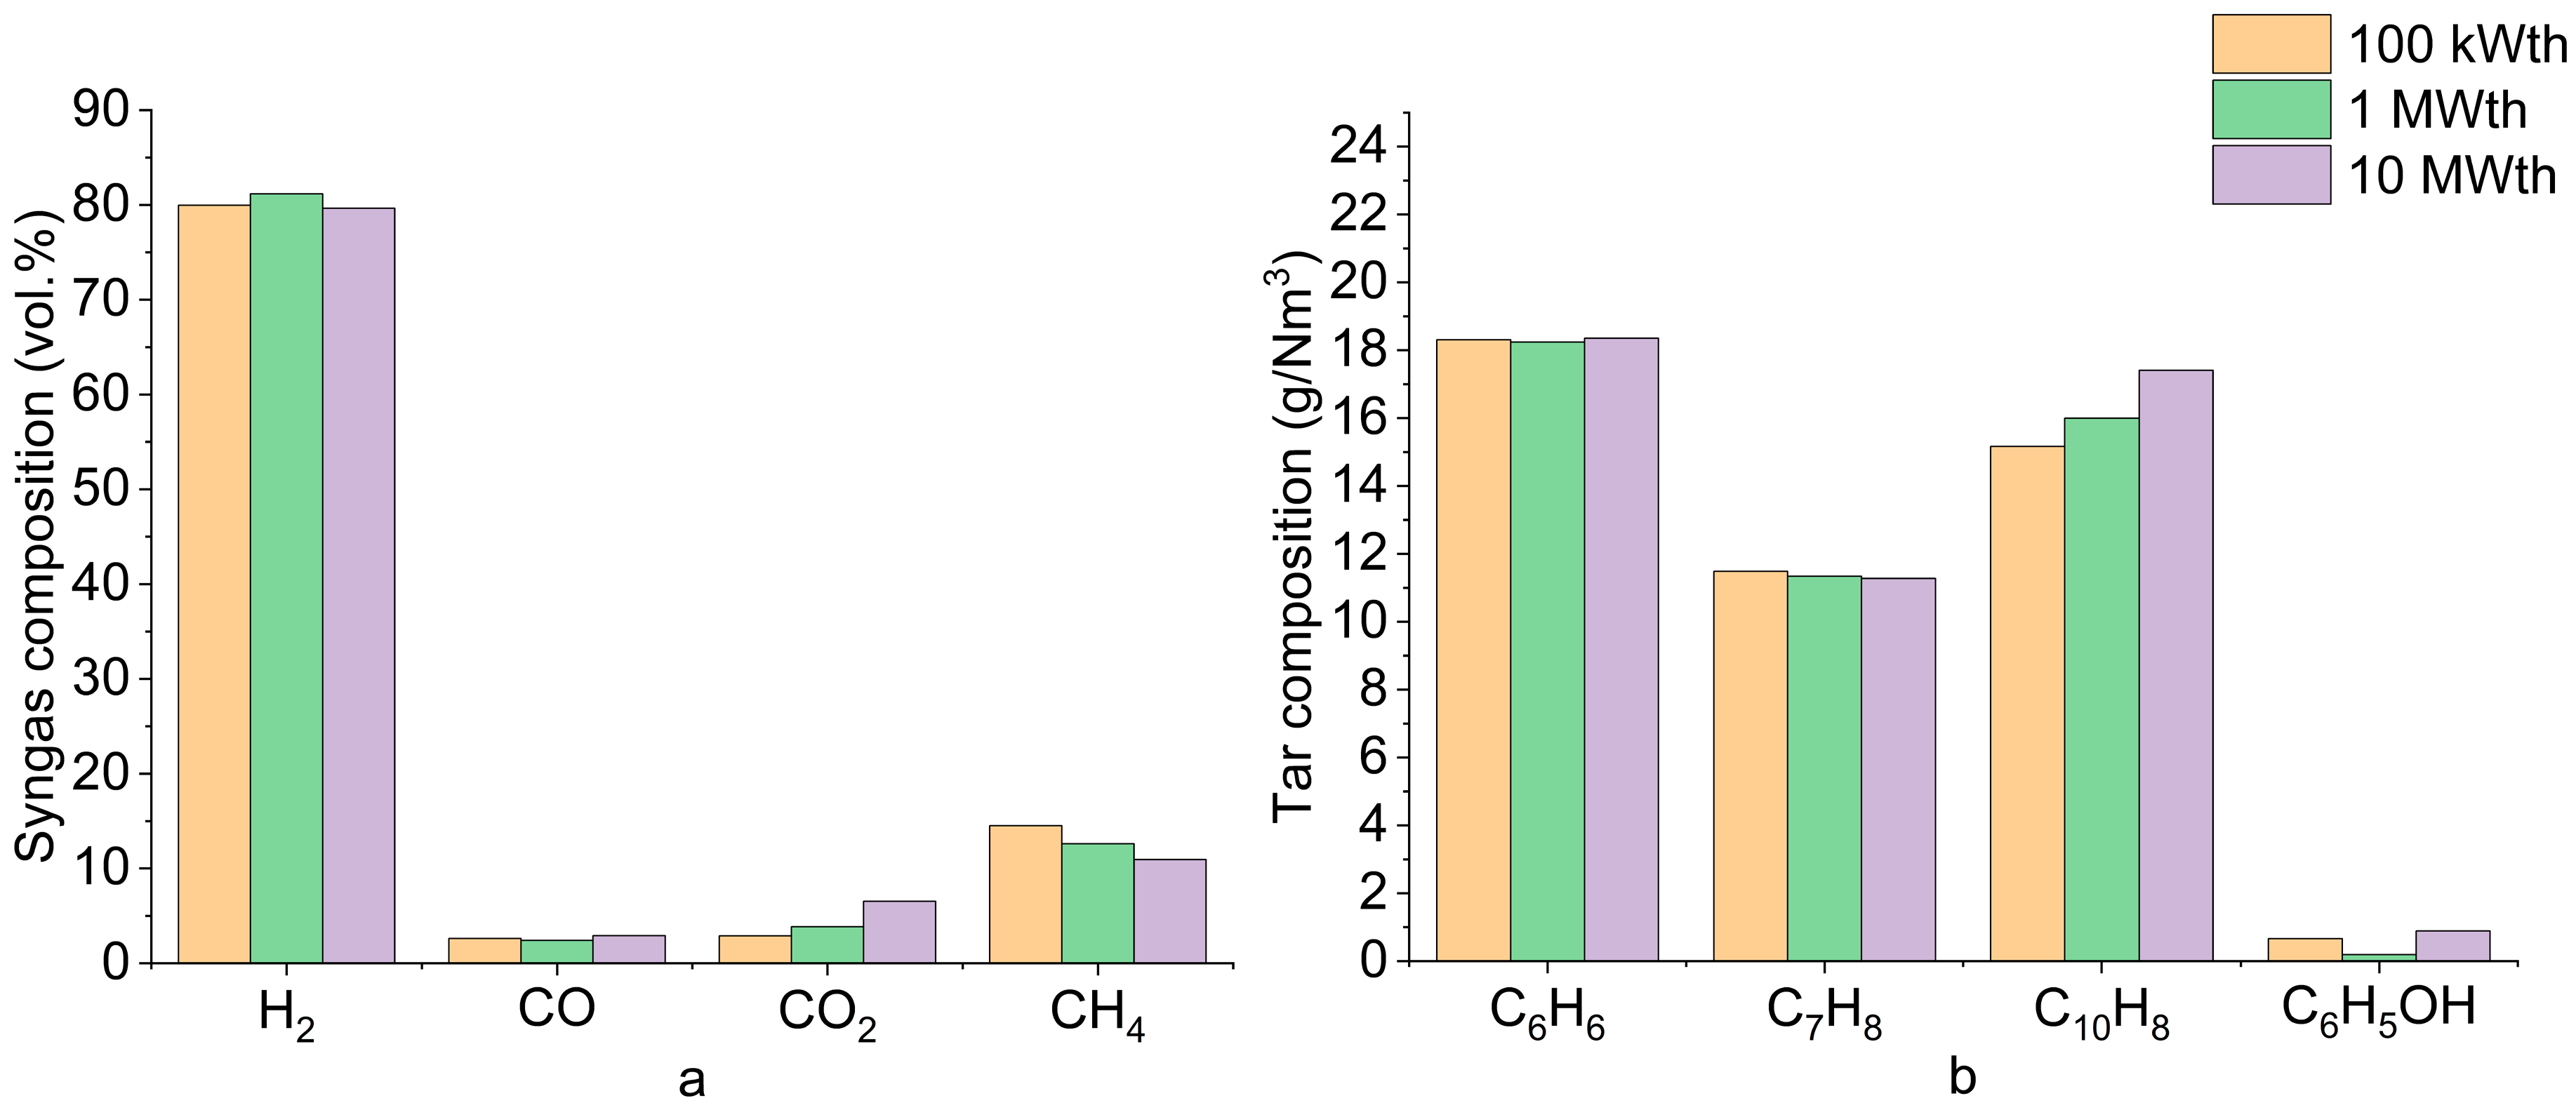
The figures below report the dry syngas (
Figure 5a) and tar composition (
Figure 5b).
The dry syngas composition obtained by the simulation depends on the gasifier scale, as reported in
Figure 5a. At 100 kWth, H
2 reaches 80%, with CH
4 15%, CO 3%, and CO
2 3%. At 1 MWth, H
2 slightly increases to 81%, while CO
2 increases to 4% and CO remains low (2%). At 10 MWth, hydrogen remains stable to 80%, CO
2 increases to 7%, CO remains stable to 3%, and methane decreases to 11%.
Despite small differences in syngas composition, the model predicts stable performance during scale-up. Under real operating conditions, various fluid-dynamic phenomena may arise during scale-up, potentially leading to reduced process efficiency. The parameters that influence gas production and quality in this model are gas velocity, bubble size, and bubble rise velocity. High gas velocities (
u0) lead to the formation of large bubbles that rise rapidly, thereby reducing the contact time between the gas and solid phases. Consequently, if the bubble rise velocity (
) is excessively high, the model predicts a decrease in efficiency as the gas escapes before reacting. Furthermore, an increase in bubble diameter (
dB) results in a reduced surface area for mass transfer between the bubble and emulsion phases. This reduction in exchange area hinders the gasifying agent from reaching the solid particles, leading to lower conversion rates [
25]. According to Davidson’s theory [
54,
55], the size of the cloud surrounding the bubble—the primary zone for gas exchange—depends on the ratio between the bubble velocity (
) and the emulsion gas velocity (
ue). If this region becomes excessively thin, the mass transfer is reduced. Ideally, the bubble velocity should be approximately five times the emulsion gas velocity [
25]. During scale-up, the fluid dynamics undergo significant changes that affect hydrogen yield. In wider beds, bubbles tend to coalesce, becoming larger and faster; this decreases the surface-to-volume ratio and impairs mass transfer. To control the growth of bubbles and to promote their breakup, various types of internals are frequently used in large-scale fluidized beds. Specifically, horizontal perforated baffles are employed to periodically redistribute the gas phase and fragment large voids, thereby maintaining a high interfacial area for mass transfer. Similarly, the installation of tube bundles, while often serving as heat exchange surfaces, provides a dual benefit by acting as physical barriers that limit maximum bubble size. Furthermore, the use of screens or grids at various bed heights further assists in mitigating the development of large bubbles [
25,
56,
57].
Under ideal sorption equilibrium conditions, dry H
2 concentrations between 70 and 85% are commonly reported in SEG systems operating in the 600–700 °C range [
58,
59]. Compared to conventional DFB gasifiers without CO
2 capture, which typically yield 35–45% of H
2, 20–25% of CO, 20–25% of CO
2, and 8–12% of CH
4 [
12], the results clearly show the substantial hydrogen enhancement achieved via in situ CO
2 sorption. The methane fraction (10–13%) across all scales is consistent with the moderate operating temperature (650 °C), where steam reforming is not fully promoted compared to high-temperature DFB systems (750–850 °C), in which CH
4 concentrations are generally lower [
60].
The tar distribution is coherent with fluidized bed gasification at intermediate temperature, where thermal cracking reactions are less severe than in catalytic or high-temperature configurations [
61,
62]. The slight differences in heavier aromatic fractions at different scales may reflect the differences in residence times, as highlighted in
Table 8.
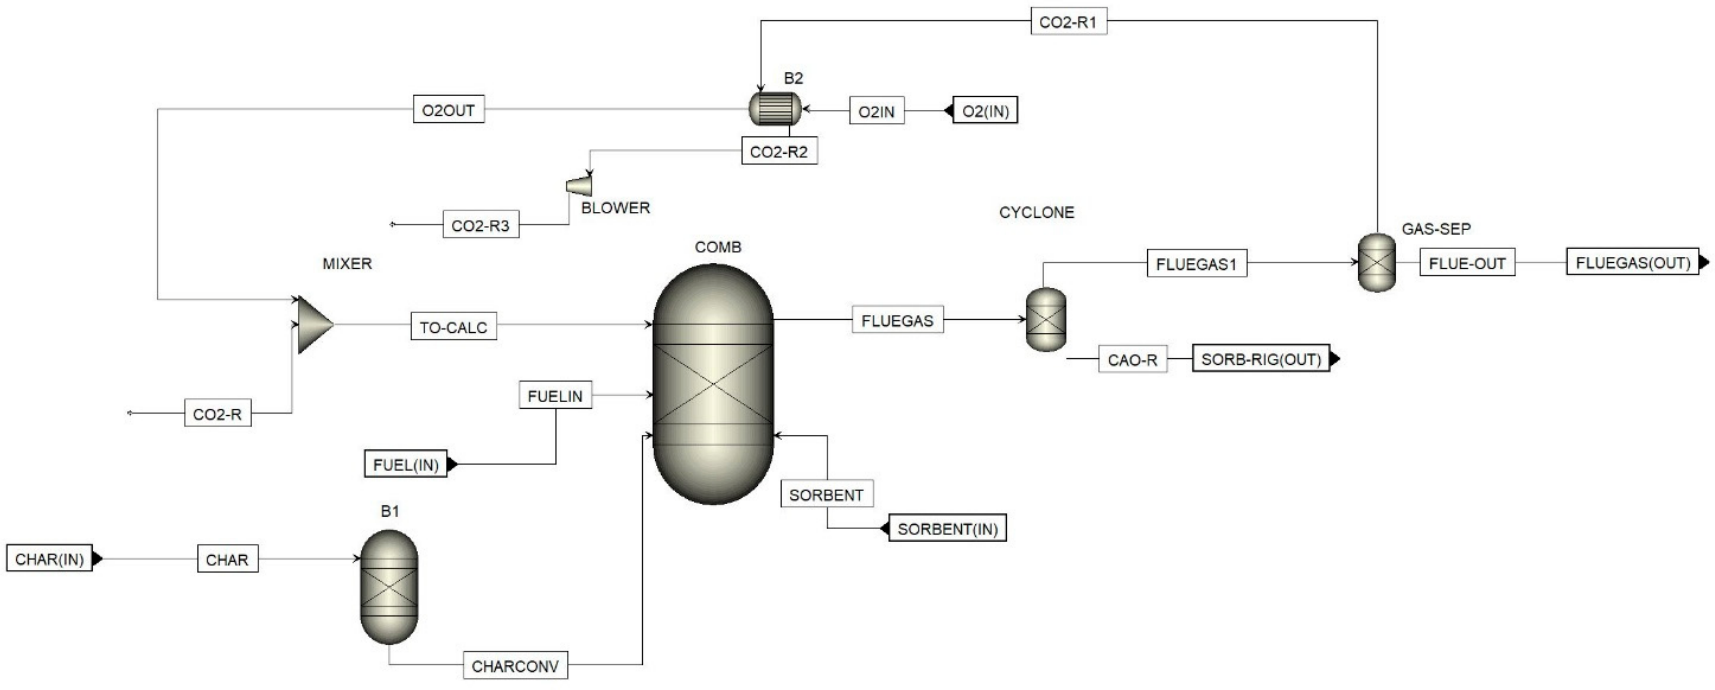
In a calcium looping system, the combustor also serves as the regeneration unit for the sorbent. The char is fed to the combustion subsystem together with the carbonated dolomite, oxygen, and recirculated CO
2. The high-temperature flue gas, mainly CO
2, is partially recirculated to the combustor to have a superficial velocity equal to 10 times the u
mf in the combustor to assure an efficient bed material recirculation as reported in the work [
63] for a 100 kWth DFBG as biomass input. For the simulation of the 100 kWth gasifier, therefore, the same size (diameter) of the combustor reported in the work [
63] was used to determine the volumetric flow rate (O
2 and recirculated CO
2) at the superficial velocity selected. For the simulations of the scaled-up gasifiers (1 MWth and 10 MWth) the volumetric flow rates were scaled accordingly. As a result, the gas mix of O
2 and CO
2 entering the reactor had a composition comparable to that of air, in which CO
2 replaces N
2.
The reactor outputs include hot flue gas and calcined dolomite. The absence of CO in the flue gas further confirms that the operating conditions and oxygen supply are sufficient to achieve complete combustion. In a DFB system, the bed material plays a fundamental role as a heat carrier between the combustor and the gasifier [
64]. Heat required for the endothermic gasification reactions is not generated by partial oxidation but indirectly supplied via the circulation of hot bed solids. In the combustion reactor, residual char is oxidized, producing exothermic heat that increases the temperature of the bed material.
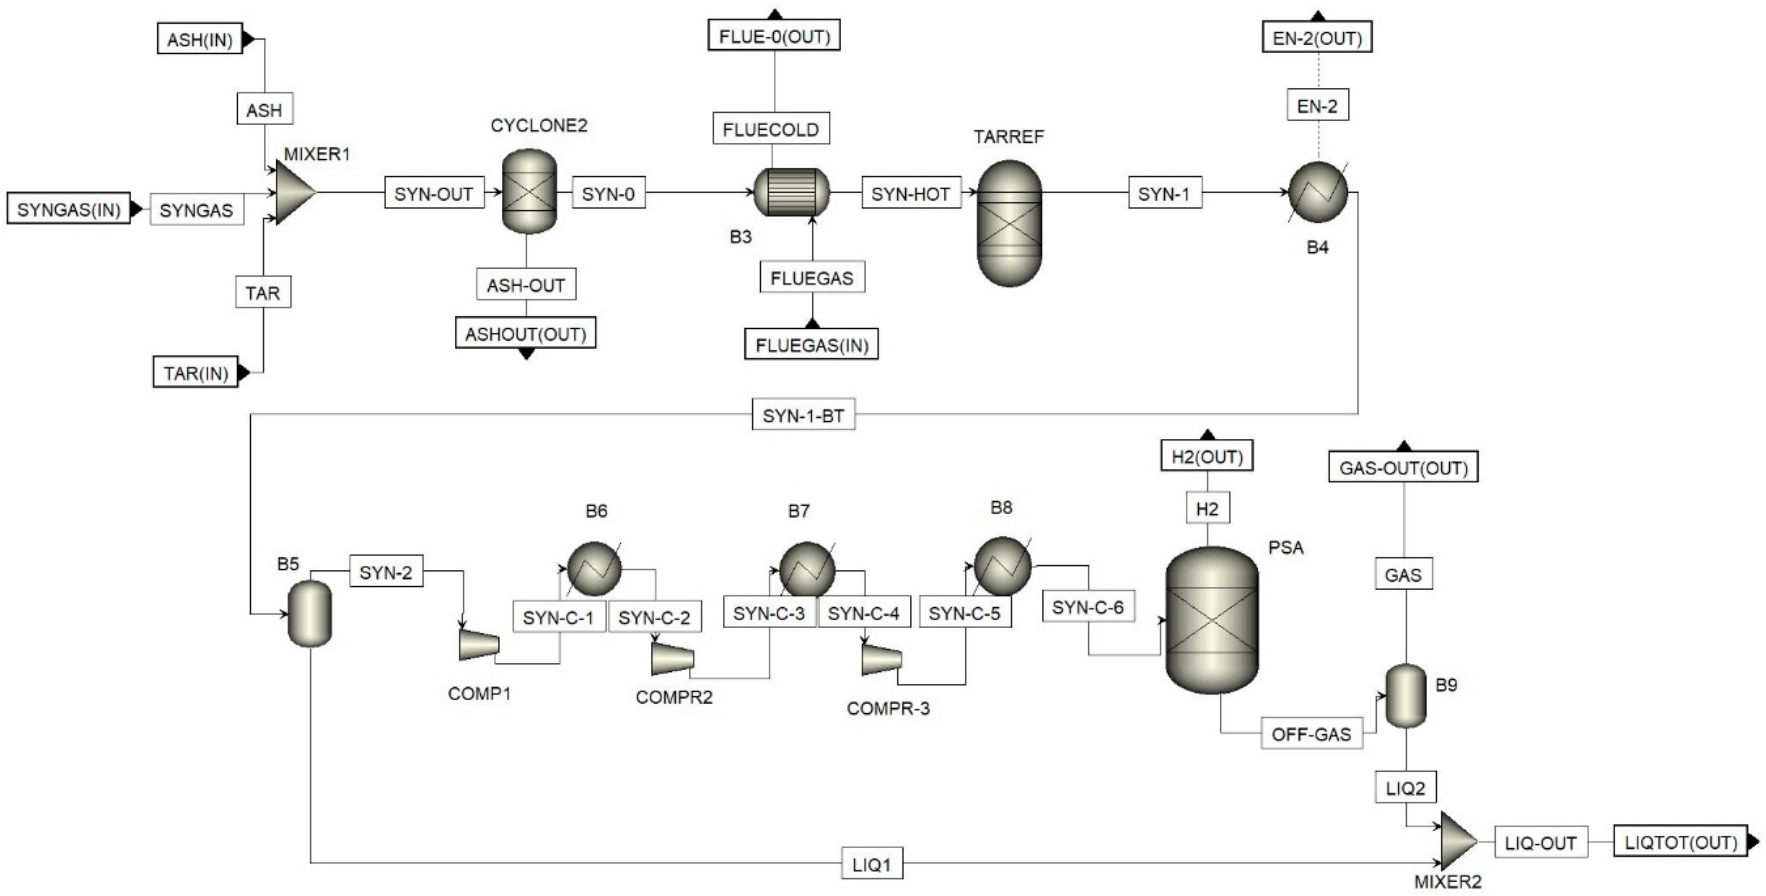
The obtained syngas is finally directed to the PSA subsystem to produce pure hydrogen. As previously mentioned, a limited conversion of tar was observed. Before entering the PSA system, the syngas is enriched via a tar reformer, which ensures high-purity hydrogen recovery while significantly enhancing overall process efficiency, and preventing downstream fouling and catalyst poisoning within the PSA unit.
The output data obtained from the PSA unit is shown in
Table 9.
The tail gas composition, characterized by 24–33% residual H2 and 33–37% of CO2, aligns with industrial PSA applications, where the off-gas is typically recycled to the combustion reactor of DFB systems for energy recovery.
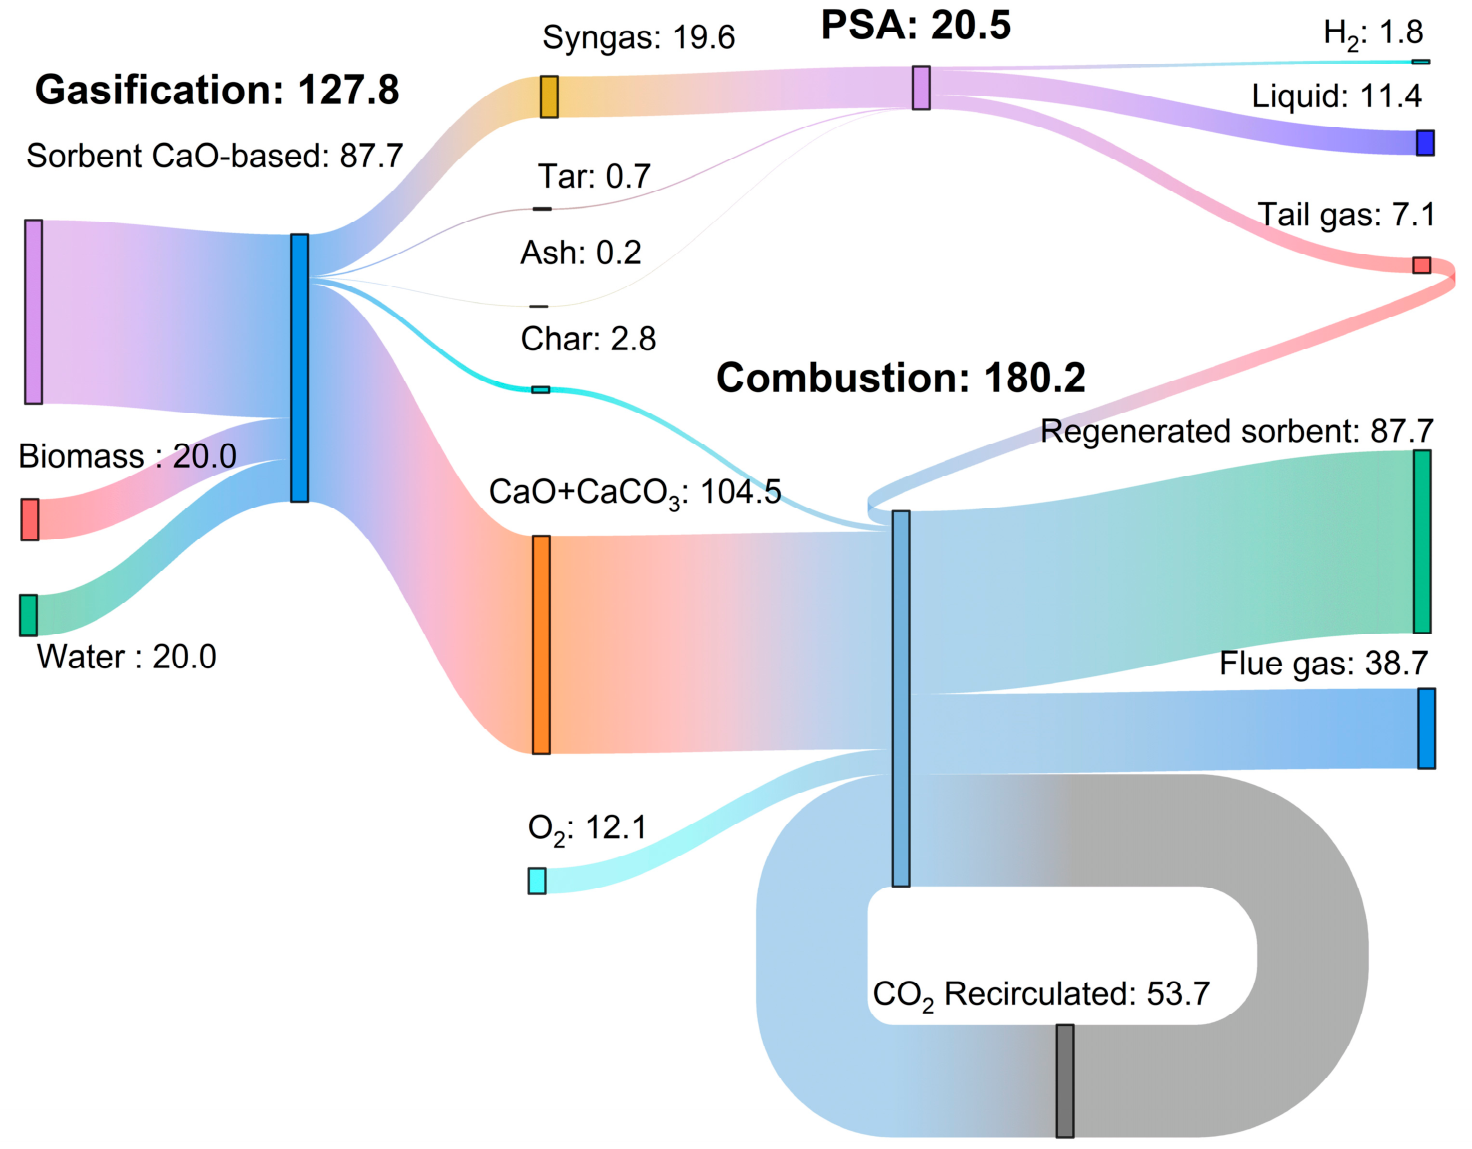
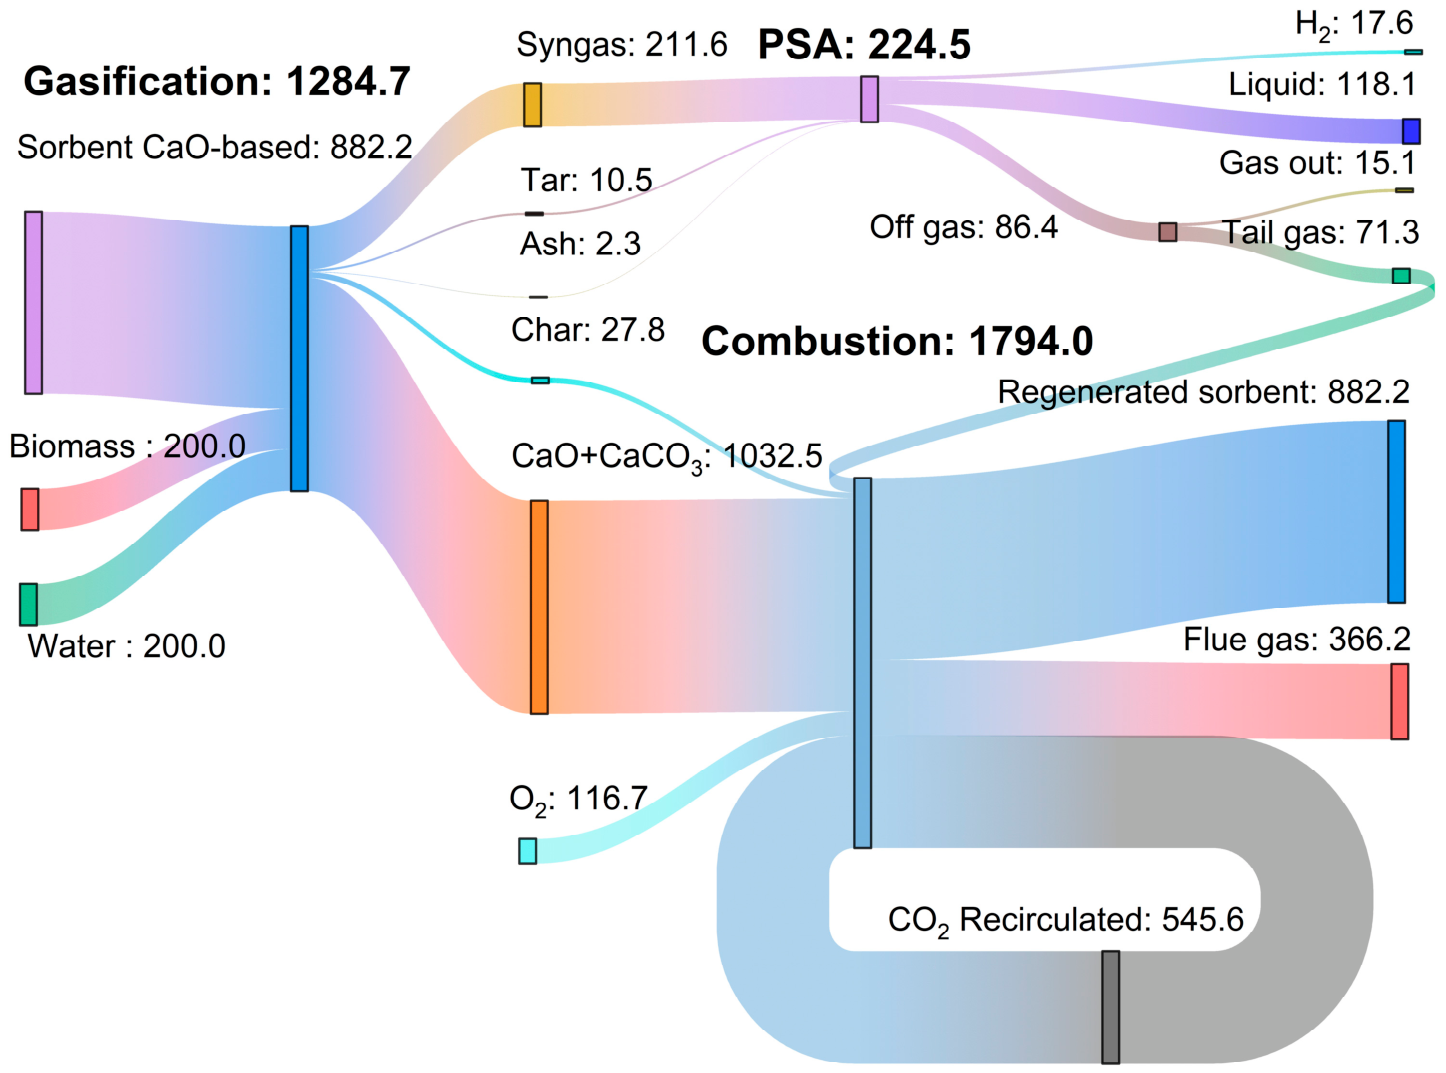
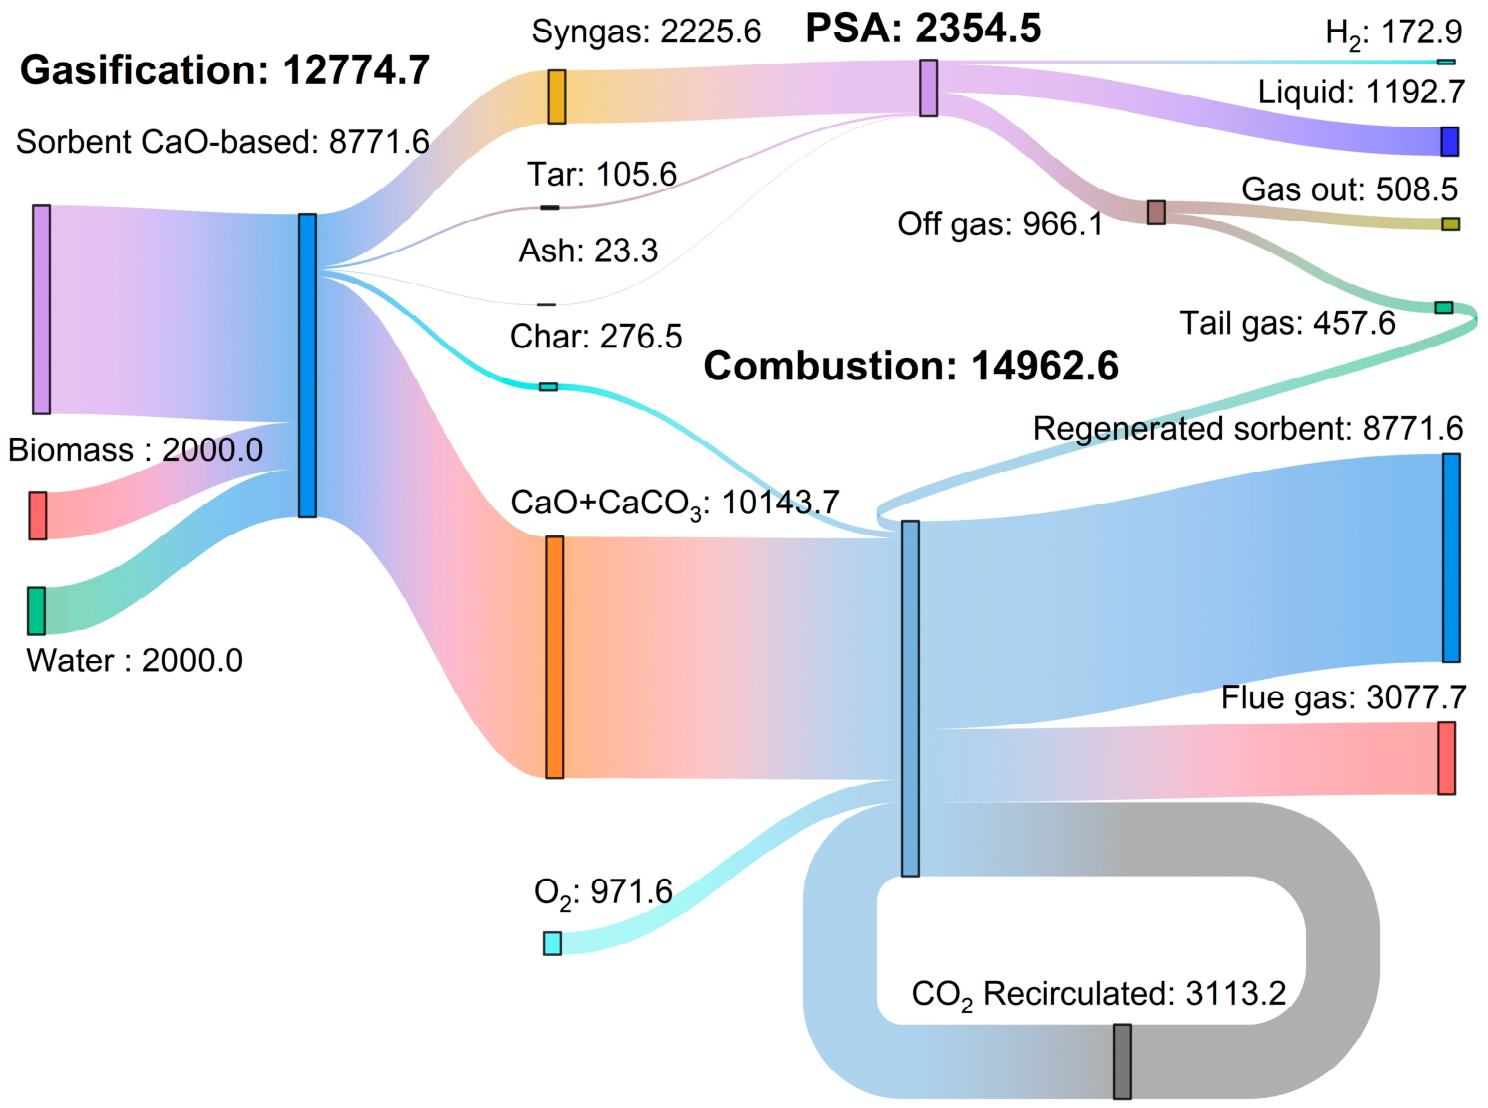
The Sankey diagrams of the system mass flow rate for the three scenarios considered are shown in
Figure 6,
Figure 7 and
Figure 8.
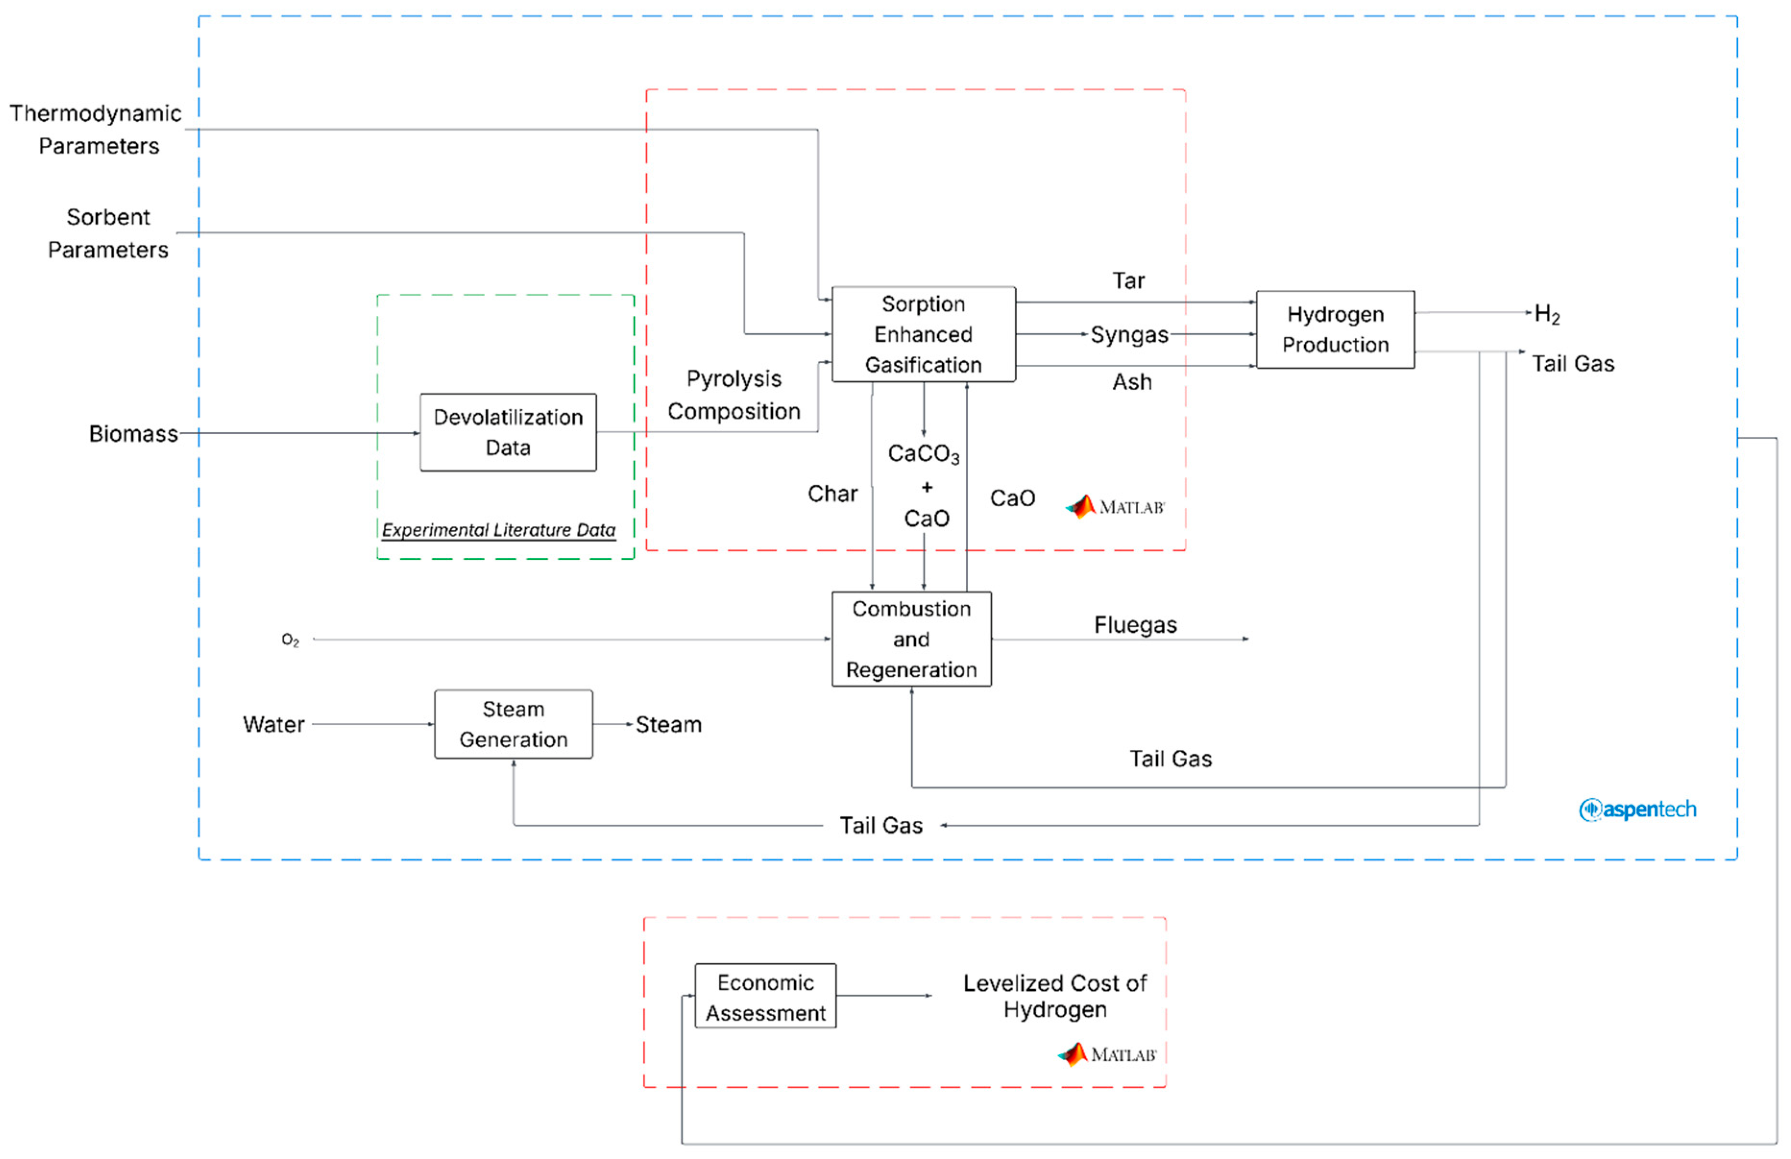
The gasification subsystem receives the biomass feedstock together with the required process water (S/B ratio equal to 1) and the sorbent CaO-based for the CO2 capture, producing syngas directed to the PSA subsystem, char, and various by-products. These represent the inputs for the model developed in Aspen.
As presented in the Sankey diagram, the total sorbent requirements for CO2 capture in the carbonator amount to 87.7 kg/h, 882.2 kg/h, and 8772.1 kg/h, respectively, for the three scenarios. Given the amount of biomass fed, the CaO-to-biomass ratio remains constant at approximately 4.3–4.4 kgCaO/kgBiomass, indicating that the scale-up was performed under proportional sorbent loading conditions, thus representing strongly intensified in situ CO2 capture conditions.
To ensure the allotermicity of the gasification and capture process and to increase overall efficiency, it is necessary to use a small amount of PSA-produced gas. As can be observed from the figures, all the off-gases are required only in the 100 kWth case, together with a small fraction of H2 (9.6 mol/h), to ensure sorbent regeneration and the consequent CO2 capture. The flue gas generated in the combustor is subsequently separated, with a fraction recirculated to ensure proper reactor fluidisation.
3.2. Performance Indicators Results
The CGE represents the fraction of the inlet energy that is converted into the chemical energy of the produced syngas. The relatively high conversion values observed are also due to internal energy recovery within the system. Since the overall gasification–combustion process operates under allothermal conditions, steam generation requires a significant energy demand.
Table 11 reports the energy requirements for steam production under the three investigated scenarios.
These components represent the three main stages for vapour generation: heating the liquid water (economizer), change in state (evaporator), and increasing the temperature of dry steam beyond the saturation point (superheater).
In a system without internal heat recovery, the energy required for steam generation would be supplied by an auxiliary fuel. This would constitute an additional energy input to the process and would therefore directly affect the overall system efficiency. In the present study, thermal integration strategies were implemented to eliminate the use of auxiliary fuel and enhance the system’s overall thermal performance.
The sensible heat of the flue gas (980 °C) exiting the combustion section is first utilized to superheat the syngas upstream of the tar reformer. This heat exchanger was designed to ensure a minimum temperature driving force of 10 °C between the flue gas outlet temperature and the syngas inlet temperature. As a result, the flue gas temperature decreases to 690 °C. Its remaining sensible heat is then employed for steam superheating up to 400 °C and subsequently in the economizer to preheat the boiler feed water to its saturation temperature. At this stage, only the vaporization remains to be supplied, which, as shown in
Table 11, represents the main energy requirement for steam production.
Downstream of the tar reformer, the syngas is first cooled and then sent to a flash unit to remove condensed water before the compression stage of the PSA (see
Figure 3). The sensible heat of the syngas is partially recovered and used to support water vaporization. However, to guarantee a minimum temperature driving force of 10 °C, the available syngas sensible heat alone is insufficient to complete the vaporization process.
A high-energy output stream of the system is the PSA tail gas. As shown in the Sankey diagram, in the 100 kWth scenario, the tail gas is entirely directed as an energy carrier to the combustor section, together with a small fraction of the produced hydrogen (0.013 kg/h). In this case, a limited amount of auxiliary fuel is still required to meet the total steam generation demand. In contrast, in the 1 MWth and 10 MWth scenarios, a portion of the tail gas not required in the combustor is used to provide the additional energy necessary to complete the water vaporization step. With this thermal integration strategy, auxiliary fuel was eliminated in the 1 MWth and 10 MWth scenarios, thereby improving the system’s overall thermal efficiency. The slight discrepancy across the scenarios is because scaling up influence syngas composition and modify efficiency, as presented before.
In the literature, CGE values typically range from approximately 50% to above 75%, depending on the process configuration, reactor technology, and operating conditions. For instance, ref. [
65] reported CGE values ranging from 51.8% to 71.4% in a 200 kWth fluidized-bed gasifier with energy recovery from solid residues and syngas. Even in the work of [
66], where the results obtained during gasification test are integrated to feed a Combined Heat and Power (CHP)-based system, the CGE is approximately of 66%. The study of [
67] reported a CGE value of 61.6% in a Computational Fluid Dynamics (CFD) model for biomass gasification in fixed-bed reactors for hydrogen production.
In this study, the primary objective is hydrogen production, which results in low-carbon utilization. This parameter represents the fraction of carbon in the biomass converted into products such as methane or methanol. In the present case, carbon is almost entirely stored as CO2, while the remain is found as unreacted char and light carbon-based compounds in the syngas.
In addition to the Carbon Capture Efficiency (CCE), which quantifies the fraction of carbon dioxide captured within the process, a specific emission intensity (EI) normalized to hydrogen production was evaluated to provide a process-level indication of the net carbon burden associated with the investigated system. Under the adopted system boundaries, the calculated EI values are 1.02 kgCO2,eq/kgH2 for the 1 MWth case and 3.57 kgCO2,eq/kgH2 for the 10 MWth case, suggesting that the intermediate scale exhibits the most favourable balance between carbon capture performance and residual emissions. However, it should be emphasized that this indicator is limited to the modelled process boundary and does not constitute a full life-cycle assessment, as upstream and downstream auxiliaries were not included in a complete LCA framework. The higher EI at 10 MWth is mainly attributable to the reduced use of PSA tail gas for internal energy integration, and also a small contribution of the capture of CO2 which depends on lower flue-gas capture performance in the carbonator, changing from 48.36% to 45.08% at 1 MWth and 10 MWth respectively. The above consideration is bonded to the condition that all the CO2 contained in the flue gas is supposed to be stored adequately in a long-time or permanent storage site.
When the auxiliary contributions were also included through the simplified net carbon footprint formulation, the resulting CFnet values ranged from 0.39 to 0.77, 1.49–1.95, and 4.03–4.49 kgCO2,eq/kgH2 for the small-, intermediate-, and large-scale cases, respectively; the auxiliary burden is largely dominated by electricity consumption, while the contributions of water and biomass supply remain comparatively limited. Nevertheless, this CFnet should be regarded only as a partial indication of the environmental performance of the system and the impact of the produced hydrogen, since it does not represent a complete life-cycle assessment.
Table 12 reports a comparison between the findings of this paper and some literature results in terms of hydrogen efficiency.
In the study of [
68], a gasification process was modelled in Aspen Plus, using correlations derived from Battelle Columbus Laboratory operational data and integrated with PSA technology for syngas upgrading. Conversely, the work of [
69] implemented biomass gasification within a downdraft reactor using oxygen-enriched air and steam; following gas cleaning, the syngas is fed into a PSA unit for H
2 production. Finally, study [
70] employs Synthesis Energy Systems (SES) technology, which is capable of pressurized operation and handling feedstocks with high moisture and ash content. This study evaluates three scenarios of hydrogen production integrated with carbon capture: cases A and B differ in the thermal energy supplied to the steam reformer, while case C is developed without carbon capture, with heat provided externally. Across these scenarios, the removal efficiency significantly affects the performance: a 75% efficiency yields a 51.3% H
2 recovery, whereas increasing the efficiency to 95% raises the productivity to 65%, underscoring the criticality of this parameter. Furthermore, in case B, a portion of the internally produced hydrogen is used as fuel for the steam reformer, leading to a further efficiency reduction to 49.6%. This trend is also pronounced in the other works; the first study yields 55.5 MJ/kg, based on the HHV, which decreases when the latent heat of vaporization is neglected, and in the second work, where a 95% removal efficiency results in overall efficiencies of up to 63%. So, the differences across this study can be attributed both to the PSA removal efficiency and to the scaling effects that influence the overall efficiency.
3.3. Economic Results
In this section, the economic results are presented and discussed.
Figure 9 reports the boundaries defined for the techno-economic analysis, and
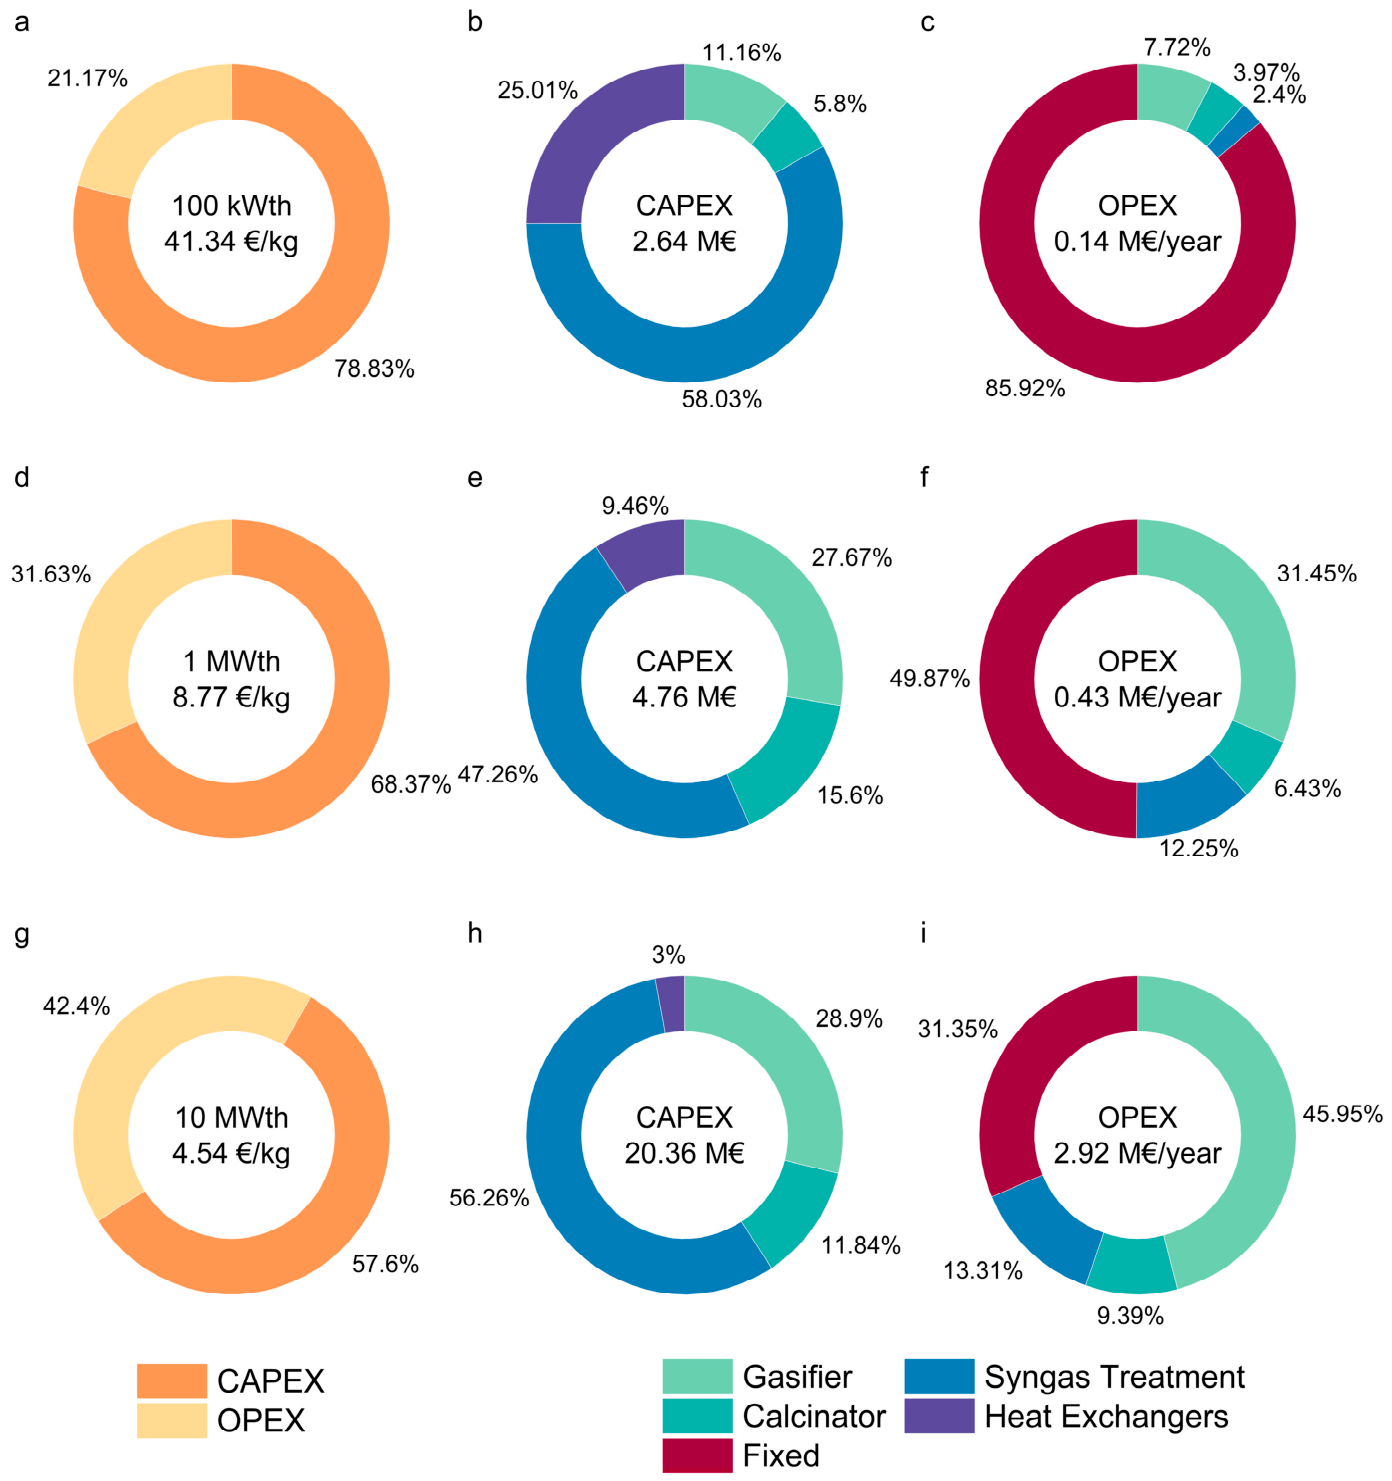
Figure 10 reports the indicators and their breakdown into the main plant sections.
The CAPEX exhibits a power-law dependence on plant capacity
(
), consistent with the well-established economies of scale in process plant construction. Between the demonstrative and industrial configurations (4.8 and 20 M€, respectively), a scaling exponent of
n ≈ 0.6 is obtained, which aligns with values typically reported for chemical process industries [
51,
71]. A significantly lower exponent of
n ≈ 0.3 is observed between the experimental (2.6 M€) and demonstrative capacities, reflecting the disproportionately high specific equipment costs of very small-scale components. Among the CAPEX contributions, the syngas treatment section consistently represents the largest share, ranging from 47% to 58% of CAPEX across all plant sizes. While the elevated share at the experimental scale was due to the very high cost of small-scale compressors (≈1 kWth), at the demonstrative and the industrial scales it is driven by the PSA unit, reflecting the greater amount of hydrogen to be treated compared to the 100 kWth capacity. For similar reasons related to the absence of standardized equipment at small size, the heat exchangers contribution decrease from 25% to 2% of CAPEX across the scale-up from 100 kWth to 10 MWth. The OPEX amounts to 0.14, 0.43 and 3.0 M€/y for the 100 kWth, 1 MWth and 10 MWth plants, respectively. Within the OPEX, the fixed component decreased progressively from 85% to 31% of CAPEX for the smallest and the largest scale, respectively, consistent with the reduction in specific capital expenditure, as it was estimated as a fixed percentage of the CAPEX (see
Table 5). Among the variable contributions, the gasifier represented the most significant one, which increased with the plant size, predominantly driven by biomass feedstock consumption. The syngas treatment represented the second most relevant variable cost, increasing with plant size as a result of the greater hydrogen production and the consequent costs associated with PSA operation. The syngas treatment followed as the third largest cost, growing from 2.4% to 13% of OPEX from the 100 kWth to 10 MWth scales, as a result of greater hydrogen production and the consequent costs associated with PSA operation. Finally, the LCOH reflected the trends observed for both CAPEX and OPEX across the investigated scales. At the industrial scale, an LCOH of 4.54 €/kg
H2 was achieved, proving competitive against low-carbon hydrogen production technologies. The demonstrative scale yielded an LCOH of 8.77 €/kg
H2, slightly exceeding the benchmark market prices. At the experimental scale, the LCOH reached 41.3 €/kg
H2, substantially penalized by the high specific CAPEX inherent to very small-scale components, resulting in values far beyond economic feasibility.
Potential valorization of the captured CO
2 stream through compression and subsequent sale was evaluated at the industrial capacity. To this end, the CO
2 compression cost was incorporated into both the CAPEX and the OPEX of the calcination section (see
Figure 11), accounting for equipment procurement and installation costs and the associated electricity consumption, respectively. CO
2 compression from 1.00 to 81.0 bar required approximately 300 kW, resulting in a 49% increase in LCOH, reaching 6.77 €/kg
H2. This value exceeds the cost range reported for SMR with CCS technology, owing to the smaller size of the compressors compared to those typically employed in large industrial facilities, resulting in elevated specific capital costs. The obtained LCOH value at industrial scale of 6.8 €/kg
H2, including CO
2 compression cots, places hydrogen production from the SEG + PSA system within the range reported for conventional biomass gasification processes (3–14 €/kg
H2) and comparable to green hydrogen production pathways based on renewable-powered electrolysis, typically ranging between 6 and 13 €/kg
H2. However, the obtained value remains higher than those generally reported for SMR (0.9–3.7 €/kg
H2) and SMR coupled with CO
2 capture (1.7–5 €/kg
H2) [
17], mainly due to the higher capital costs and process complexity associated with biomass handling, gasification, and integrated CO
2 capture systems. Nevertheless, the proposed configuration offers the advantage of combining renewable feedstocks with integrated carbon capture and storage, contributing to low-carbon hydrogen production with reduced fossil fuel dependence.
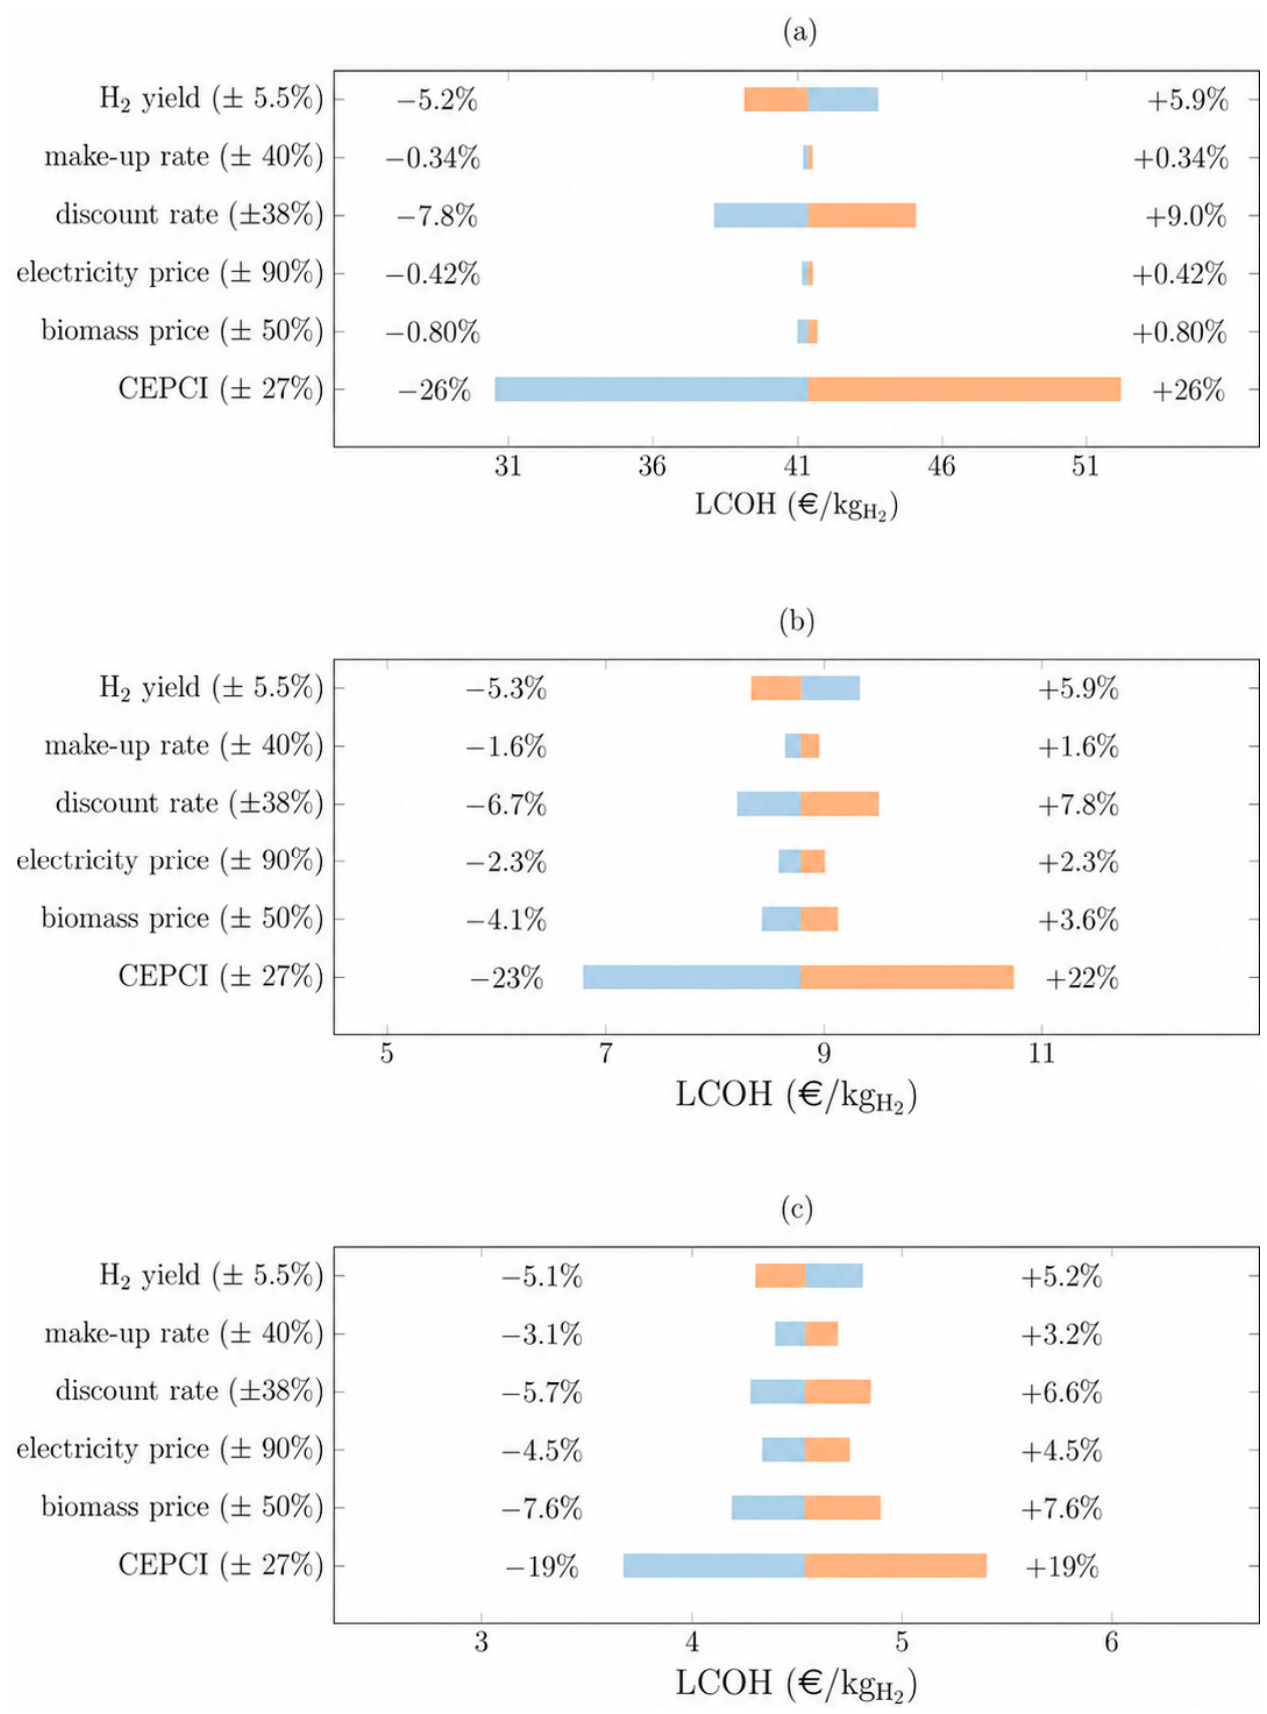
The economic performance is inherently subject to market and policy uncertainties. To unravel their influence on the competitiveness of the proposed technology, a sensitivity analysis was performed, evaluating the impact on the LCOH of the most volatile parameters: CEPCI, biomass price, electricity cost, discount rate, sorbent makeup rate, and H
2 recovery. Each parameter was varied independently around its reference value, assuming no significant correlations among them. The lower and upper bounds were set to the same relative variation in both directions around the reference value, based on literature, ensuring a fair comparison between the impact of an increase and a decrease of each parameter on the LCOH. Specifically, the CEPCI was varied between 580 and 1020, where the minimum reflects the actual variation observed between 2020 and 2025 [
72] and assuming a symmetric future variation of the same magnitude. The biomass price spanned between 30 and 90 €/t, consistent with the range reported in the literature for biomass feedstocks suitable for gasification [
73]. The electricity cost range was selected based on the minimum and maximum prices registered in Europe between 2020 and 2025, excluding the out-of-range peak of 2022 when prices exceeded up to five times the decade average [
74]; the lower bound of 10 €/MWh reflected prices recorded in Spain, Sweden and Finland, while the upper bound of 190 €/MWh referred to prices observed in Italy, Romania and Austria. The discount rate variation was set between 5 and 11% [
75], and the sorbent makeup rate between 3 and 7%, in line with values reported for calcium looping processes [
76]. Finally, the H
2 yield ranged between 85 and 95%, based on H
2 recovery values from PSA technology reported in the literature (see
Table 2). The results are presented in
Figure 11 in the form of a tornado chart. Notably, the y-axis reports the examined parameters along with their respective variation ranges, while the x-axis shows their influence on the LCOH with the resulting percentage variation labelled on each bar. Among the examined parameters, H
2 yield demonstrates the strongest influence on economic performance, with a nearly proportional but opposite effect on the LCOH: a decrease in H
2 recovery penalizes the LCOH slightly more (i.e., +6%) than the same increase benefits it (i.e., −5%). The second most influential parameter is the CEPCI, positively correlated with the LCOH, with an impact that decreases with increasing plant size, ranging from ±26% at the experimental scale to ±19% at the industrial scale, reflecting the economies of scale. The discount rate similarly shows a positive correlation with the LCOH, with an impact ranging from ±6% to ±9%, decreasing with increasing plant capacity. Conversely, the sorbent makeup rate, electricity price, and biomass price show a positive influence on the LCOH that increases with plant size, reflecting the higher feedstock and energy consumption at larger scales. Notably, their individual impact ranges from less than ±1% at the experimental scale to approximately ±8% at the industrial scale.




 ,
,