Article

High-Loaded Red Mud–Epoxy Resin Composites: The Effect of Particle Size and Mass Loading on Curing Behaviour and Environmental Safety


by
Sofia Faershtein
1,*,
Wayde N. Martens
2 and
Graeme J. Millar
1
1
School of Mechanical, Medical and Process Engineering, Faculty of Engineering, Queensland University of Technology (QUT), 2 George Street, Brisbane, QLD 4000, Australia
2
School of Chemistry and Physics, Faculty of Science, Queensland University of Technology (QUT), 2 George Street, Brisbane, QLD 4000, Australia
*
Author to whom correspondence should be addressed.
Clean Technol. 2026, 8(4), 114; https://doi.org/10.3390/cleantechnol8040114
Submission received: 12 May 2026 / Revised: 17 June 2026 / Accepted: 15 July 2026 / Published: 24 July 2026

Highlights

What are the main findings?
  • Environmentally safe polymer composites were produced with a high concentration of the mining waste (red mud) up to 60 wt.% and two particle sizes, <125 µm and <500 µm. Composites with a smaller particle size (<125 µm) and 40 wt.% of red mud demonstrated the best encapsulation with the polymer matrix.
  • A comparative study of the composite’s microstructure before and after leaching revealed how waste material mass loading and filler particle size affect the composite's structure and leaching behaviour.
What are the implication of the main findings?
  • The production of environmentally safe composites with high red mud content supports large-scale waste recycling and helps minimise waste stockpiles.
  • Successful encapsulation of potentially hazardous red mud in an epoxy matrix, together with improved structural properties of the fabricated materials, creates opportunities for the use of red mud–epoxy composites in construction, particularly at alumina production sites.

Abstract
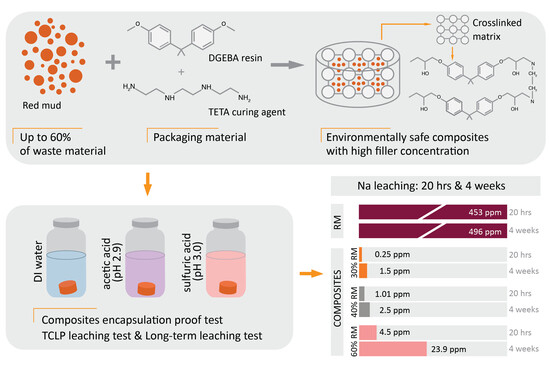
Red mud is a waste byproduct of alumina production. Its release into the environment poses risks, highlighting the need for strategies to limit pollution. Using red mud as a filler in polymer-matrix composites can reduce the leaching of heavy metals and metalloids. We fabricated composites with high red mud content (up to 60 wt.%) using two particle fractions (<125 μm and <500 μm). The study examined how filler concentration and particle size affected the composites’ microstructure and mechanical properties. Results showed that composites with smaller particles had better encapsulation and enhanced structural qualities, such as reduced porosity and fewer cracks. Among four filler mass loadings (20, 30, 40, and 60 wt.%), composites with 40 and 60 wt.% red mud exhibited greater epoxy penetration into agglomerates and partial deagglomeration, resulting in small, uniformly dispersed red mud particles within the matrix. Calorimetry analysis demonstrated that increasing the red mud concentration slows the curing process: for composites with 20 wt.% red mud, the curing time is approximately 10 h, whereas for composites with 60 wt.%, approximately 35 h. We performed a thorough environmental safety evaluation of high-loaded red mud–epoxy composites in accordance with the standard AS 4439.3:2019. The tests showed that epoxy resin significantly reduces the levels of potentially hazardous elements, such as Na and Al, in the leachates, demonstrating the safety of the composites. Composites with 40 wt.% red mud (particle size < 125 μm) showed the most effective epoxy impregnation into red mud agglomerates and demonstrated the best encapsulation behaviour, releasing the least amount of metals compared to red mud during both 20 h and 4-week, long-term leaching tests.

Graphical Abstract

1. Introduction

Alumina production plays a crucial role in driving economic growth and industrial development. However, 1 tonne of alumina produces 1–1.5 tonnes of waste [1,2,3]. Red mud (RM), or bauxite residue, is a primary waste product in alumina production. It is considered a waste material because of its high alkalinity (pH 9.5–13), originating from the Bayer process, and its heavy metal content [4,5]. Due to these properties, RM is challenging to utilise effectively, and the waste is stored in land-based impoundments, consuming substantial amounts of land [6]. The construction and maintenance of these facilities demand significant financial resources, pose risks of environmental pollution and contribute to rising carbon emissions and ecosystem disruption [7].
Current utilisation processes can generally be grouped into four directions: recovery of valuable components, functional materials, building materials, and soil formation technologies [8,9]. However, chemical recovery of valuable elements, such as Al, Fe and Ti [10], is expensive due to acid consumption, the complex composition of RM and secondary waste formation [5]. Specific functional materials, for example, radiation shielding materials, with the addition of RM [11,12], have a limited market and may not be cost-effective to use. Extensive research has been conducted to develop geopolymers with RM that can replace traditional construction materials, such as cement, asphalt, and bricks [13,14]. Wu et al. [15] studied the encapsulation of RM with ultra-high-performance concrete as a potential aggregate material with 15 times higher mechanical properties.
Despite numerous efforts, the global utilisation rate of RM remains low, below 15% [5]. Current technologies are ineffective at detoxifying RM [5,16], thereby increasing the risk of alkali release and migration of metal ions into groundwater and soil [3,17]. One of the most promising ways to utilise the full potential of iron- and aluminium-rich RM is to use it as a filler material in construction composites [3,18,19]. For instance, pipe and waste storage dam wall coating materials, or waste pipelines, can be employed within the alumina production site, thereby avoiding the transfer of waste off-site.
Epoxy resin is a thermosetting polymer with excellent adhesive properties and high resistance to chemicals and moisture [20,21]. After curing, a dense epoxy resin network restricts water penetration and prevents the leakage of potentially toxic elements into the environment [22]. Solidification/stabilisation of mining waste using epoxy resin has been considered as a potential approach for tailings treatment due to the high mechanical strength of the resulting solidified materials [23]. Producing epoxy resin–red mud (ER-RM) composites with a high concentration of RM can contribute to the large-scale utilisation of RM, which is currently stockpiled on land.
The effect of RM on the mechanical and chemical properties of polyester-epoxy-bamboo fibre composites has been investigated by Panda and Bahera [24]. Improvements were observed across all mechanical, ageing, and chemical resistance properties with the addition of 10 wt.% of RM. Reis [25] studied the fractural and flexural properties of epoxy polymer mortars with the addition of sand and RM, finding significant improvements in post-peak flexural properties in samples with up to 30 wt.% RM. Ozmeral et al. [26] also found a positive effect on flame resistance properties using RM waste; 30 wt.% RM composites were identified as the most suitable ratio in the hybrid filler. To improve the interfacial properties of RM-based epoxy resin composites, an investigation of the effect of acid surface treatment with H3PO4 was conducted by Park et al. [27], and it was observed that the mechanical interfacial properties of composites were enhanced due to improved interfacial adhesion between the filler and matrix. Anil et al. [28] used three different industry by-products, fly ash, RM, and aluminium powder, to produce one-filler and hybrid composites, thereby reducing the consumption of traditional materials. The component ratio for epoxy/fly ash/RM/aluminium powder was 91/6/1.5/1.5 wt.%. This composition has been shown to have the highest ultimate tensile modulus, flexural strength and hardness among all composites in this study. Another comparative study of polymer composites was conducted by Duarte et al. [29] using epoxy resin, unsaturated polyester and RM, at concentrations ranging from 5 to 25 wt.%. In this instance, RM content showed a significant increase in thermal conductivity for both polymer matrices.
The recent review article on RM-polymer composites [4] suggests that although significant progress is being made, there is a lack of evaluations of the environmental performance of RM-resin composites. However, this is a crucial consideration for future material applications, as RM can be harmful to the environment. Improper waste storage management has caused significant land, water, and air pollution, leading to hazardous incidents reported in multiple countries over the past two decades, including Hungary, China, Canada, and Australia [30]. Therefore, it is essential to analyse the potential environmental impact of composite materials with high RM concentration.
Additionally, most studies on epoxy resin have focused on the fabrication and characterisation of composites containing RM at concentrations ranging from 2 to 30 wt.%, with relatively fewer studies exploring the fabrication of composites at concentrations up to 50 wt.% [31,32]. The production of high-load RM composites is more efficient for large-scale RM recycling. However, increasing RM concentrations can lead to the uncontrolled release of metal ions from the epoxy matrix into the environment, underscoring the need for an environmental assessment of composites with high RM concentrations.
Our work aims to evaluate epoxy encapsulation as a strategy to limit the leaching of potentially toxic elements from RM, while examining how RM mass fractions (up to 60 wt.%), particle sizes (<125 μm and <500 μm), and composite microstructure influence encapsulation efficiency. To address this, environmental safety tests in accordance with Australian Standard 4439.3:2019 [33] (similar to the Environmental Protection Agency Toxicity Characteristic Leaching Procedure, EPA TCLP) and a long-term leaching test have been conducted to evaluate the environmental performance of the highly concentrated ER-RM composites. A comparative study of the composite’s microstructure before and after leaching was conducted to analyse the influence of waste material mass loading and filler particle size on the final properties and leaching behaviour.

2. Materials and Methods

2.1. Materials

The RM used in this study was obtained from the Australian aluminium company (name suppressed for commercial confidentiality). Upon receipt, the RM was crushed and sieved. Part of the material was oven-dried at T = 105 °C for 24 h for analysis, while a second fraction was reserved for composite preparation.
This study used epoxy resin as the polymer matrix for composite production. It is a two-component polymer based on DGEBA (Diglycidyl Ether of Bisphenol A) epoxy resin (EpoFix®, Struers, Copenhagen, Denmark) and the curing agent TETA (triethylenetetramine) (Epofix® Hardener, Struers, Copenhagen, Denmark). Selected resin properties, according to the manufacturer’s technical data, are presented in Table S1 of the SI.

2.2. Raw RM Characterisation

A laser diffraction particle size analyser (Mastersizer 3000, Malvern Instruments Ltd., Malvern, UK) was used to determine the particle size distribution of RM. In this experiment, water was used as a dispersing agent. The refractive index for RM is 2.6. The instrument software (version 3.88) then calculates particle size based on the scattering pattern.
Chemical analysis of RM was performed using X-ray fluorescence (XRF) to determine the concentrations of major elements. XRF analysis was conducted using a Bruker S8 Tiger Series II Wavelength Dispersive X-ray Fluorescence (WD-XRF) unit (Bruker, Berlin, Germany). Fused glass discs were prepared using the Katanax X-600 fluxer (Katanax, Quebec, QC, Canada). The sample (~0.74 g) was mixed with approximately 5–7 g of XRF flux (50:50 with LiI) in platinum crucibles and heated to 1050 °C for 30 min.
The Laser Ablation Inductively Coupled Plasma Mass Spectrometry (LA-ICP-MS) technique was used to analyse trace elements in RM using an Agilent 8900 LA-ICP-MS instrument (Agilent Technologies, Santa Clara, CA, USA) with XRF glass discs.
Thermogravimetric (TG) analysis was performed on a NETZSCH STA 449F3 Jupiter Simultaneous Thermal Analyser (Netzsch-Gerätebau GmbH, Selb, Germany) under an “instrument air” atmosphere (N2:O2 ratio—80%:20%). For the TG experiment, approximately 20 mg of undried RM sample was heated in an Al2O3 crucible without a lid, with a temperature profile from 30 to 1100 °C at a heating rate of 5 °C/min.
The pH of RM (as-received) was measured according to the standard AS 4439.3:2019 “Wastes, sediments and contaminated soils, Part 3: Preparation of leachates—Bottle leaching procedure” with a 1:20 sample/solution ratio (30 g of RM to 600 mL of the solution, 1000 mL bottle size). Samples were agitated on the overhead rotation wheel at 50 rpm for 20 h prior to pH measurement.

2.3. Composites Curing Examination

The effect of RM on the curing behaviour of epoxy resin was studied using Differential Scanning Calorimetry (DSC) on a DSC 204 F1 Phoenix instrument (Netzsch-Gerätebau GmbH, Selb, Germany). The experiment was conducted in a nitrogen atmosphere, using sealed aluminium pierced-lid crucibles with an approximate sample mass of 4–8 mg. Multiple ramp cure measurements were performed over the temperature range of −30 °C to 200 °C at heating rates of 20 °C/min, 10 °C/min, and 5 °C/min. A second heating to 200 °C was used to confirm the complete curing of the samples’ polymer matrix. The measurements were performed on four unreacted sample types: epoxy resin, epoxy resin with 20 wt.% RM, epoxy resin with 40 wt.% RM, and epoxy resin with 60 wt.% RM. Kinetics Neo Software (version 3.0.1) (Netzsch-Gerätebau GmbH, Selb, Germany) was used for kinetic evaluation.

2.4. Composites Fabrication

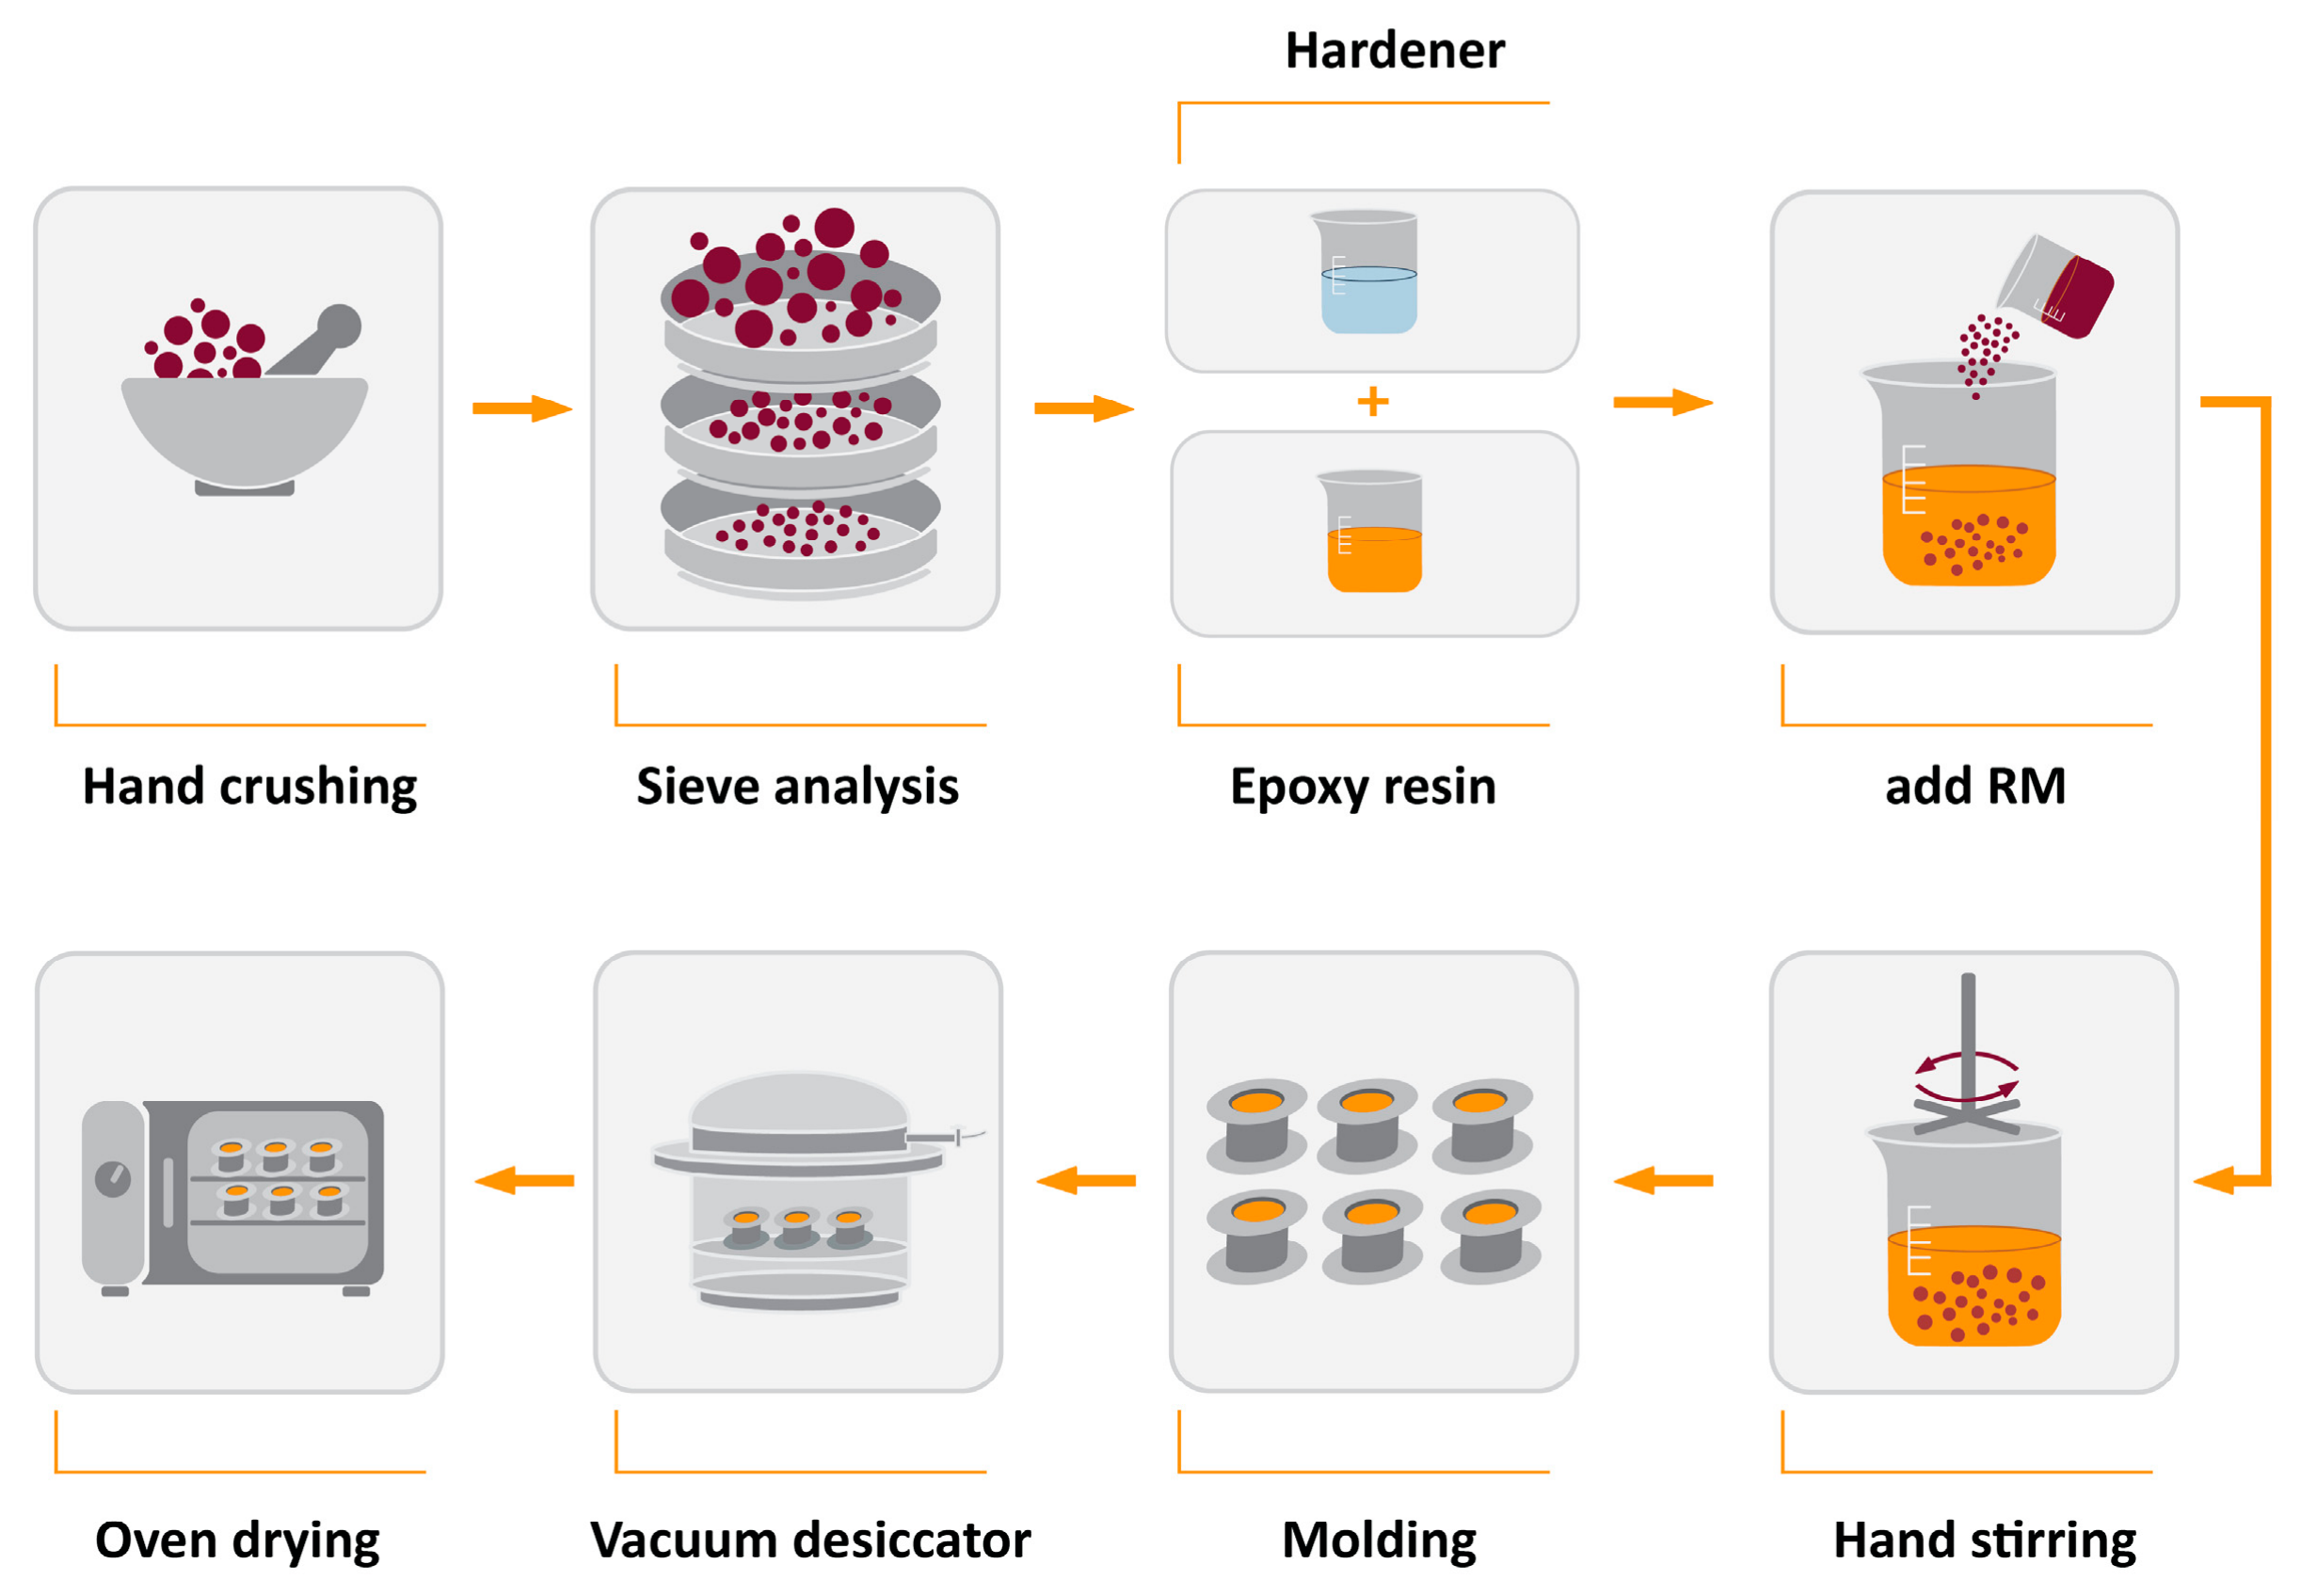
Figure 1 presents a schematic illustration of the composite fabrication process. Epoxy resin was prepared by mixing 25 parts of resin with 3 parts of hardener by weight, then manually stirring for 2 min. Then, it was combined with RM and hand-stirred with a spatula for approximately 2–3 min until visually homogeneous. The mixture was poured into the cylindrical moulds (FixiForm, 25 mm diameter, Struers, Copenhagen, Denmark); the mould geometry is shown in Figure S1 of the SI. The resulting mixture was degassed in a vacuum desiccator for 1 h to remove the trapped air bubbles. Curing was performed in an oven at 50 °C for 48 h. Finally, composites were removed from the moulds and stored in a dry plastic container.
Table 1 presents the composite mix design proportions. Four mass percentages of RM were selected to determine the maximum amount of RM that can be safely encapsulated in a polymer matrix. The composite mixture weighed 50 g, producing five composites with an average mass of 9.3 g.
Fabricated composites also varied with the particle size of the RM obtained after sieving. Two particle sizes (<125 μm and <500 μm) were used in composite fabrication to determine whether this parameter influences the encapsulation properties of the composites.

2.5. Composites Microhardness and Porosity Measurement

Hardness measurement was performed using a Struers Duramin-40 AC3 hardness tester (Struers, Copenhagen, Denmark). The Vickers hardness test (HV) employed a diamond indenter in the form of a right pyramid under a force of 0.1 N. Two diagonal indentations left on the sample’s flat surface after the load is removed are automatically measured by the machine, and hardness is calculated using the Struers machine software (version 3.24.2.0). From 12 to 16 indentations were performed for each sample, and the mean hardness is presented for each sample. The experimental error was calculated as the standard deviation (SD).
The true solid density of the composites and raw materials was measured with an Ultrapyc 5000 He pycnometer (Anton Paar, Graz, Austria). Porosity was calculated from the experimentally measured true solid densities of neat epoxy resin, RM, and composites. The porosity of the fabricated composites was calculated using Equation (1) [34]:
P =   ρ c t ρ c e ρ c t × 100 % ,
where ρ c t —theoretical density, and ρ c e —experimentally obtained true solid density of composites.
The theoretical density of composite materials in terms of weight fraction can be obtained using Equation (2) [35]:
ρ c t = 1 ( X e ρ e + X R M ρ R M ) ,
where X e and X R M are the weight fractions of the epoxy resin and RM, ρ e and ρ R M are experimentally measured densities of resin and RM.

2.6. Composites Leaching Test

The leaching test assessed the environmental safety of composites in accordance with Australian Standard AS 4439.3:2019, “Wastes, sediments and contaminated soils, Part 3: Preparation of leachates—Bottle leaching procedure.” [33]. This standard is based on the EPA TCLP procedure. Additionally, the long-term leaching experiment was conducted for 4 weeks. Leaching tests were conducted using deionised (DI) water, a glacial acetic acid solution (pH 2.9, as per AS 4439.3:2019), and additionally with a sulphuric acid solution (pH 3.0) to simulate aggressive acidic conditions. Leaching tests were conducted for RM, epoxy resin, and prepared ER-RM composites. Tests were conducted in 250 mL bottles. The mass of composite samples used for the leaching test is presented in Table S2 of the Supplementary Information (SI). Samples were added to 185 mL of leachate solution, yielding a sample-to-solution ratio of 1:20. The positions of the samples in the bottle are shown in Figure S2 of the SI. Samples were shaken in an Innova® 40/42 Shaker (Eppendorf, Hamburg, Germany) at 150 rpm. Sampling was performed after 20 h, on the 2nd and 4th days, and at 1, 2, 3, and 4 weeks of leaching. Solutions’ pH was verified using the LAQUAtwin-pH-11 pH meter (HORIBA, Kyoto, Japan). The pH measurements were taken in the 1st week: after 20 h, on the 2nd and 4th days, and at 1 week. The pH measurement results are presented in Tables S3–S5 in SI.
The leachate composition was analysed by Inductively Coupled Plasma Optical Emission Spectroscopy (ICP-OES) with the iCAP-pro X Duo instrument (Thermo Fisher Scientific, Waltham, MA, USA). Samples were diluted in 2% nitric acid (1:10 dilution factor), using a Mircolab 600 diluter (Hamilton, Reno, NV, USA). Wavelengths were optimised for the target elements using calibration standards, and internal standards were used to correct for signal drift and improve measurement accuracy. ICP-OES concentration results were compared with the maximum allowed concentrations according to the EPA TCLP hazardous waste limits, Australian Water Quality Guidelines for Fresh and Marine Waters [36] and World Health Organisation’s (WHO) Guidelines for Drinking-Water Quality [37].

2.7. SEM Analysis

For cross-sectional scanning electron microscopy (SEM) analysis, the samples were sectioned, mounted in epoxy resin, and ground to expose the surface. The exposed surfaces were then polished in three steps using water-free diamond suspensions (abrasive sizes: 3 μm, 1 μm and 1/4 μm). Prior to SEM imaging, all samples were coated with 10 nm of carbon using a Safematic CCU-010 HV High Vacuum coater (Safematic, Zizers, Switzerland) to minimise charging. The morphologies of raw RM and ER-RM composite were examined using a Phenom XL G2 desktop scanning electron microscope (Thermo Fisher Scientific, Waltham, MA, USA) at an accelerating voltage of 15 kV with a mixed detector mode 70% backscattered electron detector (BSD) and 30% secondary electron detector (SED) signals.

3. Results and Discussion

3.1. Raw RM Characterisation

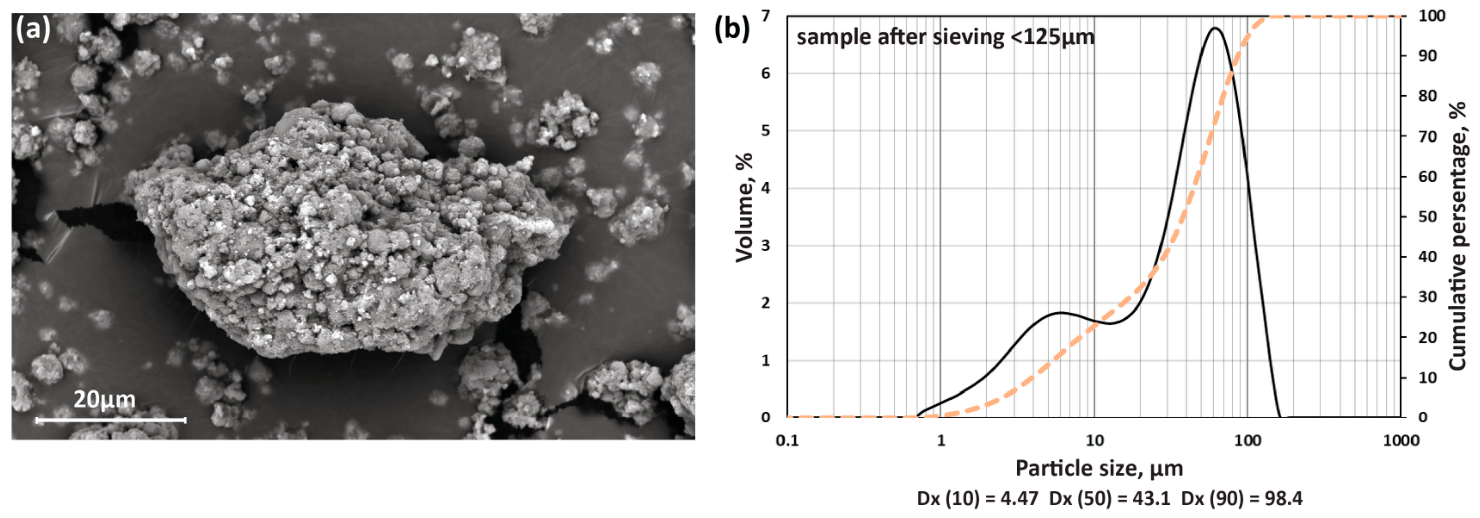
Particle size analysis was performed on three sieved RM samples: <500 μm, <250 μm, and <125 μm. The results are presented in Figures S2 and S3 in SI. As expected, the different fractions of RM represent different particle size distributions, with the mean particle size decreasing from 162 μm (for RM sieved through <500 μm) to 43 μm (for RM sieved through <125 μm).
In good agreement with the particle size analysis, SEM characterisation revealed irregularly shaped RM agglomerates ranging from 20 to 100 μm (sample sieved through <125 μm). Most agglomerates are composed of spherical particles ranging from 0.5 to 5 μm. A characteristic SEM image is presented in Figure 2a.
The pH of the RM (as received) was 10.3, consistent with the literature [38,39] and confirming its high alkalinity and potential environmental risk.
The TG curve for RM is presented in the SI (Figure S4). The combined mass loss from 30 to 1100 °C is 11.33%. Between 30 and 100 °C, a small mass loss of 1.29% is observed, indicating the evaporation of adsorbed water and confirming the low water content of the as-received RM samples, consistent with the TG data reported in the literature [40].
Table 2 presents the results of the RM chemical composition measured by WD-XRF. The main components are Fe2O3, Al2O3, SiO2, Na2O, TiO2, and CaO.
LA-ICP-MS measurement of trace element concentrations (Table 3) confirms the presence of heavy metals and toxic elements, including As, Ni, and Pb. These results highlight the necessity of encapsulating the RM and performing additional tests to evaluate the material’s environmental safety.

3.2. Composites Curing Examination

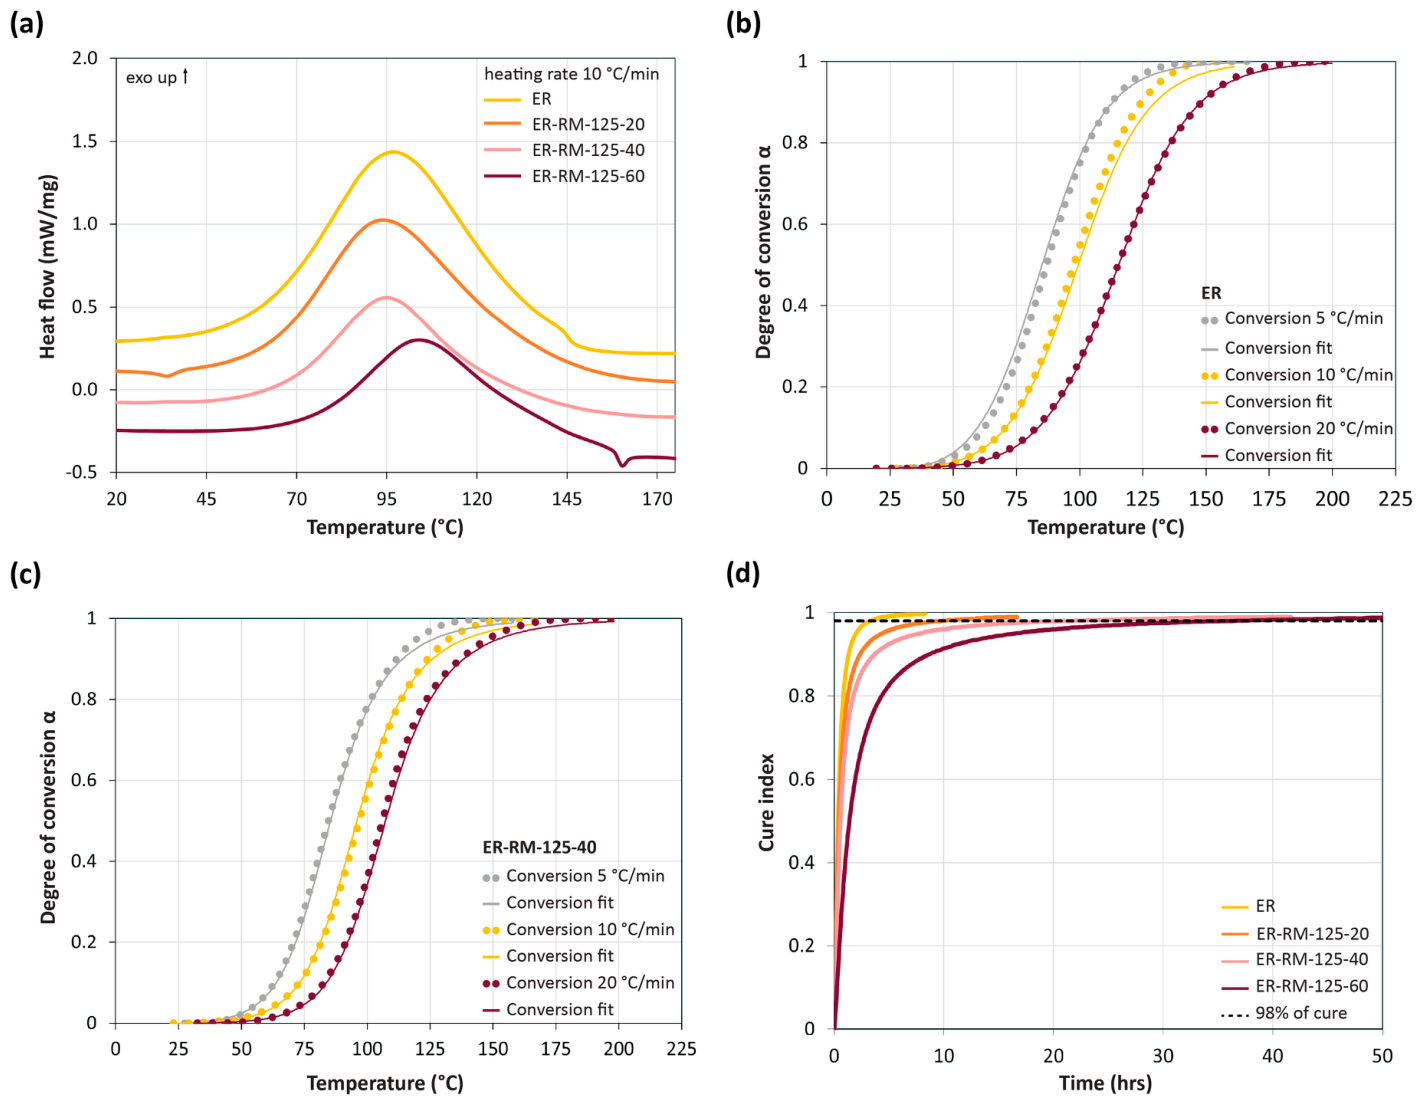
Figure 3a shows DSC curves for epoxy resin and composites with RM concentrations of 20, 40, and 60 wt.%. The DSC curves for all samples showed a single peak, indicating that a cross-linking reaction (curing) occurred in the epoxy matrix.
The absence of other peaks indicates that no significant thermally detectable reaction occurred between RM and the epoxy matrix. The peak area, corresponding to the curing reaction, decreases with increasing RM content. A temperature shift in the curing peak is also observed, from approximately 95 °C to 105 °C. This can be explained by the decrease in the epoxy resin fraction of the total composite mass and by the difference in the heat capacities of the epoxy resin and RM filler, resulting in different composite heat capacities at each concentration.
DSC data were used to evaluate kinetics and to calculate isothermal curing predictions using Kinetics Neo software. Model-based methods can predict curing mechanisms by fitting DSC experimental data to specific reaction models. For this research, the Kamal–Sourour reaction model was used, a common model for analysing the kinetics of epoxy resins [41,42,43]. Figure 3b,c shows experimental and fitted curves for the degree of conversion or degree of curing, which ranges from 0 (completely uncured) to 1 (completely cured), plotted against temperature for heating rates of 5 °C/min, 10 °C/min and 20 °C/min for epoxy resin with 40 wt.% of RM. Results for 20 and 60 wt.% are presented in the SI (Figure S5). After fitting the experimental curves, the curing prediction data were obtained from the fitted Kamal–Sourour model using Kinetics Neo software (Figure 3d). As seen from the plot, 98% of curing is achieved after approximately 3.5 h for the pure epoxy resin, about 10 h for composites with 20 wt.% of RM (ER-RM-125-20), approximately 20 h for composites with 40 wt.% of RM (ER-RM-125-40), and about 35 h for composites with 60 wt.% of RM (ER-RM-125-60). This indicates that the curing process is slower for composites with high RM concentrations. This can be explained by RM particles increasing the viscosity of the composite mixture as filler content increases, thereby reducing the mobility of resin and hardener and, consequently, lowering cross-linking reaction rates [44]. Based on this, the curing time for all composites was set to 48 h, which should be sufficient for full curing, considering the significantly larger mass of the composites (9.3 g) compared to the DSC sample mass (4–8 mg).

3.3. Microstructure of Epoxy Resin-RM Composites

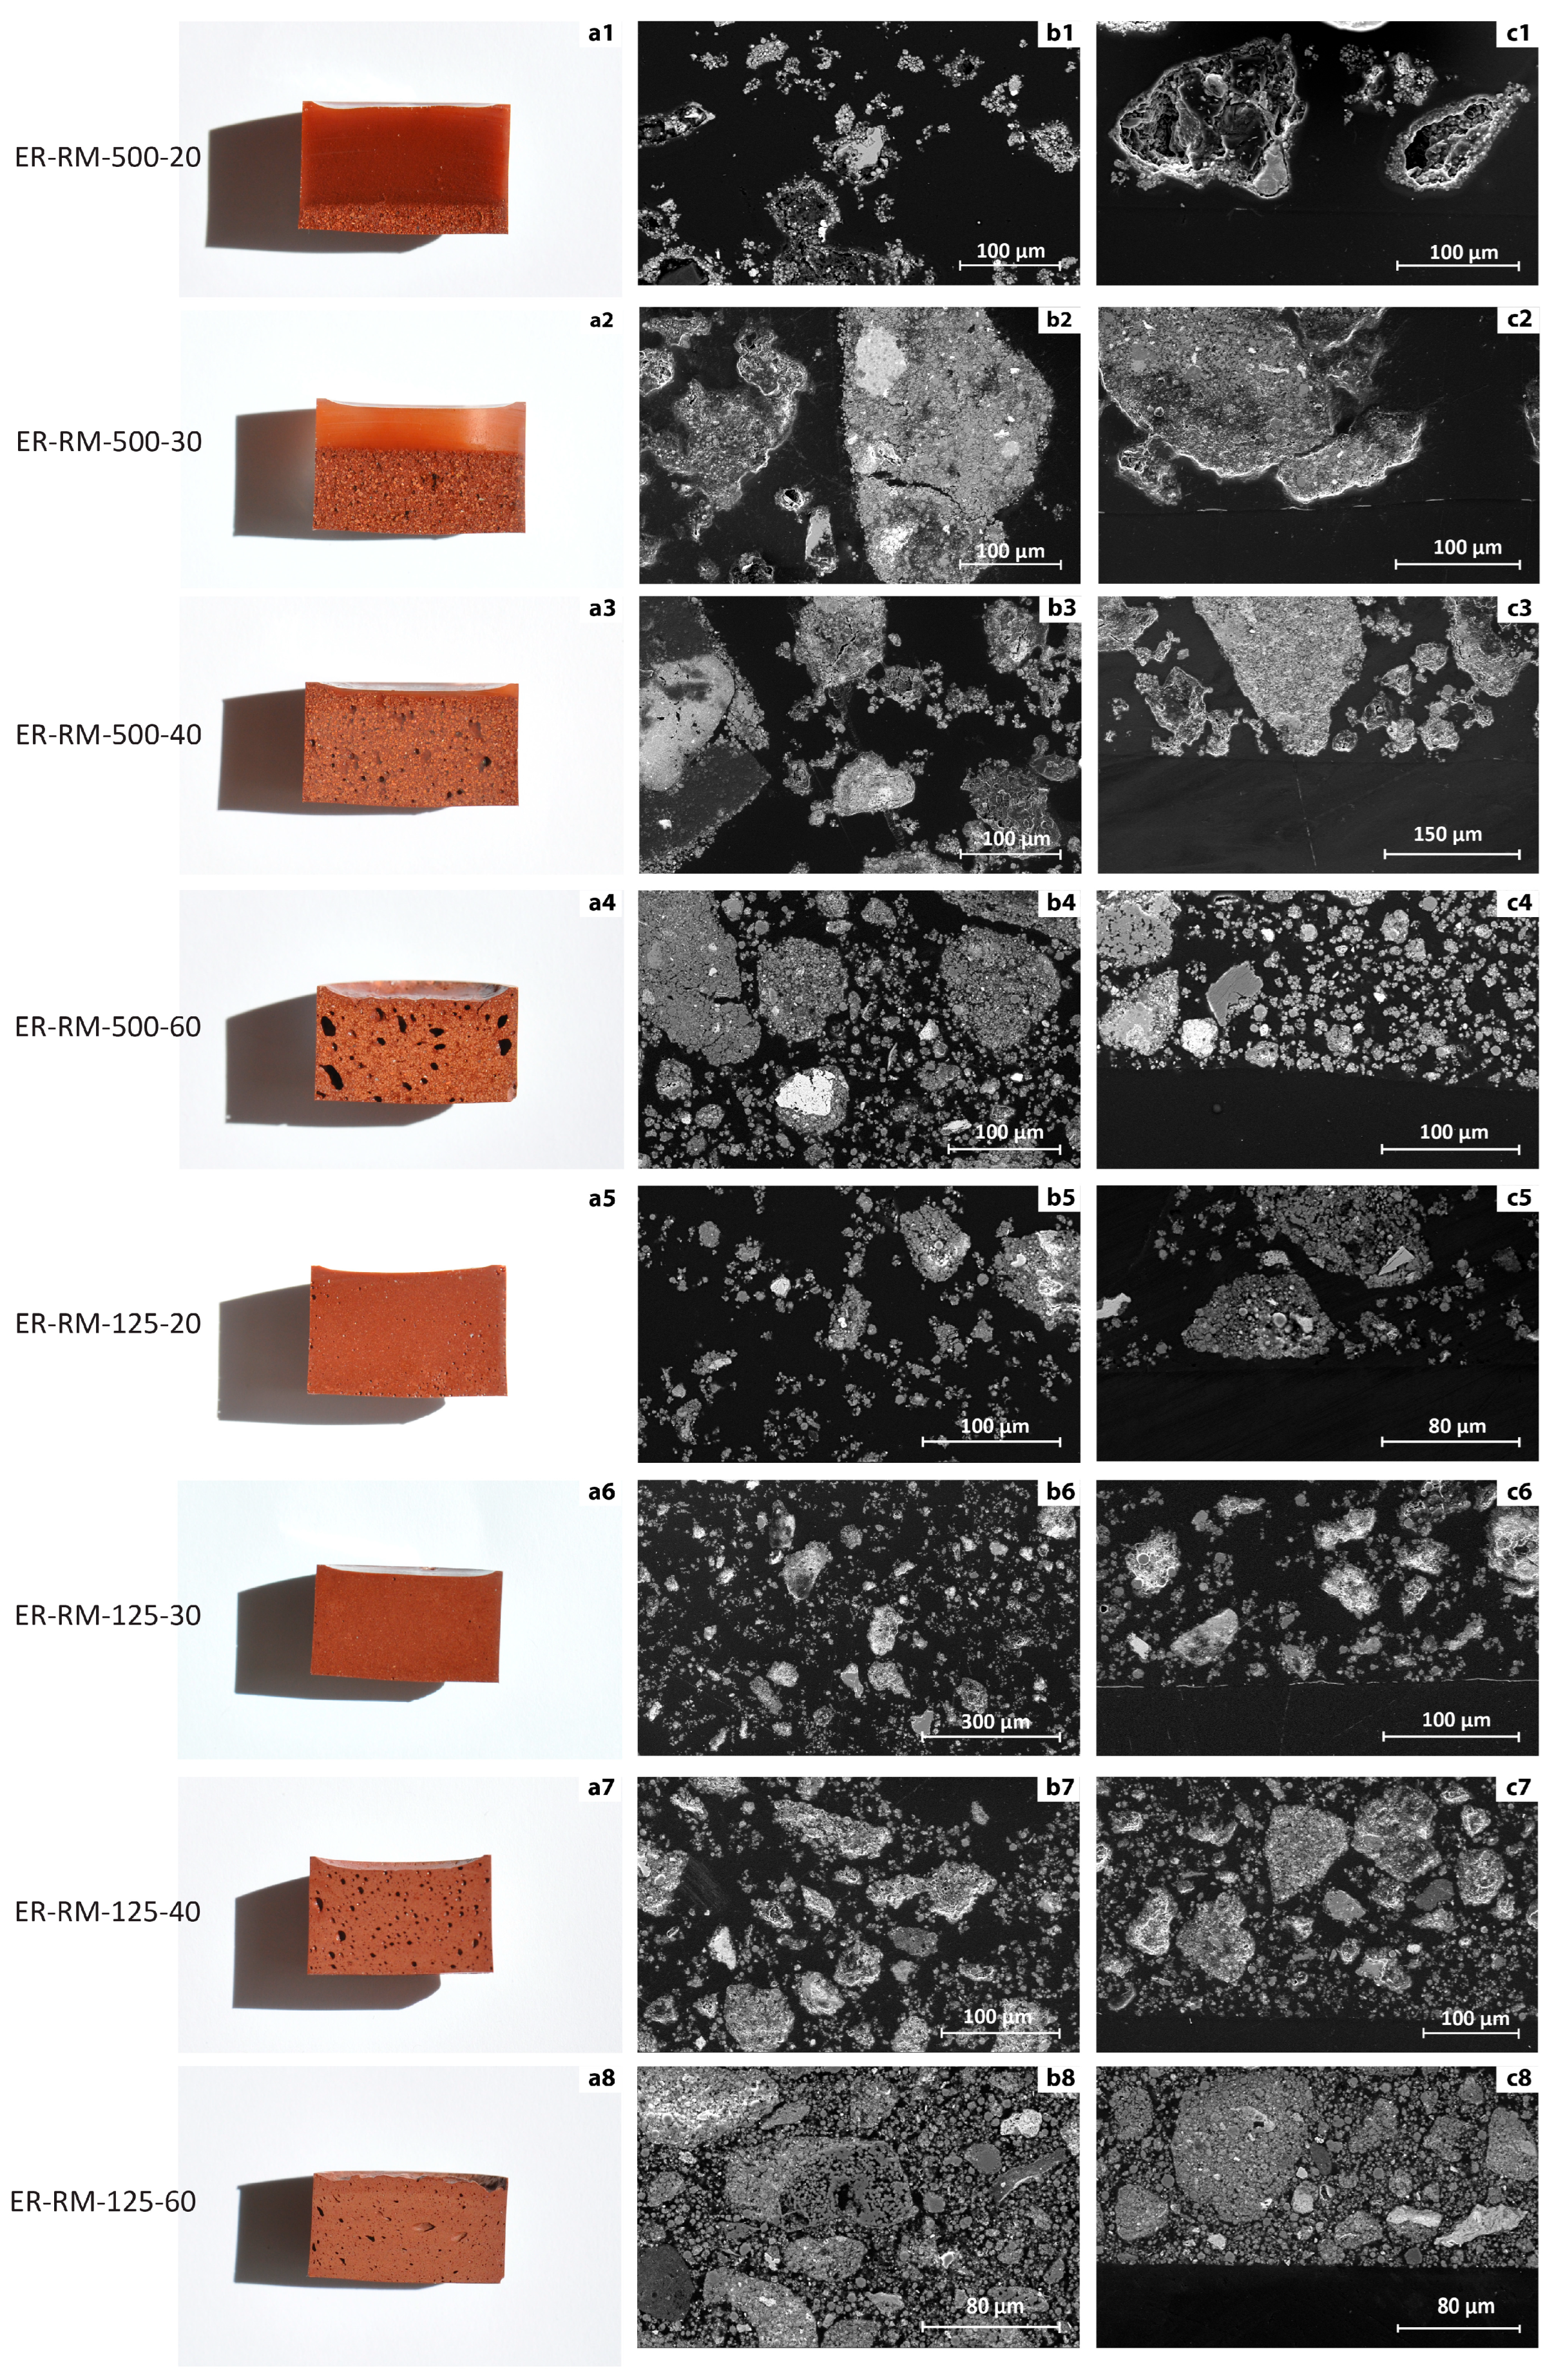
Figure 4 presents digital images and SEM results of the cross-section of the produced composites. SEM analysis focused on the composites’ structure and edges to determine the content of voids and pores. Significant phase separation was observed in the samples with particle sizes less than 500 μm and low RM mass loading, ER-RM-500-30 (Figure 4(a1)) and ER-RM-500-20 (Figure 4(a2)), which can be attributed to the faster sedimentation of larger particles under gravity. The reduced phase separation for higher RM mass loading can be attributed to the high viscosity of the ER-RM mixture. The pore amount increases with the RM mass loading; a high number of pores was observed in the ER-RM-500-60 sample (Figure 4(a4)).
SEM analysis of samples with particle sizes less than 125 μm has shown that RM agglomerates are uniformly distributed within the polymer matrix across all mass loadings: 20 wt.%, 30 wt.%, 40 wt.%, and 60 wt.% RM (Figure 4(b5–b8)). The thickness of the polymer layer between RM agglomerates decreases with increasing mass loading. Good epoxy penetration is observed inside agglomerates for samples with high RM concentrations, specifically ER-RM-125-40 (Figure 4(b7,c7)) and ER-RM-125-60 (Figure 4(b8,c8)). This indicates a significantly higher wettability of the RM by the polymer matrix. Similar to composites with large particle sizes, the pore amount in composites with small particle sizes increases with RM concentration. The highest pore amount was observed in composites ER-RM-125-40 (Figure 4(a7)).
Interestingly, many small individual particles (<10 μm) are observed in samples with 60 wt.% RM for both composites with particle sizes < 125 μm and <500 μm (Figure 4(b4,b8)). Increased wettability could be a reason for the deagglomeration phenomenon, as the filler breaks down into small, uniformly dispersed particles within the epoxy matrix. Due to epoxy’s lower penetration inside agglomerates, some cracks were observed in samples with 20 and 30 wt.% RM for composites with particle sizes < 500 μm (Figure 4(c1,c2)). The non-uniform distribution of agglomerate particles creates stress concentration, which can lead to crack formation, especially when the agglomerate is located near the edge. This makes it a potential area for void formation and the release of toxic elements.

3.4. Composites Porosity and Microhardness Measurement

The density of the composites increases with the increase in the RM mass loading, regardless of particle size. For composites with smaller particle sizes (<125 μm), the density is slightly higher than that of composites with larger particles. The calculated porosity results are presented in Table 4.
As the RM content increases, porosity also increases, a trend consistent with observations from cross-sectional images of the composites (Figure 4). Despite this increase, overall porosity remains relatively low, attributable to the vacuum degassing stage during composite fabrication and to the good wettability between the epoxy matrix and RM particles. The hardness results showed that the composites’ hardness increased with increasing RM concentration. With the addition of RM, the hardness increased from approximately 17 HV to 28 HV. Higher hardness values were observed for composites with smaller particles (<125 μm). For composites with particle sizes < 500 μm and RM contents of 20 and 30 wt.%, accurate hardness measurements are impossible due to significant phase separation.
The increase in hardness with higher mass loading aligns with SEM characterisation of the microstructure, which indicates a large number of individual microparticles (0.5–5 μm) of RM uniformly distributed in the polymer matrix (Figure 4(b4,b7,b8)). The increase in hardness may contribute to improved wear resistance in the composites.

3.5. Composites Leaching Test Results

Encapsulation-proof testing was performed on the produced composites and RM to assess their environmental performance after 20 h of TCLP leaching and over 4 weeks of long-term leaching.
Based on the ICP-OES results for the leachates, Al, Ca, K, Mg, Na, and Si can be extracted from the RM samples (Table 5). Heavy metals, such as Pb, As, Cr, and Ni, have not been detected in the leaching solutions, indicating that all heavy metal levels are below the TCLP hazardous limits.
However, other potentially harmful elements, Na and Al, were observed in the RM leachates. Excessive Na in irrigation water relative to Ca and Mg can adversely affect soil structure, reduce the rate at which water moves into and through the soil, and reduce soil aeration, all of which influence healthy plant growth [31]. Aluminium toxicity reduces crop productivity on acid soils due to increased soluble aluminium from the breakdown of oxides, clays, and silicates at low pH [31]. Also, aluminium exposure is suspected to increase the risk or speed up the onset of Alzheimer’s disease, according to the WHO guidelines for drinking water [32].
Thus, Na and Al were used as markers to confirm the RM’s encapsulation in the polymer composite matrix. However, the EPA TCLP does not have limits for Na and Al; therefore, the maximum allowed concentrations were used according to the Australian Water Quality Guidelines for Fresh and Marine Waters [31] and the World Health Organisation’s Guidelines for Drinking-Water Quality [32]. Table 6 presents maximum allowed concentrations for some elements according to the EPA’s TCLP toxicity limits, the Australian Water Quality Guidelines for Fresh and Marine Waters, and the WHO’s Guidelines for Drinking-Water Quality.
Figure 5, Figure 6 and Figure 7 present the leaching results for raw RM and composites in DI water, acetic acid and sulfuric acid solutions.
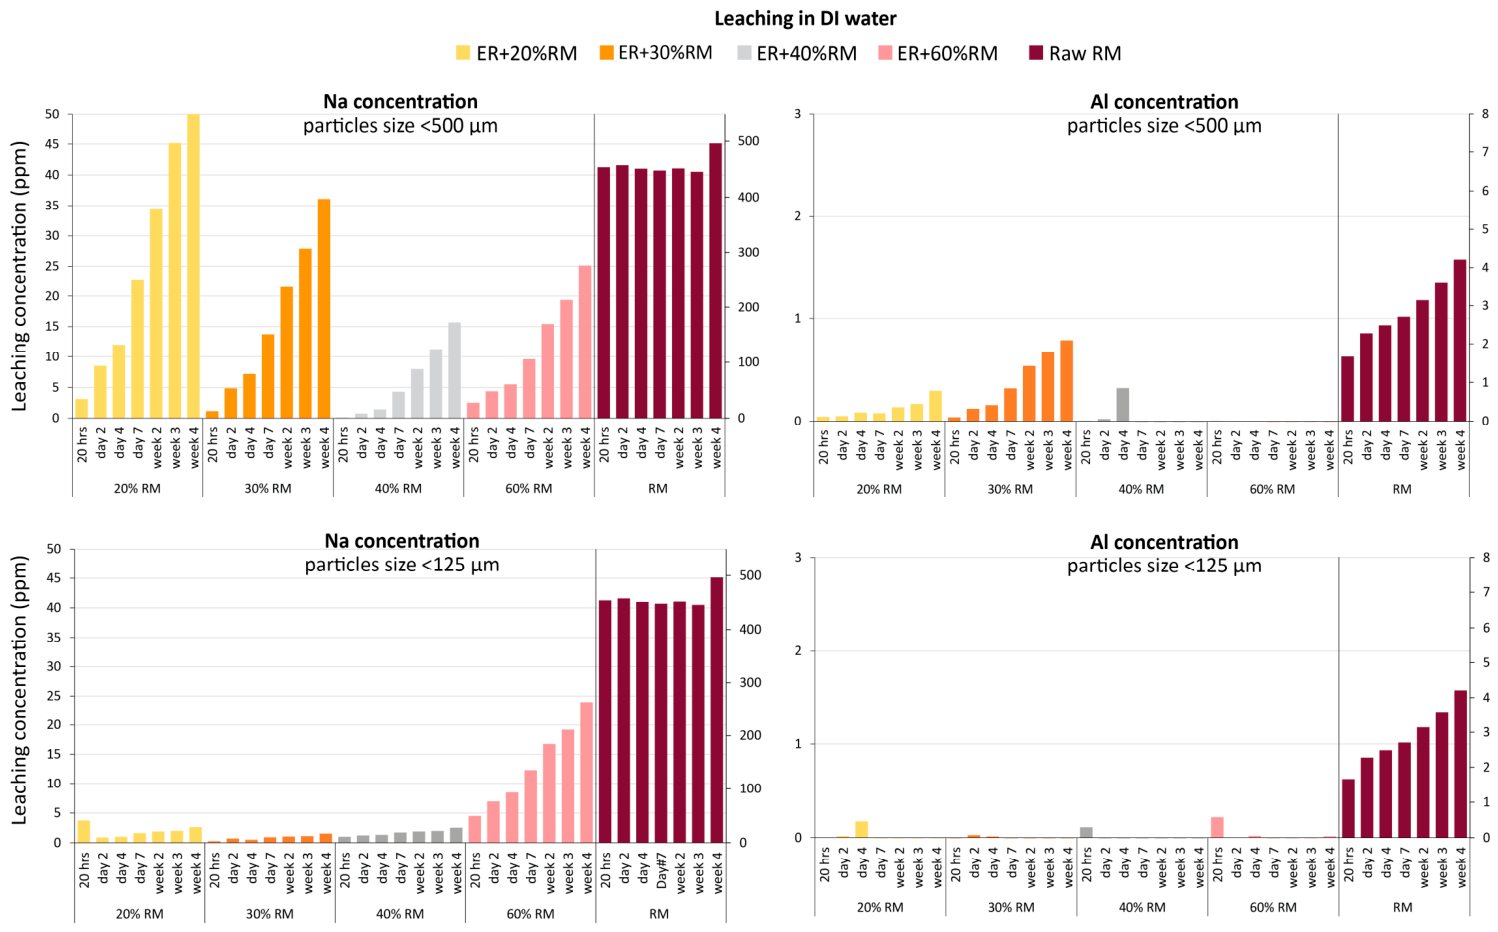
Figure 5 presents the leaching results for raw RM and ER-RM composites in deionised (DI) water. Composites with RM particles < 125 μm and <500 μm exhibited similar behaviour, indicating that the trends in Al and Na concentrations are similar. However, composites with smaller particle sizes (<125 μm) had lower Al and Na concentrations, which can be attributed to the better encapsulation of smaller particles within the polymer matrix.
The pH results of the samples in DI water (Table S3 in SI) show no significant pH drift for composites with RM particles < 125 μm. An increase in pH of composites with RM particles < 500 μm in DI water was observed, which correlates with the ICP leaching data and is attributed to increased sodium leaching in ER-RM-500 composites.
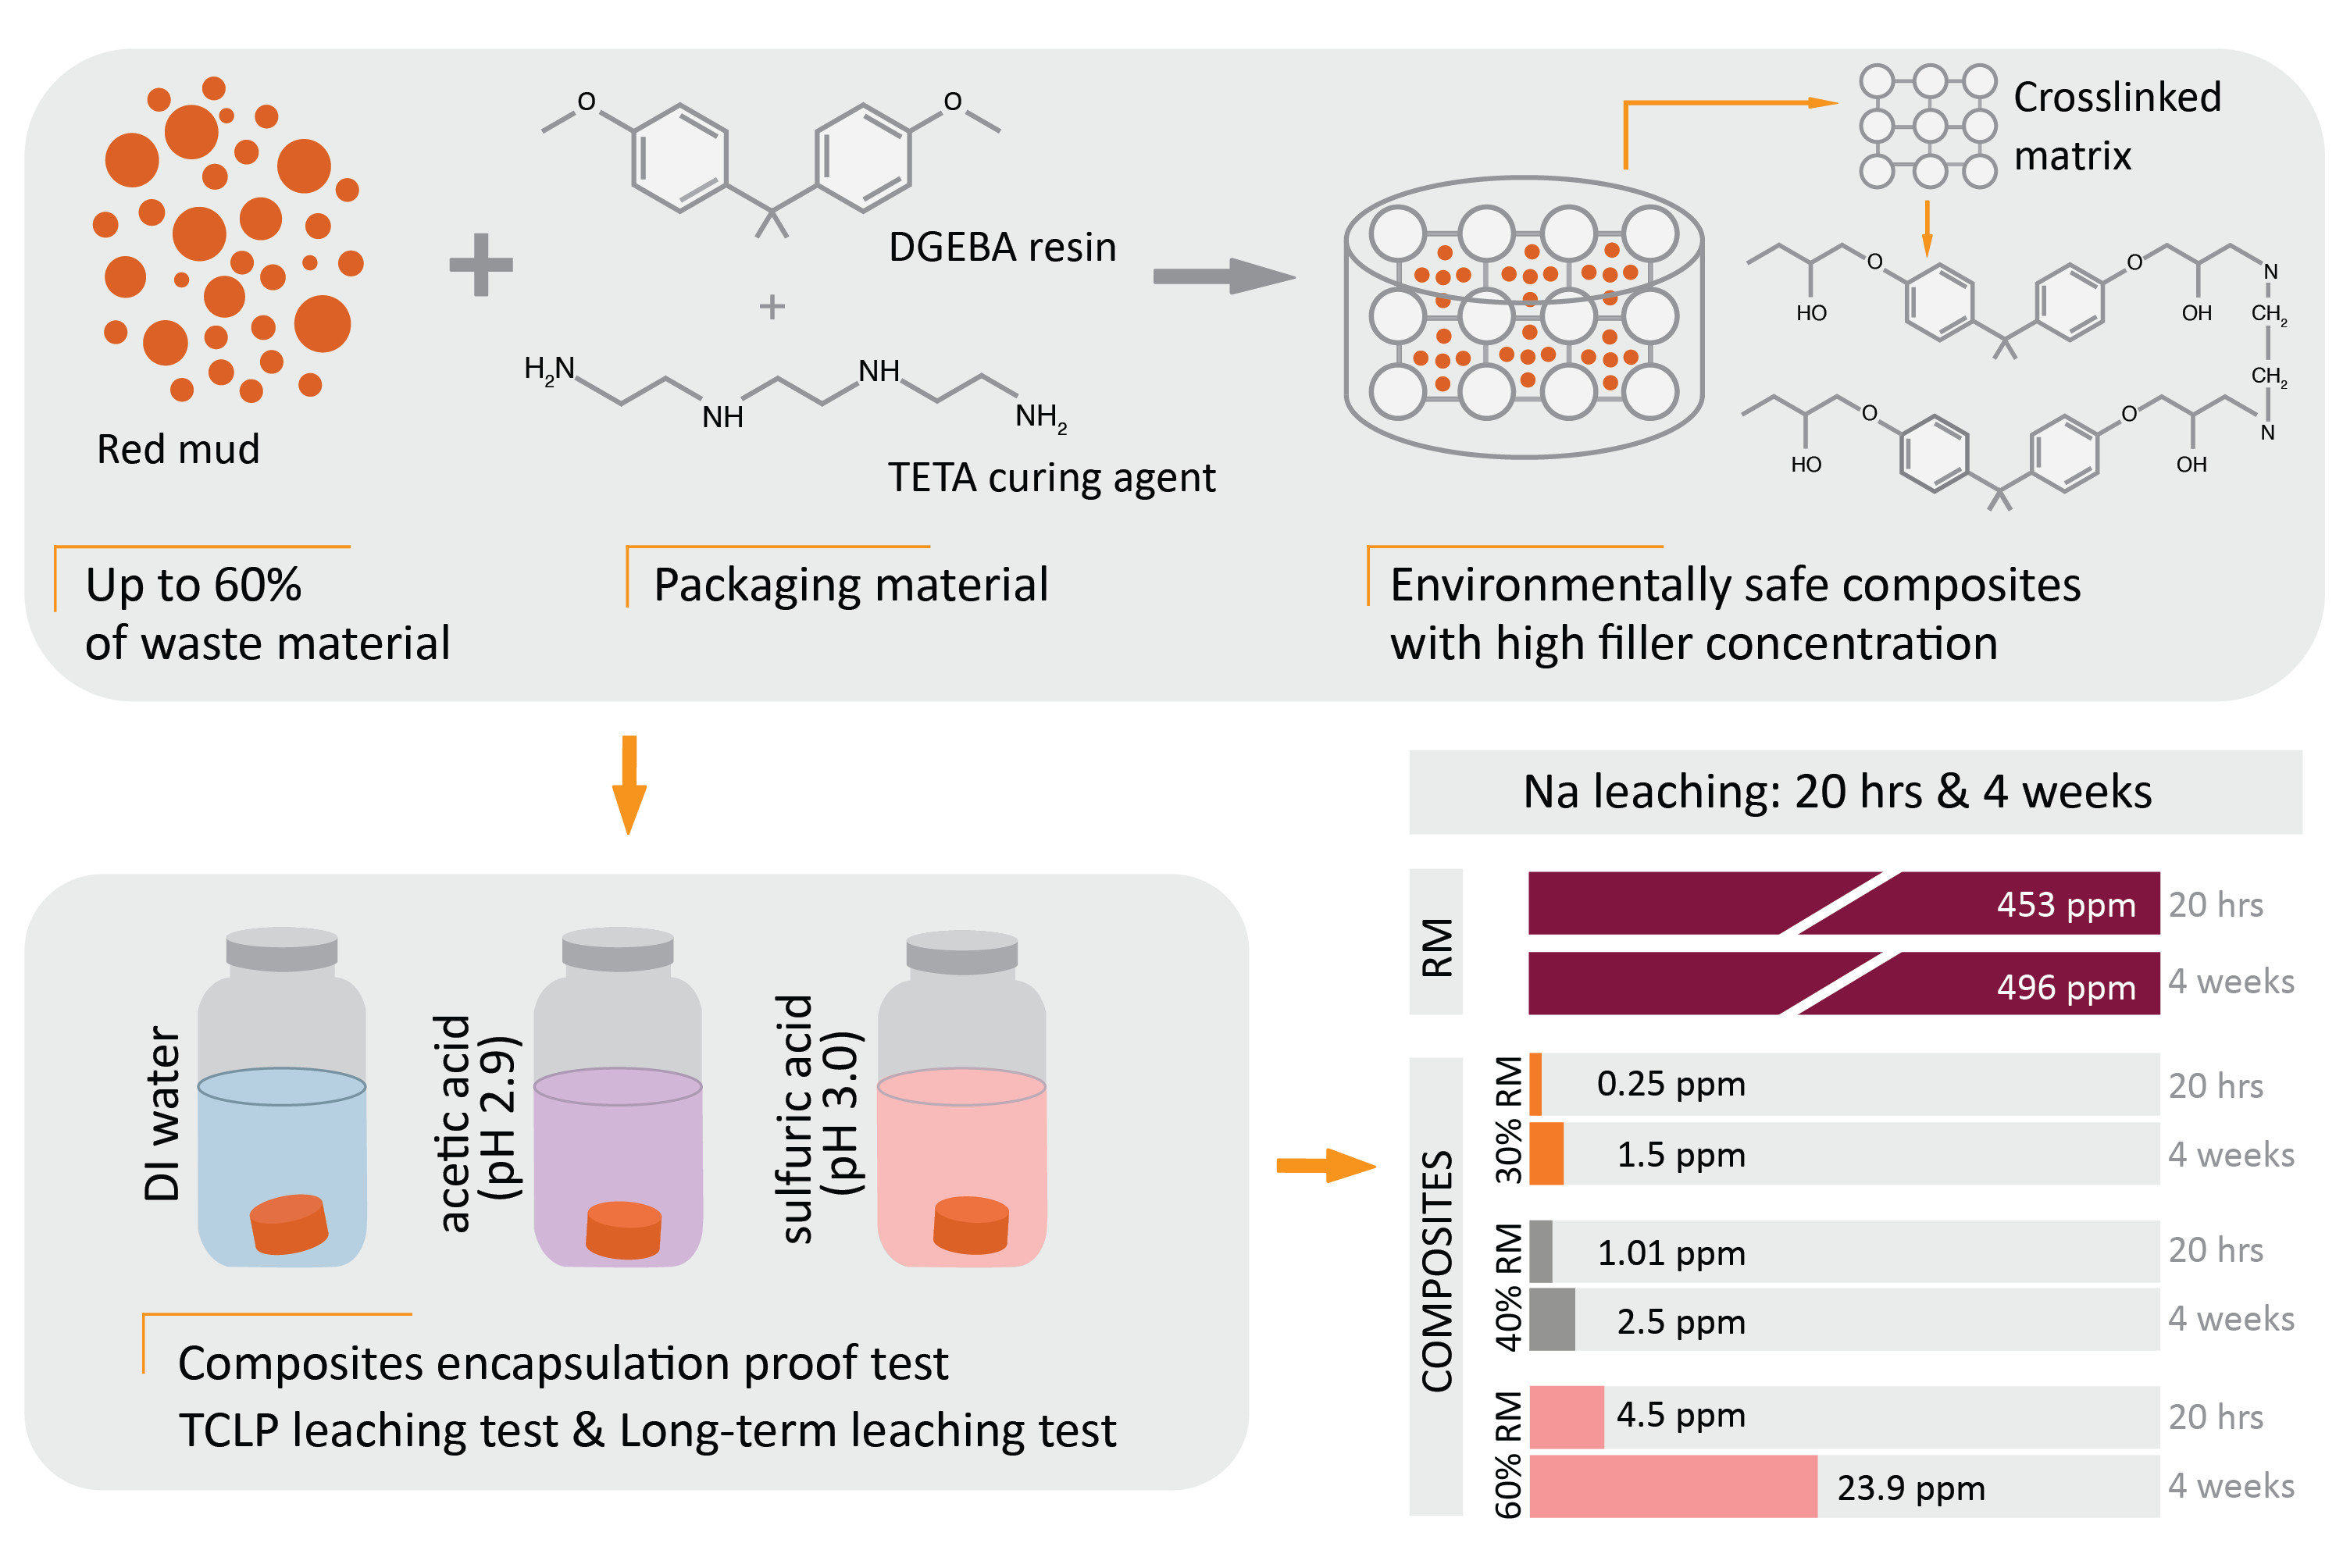
Compared to raw RM, the extraction of sodium and aluminium significantly decreased for all composites, regardless of the RM concentration in the composites and the leaching solution. This confirms the successful encapsulation of RM. The decrease in sodium concentration was dramatic. After 20 h, for RM, it was about 450 ppm, and composite concentrations were not higher than 5 ppm, which is below the recommended concentration for drinking water according to Australian water quality guidelines. This result confirms the environmental safety of the composites and their potential as construction materials.
In addition to sampling after 20 h, long-term experiments were conducted in accordance with Australian Standard 4439.3:2019. Although ICP-OES results show a significant time dependence on concentration, leaching concentrations of Na for all composites (excluding ER-RM-500-20, which exhibited significant phase separation) remained lower than the requirement for irrigation water, and some were even lower than the requirement for drinking water, even after 4 weeks of leaching for composites with 40 wt.% and 60 wt.% of RM.
The best result, meaning the lowest leaching concentration of the Al and Na, were observed for composites with 40 wt.% of the RM. Na concentration for composites with RM particles < 500 μm was 15.6 ppm, and 2.5 ppm for composites with RM particles < 125 μm after 4 weeks. The Al concentration for the same composites was below the instrument detection limit even after 4 weeks of leaching. This correlates with the SEM results, where deagglomeration of RM and good epoxy penetration between the particles were observed.
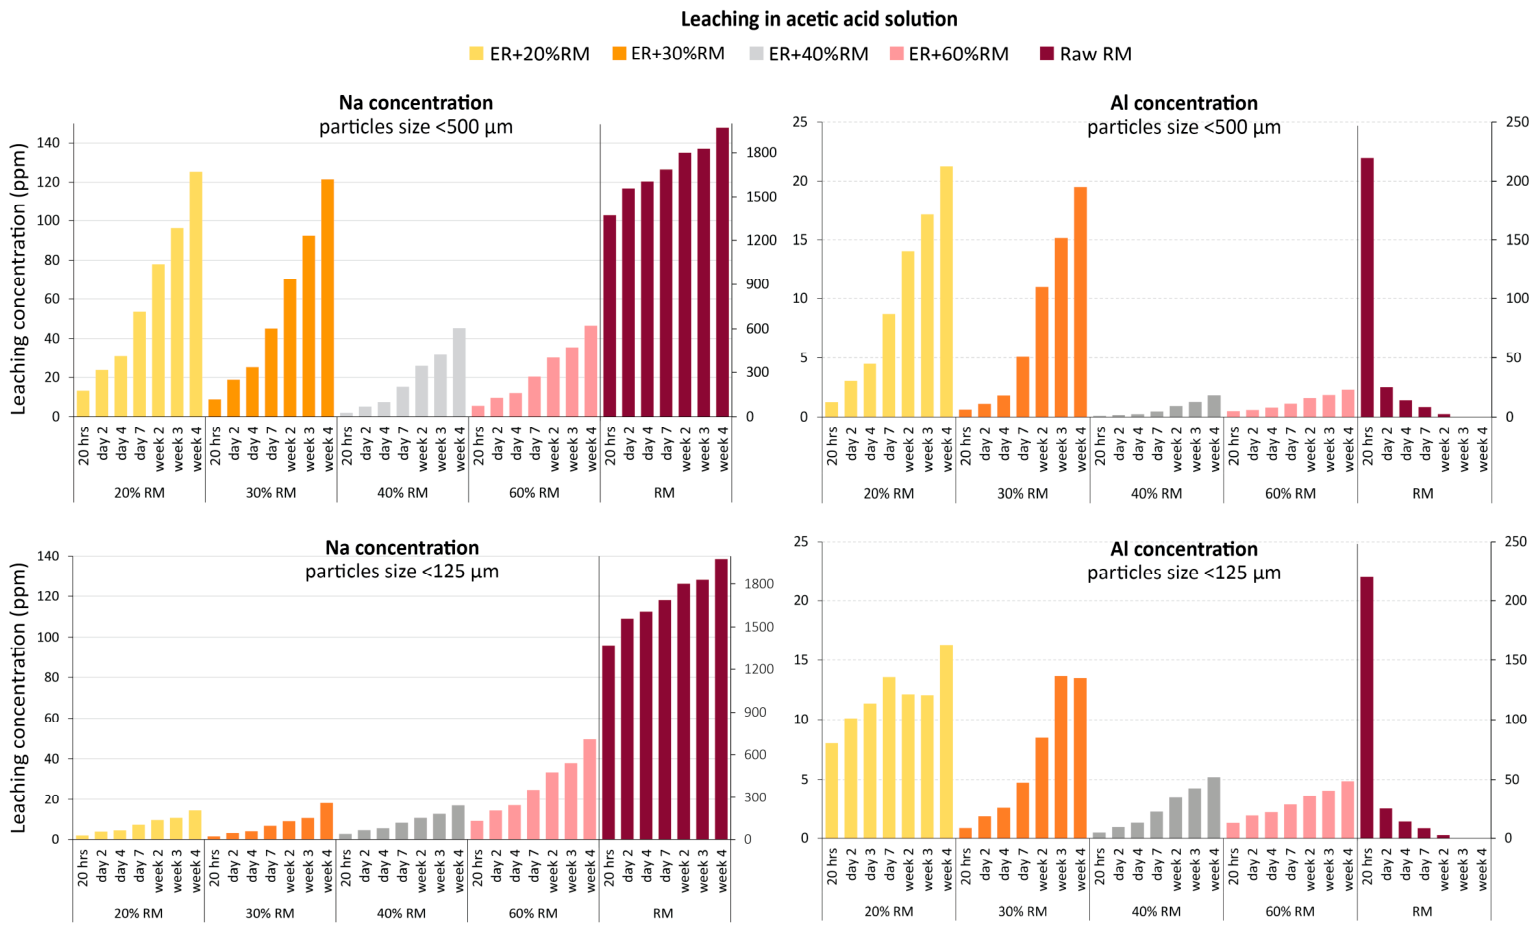
Figure 6 shows the leaching results for the raw RM and composites in the acetic acid solution. As expected, the mobility of Al and Na ions was higher for composites and raw RM samples in acid solutions compared with DI water. Still, the results after 20 h were below the concentrations recommended by Australian water quality guidelines. The pH results of the samples in acetic acid solution (Table S4 in SI) were stable for composites with RM particles < 125 μm, and a small increase was observed for composites with higher particle size.
For Al leached from RM in the acetic acid solution, the maximum extraction occurs after 20 h of leaching, after which the concentration decreases, possibly due to the reaction between aluminium anions in solution and the potential formation of aluminium acetates, thereby reducing the free concentration of aluminium in solution. Similar to DI water leaching experiments, the composites with high RM mass loading exhibited the best encapsulation results, as indicated by the histogram, which shows composites with 60 and 40 wt.% of RM.
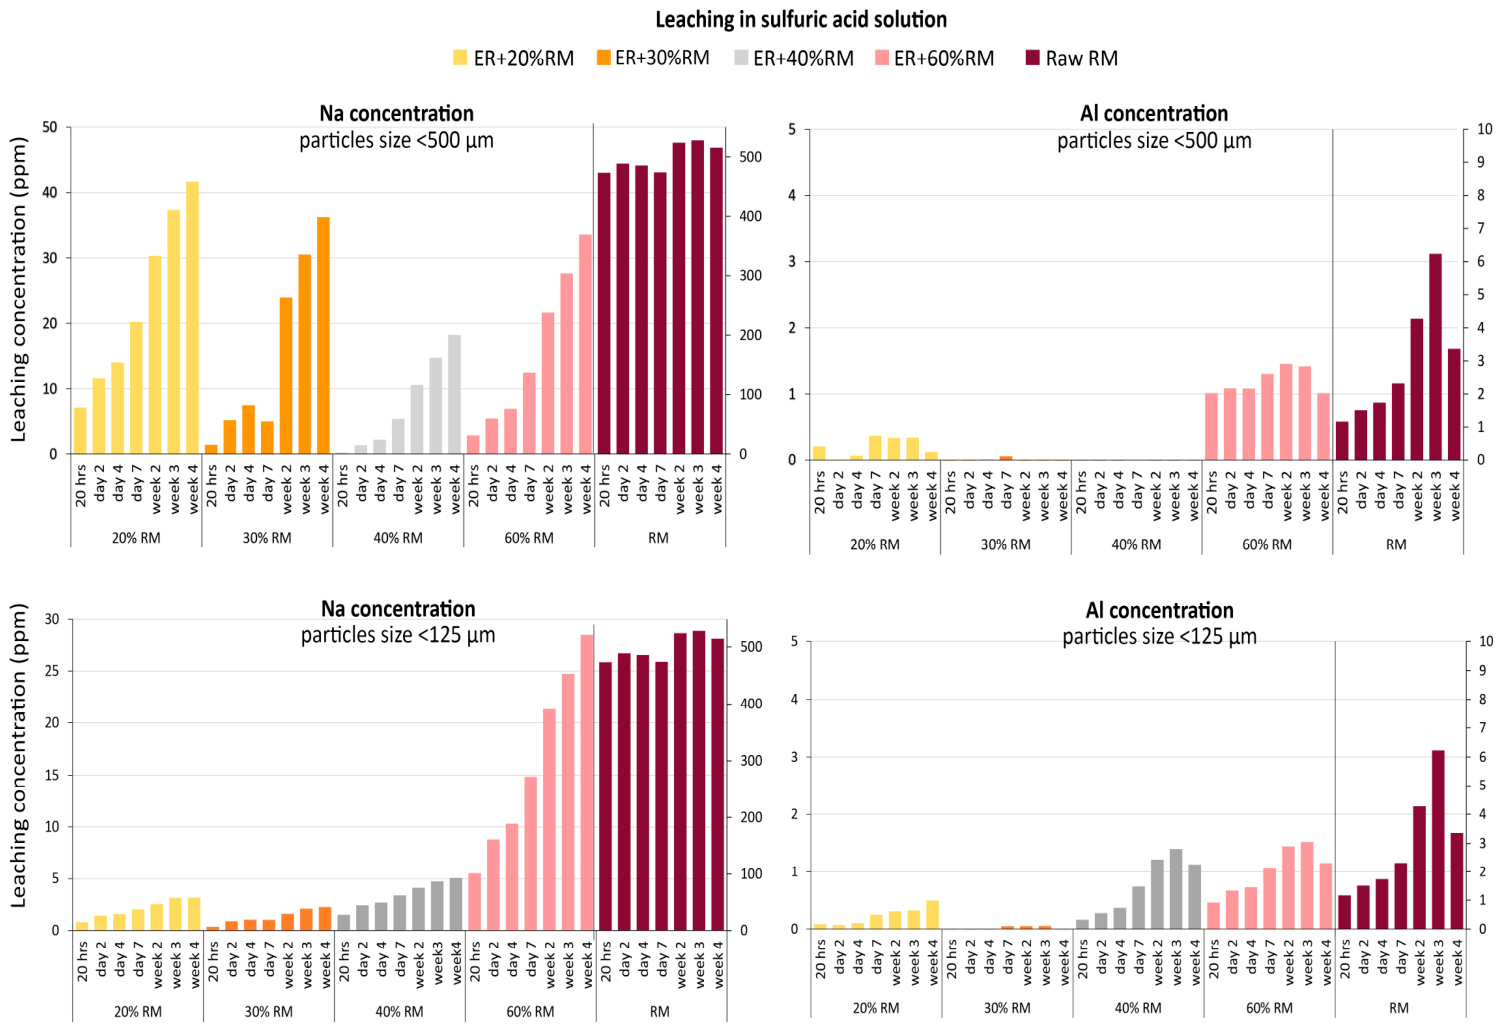
Similar leaching trends were observed in a more aggressive sulfuric acid solution (Figure 7). The best encapsulation was observed in composites with smaller particles (<125 μm) and RM concentrations of 30 wt.% and 40 wt.%. For composites with 40 wt.%, the Na and Al concentrations in the solution after 4 weeks were 5 ppm and 1.3 ppm, respectively.
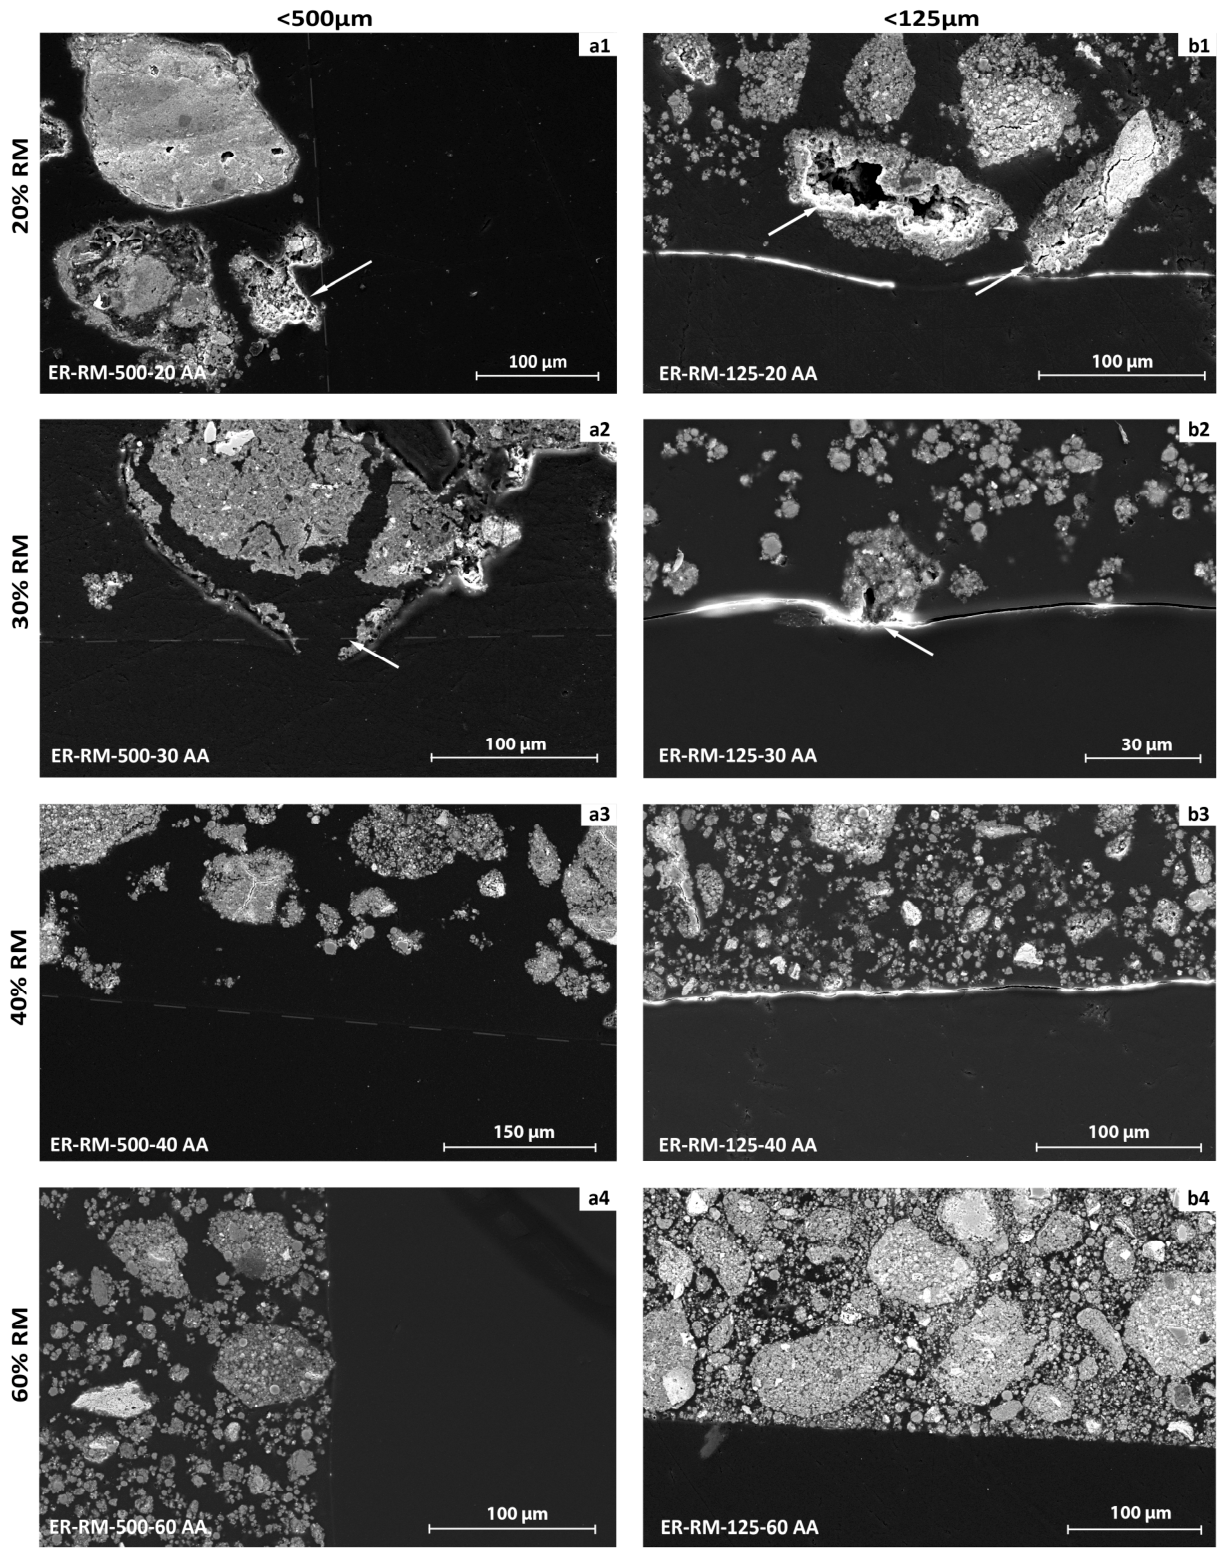
Figure 8 presents the cross-section SEM images of the composites’ edges after a 4-week leaching experiment in acetic acid. These results correlate well with the leaching data. Thus, cracks were observed in the matrix for composites with a lower RM concentration (ER-RM-500-20, ER-RM-500-30, ER-RM-125-20, and ER-RM-125-30, Figure 8(a1,a2,b1,b2)), and with the highest Na and Al concentrations in the leachate. RM agglomerates not infiltrated by the polymer matrix, located near the edges of the composites, led to crack formation during dynamic incubation. Alternatively, composites with high RM concentrations (ER-RM-125-40, ER-RM-125-60) (Figure 8(b3,b4)) do not exhibit many structural changes or cracks. A large number of small RM particles are homogeneously distributed in the polymer matrix, and the penetration of epoxy resin into RM agglomerates is improved This improved interfacial properties and contributed to better structure, fewer cracks, and ultimately reduced leaching from these composites.

4. Conclusions

In this work, we have examined how filler concentration and particle size affected the microstructure, porosity, mechanical properties and curing behaviour of RM-ER composites.
Particle size and red mud mass loading significantly affected composite properties, including particle distribution, porosity, and crack formation. Composites with smaller particles (<125 μm) showed improved structural integrity, reduced porosity, and increased hardness. Microstructural analysis of composites with higher mass loading (40 wt.% and 60 wt.% of RM) revealed good epoxy penetration within agglomerates and a notably reduced number of cracks. This indicates a significantly higher wettability of the RM by the polymer matrix.
DCS analysis revealed that increasing the RM content slows the curing process: for composites with 20 wt.% red mud, the curing time is approximately 10 h, whereas for composites with 60 wt.%, approximately 35 h.
The study included both a leaching experiment conducted in accordance with the AS 4439.3:2019 standard (EPA TCLP procedure) and a long-term leaching assessment to evaluate the environmental safety of the high-loaded ER–RM composites.
Compared with raw red mud, the extraction of sodium and aluminium was significantly reduced across all produced composites, confirming successful encapsulation of the RM in the polymer matrix. The highest ion mobility of aluminium and sodium was observed in acetic acid, compared with DI water and sulfuric acid. Following the standard sampling requirement after 20 h of the experiment, the leachate concentrations of aluminium and sodium across all composites did not exceed the limits set by Australian water quality guidelines. Even after 4 weeks of leaching in DI water and acetic acid, sodium concentrations in leachates did not exceed drinking water limits, and aluminium concentrations did not exceed irrigation water limits. Composites with a 40 wt.% red mud mass loading exhibited the most effective encapsulation, consistent with the microstructure improvements observed at higher mass loadings.

Supplementary Materials

The following supporting information can be downloaded at: https://www.mdpi.com/article/10.3390/cleantechnol8040114/s1, Table S1: Epoxy resin properties according to the manufacturer’s data sheet; Figure S1: Mould dimensions: (a1) mould dimensions, (a2) digital image of the mould, (a3) example of the produced composite using the mould; Figure S2: Position of the samples in the bottle for the leaching experiment: (a1) digital image of the sample position; schematic representations of ER-RM (a2) and RM (a3) sample positions in the bottle; Figure S3: Particle size analysis for raw RM: (a) Sample < 250 μm, (b) Sample < 500 μm. The orange line represents the cumulative percentage, and the black line represents the particles’ volume.; Figure S4: RM TGA analysis; Figure S5: DSC data evaluation: (a) The degree of conversion α vs. temperature at different heating rates for ER-RM-125-20 composites; (b) The degree of conversion α vs. temperature at different heating rates for ER-RM-125-60 composites; Table S2: The mass of composite samples, ER and RM used for the leaching test; Table S3: pH measurements during the leaching test for RM, neat epoxy resin and RM-epoxy composites in DI water (starting DI water pH 7.5, temperature 25 °C); Table S4: pH measurements during the leaching test for RM, neat epoxy resin, and RM-epoxy composites in acetic acid solution (starting solution pH 2.9, temperature 25 °C); Table S5: pH measurements during the leaching test for RM, neat epoxy resin, and RM-epoxy composites in sulfuric acid solution (starting solution pH 3.0, temperature 25 °C).

Author Contributions

Conceptualisation, S.F.; methodology, S.F.; validation, W.N.M. and G.J.M.; formal analysis, S.F.; investigation, S.F.; writing—original draft preparation, S.F.; writing—review and editing, W.N.M. and G.J.M.; visualisation, S.F.; supervision, W.N.M. and G.J.M. All authors have read and agreed to the published version of the manuscript.

Funding

This research received no external funding.

Data Availability Statement

The original contributions presented in this study are included in the article/Supplementary Material. Further inquiries can be directed to the corresponding author.

Acknowledgments

The authors acknowledge the support from the Central Analytical Research Facility (CARF) at Queensland University of Technology (QUT) for providing infrastructure for material characterisation. Sofia Faershtein is grateful for the funding provided by the Australian Government Research Training Program (RTP) Stipend (Domestic) Scholarship.

Conflicts of Interest

The authors declare no conflicts of interest.

Abbreviations

The following abbreviations are used in this manuscript:
RMRed mud
ER-RMEpoxy resin–red mud
DGEBADiglycidyl Ether of Bisphenol A
TETATriethylenetetramine
XRFX-ray fluorescence
LOILoss on ignition
WD-XRFWavelength Dispersive X-ray Fluorescence
LA-ICP-MSLaser Ablation Inductively Coupled Plasma Mass Spectrometry
TGThermogravimetric
DSCDifferential Scanning Calorimetry
HVVickers hardness test
SDStandard deviation
EPA TCLPEnvironmental Protection Agency Toxicity Characteristic Leaching Procedure
TCLPToxicity Characteristic Leaching Procedure
DI waterDeionised water
SISupplementary information
ICP-OESInductively Coupled Plasma Optical Emission Spectroscopy
SEMScanning electron microscopy
BSDBackscattered electron detector
SEDSecondary electron detector

References

  1. Kumar, S.; Kumar, R.; Bandopadhyay, A. Innovative Methodologies for the Utilisation of Wastes from Metallurgical and Allied Industries. Resour. Conserv. Recycl. 2006, 48, 301–314. [Google Scholar] [CrossRef] [Scilit]
  2. Klauber, C.; Gräfe, M.; Power, G. Bauxite Residue Issues: II. Options for Residue Utilization. Hydrometallurgy 2011, 108, 11–32. [Google Scholar] [CrossRef] [Scilit]
  3. Ram Kumar, B.A.V.; Ramakrishna, G. Performance Evaluation of Red Mud as a Construction Material—A Review. Mater. Today Proc. 2023; in press. [CrossRef] [Scilit]
  4. Wu, P.; Liu, X.; Zhang, Z.; Wei, C. Properties of Red Mud-Filled and Modified Resin Composites. Constr. Build. Mater. 2023, 409, 133984. [Google Scholar] [CrossRef] [Scilit]
  5. Li, G.; Liu, J.; Yi, L.; Luo, J.; Jiang, T. Bauxite Residue (Red Mud) Treatment: Current Situation and Promising Solution. Sci. Total Environ. 2024, 948, 174757. [Google Scholar] [CrossRef] [Scilit] [PubMed]
  6. Power, G.; Gräfe, M.; Klauber, C. Bauxite Residue Issues: I. Current Management, Disposal and Storage Practices. Hydrometallurgy 2011, 108, 33–45. [Google Scholar] [CrossRef] [Scilit]
  7. Winkler, D.; Bidló, A.; Bolodár-Varga, B.; Erdő, Á.; Horváth, A. Long-Term Ecological Effects of the Red Mud Disaster in Hungary: Regeneration of Red Mud Flooded Areas in a Contaminated Industrial Region. Sci. Total Environ. 2018, 644, 1292–1303. [Google Scholar] [CrossRef] [Scilit] [PubMed]
  8. Archambo, M.; Kawatra, S.K. Red Mud: Fundamentals and New Avenues for Utilization. Miner. Process. Extr. Metall. Rev. 2021, 42, 427–450. [Google Scholar] [CrossRef] [Scilit]
  9. Pradhan, G.; Tripathy, B.; Ram, D.K.; Digal, A.K.; Das, A.P. Bauxite Mining Waste Pollution and Its Sustainable Management through Bioremediation. Geomicrobiol. J. 2024, 41, 335–344. [Google Scholar]
  10. Liu, X.; Han, Y.; He, F.; Gao, P.; Yuan, S. Characteristic, Hazard and Iron Recovery Technology of Red Mud—A Critical Review. J. Hazard. Mater. 2021, 420, 126542. [Google Scholar] [CrossRef] [Scilit] [PubMed]
  11. Shivani; Vishwakarma, J.; Dhand, C.; M, M.S.; Salammal, S.T.; Gupta, G.K.; Mishra, A.; Dwivedi, N. “Red-Mud, A Golden Waste for Radiation Shielding”: Red-Mud Polymer Composites for High-Performance Radiation-Shielding Components. J. Hazard. Mater. Adv. 2024, 13, 100394. [Google Scholar] [CrossRef] [Scilit]
  12. El-Khayatt, A.M.; Saudi, H.A. Green Approach for Conversion of Hazardous Red Mud into an Efficient Transparent Neutron and Gamma-Ray Shield. Radiat. Phys. Chem. 2024, 215, 111339. [Google Scholar] [CrossRef] [Scilit]
  13. Kumar, A.; Saravanan, T.J.; Bisht, K.; Kabeer, K.I.S.A. A Review on the Utilization of Red Mud for the Production of Geopolymer and Alkali Activated Concrete. Constr. Build. Mater. 2021, 302, 124170. [Google Scholar] [CrossRef] [Scilit]
  14. Nanda, R.P.; Priya, N. Geopolymer as Stabilising Materials in Pavement Constructions: A Review. Clean. Waste Syst. 2024, 7, 100134. [Google Scholar] [CrossRef] [Scilit]
  15. Wu, D.; Xu, Q.; Hou, D.; Yu, R.; Wang, M.; Zhu, Y.; Zhang, Y.; Sui, S.; Zhang, M.; Song, Q.; et al. Encapsulation of Red Mud with Ultra-High Performance Concrete (UHPC) for Immobilization of Alkaline and Heavy Metals: Experiments and Simulations. Cem. Concr. Compos. 2023, 142, 105152. [Google Scholar] [CrossRef] [Scilit]
  16. Chen, J.; Bai, B.; Du, Q. Durability Evaluation of a High-Performance Red Mud-Based Composite Material. Mater. Today Commun. 2024, 39, 108684. [Google Scholar] [CrossRef] [Scilit]
  17. Mi, H.; Yi, L.; Wu, Q.; Xia, J.; Zhang, B. A Review of Comprehensive Utilization of Red Mud. Waste Manag. Res. 2022, 40, 1594–1607. [Google Scholar] [CrossRef] [Scilit] [PubMed]
  18. Putrevu, M.; Thiyagarajan, J.S.; Pasla, D.; Kabeer, K.I.S.A.; Bisht, K. Valorization of Red Mud Waste for Cleaner Production of Construction Materials. J. Hazard. Toxic Radioact. Waste 2021, 25, 03121002. [Google Scholar] [CrossRef] [Scilit]
  19. Yang, J.; Xiao, B. Development of Unsintered Construction Materials from Red Mud Wastes Produced in the Sintering Alumina Process. Constr. Build. Mater. 2008, 22, 2299–2307. [Google Scholar] [CrossRef] [Scilit]
  20. Sandu, T.; Zaharia, A.; Sarbu, A.; Zavoianu, R.; Mara, E.L. Red Mud Polymer Composites; Nova Science Publishers, Inc.: Hauppauge, NY, USA, 2018; pp. 31–108. [Google Scholar]
  21. Saba, N.; Jawaid, M.; Alothman, O.Y.; Paridah, M.T.; Hassan, A. Recent Advances in Epoxy Resin, Natural Fiber-Reinforced Epoxy Composites and Their Applications. J. Reinf. Plast. Compos. 2016, 35, 447–470. [Google Scholar]
  22. Zhu, K.; He, Y.; Feng, D.; Jiang, W.; Zhang, K. Leaching Behavior of Copper Tailings Solidified/Stabilized Using Hydantoin Epoxy Resin and Red Clay. J. Environ. Manag. 2023, 345, 118876. [Google Scholar] [CrossRef] [Scilit] [PubMed]
  23. He, Y.; Jiang, W.-Q.; Chen, K.-P.; Wu, L.-R.; Zhang, K.-N.; Yu, Z.-P.; Gan, X.-P.; Feng, D.-S. Mechanical Properties and Microstructure Evolution of Solidified Copper Tailings with Hydantoin Epoxy Resin. Trans. Nonferrous Met. Soc. China 2022, 32, 3065–3076. [Google Scholar] [CrossRef] [Scilit]
  24. Panda, S.; Behera, D. Effect of Red Mud on Mechanical and Chemical Properties of Unsaturated Polyester-Epoxy-Bamboo Fiber Composites. Mater. Today Proc. 2017, 4, 3325–3333. [Google Scholar] [CrossRef] [Scilit]
  25. Reis, J.M.L. Fracture and Flexural Assessment of Red Mud in Epoxy Polymer Mortars. Mater. Struct./Mater. Constr. 2015, 48, 3929–3936. [Google Scholar] [CrossRef] [Scilit]
  26. Özmeral, N.; Soydal, U.; Kocaman, S.; Ahmetli, G. Red Mud Waste/Nanoclay/Polystyrene-Modified Epoxy Hybrid Composites: Mechanical, Thermal, and Flammability Properties. J. Appl. Polym. Sci. 2023, 140, e54218. [Google Scholar] [CrossRef] [Scilit]
  27. Park, S.J.; Seo, D.I.; Nah, C. Effect of Acidic Surface Treatment of Red Mud on Mechanical Interfacial Properties of Epoxy/Red Mud Nanocomposites. J. Colloid Interface Sci. 2002, 251, 225–229. [Google Scholar] [CrossRef] [Scilit] [PubMed]
  28. Anil, K.C.; Hemavathi, A.B.; Adeebpasha, A. Mechanical and Fractured Surface Characterization of Epoxy/Red Mud/Fly Ash/Aluminium Powder Filled Hybrid Composites for Automotive Applications. Frat. Integrita Strutt. 2023, 17, 93–103. [Google Scholar] [CrossRef] [Scilit]
  29. Duarte, T.M.; Reis, J.M.L. Experimental Investigation of Heat Conduction in Red Mud/Epoxy and Red Mud/Polyester Composites. Int. J. Thermophys. 2014, 35, 1590–1600. [Google Scholar] [CrossRef] [Scilit]
  30. Xue, H.; Lv, G.; Zhang, T.A. Progress of Solid Waste Red Mud in the Field of Ecology and Environment. Water Air Soil Pollut. 2025, 236, 176. [Google Scholar] [CrossRef] [Scilit]
  31. Prabu, V.A.; Johnson, R.D.J.; Amuthakkannan, P.; Manikandan, V. Usage of Industrial Wastes as Particulate Composite for Environment Management: Hardness, Tensile and Impact Studies. J. Environ. Chem. Eng. 2017, 5, 1289–1301. [Google Scholar] [CrossRef] [Scilit]
  32. Kusakli, S.; Kocaman, S.; Ceyhan, A.A.; Ahmetli, G. Improving the Flame Retardancy and Mechanical Properties of Epoxy Composites Using Flame Retardants with Red Mud Waste. J. Appl. Polym. Sci. 2021, 138, 50106. [Google Scholar] [CrossRef] [Scilit]
  33. AS 4439.3:2019; Wastes, Sediments and Contaminated Soils, Part 3: Preparation of Leachates—Bottle Leaching Procedure. Standards Australia: Sydney, Australia, 2019.
  34. Biswas, S.; Satapathy, A. A Comparative Study on Erosion Characteristics of Red Mud Filled Bamboo–Epoxy and Glass–Epoxy Composites. Mater. Des. 2010, 31, 1752–1767. [Google Scholar] [CrossRef] [Scilit]
  35. Agarwal, B.D.; Broutman, L.J.; Chandrashekhara, K. Analysis and Performance of Fiber Composites, 3rd ed.; John Wiley & Sons: Hoboken, NJ, USA, 2006. [Google Scholar]
  36. Australian and New Zealand Environment and Conservation Council. Australian Water Quality Guidelines for Fresh and Marine Waters National Water Quality Management Strategy; Australian and New Zealand Environment and Conservation Council: Canberra, Australia, 1992.
  37. WHO. Guidelines for Drinking-Water Quality: Fourth Edition Incorporating the First and Second Addenda; World Health Organization: Geneva, Switzerland, 2022. [Google Scholar]
  38. Gräfe, M.; Power, G.; Klauber, C. Bauxite Residue Issues: III. Alkalinity and Associated Chemistry. Hydrometallurgy 2011, 108, 60–79. [Google Scholar] [CrossRef] [Scilit]
  39. Zhang, J.; Yao, Z.; Wang, K.; Wang, F.; Jiang, H.; Liang, M.; Wei, J.; Airey, G. Sustainable Utilization of Bauxite Residue (Red Mud) as a Road Material in Pavements: A Critical Review. Constr. Build. Mater. 2021, 270, 121419. [Google Scholar] [CrossRef] [Scilit]
  40. Ray, A.R.; Tripathy, B.C.; Mishra, S. Investigation on Process Optimization and Kinetics for Leaching of Rare Earth Elements from Red Mud Using Citric Acid. Sci. Rep. 2025, 15, 35633. [Google Scholar] [CrossRef] [Scilit] [PubMed]
  41. Tziamtzi, C.K.; Chrissafis, K. Optimization of a Commercial Epoxy Curing Cycle via DSC Data Kinetics Modelling and TTT Plot Construction. Polymer 2021, 230, 124091. [Google Scholar] [CrossRef] [Scilit]
  42. Franieck, E.; Fleischmann, M.; Hölck, O.; Kutuzova, L.; Kandelbauer, A. Cure Kinetics Modeling of a High Glass Transition Temperature Epoxy Molding Compound (Emc) Based on Inline Dielectric Analysis. Polymers 2021, 13, 1734. [Google Scholar] [CrossRef] [Scilit] [PubMed]
  43. Kamal, M.R.; Sourour, S. Kinetics and Thermal Characterization of Thermoset Cure. Polym. Eng. Sci. 1973, 13, 59–64. [Google Scholar] [CrossRef] [Scilit]
  44. Shnawa, H.A. Studies on Thermal Properties and Curing Kinetics of Talc-Filled Epoxy Resin Composite Using Differential Scanning Calorimetry. Polym. Bull. 2022, 79, 11461–11478. [Google Scholar] [CrossRef] [Scilit]
Figure 1. Schematic illustration of composite production.
Cleantechnol 08 00114 g001
Figure 2. Typical morphological image (a) and particle size analysis (b) of raw RM. The orange line represents the cumulative percentage, and the black line shows the particles’ volume.
Cleantechnol 08 00114 g002
Figure 3. DSC data evaluation: (a) heat flow of ER and composites with 20 wt.% of RM (ER-RM-125-20), 40 wt.% of RM (ER-RM-125-40) and 60 wt.% of RM (ER-RM-125-60) vs. temperature at 10 °C/min heating rate; (b) the degree of conversion α vs. temperature at different heating rates for ER and (c) composites ER-RM-125-40; (d) isothermal curing predictions for ER and composites.
Cleantechnol 08 00114 g003
Figure 4. Microstructure of ER-RM composites. Digital images of the composites’ cross-sections (a1a8); SEM images of the composites’ structure (b1b8) and the composites’ edge (c1c8).
Cleantechnol 08 00114 g004
Figure 5. Al and Na leaching concentrations of composites with different RM concentrations and raw RM in DI water. The right axes show concentrations for raw RM leaching experiments.
Cleantechnol 08 00114 g005
Figure 6. Al and Na leaching concentrations for composites with different RM concentrations and raw RM in acetic acid. The right axes show concentrations for raw RM leaching experiments.
Cleantechnol 08 00114 g006
Figure 7. Al and Na leaching concentrations of composites with different RM concentrations and raw RM in sulfuric acid. The right axes show concentrations for raw RM leaching experiments.
Cleantechnol 08 00114 g007
Figure 8. Cross-sectional SEM images of the composites after a 4-week leaching test in acetic acid solution, (a1a4) for composites with particle size < 500 μm, (b1b4) for composites with particle size < 125 μm.
Cleantechnol 08 00114 g008
Table 1. Composite mix design proportions.
SamplesMixture (g)RM (wt.%)RM (g)Resin (g)Hardener (g)
ER-RM-125-20
ER-RM-500-20
50201035.714.28
ER-RM-125-30
ER-RM-500-30
50301531.253.75
ER-RM-125-40
ER-RM-500-40
50402026.783.21
ER-RM-125-60
ER-RM-500-60
50603017.852.14
Table 2. Chemical composition of raw RM, as determined by WD-XRF, for major elements.
FormulaFe2O3MgOAl2O3Mn2O3SiO2TiO2CaONa2OSO3ZrO2
wt.%30.071.6521.630.03216.56.612.468.960.550.45
FormulaP2O5K2OCr2O3CuOSrOHfO2V2O5SumLOI
wt.%0.130.130.0820.010.0010.0140.0999.369.976
Table 3. Trace element concentrations in raw RM by LA-ICP-MS.
ElementScCoNiAsSrNbPbThU
Average
concentration
(ppm)
92.719.041.743.084.3281.663.683.518.7
Table 4. Porosity and hardness measurements ± standard deviation (SD) for epoxy resin, RM, and composites.
SamplesDensity, ρ c e
(g/cm3)
Total Porosity, P
(%)
Hardness
HV ± SD
Red mud2.96-9.4 ± 0.9
Epoxy resin1.15-17.5 ± 0.9
ER-RM-500-201.273.5-
ER-RM-500-301.391.5-
ER-RM-500-401.446.017.2 ± 2.6
ER-RM-500-601.5813.022.3 ± 4.6
ER-RM-125-201.273.420.3 ± 0.9
ER-RM-125-301.391.920.0 ± 2.8
ER-RM-125-401.3611.222.6 ± 3.8
ER-RM-125-601.6210.929.0 ± 2.6
Table 5. Element concentrations extracted from raw RM after 20 h of leaching in DI water, acetic and sulfuric acid solutions.
SolutionElement Concentrations Extracted from RM After 20 h (ppm)
CaAlKMgNaSiVCrNiPb
DI water1.401.76.90.1453.80.40.5---
Acetic acid solution306.9219.717.345.01369.9247.5----
Sulfuric acid solution3.01.27.41.2473.20.70.2---
Table 6. Metal concentrations according to TCLP, WHO and Australian water quality guidelines.
MetalsTCLP Hazardous Waste Limit (ppm)AU Water Quality Guidelines
for Water (ppm)
WHO Standards of Drinking Water (ppm)
DrinkingIrrigation
As5.00.050.10.01
Cr5.00.051.00.05
Al-0.25.00.9
Pb5.00.050.20.01
Na-300- **20 *
Ni-0.10.20.07
Cu-1.00.22
* Typically, 20 ppm; concentrations exceeding 200 ppm may result in an unacceptable taste. ** Direct toxic effect of sodium concentrations, expressed as the sodium adsorption ratio (SAR), on different plants.
Disclaimer/Publisher’s Note: The statements, opinions and data contained in all publications are solely those of the individual author(s) and contributor(s) and not of MDPI and/or the editor(s). MDPI and/or the editor(s) disclaim responsibility for any injury to people or property resulting from any ideas, methods, instructions or products referred to in the content.