Article

Algae-Based Remediation of Nitrocellulose Alkaline Hydrolysis Liquors: Nitrogen Recovery and Ecotoxicity Insights


by
Juliana Abraham
1,*,
Anthony Tesori
2,
Washington J. Braida
1,
Tsan-Liang Su
1 and
Christos Christodoulatos
1,*
1
Center for Environmental Systems, Department of Civil, Environmental and Ocean Engineering, Stevens Institute of Technology, Hoboken, NJ 07030, USA
2
US EPA Region 2 Superfund and Emergency Management Division, New York, NY 10007, USA
*
Authors to whom correspondence should be addressed.
Clean Technol. 2026, 8(4), 103; https://doi.org/10.3390/cleantechnol8040103
Submission received: 24 April 2026 / Revised: 23 May 2026 / Accepted: 29 May 2026 / Published: 9 July 2026

Highlights

What are the main findings?
  • Alkaline hydrolysis (AH) effectively degrades nitrocellulose; however, the resulting nitrate and nitrite-heavy wastewater is toxic to microorganisms, primarily driven by nitrite concentrations and the synergistic effect of co-existing nitrate and sodium that exacerbates overall toxicity.
  • Pure, S. obliquus, and freshwater microalgae and bacteria consortium cultures achieved nitrogen removal of 99% within seven days at concentrations equal to or lower than 100 mg N/L (3:1 NO2-N:NO3-N) using liquors obtained from AH of nitrocellulose.
What are the implications of the main findings?
  • This study establishes a proof-of-concept for a dual chemical (alkaline hydrolysis) and biological (microalgae) treatment framework that effectively manages N-rich industrial wastewater.
  • This method assimilates hazardous inorganic nitrogen from wastewater into valuable algal biomass, enabling sustainable resource recovery and potential algae-based biofuel production.

Abstract
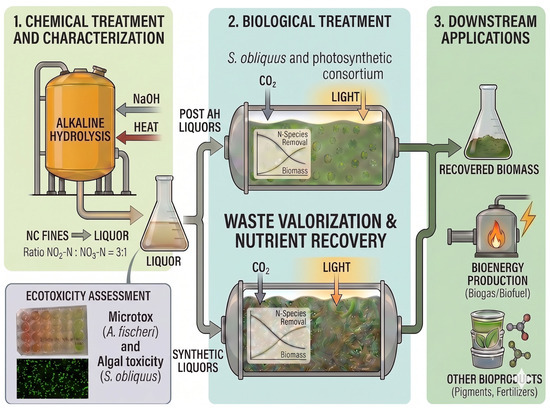
The production of Nitrocellulose (NC) generates wastewater containing insoluble fines which can be solubilized via alkaline hydrolysis (AH). However, this process yields effluents with high NO2-N and NO3-N concentrations (3:1 ratio), opening the possibility of further treatment and nutrient recovery. This study investigated the ecotoxicity and algae-based treatment potential of post-AH liquor as a proof of concept for wastewater management. Ecotoxicity assessments such as microalgal and Microtox® bioassays showed 30% toxicity (corresponding to 240–270 mg NO2-N/L and 100 mg NO3-N/L) and a 15 min EC50 of 331–399 mg NO2-N/L and 133–146 mg NO3-N/L, respectively. Additional studies on toxicity identified nitrite (NO2) as the primary toxicant, inhibiting the freshwater microalga Scenedesmus obliquus at concentrations higher than 60 ± 5 mg N/L. Furthermore, higher toxicity was observed in the presence of sodium and nitrate. Consequently, growth screening tests using synthetic liquors (20–300 mg TN/L, with NO2-N:NO3-N ratio 3:1) compared S. obliquus against the marine microalga Nannochloropsis salina, revealing that S. obliquus thrived at concentrations below 160 mg N/L, whereas N. salina performed poorly. System efficiency was shown to be highly dependent on the initial nitrogen load; S. obliquus achieved 60% removal at 200 mg/L total nitrogen (3:1 NO2-N:NO3-N), whereas efficiency reached 99% at concentrations less than or equal to 100 mg/L within seven days. Nitrogen removal rates peaked at 15 mg/(L·day) (at <160 mg TN/L), a result validated through scale-up experiments using both monoculture and a consortium with post-AH liquor. These preliminary findings demonstrate a promising two-step chemical and biological treatment strategy for NC wastewater, which assimilates hazardous inorganic nitrogen into valuable algal biomass for potential energy production.

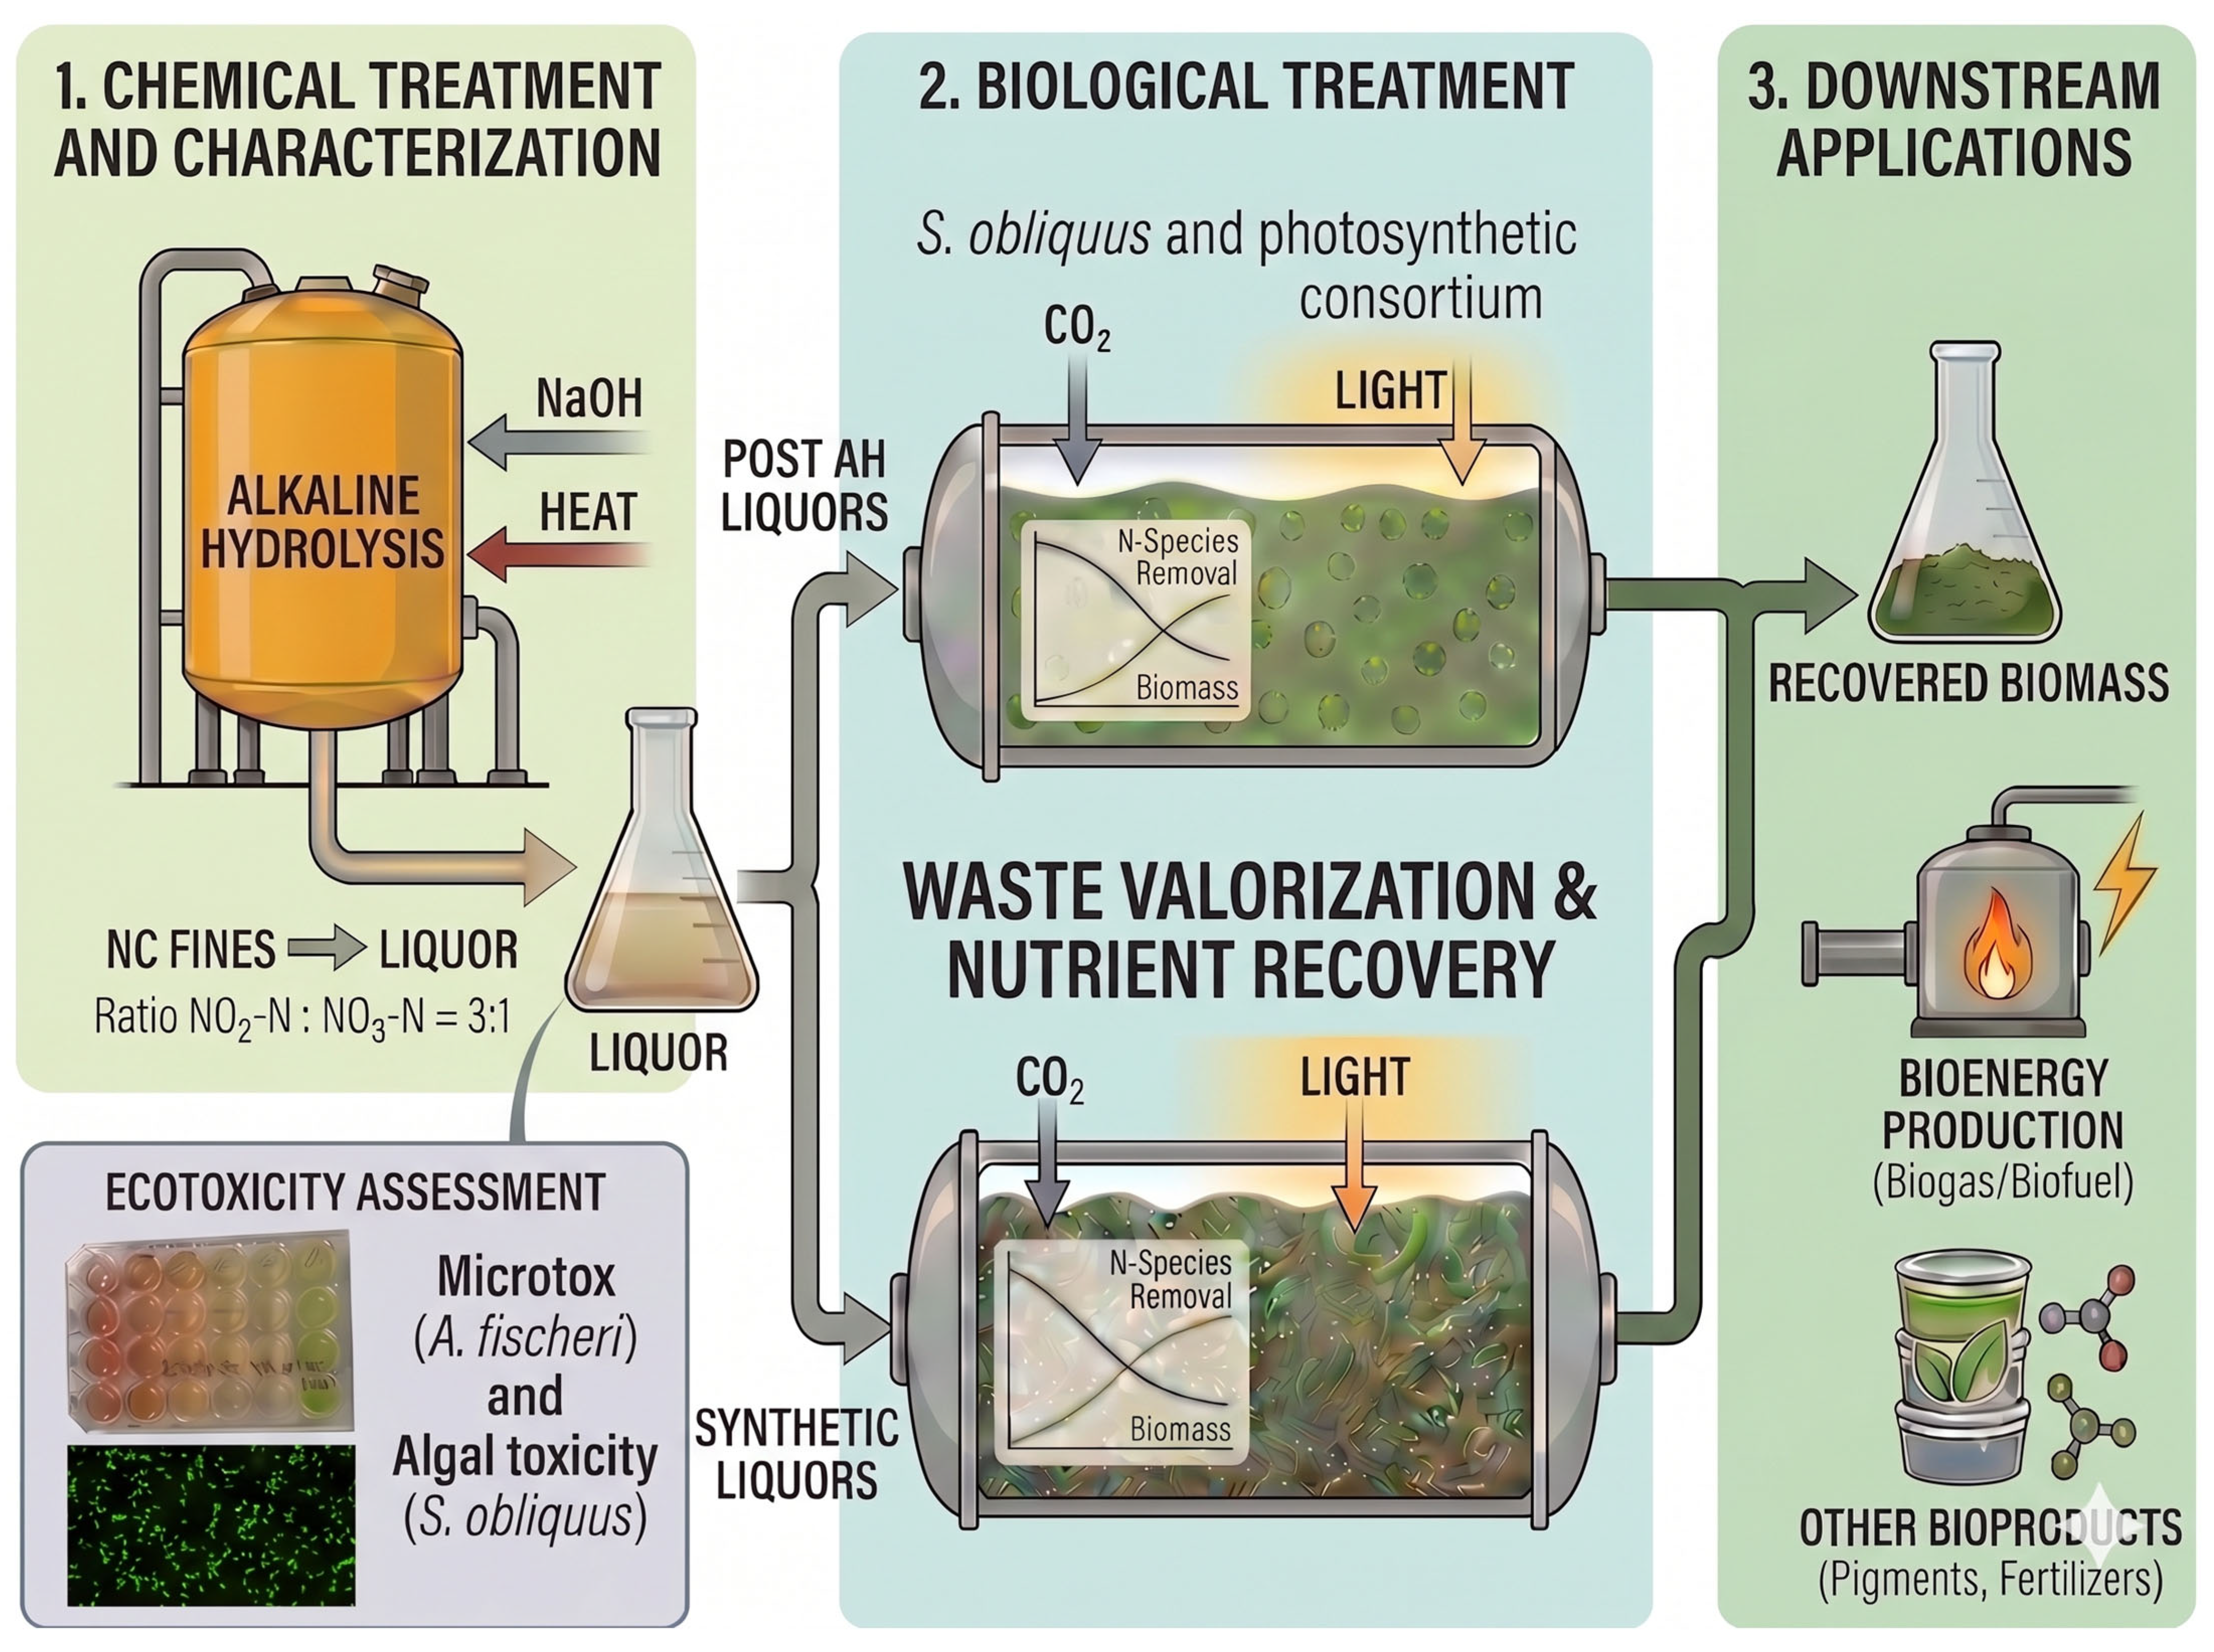
Graphical Abstract

1. Introduction

Cellulose nitrate or Nitrocellulose (NC) is a fibrous solid, highly flammable compound, insoluble in water, with multiple uses in medicine, research, coating and munitions industries, amongst others [1,2]. The manufacturing of NC generates wastewater streams laden with this insoluble organic polymer and other inorganic elements, predominantly nitrogen, that require further treatment prior to their release into adjacent water bodies.
The degradation of Nitrocellulose (NC) wastewater has been extensively explored through various physical, chemical, and biological frameworks. Conventional approaches include thermal decomposition, chemical precipitation, acid/alkaline hydrolysis, and solid-state fermentation via composting [3,4]. Recent advancements have shifted toward integrated treatment systems, such as coupling photolysis with fungal remediation or combining chemical decomposition with biological denitrification, to enhance overall degradation efficiency [3,4].
While some methods are often expensive, others are limited by long reaction times and lower effectiveness. Among all the methods stated earlier, alkaline hydrolysis (AH) has emerged as a particularly effective chemical treatment for the safe destruction and separation of NC fines from industrial streams [5,6,7,8]. AH yields digested liquors that are rich in nitrogenous compounds, specifically nitrite (NO2) and nitrate (NO3), which typically form at a consistent 3:1 ratio regardless of temperature, alkalinity, or reaction time [5]. While these liquors present a significant opportunity for resource valorization through biological systems, their high nitrogen concentrations necessitate targeted secondary treatment to meet stringent regulatory discharge standards.
The disposal of nitrogen-rich effluents can accelerate eutrophication, contributing to algal blooms and hypoxic zones that alter aquatic ecosystems [9]. Additionally, elevated nitrate and nitrite levels present potential toxicity risks to aquatic life, as well as human health concerns if drinking water sources are impacted. To protect watersheds, the US Environmental Protection Agency (EPA) establishes guidelines through the National Pollutant Discharge Elimination System (NPDES), typically limiting total nitrogen (TN) effluent discharge to 5–20 mg N/L and capping nitrate at 10 mg/L as N [10]. Consequently, developing efficient methods to meet these regulatory standards remains an important objective.
Nitrogen treatment approaches typically rely on either physicochemical methods such as ion exchange, advanced oxidation processes and ammonia stripping or biological configurations like nitrification-denitrification or partial denitrification/anammox, among others. While these established technologies are effective at reducing nitrogen loads to meet regulatory baselines, they generally focus on contaminant removal or destruction rather than resource recovery. Consequently, most competing systems do not generate biomass feedstock, contrasting with the dual remediation and biomass-generation pathways offered by microalgae-based frameworks [11,12,13].
In recent years, microalgae-based biotechnologies have developed as a viable approach for integrated resource recovery in wastewater management. These photosynthetic microorganisms sequester inorganic carbon (CO2) and assimilate essential macronutrients, primarily nitrogen (N) and phosphorus (P), for the synthesis of cellular proteins, lipids, and carbohydrates. This metabolic process facilitates the conversion of nutrient-rich effluents into bio-based feedstock, thereby integrating pollution mitigation with circular bioeconomy objectives [14,15]. Consequently, wastewater streams serve as a sustainable feedstock for biomass synthesis for products and energy generation [16,17]. This dual-purpose approach, coupling biological treatment with nutrient recycling, transforms potential pollutants into valuable precursors for biofuels or bioproducts, thereby enhancing the economic viability of the treatment process.
To the best of our knowledge, this is the first study to investigate the integration of alkaline hydrolysis and microalgae cultivation for nitrocellulose wastewater remediation. This work evaluates a closed-loop approach for the valorization of concentrated industrial nitrogenous waste streams. By linking remediation with resource recovery, this system targets two key technical objectives: reducing reactive nitrogen concentrations to meet compliant discharge guidelines for water reclamation and generating an algal biomass feedstock for potential downstream applications such as biofuels. Ultimately, this integration offers an alternative proof-of-concept framework for industrial circular bioeconomies.
This study evaluates the aquatic ecotoxicity of NC fines liquors generated following alkaline hydrolysis treatment and elucidates specific toxicants that may inhibit growth. Because the proposed treatment system relies entirely on microbial nutrient assimilation, ecotoxicological screening was focused on the functional groups of the bioprocess, such as primary producers (photosynthetic microorganisms) and bacteria. Additionally, the research assesses nitrogen removal performance, specific growth rates and biomass productivity across multiple laboratory reactor volumes, utilizing both synthetic and post-AH liquors to ensure scalability and practical relevance. Evaluation of these substrates was conducted using suspended algal cultures, comparing freshwater and marine pure strains against a resilient freshwater consortium. Furthermore, an assessment of nitrogen removal rates was performed to determine the metabolic thresholds and kinetics governing treatment efficiency.

2. Materials and Methods

2.1. Post-Alkaline Hydrolysis (AH) Liquors

Liquors used in this study were generated from the hydrolysis of NC fines (provided by an industrial base ammunition facility) from both pure (i.e., production grade) and recovered from wastewater sources (NC-p and NC-w, respectively). In brief, 3% NC fines were treated with 3% NaOH at 90 °C for 25 min as described by [5,6].

2.2. Toxicity Assessments

A multi-species microbial battery directly assessed the process ecotoxicity relevant to an algal-bacterial consortium since disruption at this baseline would collapse the remediation process.

2.2.1. Algal Toxicity Assessments

Toxicity assays followed Organization for Economic Co-operation and Development (OECD) Guidelines [18] adapted for 24-well microplates [19,20]. Scenedesmus obliquus (ATCC® 11477™) was cultured in BG-11 medium. Post-AH liquor pH was adjusted to 7 using 0.1 M/1 M HCl prior to testing. Briefly, cultures were incubated for 4 days at 25 °C under continuous shaking (120 rpm) and a 14:10 h light:dark photoperiod (5000 lux/68 µmol photons; 5% CO2 atmosphere during light phase). An initial cell density of 1 × 10⁵ cells/mL was used in all tests. Daily biomass (days 0–4) was estimated via fluorescence at 685 nm (Biotek® Citation 3, Winooski, VT, USA), calibrated against cell density (Thoma chamber, Fisher Scientific, Waltham, MA, USA; Nikon TMS, Tokyo, Japan) standard curves. Experimental treatments included sample amendments of 10, 20, 40, 60, and 80% (v/v) versus a 0% medium-only control (n = 8). Results are reported as mean cell density (cells/mL ± SD).
Growth inhibition was evaluated by comparing the average specific growth rate (µ, day−1) of treated cultures against unexposed controls (Ctrl). µ was calculated using the linear form of the exponential growth equation:
µ = L n   ( C 3 ) L n   ( C 0 ) t
where C0 and C3 represent biomass (cells/mL) at time 0 and 3 days, respectively, and t is time, 3 days.
Toxicity levels were classified based on growth thresholds relative to controls. The percentage of growth rate inhibition (Inh.) was calculated as follows:
% I n h i b i t i o n = ( µ c µ t ) µ c × 100
where µc and µt constitute the average specific growth rates of the control and the test condition, respectively.

2.2.2. Microtox Acute Toxicity Bioassay

Acute toxicity was assessed using a Microtox® LX analyzer (Modern Water Inc., New Castle, DE, USA) following the International Organization for Standardization (ISO) Standard 11348-3:2007 protocol [21]. This assay measures bioluminescence inhibition in the marine bacterium Aliivibrio fischeri upon exposure to samples, relative to reagent blank controls. Lyophilized bacteria were rehydrated and subjected to the “Acute Toxicity Basic Test” protocol to ensure high precision for samples of unknown toxicity. Prior to testing, post-AH liquor pH was adjusted to 6.0–8.0 using HCl. Data analysis and determination of the half-maximal effective concentration (EC50) were performed using Microtox®OmniLXTM software (v1.3). Sample assessment was performed in duplicate.

2.3. Nitrogen Removal Experiments

Nitrogen removal was evaluated in a batch system using 24-well microplates (3 mL microreactor working volume) to screen optimal concentrations. Synthetic effluents were prepared using freshwater medium BG-11 composition with modified N species and concentrations by adding NaNO3, NaNO2, and KNO2 salts to achieve concentrations in a 3:1 NO2-N:NO3-N ratio, mimicking post-AH liquors. Incubation followed the previously described parameters in Section 2.2.1 over a 7-day duration, such as 25 °C under continuous shaking (120 rpm) and a 14:10 h light:dark photoperiod (68 µmol photons; 5% CO2 atmosphere during light phase). An initial cell density of 1 × 10⁵ cells/mL was used in all the tests. An experimental design with 8 initial replicates per concentration facilitated sacrificial sampling for nitrogen quantification on days 1, 2, 3, and 4, leaving 4 replicates for the final assessment on day 7. Positive and negative (abiotic) controls were performed using BG-11 medium with and without inoculation, respectively.
Following screening, post-AH liquors were tested in microplates and scaled up to 250 mL and 1 L flasks (150 and 650 mL working volumes, respectively), where total suspended solids (TSS) were also monitored to evaluate growth kinetics. 0.2–0.6 g/L TSS was used as inoculum. Flask experiments were performed in triplicate. Nitrogen removal rates (R; mg N/(L·day)) were calculated as follows:
R = C 0 C 7 t
where C0 and C7 represent nitrogen concentrations (mg/L) at day 0 and day 7, respectively, and t is the experimental duration (7 days).
These bioremediation experiments were executed using two distinct pure cultures: the freshwater species Scenedesmus obliquus and the marine species Nannochloropsis salina acclimated to brackish water (5‰ salinity). To evaluate the efficacy of complex microbial interactions against pure strain performance, a resilient freshwater consortium including single-cell and filamentous algae and cyanobacteria (comprising Scenedesmus spp., Chlorella sp., Chlorococcum sp., Coelastrum sp., Stigeoclonium sp., Dictyosphaerium sp., Ankistrodesmus sp., Ulothrix sp. and Oscillatoria sp.) as described in [17,22] was also employed as a bioremediation executor. This multi-species approach allowed for the assessment of taxonomic resilience and nutrient uptake kinetics across diverse aquatic environments.
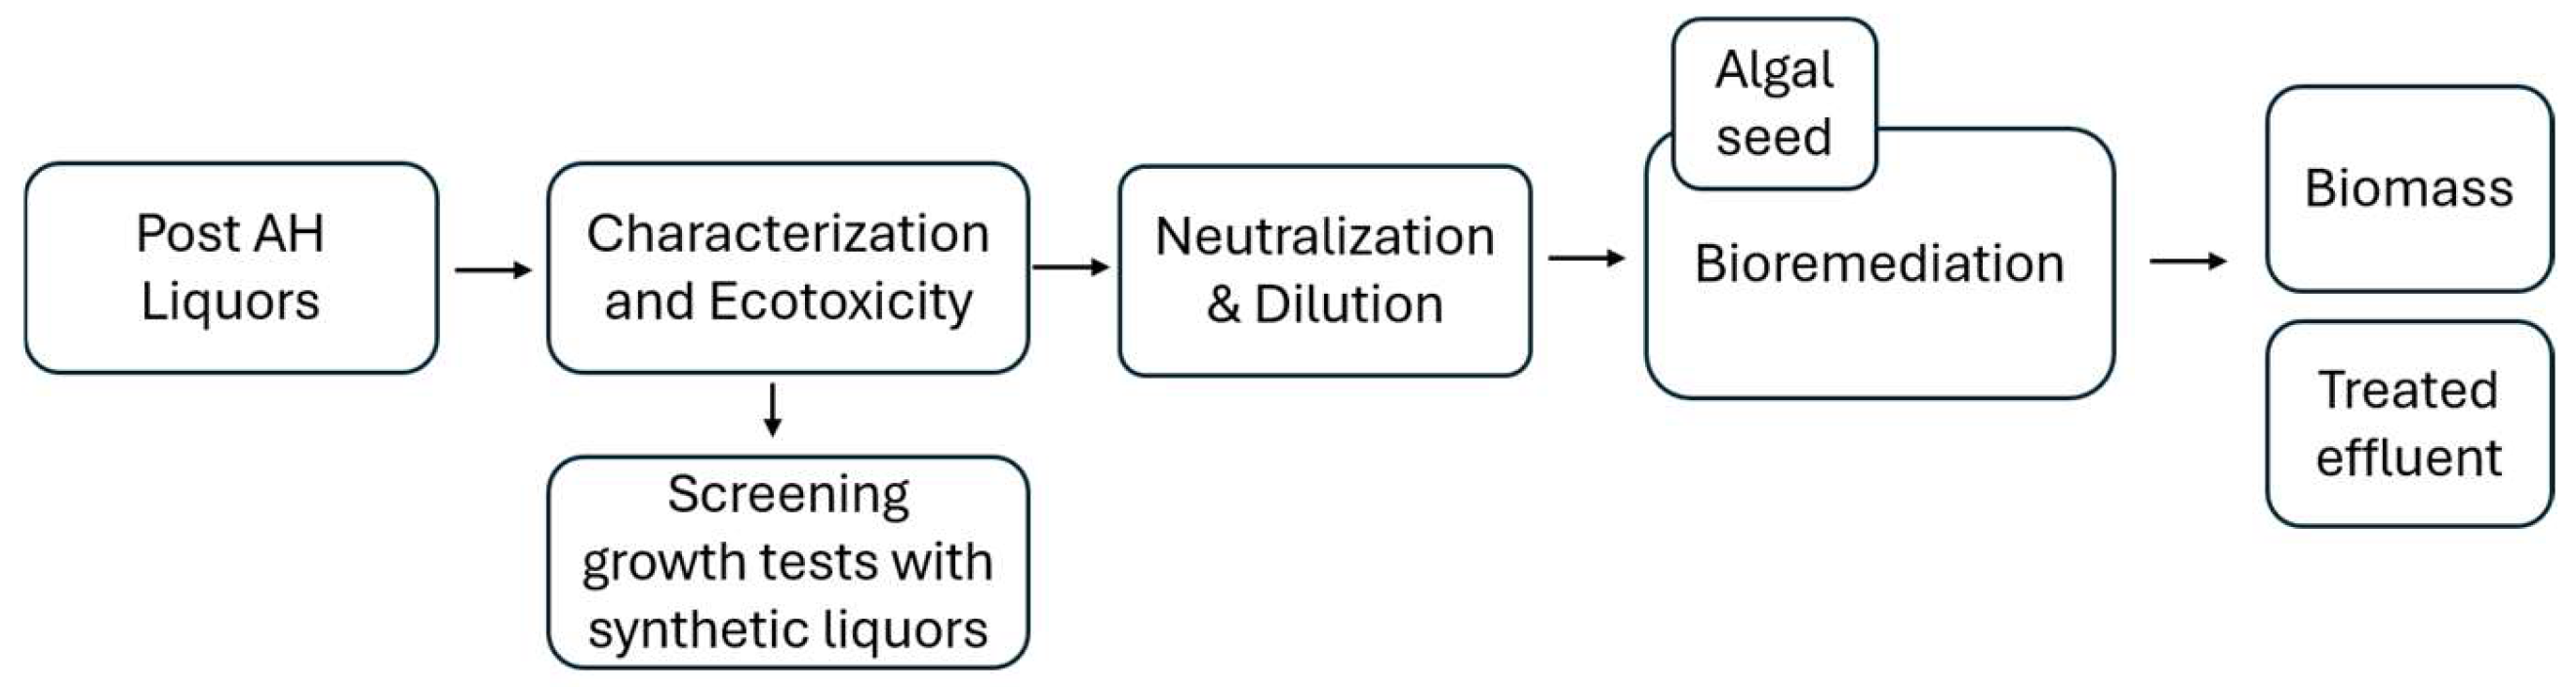
The experimental methodology performed in this study is presented in Figure 1.

2.4. Analytical Methodology

Nitrate (NO3) and nitrite (NO2) concentrations were quantified via ion chromatography (Dionex IonPac® AS16, Dionex, Sunnyvale, CA, USA, 4 mm × 250 mm with AG16 guard column, Dionex, Sunnyvale, CA, USA, 4 mm × 50 mm), and pH was measured using an Oakton® PC700 (Cole Palmer, Vernon Hills, IL, USA). Total organic carbon (TOC) was measured with a Tekmar Fusion UV-Persulfate TOC Analyzer (Teledyne Tekmar, Mason, OH, USA). Waters Micromass ZQ mass spectrometer equipped with an electrospray ionization source (Waters, Milford, MA, USA) was used to scan NC post-AH liquors. Dry biomass was determined by measuring the total suspended and volatile solids (TSS and VSS, respectively, in g/L) following the standard method APHA-AWWA-WEF 2540 D [23].
The graphical abstract was generated by using the author’s pictures and an artificial intelligence (AI) image generator and photo editor Nano Banana 2 (v3.1) (Google’s Gemini).

2.5. Statistics

Results are presented as mean ± standard deviation of four to eight replicates for microcosmos tests and three replicates for scale-up tests. Paired data were evaluated using Student’s t-test and analysis of variance to determine differences between the experimental treatments. Statistical significance was evaluated at an alpha level of α = 0.05. All statistical analyses were performed using Sigmaplot® Software version 14.0.

3. Results

3.1. Assessment of Post-Hydrolysis Liquors

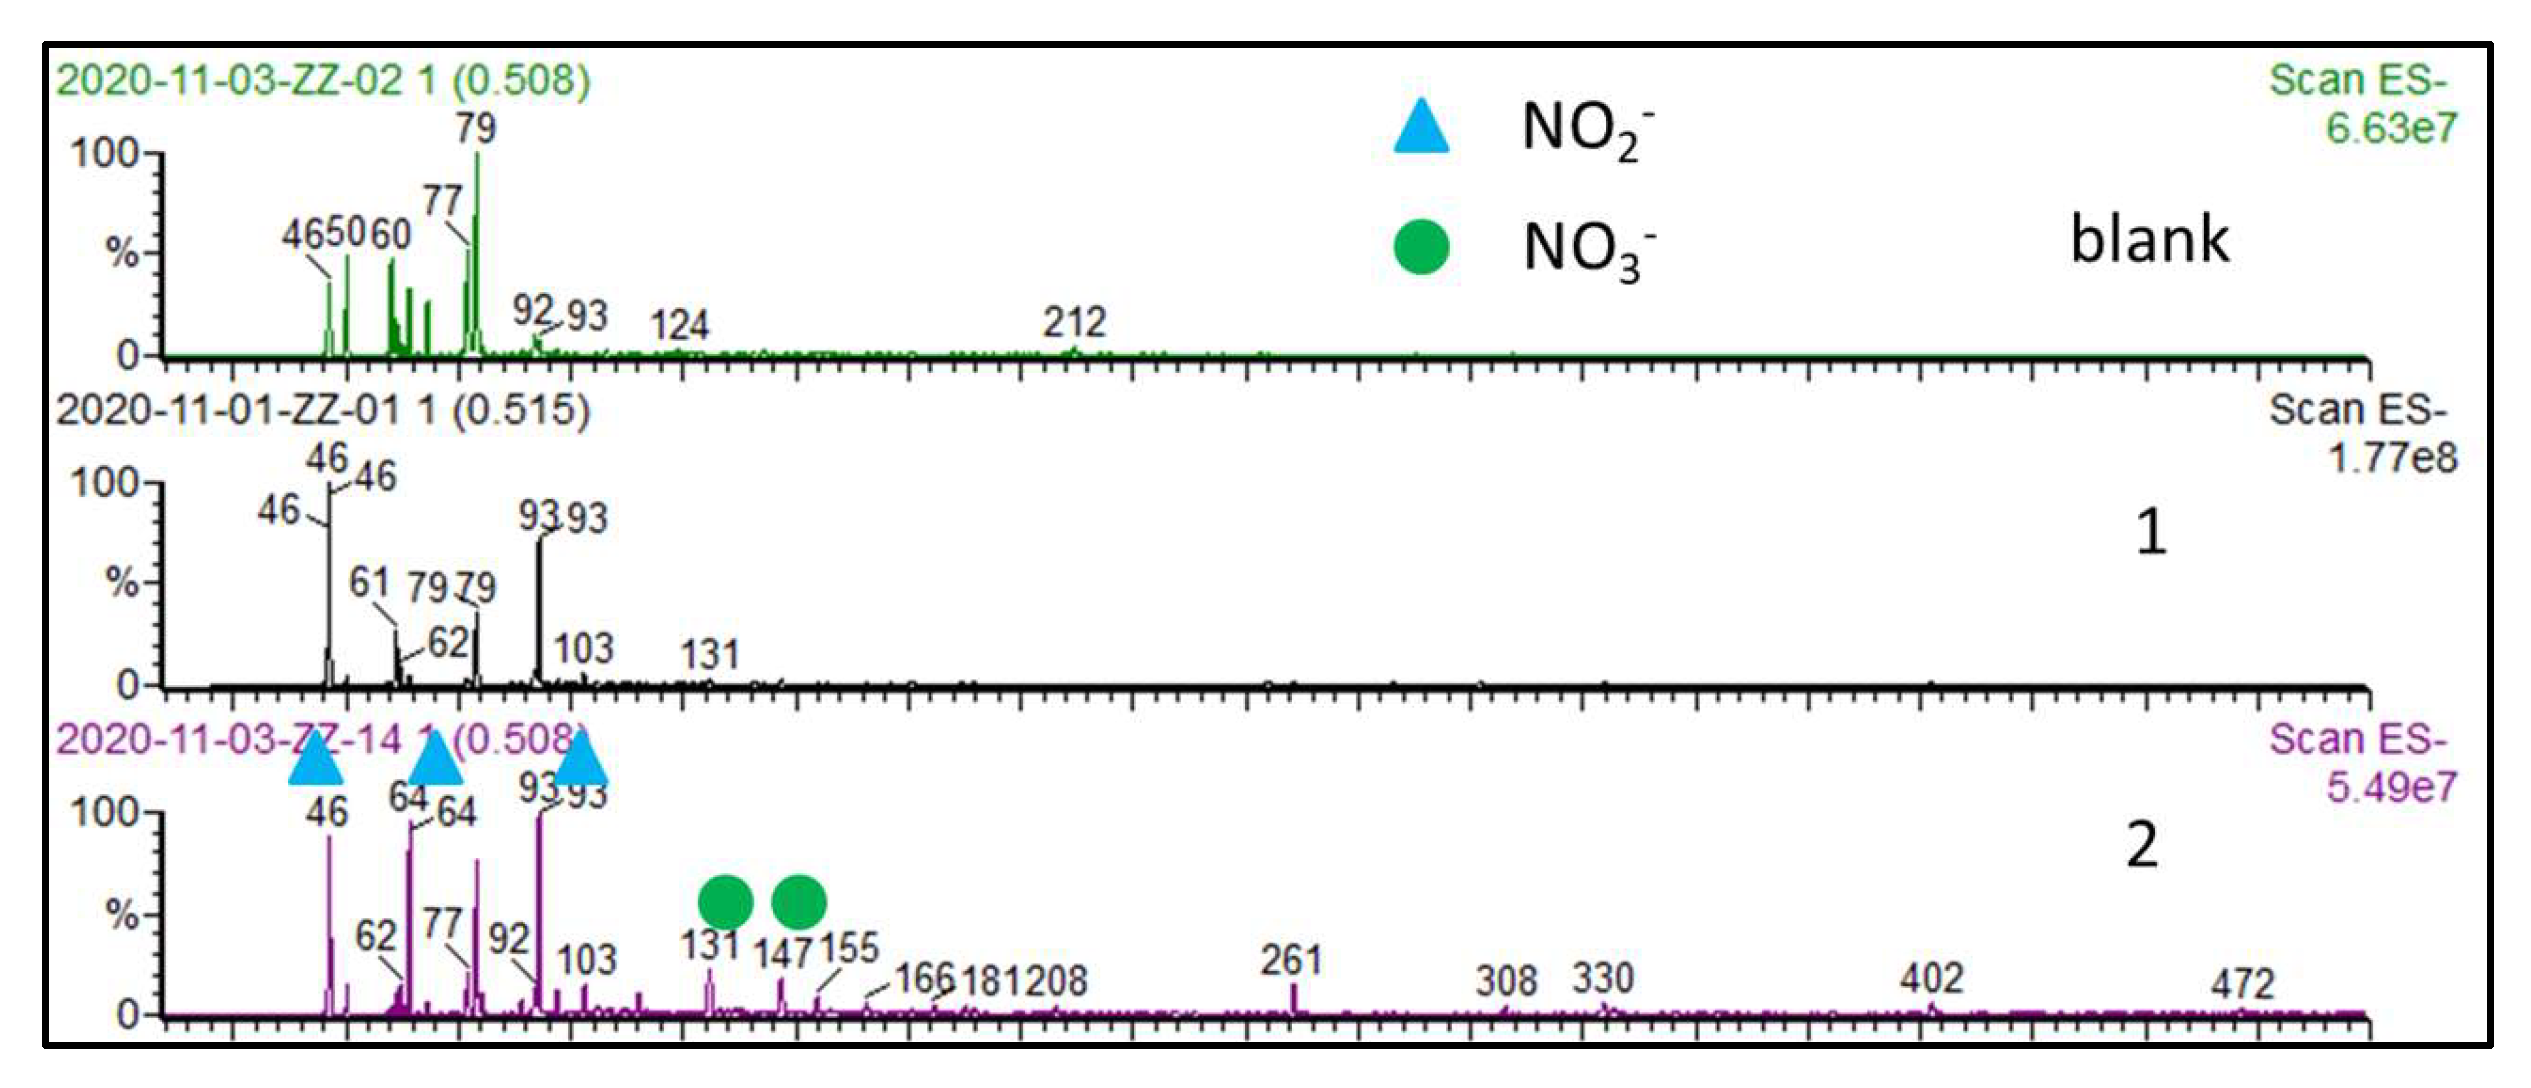
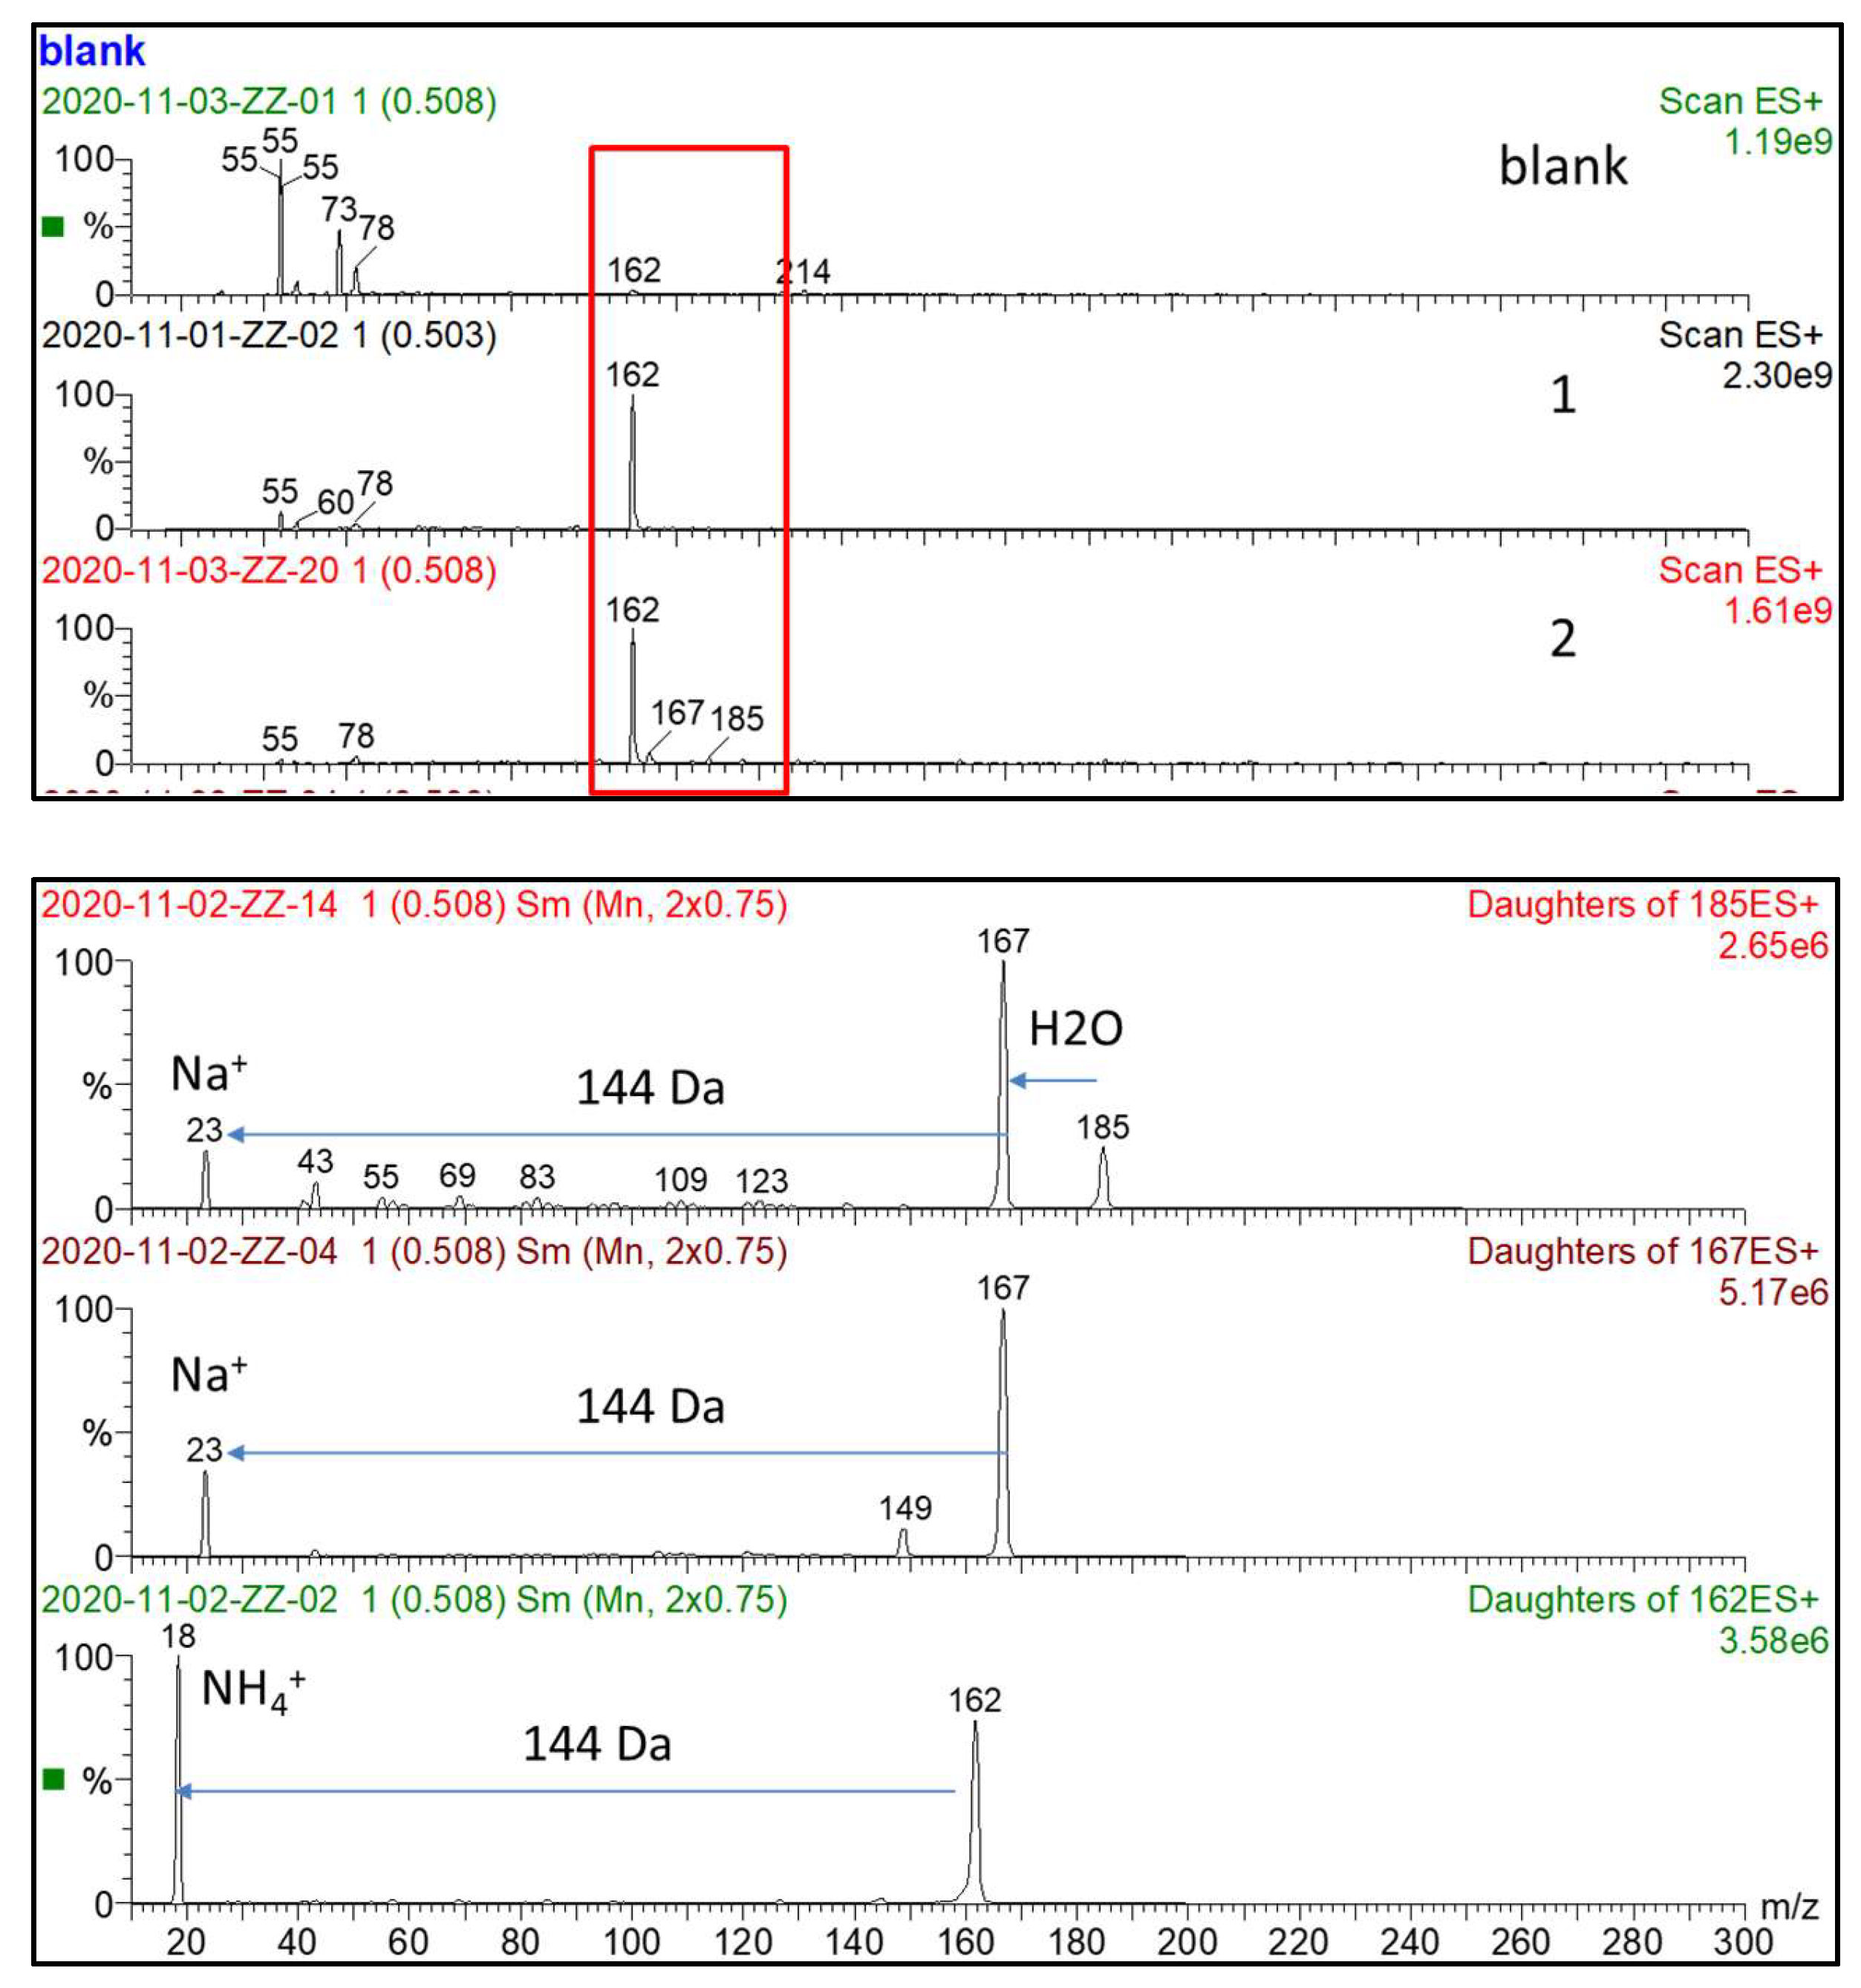
The chemical composition of the post-AH liquors is summarized in Table 1. The hydrolysis process typically yields NO2 and NO3 in a 3:1 ratio, with the resulting effluents characterized by an intense red/brown coloration as described by [5,6]. Moreover, other organic carbon compounds could be present due to incomplete mineralization (Table 1). Electrospray Ionization Mass Spectrometry (ESI-MS) results from NC post-AH liquors, Figure A1, confirmed the results. The basic pH (13) obtained was adjusted to 7 prior to toxicity assessments and growth tests.
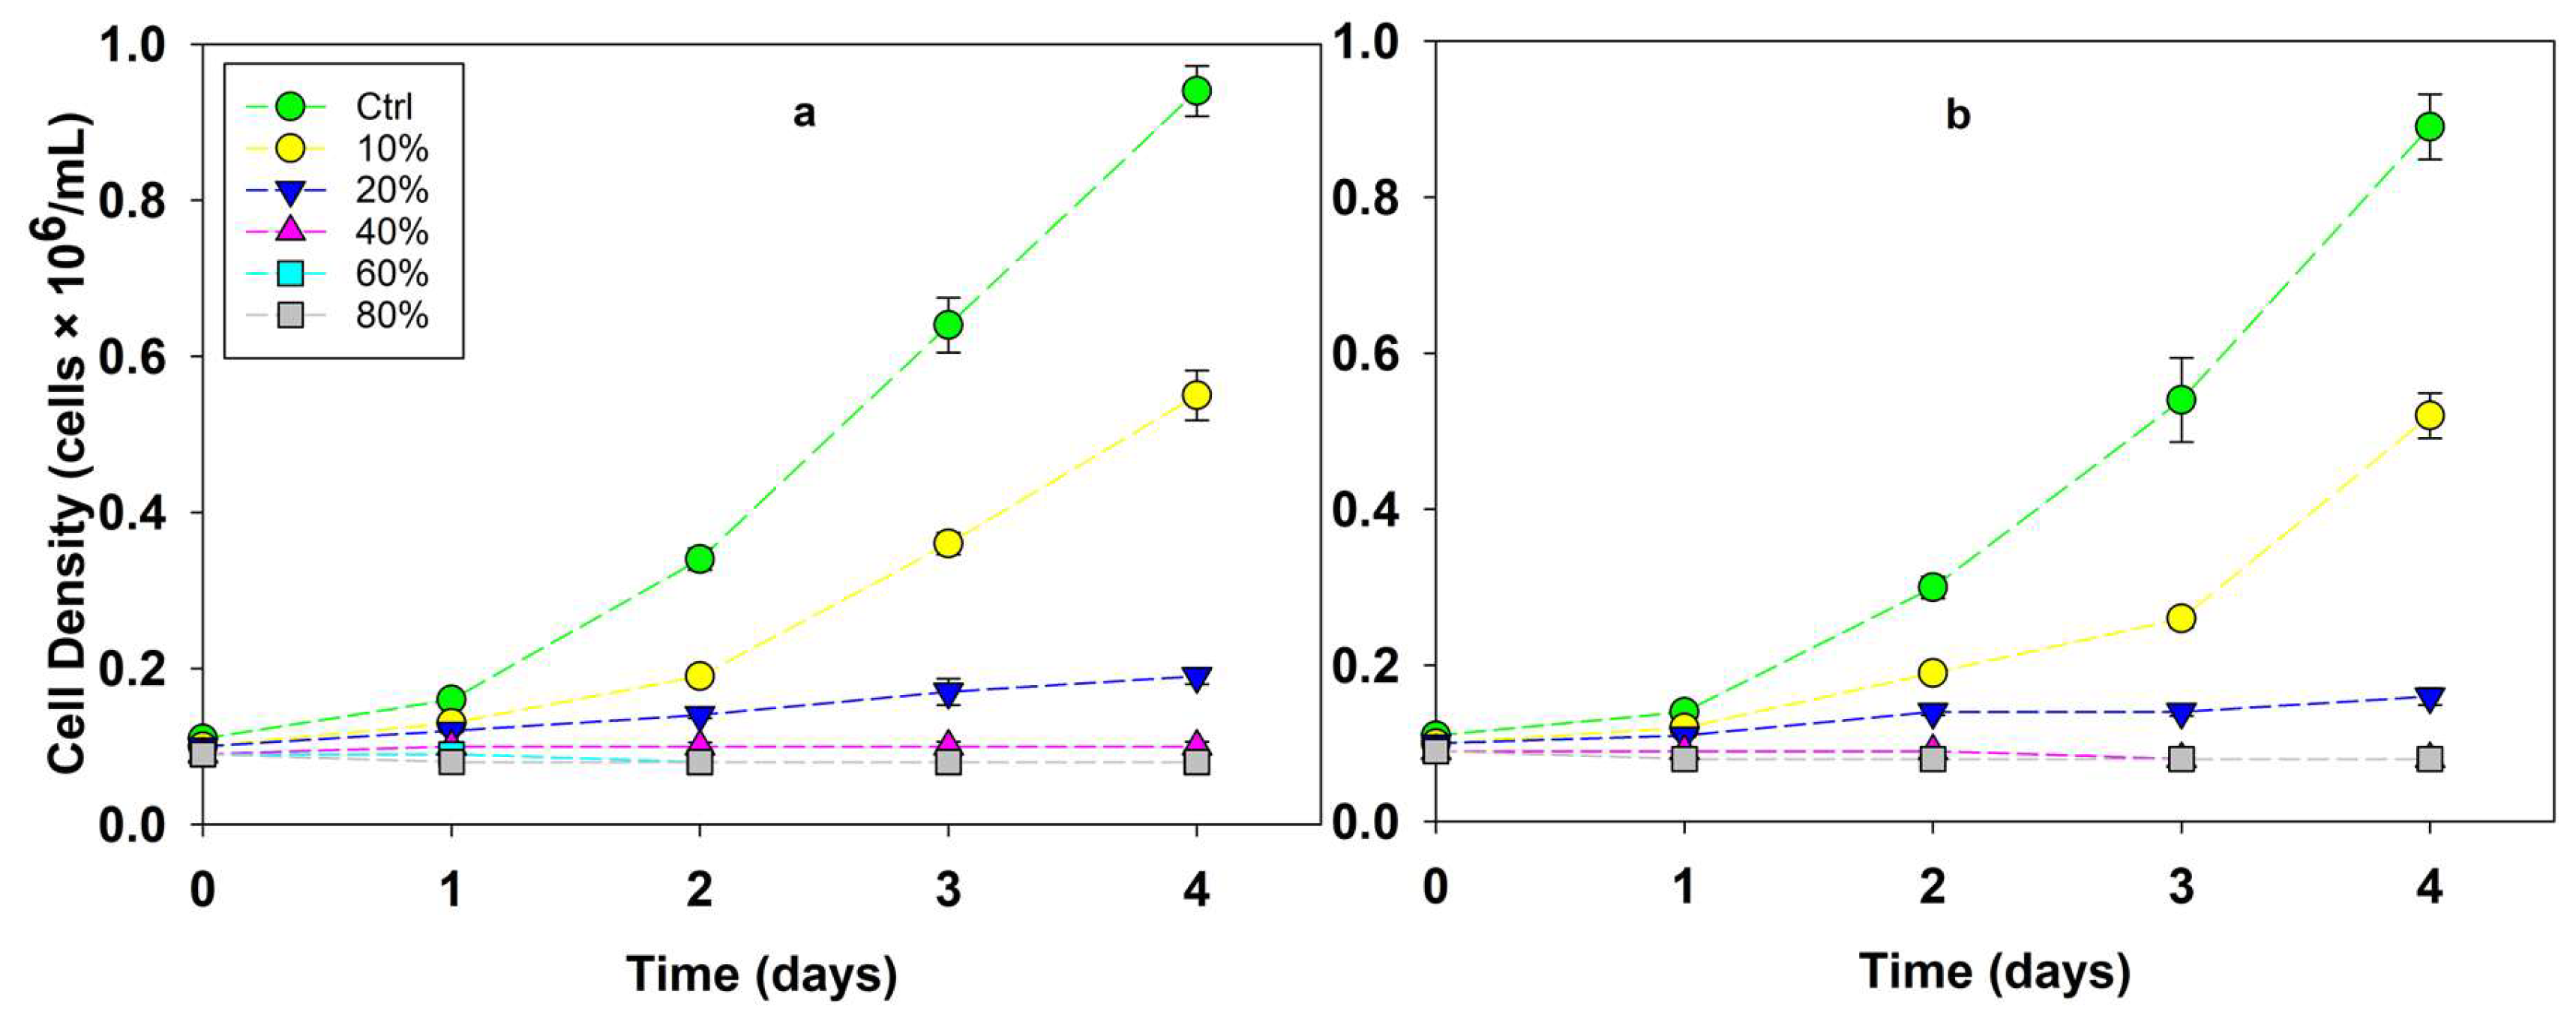
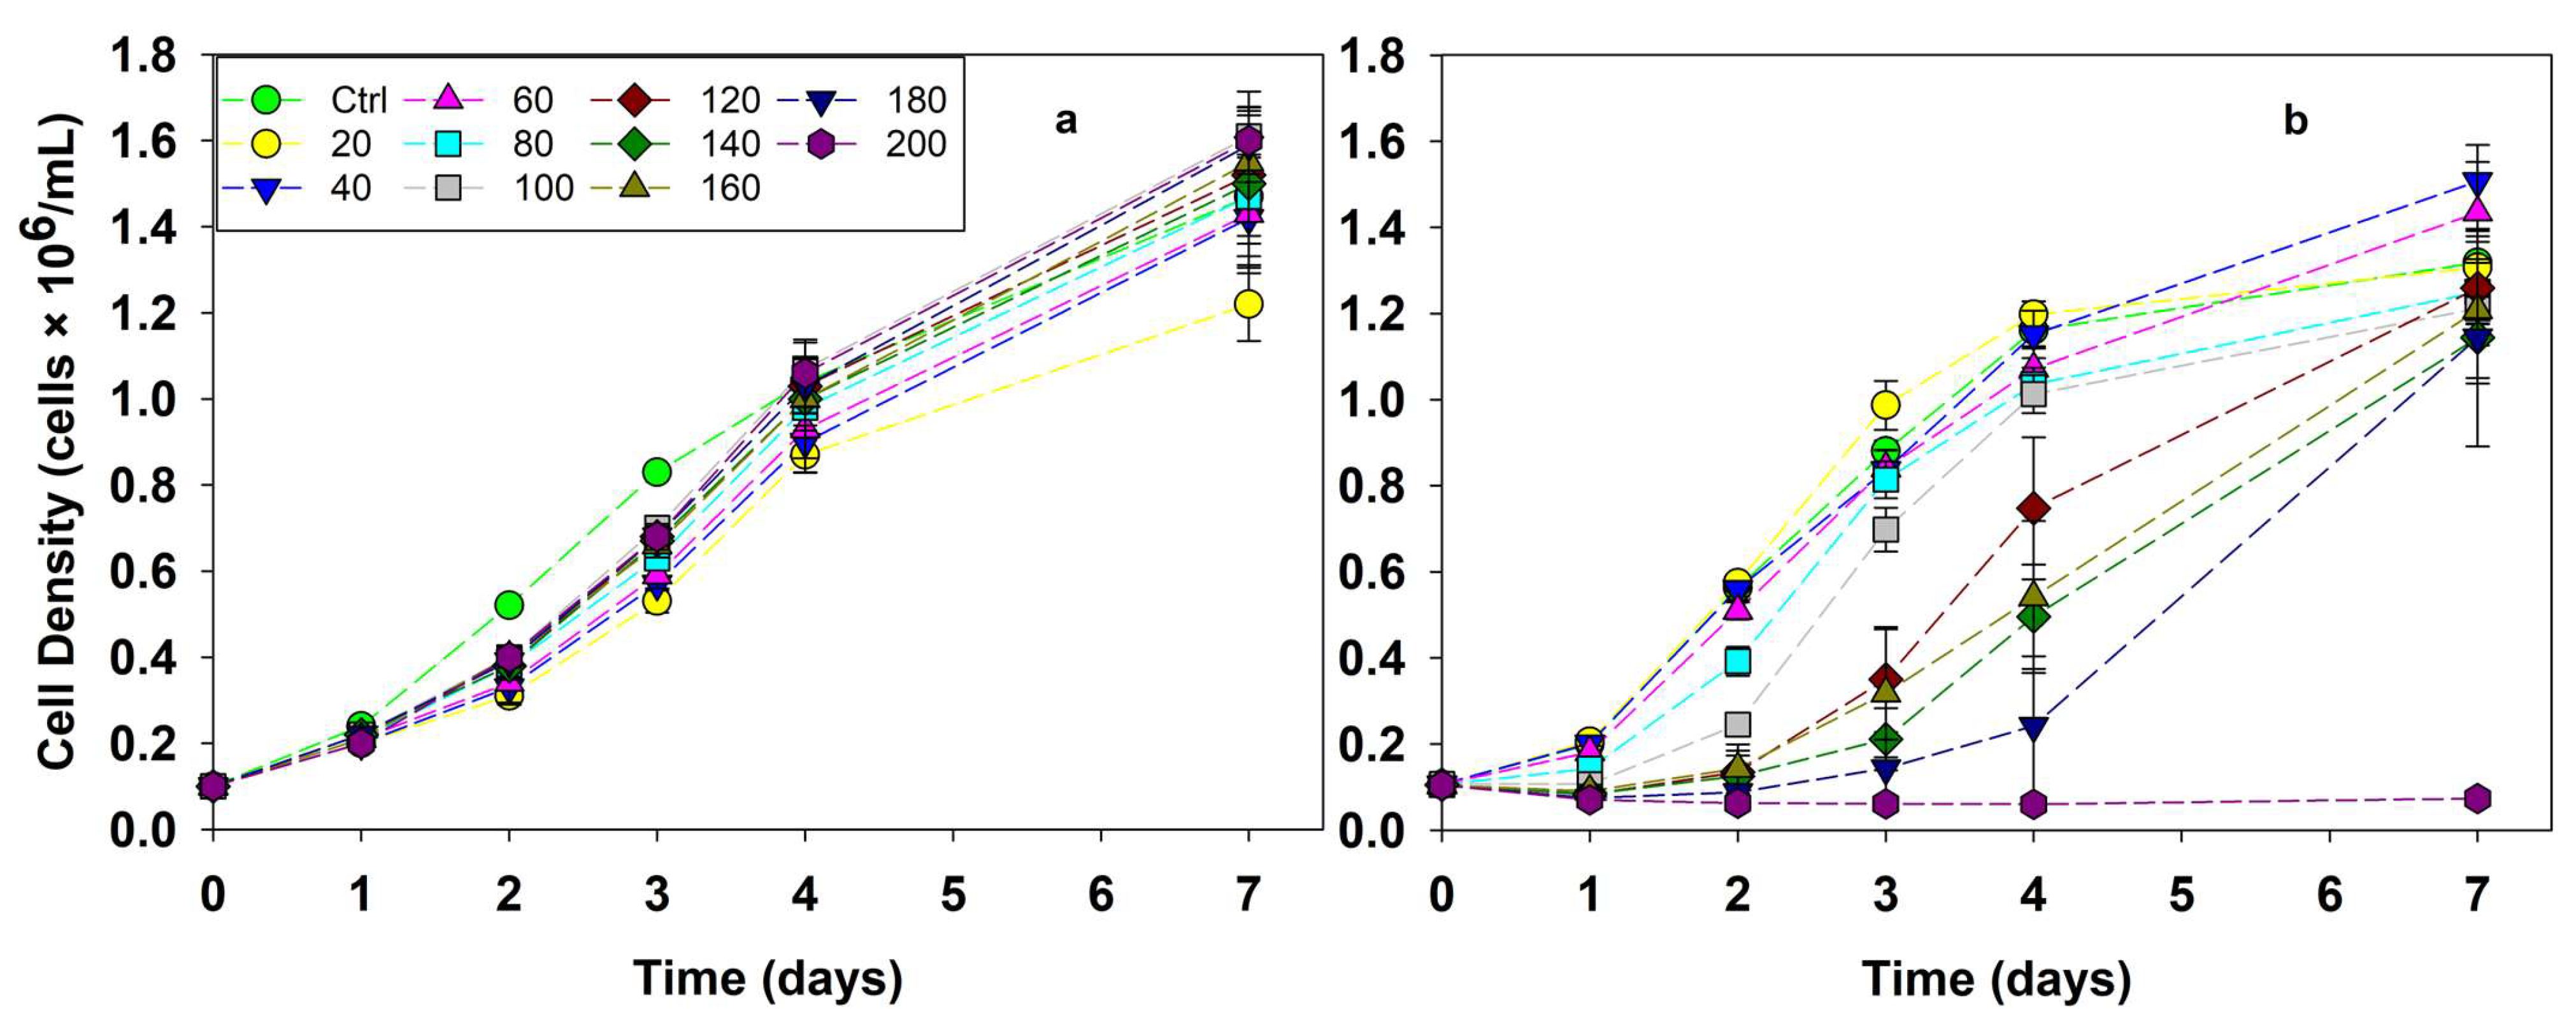
The algal toxicological assessment of NC post-AH liquors using S. obliquus is presented in Figure 2. Compared to unexposed controls, only the 10% (v/v) liquor amendment allowed algal growth, while higher concentrations resulted in complete cessation of biomass production. Specifically, the 10% amendment (around 240–270 mg NO2-N/L and 100 mg NO3-N/L) resulted in growth rate inhibition of 30% for liquors obtained from NC-p and 40% for NC-w.
Regarding the Microtox® bioluminescence assay, liquors derived from AH of NC-p exhibited a 15-min EC50 of 399 mg NO2-N/L (95% Confidence Interval, CI: 370–429) and 146 mg NO3-N/L (95% CI:135–157) (R2 = 0.99481), while liquors obtained after AH of NC-w showed a comparable 15-min EC50 of 331 mg NO2-N/L (95% CI: 277–397) and mg 133 NO3-N/L (95% CI:111–160) (R2 = 0.9724). The narrow range between the values obtained for toxicity assessments of NC-p and NC-w liquors indicates that the source of the NC fines (pure vs. wastewater-recovered) does not significantly alter the acute chemical toxicity of the resulting hydrolysis liquor.

3.2. Toxicity Assessment of Nitrogen Species

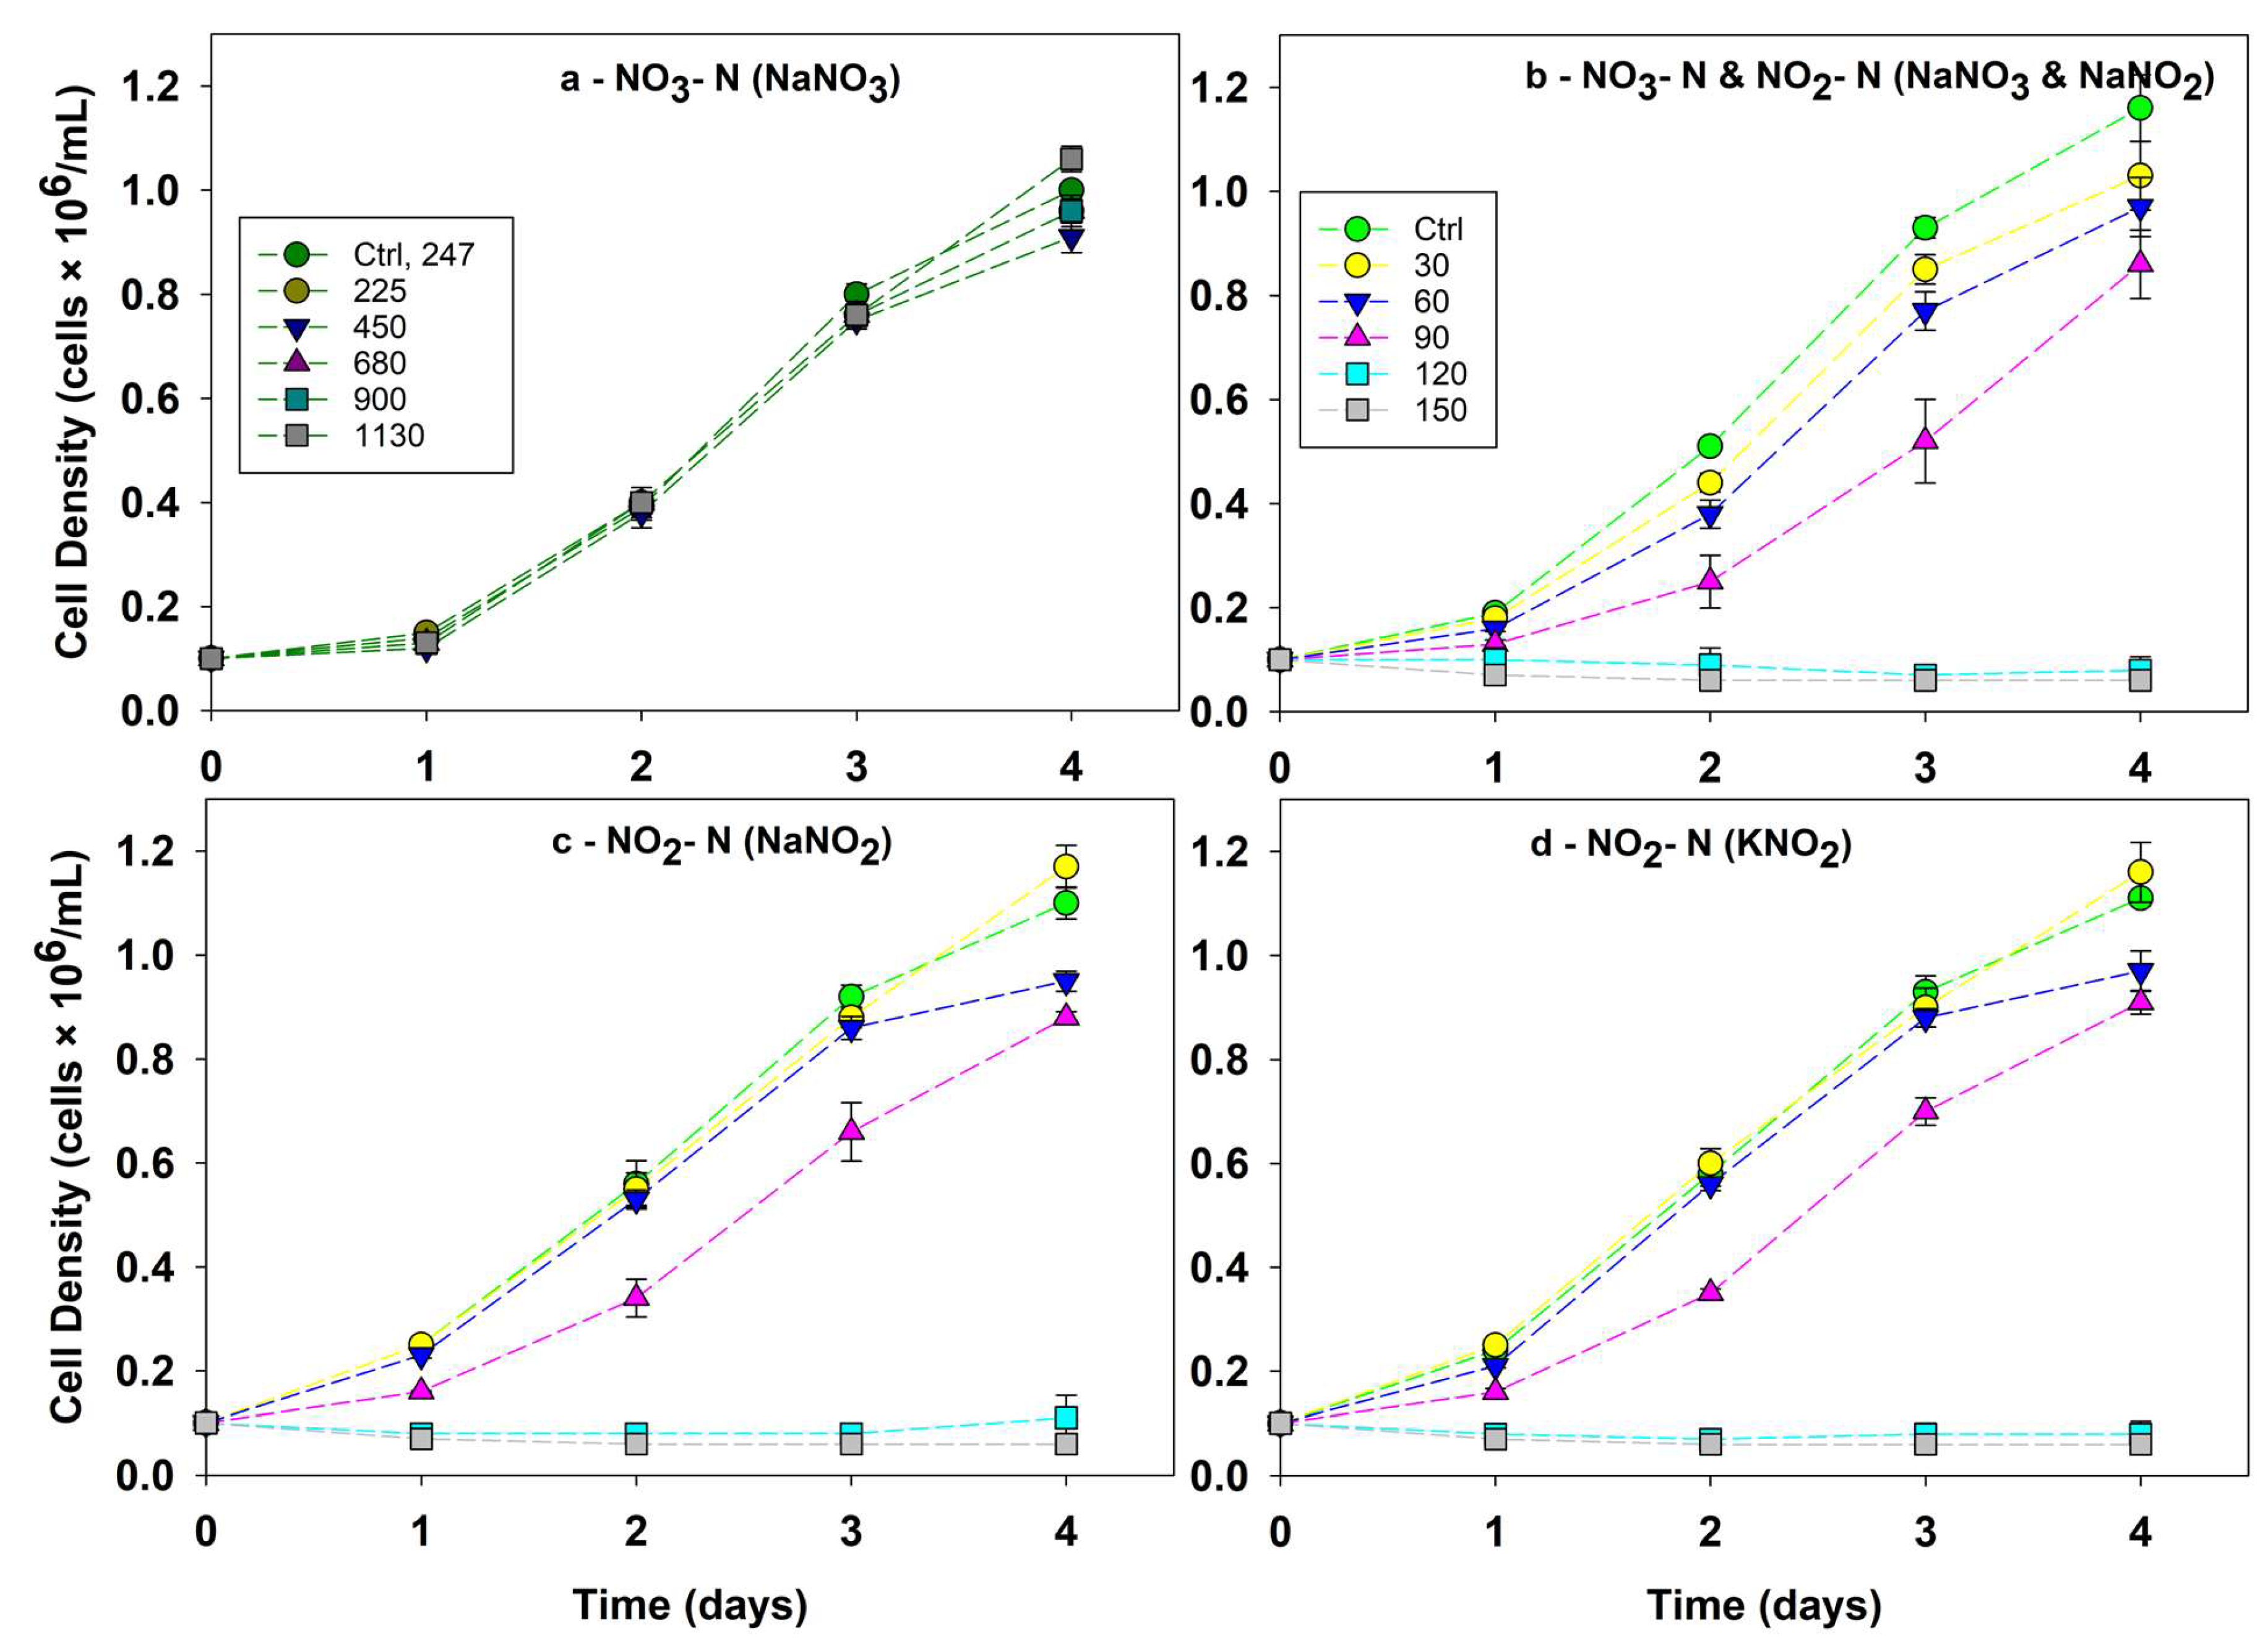
To elucidate the specific chemical drivers of toxicity, growth assays were performed on individual and combined nitrogen species. S. obliquus displayed high tolerance to nitrate, maintaining robust growth at concentrations up to 1130 mg N/L (Figure 3a) and 1858 mg Na+/L (Table 2). In contrast, nitrite was identified as the primary toxicant. To confirm that this effect was driven by the nitrite anion rather than associated cations, sodium nitrite and potassium nitrite were tested separately (Figure 3c,d). Both salts produced comparable inhibition levels (16% and 12% for Na+ and K+, respectively, p = 0.160), ruling out cation interference (Table 2). Interestingly, the combination of these nitrogen species and sodium (Figure 3b) resulted in a higher growth inhibition of 25% compared to the 12–16% observed with nitrite alone. A paired t-test of the underlying growth data confirmed that this increase in inhibition was statistically significant, with the mixture yielding lower cell densities than pure NaNO2 (one-tailed p = 0.047). This suggests that while nitrate does not cause toxicity on its own at these concentrations, its presence in a mixed stream may compound the inhibitory effect of nitrite.

3.3. Nitrogen Removal Dynamics in Suspended Algal Systems

After determining the main drivers for toxicity, synthetic liquors mimicking the N species concentration obtained in NC post-AH liquors were prepared as described in Section 2.3 and tested.
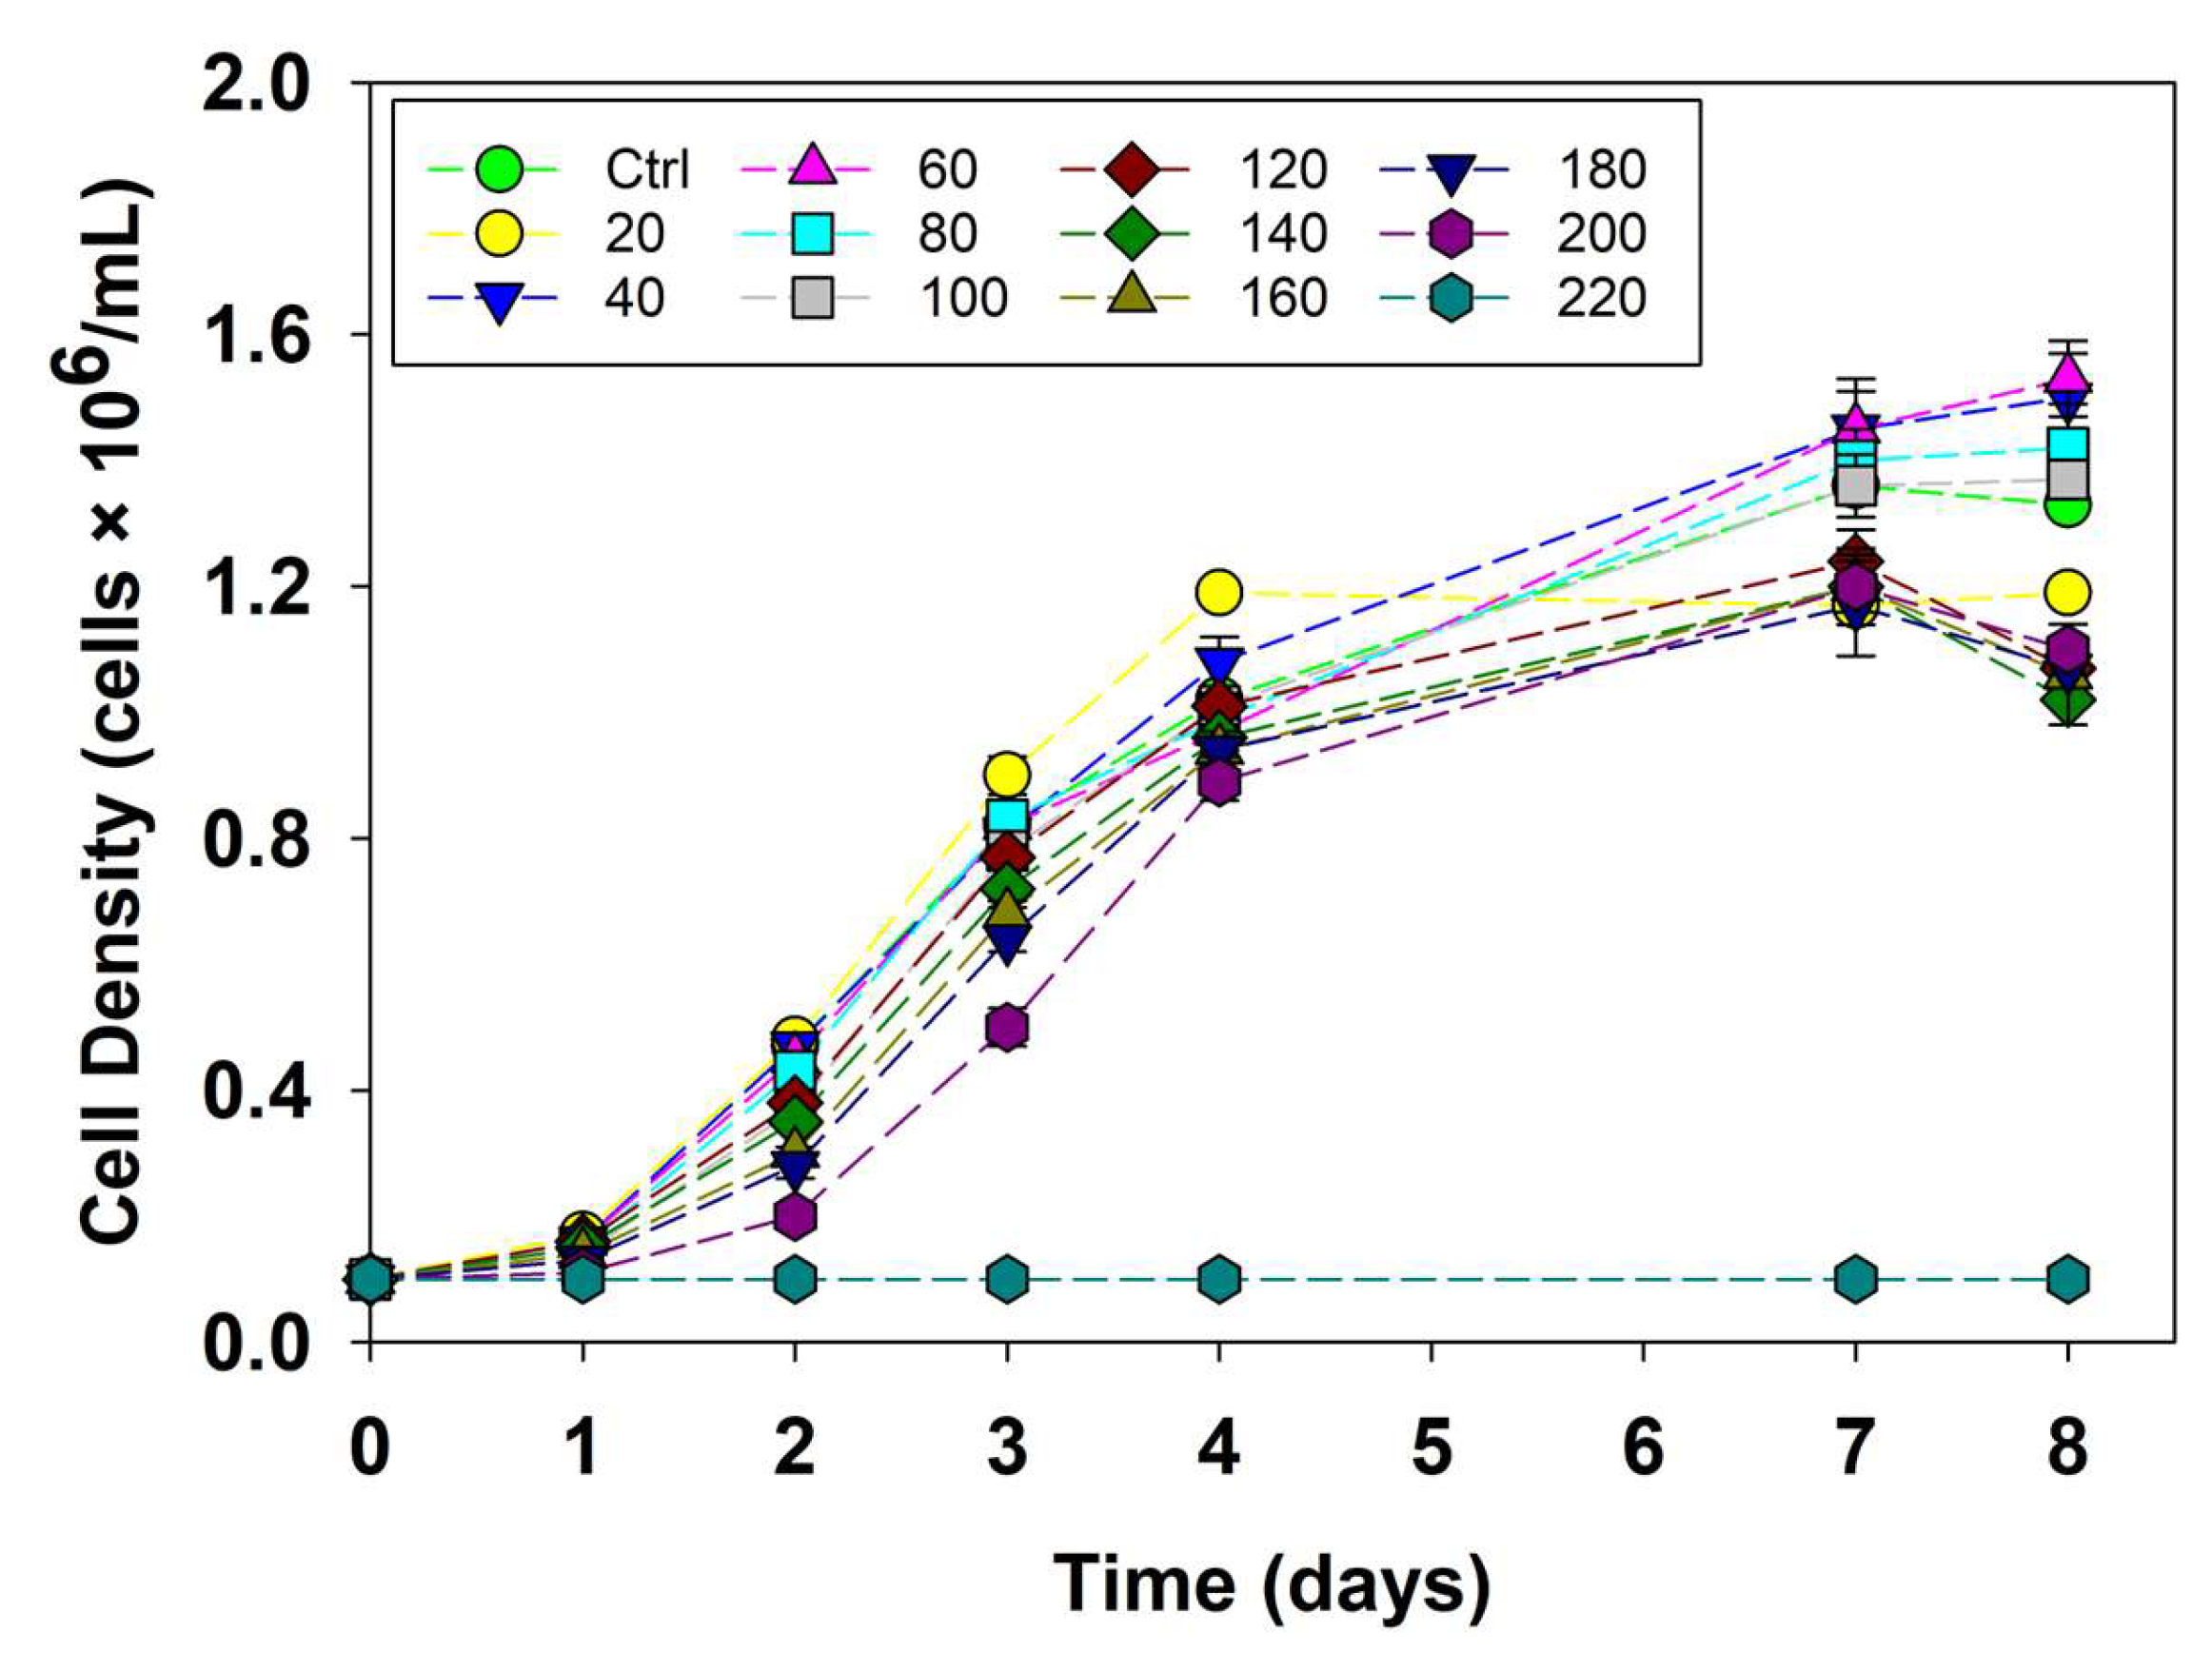
Screening of S. obliquus growth and nitrogen uptake was performed using synthetic liquors. Table 3 summarizes the initial concentrations of total nitrogen (TN), NO3-N, and NO2-N, alongside corresponding specific growth rates and nitrogen removal rates. Testing was capped at 300 mg/L TN, as concentrations exceeding 200 mg/L induced significant toxicity.
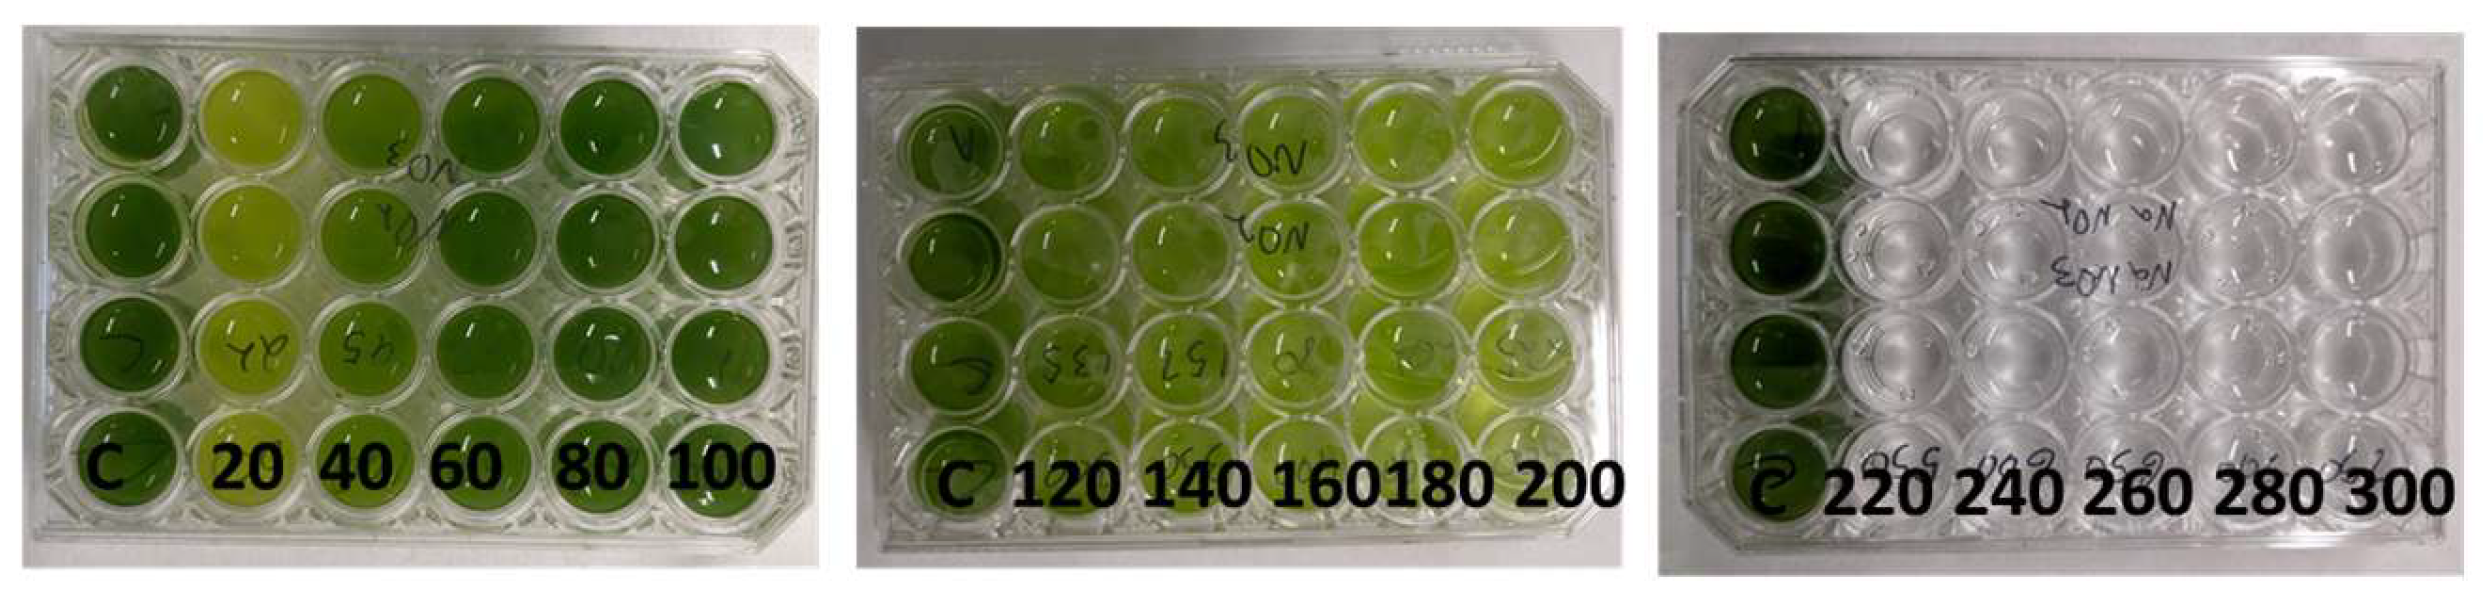
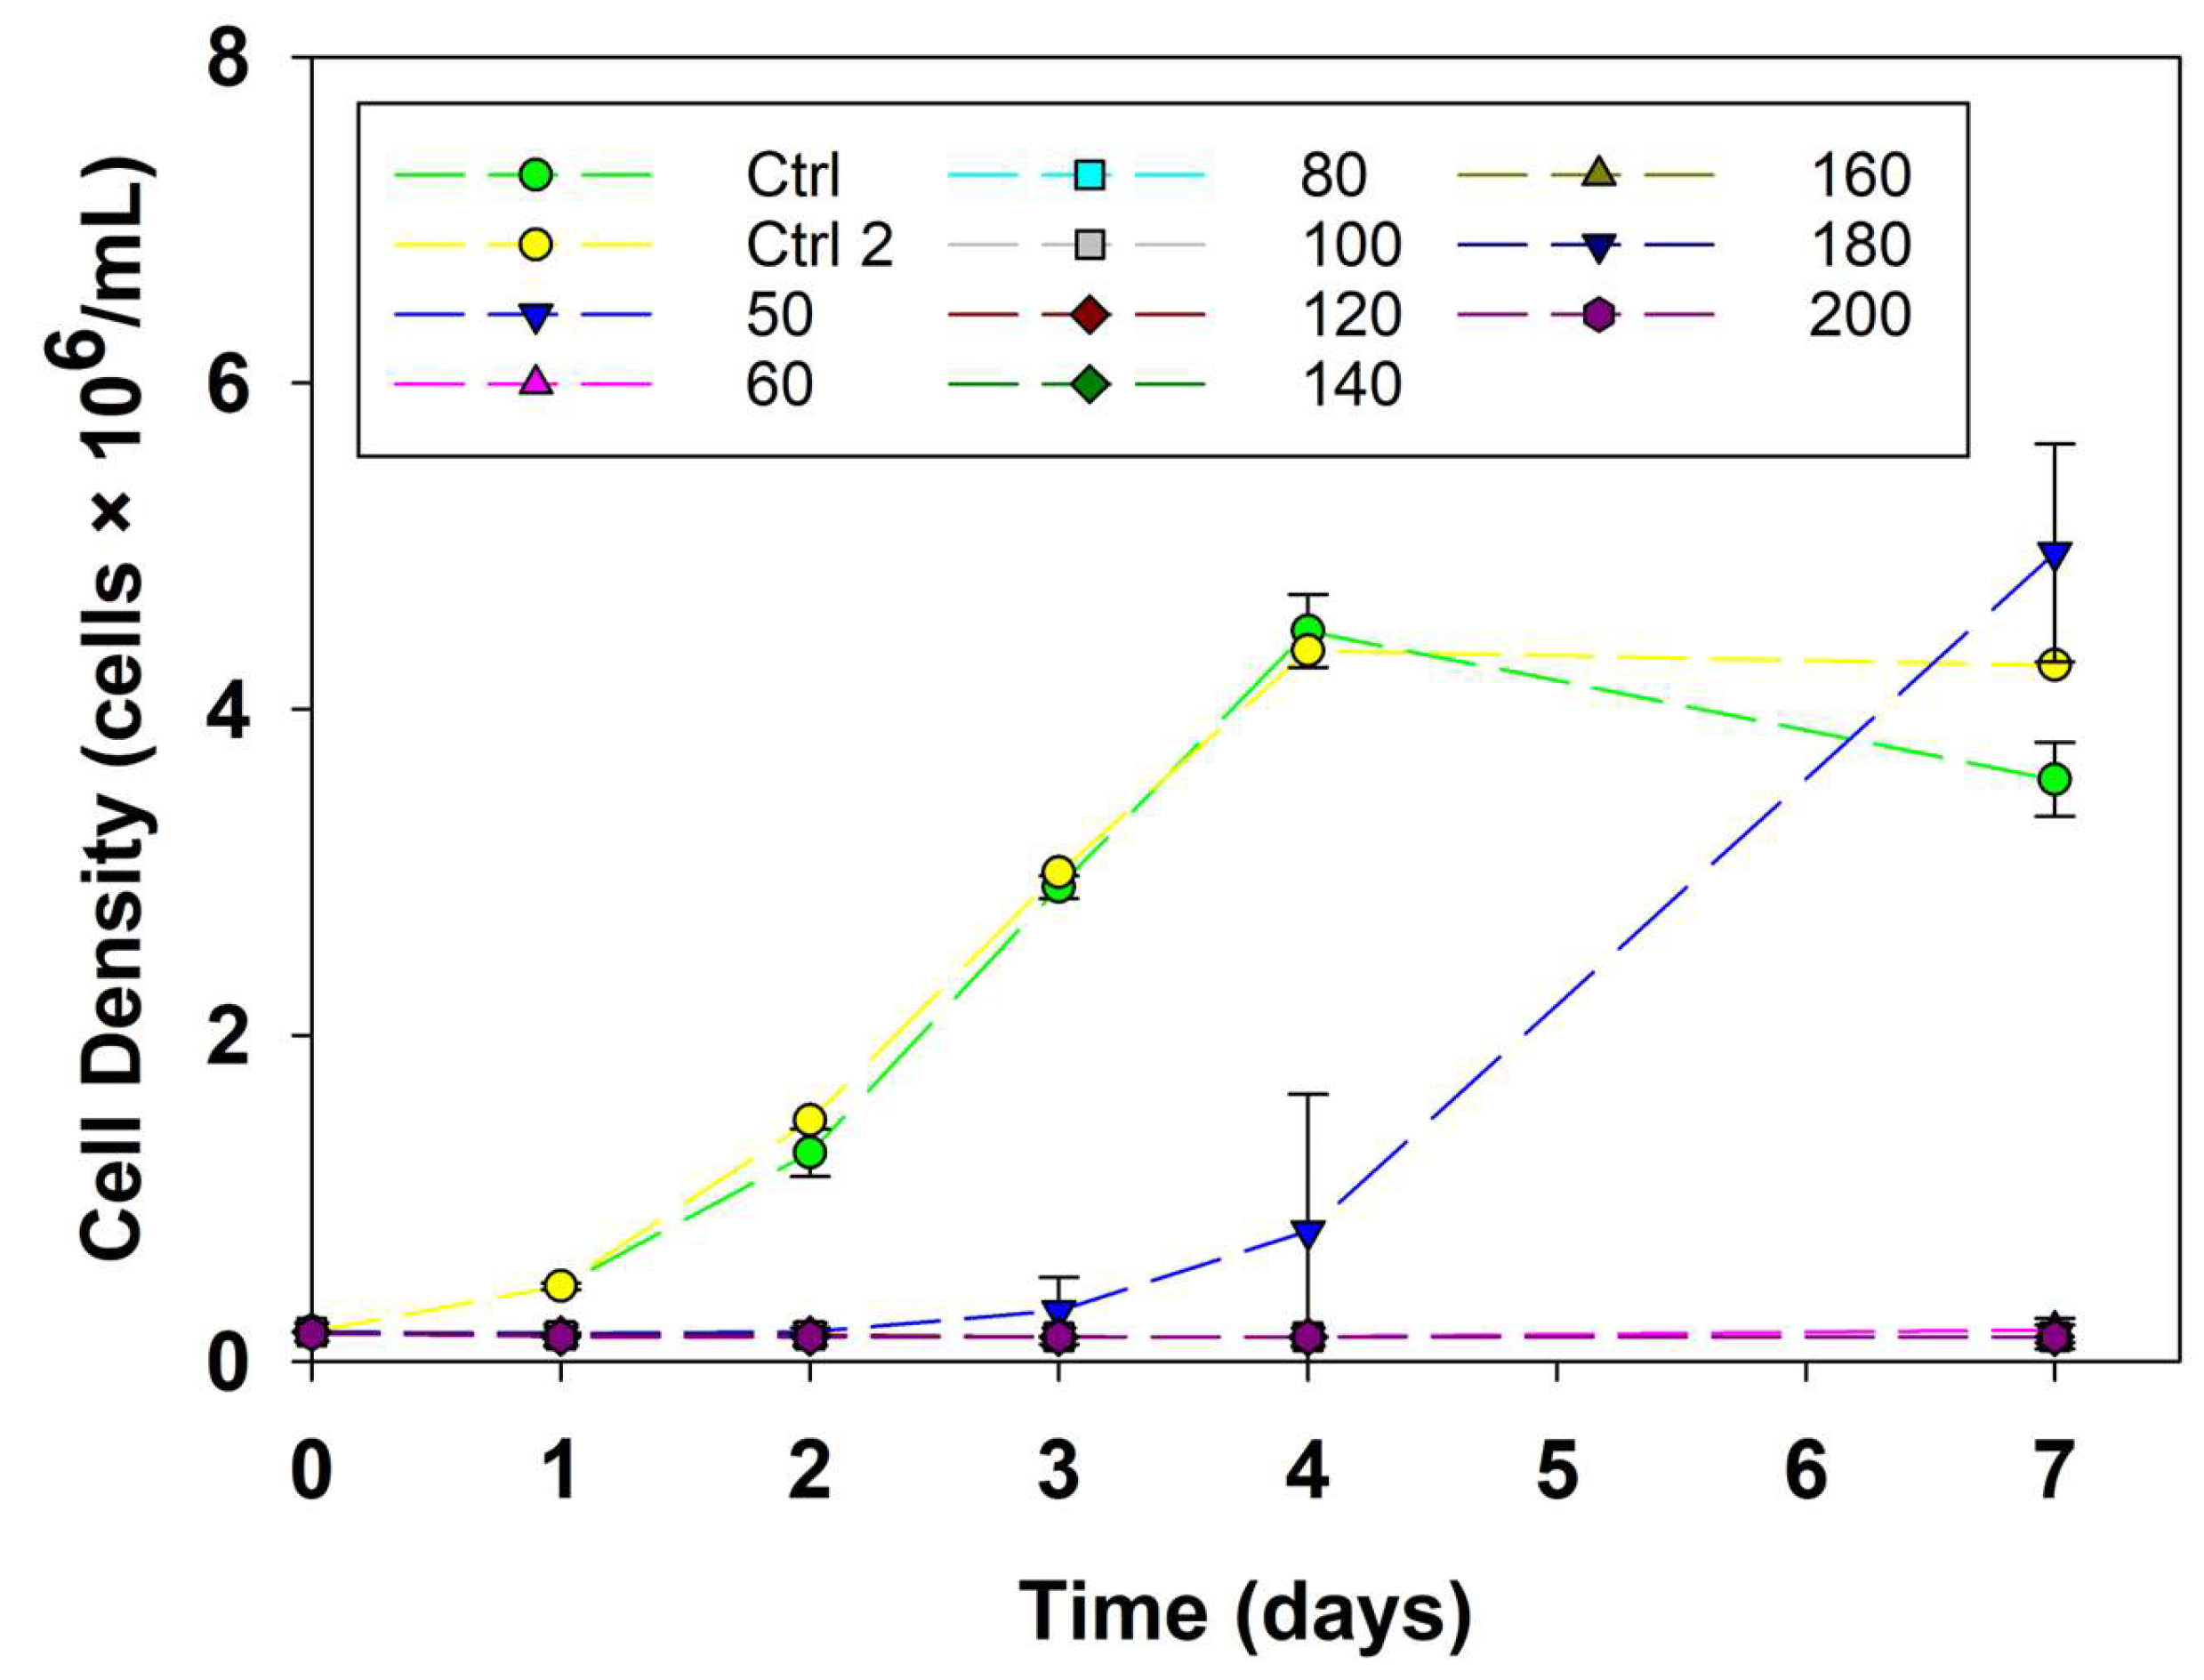
Microalgae growth followed standard batch kinetics characterized by distinct lag, exponential, linear, and stationary phases (Figure 4), with the duration and slope of these phases being highly dependent on the initial nitrogen loading. Color development at the conclusion of the trial correlated strongly with both biomass density and nitrogen depletion levels (Figure A2). A dynamic balance between CO2 acidification (5% during light hours) and biological nitrogen uptake self-stabilized the culture pH at 7.0. Nitrogen uptake patterns varied significantly across the tested species (Table 3), revealing critical relationships between concentration and metabolic activity. Specifically, maximal uptake and sustained growth were observed in treatments where nitrite-N concentrations remained below the inhibitory threshold of 60–90 mg/L. By day 7, all experimental mixtures achieved a minimum of 50% TN removal. For an initial TN concentration greater than 100 mg/L, algae can remove 60% of TN in 7 days, whereas for concentrations less than or equal to 100 mg/L, algae N removal efficiency exceeds 90% in 7 days.
Furthermore, analysis of nitrogen species suggested a substrate preference, characterized by a preferential and accelerated removal of NO2-N relative to NO3-N throughout the cultivation period (Table 3).
Moreover, the marine strain Nannochloropsis salina was also evaluated using Guillard’s F/2 medium (Figure A3). Two independent trials using fresh stock solutions yielded consistent results, demonstrating that N. salina exhibits poor tolerance to nitrite as a nitrogen source across all tested concentrations (50 to 220 mg N/L; following a 3:1 ratio for NO2-N:NO3-N).

3.4. Assessment of Nitrogen Removal Rates

To enhance N uptake kinetics, several physicochemical parameters and biological factors, including pH, carbon source, strain acclimation, and N:P ratios, were evaluated.

3.4.1. Influence of pH and Buffer Systems

The pH was successfully maintained at 8.0 by using a carbonate/bicarbonate buffer system. However, supplemental inorganic carbon failed to significantly enhance biomass yields or nitrogen removal efficiencies (Figure 5a and Table 4, row b).

3.4.2. Mixotrophic Growth and Strain Acclimation

The transition from autotrophic to mixotrophic metabolism was evaluated using glycerol (16 g/L) and sodium acetate (3 g/L) as described in the literature [24]. Although both organic carbon sources supported robust S. obliquus growth, neither significantly improved N uptake rates.
Similarly, a strain acclimated to NO2-N over a five-week period showed no competitive advantage in nitrogen removal efficiency compared to the non-acclimated parent strain (Table 4, row e).

3.4.3. Nitrogen:Phosphorus Ratios

Two additional fixed N:P ratios (15:1 and 5:1) were evaluated and compared against a baseline experiment conducted at pH 7 (Table 3), in which the N:P ratio was not controlled (ratio was variable depending on the N added; N:P ranging from 5 to 30). These specific ratios were selected to determine whether increased phosphorus availability enhances microbial nitrogen uptake effectively, assessing whether phosphorus serves as a limiting factor for nitrogen removal. Results demonstrated that biomass and TN removal rates did not improve, even in the presence of excess P (Table 4, row c and d).

3.5. Scale-Up and Performance in Post-AH Liquors

To validate findings from synthetic liquors, pure S. obliquus and a freshwater microalgae consortium were cultivated in post-AH liquors as described in Section 2.3, using flasks with working volumes of 150 mL. Based on previous toxicity thresholds, NC-w liquors were diluted 20-fold and 25-fold, respectively, to achieve initial concentrations of approximately 160 and 120 mg/L TN, respectively (3:1 NO2-N to NO3-N ratio).
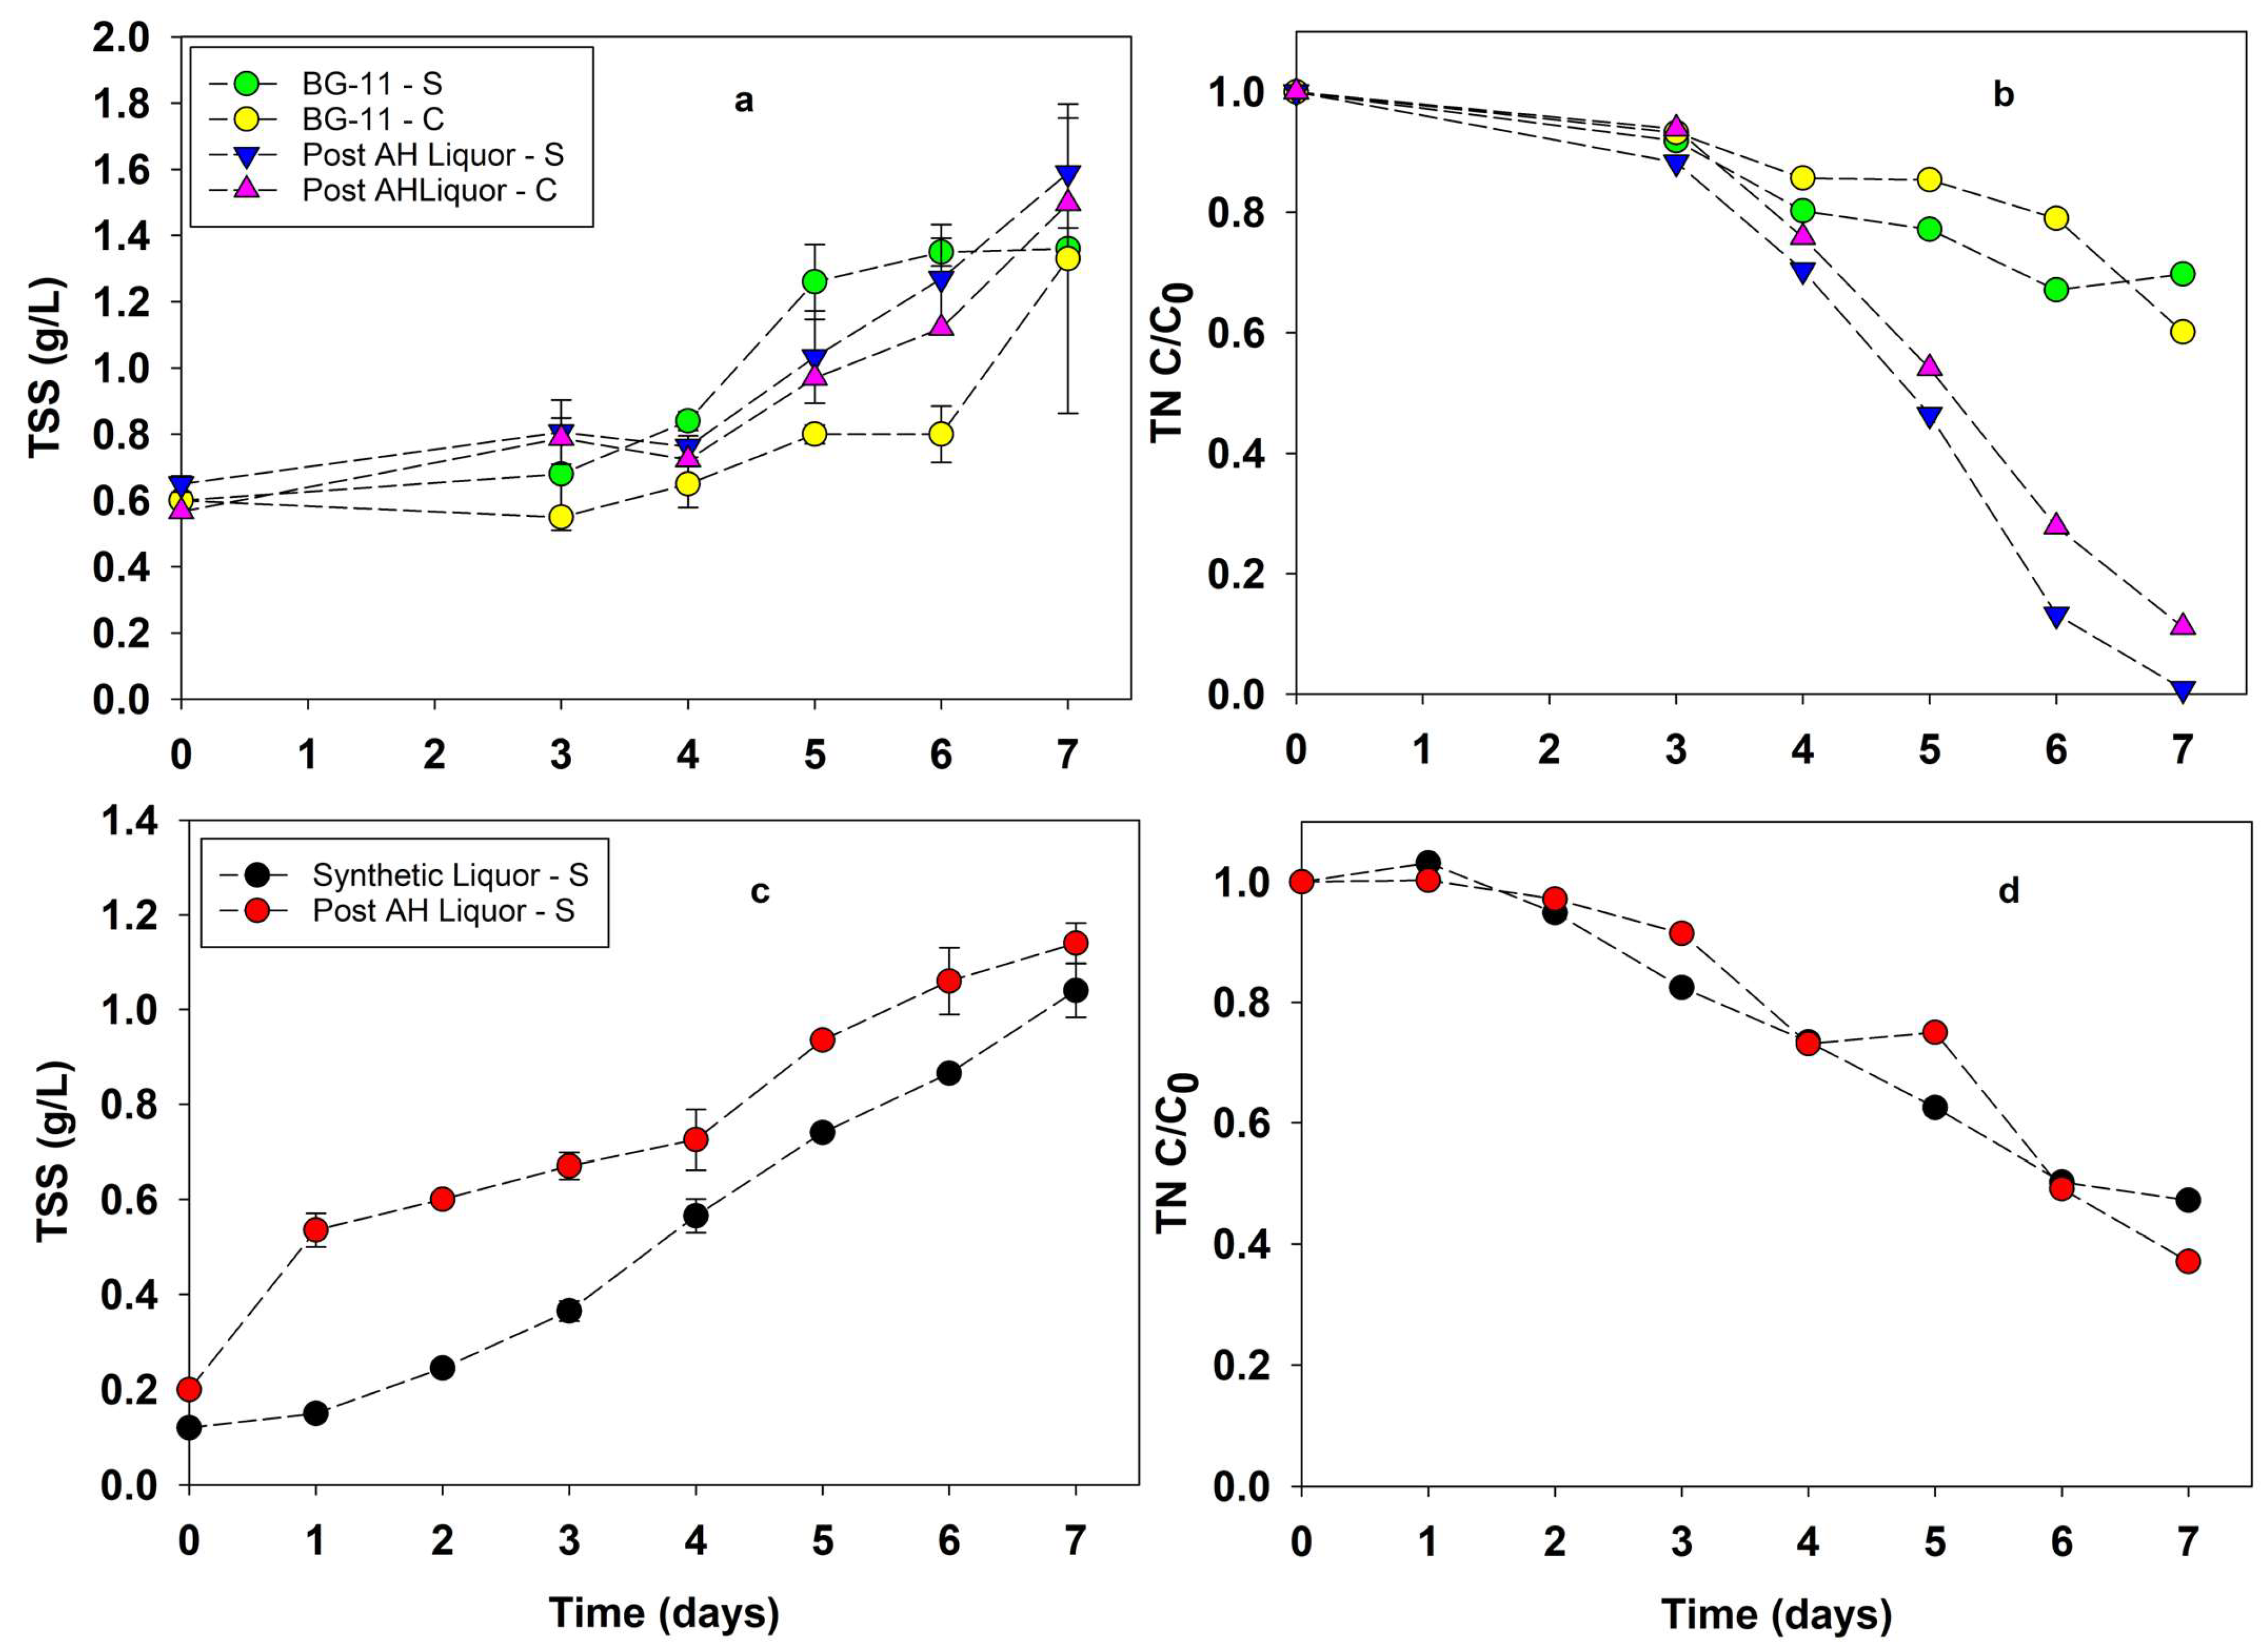
In these experiments, both S. obliquus and the consortium exhibited robust growth at a reduced initial TN concentration. As illustrated in Figure 6a, the growth profiles for both experimental groups were statistically similar to their respective BG-11 controls (t (10) = 0.018, p = 0.986 and t (10) = 0.872, p = 0.404 for S. obliquus and consortium, respectively), indicating no significant inhibition by the liquor components. The increased working volume facilitated the measurement of TSS to accurately quantify biomass productivity. Biomass productivity for S. obliquus was 0.23 g/(L·day) compared to 0.19 for its control, while for the consortium biomass productivity achieved 0.21 g/(L·day) in comparison with 0.19 g/(L·day) for its control.
By day 7, nitrogen was completely exhausted in both cultures (Figure 6b). To assess the nitrogen mass balance, abiotic controls (without biomass inoculation) with nitrogen concentrations matching the post-AH liquors and BG-11 medium showed no substantial nitrogen transformations under the experimental light and temperature conditions. This indicates that nitrogen removal in the active treatments was primarily driven by biological uptake. Specifically, S. obliquus achieved a removal capacity of 52 mg TN/g biomass with a TN removal rate of 12 mg TN/(L·day), while the consortium exhibited a removal capacity of 51 mg TN/g biomass and a rate of 11 mg TN/(L·day). These removal kinetics are consistent with results obtained using synthetic liquors at equivalent nitrogen loadings, suggesting that the consortium maintains high treatment efficiency along with the pure cultures.
In addition, the consistent performance between synthetic and post-AH liquors confirmed that the nitrogen species ratio and concentration, rather than specific NC-w impurities, were the primary cause of algal metabolism.
Furthermore, a 650 mL working volume experiment using a 2:1 NO2-N to NO3-N ratio was tested by blending a second source of wastewater (initial TN = 120 mg/L). S. obliquus performed similarly to previous tests and compared to synthetic liquor in terms of growth and N removal (Figure 6c,d). The biomass productivity of S. obliquus remained consistent across both media, reaching 0.15 g/(L·day) in synthetic liquor and 0.16 g/(L·day) in post-AH liquor. Similarly, TN removal rates were comparable at 10 and 12 mg/(L·day), respectively. These values correspond to a specific nitrogen removal capacity of approximately 70 mg TN/g in synthetic liquor and 72 mg TN/g in the post-AH effluent, indicating that the complex matrix of the liquor did not hinder the metabolic efficiency of the strain.

4. Discussion

The inhibition observed in response to NC post-AH liquors is likely a synergistic result of the high concentration of nitrogen species (mainly nitrite), sodium, and potential organic residues remaining from incomplete cellulose backbone mineralization. Microorganism resilience to these liquors was clearly species-dependent; notably, the marine bacterium A. fischeri exhibited greater resistance than either the freshwater green microalgae S. obliquus or the marine microalgae N. salina. The differential resilience between the two microalgae suggests that S. obliquus is a more resilient candidate for the biological valorization of these nitrogen-rich effluents.
The nitrite concentration of 90 mg N/L observed in our study is well within the tolerance thresholds reported for robust microalgae. For instance, the aerial microalga Trentepohlia aurea has been shown to maintain growth in the presence of nitrite concentrations as high as 141 mg NO2-N/L [25]. Similarly, recent studies on Chlorella sp. isolated from partial nitrification systems treating municipal wastewater demonstrated remarkable resilience, with biomass production continuing at concentrations up to 300 mg NO2-N/L [26].
The preference for NO2-N over NO3-N observed in S. obliquus (Table 3) likely relates to the energetic efficiency of the assimilation pathway. Nitrogen assimilation is an energy-intensive process that involves two transport steps (nitrite and nitrate membrane transporters) into the cells and chloroplasts and two reduction steps into ammonium (NH4) for amino acid synthesis performed by nitrate reductase (NR) and nitrite reductase (NiR) [27,28]. By utilizing nitrite directly, the cell bypasses the initial NR-mediated step, which is often the rate-limiting stage of the assimilation process. This “shorter” metabolic route requires fewer reducing equivalents (electrons), potentially explaining the faster removal rates observed in treatments where nitrite levels were below inhibitory thresholds.
While nitrite is a preferred substrate at low concentrations, its toxicity at levels exceeding 60 mg/L TN is a critical bottleneck. Nitrite can act as an uncoupler of photophosphorylation and can interfere with the photosynthetic electron transport chain, specifically targeting Photosystem II, the first protein complex taking part in photosynthesis, which ultimately hinders carbon fixation within the Calvin cycle [29,30]. This might explain the observed growth inhibition and the stagnation of nitrogen uptake in high-TN liquors.
These findings suggest that for high-strength liquors, a step-feed approach or pre-dilution is necessary to keep nitrite concentrations below the 60–90 mg/L threshold. Maintaining levels within this “sweet spot” could leverage the algae’s natural preference for nitrite, optimizing total nitrogen removal while avoiding the metabolic shutdown associated with nitrogen-induced stress.
Beyond carbon, nitrogen and phosphorus represent the primary macronutrients essential for algal proliferation. According to the Redfield ratio [31], the stoichiometry of carbon, nitrogen, and phosphorus remains relatively consistent at 106:16:1 across global oceans, reflecting the composition of both phytoplankton biomass and dissolved nutrient pools. Parametric studies utilizing the freshwater microalga S. obliquus demonstrated that neither an increase in pH to 8.0 nor the supplemental addition of carbonates and phosphates yielded improvements in nitrogen removal or growth rates. This lack of response suggests that the cultures were likely carbon- and phosphorus-replete, or that the initial nitrogen concentration was the sole rate-limiting factor, potentially approaching saturation thresholds for the nitrate and nitrite membrane transporters. Under these conditions, the nitrogen removal behavior suggests Michaelis-Menten-type kinetics, with the rate trending towards a maximum velocity (Vmax) and showing less dependence on further increases in substrate or co-factor concentrations [28].
Acclimation of S. obliquus to nitrite over five consecutive weeks did not result in observable genetic modifications or adaptive increases in the expression of membrane-bound nitrate/nitrite transport proteins. Further studies including metagenomic and transcriptomic analysis would be required to definitively evaluate potential changes in the expression of membrane-bound nitrate/nitrite transport proteins.
While exogenous carbon supplementation effectively enhances biomass productivity and lipid accumulation, key precursors for optimized biofuel production [24,32], our findings demonstrate that these gains do not correspond to improved nitrogen remediation. This suggests a metabolic decoupling between biomass synthesis and nutrient removal efficiency under carbon-enriched conditions. Specifically, in nitrogen-limited environments, increased carbon availability shifts cellular flux toward energy storage (lipids) rather than the active assimilation of nitrogen species.
Biomass productivity is a critical metric in microalgal biotechnology, representing the rate at which biological mass is produced per unit of volume or area over time (e.g., g/(L·day)). Higher biomass productivity directly translates to a greater quantity of feedstock available for conversion into various forms of energy, such as biodiesel, biogas (methane), or bioethanol. Balancing high biomass productivity with high lipid content is essential to achieve the maximum energy yield per harvest. High productivity allows for greater energy generation within a smaller physical area, reducing the capital expenditure required for large-scale photobioreactors or open ponds.
The high biomass productivity observed in this study, which reached approximately 0.16–0.20 g/(L·day) in post-AH liquors, suggests the potential of S. obliquus as a viable feedstock. The resilience of S. obliquus and its ability to maintain a specific removal capacity of 72 mg TN/g biomass in post-AH liquors demonstrate its robustness for integrated wastewater treatment.
Biomass productivity observed in this study aligns with values presented in the literature for several green freshwater and marine strains [33,34,35]. For instance, under optimized laboratory conditions, Kirchneriella sp. and Parachlorella kessleri reached productivity of 0.136 g/(L·day) and 0.130 g/(L·day), respectively. Similarly, S. obliquus has demonstrated robust growth in industrial wastewater with high ammonium levels, while Nannochloropsis gaditana achieved a productivity of 0.48 g/(L·day) when cultivated with 15% wastewater centrate.

5. Conclusions

This study demonstrates a promising two-step treatment strategy to degrade NC fines by alkaline hydrolysis and consequently remediates nitrogen-rich liquors by assimilating hazardous levels of inorganic nitrogen into algal biomass. It addresses a critical gap in the literature by establishing a novel framework that couples alkaline hydrolysis with microalgae-based water treatment and nutrient recovery. These findings indicate that post-alkaline hydrolysis liquors serve as a viable substrate for nutrient recovery, provided that the inherent toxicity of high nitrite concentrations is managed through strategic dilution. The screening of nitrogen ratios and concentrations (20 to 200 mg TN/L) indicates that freshwater microalgae can effectively thrive in mixed NO2-N and NO3-N environments below specific toxic thresholds. In contrast, the marine strain acclimated to brackish water exhibited poor tolerance to nitrite, suggesting that freshwater species are more robust candidates for treating these specific high-nitrite streams.
Nitrogen removal performance was primarily influenced by initial substrate concentration rather than nutrient limitation or pH fluctuations. The addition of carbon and phosphorus had a negligible impact on nitrogen removal rates. Furthermore, nitrogen removal efficiencies remained stable between pH 7.0 and 8.0, indicating a flexible operational window for large-scale applications. Additionally, extended five-week acclimation to nitrite revealed no increase in nitrogen removal rates, suggesting no genetic adaptation or quantitative changes in the membrane protein profile related to nitrite translocation in S. obliquus.
The efficiency of the system is highly sensitive to the initial nitrogen load. At an initial total nitrogen concentration of 200 mg/L (with a 3:1 NO2-N:NO3-N ratio), the freshwater pure strain, S. obliquus, achieved 60% removal within seven days. However, at concentrations below or equal to 100 mg/L, removal efficiency increased significantly to 99%. Similar removal rates were achieved with post-AH liquors obtained after alkaline hydrolysis treatment of NC fines. These results confirm that freshwater microalgae effectively assimilate inorganic nitrogen into biomass, offering a sustainable pathway for wastewater nutrient recycling and potential production of value-added products or energy.

Author Contributions

Conceptualization, J.A., W.J.B. and C.C.; methodology, J.A. and T.-L.S.; validation, J.A. and W.J.B.; formal analysis, A.T. and J.A.; investigation, A.T. and J.A.; resources, T.-L.S.; writing—original draft preparation, J.A.; writing—review and editing, J.A., W.J.B. and C.C.; visualization, A.T. and J.A.; supervision, W.J.B.; project administration, W.J.B. and C.C.; funding acquisition, C.C. All authors have read and agreed to the published version of the manuscript.

Funding

This research was executed under US Army Contracting Command to LEIDOS Inc. Prime Contract W911NF-15-D-0014/DO W911NF18F0061, Subcontract No. P010227554.

Data Availability Statement

The original contributions presented in this study are included in the article. Further inquiries can be directed to the corresponding authors.

Acknowledgments

The authors would like to thank A. Terracciano for providing the AH liquors; Z. Zheng and A. Attygalle from the Center for Mass Spectrometry at Stevens Institute of Technology for the MS scan analysis.

Conflicts of Interest

The authors declare no conflicts of interest.

Abbreviations

The following abbreviations are used in this manuscript:
AHAlkaline hydrolysis
NCNitrocellulose
TNTotal nitrogen
TOCTotal organic carbon

Appendix A

Figure A1. Electrospray Ionization Mass Spectrometry scans of post-alkaline liquors from NC-p (1) and NC-w (2). Negative mode (top), positive mode (middle) and daughter scan of positive mode (bottom). Red frame indicates specific mass-to-charge ratio (m/z) within samples: 162 m/z is often associated with hexose residues in fragmentation, 167 m/z is indicative of one hydroxide (HO-) and one methoxy (-OCH3) group on ring, and 185 m/z sometimes represents a sodiated galactose derivative (sodiated adduct).
Cleantechnol 08 00103 g0a1aCleantechnol 08 00103 g0a1b
Figure A2. Color development for the different total N concentrations (20 to 300 mg N/L) tested at pH = 7 in Figure 4.
Cleantechnol 08 00103 g0a2
Figure A3. Growth curves for the different N concentrations tested at pH = 7 for marine strain N. salina. Labels are expressed as total nitrogen in mg/L. Control (Ctrl) corresponds to Guillard medium, only NO3-N.
Cleantechnol 08 00103 g0a3

References

  1. Chang, J.I.; Chen, C.H.; Liu, G.S.Y. The experience of waste minimization at a nitrocellulose manufacturing plant. Resour. Conserv. Recycl. 2000, 30, 333–335. [Google Scholar] [CrossRef]
  2. Gashtroudkhani, A.K.; ghalehno, M.D.; Abadi, S.S.; Pouyani, M.; Salimi, A. A new process for producing of commercial nitrocellulose with chipping technology of sheet wood pulp. Sci. Rep. 2025, 15, 17470. [Google Scholar] [CrossRef] [PubMed]
  3. Gladchenko, M.A.; Gaidamaka, S.N.; Murygina, V.P.; Lifshits, A.B.; Cherenkov, P.G. Laboratory Simulation Study of the Solid-Phase Aerobic Fermentation of Nitrocellulose-Containing Wastewater Sludge. Chem. Phys. Ecol. Process. 2015, 34, 30–37. [Google Scholar] [CrossRef]
  4. Barreto-Rodrigues, M.; Souza, J.V.B.; Silva, E.S.; Silva, F.T.; Paiva, T.C.B. Combined photocatalytic and fungal processes for the treatment of nitrocellulose industry wastewater. J. Hazard. Mater. 2009, 161, 1569–1573. [Google Scholar] [CrossRef]
  5. Christodoulatos, C.; Su, T.-S.; Koutsospyros, A. Kinetics of the Alkaline Hydrolysis of Nitrocellulose. Water Environ. Res. 2001, 73, 185–191. [Google Scholar] [CrossRef] [PubMed]
  6. Terracciano, A.; Wang, Z.; Su, T.-L.; Koutsospyros, A.; Christodoulatos, C.; Braida, W.; Smolinski, B. Alkaline hydrolysis of waste nitrocellulose and characterization of post-hydrolysis liquor. In Proceedings of the Protection and Restoration of the Environment (PRE) XVI, Kalamata, Greece, 5–8 July 2022. [Google Scholar]
  7. Li, J.; Yin, X.; Liu, Z.; Gu, Z.; Niu, J. Reaction yield model of nitrocellulose alkaline hydrolysis. J. Hazard. Mater. 2019, 371, 603–608. [Google Scholar] [CrossRef]
  8. Zhang, G.; Liang, X.; Li, J.; Liu, Z. Heuristic-Based Alkaline Hydrolysis Mechanism of Nitrate Ester (Nitrocellulose Monomer) and Nitroamine (Hexogen) Compounds: Electrostatic Attraction Effect of the Nitro Group. J. Phys. Chem. A 2023, 127, 1609–1618. [Google Scholar] [CrossRef]
  9. US EPA. Ambient Water Quality Criteria to Address Nutrient Pollution in Lakes and Reservoirs; Report No. EPA-822-R-21-005; U.S. Environmental Protection Agency, Office of Water: Washington, DC, USA, 2021.
  10. US EPA. Implementing Recommended Clean Water Act Section 304(a) Ambient Water Quality Criteria to Address Nutrient Pollution; Report No. EPA-820-R-23-008; U.S. Environmental Protection Agency: Washington, DC, USA, 2023.
  11. Kasinski, S.; Kowal, P.; Czerwionka, K. Advanced Technologies for Nitrogen Removal and Recovery from Municipal and Industrial Wastewater. Materials 2025, 18, 1422. [Google Scholar] [CrossRef]
  12. Zhou, Y.; Zhu, Y.; Zhu, J.; Li, C.; Chen, G. A Comprehensive Review on Wastewater Nitrogen Removal and Its Recovery Processes. Int. J. Environ. Res. Public Health 2023, 20, 3429. [Google Scholar] [CrossRef]
  13. Thielemann, A.K.; Händel, N.; Siddiqui, S.A.; Aganovic, K.; Kießling, M.; Terjung, N.; Smetana, S.; Pleissner, D. Biological measures to recover nitrogen compounds from liquid and solid streams. Sustain. Chem. Environ. 2024, 7, 100136. [Google Scholar] [CrossRef]
  14. Morillas-España, A.; López-Serna, R.; Rodríguez Chikri, L.Y.; Jiménez, J.J.; Lafarga, T.; Uggetti, E.; Acién, G.; González-López, C.V. Microalgae wastewater treatment: Pharmaceutical removal and biomass valorization. J. Environ. Manag. 2025, 380, 124942. [Google Scholar] [CrossRef]
  15. Nobre, M.L.F.; Tavares, D.; Fraga, C.; Oliveira, B.; Dias, M.; Mesquita, S.; Oliveira, C.M.; Pires, J.C.M. Techno-economic analysis of a circular microalgal approach for enhanced wastewater treatment and resource recovery in Northern Portugal. J. Clean. Prod. 2024, 434, 140389. [Google Scholar] [CrossRef]
  16. Calijuri, M.L.; de Aguiar Do Couto, E.; Assemany, P.P.; Ribeiro, V.J.; Lorentz, J.F.; de Siqueira Castro, J.; de Assis, L.R.; Oliveira, A.P.S.; de Paula Pereira, A.S.A.; Marangon, B.B.; et al. Microalgae-based wastewater treatment and biomass valorization: Insights, challenges, and opportunities from 15 years of research. ACS Omega 2025, 10, 49273–49299. [Google Scholar] [CrossRef]
  17. Abraham, J.; Abimbola, T.; Braida, W.; Terracciano, A.; Su, T.; Christodoulatos, C.; Koutsospyros, A.; RoyChowdhury, A.; Smolinski, B.; Lawal, A. On-site pilot scale microalgae cultivation using industrial wastewater for bioenergy production: A case study towards circular economy. Bioengineering 2023, 10, 1339. [Google Scholar] [CrossRef] [PubMed]
  18. Organization for Economic Co-Operation and Development (OECD). Guidelines for the Testing of Chemicals 201; OECD: Paris, France, 2011. [Google Scholar]
  19. Abraham, J.; Lin, Y.; RoyChowdhury, A.; Christodoulatos, C.; Conway, M.; Smolinski, B.; Braida, W. Algae toxicological assessment and valorization of energetic-laden wastewater streams using Scenedesmus obliquus. J. Clean Prod. 2018, 202, 838–845. [Google Scholar] [CrossRef]
  20. Lin, Y.; Abraham, J.; RoyChowdhury, A.; Su, T.; Braida, W.; Christodoulatos, C. Ecotoxicological response of Scenedesmus obliquus to pure energetic compounds and metal ions found in wastewater streams from munitions manufacturing. Algal Res. 2020, 48, 101927. [Google Scholar] [CrossRef]
  21. ISO 11348-3:2007; Water Quality—Determination of the Inhibitory Effect of Water Samples on the Light Emission of Vibrio fischeri (Luminescent bacteria Test). Part 3: Method Using Freeze-Dried Bacteria. ISO: Geneva, Switzerland, 2007.
  22. Abraham, J.; Prigiobbe, V.; Abimbola, T.; Christodoulatos, C. Integrating biological and chemical CO2 sequestration for bioproducts generation. Front. Clim. 2023, 4, 949411. [Google Scholar] [CrossRef]
  23. APHA-AWWA-WEF. Standard methods for the examination of water and wastewater. In Total Solids Suspended, Method, 21st ed.; NW:APHA-AWWA-WEF: New York, NY, USA, 2005; 2540 D, 2-55 a 2-59. [Google Scholar]
  24. Patnaik, R.; Mallick, N. Individual and combined supplementation of carbon sources for growth augmentation and enrichment of lipids in the green microalga Tetradesmus obliquus. J. Appl. Phycol. 2020, 32, 205–219. [Google Scholar] [CrossRef]
  25. Abe, K.; Imamaki, A.; Hirano, M. Removal of nitrate, nitrite, ammonium and phosphate ions from water by the aerial microalga Trentepohlia aurea. J. Appl. Phycol. 2002, 14, 129–134. [Google Scholar] [CrossRef]
  26. Li, M.; Chen, Z.; Li, X.; Yu, S.; Xu, S.; Qiu, S.; Ge, S. Physiological and genetic responses of Chlorella sp. to nitrite accumulation in microalgal-bacterial consortium with partial nitrification treating municipal wastewater. Water Res. 2025, 280, 123473. [Google Scholar] [CrossRef]
  27. Sanz-Luque, E.; Chamizo-Ampudia, A.; Llamas, A.; Galvan, A.; Fernandez, E. Understanding nitrate assimilation and its regulation in microalgae. Front. Plant Sci. 2015, 6, 899. [Google Scholar] [CrossRef] [PubMed]
  28. Rani, V.; Shetty, P.; Maroti, G. Comparative transcriptome study highlights the versatility of nitrogen metabolism in Chlamydomonas. Algal Res. 2024, 79, 103458. [Google Scholar] [CrossRef]
  29. Zhang, X.; Ma, F.; Zhu, X.; Zhu, J.; Rong, J.; Zhan, J.; Chen, H.; He, C.; Wang, Q. The acceptor side of photosystem II is the initial target of nitrite stress in Synechocystis sp. strain PCC 6803. Appl. Environ. Microbiol. 2017, 83, e02952-16. [Google Scholar] [CrossRef] [PubMed]
  30. Aparicio, S.; Robles, Á.; Ferrer, J.; Seco, A.; Falomir, L.B. Assessing and modeling nitrite inhibition in microalgae-bacteria consortia for wastewater treatment by means of photo-respirometric and chlorophyll fluorescence techniques. Sci. Total Environ. 2022, 808, 152128. [Google Scholar] [CrossRef]
  31. Redfield, A.C. The biological control of the chemical factors in the environment. Am. Sci. 1958, 46, 205–221. [Google Scholar]
  32. Pancha, I.; Chokshi, K.; Ghosh, T.; Paliwal, C.; Maurya, R.; Mishra, S. Bicarbonate supplementation enhanced biofuel production potential as well as nutritional stress mitigation in the microalgae Scenedesmus sp. CCNM 1077. Bioresour. Technol. 2015, 193, 315–323. [Google Scholar] [CrossRef]
  33. Fields, F.J.; Hernandez, R.E.; Weilbacher, E.; Garcia-Vargas, E.; Huynh, J.; Thurmond, M.; Lund, R.; Burkart, M.D.; Mayfield, S.P. Annual productivity and lipid composition of native microalgae (Chlorophyta) at a pilot production facility in Southern California. Algal Res. 2021, 56, 102307. [Google Scholar] [CrossRef]
  34. Zhang, Y.; Wang, Q.; Liu, X.; Zheng, H.; Li, A. Two types of growth pattern of the five microalgal species under different nitrogen supplies. Biomass Bioenergy 2023, 171, 106720. [Google Scholar] [CrossRef]
  35. Arbib, Z.; Ruiz, J.; Alvarez-Dıaz, J.P.; Garrido-Perez, C.; Perales, J.A. Capability of different microalgae species for phytoremediation processes: Wastewater tertiary treatment, CO2 bio-fixation and low cost biofuels production. Water Res. 2014, 49, 465–474. [Google Scholar] [CrossRef]
Figure 1. Experimental methodology pipeline within this study. The sequential process details the characterization and ecotoxicity profiling of post-alkaline hydrolysis (AH) liquors, followed by neutralization, dilution and microalgae inoculation for subsequent bioremediation treatment, utilizing pure microalgae and algal-bacterial consortia to yield treated effluent and harvested biomass.
Cleantechnol 08 00103 g001
Figure 2. Algal toxicological assessment of NC post-AH liquors from NC-p (a) and NC-w (b). Results represent the mean of 8 replicates ± standard deviation.
Cleantechnol 08 00103 g002
Figure 3. Testing nitrite, nitrate, and their combination in microalgal culture media: (a) different concentrations of nitrate, (b) different concentrations of nitrite in nitrate medium (BG-11), (c,d) different concentrations of nitrite from sodium nitrite and potassium nitrite salts (no nitrate added). All concentrations (legends) are expressed as mg N/L.
Cleantechnol 08 00103 g003
Figure 4. Growth curves for the different N concentrations tested at pH = 7. Labels are expressed as total nitrogen. Results represent the mean of at least 4 replicates ± standard deviation. Results represent the mean of 4 to 8 replicates ± standard deviation.
Cleantechnol 08 00103 g004
Figure 5. Growth curves for several N concentrations tested at (a) pH = 8.0 (carbonate/bicarbonate buffer) and (b) N:P ratio = 5:1. Labels are expressed as total nitrogen. Ctrl is reference (control), BG-11. Results represent the mean of 4 to 8 replicates ± standard deviation.
Cleantechnol 08 00103 g005
Figure 6. Bioremediation experiments using BG-11 (positive Ctrl), synthetic, and post-AH liquors: growth curves (a,c) and the nitrogen removal (b,d) for 150 mL (top) and 650 mL (bottom) working volumes. S corresponds to S. obliquus and C to consortium.
Cleantechnol 08 00103 g006
Table 1. Characterization of NC fines post-AH liquors.
Post-AH LiquorNO3-N, mg/LNO2-N, mg/LTOC, mg/L
NC-p1001 ± 102736 ± 208218 ± 80
NC-w950 ± 92366 ± 408284 ± 56
TOC: total organic carbon. Samples were analyzed in triplicate.
Table 2. Sodium (Na+) and potassium (K+) concentrations in controls (Ctrl) and tests in Figure 3.
Concentration, mg N/L (Label in Figure 3a,d)
-IonCtrl2254506809001130
Figure 3aNa+410375746111714871858
Ctrl306090120150
Figure 3bNa+410460510560610660
Figure 3cNa+41054104154204254
Figure 3dNa+41044444
K+994179264349434
Table 3. Screening nitrogen concentration, NO2-N and NO3-N in a 3:1 ratio, for S. obliquus.
Nitrogen Concentration Tested, mg N/L
TN20406080100120140160180200220240260280300Ctrl
NO2-N1530456075901051201351501651801952102250
NO3-N51015202530354045505560657075247
µ, day−10.730.700.690.700.690.670.650.630.610.53000000.70
SD0.010.010.010.010.010.020.010.010.010.03000000.01
Inh., %00002481113241001001001001000
TN R, mg/(L∙day)75.78.611.313.714.214.712.718.918.5-----20.7
NO2-N R, mg/(L∙day)6.54.36.58.410.3109.88.313.814.1------
NO3-N R, mg/(L∙day)0.51.42.12.83.44.24.94.55.14.5-----20.7
TN: total nitrogen, µ: specific growth rate, SD: standard deviation, Inh.: percentage of growth rate inhibition, TN R: total nitrogen removal rate, Ctrl: control.
Table 4. Specific growth rate, µ, and total nitrogen removal rate, TN R, for S. obliquus using a 3:1 NO2-N and NO3-N ratio under different growth conditions (a) pH = 7, N:P = not fixed (variable), (b) pH = 8; (c) N:P = 15:1, (d) N:P = 5:1 and (e) acclimated strain.
Nitrogen Concentration Tested, mg N/L
TN, mg/L20406080100120140160180200
NO2-N, mg/L153045607590105120135150
NO3-N, mg/L5101520253035404550
(a) pH = 7, N:P = not fixed
µ, day−10.740.700.700.710.690.670.650.630.610.53
TN R, mg/(L·day)2.635.738.6311.3113.7114.2314.7012.7318.9018.52
(b) pH = 8
µ, day−10.560.590.600.630.660.650.640.630.640.65
TN R, mg/(L·day)2.705.044.967.417.6511.1311.159.1910.888.71
(c) N:P = 15:1
µ, day−10.750.690.690.680.630.390.220.340.080
TN R, mg/(L·day)2.815.738.6211.5514.369.957.126.351.710.00
(d) N:P = 5:1
µ, day−10.750.690.690.680.630.390.220.340.080
TN R, mg/(L·day)2.845.758.657.826.455.544.234.364.134.28
(e) acclimated strain
µ, day−10.720.680.670.620.530.100.000.000.000.00
TN R, mg/(L·day)2.515.648.5911.5214.258.421.220.000.000.00
TN: total nitrogen, µ: specific growth rate, TN R: total nitrogen removal rate, N: nitrogen, P: phosphorus.
Disclaimer/Publisher’s Note: The statements, opinions and data contained in all publications are solely those of the individual author(s) and contributor(s) and not of MDPI and/or the editor(s). MDPI and/or the editor(s) disclaim responsibility for any injury to people or property resulting from any ideas, methods, instructions or products referred to in the content.