1. Introduction
The transition toward low-carbon electricity systems is accelerating the deployment of solar photovoltaic and wind power worldwide. This transformation is essential for reducing fossil-fuel dependence and greenhouse-gas emissions, but it also changes the operating conditions under which power systems must remain flexible, secure, and resilient. As variable renewable energy increases, system operators require greater storage capability, reserve coordination, operational flexibility, and dispatchable support during constrained operating conditions [
1]. These requirements become especially relevant in insular and weakly interconnected power systems, where limited external interconnection, restricted balancing resources, and more demanding restoration conditions can reduce the effective operational value of renewable expansion.
In this context, the challenge is not only to integrate more renewable capacity but also to ensure that renewable-based resources can contribute to system recovery when supply interruptions, network constraints, or reserve limitations affect priority loads. Critical-load restoration is therefore becoming an increasingly important planning dimension. Hospitals, control centres, telecommunications, water-pumping facilities, emergency services, and strategic feeders require dispatchable energy during restoration windows, even when the wider system remains under constrained operating conditions. For this reason, restoration-oriented indicators such as critical-load autonomy, avoided critical Energy Not Served (ENS), and restoration coverage can provide a more operationally meaningful assessment than renewable penetration or conversion efficiency alone [
2].
The Dominican Republic provides a representative case for examining this issue in an insular power-system context. The country has experienced a rapid increase in renewable generation capacity, particularly solar photovoltaic and wind power. By the end of 2024, non-conventional renewable capacity reached 1396 MW, equivalent to 23.32% of the national installed capacity, compared with 588 MW and 11.94% in 2020 [
3]. Rooftop self-consumption systems have also exceeded 460 MW, reflecting a more decentralized and renewable-oriented electricity structure [
4]. This progress supports the national energy transition, but it also increases the need for flexible and dispatchable resources that can improve the effective use of renewable generation and support priority loads during recovery periods.
Recent events in the Dominican power system further underline the importance of restoration capability and dispatchable support. The nationwide outage of 11 November 2025 caused a total interruption of electricity service in the country, according to the technical report announced by the Organismo Coordinador del Sistema Eléctrico Nacional Interconectado (OC-SENI) [
5]. In addition, the electrical event reported on 23 February 2026 led the OC-SENI to announce operational improvements and corrective actions aimed at strengthening system stability and reliability [
6]. These events reinforce the need to evaluate not only generation adequacy under normal conditions, but also the availability of energy resources capable of supporting critical loads during restoration windows.
Green hydrogen offers a promising pathway for converting renewable electricity into a storable and dispatchable energy carrier. Through electrolysis, renewable electricity can be transformed into hydrogen, stored as chemical energy, and later reconverted into electricity using fuel cells or hydrogen-based generation technologies [
7]. Its relevance becomes stronger when the planning need goes beyond short-duration balancing, since long-duration and seasonal storage become increasingly valuable as wind and solar penetration grows [
8,
9]. International agencies have also identified renewable hydrogen as a contributor to system flexibility, long-duration storage, energy security, and the integration of higher shares of variable renewable energy [
10,
11]. From a restoration perspective, green hydrogen should therefore be understood not only as a decarbonization vector but also as a dispatchable resilience resource for priority-load support [
12].
Curtailed renewable electricity provides a particularly relevant input for this pathway. In high-renewable systems, curtailment occurs when renewable generation is technically available but cannot be absorbed by the grid due to operational, technical, or security constraints. This electricity should not be interpreted as lost generation only. When an appropriate conversion pathway is available, it can become a recoverable energy resource, as recent studies have shown for green hydrogen production from curtailed solar and wind electricity [
13]. A Power-to-Hydrogen-to-Power (P2H2P) pathway can redirect non-absorbed renewable electricity to electrolysis, produce green hydrogen, store it, and later reconvert it into electricity for critical-load restoration. Flexible hydrogen production may also provide broader power-sector benefits by reducing renewable curtailment and adding temporal flexibility [
14].
However, the main planning value of this pathway is not fully captured by hydrogen production potential alone. For restoration applications, the relevant question is how much critical demand can be supplied, how much critical ENS can be avoided, how long priority loads can remain energized, and what economic and carbon-footprint benefits are associated with the recovered electricity. This perspective shifts the assessment from a conventional curtailment-to-hydrogen-production problem toward a carbon-resilience problem, where otherwise unused renewable electricity is converted into dispatchable energy for priority-load support.
This study develops a planning-oriented framework to assess green hydrogen as a critical-load restoration resource in power systems with high renewable penetration. Rather than focusing only on hydrogen production from curtailed renewable electricity, the framework evaluates how recovered hydrogen-based electricity can support priority loads, reduce critical Energy Not Served (ENS), and provide economic and carbon-resilience benefits during restoration windows. The Dominican Republic is used as a representative insular case because it combines rapid renewable expansion, an established renewable energy policy framework, emerging storage requirements, observed renewable curtailment, and recent operational events that underline the importance of restoration capability. The proposed assessment logic can be transferred to other systems with limited interconnection, constrained flexibility, and growing needs for dispatchable support during recovery periods.
The literature on power systems with high renewable penetration shows that increasing solar photovoltaic and wind generation requires additional flexibility to manage variability, uncertainty, network constraints, and supply–demand balance [
1]. These requirements become more critical in insular and weakly interconnected systems, where limited external interconnection, constrained reserves, and a reduced balancing capability can increase renewable curtailment and complicate system restoration [
15]. Under these conditions, curtailed renewable electricity should not be viewed as lost generation only but also as a potential input for storage, sector coupling, and resilience-oriented applications.
Green hydrogen is increasingly studied as a long-duration flexibility option, because renewable electricity can be converted into hydrogen, stored as chemical energy, and later reconverted into electricity through Power-to-Hydrogen-to-Power (P2H2P) configurations [
7,
16,
17]. International agencies have also emphasized its role in supporting variable renewable integration, long-duration storage, energy security, and higher shares of renewable generation [
10,
11]. However, hydrogen is not intended to replace batteries in short-duration applications. Its value becomes clearer when the planning problem involves multi-hour or seasonal energy shifting, constrained renewable absorption, and dispatchable support under stressed or post-event operating conditions [
8,
9].
Recent studies have examined P2H2P systems as flexibility resources for renewable-based power systems. Risco-Bravo et al. [
7] reviewed advances in P2H2P systems and highlighted the role of electrolysis, hydrogen storage, and electricity reconversion in supporting renewable integration and grid operation. Guerra et al. [
8] showed that long-duration and seasonal storage technologies become increasingly valuable as wind and solar penetration grows, especially when systems must manage extended periods of surpluses and deficits. These studies indicate that hydrogen should not be assessed through component efficiency or hydrogen production potential only but also through the operational service that the stored energy can provide.
The use of curtailed renewable electricity for hydrogen production has also become an important research direction. Park et al. [
13] showed that unused solar and wind electricity can be redirected to green hydrogen production, while Stöckl et al. [
14] demonstrated that flexible hydrogen supply chains can reduce renewable surplus and provide power-sector benefits. This is particularly relevant for insular and weakly interconnected systems, where surplus renewable generation may coincide with limited export capability, local congestion, insufficient storage, or operational security constraints. In these contexts, the value of hydrogen depends not only on conversion efficiency but also on the fact that the input electricity would otherwise remain unused.
Other studies have moved from hydrogen production potential toward system-level integration. Guerra et al. [
18] evaluated low-carbon generation and storage technologies for power-system decarbonization, considering curtailment, storage requirements, and emissions reduction. Brey [
9] analyzed hydrogen as seasonal storage for managing renewable deployment in Spain, while Guerrero-Rodríguez et al. [
19] compared small- and large-scale photovoltaic hydrogen production under tropical conditions in Santo Domingo. Daminelli et al. [
20] evaluated renewable hydrogen systems for heavy-duty mobility, including renewable generation, electrolyzer sizing, compression, battery support, and hydrogen storage. More recently, Kebede et al. [
21] framed large-scale green hydrogen as a system-integration challenge involving Power-to-X and X-to-Power pathways. These contributions show that hydrogen must be evaluated in relation to the service it is expected to provide, including renewable availability, storage needs, reconversion, local operating conditions, and system-level flexibility.
A growing body of literature also discusses hydrogen storage as a resilience asset, not only as a decarbonization technology. Under restoration or contingency conditions, the relevant indicators differ from those used in normal operation. Critical-load autonomy, priority-load supply, avoided critical Energy Not Served (ENS), restoration coverage, and the ability to sustain essential services become central metrics [
2,
22]. This distinction is important, because a hydrogen pathway may have lower electricity-to-electricity efficiency than batteries while still providing operational value if it converts otherwise curtailed renewable electricity into dispatchable energy for critical-load restoration [
12].
From an economic perspective, resilience-oriented hydrogen applications also require indicators that differ from conventional energy arbitrage metrics. The value of a restoration resource depends on the cost of maintaining critical-load supply, the avoided unserved energy, and the value assigned to service continuity during disruptive events [
23]. Therefore, levelized hydrogen or recovered-electricity costs should be interpreted together with avoided critical ENS and break-even value-of-lost-load indicators. This is particularly relevant when the hydrogen input is curtailed renewable electricity, because the economic interpretation changes when the energy input is otherwise unused.
The carbon dimension adds another layer to the assessment. If hydrogen-based reconversion supplies critical loads during restoration windows and displaces grid electricity or fossil-based backup generation, the recovered electricity can also be expressed as avoided CO2 emissions. In this sense, hydrogen from curtailed renewables can provide a combined carbon-resilience contribution: it reduces critical ENS while converting non-absorbed renewable electricity into dispatchable, lower-carbon support for priority loads. However, few studies integrate these dimensions into a single assessment chain that links renewable curtailment, hydrogen production, storage, fuel-cell reconversion, critical-load restoration, economic valuation, and carbon-footprint savings.
This literature review shows that previous work has advanced important parts of the problem, including P2H2P integration, curtailment mitigation, long-duration storage, hydrogen-based resilience, and low-carbon system operation. Nevertheless, the explicit connection between curtailed renewable electricity and critical-load restoration remains less developed, particularly when evaluated through avoided critical ENS, restoration coverage, economic value, and carbon-resilience indicators. This gap motivates the framework proposed in this study.
Table 1 summarizes selected studies related to renewable curtailment, green hydrogen, long-duration storage, resilience-oriented power-system support, economic valuation, and carbon-emissions assessment. The comparison shows that previous work has advanced important parts of the problem, including P2H2P integration, curtailment mitigation, hydrogen storage, low-carbon system planning, and hydrogen-based resilience. However, fewer studies connect curtailed renewable electricity with critical-load restoration through a complete pathway that includes electrolysis, hydrogen storage, fuel-cell reconversion, avoided critical Energy Not Served (ENS), restoration-oriented economic value, and carbon-footprint savings. This gap is particularly relevant for insular and weakly interconnected power systems, where limited flexibility and constrained restoration capability can reduce the operational value of renewable expansion.
This paper contributes to the literature in four main ways. First, it reframes renewable curtailment as a planning input for critical-load restoration, extending its conventional interpretation as lost generation or as a source for hydrogen production alone. Second, it proposes a structured Power-to-Hydrogen-to-Power (P2H2P) assessment framework that connects curtailed electricity, PEM electrolysis, hydrogen storage, fuel-cell reconversion, and priority-load support. Third, it introduces a restoration-oriented evaluation layer based on critical-load autonomy, avoided critical Energy Not Served (ENS), Restoration Coverage Ratio, required H2 storage, and fuel-cell power-delivery sensitivity. Finally, it links technical restoration performance with economic and carbon-resilience valuation, allowing hydrogen-based support to be assessed through service value and avoided CO2 emissions.
The remainder of the paper is organized as follows.
Section 2 presents the curtailment-to-hydrogen-to-critical-load-restoration methodology, including the hydrogen conversion model, storage and fuel-cell reconversion, restoration-support indicators, fuel-cell power-delivery sensitivity, economic valuation, and carbon-footprint savings assessment.
Section 3 describes the case study, input variables, hydrogen-system parameters, critical-load levels, restoration durations, and sensitivity cases.
Section 4 presents and discusses the results in terms of hydrogen production potential, storage adequacy, pathway efficiency, critical-load autonomy, avoided critical Energy Not Served (ENS), hydrogen storage requirements, fuel-cell power-delivery limits, annual energy conversion balance, economic indicators, and carbon-resilience benefits.
Section 5 summarizes the main findings, discusses the implications of green hydrogen as a targeted restoration resource, and outlines future research needs.
2. Materials and Methods
2.1. Framework Overview
This section presents the methodology used to evaluate green hydrogen as a critical-load restoration resource in power systems with high renewable penetration. The framework links curtailed renewable electricity, proton-exchange membrane electrolysis, hydrogen storage, fuel-cell reconversion, priority-load supply, critical Energy Not Served (ENS) reduction, economic valuation, and carbon-footprint savings. The model was implemented in MATLAB R2024b and applied to the Dominican Republic power system as a representative insular case [
24].
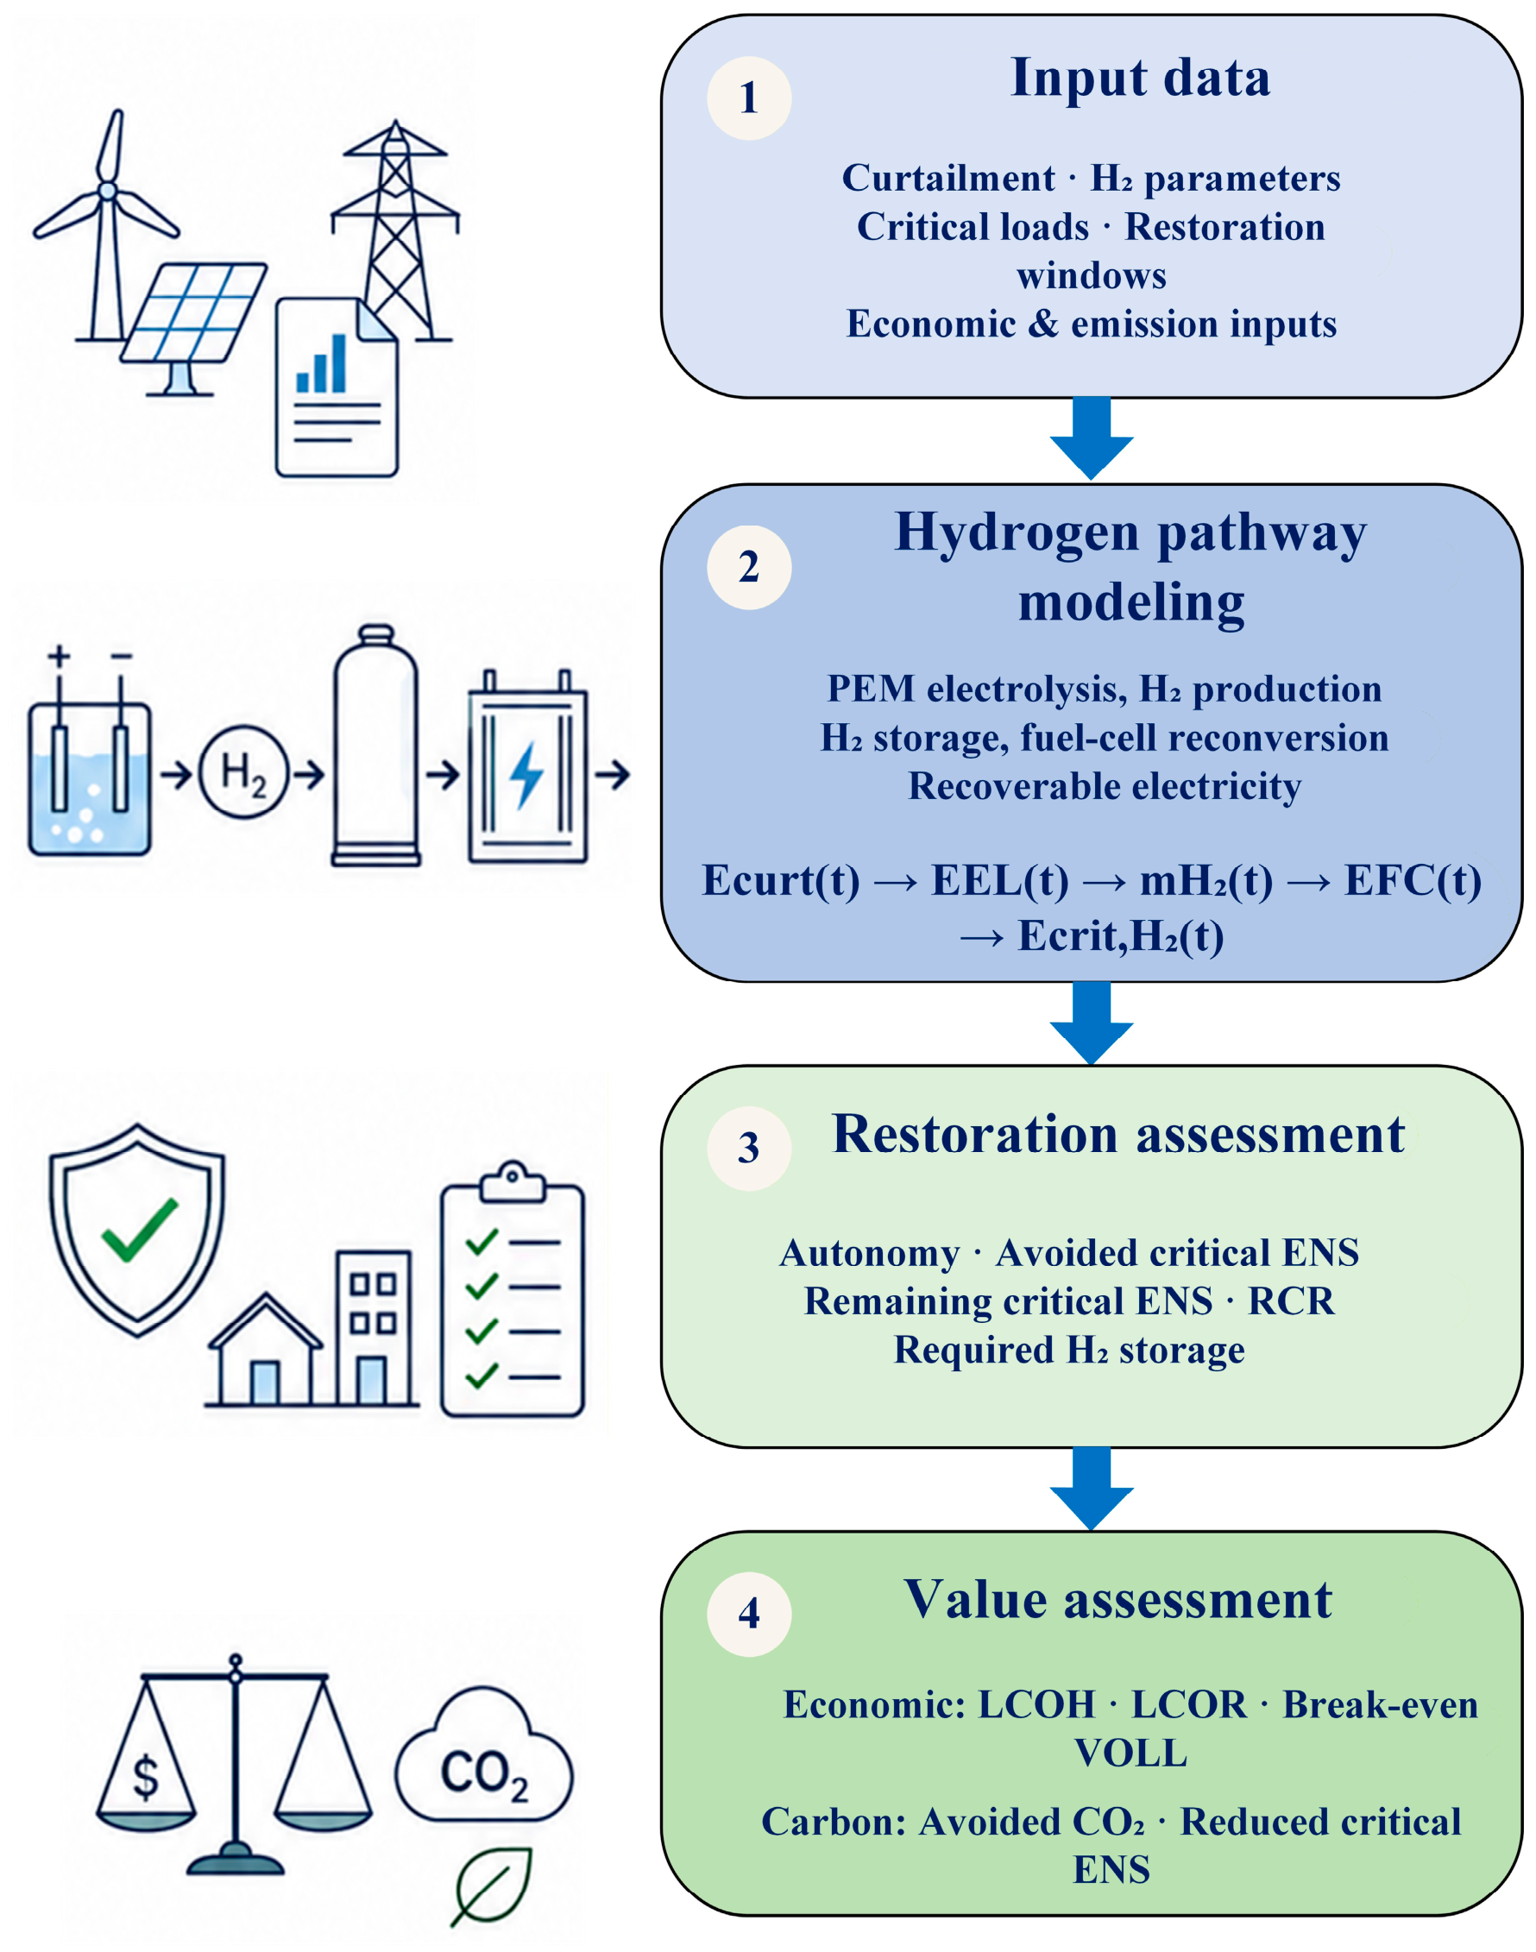
Figure 1 summarizes the integrated assessment structure. The pathway begins with renewable electricity that is technically available but not absorbed by the grid due to operational, technical, or security constraints. Instead of only being treated as lost generation, this curtailed electricity is redirected to electrolysis, converted into green hydrogen, stored as chemical energy, and later reconverted into electricity through a fuel-cell pathway. During restoration windows, the recovered electricity is used to supply priority loads and quantify restoration-oriented indicators such as critical-load autonomy, avoided critical ENS, percentage reduction in critical ENS, and the Restoration Coverage Ratio.
The framework then extends the technical restoration assessment toward two complementary valuation layers. First, the economic layer translates hydrogen production, recovered electricity, and avoided critical ENS into planning-oriented indicators such as levelized cost of hydrogen, levelized cost of recovered electricity, and break-even value of the lost load. Second, the operational carbon-footprint layer converts recovered electricity and avoided critical ENS into avoided CO2 emissions using defined counterfactual emission factors, including grid-displacement and backup-displacement assumptions. In this way, the proposed framework evaluates green hydrogen not only as a curtailment-recovery or storage pathway but as a targeted carbon-resilience resource capable of converting otherwise unused renewable electricity into dispatchable support for critical loads.
In the proposed method, curtailed renewable electricity is treated as a recoverable energy resource rather than as an operational loss. The methodological sequence first follows the physical conversion pathway from non-absorbed renewable electricity to critical-load support, as summarized in the following chain:
where
is the curtailed renewable electricity,
is the electricity absorbed by the electrolyzer,
is the hydrogen produced by electrolysis,
is the hydrogen inventory available in the storage module,
is the electricity recovered through the fuel-cell pathway, and
is the electricity supplied to critical loads during restoration conditions. This structure separates hydrogen production from stored hydrogen availability, allowing the pathway to be evaluated as a service-based restoration resource rather than only as a conversion-efficiency problem.
2.2. Input Variables and Modelling Criteria
The analysis is based on six groups of input variables and modelling criteria. First, renewable curtailment defines the amount of electricity that can potentially be redirected to hydrogen production and later recovered for restoration support. In this study, curtailment is understood as renewable generation that is technically available but not absorbed by the grid due to operational, technical, or security constraints [
13]. The assessment uses monthly curtailed non-conventional renewable electricity values reported by OC-SENI in its preliminary real-operation reports [
25]. These monthly values provide the intra-annual curtailment profile and the annual energy input obtained by aggregation, allowing for monthly hydrogen production, storage adequacy, and recoverable electricity to be estimated from reported system-operator data.
Second, the hydrogen-system parameters are specified, including electrolyzer rated power, electrolyzer specific energy consumption, hydrogen lower heating value, hydrogen storage capacity, fuel-cell efficiency, and reference system demand. The model uses electrolyzer specific energy consumption,
, because it directly links electricity input to hydrogen mass production and provides a single performance parameter for the electrolysis stage [
11,
26].
Third, the hydrogen tank is represented as a restoration-support module rather than as infrastructure intended to absorb the entire annual hydrogen production potential. Annual hydrogen production potential, storage-module size, and utilization strategy are therefore treated as separate planning dimensions.
Fourth, critical loads are expressed as percentages of the reference system demand [
2]. This modelling criterion keeps the framework scalable and applicable to other insular or weakly interconnected systems where critical-load information is commonly aggregated for system-level planning. The critical-load levels are used to estimate autonomy, avoided critical Energy Not Served (ENS), critical ENS reduction percentage, and the Restoration Coverage Ratio.
Fifth, economic valuation criteria are included to translate the technical restoration results into planning-oriented cost indicators. These criteria include component capital cost, fixed operation and maintenance costs, discount rate, project lifetime, opportunity cost of curtailed electricity, levelized cost of hydrogen, levelized cost of recovered electricity, and break-even value of the lost load. This allows the hydrogen pathway to be evaluated not only as an energy-conversion process but also as a restoration-support resource.
Sixth, carbon-footprint assessment criteria are included to quantify the emissions benefit associated with recovered hydrogen-based electricity and avoided critical ENS. Defined counterfactual emission factors are applied to the recovered electricity and restoration-support energy in order to estimate operational avoided CO2 emissions. This final layer links the technical restoration contribution of hydrogen with its carbon-resilience value while distinguishing grid-displacement, backup-displacement, and no-supply boundary assumptions.
2.3. Curtailment-to-Hydrogen Conversion
The first modelling step estimates the amount of curtailed renewable electricity that can be effectively absorbed by the electrolyzer. At each time step, the electrolyzer input is constrained by two conditions: the curtailed energy available in the system and the maximum energy that the electrolyzer can process according to its rated power. This ensures that hydrogen production is not overestimated when curtailed electricity exceeds the electrolyzer capacity. The electricity absorbed by the electrolyzer is defined by Equation (1):
where
is the electrolyzer rated power, and
is the time-step duration in hours, so that
is expressed in MWh.
The hydrogen produced from the absorbed curtailed electricity is calculated using the electrolyzer specific energy consumption,
, which links the electricity input to the hydrogen mass output in kWh/kg H
2 and is commonly used to characterize the electrolyzer performance in hydrogen-production assessments [
11,
27]. Hydrogen production is defined by Equation (2):
where
is expressed in kg,
in MWh, and
in kWh/kg H
2.
The equivalent electrolyzer efficiency is reported on a lower-heating-value (LHV) basis, a convention commonly used in hydrogen-production and P2H2P assessments [
7,
26]. It is calculated from
and
, as shown in Equation (3):
where
is the lower heating value of hydrogen, taken as
in the reference case [
26].
2.4. Hydrogen Storage and Electricity Reconversion
After hydrogen production, the next step of the framework is to evaluate how the produced hydrogen can be retained as stored chemical energy and later used for electricity reconversion. This stage is essential, because the value of the pathway does not only depend on how much hydrogen can be produced from curtailed renewable electricity, but also on how much of that energy can be preserved and made available during restoration windows. The storage model therefore tracks the hydrogen inventory over time by accounting for the hydrogen added to the tank and the hydrogen consumed by the fuel-cell unit during reconversion.
The hydrogen storage balance is represented by Equation (4), subject to the storage-capacity constraint in Equation (5):
where
is the hydrogen inventory available in the storage module at time step (t),
is the hydrogen added to the module from the electrolyzer,
is the hydrogen consumed by the fuel-cell unit during reconversion, and
is the maximum hydrogen tank capacity. Equation (4) therefore represents the temporal balance of the storage module, while Equation (5) constrains the stored hydrogen inventory between zero and the selected tank capacity.
The storage module is used to evaluate restoration support and is not intended to represent the storage capacity required to absorb the full annual hydrogen-production potential. When the hydrogen production potential exceeds the selected storage-module capacity, the excess hydrogen is interpreted as additional production potential that would require larger storage, alternative end uses, or a different dispatch strategy. This distinction separates annual hydrogen-production potential from the sizing of a targeted restoration-support module.
Once the hydrogen inventory is defined, its associated chemical energy is calculated on an LHV basis using the stored hydrogen mass and the lower heating value of hydrogen, as shown in Equation (6) [
26].
Recoverable electricity is calculated by multiplying the hydrogen chemical energy available for reconversion by the fuel-cell electrical efficiency, as shown in Equation (7). This follows the P2H2P structure, where stored hydrogen is later re-electrified through a dedicated conversion unit [
7]:
where
is expressed in MWh,
is the hydrogen consumed by the fuel-cell unit in kg,
is expressed in kWh/kg H
2, and
is the fuel-cell electrical efficiency.
Finally, the electricity-to-electricity efficiency of the hydrogen pathway is obtained by combining the electrolyzer specific energy consumption with the fuel-cell reconversion efficiency, as shown in Equation (8).
This efficiency characterizes the main electrolysis-to-fuel-cell conversion chain. It does not include auxiliary consumption, hydrogen compression, storage leakage, power-electronics losses, water treatment, or standby losses. Therefore, it should be interpreted as a simplified electricity-to-electricity conversion indicator for planning assessment, not as a detailed plant-level round-trip efficiency.
2.5. Restoration-Support Assessment
The restoration-support assessment estimates the amount of critical demand that can be supplied from the usable electricity recovered through the fuel-cell pathway. For this purpose, critical-load levels are represented as fractions of reference system demand. The critical-load power for each case
is defined by Equation (9):
where
is the critical-load share, and
is the reference system demand.
Energy Not Served (ENS) is used as an energy-based restoration indicator because it quantifies the critical demand that cannot be supplied during an interruption or recovery period. This is consistent with reliability and resilience assessments, where the energy not supplied and critical-load survivability are commonly used to evaluate interruption severity and the value of resilience measures [
2,
23]. For a restoration event with duration
, the baseline critical ENS is defined by Equation (10).
The contribution of stored hydrogen is then represented as avoided critical ENS. For each critical-load level and restoration duration, this value is limited by the usable electricity available from the hydrogen storage module and by the baseline critical ENS, as defined in Equation (11):
where
is the usable electricity available from stored hydrogen through the fuel-cell pathway.
The remaining critical ENS after hydrogen support is obtained from the difference between the baseline critical ENS and the avoided critical ENS, as shown in Equation (12).
The corresponding percentage reduction in critical ENS is calculated using Equation (13).
To express the restoration contribution as a normalized planning indicator, the Restoration Coverage Ratio,
, is defined as the fraction of baseline critical ENS avoided by stored hydrogen for critical-load level
and restoration duration
, as shown in Equation (14):
where
is the Restoration Coverage Ratio for critical-load level
and restoration duration
. A value of
indicates full coverage of the baseline critical ENS, while values below one indicate partial coverage.
When expressed as a percentage, the same indicator becomes Equation (15).
Finally, the equivalent autonomy provided by the stored hydrogen is calculated as the ratio between usable hydrogen-based electricity and the critical-load power, as shown in Equation (16).
Together, autonomy and provide an energy-adequacy basis for comparing restoration-support cases and identifying the critical-load levels and restoration durations where stored hydrogen provides the greatest contribution.
Since the restoration contribution is evaluated on an energy basis, the usable electricity available from stored hydrogen can also be expressed per unit of stored hydrogen mass. The usable electricity obtained from one tonne of stored hydrogen is calculated from the lower heating value of hydrogen and the fuel-cell electrical efficiency, as shown in Equation (17):
where
is the usable electricity obtained per tonne of stored hydrogen after fuel-cell reconversion. Although
is expressed in kWh/kg H
2, the resulting unit is numerically equivalent to MWh/t H
2, because the conversion from kilograms to tonnes and from kWh to MWh cancels out. Under the reference assumptions,
= 33.33 kWh/kg H
2 and
, resulting in
= 17.33 MWh/t H
2. Therefore, the hydrogen mass required to fully cover a critical-load level during a given restoration window can be estimated from the required critical energy, as shown in Equation (18):
where
is the hydrogen mass required to fully cover critical-load level
over restoration duration
. The variable
is expressed in tonnes of H
2 when
is expressed in MWh and
is expressed in MWh/t H
2.
The restoration indicators are first evaluated from an energy-adequacy perspective. However, actual delivery during a restoration event also depends on the rated power of the fuel-cell reconversion unit. Therefore, the sensitivity analysis distinguishes between stored-energy availability and deliverable restoration power. In the fuel-cell power-delivery sensitivity, the avoided critical ENS is constrained not only by the stored hydrogen energy and the baseline critical-load requirement but also by the maximum electrical power that the fuel-cell unit can deliver during the restoration window. This ensures that the hydrogen module is not interpreted only as an energy reservoir but also as a restoration resource constrained by reconversion capacity.
2.6. Scenario Design and Sensitivity Analysis
Sensitivity analyses are performed to evaluate the robustness of the curtailment-to-hydrogen-to-restoration pathway under resource, technology, restoration, and economic variability. First, the available annual curtailed renewable electricity is varied around the official 2025 OC-SENI baseline to represent lower- and higher-curtailment availability conditions. This sensitivity captures the fact that renewable curtailment may change across years due to solar and wind resource variability, demand conditions, dispatch constraints, network limitations, reserve requirements, and operational security criteria.
Second, electrolyzer specific energy consumption varies to assess the effect of electrolysis performance on hydrogen production and recoverable electricity. Third, fuel-cell reconversion performance and power-capacity constraints are considered to distinguish energy adequacy from deliverable restoration power. This is relevant because, during restoration events, the ability to serve critical loads depends not only on stored hydrogen energy but also on the fuel-cell capacity available to supply the required critical-load power.
Finally, selected economic parameters are varied to evaluate the screening-level cost robustness of the pathway. These include the opportunity cost assigned to curtailed renewable electricity, component cost assumptions, the discount rate, and the number of equivalent annual restoration events. These sensitivity dimensions allow the framework to account for renewable-resource variability, technology performance, restoration-power constraints, and economic uncertainty. The scenario structure used to organize the curtailment-to-hydrogen-to-restoration pathway is summarized in
Table 2. The scenarios progress from the base case without hydrogen to hydrogen production, storage and reconversion, restoration support, economic valuation, and carbon-footprint savings.
2.7. Economic Valuation of Hydrogen-Based Restoration Support
An economic valuation is included to translate the technical results into planning-oriented cost indicators. The valuation considers annualized capital cost, fixed operation and maintenance cost, and the opportunity cost assigned to curtailed renewable electricity. The capital recovery factor,
, is calculated using Equation (19):
where
is the discount rate, and
is the component lifetime in years.
The annualized cost of each component is calculated using Equation (20):
where
is the annualized cost of component
,
is the installed capital cost of component
,
is the capital recovery factor associated with that component, and
is the annual fixed operation and maintenance cost. The subscript
denotes the component considered, such as the electrolyzer, fuel-cell unit, or hydrogen storage module.
The levelized cost of hydrogen,
, is estimated as the ratio between the annualized hydrogen-production cost and the annual hydrogen mass produced, as shown in Equation (21):
where
is the annualized cost associated with hydrogen production, and
is the annual hydrogen production.
The levelized cost of recovered electricity,
, is calculated as the ratio between the annualized Power-to-Hydrogen-to-Power pathway cost and the recoverable electricity obtained after fuel-cell reconversion, as shown in Equation (22):
where
is the annual electricity recovered after fuel-cell reconversion.
Finally, the break-even value of the lost load,
, is calculated by dividing the annualized restoration-module cost by the avoided critical ENS, as shown in Equation (23). This indicator links the economic valuation directly to the restoration service by estimating the minimum value of avoided unserved critical energy associated with hydrogen-based support:
where
is the break-even value of the lost load,
is the annualized cost of the hydrogen restoration module, and
is the avoided critical Energy Not Served provided by hydrogen support.
represents the minimum economic value of avoided unserved critical energy required for the hydrogen module to be justified as a restoration-support resource.
In these equations, annual hydrogen production is expressed in kg/year, recovered electricity and avoided critical ENS are expressed in MWh/year, and the resulting cost indicators are reported as USD/kg H2 for , USD/MWh for , and USD/MWh of avoided critical ENS for . The opportunity cost of curtailed renewable electricity is treated as a sensitivity parameter, allowing for economic valuation to distinguish between otherwise unused renewable energy and cases where a positive planning value is assigned to curtailed electricity.
2.8. Operational Carbon-Footprint Savings Assessment
The environmental contribution of the curtailment-to-hydrogen pathway is evaluated through an operational carbon-footprint savings assessment. The calculation estimates the amount of CO2 emissions that can be avoided when recovered hydrogen-based electricity is used to supply restoration demand that would otherwise be served by grid electricity or fossil-based backup generation. This approach links the restoration-support value of hydrogen with an operational emissions-reduction indicator based on the electricity recovered after fuel-cell reconversion.
The annual avoided CO
2 emissions are calculated using Equation (24):
where
is the annual avoided CO
2 emissions,
is the annual electricity recovered through the fuel-cell pathway, and
is the emission factor of counterfactual scenario (s), expressed in tCO
2/MWh.
A second indicator is defined to express the carbon benefit per unit of stored hydrogen used for restoration support. This value is calculated using Equation (25):
where
is the avoided CO
2 emissions per tonne of stored hydrogen under counterfactual scenario (s), and
is the usable electricity obtained per tonne of stored H
2 after fuel-cell reconversion.
The carbon-footprint savings associated with avoided critical ENS during a restoration event are calculated using Equation (26):
where
represents the CO
2 emissions avoided under counterfactual scenario (s) when stored hydrogen reduces critical ENS for critical-load level
and restoration duration
,
is the avoided critical ENS provided by hydrogen support, and
is the corresponding counterfactual emission factor.
Equations (24)–(26) are based on the standard emissions-accounting principle that avoided emissions are obtained by multiplying the amount of electricity displaced or supplied by the emission factor of the corresponding counterfactual scenario. Equation (24) evaluates the annual operational carbon-footprint savings of the recovered electricity. Equation (25) converts the hydrogen storage-sizing rule into an operational emissions indicator by estimating the avoided CO2 associated with each tonne of stored H2. Equation (26) links the environmental benefit directly to the restoration performance by estimating the avoided emissions associated with avoided critical ENS. This formulation is appropriate for a planning-level assessment because it uses the same energy quantities already calculated in the technical model and combines them with defined counterfactual emission factors, allowing grid-displacement, backup-displacement, and no-supply boundary assumptions to be evaluated consistently.
Although the reference calculation uses SENI grid emission factors, the same formulation can be applied with alternative counterfactual emission factors when the restored critical load would otherwise depend on local backup supply. To avoid assuming a single displaced source during restoration conditions, this study evaluates carbon-footprint savings under three counterfactual assumptions: no supply, SENI grid displacement, and diesel-backup displacement. For each counterfactual scenario (s), denotes the emission factor applied to the recovered electricity or avoided critical ENS, expressed in tCO2/MWh. In the no-supply boundary case, no avoided emissions are credited, and the benefit is only represented by avoided critical ENS. In the SENI grid-displacement cases, the selected Dominican grid emission factors are applied.
In the diesel-backup displacement case,
denotes the diesel-backup emission factor and is set to 0.80 tCO
2/MWh as a planning sensitivity assumption, derived from the IPCC default Gas/Diesel Oil emission factor for stationary combustion and an assumed diesel-generator electrical efficiency of 33% [
28]. This structure separates the resilience benefit from the emissions benefit and avoids attributing carbon savings when no carbon-emitting source is displaced.
The carbon-footprint assessment is limited to operational avoided emissions associated with recovered electricity and avoided critical ENS. It does not include life-cycle emissions from electrolyzer manufacturing, fuel-cell production, hydrogen storage infrastructure, compression equipment, civil works, component replacement, or end-of-life processes. Therefore, the reported values should be interpreted as operational carbon-footprint savings rather than full life-cycle emission savings.
3. Case Study and Simulation Setup
3.1. Dominican Power-System Context
The method is applied to the Dominican Republic’s National Interconnected Electric System, hereafter referred to as SENI [
29]. The Dominican power system is used as a representative insular case because it combines increasing variable renewable penetration, limited external interconnection, dependence on conventional generation for balancing and reserves, and growing needs for flexible resources during constrained operating conditions. By the end of 2024, the non-conventional renewable capacity reached 1396 MW, equivalent to 23.32% of the national installed capacity, while rooftop self-consumption systems exceeded 460 MW [
3]. Within this context, green hydrogen is evaluated as a complementary pathway for converting curtailed renewable electricity into stored energy that can later be reconverted into electricity for critical-load support.
3.2. Curtailment Input and Temporal Treatment
The main energy input to the model is curtailed non-conventional renewable electricity. In this study, curtailment refers to renewable generation that is technically available but not absorbed by the power system due to operational, technical, or security constraints. These constraints may include transmission congestion, local demand limitations, reserve requirements, voltage or frequency security criteria, or insufficient flexibility. This definition is consistent with the broader literature on renewable power curtailment, where curtailment is commonly understood as the deliberate reduction in output below available generation to maintain system balance or security [
13]. In the Dominican context, the procedure established by Resolution SIE-118-2024-MEM also recognizes generation limitations for security reasons in the SENI as an operational mechanism to preserve system security and stability [
30].
The curtailment dataset is obtained from the monthly preliminary real-operation reports published by the Organismo Coordinador del Sistema Eléctrico Nacional Interconectado (OC-SENI) [
25]. These reports include a dedicated section on non-conventional renewable energy curtailment, where curtailed electricity from non-conventional renewable power plants is reported for each month. The monthly OC-SENI values are used to define the intra-annual curtailment profile and to calculate the annual curtailed renewable electricity input.
Based on the twelve monthly OC-SENI reports for 2025, the accumulated annual curtailed renewable electricity
is 196.46 GWh/year [
25]. This value is adopted as the reference curtailment input for estimating hydrogen production, storage adequacy, fuel-cell reconversion, economic indicators, and carbon-footprint savings.
The specific monthly OC-SENI reports, report codes, release dates, access dates, and curtailed-energy values used to construct the 2025 input dataset are provided in
Table A1 of
Appendix A.
Because the OC-SENI curtailment data are reported at a monthly resolution, the present assessment estimates the technical hydrogen-production potential associated with the reported monthly curtailed electricity. Therefore, the monthly calculations do not represent an hourly or sub-hourly electrolyzer dispatch simulation. The electrolyzer rated power is used as a reference system-sizing and economic parameter, while the reported monthly curtailed electricity defines the energy available for the planning-level conversion assessment.
3.3. Hydrogen-System Configuration
The hydrogen system is represented as a modular P2H2P pathway composed of three main elements: an electrolyzer, a hydrogen storage unit, and a fuel-cell-based reconversion unit. The electrolyzer absorbs curtailed renewable electricity and converts it into hydrogen. The storage unit preserves the produced hydrogen as chemical energy. During restoration conditions, stored hydrogen is reconverted into electricity and used to support critical loads. This structure is consistent with P2H2P systems, where renewable electricity is converted into hydrogen, stored, and later re-electrified to provide dispatchable support [
7].
Table 3 summarizes the reference configuration used in the assessment. The annual curtailment value is obtained by summing the monthly non-conventional renewable curtailment values reported in the OC-SENI preliminary real-operation reports for 2025. The remaining parameters are defined from literature values or from the reference design adopted in this study.
The storage module is represented on a mass basis, which allows the analysis to focus on the usable hydrogen energy available for restoration support.
The model uses instead of a fixed electrolyzer efficiency, because this parameter directly links the electricity input to hydrogen mass production in kWh/kg H2. Using Equation (3), the reference value corresponds to an equivalent LHV electrolyzer efficiency of approximately 64.1%.
The reference value of
= 52 kWh/kg H
2 is therefore used as a central PEM-electrolysis performance assumption, while the sensitivity range in
Section 3.5 represents optimistic, reference, conservative, and high-consumption cases. Similarly, the fuel-cell electrical efficiency (
= 0.52) is adopted as a central reconversion-efficiency assumption for the planning-level P2H2P pathway, consistent with the reference configuration in
Table 3 [
7,
31]. Because the fuel-cell performance may vary with technology, operating point, degradation, auxiliary consumption, and part-load operation, this value is not treated as a fixed universal efficiency. Instead, lower and higher reconversion-efficiency cases are included in the sensitivity synthesis to evaluate how fuel-cell performance affects usable electricity, storage autonomy, avoided critical ENS, and operational carbon-footprint savings.
In the reference case, the 60 MW electrolyzer represents a large-scale configuration for assessing the curtailment-to-hydrogen pathway. Using the OC-SENI monthly curtailment profile, the estimated hydrogen production is defined by the reported monthly curtailed-electricity values and the selected conversion parameters.
The restoration matrix is evaluated from an energy-adequacy perspective. In the reference case, the fuel-cell unit is assumed to deliver the required power for each priority-load tier. This energy-based assessment is complemented by fuel-cell power-capacity sensitivity cases, which separate stored-energy availability from deliverable restoration power. Therefore, the matrix quantifies the usable energy contribution of hydrogen for each priority-load tier without representing a full dynamic restoration simulation.
3.4. Critical-Load and Restoration Criteria
The restoration assessment evaluates the ability of stored hydrogen to supply priority loads during recovery periods. Critical demand is represented as a percentage of reference system demand, allowing the restoration-support assessment to compare different levels of priority-load aggregation at the national scale.
Four critical-load levels are considered, as shown in
Table 4.
These levels are defined as illustrative planning tiers rather than measured feeder-level critical-load inventories for the Dominican Republic. The purpose is to evaluate how the same hydrogen storage module performs as the scale of priority-load aggregation increases. The 1% case represents a targeted emergency-load layer that may include system-control centres, hospitals and emergency-care facilities, telecommunications nodes, water-pumping and sanitation services, emergency-response facilities, and selected strategic feeders. The 3%, 5%, and 10% cases represent progressively broader priority-load envelopes that may include larger groups of essential public services, critical commercial and institutional loads, and additional strategic distribution feeders. This tiered structure keeps the framework scalable and avoids assuming a fixed national critical-load inventory that is not available at the required feeder-level detail.
Accordingly, the percentage-based critical-load levels should be interpreted as normalized restoration layers rather than measured Dominican critical-load demand values. The 30 MW case represents a targeted priority-load aggregate, while the higher tiers represent progressively broader restoration-support envelopes used to test the scalability of the hydrogen module under increasing demand requirements.
Restoration events are represented by four duration levels:
These durations are used as planning windows for short-, medium-, and extended-duration restoration support. The 6 h and 12 h cases represent short-to-medium restoration intervals in which targeted priority-load support may be sufficient to maintain essential services. The 24 h and 48 h cases represent longer recovery windows in which storage adequacy and reconversion capacity become more limiting. This duration-based structure allows the same hydrogen storage module to be evaluated according to the amount of critical ENS that could be avoided if stored hydrogen were available for priority-load supply.
3.5. Simulation Cases and Sensitivity Parameters
The simulation follows the scenario structure defined in
Section 2.6. The base case assumes that curtailed renewable electricity remains unused. The hydrogen cases then evaluate the conversion of curtailed non-conventional renewable electricity into hydrogen, the storage and reconversion of that hydrogen, and its contribution to avoided critical ENS during restoration events.
In addition to the reference case, four sensitivity dimensions are evaluated. The first dimension is the available curtailed non-conventional renewable electricity. The official 2025 OC-SENI curtailment profile is used as the reference case, while lower- and higher-availability cases are represented by ±20% variations around the annual baseline. These cases are interpreted as planning sensitivities that reflect possible changes in annual curtailment availability due to solar and wind resource variability, demand conditions, dispatch constraints, reserve requirements, operational security criteria, and network limitations.
The second dimension is electrolyzer performance. Four electrolyzer specific energy consumption values are considered:
These values represent optimistic, reference, conservative, and high-consumption cases for the hydrogen-production pathway. Their selection is based on the LHV-based efficiency relationship defined in Equation (3), where higher electrolyzer specific energy consumption corresponds to lower equivalent electrolyzer efficiency. The values of 50, 52, 55, and 57.3 kWh/kg H2 correspond to equivalent LHV electrolyzer efficiencies of approximately 66.7%, 64.1%, 60.6%, and 58.2%, respectively. The 52 kWh/kg H2 value is used as the reference PEM electrolysis assumption, while 50 kWh/kg H2 represents an improved-performance case and 55–57.3 kWh/kg H2 represent progressively more conservative electricity-consumption cases. This range is therefore used to test how electrolyzer performance affects hydrogen production, recoverable electricity, and pathway efficiency under the same OC-SENI curtailment input.
The third dimension is fuel-cell reconversion and deliverable restoration power. In the reference restoration matrix, the fuel-cell unit is treated from an energy-adequacy perspective. To complement this assumption, fuel-cell power-capacity cases are considered to evaluate whether the stored hydrogen energy can be delivered within the required restoration window. For the 30 MW critical-load case, three fuel-cell rated-power values are evaluated: 15 MW, 30 MW, and 60 MW. These cases represent an undersized reconversion unit, a power-matched reconversion unit, and an oversized reconversion unit relative to the selected critical-load level. This distinction allows the analysis to separate stored-energy availability from power-delivery capability. Within the same reconversion-performance dimension, fuel-cell electrical efficiency is also considered, because it directly affects the usable electricity obtained from stored hydrogen, avoided critical ENS, and operational carbon-footprint savings. Lower, reference, and higher reconversion-efficiency cases of 0.45, 0.52, and 0.60 are therefore used in the sensitivity synthesis.
The fourth dimension is economic robustness. The opportunity cost of curtailed renewable electricity, component-cost assumptions, discount rate, and restoration-service utilization, expressed as the number of equivalent annual support events, are evaluated as planning sensitivities. These parameters are used to interpret the levelized cost of hydrogen, the levelized cost of recovered electricity, and the break-even value of the lost load as screening-level indicators rather than final project-finance results.
The sensitivity results are reported in the corresponding results subsections to keep each uncertainty dimension linked to its main performance indicator. Electrolyzer-performance and curtailment-availability sensitivities are reported with hydrogen production and recoverable electricity, fuel-cell reconversion sensitivity is reported with usable electricity and avoided critical ENS, economic sensitivity is reported through LCOH, LCOR, and VOLL
BE indicators, and carbon-counterfactual sensitivity is reported through operational avoided CO
2 emissions. A consolidated interpretation of these sensitivity dimensions is provided in
Section 4.10.
3.6. Output Indicators
The model produces a set of technical, restoration, economic, and carbon-resilience output indicators, summarized by category in
Table 5. These indicators allow the assessment to move from renewable curtailment and hydrogen production potential to storage adequacy, fuel-cell reconversion, critical-load restoration, avoided critical Energy Not Served (ENS), economic valuation, and carbon-footprint savings.
These output categories are directly aligned with the results presented in
Section 4. Together, they allow the assessment to distinguish hydrogen production potential, storage adequacy, stored-energy contribution, deliverable restoration power, economic value, and carbon-footprint savings. The detailed mathematical definitions are provided in the corresponding methodology subsections, while the numerical values are reported in the results tables to avoid duplication.
4. Results and Discussion
4.1. Hydrogen Production Potential and Storage Adequacy
The first result of the study is the estimation of green hydrogen production from curtailed non-conventional renewable electricity reported by OC-SENI. Under the reference case, the annual curtailed-electricity input is 196.46 GWh/year, obtained by aggregating the twelve monthly values reported for 2025. Using an electrolyzer specific energy consumption of 52 kWh/kg H2, the estimated hydrogen production potential is 3.78 kt H2/year. This value represents the technical production potential associated with the official monthly curtailment input and the selected electrolysis parameter.
Table 6 summarizes the monthly OC-SENI curtailed non-conventional renewable electricity values for 2025 and the corresponding hydrogen-production indicators derived from the reference P2H2P assumptions [
25]. For each month, the reported curtailed electricity is converted into hydrogen production using the electrolyzer specific energy consumption and then into recoverable electricity using the hydrogen lower heating value and the fuel-cell efficiency. The table also expresses monthly hydrogen production as 25 t H
2 tank equivalents, which provides a normalized measure of the production potential relative to the selected restoration-support storage module. The annual tank-equivalent value represents cumulative yearly hydrogen-production equivalents and should not be interpreted as the required simultaneous storage capacity.
The monthly results show a highly uneven intra-annual curtailment profile. March presents the lowest curtailed-electricity value with 564.00 MWh, equivalent to 10.85 t H2 and 187.98 MWh of recoverable electricity. In contrast, December presents the highest curtailment value with 53,386.54 MWh, equivalent to 1026.66 t H2 and 17,793.73 MWh of recoverable electricity. This difference highlights the importance of using the monthly OC-SENI reported profile rather than a smoothed or uniformly distributed annual value.
At the annual scale, the 196.46 GWh/year of curtailed non-conventional renewable electricity corresponds to 3.78 kt H2/year under the reference electrolyzer specific energy consumption of 52 kWh/kg H2. After fuel-cell reconversion, this hydrogen production potential represents 65.48 GWh/year of recoverable electricity. Expressed relative to the selected 25 t H2 storage module, the annual hydrogen-production potential corresponds to approximately 151.12 cumulative tank equivalents. This value should be interpreted as an annual production-equivalent indicator not as the simultaneous storage capacity required by the system.
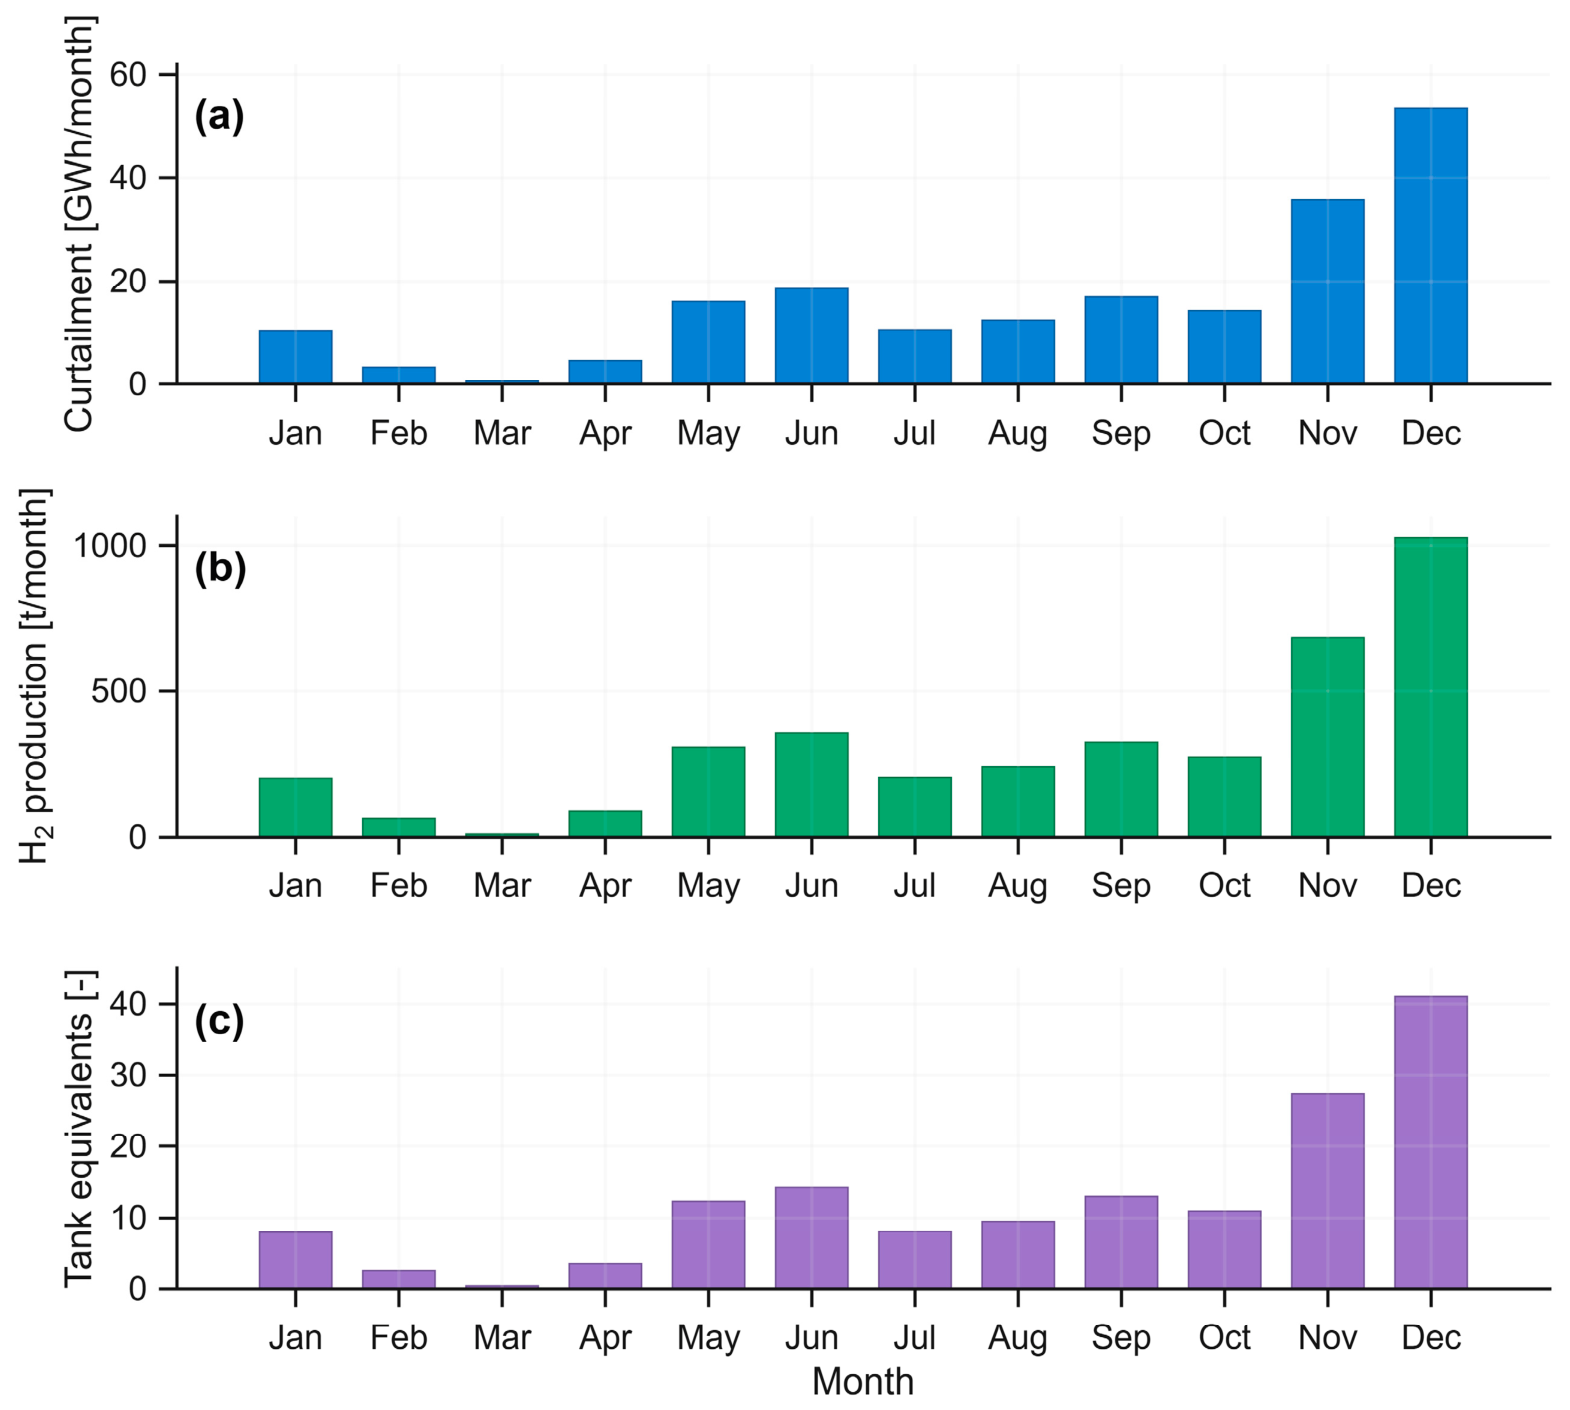
Figure 2 illustrates the monthly hydrogen-production potential and the corresponding storage-module equivalents derived from the official OC-SENI curtailment profile. The figure emphasizes both the annual scale of the curtailment-to-hydrogen opportunity and the strong monthly variability observed in the reported curtailment data.
The estimated monthly hydrogen production ranges from 10.85 t H2 in March to 1026.66 t H2 in December. Relative to the selected 25 t H2 storage module, these values correspond to 0.43 tank equivalents in March and 41.07 tank equivalents in December. This wide range shows that curtailment availability is highly uneven across the year and confirms the importance of using reported monthly data rather than a smoothed annual distribution for hydrogen-production assessment.
The storage-adequacy panel shows that the selected 25 t H2 module should be interpreted as a targeted restoration-support module rather than as infrastructure designed to absorb the full monthly or annual hydrogen-production potential. At the annual scale, the 196.46 GWh/year of curtailed non-conventional renewable electricity corresponds to approximately 151.12 cumulative 25 t tank equivalents. This value is an annual production-equivalent indicator and does not represent simultaneous storage capacity.
4.2. Sensitivity to Electrolyzer Specific Energy Consumption
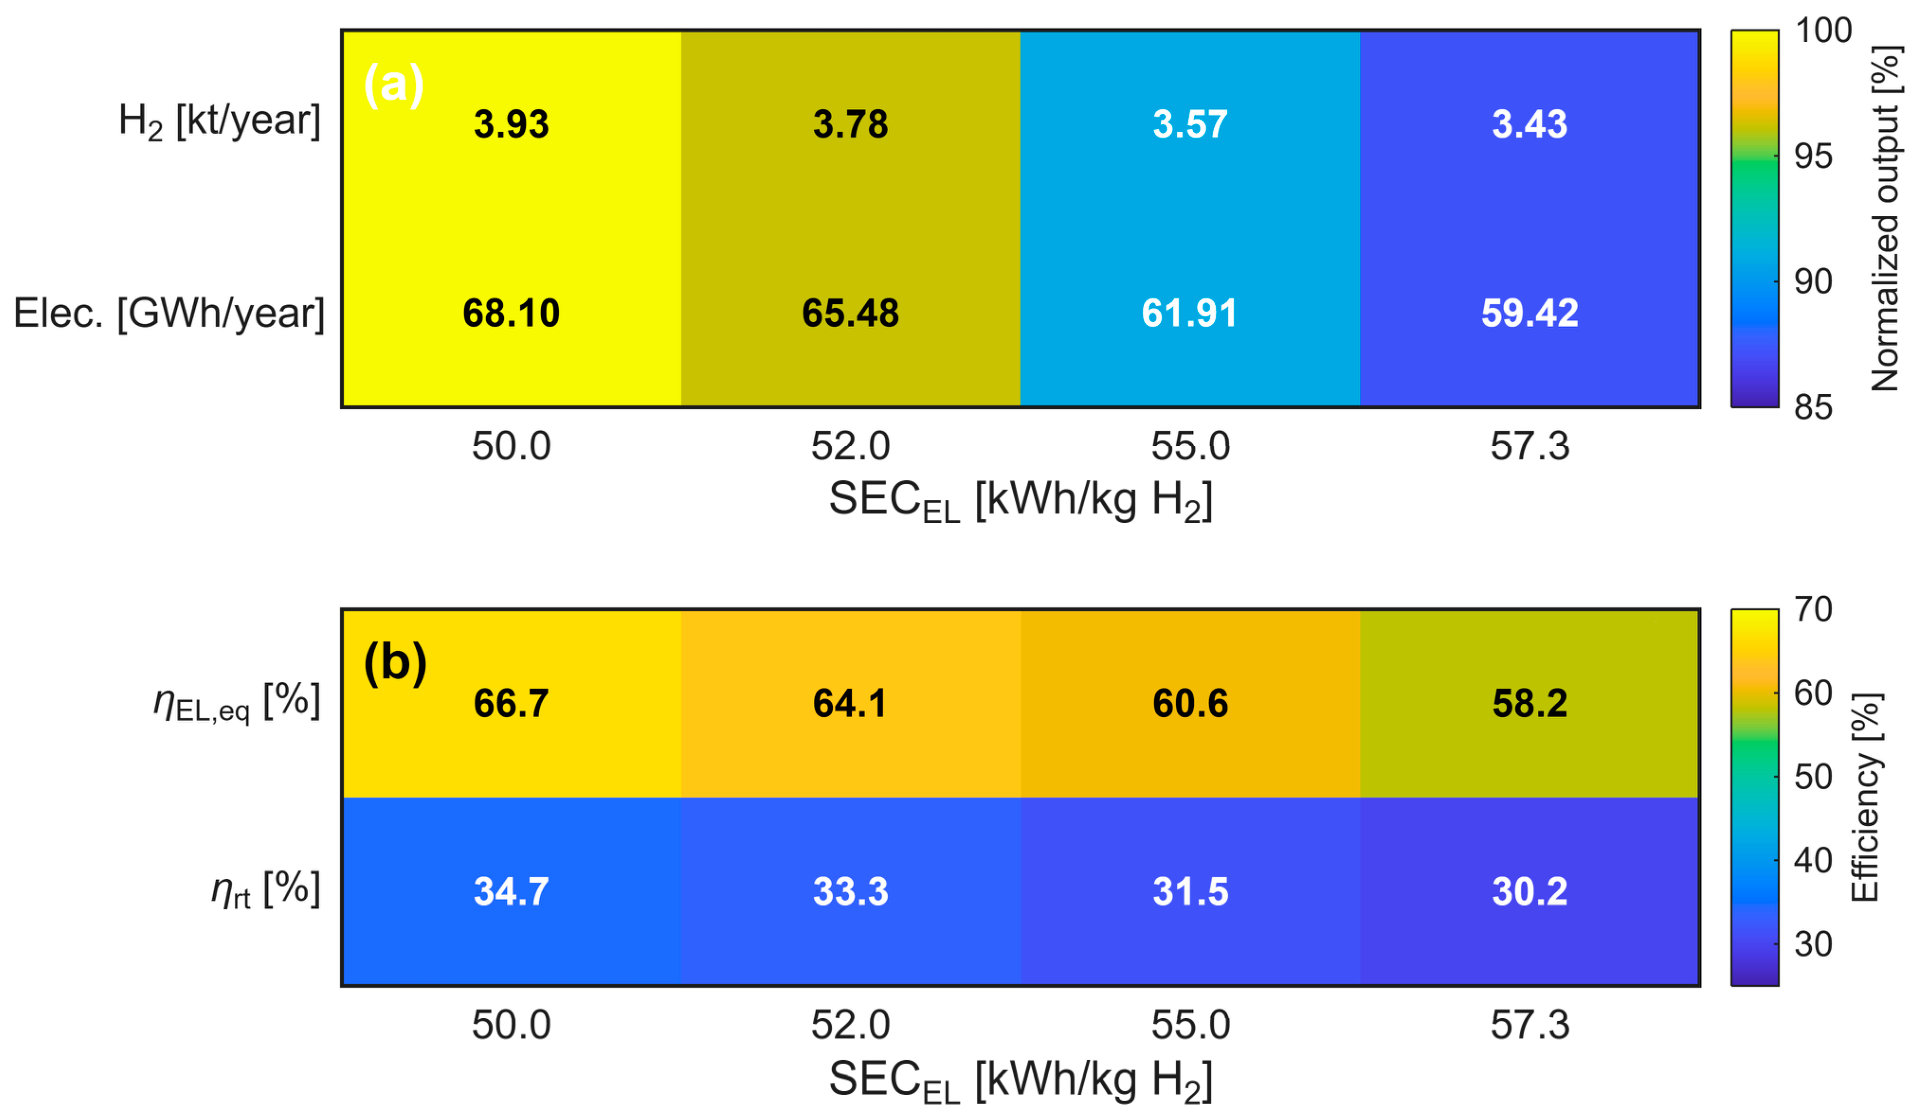
The hydrogen production potential depends directly on the electrolyzer specific energy consumption, . A sensitivity analysis was therefore performed using four values, 50, 52, 55, and 57.3 kWh/kg H2, representing optimistic, reference, conservative, and high-consumption cases for the hydrogen pathway.
Figure 3 shows that increasing
from 50 to 57.3 kWh/kg H
2 reduces the estimated hydrogen production from 3.93 to 3.43 kt H
2/year. Over the same range, the recoverable electricity through the fuel-cell pathway decreases from 68.10 to 59.42 GWh/year. The efficiency panel reinforces this trend, with the equivalent electrolyzer efficiency decreasing from 66.7% to 58.2%, and the electricity-to-electricity efficiency decreasing from 34.7% to 30.2%.
4.3. Hydrogen Storage Autonomy for Critical-Load Support
The restoration-support value of hydrogen depends not only on annual production potential but also on the amount of usable electricity available from stored hydrogen. For the reference storage module of 25,000 kg H2, the chemical energy stored on an LHV basis is approximately 833.25 MWh. Assuming a fuel-cell electrical efficiency of 52%, the usable electricity available through the fuel-cell pathway is 433.29 MWh.
Table 7 summarizes the equivalent autonomy provided by the selected 25 t H
2 storage module under four critical-load levels. The calculation uses 433.29 MWh of usable electricity available after fuel-cell reconversion. The critical-load levels are defined as 1%, 3%, 5%, and 10% of a 3000 MW reference demand, corresponding to 30, 90, 150, and 300 MW, respectively.
These results show that hydrogen provides its strongest restoration value when it is directed toward priority loads rather than broad system-wide demand replacement. The 1% case may represent essential services such as control centres, hospitals, telecommunications, water pumping, emergency response facilities, and selected strategic feeders. As the critical-load level increases, the same stored energy is distributed over a larger demand requirement, reducing the available autonomy.
4.4. Avoided Critical Energy Not Served During Restoration Events
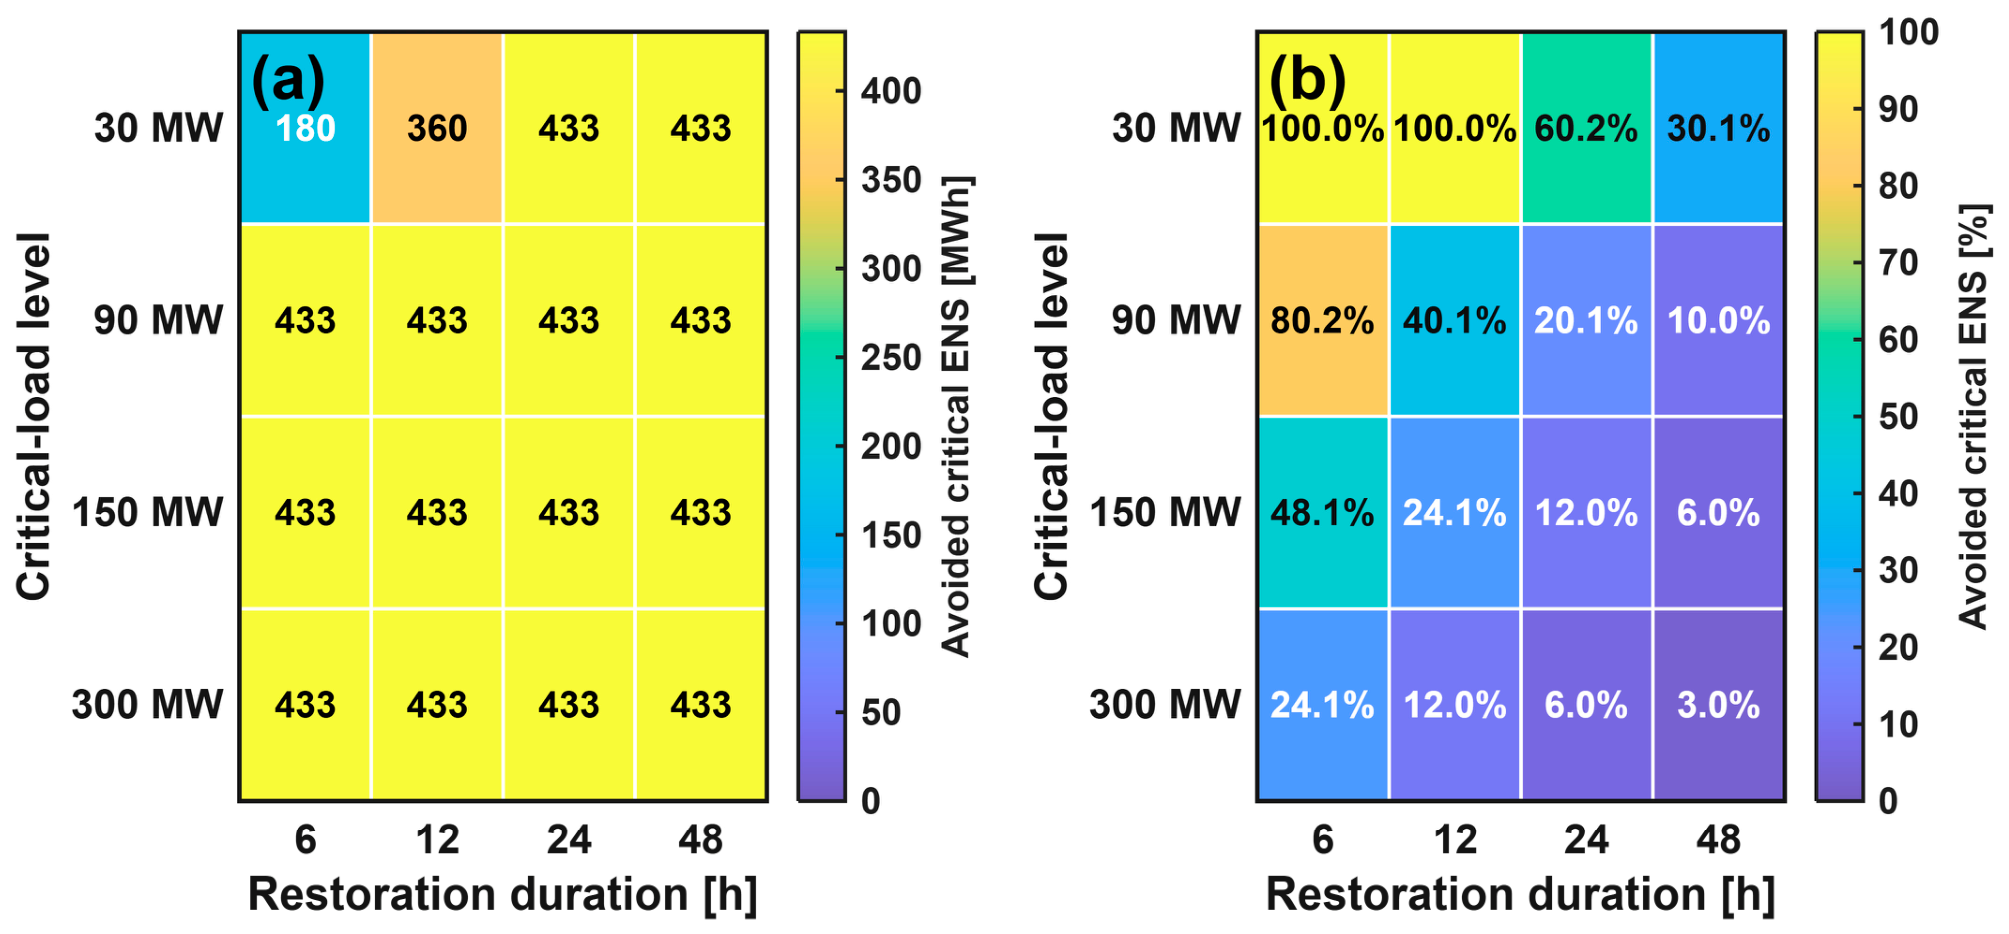
Figure 4 evaluates the avoided critical ENS under different restoration-event durations and critical-load levels. The analysis considers restoration windows of 6, 12, 24, and 48 h. In absolute terms, the hydrogen storage module can provide up to 433.29 MWh of usable electricity through the fuel-cell pathway. This explains why several cases in
Figure 4a reach approximately 433 MWh: in those conditions, the available hydrogen energy is fully dispatched and becomes the limiting factor.
The percentage reduction in critical ENS, shown in
Figure 4b, provides a clearer interpretation of the restoration contribution. For the 1% critical-load case, equivalent to 30 MW, the hydrogen storage module fully covers 6 h and 12 h restoration events. It also reduces critical ENS by 60.2% for a 24 h event and by 30.1% for a 48 h event. For higher critical-load levels, the relative contribution decreases because the same stored energy must supply a larger demand requirement. At 10% of demand, equivalent to 300 MW, the avoided critical ENS decreases from 24.1% for a 6 h event to 3.0% for a 48 h event.
The matrix supports the interpretation of green hydrogen as a targeted restoration-support resource. Its main contribution is not to replace conventional generation or supply broad system-wide demand but to extend energy availability for priority loads during short- and medium-duration recovery windows. This role is especially relevant in systems where restoration may be constrained by limited reserves, fuel logistics, transmission constraints, or reduced dispatchable generation availability.
The restoration-support matrix can also be translated into a storage-sizing rule by estimating the H
2 mass required for full critical-load coverage under each restoration window. This additional interpretation is presented in
Section 4.5.
4.5. Restoration Coverage Ratio and Hydrogen Storage Sizing Rule
The restoration matrix in
Figure 4 can be further interpreted through the Restoration Coverage Ratio,
, and the hydrogen storage-sizing rule defined in
Section 2.5. Since the restoration assessment is energy-based, the usable electricity available from stored hydrogen scales directly with the stored hydrogen mass. Under the reference configuration, each tonne of stored H
2 provides approximately 17.33 MWh of usable electricity through the fuel-cell pathway. This value converts the restoration-support results into a practical sizing criterion for estimating the hydrogen storage required to fully cover a given critical-load level during a selected restoration window.
Table 8 translates the restoration-support cases into hydrogen storage requirements. For the 30 MW critical-load case, full coverage requires 10.4 t H
2 for 6 h and 20.8 t H
2 for 12 h, which explains why the reference 25 t H
2 module fully covers both restoration windows. Full coverage of the same 30 MW load for 24 h and 48 h would require 41.5 t H
2 and 83.1 t H
2, respectively. For broader restoration targets, the required storage increases proportionally with the critical-load level, reaching 830.8 t H
2 for a 300 MW critical load over 48 h.
This sizing rule extends the interpretation of the restoration matrix by converting avoided critical ENS into a direct storage requirement. Instead of evaluating only a fixed hydrogen module, the approach allows planners to estimate the amount of stored H2 needed for a selected priority-load level and restoration duration. In this way, the proposed assessment moves from a single-case restoration estimate toward a scalable planning tool for hydrogen-based support in renewable-rich power systems.
In addition to storage sizing, restoration planning also requires evaluating whether the fuel-cell unit can deliver the required critical-load power during the restoration window.
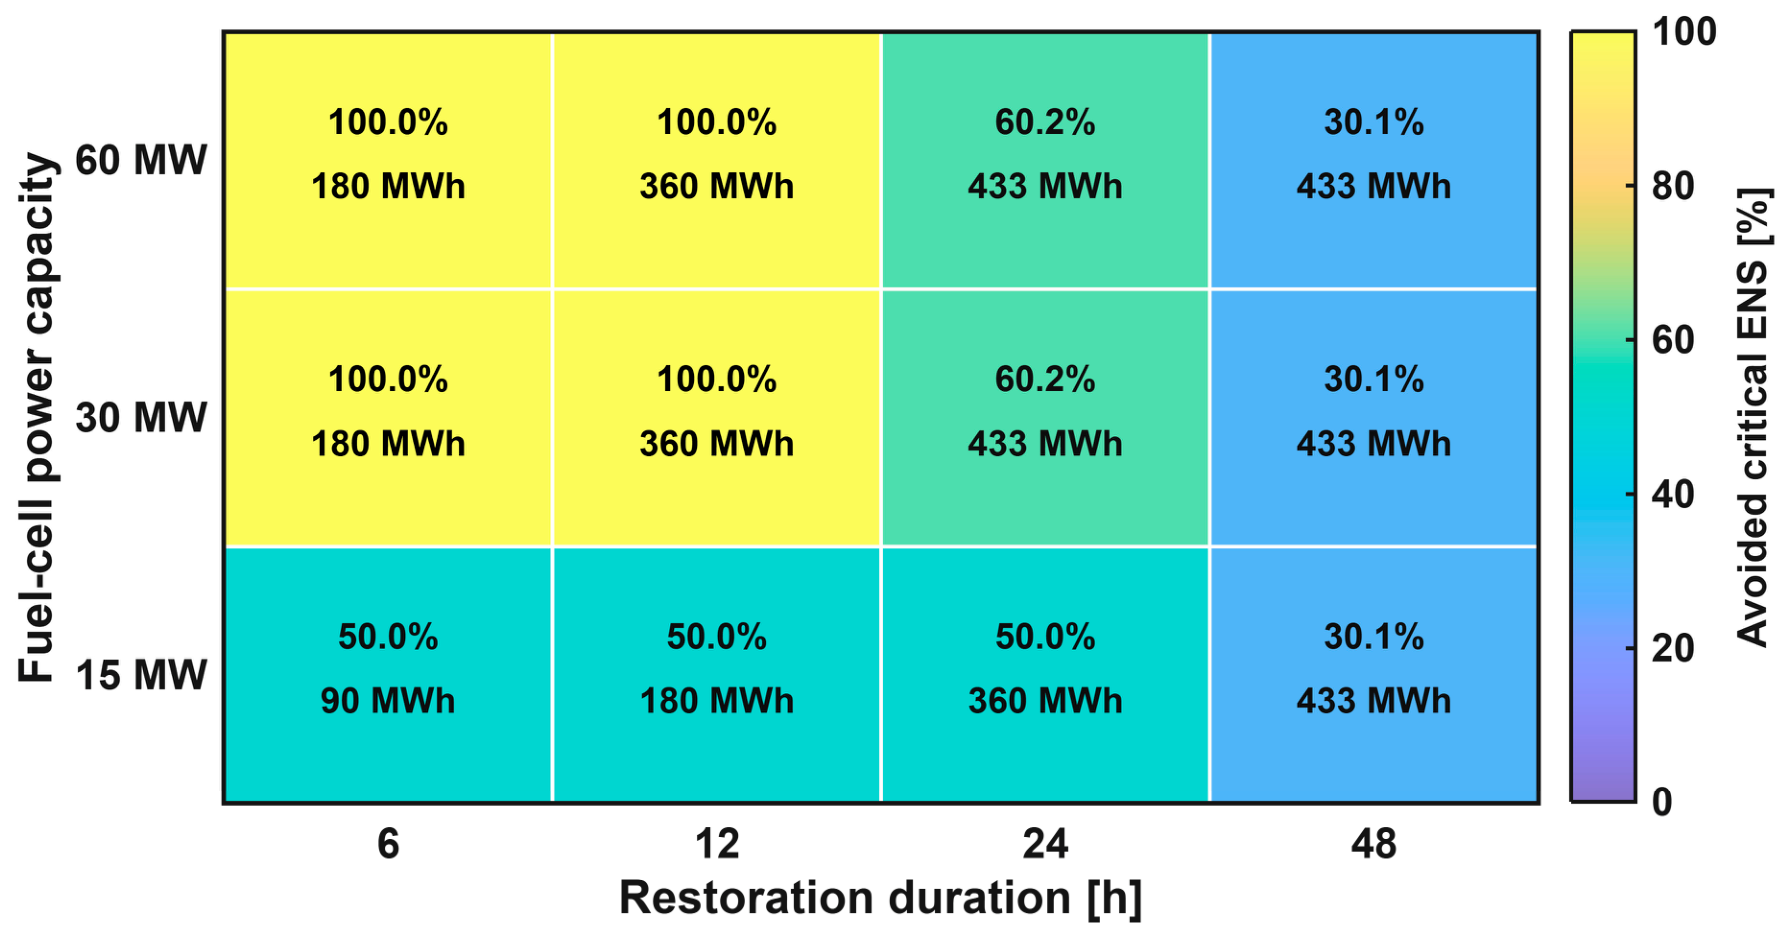
Figure 5 separates stored-energy availability from deliverable restoration power for the 30 MW critical-load case. The results show that a 15 MW fuel-cell unit is power-limited and can supply only half of the required critical-load power, limiting avoided critical ENS to 50% for the 6 h and 12 h restoration windows despite the availability of stored hydrogen. With a 30 MW fuel-cell unit, the module fully covers the 6 h and 12 h cases and reduces critical ENS by 60.2% and 30.1% during the 24 h and 48 h events, respectively. Increasing the fuel-cell capacity to 60 MW does not improve the results for this load level, because the deliverable power already exceeds the 30 MW critical-load requirement and the limiting factor becomes the available stored energy.
4.6. Annual Energy Conversion Balance
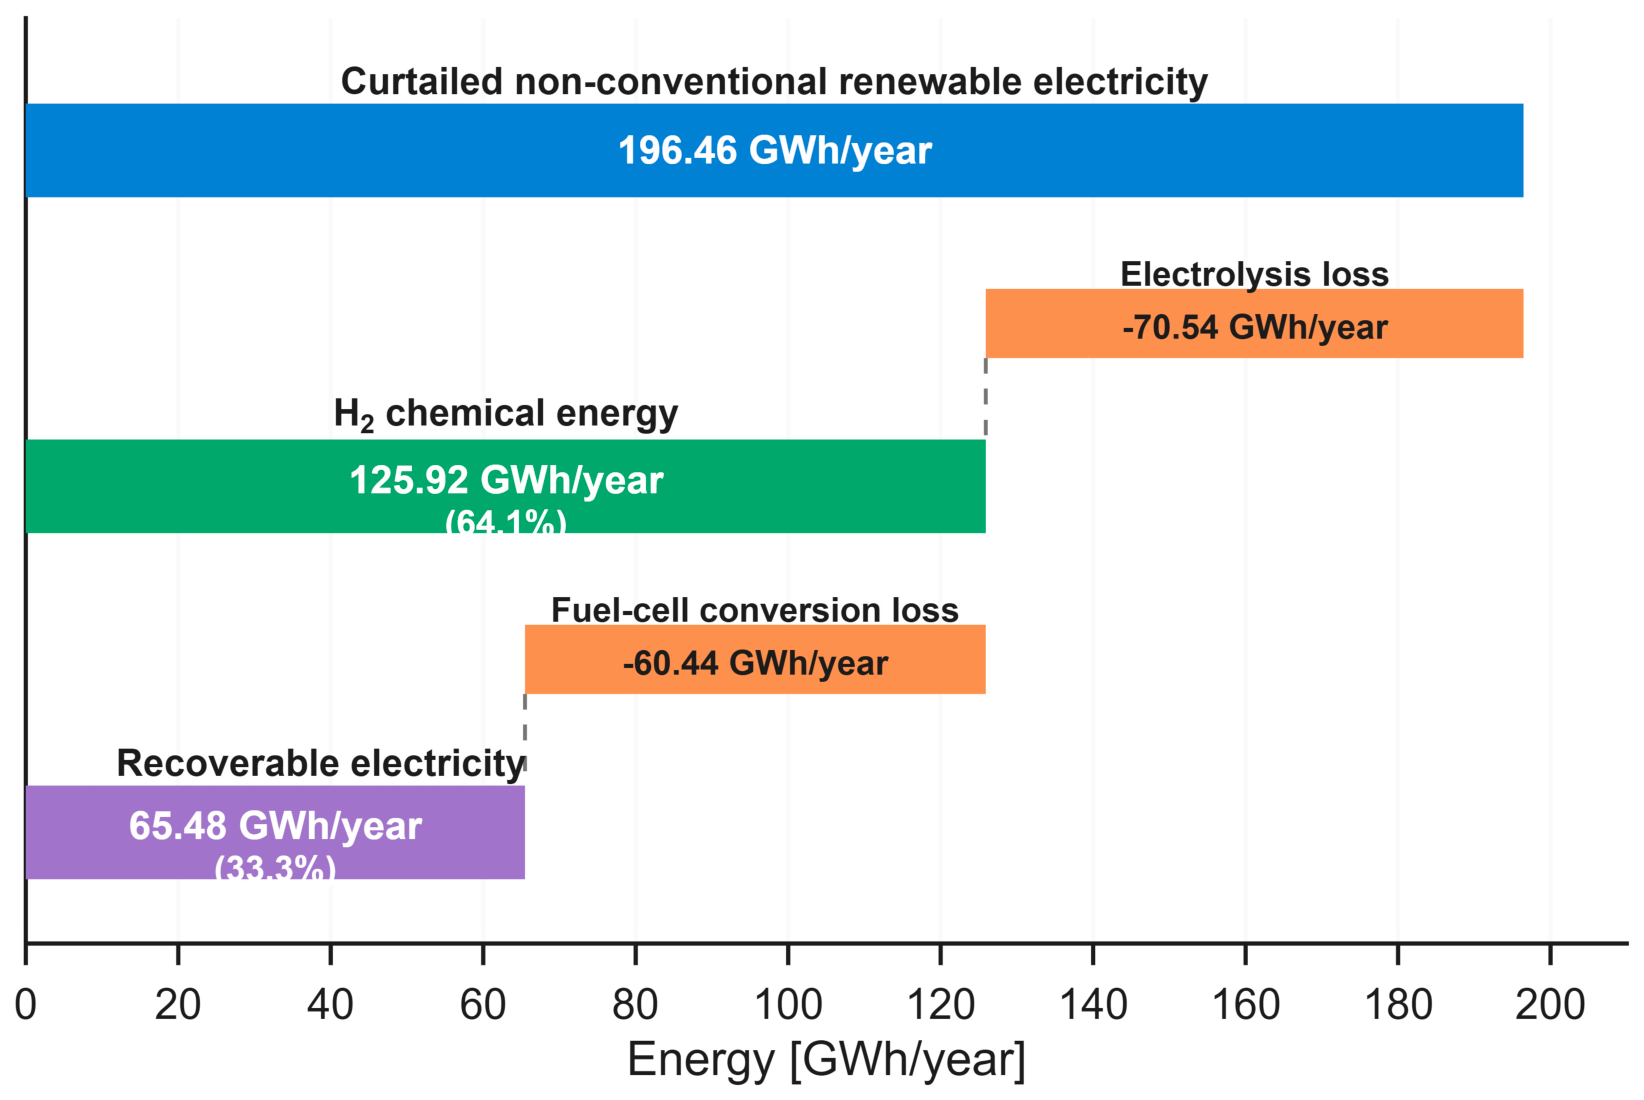
Figure 6 summarizes the annual energy conversion balance of the curtailment-to-hydrogen pathway. Starting from the 196.46 GWh/year of curtailed non-conventional renewable electricity reported by OC-SENI for 2025, the reference case yields 125.92 GWh/year of hydrogen chemical energy after electrolysis. This corresponds to 64.1% of the original curtailed-electricity input on an LHV basis. After reconversion through the fuel-cell pathway, the recoverable electricity is reduced to 65.48 GWh/year, equivalent to an overall electricity-to-electricity recovery of 33.3%.
The annual balance also shows the conversion losses associated with electrolysis and fuel-cell reconversion. These losses should be interpreted in relation to the nature of the energy input. The electricity used for hydrogen production corresponds to curtailed non-conventional renewable generation that was technically available but not absorbed by the grid under the reference curtailment conditions. Therefore, the recovered electricity has a different operational value from the original curtailed electricity: it is no longer tied to the moment at which curtailment occurs and can be stored for later use during restoration windows. Thus, the pathway converts otherwise unused renewable electricity into a dispatchable energy reserve, adding a resilience layer for critical-load support despite its limited round-trip efficiency.
4.7. Sensitivity to Curtailment Availability
To evaluate how the pathway responds to changes in the available curtailment resource, the annual curtailed non-conventional renewable electricity was varied by ±20% around the 2025 OC-SENI reference case, while keeping
and
. As shown in
Table 9, hydrogen production varies from 3.02 to 4.53 kt H
2/year, while recoverable electricity ranges from 52.38 to 78.57 GWh/year. The nearly linear response indicates that the pathway scales directly with the amount of curtailed renewable electricity available for conversion.
4.8. Economic Valuation of Hydrogen-Based Restoration Support
The technical results were translated into economic indicators to evaluate the cost scale of the curtailment-to-hydrogen pathway and its restoration-support value. The economic valuation uses the annual hydrogen production, the recoverable electricity obtained after fuel-cell reconversion, and the avoided critical ENS estimated in the restoration matrix. This allows the pathway to be assessed not only as an energy-conversion option but also as a resource that can preserve otherwise curtailed renewable electricity for priority-load support during recovery periods.
The economic indicators are intended as screening-level planning metrics rather than final project-finance results. They are used to compare the relative cost scale of hydrogen production, recovered electricity, and avoided critical ENS under consistent assumptions. A detailed investment assessment would require site-specific engineering design, financing structure, operating strategy, component degradation, maintenance scheduling, and market or regulatory remuneration mechanisms.
Because several site-specific cost components are not explicitly modelled, including detailed compression-system design, water treatment, land, permitting, grid interconnection, detailed safety systems, component replacement, leakage management, standby losses, emergency-operation maintenance, taxes, insurance, and site-specific civil works, the resulting LCOH and LCOR values should be interpreted as screening-level cost indicators rather than bankable project-cost values.
Table 10 summarizes the reference parameters used for the economic valuation of the hydrogen restoration pathway. These parameters include electrolyzer CAPEX, fixed operation and maintenance costs, fuel-cell CAPEX, hydrogen storage cost, the discount rate, project lifetime, curtailed-electricity opportunity cost, and the main annual model outputs used in the economic calculations.
Table 11 summarizes the economic indicators of the annual curtailment-to-hydrogen pathway under different curtailed-electricity opportunity-cost values. Based on the reference economic parameters in
Table 10, the annualized cost of the 60 MW electrolyzer is approximately 7.59 MUSD/year. When the curtailed electricity is assigned zero opportunity cost, the levelized cost of hydrogen is approximately 2.01 USD/kg H
2. If the opportunity cost of curtailed electricity is increased to 10 and 20 USD/MWh, the corresponding values increase to 2.53 and 3.05 USD/kg H
2, respectively. This result shows that the economic interpretation of green hydrogen from curtailment depends strongly on whether curtailed electricity is treated as an otherwise unused resource or assigned a positive planning value.
The levelized cost of recovered electricity follows the same trend. Considering the annualized cost of the electrolyzer and a 30 MW fuel-cell reconversion unit, the cost of recovered electricity is approximately 176 USD/MWh when the curtailed-electricity opportunity cost is zero. This value increases to 206 USD/MWh and 236 USD/MWh when the curtailed-electricity opportunity cost is set at 10 and 20 USD/MWh, respectively. These values should be interpreted in relation to the service provided: the recovered electricity is dispatchable and can be directed to priority loads during restoration windows, unlike the original curtailed electricity.
Table 12 reports the break-even value of the lost load for hydrogen-based restoration support as a function of the number of equivalent annual support events. The restoration-oriented economic indicator is the break-even value of lost load,
. For the 25 t H
2 module and a 30 MW fuel-cell unit, the annualized restoration-module cost is approximately 5.35 MUSD/year when hydrogen storage is represented using the DOE compressed-storage cost reference. For the 30 MW, 24 h restoration case, the module avoids 433.29 MWh of critical ENS. If one equivalent event is considered per year, the resulting
is approximately 12,350 USD/MWh of avoided critical ENS. This value decreases to approximately 6175 USD/MWh, 4116 USD/MWh, and 2470 USD/MWh if the same module provides equivalent restoration support during two, three, or five events per year, respectively.
These results show that the economic value of the pathway depends on the service being evaluated. For normal electricity arbitrage, the conversion losses associated with electrolysis and fuel-cell reconversion remain a constraint. For restoration support, the relevant comparison shifts toward avoided critical ENS, autonomy, and the value of maintaining priority loads during recovery periods. In this sense, hydrogen is better interpreted as a targeted resilience resource than as a direct substitute for short-duration storage. Accordingly, VOLLBE should be interpreted as a planning-level break-even indicator for avoided critical ENS, not as a market price or a validated willingness-to-pay value for the Dominican Republic power system.
4.9. Operational Carbon-Footprint Savings from Recovered Curtailed Renewable Electricity
The recovered electricity from the curtailment-to-hydrogen pathway can also be interpreted in terms of operational avoided carbon emissions. Under the reference case, the pathway provides 65.48 GWh/year of recoverable electricity after fuel-cell reconversion. Under the SENI grid-displacement assumptions, using the combined-margin emission factor of 0.6649 tCO2/MWh results in approximately 43.54 ktCO2/year of avoided operational emissions, while using the simplified 2024 emission factor of 0.6277 tCO2/MWh results in approximately 41.10 ktCO2/year. These values translate the recovered curtailed renewable electricity into an operational carbon-footprint savings indicator. The same calculation can be expressed per unit of stored hydrogen. Under the reference fuel-cell efficiency, each tonne of stored H2 provides approximately 17.33 MWh of usable electricity. This corresponds to about 11.52 tCO2/t H2 when the combined-margin factor is used or 10.88 tCO2/t H2 when using the simplified emission factor. For the 25 t H2 storage module, the associated operational carbon-footprint savings are therefore approximately 288.1 tCO2 and 272.0 tCO2, respectively, when the module is fully discharged under the SENI grid-displacement assumptions.
Table 13 summarizes the carbon-footprint savings obtained from the recovered curtailed renewable electricity under alternative counterfactual assumptions. The no-supply case represents a boundary condition in which the hydrogen pathway reduces critical ENS but does not displace a carbon-emitting electricity source. The SENI grid-displacement cases use the selected Dominican grid emission factors. The diesel-backup displacement case represents a restoration condition in which critical loads would otherwise be supplied by local diesel generation. This scenario is included as a planning sensitivity to address the uncertainty associated with the actual displaced source during restoration events.
The avoided-emissions result depends on the counterfactual electricity source. If the alternative during restoration is no supply, the hydrogen pathway should not be credited with avoided emissions, although it still provides a resilience benefit by reducing critical ENS. Under SENI grid-displacement assumptions, the annual recovered electricity avoids 41.10–43.54 ktCO2/year, while the selected 25 t H2 module avoids 272.0–288.1 tCO2 when fully discharged. Under the diesel-backup displacement scenario, avoided emissions increase to 52.38 ktCO2/year at the annual scale and 346.6 tCO2 for the 25 t H2 restoration module. In this sense, the curtailment-to-hydrogen pathway provides a dual contribution when it displaces the carbon-emitting supply: it reduces critical ENS during restoration windows and converts otherwise unused renewable electricity into a measurable carbon-footprint benefit.
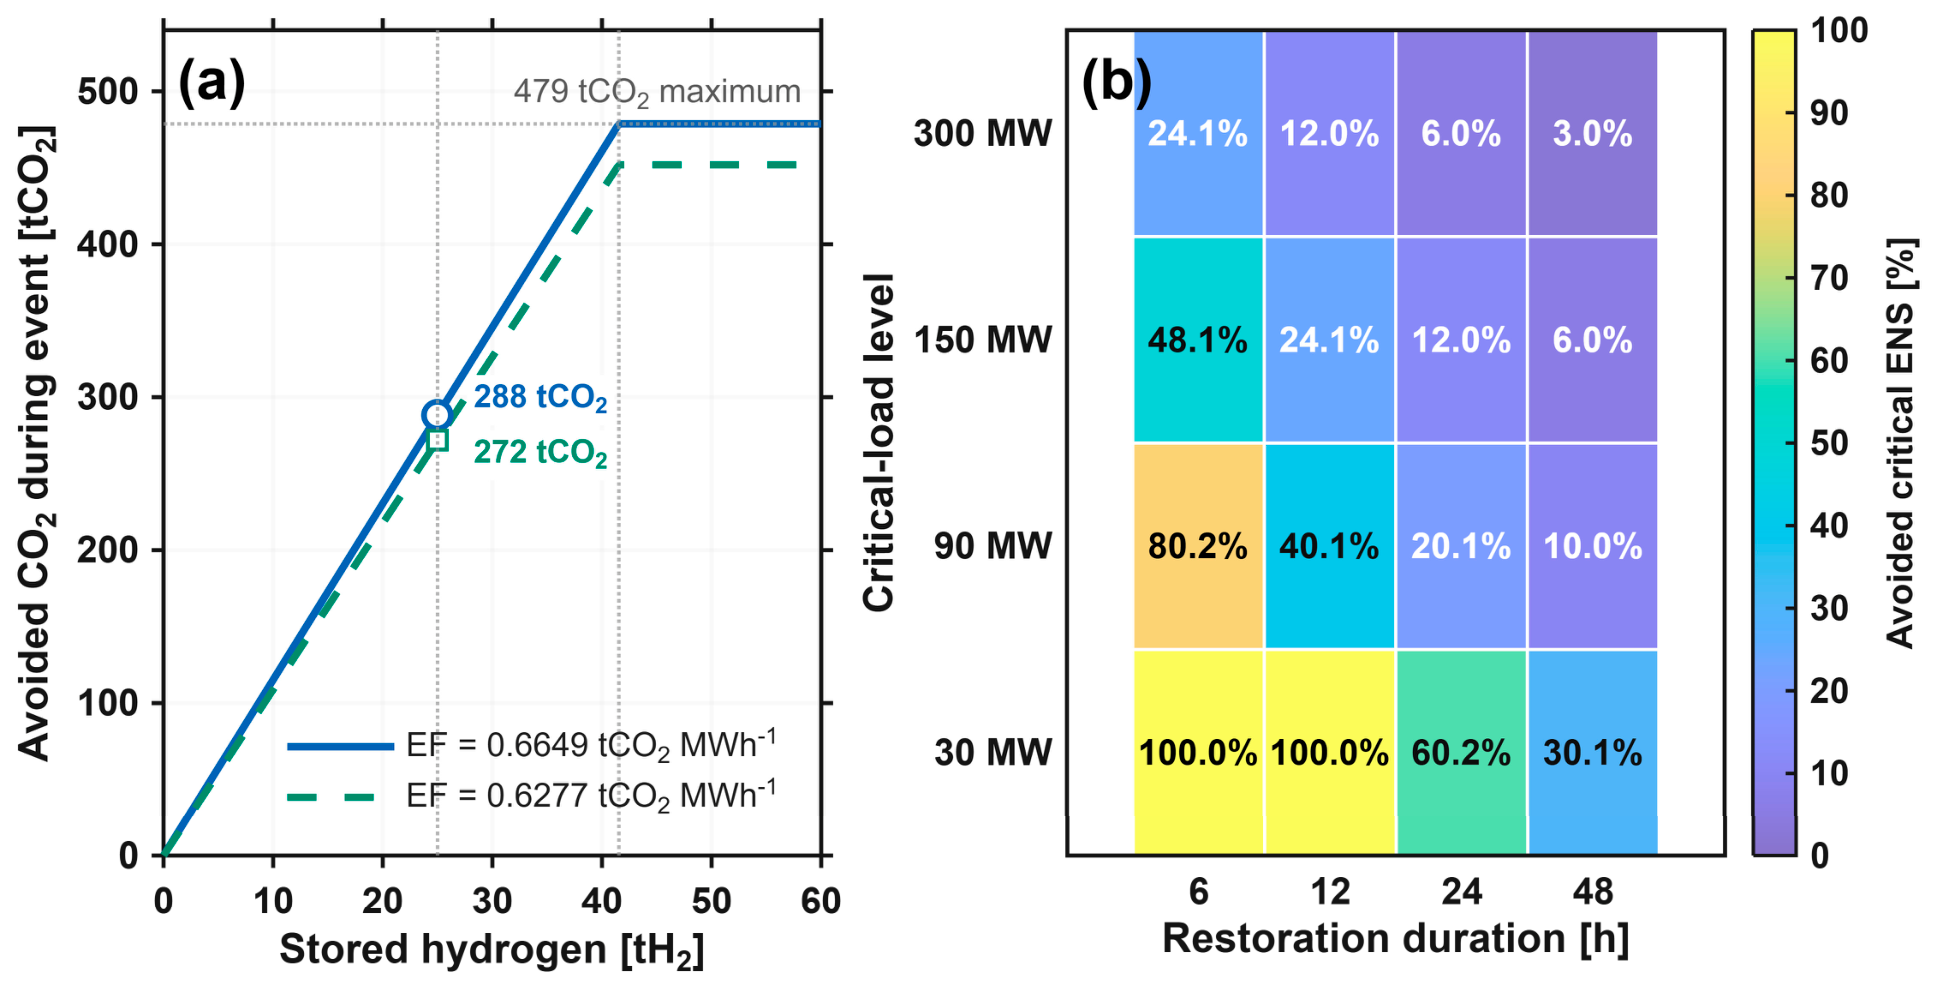
Figure 7 complements this tabular assessment by showing how avoided CO
2 emissions scale with stored hydrogen under the two SENI grid-displacement emission-factor assumptions, while also showing how the selected 25 t H
2 module reduces critical ENS across restoration durations and critical-load levels.
Figure 7 links the restoration-support contribution of stored hydrogen with its associated carbon-footprint benefit under the two SENI grid-displacement emission-factor assumptions. For the 30 MW–24 h restoration case, avoided CO
2 increases almost linearly with stored hydrogen until the critical-load energy requirement is fully covered. The 25 t H
2 module provides 433.29 MWh of usable electricity, corresponding to approximately 288 tCO
2 avoided under the SENI combined-margin emission factor and 272 tCO
2 under the simplified SENI factor. Full coverage of the 30 MW–24 h case would require approximately 41.5 t H
2; beyond this point, additional stored hydrogen does not increase the avoided emissions for that specific event, because the critical-load requirement has already been satisfied. The diesel-backup displacement case is reported in
Table 13 as an additional counterfactual sensitivity and is not plotted in
Figure 7 to keep the figure focused on the grid-displacement cases.
The carbon-resilience matrix further shows that the same hydrogen module provides the greatest relative contribution when directed to smaller priority-load levels and shorter restoration windows. For the 30 MW case, the module fully covers 6 h and 12 h events, while reducing critical ENS by 60.2% during a 24 h event and 30.1% during a 48 h event. For higher critical-load levels, avoided CO2 remains constrained by the available stored energy, while the percentage reduction in critical ENS decreases as the required restoration energy increases. These results confirm that hydrogen produced from curtailed renewable electricity is better interpreted as a targeted carbon-resilience resource for priority-load support than as a broad system-wide replacement source.
4.10. Sensitivity Synthesis and Robustness Interpretation
The sensitivity analyses show that the value of the curtailment-to-hydrogen-to-restoration pathway is governed by resource availability, conversion performance, restoration-power delivery, restoration-service utilization, economic assumptions, and the displaced counterfactual electricity source.
Table 14 summarizes the main sensitivity dimensions evaluated in the study and links each parameter to the affected performance indicators. The table is intended as a compact screening-level synthesis across the technical, restoration, economic, and operational carbon-footprint results.
Overall, the sensitivity synthesis confirms that the proposed pathway is most favourable when curtailed renewable electricity is abundant, electrolyzer and fuel-cell performance are close to reference or improved values, the fuel-cell unit is sized to match the priority-load power requirement, and the storage module is used across multiple high-value restoration events. Conversely, the value decreases when curtailment availability is low, conversion performance is lower, reconversion is power-limited, the opportunity cost of curtailed electricity is high, the restoration module is rarely used, or the displaced counterfactual source has low carbon intensity. These results support the interpretation of the pathway as a screening-level planning option rather than a site-specific project design.
4.11. Energy-Policy and Planning Implications
The results provide several energy-policy and planning implications for insular power systems with high renewable penetration. First, renewable curtailment should be monitored not only as an operational loss but also as a planning signal for flexibility, storage, and resilience-oriented energy conversion. In systems with growing solar and wind penetration, the magnitude and timing of curtailment can inform electrolyzer operation, hydrogen production potential, storage sizing, and reconversion requirements.
Second, hydrogen storage sizing should follow the intended service. The storage-sizing rule derived in this study shows that priority-load support, curtailment absorption, and long-duration energy shifting require different design choices. For restoration planning, the required H2 mass scales directly with the critical-load level and the duration of the recovery window. This allows planners to move from a fixed storage module toward service-based sizing criteria linked to RCR, avoided critical ENS, and critical-load autonomy.
Third, the reconversion unit should be sized according to the power requirement of the priority load. The fuel-cell power-delivery sensitivity shows that stored hydrogen availability alone does not guarantee full restoration support if the fuel-cell unit cannot deliver the required critical-load power during the restoration window. Therefore, hydrogen-based restoration planning should jointly consider the stored hydrogen mass, usable energy, fuel-cell rated power, and restoration duration.
Fourth, the value of the hydrogen pathway should be interpreted through the service it provides. For restoration planning, indicators such as avoided critical ENS, critical-load autonomy, recoverable electricity during restoration windows, and break-even VOLL offer a more useful basis for decision-making than conversion efficiency alone. These metrics help identify where hydrogen storage can provide value as a resilience-oriented complement to short-duration flexibility resources.
The transferability of the framework depends on local curtailment patterns, generation mix, counterfactual emission factors, critical-load definitions, fuel-logistics constraints, and the availability of alternative restoration resources. In systems with higher renewable curtailment and greater dependence on fossil-based backup during restoration, the hydrogen pathway may provide higher carbon-resilience value. In systems with low curtailment, strong interconnection, abundant short-duration storage, or low-carbon backup resources, the additional value of the same pathway may be lower. Therefore, the numerical results are case-specific, while the assessment structure can be transferred to other insular or weakly interconnected systems by updating the curtailment input, hydrogen-system parameters, restoration criteria, cost assumptions, and emission-factor scenarios.
5. Conclusions
This study assessed green hydrogen as a critical-load restoration resource for power systems with high renewable penetration. The proposed framework links curtailed non-conventional renewable electricity, PEM electrolysis, hydrogen storage, fuel-cell reconversion, priority-load support, avoided critical Energy Not Served (ENS), economic valuation, and carbon-footprint savings. Using the Dominican Republic as a representative insular case, the results show that otherwise unused renewable electricity can be assessed, at the screening level, as a potential input for producing stored hydrogen that may support priority loads during restoration windows.
Under the reference case, 196.46 GWh/year of curtailed non-conventional renewable electricity reported by OC-SENI for 2025 produces an estimated 3.78 kt H2/year, equivalent to 125.92 GWh/year of hydrogen chemical energy and 65.48 GWh/year of recoverable electricity through the fuel-cell pathway. Although the resulting electricity-to-electricity efficiency is approximately 33.3%, this value should be interpreted in relation to the nature of the input energy, which would otherwise remain unused under curtailment conditions. In this sense, the pathway does not only compete as a conventional energy-arbitrage option but as a mechanism for converting non-absorbed renewable electricity into stored energy with restoration value.
The restoration-support results show that a 25 t H2 storage module provides approximately 433.29 MWh of usable electricity. Under the illustrative 1% critical-load tier, equivalent to 30 MW under the reference demand, this is sufficient to fully cover 6 h and 12 h restoration events. For longer restoration windows, the same module reduces critical ENS by 60.2% during a 24 h event and 30.1% during a 48 h event. The sensitivity analysis confirms that electrolyzer performance directly affects the pathway: increasing from 50 to 57.3 kWh/kg H2 reduces hydrogen production from 3.93 to 3.43 kt H2/year and recoverable electricity from 68.10 to 59.42 GWh/year. A ±20% sensitivity on the annual curtailment availability further shows that recoverable electricity ranges from 52.38 to 78.57 GWh/year, confirming that the pathway scales directly with the amount of curtailed renewable electricity available for conversion.
The economic assessment indicates that the value of hydrogen-based restoration depends strongly on the service being evaluated. When curtailed electricity is assigned an opportunity cost between 0 and 20 USD/MWh, the levelized cost of hydrogen ranges from 2.01 to 3.05 USD/kg H2, while the levelized cost of recovered electricity ranges from 176 to 236 USD/MWh. For restoration support, the break-even value of the lost load decreases from 12,350 USD/MWh for one equivalent annual event to 2470 USD/MWh when the same module provides five equivalent support events per year. These results show that the economic interpretation of the pathway improves when the recovered electricity is valued through avoided critical ENS rather than through round-trip efficiency alone. These economic values should therefore be interpreted as planning-level screening indicators under the stated assumptions rather than as bankable project-cost estimates or validated market values.
The operational carbon-footprint assessment adds a complementary environmental dimension to the restoration value of the pathway. Under the reference grid-displacement case, the 65.48 GWh/year of recoverable electricity can avoid approximately 43.54 ktCO2/year using the SENI combined-margin emission factor. At the restoration-module level, the 25 t H2 storage module avoids approximately 288.1 tCO2 when fully discharged under the same grid-displacement assumption, while the diesel-backup displacement sensitivity increases this value to 346.6 tCO2. Therefore, hydrogen produced from curtailed renewable electricity can provide a combined carbon-resilience contribution when it displaces the carbon-emitting supply: it reduces critical ENS while also converting non-absorbed renewable generation into lower-carbon support for priority loads.
Overall, the study shows that green hydrogen produced from curtailed renewable electricity has screening-level potential as a targeted restoration layer when directed toward priority loads and evaluated through service-based indicators. The proposed framework provides a planning-oriented interpretation of green hydrogen value by linking recovered electricity with avoided critical ENS, restoration coverage, economic performance, and operational carbon-footprint savings during critical-load restoration. However, practical deployment would require time-resolved curtailment data, validated critical-load profiles, dynamic restoration simulations, site-specific system design, and more detailed economic and life-cycle assessments.
Future work should extend the analysis using time-resolved curtailment data, capacity-constrained electrolyzer dispatch, hybrid battery–hydrogen coordination, dynamic restoration simulations with network constraints and critical-load prioritization, fuel-cell power-delivery constraints, detailed project-finance assumptions, and full life-cycle carbon assessment.