1. Introduction
The substantial volume of waste sludge generated in wastewater treatment plants requires appropriate treatment to prevent secondary pollution and to reduce the environmental impact. Waste sludge is characterized by an exceptionally high water content, along with a colloidal and compressible structure [
1]. After thickening, sludge is mechanically dewatered to achieve a 20–30% solids content [
2], a step critical for reducing transportation costs, improving calorific value for incineration, and minimizing leachate generation [
3]. Dewatering separates the sludge into two phases: dewatered sludge and an excess liquid phase, commonly referred to as “centrate”. Although centrate typically represents a small volumetric fraction, its return to the plant influent introduces high concentrations of dissolved organic matter, ammonia, and phosphorus. This internal recirculation increases organic and nutrient loading and may compromise overall process efficiency [
4,
5]. Since the centrate is returned to the inlet of the treatment plant, ineffective dewatering increases the return flow load, thereby intensifying internal recirculation and reducing operational resilience and process flexibility. Under variable hydraulic and pollutant loading conditions, accurate moisture monitoring becomes essential to maintain stable dewatering performance and to limit additional return loads to the main treatment line.
Sludge dewatering efficiency is a multifactorial process governed by the combined and interacting effects of conditioning strategies and operational parameters. Optimal polymer conditioning and dosage have been shown to significantly enhance sludge dewatering performance by promoting particle aggregation and reducing capillary suction time (CST) and specific resistance to filtration (SRF) [
6]. The assessment of sludge dewatering performance must consider the complexities of the process, including the physicochemical characteristics of the sludge and the limitations of traditional dewatering indices, as highlighted in comprehensive reviews [
7]. Moreover, various conditioning technologies and physicochemical properties influence dewaterability, reflecting that sludge dewatering performance represents the integrated outcome of interacting process variables rather than a single metric [
1]. Therefore, moisture content should be interpreted within this broader context of conditioning strategy, sludge properties, and mechanical operating settings.
Moisture content is a critical parameter for evaluating dewatering effectiveness, directly influencing disposal strategies, operational costs, and environmental impacts, especially in cases where sludge is incinerated [
8,
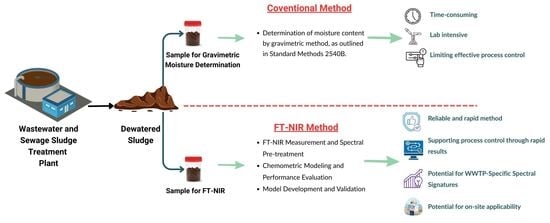
9]. Sludge moisture content is affected by the efficiency of dewatering equipment, feed water characteristics, type of treatment plant, and conditioning methods. Current sludge moisture monitoring relies on laboratory-based gravimetric method, which is highly time-consuming and therefore unsuitable for real-time process control [
10]. Existing process control practices focus on monitoring suspended solids in feed sludge and centrate, which provides only limited insight into dewatering performance and fails to directly reflect the moisture content of the final cake. Consequently, despite the critical role of moisture content, the lack of on-site, real-time measurement technologies remains a significant barrier to the automation and optimization of the dewatering process.
Information obtained from wavelength-dependent absorption measurements at the molecular level offers a promising alternative to conventional analytical methods. Near-Infrared (NIR) spectroscopy is a type of vibrational spectroscopic technique operating within the wavelength range of 750 to 2500 nm (13,300 to 4000 cm
−1) and is based on overtone and combination vibrations of hydrogen-containing molecular groups such as O–H, N–H, and C–H [
11]. In this spectral region, O–H overtones are typically dominant in moisture-containing materials, while C–H and N–H contributions provide additional information related to organic constituents. Although NIR bands are broader and less intense than the fundamental vibrations observed in conventional mid-infrared (mid-IR) spectroscopy, their lower absorptivity allows deeper radiation penetration and direct analysis of heterogeneous matrices with minimal sample preparation. Consequently, NIR spectra provide integrated information regarding the molecular structure, functional groups, and physical properties of a matrix. Recent technological advancements have enabled a transition from benchtop laboratory measurements to compact, non-intrusive instruments suitable for rapid, on-site, and real-time process monitoring [
12]. NIR spectroscopy is widely recognized as a robust analytical tool for moisture determination across diverse industries. Specifically, FT-NIR has demonstrated high performance in agricultural and food research, enabling simultaneous multi-parameter analysis with minimal sample preparation [
13,
14,
15]. In environmental engineering, NIR and FT-NIR spectroscopy have been investigated for wastewater quality monitoring, particularly for bulk physicochemical parameters such as chemical oxygen demand (COD), biochemical oxygen demand (BOD
5), total suspended solids (TSS), and related organic load indicators [
16]. NIR-based approaches have also been explored for the prediction of wastewater constituents including organic and nitrogen-related parameters [
17]. Furthermore, FT-NIR spectroscopy has been reported for the quantification of selected pharmaceutical compounds in wastewater matrices using chemometric modeling techniques [
18]. Moreover, previous studies have utilized FT-NIR to characterize sewage sludge stability, assess anaerobic digester performance, and model various compositional parameters [
19,
20,
21]. However, none of these studies addressed the quantitative prediction of moisture content in mechanically dewatered sewage sludge. Therefore, monitoring sludge moisture content is critical for the optimal operation of sludge dewatering units in wastewater treatment plants.
In this context, this study investigated the potential of FT-NIR spectroscopy as a rapid tool for estimating sludge moisture content using Partial Least Squares (PLS) regression. Principal Component Analysis (PCA) was applied to the spectral data to explore chemical relationships and matrix variations among dewatered sludge samples. Long-term, operationally diverse sludge samples collected from two wastewater treatment plants (WWTPs) were used to capture realistic temporal variability, including seasonal, operational, and plant-specific fluctuations in sludge characteristics. This long-term sampling strategy enables evaluation of model robustness under real operating conditions and highlights the potential for reliable in-line implementation in WWTPs. Beyond the experimental modelling, this research also assessed the applicability of in-line NIR spectroscopy for real-time monitoring of dewatering operations by comparing model performances from recent literature and addressing the practical challenges of on-site implementation in WWTPs. Successful implementation of this approach could substantially enhance sludge dewatering management, thereby improving operational efficiency and cost-effectiveness while reducing the environmental impact of wastewater treatment facilities.
2. Material and Methods
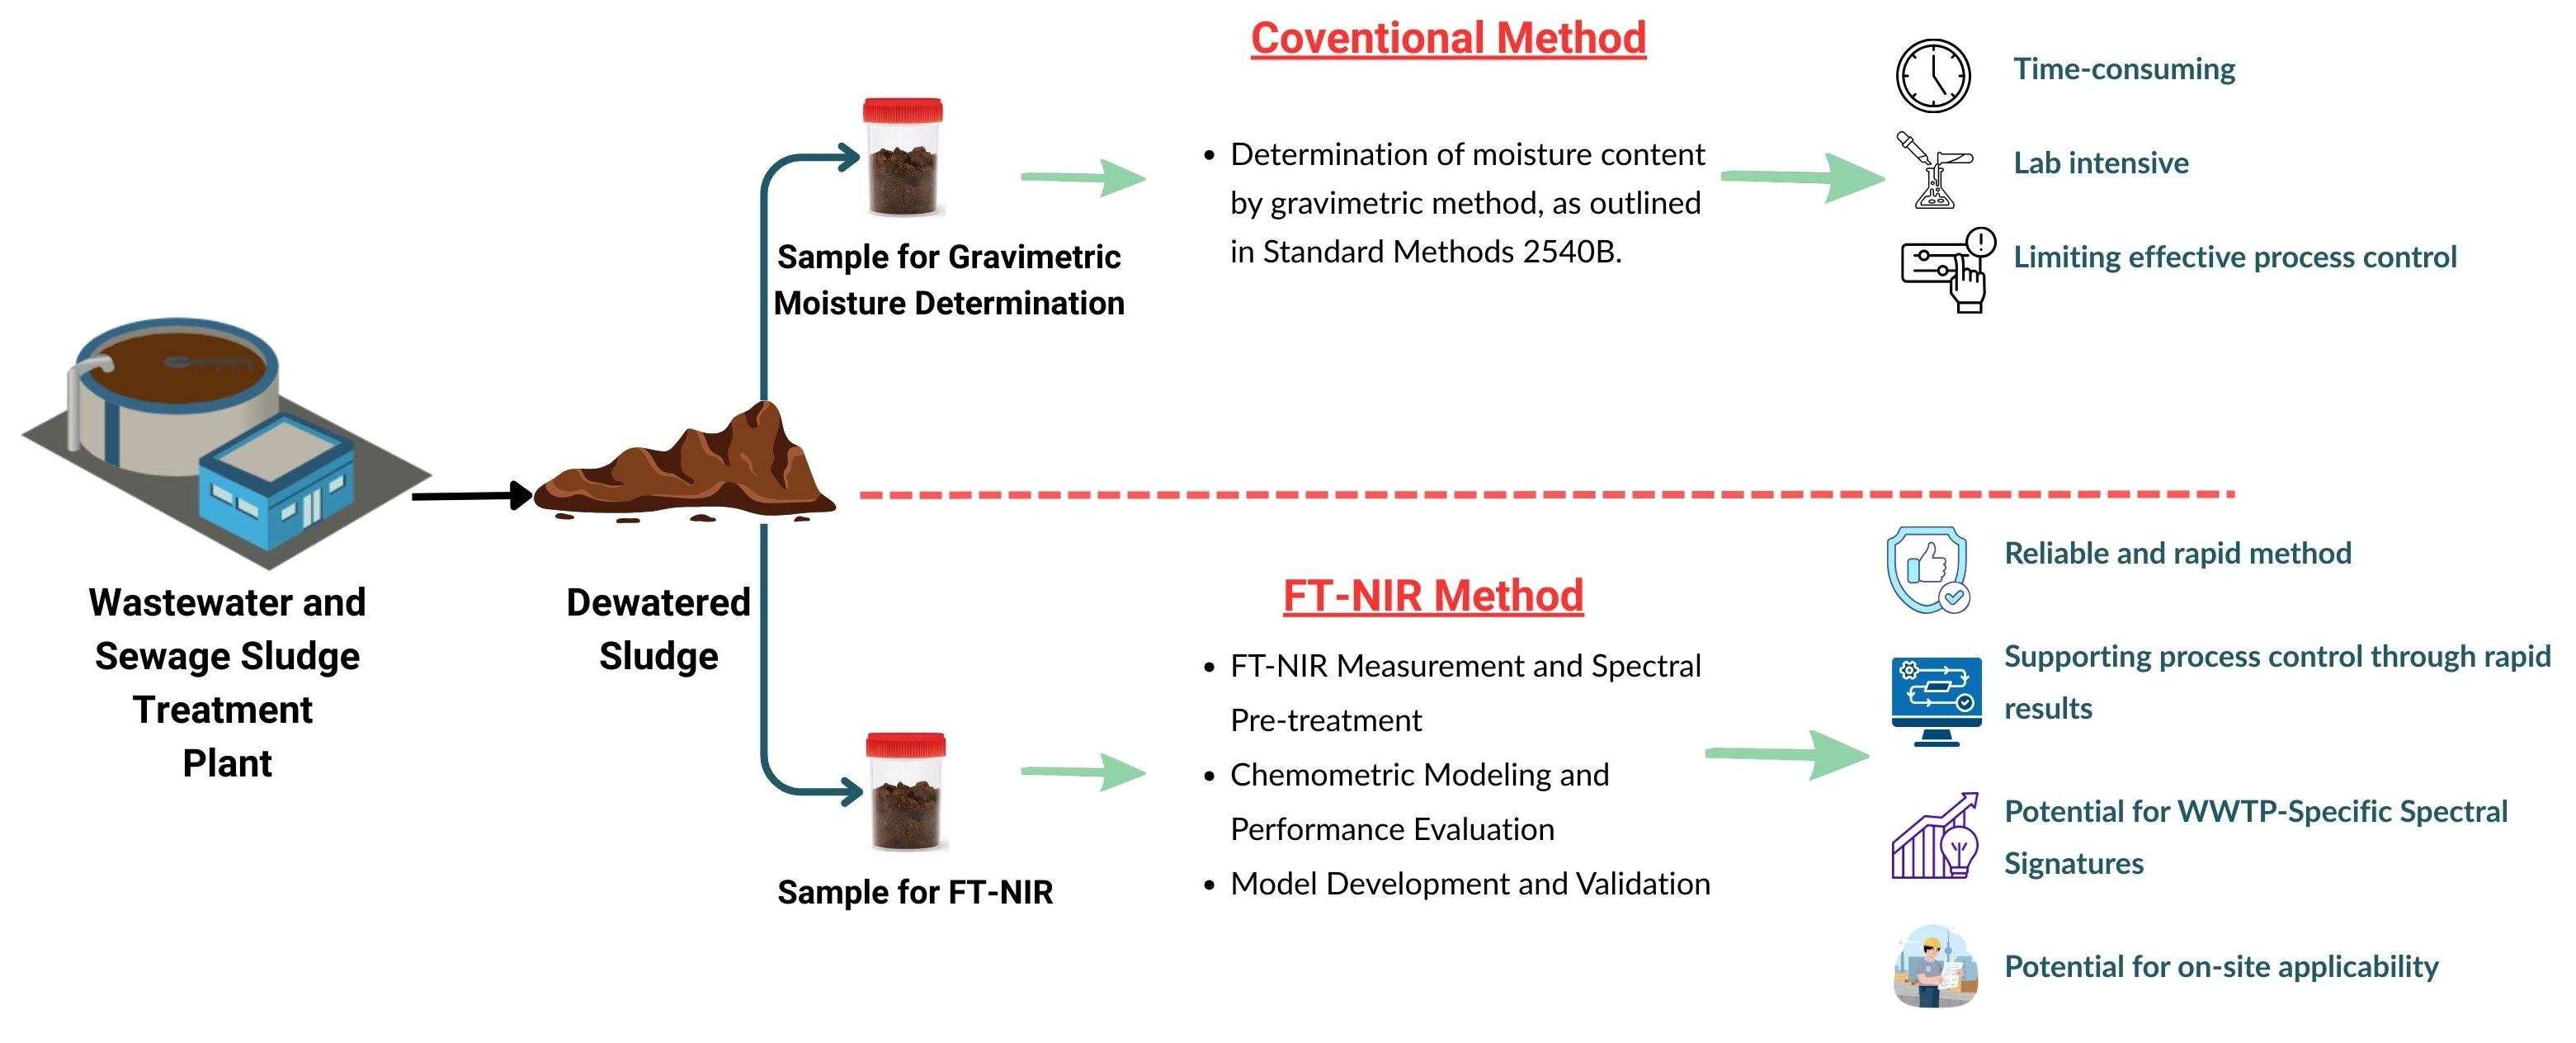
The effectiveness of FT-NIR spectroscopy for estimating sludge moisture was evaluated according to the conceptual framework illustrated in
Figure 1. Following sample collection, moisture content was determined in the laboratory using the conventional gravimetric method to serve as the reference. FT-NIR spectra were subsequently acquired and processed using chemometric techniques to assess the potential of FT-NIR’s performance as a rapid predictive method. The following subsections describe the sampling, spectral acquisition, and modelling procedures in detail.
2.1. Sludge Sample Collection and Laboratory Method for Moisture Measurement
A total of 96 sludge samples were collected from two full-scale urban wastewater treatment plants, WWTP 1 and WWTP 2, serving approximately 220,000 and 670,000 population equivalents, respectively. Both facilities utilize biological processes for carbon, phosphorus, and nitrogen removal, followed by sludge thickening and centrifuge-based dewatering. The dewatering units are equipped with polyelectrolyte dosing and sludge pumping systems. The plants treat a combination of domestic and pre-treated industrial wastewater, with WWTP 1 receiving a higher industrial fraction than WWTP 2.
Waste sludge was sampled at the dewatering unit outlets over an eight-month period (May 2024–January 2025). To ensure a robust calibration range, samples were collected during both steady-state operations and equipment start-up phases, thereby covering a broader moisture rang. After collection, samples were stored in airtight polyethylene containers at 4 °C to minimize evaporation and analysed within 48 h. Approximately 1 kg of sludge was collected for each sampling event and thoroughly mixed prior to subsampling; about 150 g of the homogenized material was used for FT-NIR analysis to improve bulk representativeness and minimize the influence of local heterogeneity.
Reference moisture content was determined using the gravimetric method described in Standard Methods 2540B [
22] with measurements performed in triplicates. Approximately 10 g of each sample was dried in a laboratory oven at 105 °C until a constant weight was achieved (up to 24 h). Drying at 105 °C is the globally accepted standard for sludge moisture determination and is considered sufficient for water removal without introducing significant bias due to volatile compound loss under routine analytical conditions. The moisture content was then calculated based on mass loss using the following equation:
where W is the moisture content of sludge (%), M
1 is the mass before drying (g), M
2 is the mass after drying at 105 °C (g). The dry matter content (%) of the sludge was then calculated as 100 − W.
The uncertainty of the reference method was evaluated by performing ten dry matter (DM%) measurements on the same sludge sample. The expanded uncertainty at a 95% confidence interval was calculated as ±0.25%. It should be noted that the standard gravimetric method employs a relatively small sample mass (10 g), which may contribute to variability in measured DM% for highly heterogeneous sludges. Therefore, to ensure reliability, measurements were repeated when triplicate results exhibited excessive variability.
2.2. FT-NIR Spectral Acquisition of the Sludge and Principal Component Analysis
FT-NIR spectral measurements were performed using a Bruker MPA FT-NIR spectrometer equipped with a lead sulfide (PbS) detector (Bruker Optik GmbH, Ettlingen, Germany). Samples were scanned in diffuse reflectance mode using the instrument’s rotating sample cup accessory, which enables continuous rotation during spectral acquisition to ensure spatial averaging across the sample surface and to minimize heterogeneity effects. Spectral data were collected in the wavenumber range of 12,000–3500 cm−1 (corresponding to 800–2500 nm) at a spectral resolution of 8 cm−1, with each spectrum representing the average of 64 scans. The selected resolution and number of scans were chosen as a compromise between signal-to-noise optimization and acquisition time, as higher resolution or additional scans did not provide substantial improvement in moisture-related spectral features but increased measurement duration. All measurements were conducted at room temperature and recorded using OPUS software (v7.2, Bruker Optik GmbH, Germany).
Principal component analysis (PCA) was performed on the spectral dataset to investigate the underlying structure of variability among the sludge samples. Furthermore, correlation loading plots were analyzed to identify the specific spectral variables driving the sample groupings observed within the principal component space.
2.3. PLS-R Model Development and Validation
A total of 96 waste sludge samples were utilized to develop and validate Partial Least Squares Regression (PLS-R) model for predicting dry matter content (%DM) from FT-NIR spectral data. Prior to model calibration, an outlier detection procedure was applied using Mahalanobis distance in OPUS software. The Mahalanobis distance limit was calculated based on the distribution of the calibration spectra, assuming normal distribution and using a one-sided confidence level of 99.999%. Two samples exceeded this limit and were identified as spectral outliers; these were excluded from further analysis. The remaining dataset was considered spectrally homogeneous and used for model development.
Spectral pre-processing and model development were performed using the OPUS software. To identify the optimal model configuration, various spectral ranges and pre-processing techniques were systematically evaluated using the software’s “Optimize” function. The tested pre-processing methods included Constant Offset Elimination (COE), Straight Line Subtraction (SLS), Vector Normalization (SNV), Min–Max Normalization (MMN), Multiplicative Scatter Correction (MSC), as well as first and second derivatives calculated using the Savitzky–Golay algorithm with a 25-point smoothing window.
The “Optimize” function iteratively compares different combinations of spectral regions and pre-processing strategies based on their cross-validation performance. The configuration yielding the lowest Root Mean Square Error of Cross-Validation (RMSECV) was selected as the final model. Among the evaluated options, Min–Max Normalization provided the best predictive performance and was therefore applied in the final model development. Model performance was assessed using a comprehensive set of statistical metrics: the coefficient of determination (R2), the number of latent variables (LVs), and the Root Mean Square Errors of Estimation (RMSEE), Cross-Validation (RMSECV), and Prediction (RMSEP). Additionally, the Residual Predictive Deviation (RPD) was calculated as the ratio of the standard deviation of the reference values to the corresponding error metrics (RMSEE, RMSECV, or RMSEP), serving as an indicator of predictive reliability.
A multi-step validation strategy was employed to ensure model robustness. For the internal validation, Leave-One-Out Cross-Validation (LoO-CV) was applied to the entire dataset. In this procedure, each sample is excluded iteratively while a calibration model is built on the remaining samples to calculate a generalized error estimate (RMSECV). For the external validation; the dataset was randomly partitioned into a calibration set (64 samples) and an independent test set (32 samples). The model was calibrated on the former and subsequently applied to the latter to determine external validation metrics (R2, RMSEP, and RPD).
The number of LVs was selected to minimize RMSE while preventing overfitting, ensuring the final model was both accurate and generalizable.
The equations used are given below:
Root Mean Square Error of Cross Validation:
where M is the number of samples in the dataset,
is the value of
ith sample measured with the reference method and
is the value of
ith sample predicted with model
Root Mean Square Error of Estimation:
where M is the number of samples in the dataset, R is the number latent variable and SSE is the sum of squared errors.
Residual Prediction Deviation:
where SD is the standard deviation of the reference values of the samples and SEP is the standard error of prediction.
The coefficient of determination:
where M is the number of samples in the dataset,
is the value of
ith sample measured with the reference method,
is the value of
ith sample predicted with model and Y
m is the mean of the reference values.
3. Results and Discussion
3.1. Characterization of the Waste Sludge
A total of 96 samples were collected from the dewatering process of two advanced biological wastewater treatment plants between May 2024 and January 2025. In order to cover a wider range of moisture contents, some of samples were collected from the start-up of the dewatering equipment, when the equipment was not in steady state and moisture was initially high. The dry matter content of the sludge samples ranged from 12.4% to 24.6% (mean: 19.8% ± 2.5%). These values fall within the typical operational range reported in the literature for mechanically dewatered sludge (approximately 13–30%) [
23,
24,
25,
26]. These samples therefore cover a wide range of dry matter contents encountered in wastewater treatment plants using decanter as dewatering process. The distribution of dry matter content was followed approximately normal distribution, with a slight right skew with the median value of 20.9%. This relatively uniform and well-distributed dataset provides a robust basis for developing and validating chemometric prediction model.
3.2. Principal Component Analysis of Spectral Data
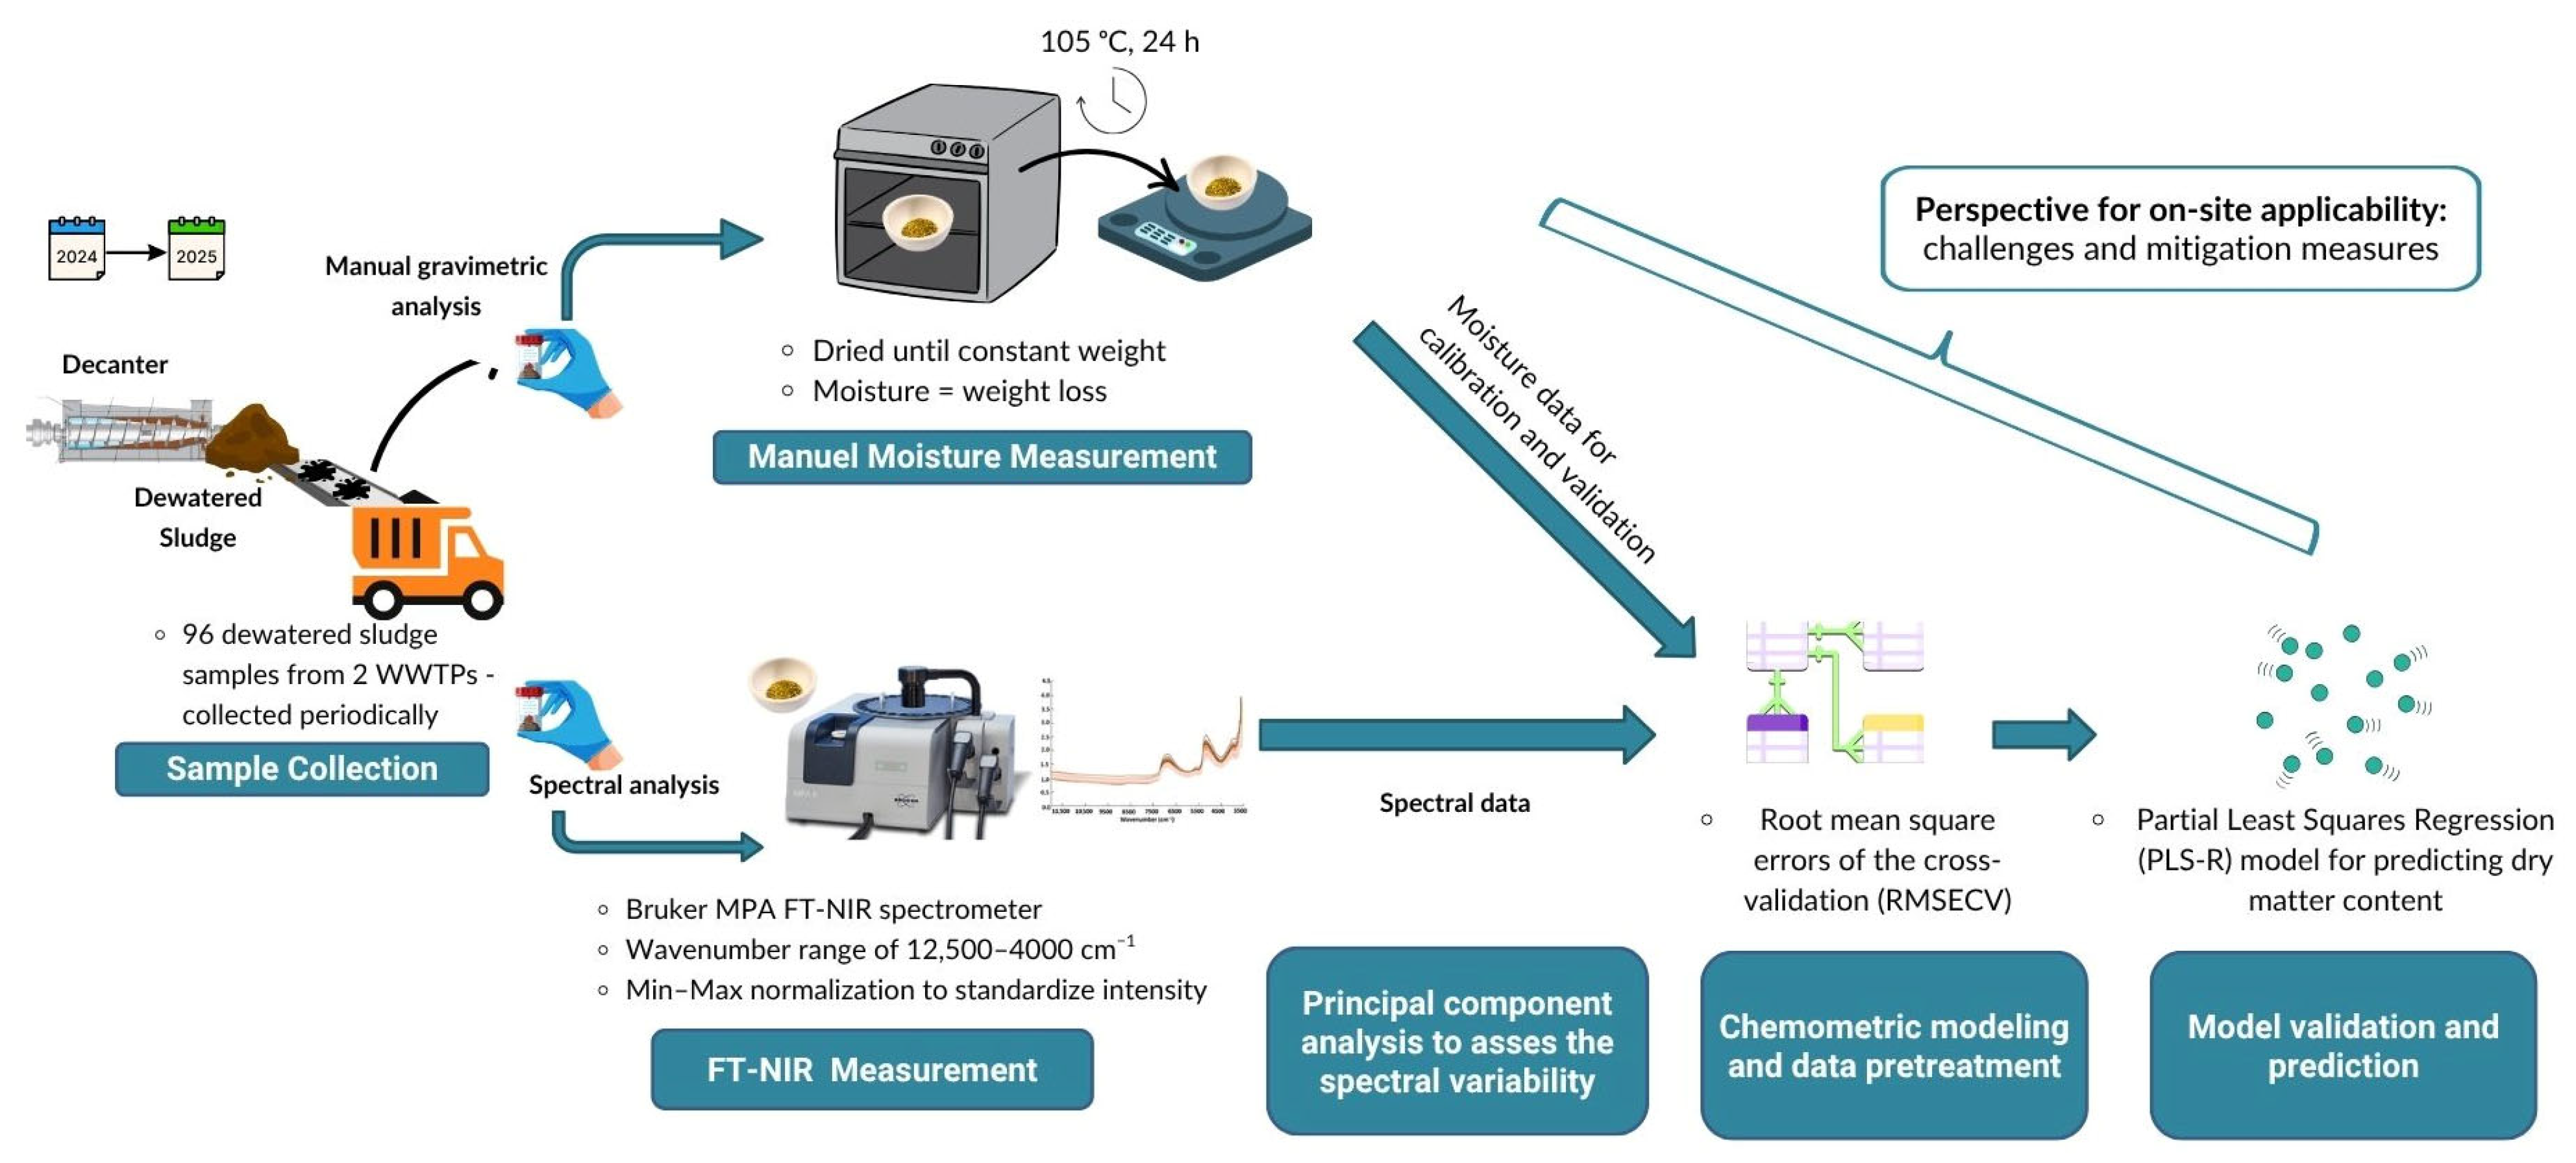
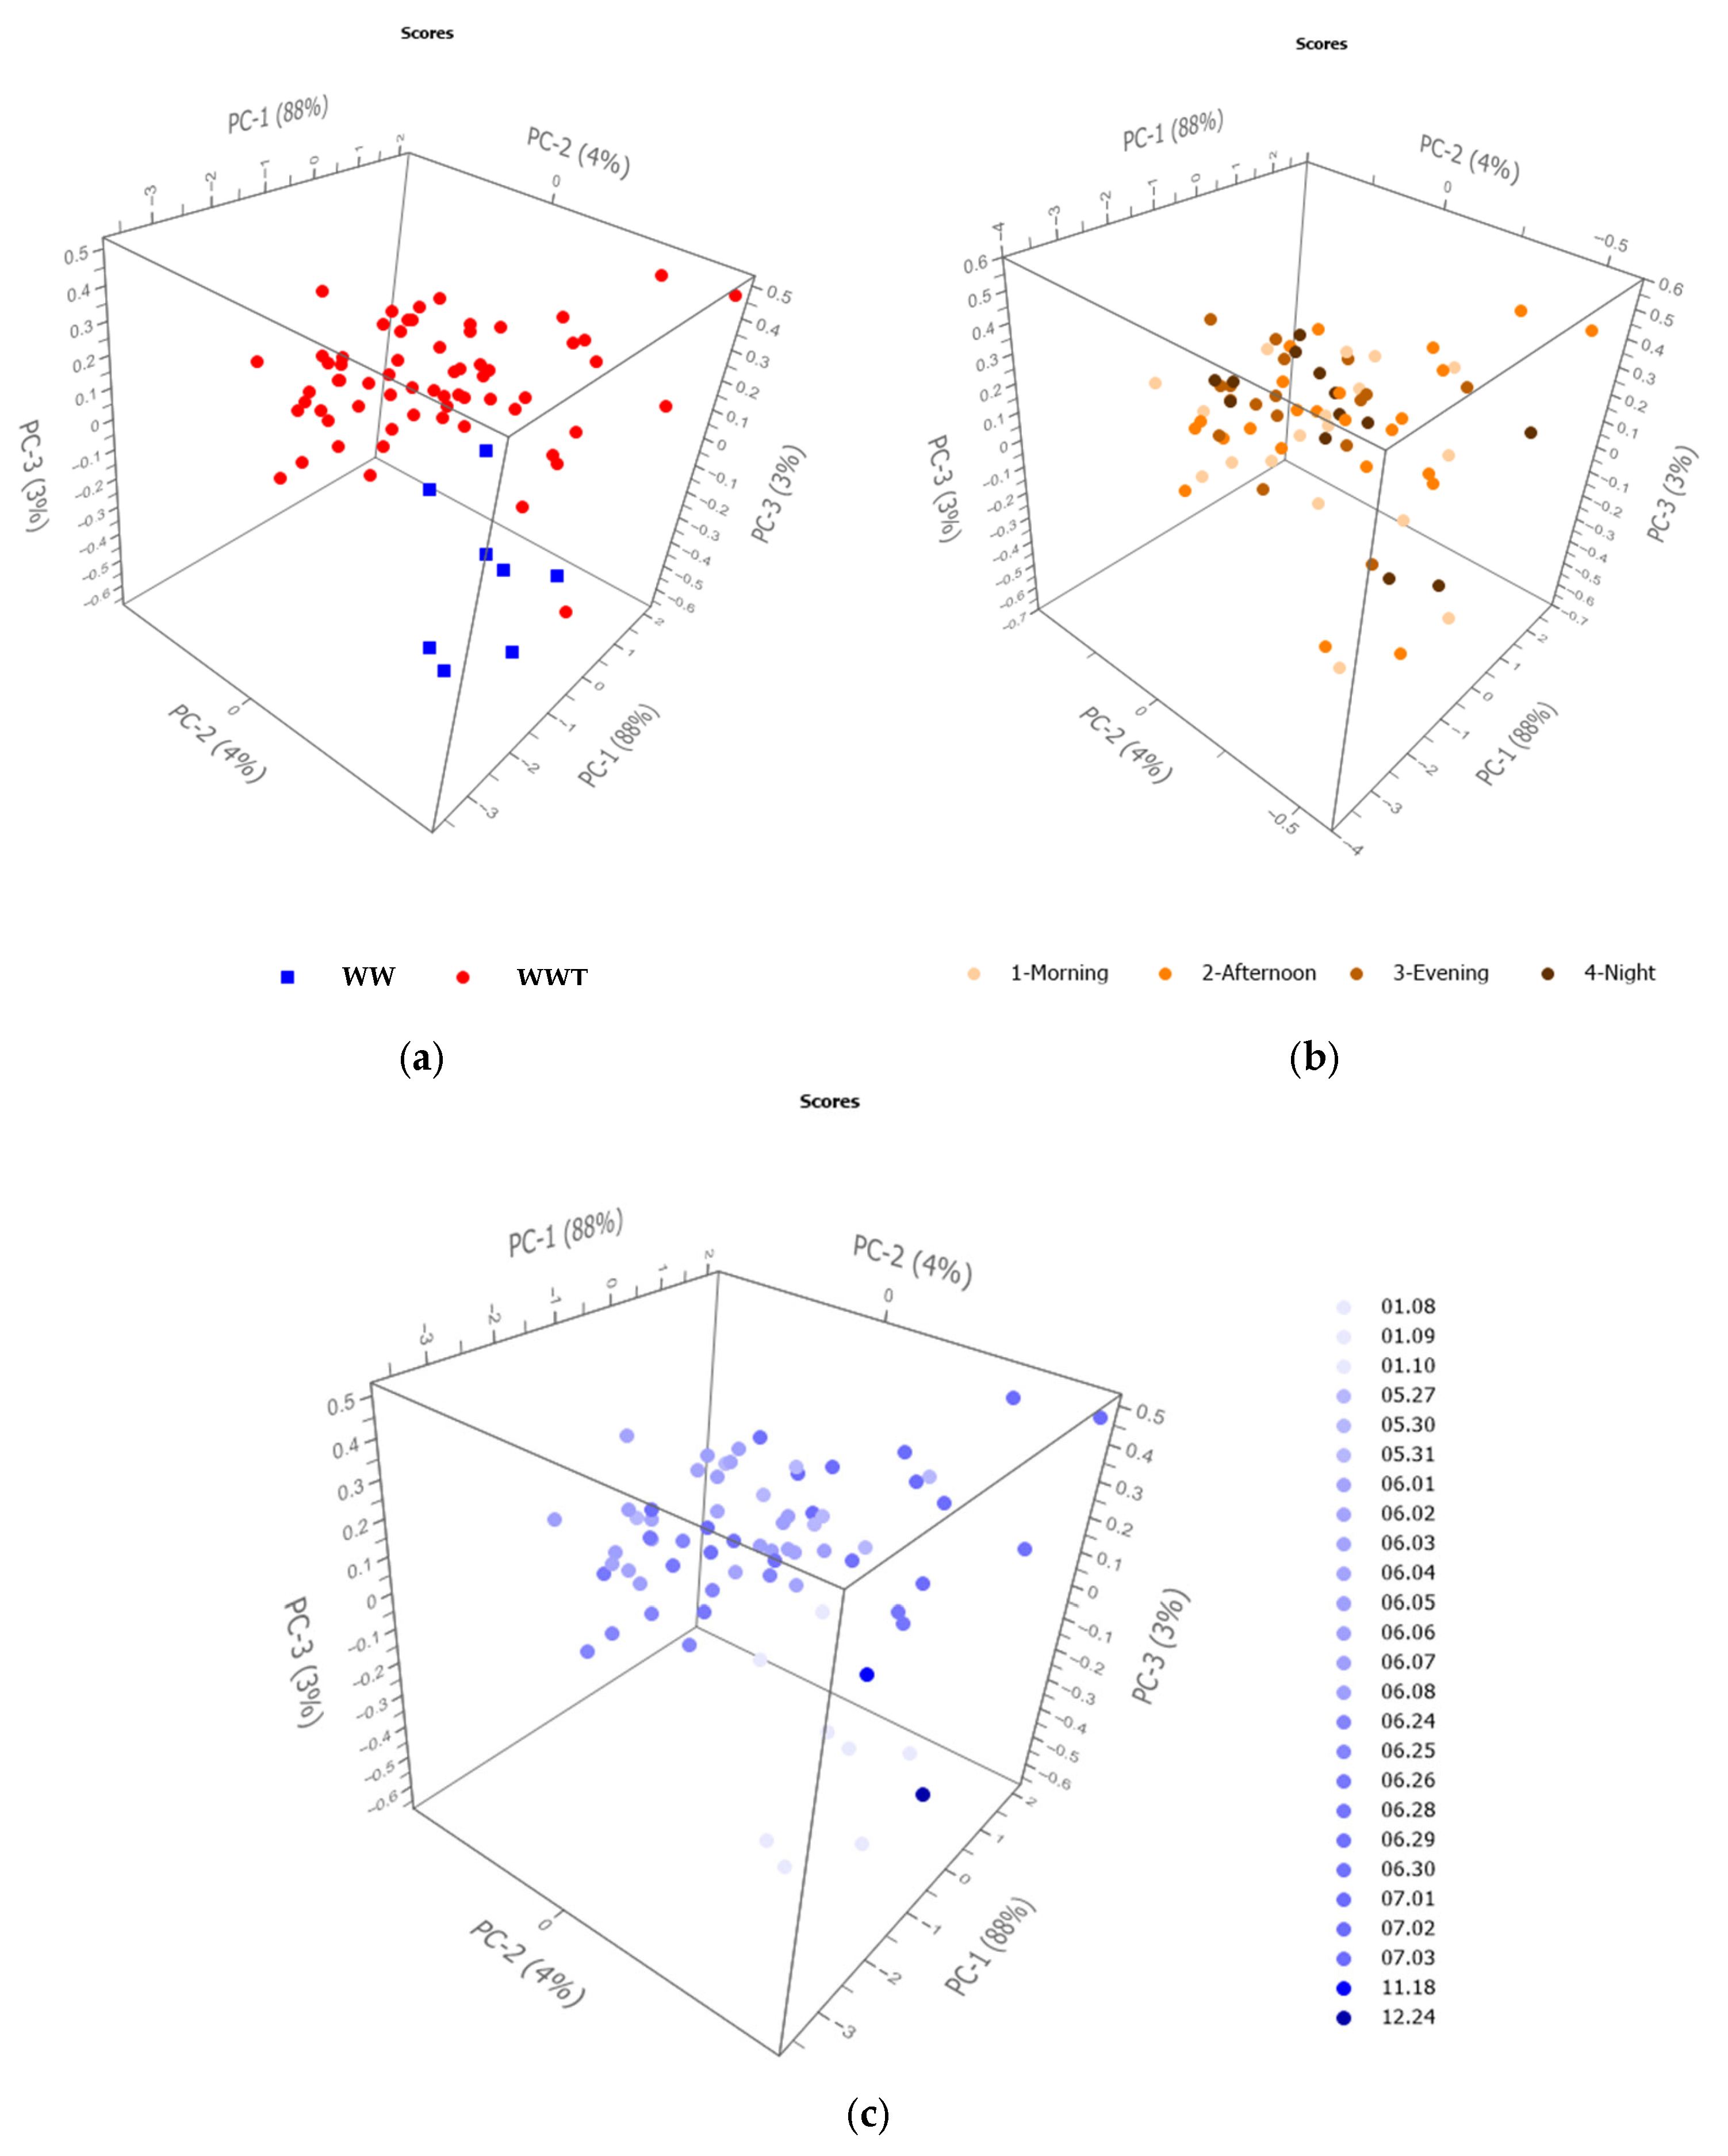
Principal component analysis was performed on the FT-NIR spectral data of the sludge samples to explore the underlying structure of variability and to evaluate the influence of WWTP origin, sampling date and sampling time within the day. The first three principal components accounted for 95% of the total variance, with PC1 explaining 88%, PC2 explaining 4%, and PC3 3%, indicating a limited number of highly structured variance sources rather than random noise (
Figure 2).
The dominance of PC1 indicates that FT-NIR spectra are primarily driven by the intrinsic physicochemical characteristics of the sludge matrix. This is consistent with the behaviour of complex, heterogeneous materials, where bulk properties strongly influence near-infrared absorbance. When PCA scores were visualized by WWTP origin, a robust separation between WWTP 1 and WWTP 2 was observed, primarily along the PC1 axis. WWTP 1 samples formed a compact cluster at negative PC1 values, whereas WWTP 2 samples exhibited broader dispersion at positive values (
Figure 2a). Given that PC1 explains 88% of the total variance, site-specific characteristics represent the dominant source of spectral variability. These differences may likely arise from variations in influent composition (industrial vs. domestic fractions), processing conditions, and stabilization efficiency [
27,
28]. The tighter clustering observed for WWTP 1 samples suggests a more homogeneous sludge composition, while the spread of WWTP 2 samples points to increased heterogeneity, potentially reflecting a more diverse influent profile or fluctuating operational conditions.
In contrast, PCA scores grouped by sampling time (morning, afternoon, evening, night) showed no distinct clustering, indicating that daily changes have a negligible effect on sludge characteristics captured by FT-NIR (
Figure 2b). Similarly, samples grouped by sampling date exhibited substantial overlap (
Figure 2c). he absence of systematic temporal variation along PC1 confirms the relative stability of the sludge characteristics throughout the study period. This stability may be attributed to the buffering effects of the treatment process residence time, alongside the relatively constant nature of waste sludge generated by biological processes. Collectively, these factors may reduce short-term variability and prevent significant fluctuations in sludge composition, resulting in a stable spectral signature. Minor dispersion observed along PC2 and PC3 may be associated with localized, short-term events (e.g., rainfall, sudden industrial discharges, and/or operational changes) rather than persistent changes (
Figure 2b,c).
Overall, the PCA results demonstrate that WWTP origin is the primary driver for FT-NIR spectral variability, while sampling date and intra-day sampling time has only a minimal influence.
3.3. Interpretation of Correlation Loading Plots
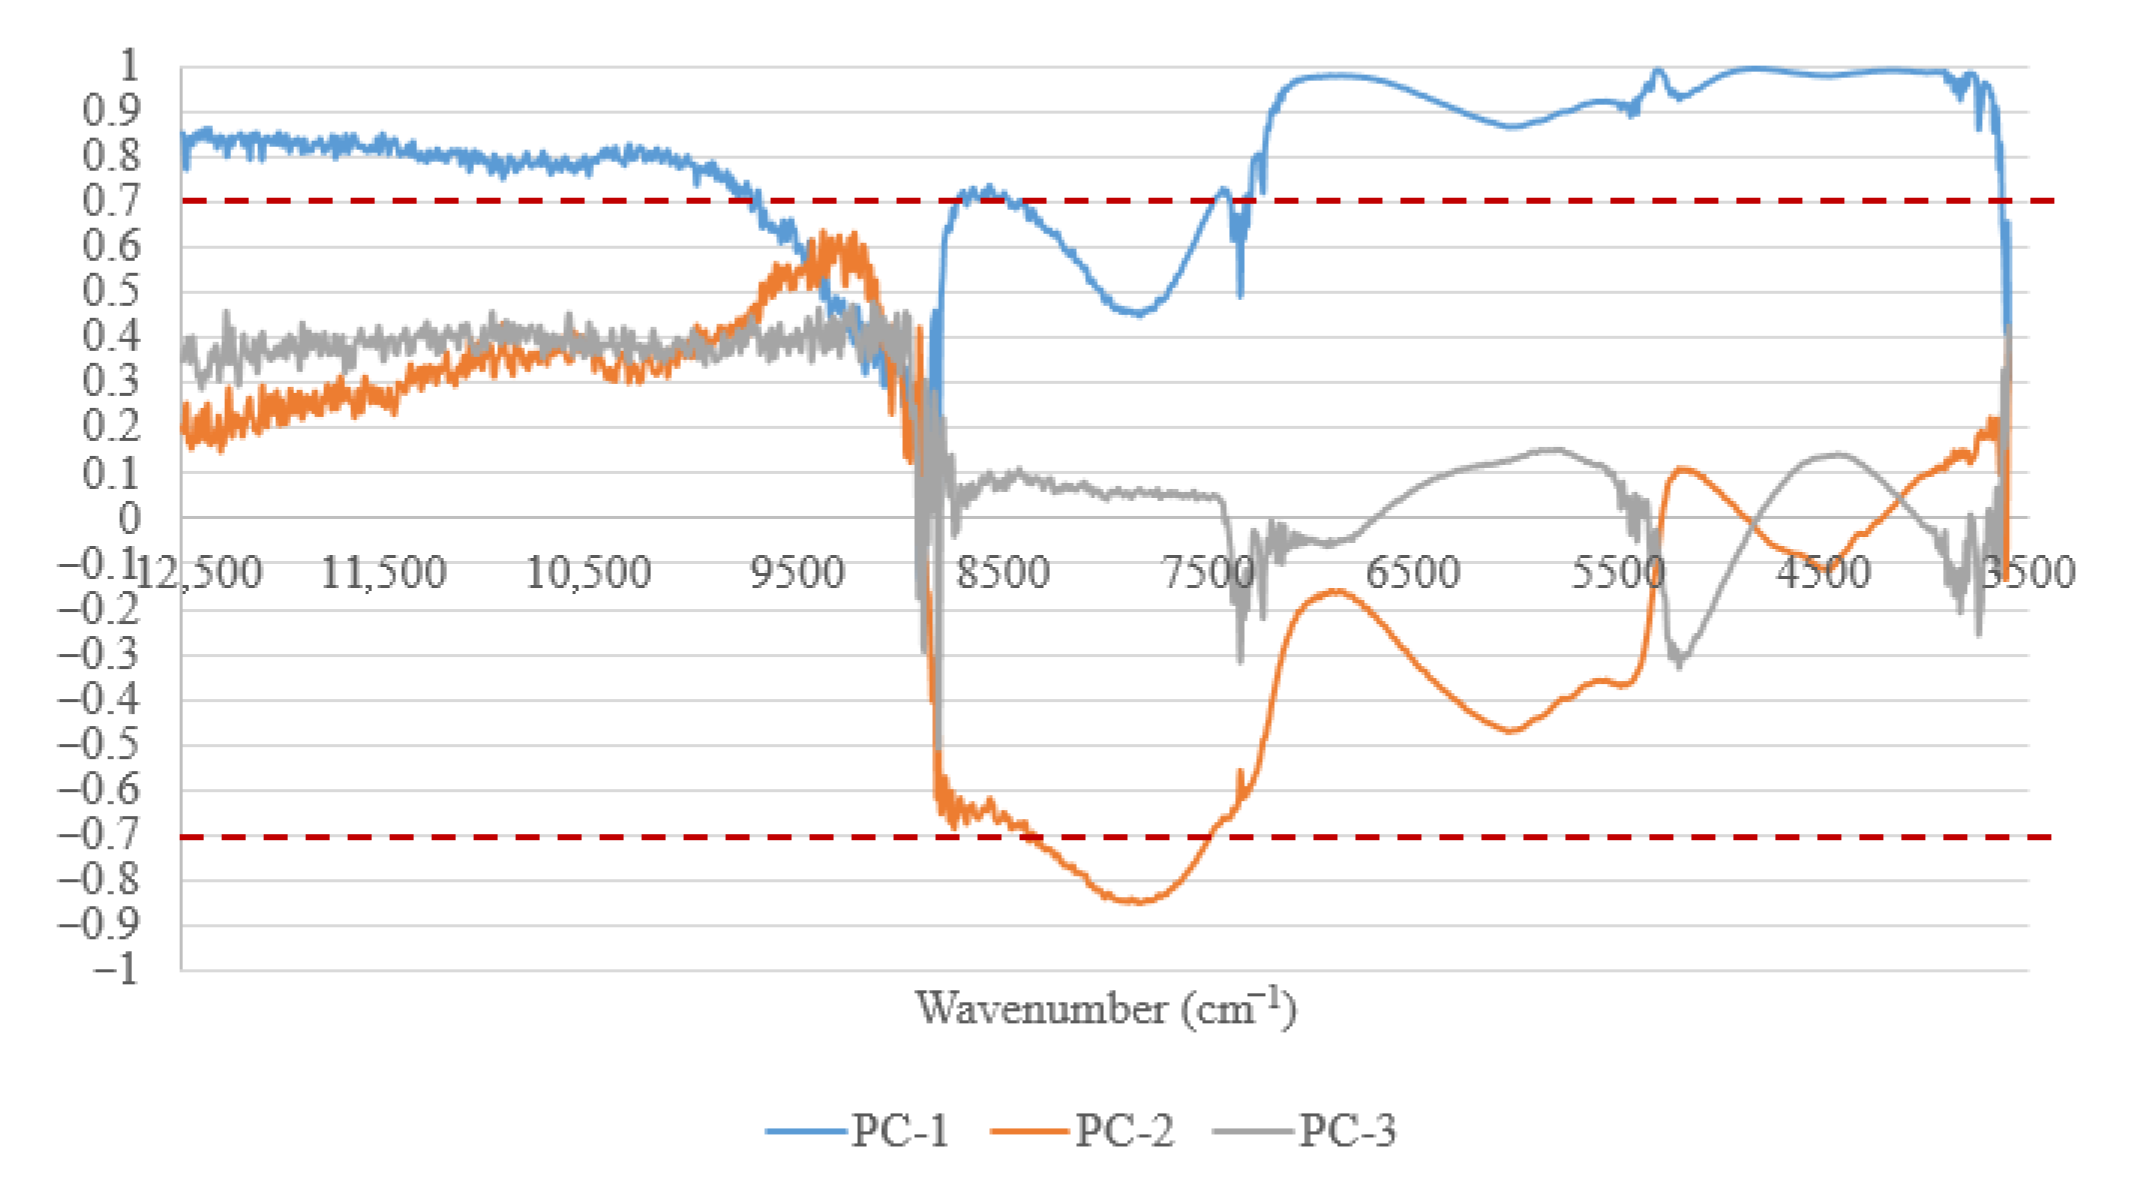
Correlation loading plots for PC1, PC2, and PC3 are presented in
Figure 3 to better explain the relationships between individual spectral variables and the principal components, as well as the chemical features underlying the observed sample groupings.
The correlation loading plot for PC1 reveals the chemical basis for the site-dependent separation observed in this study. The PC1 loadings exhibited strong positive correlations (r > 0.7) across broad spectral regions, particularly in the high- and low-wavenumber ranges. This indicates that PC1 reflects global matrix properties rather than isolated molecular features. High correlations in the 12,000–9000 cm
−1 region are consistent with higher-order O–H overtones and scattering-related effects, suggesting an important contribution from moisture content and physical structure. Similarly, strong positive correlations in the 7500–6700 cm
−1 range (first O–H overtone and combination bands) correspond to first O–H overtone and combination bands, further emphasizing the role of water–matrix interactions [
29,
30,
31,
32]. Very high correlations in the 5400–4500 cm
−1 region associated with both the O–H combination band of water as well as overlapping C–H and N–H combination bands. In the near-infrared (12,000–3500 cm
−1), absorption features arise mainly from overtone and combination transitions due to the anharmonic behaviour of molecular vibrations. In this context, C–H contributions in this region originate from first overtones (typically around 6000–5600 cm
−1), second overtones (around 8500–8000 cm
−1), and C–H combination bands (approximately 4500–4000 cm
−1). Although these bands are weaker than mid-infrared fundamental vibrations, they are clearly detectable in organic-rich matrices such as sludge. Therefore, the strong loadings observed in these regions point to systematic differences in organic matter composition, including lipids, proteins, and carbohydrates, as well as variations in moisture–organic interactions [
33].
Given the strong influence of moisture on NIR spectra, the separation observed between the two WWTPs along PC1 was further examined in relation to their dry matter (DM) contents. The dry matter content ranged from 15.3% to 17.4% for WWTP1 and from 13.5% to 24.6% for WWTP2. The wider DM variability observed in WWTP2 indicates that moisture differences substantially contribute to the site-dependent separation, consistent with the dominance of O–H-related loadings in PC1. However, this variability in moisture content also reflects operational heterogeneity between the treatment plants, such as differences in dewatering efficiency and process stability. Therefore, the separation along PC1 likely represents not only moisture-related spectral effects but also plant-specific process characteristics. In addition, contributions from C–H and N–H regions suggest that compositional differences in the organic matrix further contribute to the observed clustering. Conversely, a sharp negative feature around 8900–8500 cm−1 indicates an inverse relationship between specific overtone bands and the dominant PC1 trend. This spectral behaviour may be interpreted as an indication of differences in water environments (e.g., bound vs. free water) and their potential interactions with organic matrix components. While these features suggest that PC1 acts as a composite axis integrating moisture levels, organic matter composition, and matrix-related scattering, further investigation with complementary techniques would be required to definitively resolve these specific molecular water–solid interactions. Collectively, these features indicate PC1 as a composite axis integrating moisture levels, organic matter abundance and composition, and matrix-related scattering, which collectively explain why origin of waste sludge exerts such a strong influence on the PCA scores.
The PC2 loadings displayed a distinctly bipolar structure, with moderate positive correlations at high wavenumbers and strong negative correlations in the 8600–7400 cm
−1 region. This pattern indicates that PC2 captures contrasts between specific organic fractions rather than total organic matter concentration. The negatively correlated mid-NIR region is usually associated with second overtones and combination bands of C–H from lipids and protein-related structures [
33], suggesting that PC2 reflects qualitative shifts in organic composition. Moderate positive features at lower wavenumbers, involving overlapping O–H, N–H, and C–H combination bands, further support this interpretation. These characteristics explain why PC2 contributes to minor dispersion seen in sampling date or episodic events but does not override the dominant site-dependent separation.
PC3 loadings were characterized by relatively low absolute correlation values, with moderate positive correlations in the high-wavenumber region and localized negative features in the mid- and lower-wavenumber ranges. This pattern is indicative of fine-scale heterogeneity, potentially arising from minor biochemical variations, subtle moisture redistribution, or residual physical effects such as particle size variability. The absence of systematic grouping along PC3 in the score plots confirms that this component represents residual variability rather than a dominant or process-driven factor.
In summary, FT-NIR spectral variability is hierarchically structured, with site-specific sludge characteristics being driven by moisture–organic matter interactions and matrix properties, as the dominant source of variance, followed by secondary compositional contrasts and residual sample-specific heterogeneity. PCA revealed no significant spectral differences between samples collected at different times or dates within the same WWTP, thereby confirming the temporal stability of sludge properties. Conversely, samples from different WWTPs were consistently separated in PCA space, indicating that WWTP-specific characteristics are the dominant source of spectral variability. These discrepancies are likely to be caused by variations in influent composition, relative contributions of industrial and domestic wastewater, and/or differences in operational parameters relevant to sludge stabilization. The hierarchical structure and temporal stability of the FT-NIR-based moisture estimation of dewatered sludge demonstrate its robustness for routine monitoring and large-scale screening applications. Furthermore, the discriminatory capability of the FT-NIR–PCA for identifying the WWTP origin of dewatered sludge could be an important tool to identify the potential source of uncontrolled or unauthorized sludge discharges.
3.4. FT-NIR Spectral Features Relevant to Moisture Prediction
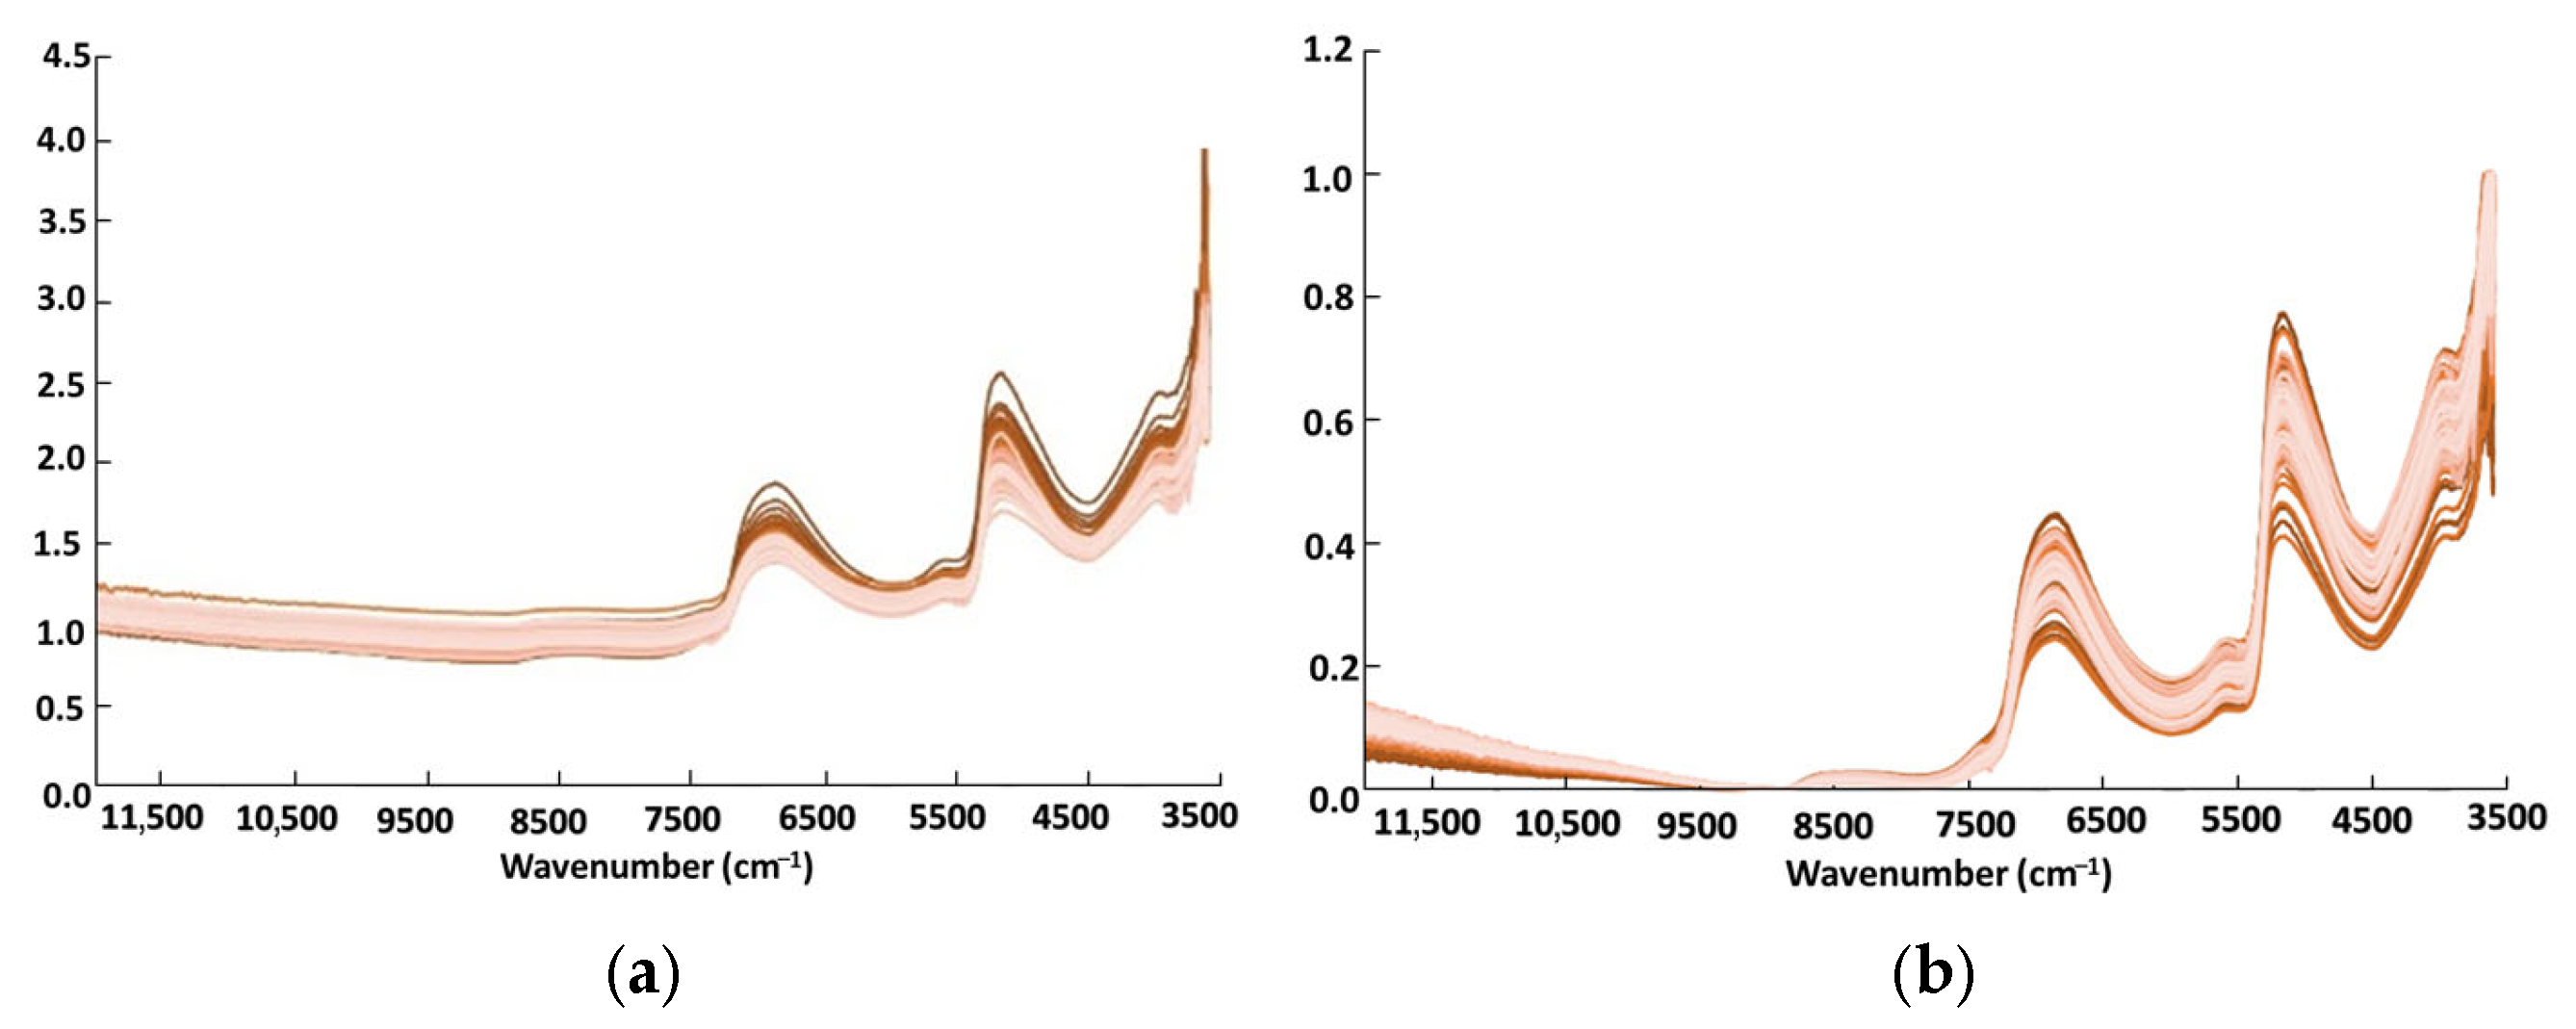
The raw FT-NIR spectra of sludge samples, collected over the 12,000–3500 cm
−1 range, exhibited distinct absorbance features associated with moisture and organic matter (
Figure 4a). Prominent absorption bands were observed at 7398–6364 cm
−1, which is predominantly attributed to O–H overtone and combination bands of water, known to dominate this spectral window, particularly around ~7200 and ~6900 cm
−1 [
31,
32]. Furthermore, additional absorption features were identified in the 5847–4810 cm
−1 range, corresponding to combination bands involving O–H and N–H stretching vibrations. Overall, these spectral regions are characteristic of water-associated absorptions and moisture-related contributions and are consistent with previous observations in similar matrices [
32]. The intensity of the water-related bands increased with moisture content, highlighting the sensitivity of FT-NIR spectroscopy to variations in sludge water content and establishing a clear spectral–molecular basis for quantitative prediction. The descriptive statistics of the dataset used in this study are summarized in
Table 1, providing an overview of the sample distribution prior to model development. For PLS modelling, the spectral regions (10,364–5439 and 4621–3799 cm
−1) were selected through the optimization procedure implemented in OPUS (
Table 2), which evaluates spectral intervals based on predictive performance criteria. These selected regions encompass the major water absorption bands while also including adjacent spectral information related to matrix components inherently present in sludge samples. Minor baseline shifts and noise were evident across samples, likely reflecting physical differences such as particle size or surface water distribution. Applying Min–Max normalization (
Figure 4b) effectively minimized these variations while preserving relevant chemical information, thereby improving spectral consistency for subsequent modelling. These well-defined, moisture-specific spectral features underpin the predictive performance of the PLS-R models. By capturing chemically meaningful information in targeted spectral regions, the pre-processed spectra provide a robust foundation for accurate regression and moisture quantification.
3.5. PLS-R Model Development and Validation for Moisture Prediction
Among the measurements, two samples’ data were identified as outliers and excluded from the calibration. Descriptive statistics of the dataset are presented in
Table 1. The remaining 94 samples were separated into two datasets, as a calibration dataset (62 samples) and a test dataset (32 samples), with similar distributions of dry matter content to ensure representative model development. Both the calibration and validation datasets covered a wide range of dry matter content. The sludge samples used for calibration exhibited dry matter contents ranging from 12.4% to 24.6% (mean: 19.9% ± 2.5%), while the validation set ranged from 13.6% to 23.0%, with a mean value of 19.7% ± 2.6%.
The optimized PLS-R model, developed using FT-NIR spectra and Min–Max normalization over informative spectral regions (10,364–5439 and 4621–3799 cm
−1), achieved excellent calibration performance with seven latent variables (LVs). High coefficients of determination (R
2CT = 0.949) and low error values (RMSEE = 0.60%) were observed, along with an RPD of 4.46, indicating strong predictive capacity on the calibration set (
Table 2). The number of latent variables was determined based on predictive performance behaviour rather than calibration fit alone. Model accuracy improved progressively up to seven LVs, after which no meaningful improvement in R
2 or prediction error was observed, indicating stabilization of the explained variance and diminishing returns from additional components. Internal model validation using leave-one-out cross-validation yielded slightly lower but still robust performance (R
2CV = 0.866, RMSECV = 0.92%, RPD = 2.73). This reduction is expected and reflects the model’s ability to generalize beyond the calibration data. External validation on the independent test set further confirmed the model’s predictive strength, with R
2Test = 0.879, RMSEP = 0.88%, and RPD = 2.92. The close agreement between cross-validation and test set metrics indicates that the model is not overfitted and maintains high predictive accuracy when applied to unseen samples. In addition to prediction statistics, model diagnostics were evaluated using leverage and spectral residuals (Q-residuals), which represent the portion of each spectrum not explained by the selected latent-variable model. Leverage values were mostly between 0.05 and 0.20, with a maximum of 0.32. Considering the commonly applied threshold (3A/n ≈ 0.34 for A = 7 and n = 62), none of the samples exceeded the critical leverage limit. Spectral residuals were generally within the 0.05–0.10 range, with only two samples showing moderately elevated values (0.119 and 0.154); however, their associated F-probabilities were not statistically significant. Importantly, no sample simultaneously exhibited high leverage and high residual values. These diagnostic results confirm that the unexplained spectral variance is limited and that the model is not driven by influential outliers, supporting the appropriateness of the selected model complexity.
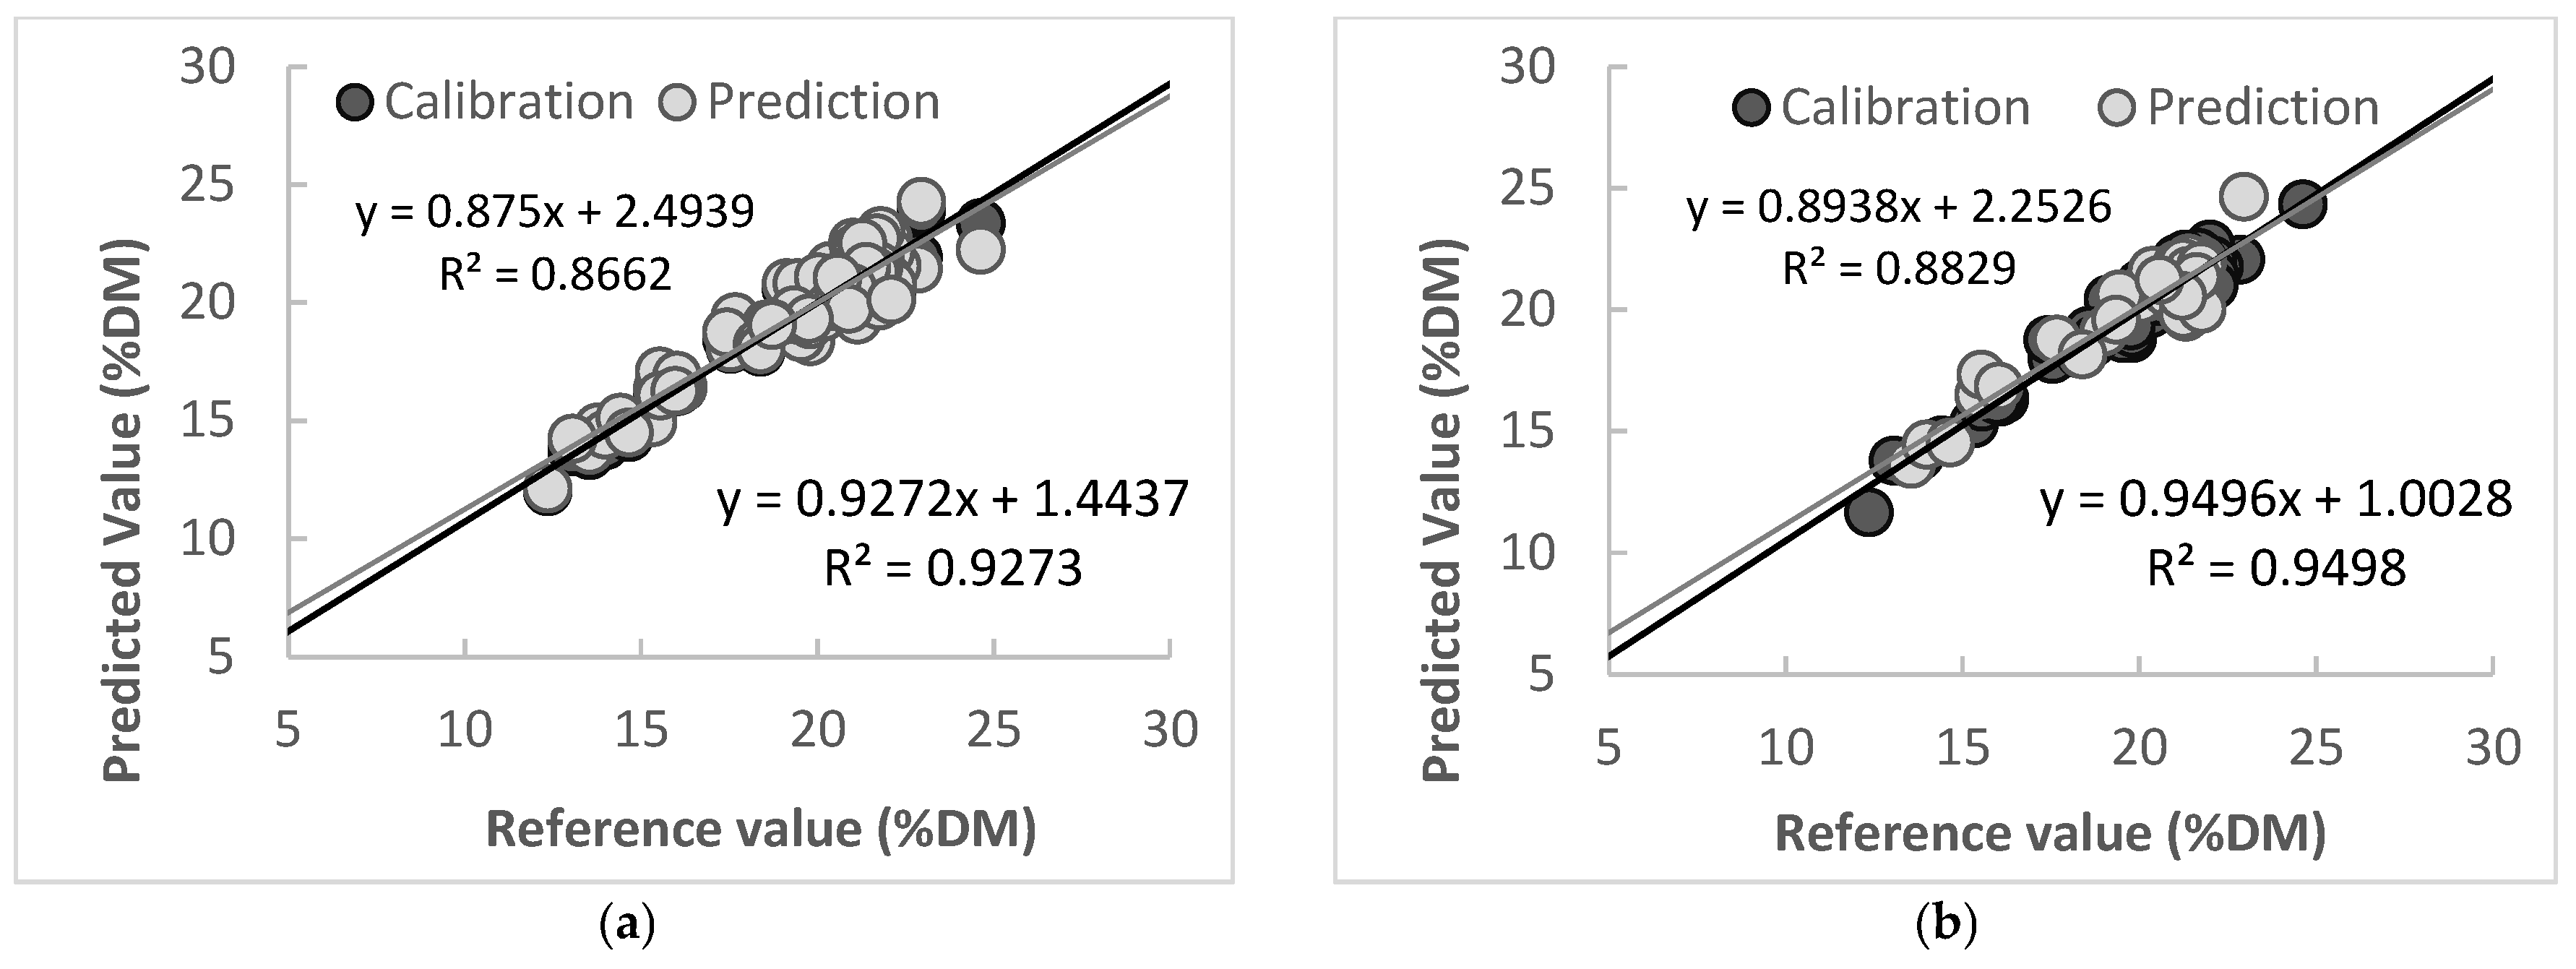
Figure 5 illustrates the regression plots of predicted versus reference dry matter content (%DM) for both cross-validation (
a) and external test-set validation (
b). In both cases, the points are closely distributed around the 1:1 line, and the linear regression fits yield high coefficients of determination (R
2CV = 0.9273 for cross-validation and R
2CT = 0.9498 for the test set). The slopes near unity and low intercepts further support the model’s accuracy and stability across calibration and validation datasets. These results, together with the high RPD values and low error metrics summarized in
Table 2, confirm the robustness and predictive power of the PLS-R model. Overall, the findings demonstrate that FT-NIR spectroscopy, together with appropriate chemometric modelling, provides a reliable and rapid tool for monitoring of sludge moisture content in wastewater treatment processes. In the literature studies on moisture content prediction in food products reports R
2 values ranging from 0.81 to 0.99. Consistently, the R
2 value obtained in the present investigation of sludge moisture prediction aligns well with the trends observed in the extant literature [
13,
14,
15,
34,
35].
Sludge presents substantial challenges for FT-NIR analysis due to its heterogeneous structure, variable chemical composition, and the presence of diverse contaminants. Seasonal variations can further affect the biological sludge matrix, while operational parameters, including chemical dosing, sludge type, and sludge age, may also influence its characteristics. The long-term sampling and inclusion of diverse samples enabled evaluation of model performance under realistic conditions, capturing seasonal and treatment plant-specific variability rather than relying on short-term or laboratory-controlled datasets, and further demonstrates the robustness of the FT-NIR method. However, the developed model was validated within a dry matter range of 12.4–24.6%, application outside this range or under substantially different sludge characteristics may require further validation.
In addition to its successful prediction of sludge moisture content, another significant advantage of the FT-NIR method is its ability to account for sample heterogeneity. The standard gravimetric method uses a relatively small sample mass (10 g), which can limit representativeness and contribute to variability in measured DM% values, particularly for heterogeneous sludge samples. In contrast, FT-NIR analysis utilizes a substantially larger sample (~150 g per measurement), providing a much more representative assessment of the bulk sludge and improving measurement robustness and repeatability. These results highlight FT-NIR spectroscopy as a promising alternative to conventional gravimetric methods, which are time-consuming and particularly sensitive to variability arising from sludge heterogeneity.
3.6. Practical Considerations for On-Site NIR-Based Sludge Moisture Monitoring
This study demonstrates the potential of FT-NIR spectroscopy for accurate estimate sludge moisture across samples collected from two WWTPs under controlled laboratory conditions. To evaluate the broader applicability of this approach, the performance of benchtop and in-line NIR systems was benchmarked against previously reported applications in heterogeneous environmental matrices, particularly soil and organic waste materials (
Table 3). Unlike relatively homogeneous food systems, dewatered sludge represents a highly heterogeneous, multi-phase matrix composed of mineral particles, organic matter, bound and free water fractions, and variable particle size distributions. This structural complexity induces strong diffuse reflectance scattering effects and baseline variability in the NIR spectra. Similar optical challenges have been widely reported in soil NIR applications, where mineral–organic interactions and matrix heterogeneity strongly influence spectral behaviour [
36,
37,
38].
Reported FT-NIR and Vis-NIR studies on soil moisture typically achieve R
2 values ranging from 0.78 to 0.97 using chemometric approaches such as PLS-R, PCR, MRA, and linear regression models within the 4000–12,000 cm
−1 spectral range. Although the moisture range in soil datasets is generally lower than that observed in dewatered sludge, the comparable scattering-dominated spectral characteristics make soil studies methodologically relevant benchmarks for sludge moisture prediction (
Table 3). Across environmental matrices, high predictive performance (R
2 ≈ 0.78–0.97) demonstrates the robustness of NIR-based approaches under heterogeneous conditions. Consistent with these findings, the present study achieved an R
2 of 0.88 for sludge moisture prediction within a high-moisture regime (75.4–87.6%), supporting FT-NIR spectroscopy as a reliable and rapid analytical tool under laboratory conditions. Extending this capability to on-site, real-time monitoring could enable timely moisture assessment and optimized chemical dosing, representing a substantial improvement over conventional practices.
In practice, FT-NIR systems are predominantly used for high-resolution laboratory analyses, whereas diode array NIR instruments are more commonly deployed for in-line applications due to their lower cost, mechanical robustness, and sufficient spectral resolution for moisture determination. Benchtop FT-NIR instruments typically operate over the 12,000–3500 cm
−1 range [
12], achieving high accuracy (R
2 ≈ 0.81–0.99), and have been widely applied for moisture analysis in food and forage samples. In contrast, diode array NIR systems generally cover a narrower spectral range (11,111–5882 cm
−1) [
12,
39,
40], while still achieving high predictive performance for moisture quantification (R
2 = 0.88–0.96).
However, compared to laboratory measurements, the robustness of in-line NIR systems may be decrease under field conditions if systems are not adequately adapted to WWTP-specific operational environments. Factors such as variable sludge composition, surface heterogeneity, fouling, vibration and fluctuating ambient conditions can adversely affect spectral quality and model stability. In this context, this section outlines key WWTP-specific challenges for on-site NIR implementations, together with mitigation strategies to improve robustness and reproducibility under operational conditions, as summarised in
Table 4.
In general, factors affecting the accuracy and robustness of the technology include sampling representativeness and sensor condition. These can be addressed through physical and modelling strategies. Physical measures include sensor placement and sampling design, whereas modelling strategies involve multivariate calibration and appropriate data processing. Specific challenges for sludge dewatering applications in WWTPs include surface heterogeneity, sensor fouling, harsh environments, and vibration. Intermittent operation and temperature fluctuations can lead to optical fouling, and variable sludge surfaces may increase scattering effects. To mitigate these issues, careful sensor placement (e.g., above conveyors or free-fall streams), surface stabilisation, or use of metal chutes can reduce surface variability and vibration effects [
41,
42]. Additionally, optical cleaning systems and protected installation can reduce optical fouling. Beyond physical measures, model optimisation may further improve robustness. Multivariate model calibration, inclusion of process-influencing variables and optimal data pre-processing strengthen predictive performance. Moreover, adaptive calibration strategies based on artificial intelligence (AI) and machine learning (ML) may further enhance predictive accuracy and compensate for field-related variability. Beyond moisture, NIR may enable estimation of organic matter, nitrogen, metals, carbon fractions [
20], nutrients [
21] and polymers [
12,
32,
43].
Table 3.
Performance comparison of NIR/FT-NIR moisture prediction across heterogeneous environmental and food matrices.
Table 3.
Performance comparison of NIR/FT-NIR moisture prediction across heterogeneous environmental and food matrices.
| Application Type | Material | Number of Samples | Type of
Instrument | Wavelength
Range (cm−1) | Moisture (%) | Validation for R2 | Model | Reference |
|---|
| Environmental/heterogeneous matrices (sludge, soil, manure) |
Benchtop
FT-NIR | WWTP sludge | 96 | FT-NIR | 12,500–4000 | 75.4–87.6 | 0.88 | PLS-R | This study |
| Soil | 393 | 12,000–3800 | 0.6–13.2 | 0.96 | PLS-R | [44] |
| 48 | Vis-NIR | 9091–4000 | 3.5–13 | 0.97 | MRA b | [45] |
| 802 | 7692–4000 | 0–16 | 0.84 | PCR a | [46] |
| 107 | 28,571–4000 | 5–25 | 0.78–0.87 | PLS-R | [47] |
| 48 | 12,798~3599 | 1.4–11.1 | 0.85 | LRM c | [48] |
| In-line NIR | Soil | 150 | 5208 | 4–20 | 0.96 | SLR d | [49] |
| Poultry manure | 109 | 10,000–4000 | 18.5–54 | 0.93 | PLS-R | [15] |
| Food matrices (supporting comparison) |
Benchtop
FT-NIR | Apricot | 82 | FT-NIR | 9400–5450 | 5–39 | 0.99 | PLS-R | [14] |
| Herbage | 100 | 10,000–4000 | 57–89 | 0.87/0.83 | PLS-R/PCR a | [35] |
| Green tea | 30 | 12,000–4000 | 3–45 | 0.99 | PLS-R | [34] |
| Turmeric | 120 | 12,500–3600 | 7–9.5 | 0.81 | PLS-R | [13] |
| In-line NIR | Pasta | 12 | Diode array NIR | 32,468–5869 | 31–74 | 0.96 | PLS-R | [50] |
| Meat industry | 54 | 6600–4762 | 23.2–24 | 0.88 | PLS-R | [51] |
Table 4.
Challenges and mitigation methods of on-site use of NIR spectroscopy for sludge dewatering.
Table 4.
Challenges and mitigation methods of on-site use of NIR spectroscopy for sludge dewatering.
| | Potential Challenges and Limitations | Mitigation Methods |
|---|
| Operational and environmental challenges | Challenges for sludge dewatering processes in WWTPs include:
- Surface roughness and texture of the sludge and their variability
- Fouling and ambient conditions. The dewatering process typically operates intermittently during day-time or night-time.
Therefore, occurrence of fouling in optical paths due to temperature differences& condensation:
- Vibration: dewatering equipment and conveyors usually generate significant vibration | - Installing a suitable structure, to create smooth surface or a metal chute to facilitate an interface for NIR installation, may help to minimise variations in roughness, and shape of sludge [41,42].
- Implementing an effective cleaning strategy& protected installation may help to reduce fouling and impact of ambient conditions
- Selection of suitable location (such as over a conveyor belt, on a chute, or in a free-fall stream) can reduce the impact of vibration
- Introduction of AI and ML into calibration model may contribute to adaptive calibration or fault compensation. |
| Method robustness | Factors that can affect robustness include:
- Representative sampling,
- Variations in physical conditions such as sensor location, distance and depth [41,52]. | Physical measures:
- Defining effective sample size and frequency.
- Selecting suitable NIR sensor location and distance to ensure representativeness and robustness.
- Design and installation of suitable structure or a chute.
Modelling related measures:
- To mitigate the effects of physical parameter variability and improve model robustness, the following strategies may be applied: (i) multivariate model calibration as well as integration of factors into the model calibration that has impact to the process [53], and (ii) the application of pre-processing methods such as standard normal variate (SNV), PLS-based pre-processing, and multiplicative scatter correction (MSC) methods [54,55]. |
4. Conclusions
The management of wastewater treatment plants relies heavily on efficient sludge dewatering processes, which require accurate and timely determination of moisture content to reduce environmental impacts and enhance process resilience. However, conventional gravimetric methods for moisture analysis are time-consuming and labour-intensive, limiting effective process control and highlighting the need for reliable and faster analytical techniques.
In this context, this study investigated the applicability of FT-NIR spectroscopy with partial least squares regression model for quantifying the moisture content of dewatered waste sludge using 96 samples from two different WWTPs. PCA results demonstrated that sludge spectral characteristics were temporally stable within each WWTP, with no significant differences observed across sampling periods. In contrast, samples from different WWTPs showed clear and consistent separation, confirming that WWTP-specific characteristics are the primary drivers of FT-NIR spectral variability, and providing new insight into the dominant role of site-specific matrix effects.
The FT-NIR method achieved accurate moisture predictions, with strong cross-validation performance (R2CT = 0.95; RMSEE = 0.60; RMSECV = 0.92; RPD = 2.73), and comparable test set validation results (R2Test = 0.88; RMSEP = 0.88; RPD = 2.92). The consistency of model performance across calibration and independent validation datasets demonstrates the robustness of the method against sludge variability. The developed model was validated within a dry matter range of 12.4–24.6% using long-term samples from two WWTPs representing realistic seasonal and operational variability. Application outside this range or under substantially different sludge characteristics may require further validation.
In addition, the study also assessed the practical perspective for on-site of NIR spectroscopy implementation in wastewater treatment plants, addressing the potential operational and environmental challenges and discussing mitigation strategies to enhance method robustness.
Overall, the results demonstrate that FT-NIR spectroscopy has strong potential as a reliable and rapid alternative to conventional gravimetric methods for sludge moisture quantification as long-term sludge variability did not adversely affect model performance. Its application can support more sustainable, efficient, and cost-effective sludge management in wastewater treatment facilities.




 ,
,